Embed Size (px)
Citation preview

165
Chapter 3
Technical
University of
Madrid
Climate Change and Waste Land RestorationMaría Paz ArraizaJosé Vicente López ÁlvarezBelén Vázquez de Quevedo AlgoraÁngela García de Arana
1 INTRODUCTION TO CLIMATE CHANGE AND WASTE LAND RESTORATION
At a global scale, the waste management sector makes a relatively minor contribution to greenhouse gas (GHG) emissions, estimated at approximately Ǧά� ��� ������ �������������� ���������� ��� Ǥ� �������ǡ� ���� ������ ������� ���in a unique position to move from being a minor source of global emissions to becoming a major saver of emissions. Although minor levels of emissions are released through waste treatment and disposal, the prevention and recovery of wastes (i.e. as secondary materials or energy) avoids emissions in all other sectors of the economy. A holistic approach to waste management has positive consequences for GHG emissions from the energy, forestry, agriculture, mining, transport, and manufacturing sectors.
Waste generation does not result in positive impacts on climate. Waste treatment and disposal can have both positive and negative climate impacts. Therefore, an increasingly key focus of waste management activities is to reduce GHG emissions.

Chapter 3
166
Figure 1.� ������Ƥ��� ���������� ��� ������ ����������� ������ǡ� ���� �� ����������(applicable to urban waste management). Source: UNEP Waste and Climate Change Global
Trends and Strategy Framework
2 WASTE MANAGEMENT AND GREEN HOUSE GASES (ghg)
2�1 Background
The waste management sector is in a unique position to move from being a comparatively minor source of global greenhouse gas (GHG) emissions to becoming a major contributor to reducing GHG emissions. Although minor levels of emissions are released through waste treatment and disposal, the prevention and recovery of wastes (i.e. as secondary materials or energy) avoids emissions in other sectors of the economy. A holistic approach to waste management has positive consequences for GHG emissions from the energy, agriculture, transport, and manufacturing sectors. �� ������� ������� ��� ����������� ���������� ����� ά���� �������� ���������� ��� ����US are associated with the management of materials (US EPA 2009). A number of international organisations include waste and climate change initiatives in their ���������� ��� ����������ǡ� ������������ ���� ������������� �������� ����Ƥ�� ����� ������ ���achieved through improved management of wastes.

Climate Change and Waste Land Restoration
167
2�2 Sources of GHG
2�2�1 Landfill
�������� ���������� ����� ����Ƥ��� ���� ���������� ����������� ��� ���������� ���� ���������������������������������������������������ȋ���������������������Ƥ��������������������ȌǤ�It is worth noting that, if a broader view of waste management were taken, which �����������������������������ǡ� ����Ƥ����������������� ��� ������� ��� ���� ��������source of GHG in the sector. The potential to save GHG through improved materials management (i.e. preventing material waste) is discussed in later sections.
Waste contains organic material, such as food, paper, wood, and garden trimmings. ���������������������������������Ƥ��ǡ�������������������������������������������������material, which causes decomposition. Under the anaerobic conditions prevalent ��� ����Ƥ���ǡ������������������������������������������Ǧ������������������Ǥ��������microbes gradually decompose organic matter over time, methane (approximately άȌǡ� ������� �������� ȋ�������������� άȌǡ� ���� ������ ������ �������� ��� ������������������ ȋζ� άȌ� ���� ���������� ���� ����� ����Ƥ��� ���Ǥ� ��� ����������� ����Ƥ���ǡ� ����process of burying waste and regularly covering deposits with a low permeability material creates an internal environment that favours methane-producing bacteria.
As with any ecological system, optimum conditions of temperature, moisture, and nutrient source (i.e. organic waste) result in greater biochemical activity and hence ��������������������������Ƥ������Ǥ
��������������������� ����������� ������ ����� ����Ƥ����������������������������������Waste disposal has ceased. This is because the chemical and biochemical reactions take time to progress and only a small amount of the carbon contained in waste is emitted in the year this waste is disposed. Most is emitted gradually over a period of years.
Methane and carbon dioxide (CO2) are greenhouse gases (GHG), whose presence in the atmosphere contribute to global warming and climate change. Methane is a particularly potent GHG, and is currently considered to have a global warming potential (GWP) 25 times that of CO2 when a time horizon of 100 years is considered; the GWP is much higher (i.e. 72) when a 20-year time horizon is applied. See the table below:

Chapter 3
168
Source: UNEP. Waste and Climate Change Global Trends and Strategy Framework.
���������ǡ� �������������� ����������������������������������ơ������� ��������������climate impact of methane emissions. Ideally, and in-line with IPCC guidance (1995), ������������������������������������ƪ������������������ǡ�����������������ơ������������concern. For example if the aim of a policy is to reduce the immediate or nearfuture levels of GHG, or minimise the rate of climate change, then a 20-year horizon is most appropriate. However, if the focus is on minimising the ‘risk of long-term, quasi-irreversible climate or climate-related changes’, then a 100 or 500 year time horizon is most suitable (Fuglestveldt et al 2001). However, as noted by an IPCC scientist: ‘the time horizons tend to be misused or even abused. Industries tend to pick the horizon that puts their ‘product’ in the best light’ (Fuglestveldt et al 2001).
��� ������ ��� ���������� ����Ƥ��� ���������ǡ� ���� ������������������ ������ ��� ��������Change (IPCC) has set an international convention to not report CO2 released due to ���� ����Ƥ�������������������� ������������������������� ������������������Ȃ����������carbon is accounted for under the ‘land use / land use change and forestry’ (LULUCF) sector (see discussion below, and refer to IPCC (2006) for accounting methodologies). ���������ǡ� ������ ����Ƥ��� ��� ���������ǡ� ����� �������� ���������� ���� ��������ǡ�expressed as tonnes of CO2 equivalent (i.e. 1 tonne of methane is expressed as 25 tonnes of CO2Ǧ�ȌǤ� �����������ǡ����������������������������Ƥ����������������������ǡ�but rather estimated for reporting (United Nations Environment Programme, 2010).

Climate Change and Waste Land Restoration
169
2�2�2 Aerobic composting
Aerobic composting processes directly emit varying levels of methane and nitrous oxide, depending on how the process is managed in practice. Closed systems, such as enclosed maturation bays or housed windrows, reduce emissions through use of air Ƥ������ȋ���������Ƥ�����Ȍ����������������������������������Ǥ�
Compost plants require varying, but usually small, amounts of energy input (with associated ‘upstream’ GHG emissions). Further GHG emissions occur ‘downstream’, depending on the application of the compost product – CO2 will be gradually released as the compost further degrades and becomes integrated with soil-plant systems.
2�2�3 Anaerobic composting
Anaerobic digestion (AD) systems are enclosed in order to capture and contain the biogas generated by the digestion process. GHG emissions from AD facilities are generally limited to system leaks from gas engines used to generate power from biogas, fugitive emissions from system leaks and maintenance, and possible trace amounts of methane emitted during maturation of the solid organic output.
Such systems also consume energy, however plants are generally self-sustaining if appropriately operated (i.e. a portion of the biogas output generates energy for use in-plant). ‘Downstream’ GHG emissions will depend on the application of the matured digestate (as per aerobic compost product). (United Nations Environment Programme, 2010)
2�2�4 Mechanical biological treatment (MBT)
Mechanical biological treatment (MBT) encompasses mechanical sorting of the mixed residual waste fraction, with some recovery of recyclable materials (limited due to �������������Ȍǡ���������������������Ƥ��ǡ��������������������������������������������treatment.
The biological component may include anaerobic digestion with recovery of biogas for energy/heat generation, or aerobic composting to produce a biologically stable product for either land application (limited applicability) or use as refuse-derived fuel

Chapter 3
170
(RDF) to substitute fuel in industrial furnaces (i.e. coincineration in cement kilns). �����������������������������������������������������������ǡ����Ƥ��������ǡ������ǡ�����outputs. GHG emissions associated with MBT are due to energy inputs (although AD systems may be self-sustaining), direct process emissions (this will depend on the air ����������� �������� ������ǡ� ����� ��� �� ���Ƥ����ǡ� ��������� ��� ���� �������� �����������component), gas engine emissions (for AD), and use of the composted organic output ȋ�������������������Ƥ���������������������ȌǤ�������������������������������������������to remediate contaminated land, however most OECD countries strictly regulate the ���������������������������������������ǡ����������������������������������������Ƥ��ǡ�����������������������������������Ƥ�������������Ǥ
2�3 GHG savings
In the context of the current report, the waste sector can save or reduce GHG emissions through several activities:
• Avoiding the use of primary materials for manufacturing through waste avoidance and material recovery (i.e. the GHG emissions associated with the use of primary materials – mostly energy-related – are avoided)
• Producing energy that substitutes or replaces energy derived from fossil fuels (i.e. the emissions arising from the use of waste as a source of energy are generally lower than those produced from fossil fuels).
• ����������������������Ƥ����ȋ�Ǥ�Ǥ�������Ǧ������������������������������������������������ ���������� ����Ƥ��� ����������ǡ� ����� ��� ��������� ���� ����Ȍ� ���� ��������application of compost to soils.
Indeed, depending on which GHG accounting convention is used, the waste sector is ����������������������������������Ƥ�������������������������ǡ������������������ǡ�and energy recovery.
2�3�1 European Environment Agency (EEA)
Using a life-cycle perspective, this report analyses the greenhouse gas emissions from municipal solid waste management in the EU, plus Norway and Switzerland. Among ���������������������������ǡ����Ƥ��������ǣ�

Climate Change and Waste Land Restoration
171
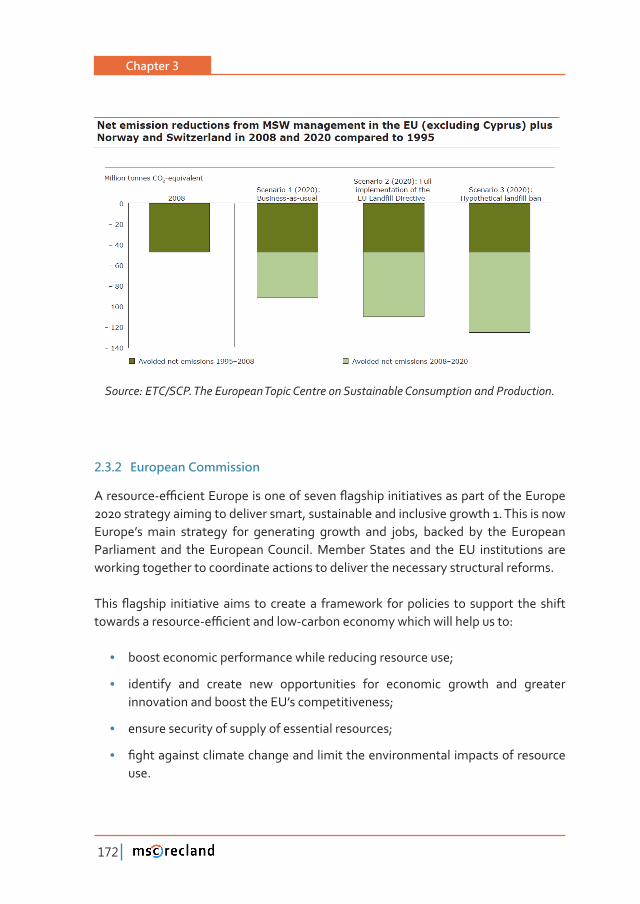
• improved municipal solid waste management in these countries has already cut annual net greenhouse gas (GHG) emissions by 48 million tonnes CO2-equivalent between 1995 and 2008;
• the two main factors responsible for this improvement are reduced methane �������������������Ƥ����������������������������������������������������Ǣ�
• ��� ���� ���������� ������ ����� ���� ����Ƥ��� ���������ǯ�� ������ ���������� �������ǡ�potential life-cycle GHG emissions from municipal waste management in 2020 �����������������������������������������ǡ��������������Ǥ�ά����������������GHG emissions in 2008;
• �� ��������� ���� ��� ����Ƥ������ ������ ���� ���������� ����� �������ǡ� ���������potential net emissions from waste management in 2020 by 78 million tonnes compared to 2008 — an amount slightly greater than Hungary’s total emissions in 2008.
As this report makes clear, better management of municipal solid waste can reduce ����������� ���� ���������� �����Ƥ������Ǥ� ���� ��� ���� ����� ���������ǡ� ���� ��ǯ�� �������������������������������������������Ȅ�����������������������Ƥ������������Ǥ
������� ���� ��������� ��� ���ǡ� ������ ��� �����Ƥ����� �������� ���������� ��������������emissions through better MSW management in the years to 2020.
�����������������������������������ơ�����������������������������������������ǡ�����EEA and its ETC/SCP developed three scenarios on possible future paths for European MSW management:
• scenario 1 assumes business-as-usual (as presented in Figure 2.1);
• ����������������������������������������������������Ƥ������������Ǣ�
• ��������� ���������������������������Ƥ��������������������� �����������������Ǥ�
���������Ƥ������������������������������������������������������������������� Ȃ�ȋ�������Ƥ����������Ȍ����������������������������������������������������for all three scenarios (in columns two, three and four). The net emission reduction is ��������������������ơ�������������������������������������������������������or 2020, as appropriate.
Chapter 3
172
������ǣ����Ȁ���Ǥ��������������������������������������������������������������������Ǥ
2�3�2 European Commission
����������Ǧ�ƥ�����������������������������ƪ�����������������������������������������2020 strategy aiming to deliver smart, sustainable and inclusive growth 1. This is now Europe’s main strategy for generating growth and jobs, backed by the European Parliament and the European Council. Member States and the EU institutions are working together to coordinate actions to deliver the necessary structural reforms.
�����ƪ������� ���������������� ��� ��������� ���������� ������������� ��� �������� ���� ������������������������Ǧ�ƥ�������������Ǧ������������������������������������ǣ�
• boost economic performance while reducing resource use;
• identify and create new opportunities for economic growth and greater innovation and boost the EU’s competitiveness;
• ensure security of supply of essential resources;
• Ƥ���������������������������������������������������������������������������use.
Climate Change and Waste Land Restoration
173
Increasing recycling rates will reduce the pressure on demand for primary raw materials, help to reuse valuable materials which would otherwise be wasted, and reduce energy consumption and greenhouse gas emissions from extraction and processing.
�������������������������� ������ ���� �����Ƥ���������2 emissions. For example, each year the EU disposes of 5.25 billion euro worth of recyclables such as paper, glass, plastics, aluminium and steel.
If this was recycled, the equivalent of 148 million tonnes of CO2 emissions could be avoided annually. Improved management of municipal waste could result in 92 million tons of greenhouse gas emissions avoided in 2020 compared with 1995. At least 500 �����������������������������������������������������������ά���������������Ǥ�
2�3�3 German Federal Ministry for the Environment
Following the entry into force of the Waste Management and Product Recycling Act ���ǡ�����������������������������������������������������������Ƥ�����������������abandoned in the period up to June 2005.
Thanks to a marked increase in separate collection and processing, and also to waste ���������� ��������� �ƥ������������ ���������� ���� ����������������ǡ� ��� ���� �����possible to replace fossil fuels and raw materials. These improvements are entered ��������������������������������ǡ�������������������������Ƥ��������������������������Ǧrelevant emissions and savings in fossil fuels.
�������������������������������������������������������������Ƥ��������Ǥ������������������� ����� �������������������� ����Ƥ��ǡ���������� �����������������������sheet results between 2005 and 2020 are no longer possible on the scale seen between 1990 and 2005. But a potential of over 5 million t CO2 equivalent remains as an important contribution to the German climate protection target.
On the whole, the disposal paths of waste incineration plants and co-incineration display the greatest potential for reducing emissions of greenhouse gases. Waste paper recycling is also of great importance, while all other paths make smaller contributions to climate protection, and even the expenditure involved in the collection of waste is ������������������Ƥ����ǡ����������������������������������ǣ

Chapter 3
174
Greenhouse gas emissions and remaining reduction options in the scenario SHULRG�XS�WR�������ÀJXUHV�LQ�PLOOLRQ�&22�HTXLYDOHQPW
Source: German Federal Ministry for the Environment.
2�4 Biogenic carbon
Many studies that examine the linkages between waste and climate change adopt the current IPCC convention for national GHG inventories of ignoring the contribution of CO2 emitted from biogenic materials where these materials are grown on a sustainable basis. The argument is that during the growth of the plants, carbon has been taken-up and incorporated, and that same amount of carbon is emitted when ��������������������������������Ȃ�������������������������ơ���������Ǯ�������ǯǤ�������are several points to this argument that are worth considering:
• Climate change is time-critical – it is widely accepted that immediate reductions in global GHG emissions are essential to reduce the impact of climate change, �����������ơ���������������������������������������������������2, regardless of source.
• Plant growth – particularly of trees and longer-lived species – does not occur evenly over years and seasons, and the initial up-take of carbon by a seedling is far less than the uptake of carbon by a mature plant. Therefore it could be several
Climate Change and Waste Land Restoration
175
���������������ƪ�����������������2 emitted instantaneously from a process (i.e. combustion of biogenic carbon) is re-captured through plant growth.
• The majority of wood, paper, and agricultural materials that enter the waste stream have not been produced through sustainable forestry/land practices – unsustainable practices deplete the carbon stored in forests and soil over time. According to IPCC methodologies for reporting national GHG inventories, if any factor ‘…is causing long-term decline in the total carbon embodied in living biomass (e.g., forests), this net release of carbon should be evident in the calculation of CO2 emissions described in the Agriculture, Forestry and Other Land Use (AFOLU) Volume of the 2006 Guidelines’. However, it is unclear how and whether this information is being recorded in all cases.
• In a national GHG inventory for IPCC purposes, where deforestation and re-growth is accounted for in the land-use category (LULUCF), there may be an argument for ignoring biogenic carbon. However, in an examination of the GHG impact of waste management systems, where solutions are being sought �������������������� �������������������ǡ� ������ ��� �����Ƥ����������� ��������������sources of GHG.
• ���� ����Ƥ��� ����� ������� ����� �� ���������� ��� ������ ��2, irrespective of the source, would seem to be the best indicator of the consequences of the ��ơ�������������Ǥ�������������������������������������������������������ǡ�������ơ�����������������������������Ǥ
3 CLIMATE IMPACT OF WASTE
3�1 Potential GHG emissions reductions from materials management
��������� ���������� ����������� ���������� ����������� ���� ��������� ƪ��� ��������� �� �����Ƥ����� ������� ��� ����Ǧ������ ��� ȋ�Ȍ� ���������Ǥ� ������ ����������management total technical potential scenarios include life cycle GHG emissions. These scenarios represent the estimated emission reductions that would occur if the scenarios presented were achieved, setting aside economic or practical limitations.

Chapter 3
176
The total technical potential scenarios provided here are not representative of all possible approaches to reduce GHG emissions through materials management. Many of these scenarios focus on the waste stream because the data are limited on materials ������������������������������������������������� �����������������ƪ��Ǥ������������research is completed, additional total technical potential scenarios will be developed to understand the GHG emission reductions that could be achieved throughout the ����������ƪ��Ǥ����������������������������������������������������������������������boxes:
Source: EPA, United States Environmental Protection Agency. Opportunities to Reduce Greenhouse Gas Emissions through Materials and Land Management Practices, 2009.
Source: EPA, United States Environmental Protection Agency. Opportunities to Reduce Greenhouse Gas Emissions through Materials and Land Management Practices, 2009.

Climate Change and Waste Land Restoration
177
3�2 Reducing or avoiding GHG emissions through land management practices
Land management has three key components: land protection, sustainable land use, and land revitalization. Similar to the materials management approaches that can be ���������������������ƪ��ǡ����������������������������������������������������emissions by improving practices within or across each of these components. Land protection practices limit how much land is contaminated each year. When land is contaminated, it should be cleaned up to levels protective of human health and the environment.
Sustainable land use practices include those that promote the sustainable use and development of land (including managing land for agricultural and forestry ��������Ȍǡ� ���� ����������� �����Ƥ���� �����������Ǥ� ����� ��������������� ����������promote the cleanup and reuse of contaminated land. By considering the impact of �����������������������������������������ǡ�������������������Ƥ���������������������emissions. Decisions at the local, or national level related to the cleanup, restoration and/or reuse of contaminated land (i.e., land revitalization) can also reduce GHG emissions.
����� �������������� ��������� ����� ��������� ��� ������������� ����� ���� Ƥ���opportunities to employ cleanup techniques that provide an equivalent level of environmental and human health protection while emitting lower amounts of GHGs through:
1. Optimizing remedies and treatment systems both for new and existing reme-dies;
2. Using alternative energy derived from cleaner and renewable energy sources; and
3. Accounting for the technical needs of potential reuse options and incorpora-ting them throughout the cleanup processes to facilitate sustainable reuse of ��������������������������������������Ƥ����Ǥ
����������������������������������� �������������������������Ƥ��������������������and reuse activities—particularly on former mine lands. At some sites, organic soil amendments can be used to remediate the site, boosting the amount of carbon
Chapter 3
178
sequestered in the soil and enhancing vegetation growth. This remediation approach also provides a use for some organic soil amendments such as biosolids which may otherwise be a waste product.
Land cleanup activities may also provide recycling opportunities to further bolster EPA’s approaches to materials and land management. For example, reusing and recycling construction and demolition debris from buildings on contaminated land ������������ơ���������������������������������������������Ǣ������������������������reuses both materials and land, but also prevents other land from being used for the disposal of construction and demolition debris.
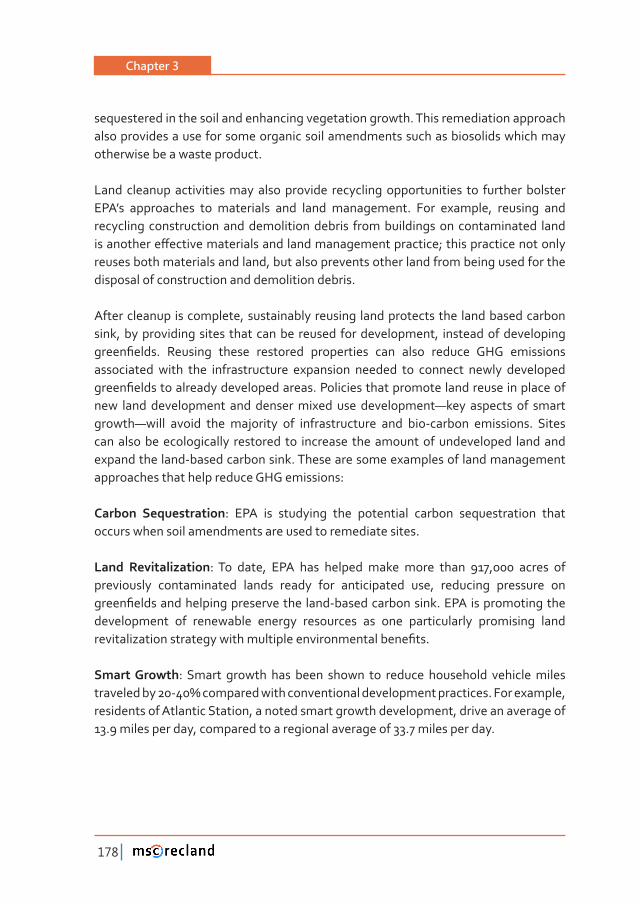
After cleanup is complete, sustainably reusing land protects the land based carbon sink, by providing sites that can be reused for development, instead of developing �����Ƥ����Ǥ� �������� ������ ��������� ����������� ���� ����� ������� �� ����������associated with the infrastructure expansion needed to connect newly developed �����Ƥ�������������������������������Ǥ����������������������������������������������new land development and denser mixed use development—key aspects of smart growth—will avoid the majority of infrastructure and bio-carbon emissions. Sites can also be ecologically restored to increase the amount of undeveloped land and expand the land-based carbon sink. These are some examples of land management approaches that help reduce GHG emissions:
Carbon Sequestration: EPA is studying the potential carbon sequestration that occurs when soil amendments are used to remediate sites.
����� ��������������: To date, EPA has helped make more than 917,000 acres of previously contaminated lands ready for anticipated use, reducing pressure on �����Ƥ����������������������������������Ǧ�����������������Ǥ����������������������development of renewable energy resources as one particularly promising land ��������������������������������������������������������Ƥ��Ǥ�
�����������: Smart growth has been shown to reduce household vehicle miles ������������ Ǧά�������������������������������������������������Ǥ�����������ǡ�residents of Atlantic Station, a noted smart growth development, drive an average of 13.9 miles per day, compared to a regional average of 33.7 miles per day.

Climate Change and Waste Land Restoration
179
Green Remediation: Green remediation practices are being employed at contaminated sites, which can reduce GHG emissions. For example, some remediation projects use solar energy to operate ground water pump and treat systems; others are reducing construction engine idling time, and using alternative fuels to reduce GHG emissions.
3�3 Trends in waste generation and management
The long-term vision for the waste sector is to establish a circular global economy in which the use of materials and generation of waste are minimised, any unavoidable waste recycled or remanufactured, and any remaining waste treated in a way that causes least damage to the environment and human health or even creating additional value by recovering energy from waste. To achieve this vision, radical changes to supply-chain management, especially to the product and industrial design part of ����������������ǡ�����������Ǥ������Ƥ�����ǡ����������������������������������������Ȃ�with implications for materials at all stages – and be overlaid on the entire supply chain. This requirement is, in turn, expected to motivate innovation. The chapter on manufacturing further elaborates on life-cycle approaches, including closed loop and circular systems in manufacturing.
The waste sector is facing three sets of challenges:
1. Increasing growth in the quantity and complexity of waste streams associated with rising incomes and economic growth;
2. Increasing risk of damage to human health and ecosystems; and
3. The sector’s contribution to climate change.
The exploitation of the earth’s resources continues apace; material use increased eight-fold in the last century (Krausmann et al. 2009). According to the Wuppertal Institute, an average European consumes about 50 tonnes of resources a year, around three times the amount consumed per capita by emerging economies. Furthermore, on average, Europeans dispose twice as much as citizens from emerging economies (Bleischwitz 2009). Per-capita resource use in emerging economies is also increasing considerably while the world’s Least Developed Countries (LDC) are beginning the transition towards an industrial type of societal metabolism, as incomes rise and purchasing power is deployed in consumer spending.

Chapter 3
180
Currently, 3.4-4 billion tonnes of municipal and industrial waste are produced every year, of which non-hazardous industrial waste accounts for 1.2 billion tonnes (Chalmin and Gaillochet 2009). A major share of the waste generated is MSW originating from urban settlements (1.7-1.9 billion tonnes, or 46 per cent of the total waste generated) with 0.77 billion tonnes of this being produced by 25 Organisation for Economic Cooperation and Development (OECD) countries alone (UNEP 2010).
As a country develops and becomes wealthier, the composition of its waste stream �����������������������������������������Ǥ���������������Ƥ��������������������������proportion of organic-rich MSW in middle and lower income countries with a gross national income per capita of less than US$ 12,196, while the high-income countries’ MSW streams contain a large proportion of paper and plastics.
Source: Chalmin and Gaillochet (2009) and averaged
Waste generation is linked to both population and income growth. Of the two, ����������������������������������������Ǥ���������������Ƥ���������������������������between MSW generation and GDP. In high-income countries, an urban population of 0.3 billion generates approximately 0.24 million tonnes of MSW (0.8 kg per capita per day), while in low-income countries around the same amount (0.26 million tonnes per day) is generated by 1.3 billion people (0.2 kg per capita per day), a quarter of the level high-income countries.

Climate Change and Waste Land Restoration
181
Source: MSW data source from a EPA (2007), b Borzino (2002), c Methanetomarkets (2005), d World Bank (2005), OECD (2008) and e Yatsu (2010) and f GHK (2006); Population
data available at http://esa.un.org/wpp/; GDP data sourced from World Bank.
Chapter 3
182
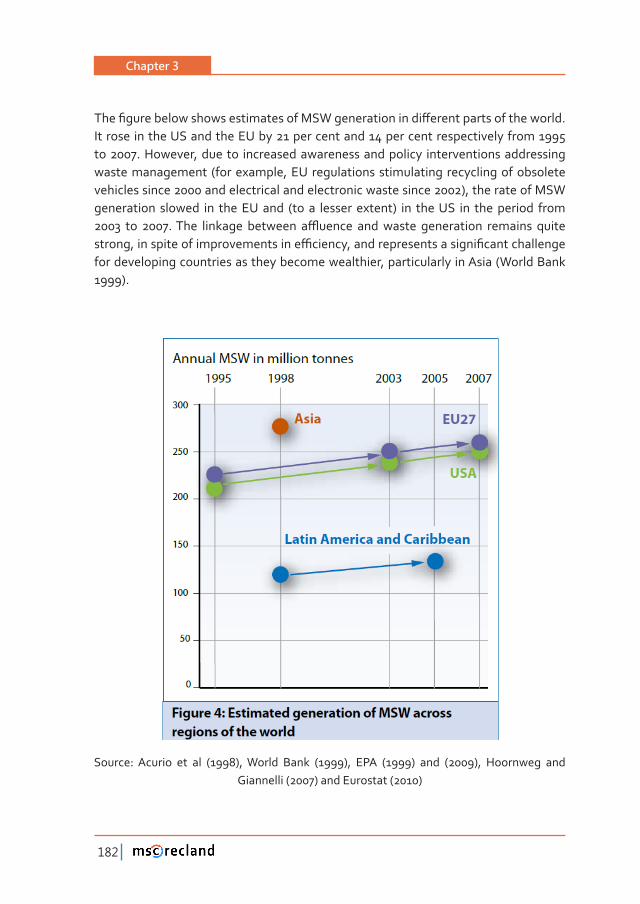
����Ƥ��������������������������������������������������ơ������������������������Ǥ�It rose in the US and the EU by 21 per cent and 14 per cent respectively from 1995 to 2007. However, due to increased awareness and policy interventions addressing waste management (for example, EU regulations stimulating recycling of obsolete vehicles since 2000 and electrical and electronic waste since 2002), the rate of MSW generation slowed in the EU and (to a lesser extent) in the US in the period from � ��� Ǥ����� �������� �������� �ƫ������ ���������� ����������� �������� ������������ǡ������������������������������ƥ������ǡ�����������������������Ƥ���������������for developing countries as they become wealthier, particularly in Asia (World Bank 1999).
Source: Acurio et al (1998), World Bank (1999), EPA (1999) and (2009), Hoornweg and Giannelli (2007) and Eurostat (2010)

Climate Change and Waste Land Restoration
183
At best, relative decoupling has begun in OECD countries, with a stabilisation of ���Ǧ������� ������ ����������� ��� ���� ����� ������ǡ� ��� ������ ��� ���� ����� Ƥ����Ǥ�����������������������������Ƥ������������������������ǡ�������������������������������Ǧintensive production to developing and emerging countries may have contributed �������������������Ǥ�����Ƥ�������������������������������������������������������countries (OECD 2008).
Source: OECD (2008).
The rapid pace of industrialisation around the world has brought about increasing demand for metals, which are considered as core raw materials for infrastructure and manufacturing of products. The demand for metals is expected to maintain dynamic in the future: in developing countries due to economic growth, and in industrialized countries due to modern technologies with dissipative metal applications. Since ������� ���� �� Ƥ����� ��������ǡ� ���� ���������� ���������� ��� ������ ������� ������ ���addressed through recycling across the life-cycle.
Among the various steps of the metal life-cycle, societal or in-use metal stocks, which include all metals put into use and currently providing service, are the most relevant metal stocks to focus. On a global level, most of the world’s in-use stocks reside in

Chapter 3
184
more developed countries. For instance, Japan and the United States posses the highest in-use stocks and exceed the value of China by 9 and 13 times. Moreover, data suggests that per capita inuse stocks in more-developed countries typically exceed those in less-developed countries by factors of 5 to 10.
One of the key strategies in meeting this increasing demand is to take advantage of anthropogenic mines, or urban stocks, which has a great potential to reduce dependency on virgin metal resources and mitigate the environmental degradation caused by mining activities. However, tremendous weak points have been found in global metal recycling. For instance, mass-scale use of specialty metals like gallium, indium, etc, in the last three decades and the lack of infrastructure for recycling in many developing countries has led to dissipative losses of such metals.
Thus, the recycling rates for some of the metals, especially specialty metals are relatively low. It has been recognized that creating a circular economy is key for increasing metal needs of the future. Setting of appropriate metal recycling infrastructure and services in urban areas - that are tomorrow’s metal mines – is essential and should be given high priority.
The International Resource Panel decisively states that it is important to enhance capacity building, technology transfer and international cooperation in developing countries through international recycling conferences, technological implementation ��������������������Ƥ���������Ƥ���������������������Ǥ
The Panel also highlights three key issues that require urgent attention:
• Research & development. Data acquisition and analysis, recycling technologies ��������ǡ����������� ��������������������������ơ�������������������������� ���the development process. Global data on a large variety of metals on equal spatial and temporal resolution is actually not available
• Stopping illegal waste transport. International organisations like UNEP and OECD have to multiply their engagement in the monitoring and controlling of illegal scrap exports.
• Continuous improvements of legislative systems. The more developed countries should reinforce their attempts to help the less developed countries install appropriate legislative systems and ensure their enforcement in order to take advantage of metal stocks in society.

Climate Change and Waste Land Restoration
185
Waste volumes are not necessarily the most important challenge ahead. Mixed MSW, hazardous health-care waste, and industrial waste streams can impose serious health and ecological risks if these wastes remain uncollected or dumped in uncontrolled ������������������Ƥ��������Ǥ������������������������ǡ������������ǡ����������������������lower than 70 per cent, with more than 50 per cent of the collected waste disposed �������� ������������� ����Ƥ������ ���� ������ � ���� ����� ���������� �������� �������and informal recycling (Chalmin and Gaillochet 2009). Given the amount of valuable components in MSW, the mixing of wastes also means a lost opportunity to recover components that could be recycled and used as new resources.
3�4 Climate impact of waste management practices
Every waste management practice generates GHG, both directly (i.e. emissions from the process itself) and indirectly (i.e. through energy consumption). However, the ���������������� ��������������Ƥ������������������������������������������������net GHGs, accounting for both emissions and GHG savings.
3�4�1 Landfill
���������������������������������������������ǡ���������������������������������Ƥ�������������������������������������������������������Ǥ����������������������������Ƥ���represent the largest source of GHG emissions from the waste sector, contributing around 700 Mt CO2-e (estimate for 2009) (Bogner et al 2007). In comparison, the next largest source of GHG emissions from the management of solid wastes is incineration, estimated to contribute around 40 Mt CO2-e (2009 data estimated in Bogner et al ȋȌȌǤ�����Ƥ�����������������������������������������Ǣ�����������������������������global GHG emissions is believed to be negligible, and related to the management ���������������������������������������������Ƥ������������Ƥ������������ȋ�������������2008).
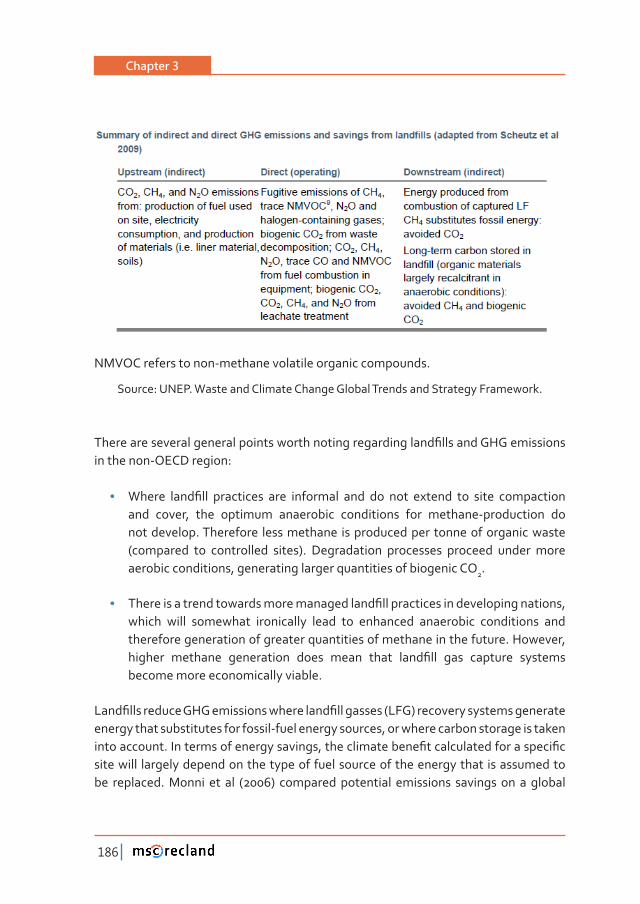
The next table provides a qualitative summary of the indirect and direct GHG ������������������������������������������Ƥ�����Ǥ������������������������������ǡ�����GHGs are noted, including biogenic CO2.
Chapter 3
186
NMVOC refers to non-methane volatile organic compounds.
Source: UNEP. Waste and Climate Change Global Trends and Strategy Framework.
������������������������������������������������������������Ƥ��������������������in the non-OECD region:
• ������ ����Ƥ��� ���������� ���� ��������� ���� ��� ���� ������� ��� ����� �����������and cover, the optimum anaerobic conditions for methane-production do not develop. Therefore less methane is produced per tonne of organic waste (compared to controlled sites). Degradation processes proceed under more aerobic conditions, generating larger quantities of biogenic CO2.
• ������������������������������������������Ƥ����������������������������������ǡ�which will somewhat ironically lead to enhanced anaerobic conditions and therefore generation of greater quantities of methane in the future. However, ������� �������� ����������� ����� ����� ����� ����Ƥ��� ���� �������� ��������become more economically viable.
����Ƥ���������������������������������Ƥ����������ȋ�Ȍ���������������������������energy that substitutes for fossil-fuel energy sources, or where carbon storage is taken ������������Ǥ���������������������������ǡ�����������������Ƥ������������������������Ƥ��site will largely depend on the type of fuel source of the energy that is assumed to be replaced. Monni et al (2006) compared potential emissions savings on a global

Climate Change and Waste Land Restoration
187
��������������Ƥ��������������������������ǡ���������������������2-e where coal-derived energy is assumed to be replaced and 22 Tg CO2-e where natural gas-derived energy is replaced (natural gas is a ‘cleaner’ fuel than coal, therefore there is less ������������Ƥ��������������������������ȌǤ
�������Ǧ�����������ǡ��������� ����Ƥ������� ���� ���������� �������������������������������������������Ȃ�ά����������������������ȋ���������������ǡ�������������ȌǤ�����Ƥ�����������������������������������������������������������������������ά���������������������Ǥ
�������� ������ ���������� ���� �������� ������������� ��� ����Ƥ���� Ȃ� ���Ǧ��������������materials (i.e. plastics), lignin and some lignin-bound cellulose and hemi-cellulose �����������������������������������������������������������������������������Ƥ����(Barlaz 2006). A high proportion of wood waste, for example, may be considered as ���������������������Ƥ��������������������������������������Ǥ���������������������������ǡ�����������������������������������������ǡ���������������������Ƥ����������������of the solution; however, there are myriad other reasons (i.e. ecological, resource use, land use) for not doing this.
�������������������������������������Ƥ������� �����������������������������������������Ƥ��� ���� ����������� ���� �������������� ��� ��� ������ǣ� ���� ��� ���� �������� ����������� �������� ����� ����� �����ǡ� ����� ��� �� ���� ��� ����Ƥ������ �������� ������ �����implemented at a site today, there would still be an existing store of organic material releasing methane, that could be extracted into the future.
����Ƥ�����������������������������������������������������������������������������sector, but the options for reducing this climate impact are available and achievable: ������������������������������������Ƥ�����������������������������Ƥ��������������Ǥ�Neither option is technically complex, and there is a body of knowledge and experience in OECD regions that could be transferred to non-OECD countries.
3�4�2 Thermal treatment
Thermal waste treatment refers to mass-burn incineration, co-incineration (i.e. replacing fossil fuels with refuse-derived fuel (RDF) in conventional industrial ���������ǡ���������������������Ȍǡ�������������������Ƥ������Ǥ�����Ǧ����������������������������������������������������������������Ǥ�������������������Ƥ��������������

Chapter 3
188
considered as emerging technologies, with limited success in treating mixed waste streams. The majority of studies assume that energy is recovered from the thermal treatment of waste, either as heat or electricity, which can equate to a considerable GHG saving (depending on the type of energy displaced). Metals are also recovered ��������������������ǡ���������������������������������������Ƥ��Ǥ
Approximately 130 million tonnes of waste are currently incinerated across 35 ����������ȋ�������������ȌǤ� ����ǡ��������ǡ����������������������ηά��������waste stream through incineration. France, Sweden, the Netherlands and Switzerland also have high rates of incineration (Bogner et al 2007). Incineration is only applied in a limited capacity in the remainder of the OECD countries. There is no incineration of mixed waste practiced in either Australia or New Zealand, largely due to public opposition. Australia, New Zealand, Canada and the US do not have legislation in ����������������������Ƥ������ȋ�Ǥ�Ǥ��������������������������������Ƥ������������ȌǢ���������������Ƥ��� �������� ���� ��������� ���� ����� ���������� ��������� ������Ǥ� ������������� ���mixed wastes is a largely unfeasible option in non-OECD countries due to cost and often unsuitable waste composition.
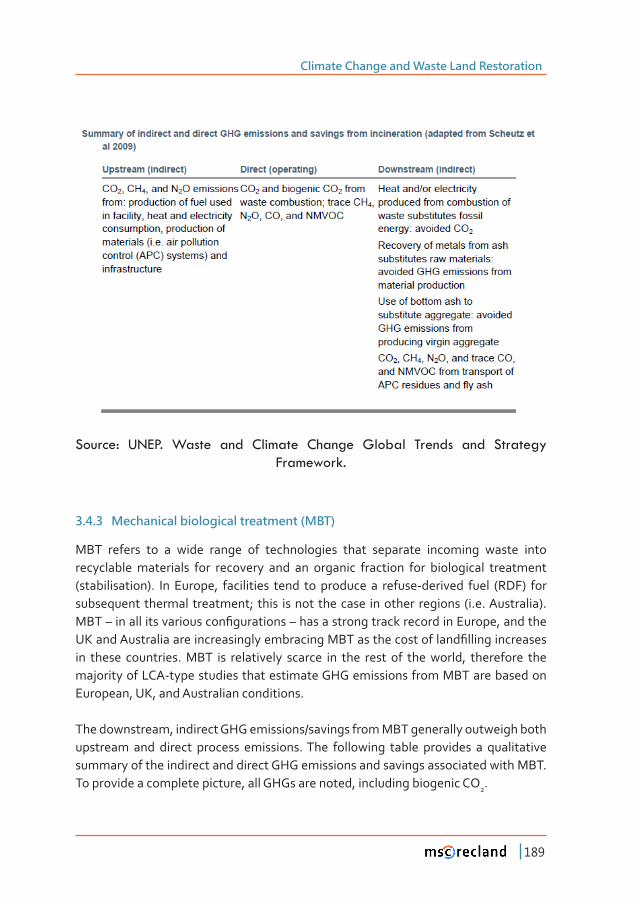
At the global level, the climate impact of incineration is minor compared to that of ����Ƥ�����ǡ���������������������������2-e in the current year (Bogner et al 2007). Typically only fossil CO2 is counted as a GHG emission from incineration; therefore, ���� �������� �������� ������� ��� ������������� ����� ��� ������� ��ƪ������� ��� ���� �������carbon content of the input waste. Downstream, indirect GHG savings due to energy generation may dominate an estimate of emissions from incineration, depending on the energy assumed to be replaced. The next table provides a qualitative summary of the indirect and direct GHG emissions and savings associated with incineration. To provide a complete picture, all GHGs are noted, including biogenic CO2.
���������������������������������������������������������������������������������Ƥ��streams of wastes, or carefully prepared mixed residual wastes, as part of an integrated and future-thinking waste management system. In many countries, thermal treatment plants require long lead-times (i.e. >10 years) to meet planning ��������ǡ�Ƥ�������ǡ�������������ǡ������������������Ǥ������������ǡ����������������� ��������������������������������������ƪ�����������������������������������ǡ����������������that capacity needs to be planned for carefully. This suggests that such facilities may be part of a longer-term strategy for climate abatement.
Climate Change and Waste Land Restoration
189
6RXUFH�� 81(3�� :DVWH� DQG� &OLPDWH� &KDQJH� *OREDO� 7UHQGV� DQG� 6WUDWHJ\�Framework.
3�4�3 Mechanical biological treatment (MBT)
MBT refers to a wide range of technologies that separate incoming waste into recyclable materials for recovery and an organic fraction for biological treatment (stabilisation). In Europe, facilities tend to produce a refuse-derived fuel (RDF) for subsequent thermal treatment; this is not the case in other regions (i.e. Australia). ����Ȃ�����������������������Ƥ����������Ȃ������������������������������������ǡ����������������������������������������������������������������������������Ƥ����������������in these countries. MBT is relatively scarce in the rest of the world, therefore the majority of LCA-type studies that estimate GHG emissions from MBT are based on European, UK, and Australian conditions.
The downstream, indirect GHG emissions/savings from MBT generally outweigh both upstream and direct process emissions. The following table provides a qualitative summary of the indirect and direct GHG emissions and savings associated with MBT. To provide a complete picture, all GHGs are noted, including biogenic CO2.

Chapter 3
190
The overall climate impact of a particular MBT technology will depend on:
• �����ƥ���������������Ǧ����������������������Ȃ����������������������������������������������������Ƥ��������������������������
• Energy consumption of system – more automated, sophisticated systems have a higher energy demand
• Energy generation – in the case of anaerobic digestion (AD)-type MBT facilities, energy produced from biogas – either heat or electricity – will account for a GHG saving
• Control of emissions during the maturation phase – best-practice for MBT �������������������������������������������������ǡ��������������������������Ƥ�����ǡ�to prevent emissions of nitrous oxide and methane
• Carbon storage potential – compost derived from mixed waste is usually ��������������������������ȋ�Ǥ�Ǥ�����������������������������������������Ƥ��Ȍǡ����������������������������������Ƥ���������������������
• ��������������������Ƥ�����������Ȃ�����������������������������Ƥ���������������������will decrease with increased maturation time, and the lower the biodegradability, ��������������������������������������������������������ȋ�������Ƥ����Ȍ
Source: UNEP. Waste and Climate Change Global Trends and Strategy Framework.
Climate Change and Waste Land Restoration
191
MBT, with simple aerobic composting of the organic portion of the mixed waste stream, �����ơ����������ǡ���������������������������������������������������������������������Ƥ�����������Ǥ������������������������������������������������������������������Ƥ��������������management systems are improved (i.e. to increase source separation and recovery).
3�4�4 Composting and anaerobic digestion
Composting systems treat biodegradable material such as food, animal industry wastes, green waste, wood, and agricultural residues and produce a range of organic soil amendment products that can replace manufactured fertilisers and/or peat, reduce the need for pesticides, improve soil structure, reduce erosion, and reduce the need for irrigation. Around 2,000 composting facilities currently treat source-separated household organic waste in Europe (Boldrin 2009). Composting and ���������� ���������� ��� ������Ǧ���������� ������� ��������� �����Ƥ����� ����������� ���local community education (both households and commercial enterprises) and public awareness – this is essential to ensure proper source-separation, highquality compost ��������ǡ���������������Ǧ�����������Ǥ�����������������������������������ơ������ǡ�low-tech solution for developing countries to reduce waste quantities and generate a valuable compost product for application to agriculture.
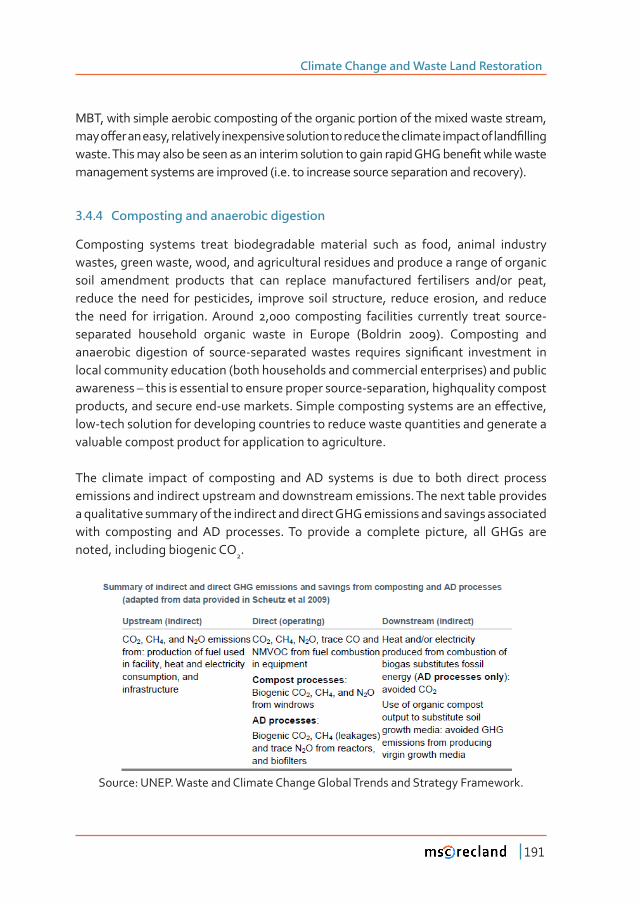
The climate impact of composting and AD systems is due to both direct process emissions and indirect upstream and downstream emissions. The next table provides a qualitative summary of the indirect and direct GHG emissions and savings associated with composting and AD processes. To provide a complete picture, all GHGs are noted, including biogenic CO2.
Source: UNEP. Waste and Climate Change Global Trends and Strategy Framework.

Chapter 3
192
Direct emissions from composting facilities result from fuel combustion in equipment (i.e. frontloaders) and from decomposition of the organic material. As composting produces CO2 from biogenic carbon sources, it does not contribute to national GHG inventories for the waste sector under IPCC accounting methods (IPCC 2006). CH4 and N2O emissions will depend on the type of organic waste input, the technology used (in particular, whether the process is open or enclosed), and how the process is managed (Boldrin et al 2009).
Once compost is applied to land, further, minimal emissions will be generated as organic compounds are gradually mineralised to biogenic CO2. Therefore, compost applied to soil has a medium or long-term potential to store carbon; however, it does not represent a permanent solution for ‘locking-up’ carbon (Smith et al 2001; Favoino ���� ����ǡ� ȌǤ������������� ���� �������� ����Ƥ�� ��� ������� �������� ��� ������������ƥ����� ��������� �������� ������� ��� ���� ���� ����� ���������� ����������� ȋ��������ǡ�tillage, irrigation, compost application rate, etc), climate, and original carbon content of the compost and soil.
Anaerobic digestion (AD) of source-separated organic wastes is an alternative to aerobic composting systems; although AD tends to accept a smaller range of materials (i.e. materials with a high lignin content, such as woody garden wastes, are generally not suitable for AD in large quantities). The biogas produced by AD tends �������������������������������ȋ�������άǡ����������������������������������������parameters) and therefore high energy content.
Depending on facility performance, assumptions regarding energy, the end-use of energy generated, and assumptions regarding use of digestate, an advanced, European-style AD facility may have a net climate impact ranging from -375 to 111 kg CO2-e per tonne of wet organic waste input (Møller et al 2009). Higher levels of biogas production, a high-CO2-e energy mix, and use of heat rather than electricity would all contribute to greater GHG savings.
3�4�5 Recycling
After waste prevention, recycling has been shown to result in the highest climate ����Ƥ�����������������������������������������������Ǥ������������������������case not only in the OECD (i.e. ISWA 2009, Christensen et al 2009, US EPA 2006) but also in developing countries (i.e. Pimenteira et al 2004, Chintan 2009), although

Climate Change and Waste Land Restoration
193
limited data is available. For example, in the US, recycling materials found in MSW resulted in the avoidance of around 183 Mt CO2-e in 2006 (US EPA, 2009). Estimates of GHG savings are generally based on the premise that recycled materials replace an equal – or almost equal – quantity of virgin materials in a closed-loop recycling system (i.e. where material is reprocessed back into the same or a similar product). Industrial symbiosis involves the exchange of resources including by-products among industrial enterprises, which may form ‘recycling clusters’ to facilitate sharing resources.
The next table provides a qualitative summary of the indirect and direct GHG emissions and savings associated with recycling processes. To provide a complete picture, all GHGs are noted, including biogenic CO2.
Source: UNEP. Waste and Climate Change Global Trends and Strategy Framework.
A recent investigation by the UK Waste and Resources Action Programme (WRAP) of ������������������������Ǯ����������������ǡ�����������������������������������ơ��������� �������������� ����Ƥ��� ���� ������ �������������� �������� ����� ������ ������management options’ (WRAP, 2006). The report’s main GHG-related conclusions for �����Ƥ��������������������ǣ
• On average, virgin production of paper followed by incineration with energy recovery consumes twice as much energy as paper recycling; however, the GHG ����Ƥ����������������������������������������������������������������������

Chapter 3
194
by the individual LCA studies (in particular, whether the GHG ‘cost’ of using timber to produce paper is accounted for)
• ������Ǧ����� ���������� ��� ������ �������� ��� ���� �������� ����Ƥ��� ��������� ���������������Ǥ��������������ƥ������������������Ǧ���������������ȋ�Ǥ�Ǥ����������������into aggregate, insulation, or other secondary product) to determine the net GHG impact
• - Where recycled plastic replaces virgin plastic of the same kind in ratio of 1:1 ȋ���������Ȍǡ����������������������������������������������������������������Ƥ��compared to incineration. For every kg of plastic recycled, around 1.5 – 2 kg CO2-e is saved.
• Production of virgin aluminium requires 10-20 times more energy than ���������� ���������Ǥ���������� ��������� ��ơ�������� ��� ������� �������� �������������������������������������������������ǡ����������������������������������Ƥ��in recycling aluminium.
• Production of virgin steel requires around two times as much energy as ���������������������������������������Ǥ���������ǡ������������ơ������������������sources may cause variations in the extent of GHG savings; however there is a ����������������������Ƥ��������������������Ǥ
The role of the informal recycling sector should not be underestimated in developing �������Ǥ� ���� ������ ����� ���������� ����� ������� ά� ��� ���� ������ ����������� ���developing countries (approximately 15 million people) earns their livelihood from waste-picking and the informal recycling sector (Medina 2008).
The economic contribution of waste pickers should also not be overlooked. Informal ���������� ��� ������� �������� ���� ������� ��� ������ ��� �������������� άǡ� ������������������ ����������� ������������� �����ǡ� �������������� ���� ����� ��� ����Ƥ���� ȋ�������2008). In major Indian cities such as Delhi and Bangalore, waste pickers prevent at ������ ά�������������� ��� ����Ƥ��ǡ� ������� ��������������� ���������ǡ�����day in waste collection and disposal costs (Sharholy 2008). Mexican paper mills have strengthened relationships with waste picker associations in order to secure more supply of valuable waste paper.

Climate Change and Waste Land Restoration
195
3�5 Waste prevention
Waste prevention is considered the most important action in the waste hierarchy; ��������������������������������������������������������������������������������ơ���Ǥ�Waste avoidance is critical to decoupling waste generation from economic growth. Within waste prevention there exists a raft of mechanisms that can deliver climate ����Ƥ�ǡ� ����� ��� �������� ����������ǡ� ��������� ��������� ��������������ǡ� ������������consumption and production, etc. The SCP Branch of UNEP is involved in a number of programmes targeting sustainable consumption and production, including collaborations with the International Solid Waste Association (ISWA) on waste minimisation. Various mechanisms have been developed and applied to prevent �������������ǡ���������������������������������ơ��������������������������������Ǥ
Since the early 1990s, the EU has been actively developing waste-related policy measures. The following EU Directives and Strategies have been instrumental in greening the region’s waste management industry: Packaging (1994), Waste ����������������������� ȋȌǡ� ����Ƥ��� ȋȌǡ� ���� ��� �������������� ȋ����� Ȍǡ�Waste Electrical and Electronic Equipment (WEEE 2002), the Thematic Strategy on Waste Prevention and Recycling of Waste and Sustainable Use of Natural Resources (2005), the EU’s revised Waste Framework Directive (2008) and the Raw Material Initiative (2008).
������������ ������������������������� �������������������������������������Ƥ������cost for the EU by € 80 million per year, which is a cost saving of 40 per cent, compared to the cost that prevailed prior to the directive. Meeting the 95 per cent target by 2015 will reduce the cost further by 80 per cent (GHK and Bio Intelligence Service 2006).
Individual countries have also moved forward with waste related regulations and their enforcement. The German Packaging Ordinance introduced in 1991 helped encourage recycling of packaging waste which is collected through a third party organisation. British Columbia Recycling Regulation of 2004 brought about a considerable increase in the proportion of recycled waste in Canada.
Developing-country examples include the Law of the People’s Republic of China on the Prevention and Control of Solid Waste Pollution adopted in 1995, South Africa’s National Waste Management Strategy in 1999, India’s Municipal Waste Management and Handling Rules in 2000, the Philippines’s Ecological Solid Waste Management Act in 2000, Malaysia’s Solid Waste and Public Cleansing Management Act in 2007 and

Chapter 3
196
���������ǯ��������������������������������� ���Ǥ��������������������ơ��������such measures will come from implementation, the existence of these instruments provides a signal of political commitments to greening the waste sector.
��� ������ ��� �������� ������� ������ǡ� ���� ����Ƥ��� ��� ������ ����������� �����������������������Ƥ���������������������������������������������������ǣ��������������net GHG emissions avoided from treatment and disposal of the waste, but there is ����������������������Ƥ�����������������������������������������������������������and manufacturing.
A US EPA study found that, generally, the net GHG emissions for a given material ���� ������� ���� ������� ���������� ���� �������� ���� ����Ƥ������ ȋ��� ���ǡ� ȌǤ������ ���especially true for prevention of paper waste where GHG savings are attributed to increases in forest carbon sequestration (i.e. less use of virgin forest materials to produce paper products equates to less deforestation). A recent report produced by ������������ƥ�����������������������������������������ȋ�������Ȍ����������how GHG emissions could be prevented through alternative management of materials ȋ������ǡ�ȌǤ��������������ά����������������������������������������������management. Strategies discussed in the report include source reduction through improved product design and cleaner production, increasing product durability, and maximising the ease of product disassembly (for recycling).
3�5�1 European Union: The Landfill Directive
����������ǡ���������Ƥ�����������������������������������������������Ǥ� ������������������������������������Ƥ�����������������ǯ���������������������ǡ�������������������waste prevention, followed by re-use, recycling and recovery, and seeks to avoid ����Ƥ�����������������������Ǥ�
��������������������������������������������������ơ�������������������������������management practices is a complex task. The process of diverting biodegradable ���������� ������ ����� ����Ƥ��� ���������� ��� ��ơ������ ������ ��� ���� ���������� ����region studied and has proceeded at varying speeds. In addition, urbanization and population density are obviously important socio-economic drivers for diverting ���������������Ƥ��Ǥ�

Climate Change and Waste Land Restoration
197
��������Ƥ������������ǯ�� �������� ������������ ��������� �������Ǥ�����ǡ� ���� ������������of long-term and intermediate targets has provided a good framework for countries �������Ƥ�������������������������������������Ǥ��������������ǡ�������������������������governments and the European Commission measure progress and keep attention ��� ���� ����� ������Ǥ�������ǡ� ���� ���������ǯ�� ƪ���������� ���� ����� ��� ���������� �����ǡ��ơ��������������������� ������������� ����������������������������ǡ�����������������to match national and regional realities (including existing waste management practices, institutional structures and environmental conditions), and adapt policies ��������������������������Ǥ����������ǡ���������Ƥ�������������������������������������������� ������������������������������������������������������Ƥ�������������������������way.
The strategies usually include a combination of recycling, incineration, and/or mechanical-biological treatment:
• �������� ����Ƥ���� ��� ��� ���������� ������� ���� ��������� ���� ������ �����������������Ǥ�������������������Ƥ�������������������������������������������������������Ƥ������� ������� �����Ȃ������ǡ�����������������������������������������and other low standard sites. Although this probably implies a reduction in total ����Ƥ��� ��������ǡ��������� ����������������������������� ����Ƥ��� ������ �������������������������������������������������������ƥ����������������������������Ǥ
• �����������������������������������������Ƥ�������������������������������������emissions standards.
• Separate collection of biodegradable municipal waste fractions (mainly paper and cardboard, packaging waste, and food and garden waste) is increasingly ��������������������������������������������Ƥ��Ǥ
• Mechanical-biological treatment is used as an alternative option to incineration to treat mixed municipal waste, in fact capacity for mechanical-biological treatment has doubled or tripled in some countries. The countries studied that use this treatment option all use or are planning to use dedicated incineration and co-incineration of the refuse-derived fuel produced to generate energy.
• Since 1999, capacity at composting and anaerobic digestion plants has increased in most countries.
• ��� ����������� ��� ��� ����� �� ����� ��� ���������� ������ ����� ����Ƥ��� ����� ��well-functioning market for compost is needed. This in turn necessitates that the products of biological treatment of biowaste are of good quality.
Chapter 3
198
��� ������������ ���� ����������� ��� ���� ����Ƥ������������ǡ� ���������� ����� ��������������������������������������������������������Ƥ�����Ǥ��������������������������������������������������������������������������������Ƥ����������������������������������������that gate fees should cover all costs involved in the setting up, operating and closing ����Ƥ���Ǥ
It is important to note that when governments and competent waste management authorities set waste management objectives and targets these must be clearly ��Ƥ���Ǥ� ����������� ����� ����� ��� ���������� �������� ���� ������������� ���� �������responsible for meeting them. Cooperation between municipalities or larger geographical units such as provinces or districts plays an important role in ensuring ���������������Ƥ��������������������������� ������������� ������������������������ �������Ƥ��Ǥ
An often overlooked problem in waste recycling is the lack of acceptance of waste-derived products among potential users. Lack of public acceptance is also very often an obstacle for the introduction of waste incineration. People have tackled incineration’s poor reputation in the past by setting ambitious emission standards. Policy measures and instruments that the public traditionally regards positively; for example separate collection of waste paper, can be further strengthened. In addition, regular communication activities are important to keep households and others aware and active in separating waste and participating in home composting schemes.
3�5�2 Waste management in the EU-27
The Sixth Environment Action Programme (2002–2012) sets out the EU’s key environmental objectives. One of the overall goals is to decouple resource use and waste generation from the rate of the economic growth. The programme also targets �� �����Ƥ����ǡ� �������� ���������� ��� ���� �������� ��� ������ ���������� �������� ����������������� ������������ ������ �����Ƥ����� ���������� ��� ���������������������������� ���disposal. It further encourages reuse and aims to reduce the level of hazard, giving preference to recovery and especially recycling, making waste disposal as safe as possible, and ensuring that waste for disposal is treated as close as possible to its source.

Climate Change and Waste Land Restoration
199
According to the new Waste Framework Directive (2008/98/EC), the European Commission will propose measures to support waste prevention activities, e.g. by �������������������������������������������������Ǥ���������ǡ�����������ά����waste materials such as paper, glass, metals and plastic from households and possibly from other origins must be recycled or prepared for re-use. The minimum target set ������������������������������������������ά����Ǥ�
��� �������� ȋ����������Ȍǡ� ���� ��������� �������� ���������� � ά� ����� ������ ���� ����� ��� � ȋ��������ȌǤ����� ������ ������� ����� ����� ������� ȋǤ�άȌ� ��� ������Ǧ��������������Ǥ�������������Ƥ����������������ǡ������������������Ƥ��������������������������ơ�����������������������������Ǥ�
Source: Eurostat Structural Indicators

Chapter 3
200
3�5�3 Development of municipal waste management
Broadly speaking, Member States can be categorised under three waste management ‘groupings’, clustered according to their strategies for diverting municipal waste ��������������Ƥ������������� ������������������� ����Ƥ�����ǡ���������� ���������ȋ�������recycling and composting) and incineration (EEA, 2007a).
���� Ƥ���� ��������� ���������� ���������� �������������� ����� ������� ��� ���������������������������������������ǡ�����������������������������Ƥ���������Ǥ�������������������������generally introduced several policy instruments early, often before the adoption of Directive 94/62/EC on packaging and packaging waste (hereinafter referred to as ‘the �������������������ǯȌ�������������Ƥ������������Ǥ�
The second grouping brings together countries with high material recovery rates and �����������������������������ǡ�������������������������������������Ƥ��Ǥ������������countries in this grouping introduced policy instruments after adopting the Packaging �������������ǡ�������������Ƥ����������������Ǥ�
������ǣ����ǡ����������������������������Ǥ��������������������������Ƥ���Ȅ��ơ�����������of waste-management policies in the European Union. 2009.
Climate Change and Waste Land Restoration
201
The third grouping contains those countries whose material recovery and incineration ���������������� ���������������������������� ����Ƥ��� ��� ���������������Ǥ������������comprises the majority of the EU-12 Member States in the process of implementing EU regulations and several, but not all Member States with a 4-year derogation from ��������Ƥ������������� ȋ�Ǥ�Ǥ���������ǡ� ������������������ǡ������ǡ����������ǡ� �������ǡ�Romania, Slovakia and the United Kingdom) or from the Packaging Directive (Greece and Portugal). The geographical distribution of the three groupings is shown in this Ƥ����ǣ
4 MANAGEMENT AND MINIMIZING OF LANDFILL GAS EMISSIONS
����Ƥ������������Ƥ�������Dz������������������������������������������ǡ������������������underground or on the surface for periods of time longer than one year for non-hazardous waste, and exceeding six months for hazardous waste.”
�����������������������������ǡ���������������� �����Ƥ������������������������������of waste at locations properly built and prepared, following the corresponding environmental requirements. Waste disposal is the last option in the hierarchy of waste contained in the European Union management principles.
��� ���� ������� �����ǡ� ���� �������� ������ ��� ��� ������� ����Ƥ��� ��������ǡ� ����������� ���Ǧrecyclable materials (fully optimize waste resources), and to control environmental contaminants (pollutants in the atmosphere, leachate generation and treatment, distinction in the discharge of hazardous waste, inert or non-hazardous waste, etc..).
���������������������������Ƥ�����������������������������������������������������ǡ�as well as the main characteristics (waterways, water bodies and agricultural and urban areas, the existence of groundwater or natural reserves, geological and ���������������� ����������ǡ� ������ ��� ƪ������ǡ� ����������ǡ� ������ ��������� ���landslides, protection of cultural heritage of the area where they will be located) and consider the distances between the boundary of the site and residential and recreational areas.
���������������������������������������������������ơ��������������������Ǧ��������������������������ơ�����������������������Ǥ��������������������ǣ

Chapter 3
202
T/YEAR RATIO AND PERCENTARGE OF WASTE OF EACH FLOW TREATMENT OF MSW IN SPAIN.
Treatment system t/year ά
Controlled waste 14.696.000 59,35
Triage + Composting 6.455.000 26,07
Incineration 1.915.000 7,73
Selectively collected packaging waste 331.000 1,33
Selectively collected organic waste 244.000 0,98
Triage + methanation 1.124.000 4,54TOTAL 2.4765.000 100,00
Source: Spanish Ministry of Agriculture, Food and Environment, 2006.
4�1 Closure of landfills
������Ƥ������������������������������������������������������������������������Ƥ����on-site inspection, assessing all the reports submitted and notifying the operator its approval for the closure. Then, the entity will be responsible for its maintenance; monitoring and control during the period required by the relevant authorities and in no case shall be less than 30 years.
����� ������� ����� ����� ��� ������������ ���� ����������� ���� ���������� ����Ƥ��� ���� ����leachate, and the groundwater regime in the vicinity of the site. After the useful life of ������Ƥ����������ǡ�����������������������������������������������������������������Ǥ������restoration should be done with all environmental safeguards.
�����������������������������������������Ƥ��������������ǣ
1. Conduct a detailed site survey, in order to write a proper sealing project, as ���������Ƥ���������������������������������Ǥ
2. Write the sealing project.
3. �������������Ƥ��������������������Ƥ���������������������ǡ��������������������������access control, in order to prevent further discharges.
4. Conditioning discharge surfaces.

Climate Change and Waste Land Restoration
203
5. ��������������ǡ���������������������������������������ǡ�������������Ƥ������������river water and close the outlet passage of the vent gases through the exhaust system of gas. This includes revegetation of the surface. Sealing layers:
- The top layer of waste is covered with a 0.5 m compacted clay mineral layer.
- Layer of high density polyethylene (HDPE) that is covered by a geotextile.
- Gravel drainage layer (not <50 cm), enabling the collection and channeling of rainwater.
- Capa de tierra de 1m de espesor y de naturaleza adecuada a la vegetación que se prevea.
- 1m thickness soil layer suitable for the vegetation.
- Humus soil fertilized with appropriate vegetation to these conditions.
6. ��������������������ơ�����������������Ƥ����������������������ơ�ƪ������������-�������������Ƥ����������������������Ǥ
7. Control leachate extraction placing drainage systems leading to leachate sto-rage ponds.
8. Controlling the extraction of gases and avoid its uncontrolled migration.
9. Monitoring of gas and leachate management during a period of 30 years after closure.
10. ���������������������������������������ơ�������������������Ǥ
11. Waste and soil treatment, as it must be conditioned for revegetation and re-clamation.
4�2 Post-closure maintenance
4�2�1 Production of biogas
���� �������� ��� ������� ��� �� ����Ƥ��� �������� ���������� ���������� ��� ��������������waste producing gases such as methane, carbon dioxide and water vapor mainly, and ���������������������������������ȋ������������Ƥ��ǡ��������ǡ��������ǡ�����������ǡ�etc.)..

Chapter 3
204
The volume and composition of gases generated depends, not only on the content of ���������������������������������������������������ǡ����������������������������Ƥ��������������Ƥ��Ǥ
Gas production is automatically controlled by the gas conduction to control stations �����������������������������������ƪ��ǡ�������������������������Ǥ����������������centralized in a control center using a computerized system.
4�2�2 Exploitation of landfill biogas
���� ��������� ����������� ���� ��� �� ����Ƥ��ǡ����������������� ��������� ���� ����������actions:
• Preparation of wells or chimneys
Essential conditioning to hinder the introduction of air through the surface adjacent ������������ǡ��������������Ǧ����������ȋ�������� ����ƪ�������������������������ȌǤ� ���basically consists of the isolation of the area adjacent to each well of capture, so that �������������������������������������������������������������������������������Ƥ���biogas production by aerobic conditions.
�������������� �������� ��� ���� �������� ��� ���� ����Ƥ�������� ��� ������� ��� ��������� ���possible. The sealing of the wellhead can be ensured by the compaction of clay covering materials in the vicinity of the chimneys, complemented if necessary, placing ���������������Ƥ�����������������������������������������������������Ǥ������system is used to prevent the entry of air and thus oxygen, to the compacted waste.
• Uptake of gas and its conduction
Each wellhead is connected to pipes of high density polyethylene (HDPE) of 110 or 90 ��������������Ǥ����������������������ǡ������������������������������������������ά�to regulation stations.
• Regulation stations
HDPE pipes from wells, form groups according to their closeness. Each set of pipes goes to a collector where the concentration of methane (CH4) and oxygen (O2) is continuously ��������Ǥ�����������������������������������ǡ���������������������������ƪ��Ǥ

Climate Change and Waste Land Restoration
205
The collector of each station leads the gas mixture to the extraction plant; it is centralized in a picture-programmable computer control.
• Extraction system
Mixture gas pipes from regulation stations converge at the entrance of the extraction plant in a single intake manifold. The suction gas is sent to the delivery manifold where it is distributed for use (cogeneration or torch).
The amount of gas that is sent to cogeneration (CHP) must contain a minimum ����������� ��� �����������Ǥ����������ǡ� ��� ���������� ������ ���������� ���� ���� ƪ���direction, depending on the indication of the methane analyzer.
• Cogeneration
Cogeneration is the alternating electric generation by a group of internal combustion engine-electric generator.
• Torch
This is a safety system which burns the excess of gas cogeneration. It must have ��ƥ�����������������������ά��������������������Ǥ
• Gas control
It provides control of gas collection facilities, the analysis, the control of cogeneration based on the quantity and quality of gas produced, and centralization of data in a control center with computer support.
4�3 Minimizing impacts on the atmosphere
• ��������������Ƥ�������������������������������ǣ�
- ά������������������������������������������������������ȋ����������Ȍ�
- ������������������������������������
- ά����ƪ�����ȋ������Ȍ�

Chapter 3
206
• ���������������������������������������Ƥ��ǣ�
- ������������������������������������������������������
- ά� ��� ��������� ������ Ǯ�����ǯ� ����� ����������� ����� ��� ������� ��������Composting
- ά���������������������Ǯ�����������ǯ��������������������������������ǡ�����
- ������������������������������������������������������������������������or more highly engineered composting schemes
Source: ����ǣȀȀ���Ǥ����������������������Ǥ���Ȁ����Ƥ��Ǧ��Ǧ�������Ǥ���
4�4 Landfill mining
As available land and resources become increasingly scarce, options to harness these from alternative sources become more sought after. One of the options available is ����Ƥ���������� ȋ��ȌǤ���� ����������������������������� �����������������������������������Ƥ�������������������������������������������������������������������Ǥ��������

Climate Change and Waste Land Restoration
207
�����Ƥ����������������������������ǯ���������������������������������������Ƥ��ǡ���������������������������������Ƥ�����������������������������������Ǧ��������Ǥ�����������������������Ƥ��������������������������������������������������������������Ǥ
It appears that there are three main strategic reasons for LFM operations: Extraction recycling potential; extraction for energy recovery; and the reclamation of land. �����������Ƥ���������������������������������������������������������������������the deposited wastes, the third has greater potential for considering environmental and wider sustainability drivers.
4�4�1 Advantages and disadvantages of landfill mining operations
The extraction of wastes for their recycling potential is highly likely to be driven by �������������������������������������������������Ƥ������������Ǥ�������������������������those materials which have the highest values and the lowest level of degradation ��������� ����Ƥ�������Ǥ����������ǡ����������ǡ������������������������������Ǥ��������ǡ��������������������������������������Ƥ�������������Ǥ���������Ƥ������������������������need to be considered.
The reasons covered by the broad term ‘land reclamation’ may include one or a combination of the following:
• ����Ƥ�������������������������������������ǡ������������������������Ƥ�������������ǡ�ideal for traditional development purposes;
• ��������Ƥ��������������������������������������������������������������������ǡ�such as the Channel Tunnel Rail Link in the United Kingdom;
• It may be contaminating the groundwater or surrounding area and the source requires removal; or,
• �����������������������������������������������Ƥ����������������������������ơ������kinds of wastes more suitable to long-term disposal, such as non-reactive hazardous wastes (e.g. asbestos).
Materials and energy recovery are likely to be primarily dependent on economic factors, land reclamation may be driven by environmental reasoning. When the ��������������������Ƥ��� �������������ǡ������������������Ƥ���������������������������������������������������������Ƥ����������������������������Ǥ
Chapter 3
208
�����������������������������Ƥ����������������ǡ������������������Ƥ���������������������������������������������������������Ƥ����������������������������Ǥ
On the other hand, it is only in recent years that accurate knowledge, and then only ��������������ǡ������������������������������������������Ƥ�������������������Ǥ�����������of knowledge merely increases the risks that would otherwise be present during LFM operations.
���������������������������������Ƥ���������������ǣ�
• Nuisance caused during the LFM operation
• Potential for presence of hazardous materials
• ��������������������������Ƥ����������������������������
Many of these risks are similar to traditional mining operations but are enhanced by ������������������������������������������������Ƥ��Ǥ�������������������������������������������������Ƥ�������������������������������Ǥ�����������������������������ǡ�����������would remain contained and have limited opportunity to realise the hazards caused.
4�4�2 Technical requirements and considerations
LFM is a combination of processes. These can be broken down into:
1. Preliminary works
2. Extraction of waste
3. Processing of waste
4. End-markets
5. Remediation of land
6. Subsequent development
Following the preliminary works of site preparation, surveys, investigations and programming resources, the physical operation of LFM is a relatively simple one �����������������������Ƥ���������������������Ǥ��������ǡ����������������Ƥ�������������

Climate Change and Waste Land Restoration
209
need to be considered. The discovery and handling of hazardous materials within the ����Ƥ�������������������������������ǡ��������������������������ǡ��������������Ǥ
Once the waste is extracted, it needs to be processed according to the objectives of the ������Ǥ�������������������������������������ǡ��������������������������Ƥ������������depending upon material and the end-markets will have their own requirements. ������������������������������������������������������Ƥ���������������������Ǥ�
Any form of energy recovery is likely to require pre-treatment shredding, trommel screens and metal extraction. It may also require drying to reduce moisture content. �������������������Ƥ�������������������������������������������������������������������������������ơ������������������������������������������Ǧ�����������������������to be able to provide a homogenous output for a waste-to-energy plant to deal with. This may need to be completed on site prior to transportation so that only a stabilised product is being moved and the associated haulage costs and risks reduced.
Once the site has been completely excavated, there will be a requirement to remediate the land to remove any residual pollution if the intention is to develop the site for an ��������������������������������������������������Ǥ���������������������Ƥ������������that will require intensive ground investigations and analysis of the groundwater and soils in the area. By removing the source, this part of the process becomes one of containment and decontamination. It is likely that this would be possible using traditional land remediation techniques.
������������������������������������Ƥ���������������Ƥ��������������������������������the scheme. Depending on the extent of the remediation, it is likely that a specialist operator would not be required at this stage and a construction contractor experienced ��������Ƥ�������������������������ƥ�����Ǥ
4�4�3 Costs and benefits to society
According to a study conducted by Van Passel, S., et al. (2012), show that Enhanced ����Ƥ��� ������� ȋ���Ȍ� ��������� ����� �� ������ �������� ��������� ���������� �����adequate regulation and support policies are in place. This is important because ��� ������ ����� ������ ��� ������ �������������������������� ��� ����������Ƥ������ �������projects. In this section we broaden the scope of analysis by including also some of ��������������Ƥ���������������ơ������������������������������������Ǥ��������������ǡ����

Chapter 3
210
��������������������������������������������������������Ǥ������Ƥ�������������������������������������������������Dz������������������dz�����������Ǥ�����������������������assessed and later monetized. In a second step the analysis of impacts for society is ���������������������������������������Ƥ�������������Ǥ
Van Passel, S., et al. (2012) performed the carbon footprint analysis for two scenarios assuming a time frame of 20 years. In this way, they investigated which scenario is �������������Ƥ������������������������������������������Ǥ���������������ȋ�������ǡ��������Ȍ��������������������Ƥ���������������������������������������������������������methane. The energy recovery from methane would last for about 15 years, using a combined heat and power (CHP) cycle. This will generate an amount of electricity and an amount of recoverable heat. Keeping the situation unchanged ‘forever’ is called the Business as usual (BAU) scenario. No incoming materials, no outgoing materials. In a second scenario (ELFM) most of the historical waste from the Remo site would be recovered as energy and materials. As in the BAU scenario, energy recovered from methane would last for about 15 years. In the ELFM scenario, however, a waste-to-energy (WtE) plant and a sorting and recycling plant (WtM) need to be built on the Remo site. All operational emissions of the six categories mentioned are taken into ��������ȋ�������������Ƥ����ȌǤ��������������������������������������������������������any net addition to global warming.
�������ǣ�����������ǡ��Ǥǡ������Ǥǡ�������������������������������Ƥ���������ǣ����������������������performance drivers, Journal of Cleaner Production (2012), doi:10.1016/j.jclepro.2012.03.024

Climate Change and Waste Land Restoration
211
The BAU scenario would only produce a small amount of energy (from methane ��������Ȍǡ��������������������������������Ǥ����������ǡ�������ơ������������������������energy will be purchased on the market in the case of the BAU scenario. Greenhouse gas emissions of conventional market production methods will be accounted for in the BAU carbon footprint. Comparing the footprints of both scenarios; gives us an �����������������������������������Ƥ��������������������������������������Ǥ
The summarized output data in the next table show that, under current conditions, ����������������������������������������ȋ������ά�������������Ȍ������������������������������� ����Ƥ�� ȋ����� ����� ά���� ���� ����Ƥ��ȌǤ����������������� ��� �����������technologies (and especially Waste-to-Energy technologies) is an important aspect to improve the feasibility of ELFM practices. Logically, market prices also have an impact on the economic performance of ELFM.
������ǣ�����������ǡ��Ǥǡ������Ǥǡ�������������������������������Ƥ���������ǣ����������������������performance drivers, Journal of Cleaner Production (2012), doi:10.1016/j.jclepro.2012.03.024

Chapter 3
212
REFERENCES
United Nations Environment Programme. Waste and Climate Change Global Trends and Strategy Framework. 2010.
���ǡ����������������������������Ǥ���������������������Ȅ���������� �������������������Ƥ���from better municipal waste management in Europe. 2011.
��ǡ��������������������Ǥ�����ȋȌ��Ƥ���ǤGerman Federal Ministry for the Environment. Waste Sector’s Contribution to Climate Protec-
tion. 2005Fundación Forum Ambiental. La mejora en la prevención y gestión de los residuos municipales en
España contribuye a la lucha contra el cambio climático. 2012.EPA, Unites States Environmental Protection Agency. Opportunities to reduce greenhouse gas
emissions through materials and land management practices. 2009.UNEP, United Nations Environment Programme. Towards a Green Economy: Pathways to Sustai-
nable Development and Poverty Eradication. 2011.���ǡ����������������������������Ǥ��������������������������Ƥ���Ȅ��ơ�������������������Ǧ��-
nagement policies in the European Union. 2009.����ǡ��������������������������������������Ǥ������������������������Ƥ���������ǡ�Ǥ����������ǡ��Ǥǡ������Ǥǡ�������������������������������Ƥ���������ǣ�������������������������������-
ce drivers,Journal of Cleaner Production (2012), doi:10.1016/j.jclepro.2012.03.024

Water Management and Planning
Authors
Juan C. Santamarta Cerezal
Jonay Neris
Axel Ritter
Luis E. Hernández-Gutiérrez
University of La Laguna
Viana nº 50, planta baja, 38071,
La Laguna - Tenerife
Spain
4Chapter


215
Chapter 4
University of
La Laguna,
Tenerife, Spain
Water Management and PlanningJuan C� Santamarta CerezalJonay NerisAxel RitterLuis E� Hernández-Gutiérrez
ABSTRACT
������ ��� ����ǡ� �������������������������� ��������������� �������Ǥ����� ��ǯ�� ��Ƥ�������������ǡ� ���� ����� ����� ά� ��� ���� �����ǯ�� ������ ������ ��� ���������� ���� ����������������Ǥ�����Ƥ�����������������������������������������������������������������matter. It is well recognised that water planners require a broad set of inter-�������������������������������ơ�����������������������Ǧ�������ǡ�������������������contemporary water management challenges. Solving water-related problems, ��������� �������Ƥ�� ���������� ���� ������� ���� ��������� ����� ������������ ���� ����ability to integrate environmental, social and political considerations into planning practice. The 21st century will be an era of increased global concern regarding the availability of water.
�������ǡ�����������������������������������������������������������Ƥ������������and the population in general. Despite the climate pattern has been changing continuously during the Earth´s history due to changes in the atmosphere, topography, volcanic activity, and other natural factors, this change seems to have been exacerbated recently due to the alteration of the greenhouse gases content in the atmosphere by the humanity. Nowadays, the extent of this change and its �ơ��������������������������������������������������������ƪ���������������������������������ơ���������������������������������Ǥ����������������������������������������������������������������������������������������ơ�����������������������Ǥ�������warming, leaded last century by the climate change, has involved alterations in the temperature, precipitation and evaporation patters. From the point of view of
Chapter 4
216
the water resources, these changes include an increase in the freshwater losses from terrestrial sources (glaciers, ice and snow, lakes, soil moisture, swamps, groundwater, marches and rivers) by evaporation and sublimation from fresh water deposits and transpiration from the vegetation, but also changes in the rainfall quantity and patterns. As a result, climate change has leaded short and long-term alterations in the ��������������������������Ǧ�����������������������ƪ��������������������������������impact on, among others, the quantity but also quality of water resources.
This module focuses on one of those, the issue of water supply planning and resource management, in particular, the planning process, systems analysis methods; institutional framework for water resources engineering; comprehensive integration of engineering, economic, environmental, security, legal, and political considerations in water resources development and management. It further discusses the �������������ǡ� ��������ǡ� ���� ������� ������������� ��� ƪ����ǡ� ��������ǡ� ����ǡ� ����water usage as well as current issues in water quality, water pollution, and water resource regulation.
The overall aim of the module is to develop the skills of the students to know how to plan, develop and manage water resources.
1 WATER PLANNING
1�1 Introduction
Water is an increasingly critical issue at the forefront of global policy change, management and planning. There are growing concerns about water as a renewable resource, its availability for a wide range of users, aquatic ecosystem health, and global issues relating to climate change, water security and water trading.
������ ���������� ����������� ������ ������� ������� ��� �ƥ�����ǡ� ������������ ������� ������ ���������Ǥ������ ������� ������ ��� ����������� �ƥ�������� ���� ��������� �������������������ǡ���������ƪ�������������������������������������������������������ǡ�also considers how water resources can become more integrated and sustainable.

Water Management and Planning
217
1�2 Water plans
Water plans must include recommended alternatives for regional water resources management, water conservation, protection of the regional public welfare, and time lines for implementing the water plan. The primary factor that was taken into ���������������������������������������������������ƪ�����������������������������������resources, such as boreholes, rivers or springs.
The water budget begins with the amount of water provided by precipitation as the total available water in the watershed.The plan will be reviewed and updated ������Ƥ��������Ǥ�������������������������������������Ƥ������������������������������population forecasts into the forecasts.
Figure 1: Lake in Azores Island, San Miguel (Santamarta-Cerezal, 2013).
According to Loucks and van Beek (2005), planning and management activities should pay attention to these possible negative consequences of industrial development, population growth and the intensive use of pesticides and fertilizers in urban as well as in agricultural areas. Issues regarding the environment and water quality include:

Chapter 4
218
• ������������������������������ƪ���������������������������������������
• Threats from aquatic nuisance species
• Threats from the chemical, physical and biological water quality of the watershed’s aquatic resources
• Quality standards for recycled water
• Non-point source pollution discharges, including sediment from erosion
• Inadequate groundwater protection compacts and concerned institutions
1�3 Water plans objetives and strategies
The water plans objetives include;
To introduce a Water Act as well as revise existing laws and regulations to serve as ���������������������������ƥ��������������������������������������������Ǥ
To establish a national level organization responsible for policy formulation; oversee implementation of the policy by concerned agencies; and establish basin-level and local level organizations with supporting laws.
Appropriate water allocation for all user sectors at the national and basin levels:
• ��Ƥ��������������������������������������������������������
• Prioritize water use for the various sectors, i.e., agriculture, domestic, industry, conservation of ecosystem etc
• Promote conjunctive use of surface and groundwater
• Set water-use criteria/proportions for the various sectors from national to basin level
• ������������������������ȋ�������ǡ�ƪ������������������Ȍ
��������������������Ǧ�����ƥ������ǣ
• ������ ��������� ���� Ƥ�������� ������ ���� ������ ����������ǡ� ���� ����������ǡ�the creation of a water market, compensation, taxes and allow users to be responsible for paying for service, wastewater treatment etc

Water Management and Planning
219
• Campaign to create awareness of users about the necessity to share costs and �����������ƥ�������
• Set up a water resources management fund
• Introduce water reuse/recycling
• Introduce water saving technologies
������������������������������ƥ������ǣ
• Rehabilitate existing infrastructures
• Develop a water network/grid both within and among basins, and a distribution system to serve as many users as possible
• Improve the organizational structure and management system
To develop water resources in accordance with potential and needs of various activities, both in terms of quantity and quality with due consideration of the environment. To ��������ƥ�����������������������������������������������������ǣ
• Set clear direction for water resources development both within and outside the country by emphasizing development of water resources within the country to their full potential
��������������������������������������������������������������ƥ�����������������ǣ
• Include water related topic at all levels of educational curriculum
• Promote public awareness and understanding of the importance and ����������������������������������ƥ�����������������
���������� ������ƪ���ǡ����������������������������������������������� ��������������ƥ������ƪ���������������������������������ǣ
• ��������� ƪ���� ���� �������� ����������� ���� ��������������� ������� �����ǡ�employing bothstructural and non-structural measures
• Promote and support local organizations to be capable of reduce and solve ƪ����������������������
• Develop a preparatory process for protection and rehabilitation operations prior, during and

Chapter 4
220
• after disasters
• Set up a forecasting and warning system
• Set guidelines and procedure for water related disaster warning
1�4 Water budget
�������������ά���� ���������ǯ�� �������ǡ����� ��� �����ƥ����� ������������������ ������������������������������������������������������������Ǥ��������������������Ǥά�������������ǯ�������ǡ������Ǥάǡ������������������������������������Ǥάǡ�����������seem surprising because water plays such an important role in weather. The annual precipitation for the earth is more than 30 times the atmosphere’s total capacity to hold water. This fact indicates the rapid recycling of water that must occur between the earth’s surface and the atmosphere.
����������������������������������������������Ƥ������������������������������������������������������������������Ƥ�������ǡ���Ƥ�������������������������������������������Ǥ�A water balance analyzes the input and output of water in an area of a watershed ���������ǡ�������������������������������������������������������������������ơ���������������ǡ��������������ơ����������������������Ǥ
���� ���������������������������� ��� ����� ��� ���������������������������Ƥ�����Ƥ�������surplus water in a watershed taking parameters like rainfall, relative humidity, tem-��������ǡ������������ǡ���������������������������������ƪ���������������������������of the watershed.
������������������������������������������ơ������������������������������������������outputs of water mean water that is stored.
Inputs - Outputs = Change in Storage
Applying these concepts, precipitation is expressed as:
������������
���������������������������������������������������ǡ���������������������ǡ�������ơ���������Ƥ��������Ǥ
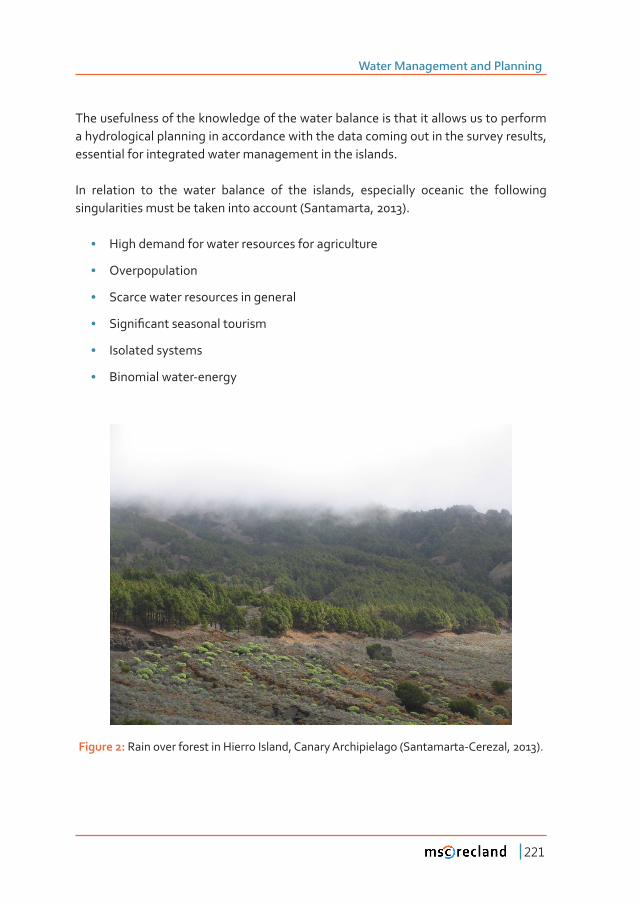
Water Management and Planning
221
The usefulness of the knowledge of the water balance is that it allows us to perform a hydrological planning in accordance with the data coming out in the survey results, essential for integrated water management in the islands.
In relation to the water balance of the islands, especially oceanic the following singularities must be taken into account (Santamarta, 2013).
• High demand for water resources for agriculture
• Overpopulation
• Scarce water resources in general
• �����Ƥ����������������������
• Isolated systems
• Binomial water-energy
Figure 2: Rain over forest in Hierro Island, Canary Archipielago (Santamarta-Cerezal, 2013).

Chapter 4
222
�������� ���������� �������� ��������� �� �������� �������� �������������ǡ� ����ơ� ��������ǡ� ������� ������������ǡ� ���Ǥǡ� ��Ƥ��������� ��� ���� ������������ ������ǡ� ����������which either evaporates (from open water surfaces) or transpirates from vegetation (evapotranspiration), completing the natural cycle back into atmospheric moisture and precipitation. It is necessary to understand this balance or water budget in order to sustain the resource and its environmental and human connections in the watershed. The understanding of the hydrologic cycle on a watershed basis is essential for development and implementation of appropriate watershed management policies and procedures.
A water budget analysis is a computational technique that balances water input and output while accounting for change in storage. On a watershed scale knowledge of these relationships can be used in addressing major decisions relating to such issues as:
• Land use and watershed planning
• Ensuring sustainable development
• Determining the receiving stream capacity for waste discharge
• Assessing risk exposure;
• ������������������������Ƥ������������������
• Reporting environmental conditions and status.
1�5 Water planning and climate change
The most important impacts of Climate Change will be on the Earth’s water cycle. �����������������������������������������������������Ƥ�������������������������������challenge. The water cycle describes the constant movement of water from ocean to atmosphere to the land surface and back to the ocean. On a global scale the total amount of water does not change but where it is distributed does.
Water scarcity is expected to become an ever-increasing problem in the future, for various reasons. First, the distribution of precipitation in space and time is very uneven, leading to tremendous temporal variability in water resources worldwide (Oki et al, 2006).

Water Management and Planning
223
Second, the rate of evaporation varies a great deal, depending on temperature and relative humidity, which impacts the amount of water available to replenish groundwater supplies. The combination of shorter duration but more intense ��������� ȋ�������� ����� ����ơ� ���� ����� ��Ƥ��������Ȍ� ��������� ����� ����������evapotranspiration (the sum of evaporation and plant transpiration from the earth’s land surface to atmosphere) and increased irrigation is expected to lead to groundwater depletion (Konikow and Kendy 2005).
As climate change warms the atmosphere and alters the hydrological cycle, we will continue to witness changes to the amount, timing, form, and intensity of precipitation ���� ���� ƪ������������ �������������ǡ� �������� ��� ���� �������� ��� �������� �����������environments, Already, water-related climate change impacts are being experienced ����������������������������������������������������������ƪ����Ǥ����������������temperatures and changes in precipitation and temperature extremes are projected ����ơ��������������������������������������������������������������������������������ǡ������ ��������ǡ� �������� ���� ���Ȁ���������ǡ� ���� ������ ���� ������������ ƪ���Ǣ� ������factors are expected to lead to further deterioration of water quality as well.
The premises that water planning is best done on a regional level is due to the many variables in climate, water supply, water demand, and legal and institutional constraints to water resources management.
1�6 Water management on islands
Water problems on islands are mainly related to the limited water resources. Due to the limited water resources, water related problems that are common elsewhere as well, such as pollution by wastewater and inadequate water supply systems (mainly huge leakages) become more acute on islands and thus require special attention and appropriate management (Hophmayer, 2012).
Islands depend, as other mainland countries, upon the quality and quantity of their water for their existence and economic activities. However, water management on islands is unique as it is constrained by their size, isolation from the mainland, fragility, �����������������ǡ�������������Ƥ������������������ȋ����Ƥ��������������ǡ�ȌǤ

Chapter 4
224
Small islands frequently have a relatively limited capacity to store water for use in the dry season, and the construction of large reservoirs is often prohibited by the ������������ ��� ƪ���� ������� ����Ǥ� ��� ��������ǡ� ����������� �����ǡ� �������� ����� ������topography, short river channels and easily eroded soils, can cause siltation of reservoirs, further decreasing storage capacity (Khaka, 1998).
Figure 3: Landscale in Hawaii islands (Santamarta-Cerezal, 2013).
1�7 Useful links
• WATER - Environment - European Commission
• Climate Change and Water - US Environmental Protection Agency
• Water resources systems planning and management
• Ground Water Development, Sustaninability, and Water Budgets
• Climate Uncertainty: What it Means for Water Planning and Policy
• Water Resource Planning Options for Climate Change

Water Management and Planning
225
2 water uses
2�1 Introduction
An adequate supply of water is essential to ensure continued economic vitality and quality of life. Water use must generally respond to two needs: the need to satisfy the growing demand for water used for human consumption and for production processes (industry, agriculture, recreation), and the need to preserve water quality and protect ���������������Ǥ�������������������������Ƥ������ǡ�����������������ǡ����������������protection of water resources.
The most important water uses are;
• For drinking purpose
• For washing, bathing and cooking etc
• For building construction
• For the generation of steam for industrial use and electricity generation
• For generating hydroelectricity
• As a solvent
• For irrigation purposes
Water is crucial for the economy. Virtually every industry from agriculture, electric power and industrial manufacturing to beverage, apparel, and tourism relies on it to grow and ultimately sustain their business. Generally, the largest percentage of water consumption is attributed to agriculture.
Accounting for water is an essential step toward ensuring that a water utility is sustainable. This is best accomplished when water systems meter use by their customers. Metering helps to identify losses due to leakage and also provides the foundation on which to build an equitable rate structure to ensure adequate revenue to operate the system.
Options for water demand reduction:
• ������ƥ������Ƥ����������������������������

Chapter 4
226
• Landscaping and storm water management
• Grey water use
• Revised irrigation strategies and technologies
• Water pricing
• Education
• Incentives
• �����Ƥ������
Two-thirds of the world’s population is projected to face water scarcity by 2025, ����������������������������ȋȌǤ���������ơ������������������������ǣ
• Birth rate
• Death rate
• Immigration
• Emigration
• Government policies
• Religious and societal beliefs
• Catastrophes
• State of the Economy
2�2 Water footprint
The water-footprint concept was coined in 2002 by Arjen Hoekstra, a professor of water management at University of Twente in the Netherlands. Using data from the UN’s Food and Agricultural Organization, Mr. Hoekstra and other researchers gauged the water content that went into the making of various products and applied those statistics to people’s consumption patterns to get a rough water footprint for average individuals and nations as a whole.
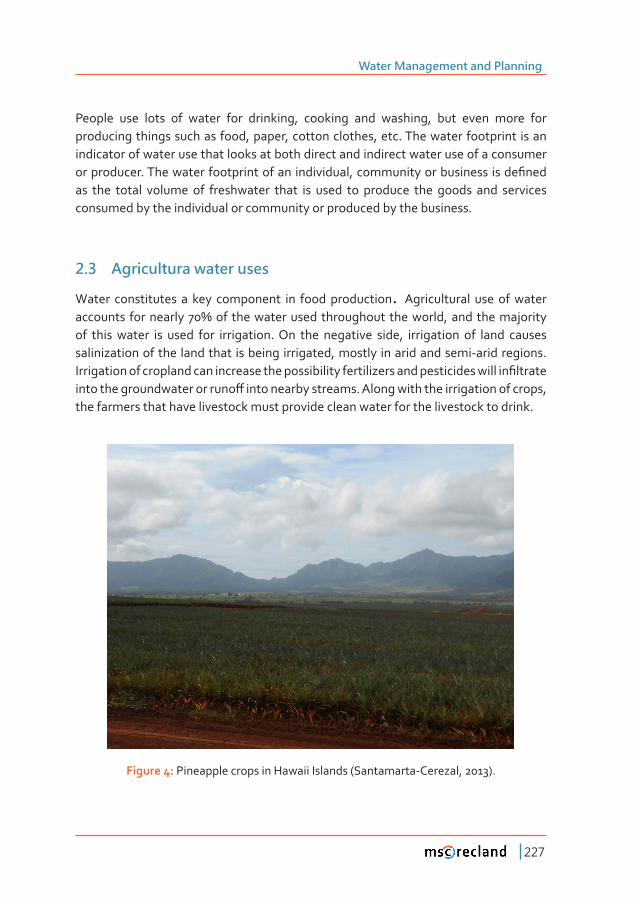
Water Management and Planning
227
People use lots of water for drinking, cooking and washing, but even more for producing things such as food, paper, cotton clothes, etc. The water footprint is an indicator of water use that looks at both direct and indirect water use of a consumer �����������Ǥ�������������������������������������ǡ����������������������������Ƥ����as the total volume of freshwater that is used to produce the goods and services consumed by the individual or community or produced by the business.
2�3 Agricultura water uses
Water constitutes a key component in food production. Agricultural use of water ��������� �����������ά���� �����������������������������������ǡ������������������of this water is used for irrigation. On the negative side, irrigation of land causes salinization of the land that is being irrigated, mostly in arid and semi-arid regions. ��������������������������������������������������������������������������������������Ƥ�����������������������������������ơ��������������������Ǥ�����������������������������������ǡ�the farmers that have livestock must provide clean water for the livestock to drink.
Figure 4: Pineapple crops in Hawaii Islands (Santamarta-Cerezal, 2013).

Chapter 4
228
2�4 Industrial uses
��� ��� ���������� ����� ά� ��� ���������� ������ ���� ��� ����������Ǥ� ������ �����������users include power plants, which use water for cooling or as a power source (i.e. ��������������������Ȍǡ������������� ��Ƥ������ǡ����������������� ���������������������ǡ�and manufacturing plants, which use water as a solvent.
Some power plants use cooling systems that draw water from a lake, river, aquifer, or ocean to cool steam and then return virtually all of it, although at higher temperatures, to the source. Such systems, known as once-through cooling systems, have high withdrawals but low consumption.
Reusing and recycling industrial water can ease the pressure on water resources and avoid the need to discharge to the sewer and/or environment. With appropriate management, which may include treatment, industrial water can be used for a wide range of purposes including industrial uses (e.g. cooling or material washing) or non-����������������ȋ�Ǥ�Ǥ����������������������ƪ������ȌǤ
2�5 Useful links
• What’s your water footprint?
• The EU’s Water Footprint - Institute for Environment and Sustainability
• Water resources across Europe - European Environment Agency
• TEDxOslo - Angela Morelli - The Global Water Footprint of Humanity
• Water Footprint and Conservation projec

Water Management and Planning
229
3 SURFACE WATER EXPLOTATION
3�1 Precipitation
The part of the hydrologic cycle that is of most relevance to water planning is the precipitation;
• ����� �������������� ����� ������ ��� ����� ������ ȋ��Ƥ�������Ȍ� ����� ���� ������� ���become soil moisture, part of which is taken up by plant roots and returned to the atmosphere through the process of transpiration
• �������������������������������������������Ƥ��������ƪ����������������������������and through channels, from which it may be diverted for various consumptive ����������������Ƥ�������������ǡ��������������������������������������������
• When soil moisture storage capacity is exceeded, recharge to groundwater occurs
When rainfall falls on the land surface, typically, depending on the intensity of the ������������������������������������������������������ǡ������������������������Ƥ�����������������������ǡ�������������������������������ơ�����ƪ������������������������������������������������ǡ����������������������������ƪ������������ƪ��Ǥ�
������������������������������ơ����������������������������������������������������������� ���� ����Ǥ������������ �������������������� ��������� ���������� ��������� �����Ƥ������� ��������ǡ��������������������������������ơ������������������������������������������������catchment.
Surface water budget analyses rely heavily on estimates of components instead ��� ������� ������������Ǥ� ��������� �������������� ���� ������ƪ��� ���� �����������water sources, they are typically measured at only a few locations. Evaporation, ����������������������������ǡ���Ƥ��������ǡ��������ƪ���ǡ��������������������������������are generally not measured directly and are therefore estimated. Consequently, the surface water budget calculations presented here have a high degree of uncertainty and should be used with caution.

Chapter 4
230
Figure 5: Surface water catchment (Santamarta-Cerezal, 2013)
3�2 Reservoir related issues
������������������������Ǧ����������������������ƪ����������ǡ������������������������annual basis. Dam building, or other hydraulic works, is the way usually to control water quantity, as far as meeting demands is concerned.
������������������������������Ƥ���������ǡ����������������������������������������������is used to store water. Reservoirs may be created in river valleys by the construction of a dam or may be built by excavation in the ground or by conventional construction techniques such as brickwork or cast concrete.
�����������������������������������������������������������������������������ƪ��Ǥ��������������������Ǧ���������������������������������������Ƥ���������������������������conserve the hydrological and ecological functions of their drainage networks.
Water Management and Planning
231
�����������������������������������������������������������������������������ƪ�������in those areas. Reservoir construction inevitably results in loss of land and forces the evacuation of residents due to impoundment
Water stored here during wet times is used during dry times, making the region’s �����������������������������������ǡ��������������ƪ������Ǥ
The reasons for constructing reservoirs are ancient in origin, and initially focused ��������������������������������� ����������������������������������������ƪ����Ǥ�Accordingly, reservoirs are usually found in areas of water scarcity, or where a controlled water facility was necessary.
3�2�1 Dams
A dam is any barrier that holds back water; dams are primarily used to save, manage, ���Ȁ���������������ƪ�����������������������������Ƥ���������Ǥ������������ǡ������������������������������������������Ǥ���������������������ơ�������������������Ǥ����������� ���� ������� ����������� ����Ǥ� ����������� ����� ���� ������� ������� �����Ƥ���������������Ƥ�������ǡ���������������������������������������������������Ǥ������Ƥ�������������������������������ǡ���������Ǥ�����Ƥ��������������������������������Ǥ�������dams are made of concrete. Concrete dams can be either gravity dams or concrete arch dams, depending on how they are built.
����������������������������������������ơ���������������������������������������������maintain an area’s water supply. Many of the world’s largest urban areas are supplied with water from rivers that are blocked via dams. Another major use of dams is power generation as hydroelectric power is one of the world’s major sources of electricity. Hydropower is generated when the potential energy of the water on the dam drives a water turbine which in then turns a generator and creates electricity. To best make use of the water’s power, a common type of hydroelectric dam uses reservoirs with ��ơ������ ������� ��� ������� ���� ������� ��� ������� ���������� ��� ��� ��� ������Ǥ������demand is low for instance, water is held in an upper reservoir and as demand increases, the water is released into a lower reservoir where it spins a turbine. Some �����������������������������������������������������������������������������ƪ�����������������ǡ�ƪ��������������ǡ�������������������������������Ǥ

Chapter 4
232
3�2�2 Water storage ponds
The demand for water has increased tremendously in recent years, and ponds are one of the most reliable and economical sources of water. Ponds are now serving a variety �����������ǡ�������������������������������������������������ǡ�Ƥ�������������ǡ�Ƥ���������������� ��������ǡ� Ƥ�������������ǡ� ������� ������������ǡ���������� �������ǡ� ����������ǡ�and landscape improvement.
Water storege ponds are a key component in the treatment, storage and distribution of potable water. Built in many sizes and shapes they serve as repositories for the regions water.
Figure 6: Water reservoir (Santamarta-Cerezal, 2013)
3�2�3 Water supply and transport
The functions of the formal urban water supply and wastewater sector include storage, supply, distribution, and wastewater treatment and disposal systems that provide organized water services to established urban areas. The infrastructure

Water Management and Planning
233
generally includes water and wastewater utility systems with large raw-water storage facilities, storm-water collection systems, trans-basin diversion structures, potable and wastewater treatment plant equipment, pipelines, local distribution systems, ����Ƥ������Ǧ������������������������Ǥ
Some urban distribution systems also include secondary distribution systems for reuse of treated wastewater, advanced treatment systems such as reverse osmosis ��� Ƥ��������ǡ� ������������� ������ ��� �������� �������Ǥ��������� ���������������� ���distributed to meet irrigation and other non-potable needs, and with adequate treatment can be used to augment some drinking water supplies provided that communities are willing (Hurliman, 2007).
Figure 7: Water channel in Canary Islands (Santamarta-Cerezal, 2013)
Water leaking from water company pipes is wasteful of water and energy if the ����Ƥ������������������������������������������Ǥ