Embed Size (px)
Citation preview
Clickstream Data Yields High-Resolution Maps of ScienceJohan Bollen1*, Herbert Van de Sompel1, Aric Hagberg2., Luis Bettencourt2,3., Ryan Chute1., Marko A.
Rodriguez2, Lyudmila Balakireva1
1 Digital Library Research and Prototyping Team, Research Library, Los Alamos National Laboratory, Los Alamos, New Mexico, United States of America, 2 Theoretical
Division, Mathematical Modeling and Analysis Group, and Center for Nonlinear Studies, Los Alamos National Laboratory, Los Alamos, New Mexico, United States of
America, 3 Santa Fe Institute, Santa Fe, New Mexico, United States of America
Abstract
Background: Intricate maps of science have been created from citation data to visualize the structure of scientific activity.However, most scientific publications are now accessed online. Scholarly web portals record detailed log data at a scale thatexceeds the number of all existing citations combined. Such log data is recorded immediately upon publication and keepstrack of the sequences of user requests (clickstreams) that are issued by a variety of users across many different domains.Given these advantages of log datasets over citation data, we investigate whether they can produce high-resolution, morecurrent maps of science.
Methodology: Over the course of 2007 and 2008, we collected nearly 1 billion user interactions recorded by the scholarlyweb portals of some of the most significant publishers, aggregators and institutional consortia. The resulting reference dataset covers a significant part of world-wide use of scholarly web portals in 2006, and provides a balanced coverage of thehumanities, social sciences, and natural sciences. A journal clickstream model, i.e. a first-order Markov chain, was extractedfrom the sequences of user interactions in the logs. The clickstream model was validated by comparing it to the GettyResearch Institute’s Architecture and Art Thesaurus. The resulting model was visualized as a journal network that outlinesthe relationships between various scientific domains and clarifies the connection of the social sciences and humanities tothe natural sciences.
Conclusions: Maps of science resulting from large-scale clickstream data provide a detailed, contemporary view of scientificactivity and correct the underrepresentation of the social sciences and humanities that is commonly found in citation data.
Citation: Bollen J, Van de Sompel H, Hagberg A, Bettencourt L, Chute R, et al. (2009) Clickstream Data Yields High-Resolution Maps of Science. PLoS ONE 4(3):e4803. doi:10.1371/journal.pone.0004803
Editor: Alan Ruttenberg, Science Commons, United States of America
Received June 25, 2008; Accepted February 6, 2009; Published March 11, 2009
This is an open-access article distributed under the terms of the Creative Commons Public Domain declaration which stipulates that, once placed in the publicdomain, this work may be freely reproduced, distributed, transmitted, modified, built upon, or otherwise used by anyone for any lawful purpose.
Funding: This research was funded as part of the MESUR project (http://www.mesur.org/) by the Andrew W. Mellon Foundation. The funders had no role in studydesign, data collection and analysis, decision to publish, or preparation of the manuscript.
Competing Interests: The authors have declared that no competing interests exist.
* E-mail: [email protected]
. These authors contributed equally to this work.
Introduction
Maps of science derived from citation data [1,2,3,4,5,6,7]
visualize the relationships among scholarly publications or
disciplines. They are valuable instruments for exploring the
structure and evolution of scholarly activity. Much like early
world charts, these maps of science provide an overall visual
perspective of science as well as a reference system that stimulates
further exploration. However, these maps are also significantly
biased due to the nature of the citation data from which they are
derived: existing citation databases overrepresent the natural
sciences; substantial delays typical of journal publication [8,9,10]
yield insights in science past, not present; and connections between
scientific disciplines are tracked in a manner that ignores informal
cross-fertilization.
Scientific publications are now predominantly accessed online.
Scholarly web portals provide access to publications in the
natural sciences, social sciences and humanities. They routinely
log the interactions of users with their collections. The resulting
log datasets have a set of attractive characteristics when
compared to citation datasets. First, the number of logged
interactions now greatly surpasses the volume of all existing
citations. This is illustrated by Elsevier’s announcement, in 2006,
of 1 billion (16109) article downloads since the launch of its
Science Direct portal in April 1999. In contrast, around the time
of Elsevier’s announcement, the total number of citations in
Thomson Scientific’s Web of Science from the year 1900 to the
present does not surpass 600 million (66108). Second, log datasets
reflect the activities of a larger community as they record the
interactions of all users of scholarly portals, including scientific
authors, practitioners of science, and the informed public. In
contrast, citation datasets only reflect the activities of scholarly
authors. Third, log datasets reflect scholarly dynamics in real-
time because web portals record user interactions as soon as an
article becomes available at the time of its online publication
[8,9]. In contrast, a published article faces significant delays
before it eventually appears in citation datasets: it first needs to be
cited in a new article that itself faces publication delays [11,12],
and subsequently those citations need to be picked up by citation
databases.
PLoS ONE | www.plosone.org 1 March 2009 | Volume 4 | Issue 3 | e4803
Given the aforementioned characteristics of scholarly log data, we
investigated a methodological issue: can valid, high resolution maps
of science be derived from clickstream data and can clickstream data
be leveraged to yield meaningful insights in the structure and
dynamics of scholarly behavior? To do this we first aggregated log
datasets from a variety of scholarly web portals, created and analyzed
a clickstream model of journal relationships from the aggregate log
dataset, and finally visualized these journal relationships in a first-
ever map of science derived from scholarly log data.
Methods
Data collectionWe aggregated a log dataset that contains approximately 1
billion (16109) user interactions. These interactions were logged in
the course of 2006 and 2007 by web portals operated by the
following scientific publishers, aggregators, and institutions:
Thomson Scientific (Web of Science), Elsevier (Scopus), JSTOR,
Ingenta, University of Texas (9 campuses, 6 health institutions),
and California State University (23 campuses). Strict confidenti-
ality agreements prevent the distribution of any comparable and
identifiable statistics with regards to individual web portals.
However, the results of the analysis of aggregated log data across
web portals, such as our map of science, can be freely published.
These distinct portals were selected for two reasons. First, their
log data tracks user interactions across the boundaries of individual
publisher collections. Second, the resulting aggregate log data set
was expected to cover sources in the natural sciences, social
sciences, as well as the humanities.
From this aggregate log dataset, we selected a subset that
includes user interactions that occurred between March 1st 2006
and February 1st 2007 because this timeframe was covered by the
logs of all aforementioned portals. The resulting log dataset
contains 346,312,045 user interactions pertaining to 97,532 serial
publications. Many of these publications are scholarly journals, but
weekly magazines and newspapers such as The New York Times
are also included.
We then processed this log dataset of individual interactions
[13] to select only those that are considered expressions of interest
by a user for a specific article, for example clicking links to request
the full-text of the article or the abstract of the article. This process
included removing interactions such as keyword searches and next
page requests, as well as those that could straightforwardly be
attributed to web crawlers by means of their hostnames. Finally,
consecutive expressions of interest by a user in the same article in
the course of the same session were interpreted as a single
expression of interest in the article.
Journal domain classificationIn order to assign a general scientific discipline to each journal
we extracted journal classifications from two databases, namely
Thomson Scientific’s Journal Citation Reports (JCR) classification
codes (approx. 8,000 journals in the Natural Science and Social
Science edition) and the Dewey Decimal system (approx. 40,000
journals) as provided by Ulrich’s Serials Directory. These are the
two most complete, prominent and widely applied journal subject
classifications available.
JCR and Dewey Decimal classification codes were retrieved for
each journal in our logs. However, the JCR and Dewey Decimal
classification systems do not organize their classification codes into
a common taxonomy, meaning that no comparison can be made
between JCR and Dewey Decimal classifications at various levels
of abstraction, e.g. JCR’s ‘‘medicine’’ vs. Dewey Decimal’s
‘‘Medical sciences – Oncology’’. The JCR and Dewey Classifica-
tion codes were therefore manually mapped to the Disciplines
hierarchy of the Getty Research Institute’s Art and Architecture
Thesaurus (AAT)[14] that was used as a unifying, taxonomic
classification structure. This involved the mapping of 215 JCR
classification codes into 202 matching AAT disciplines and 425
Ulrich Dewey Values into 98 matching AAT disciplines, at various
depths in the AAT taxonomy.
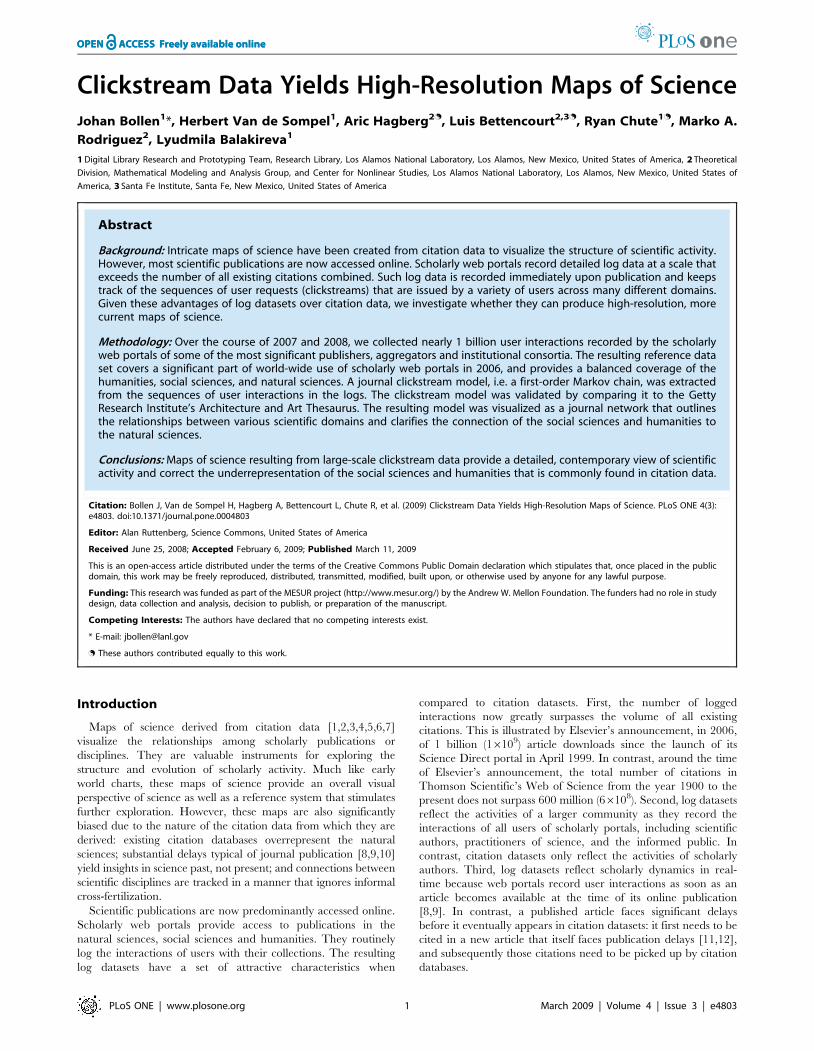
The AAT Disciplines hierarchy is structured as a taxonomical
tree that starts by differentiating between the social sciences,
humanities, natural sciences and interdisciplinary sciences, and
splits these broad categories into increasingly finer subject areas.
As such we could place each journal in our log data at a branch in
the AAT taxonomy as shown in Fig. 1. A JCR or Dewey Decimal
classification code and matching AAT taxonomy position could be
assigned to the journals involved in 93% of all interaction events.
The distribution of journal domain classifications for the log
data obtained from each provider indicates its degree of coverage
for the different domains in the AAT. The domain distribution
obtained from pooling interaction events over all data providers, as
shown in Table 1, reveals log data in which interaction events
pertain to journals in the social sciences (47%) and natural sciences
(41%) in nearly equal numbers. In addition, the humanities
correspond to roughly 8% of all interaction events, while
interdisciplinary fields account for 3%. This distribution deviates
only slightly from the distribution of degrees conferred in the
entire University of California (UC) system in 2007 by domain.
Although it is not feasible to perform a full census of the scientific
community, this indicates that the representation of scientific
disciplines in our usage data, conforms at least to that observed in
a large, diverse scientific community such as the UC system.
The discipline coverage of our log dataset can be contrasted to
the coverage provided by the JCR, a citation database that is
commonly used in the construction of journal-based science maps.
When analyzing the total amount of citations in the Science vs.
Social Science edition of the 2007 edition of JCR, a distribution of
journal domains emerges that is heavily skewed towards the
natural sciences as opposed to the social sciences and humanities,
respectively 92.8% vs. 7.2%.
A clickstream model of journal relationshipsFor each user interaction the resulting dataset contained the
following data elements:
Figure 1. Matching JCR and Dewey Journal classifications tothe AAT taxonomy.doi:10.1371/journal.pone.0004803.g001
Maps of Science
PLoS ONE | www.plosone.org 2 March 2009 | Volume 4 | Issue 3 | e4803
Article identifier. Or sufficient metadata to identify the
article to which the interaction pertained.
Date-time. A date-time of the interaction, to the second.
Session identifier. A session identifier assigned by the web
portal at the start of a user’s information gathering session [15].
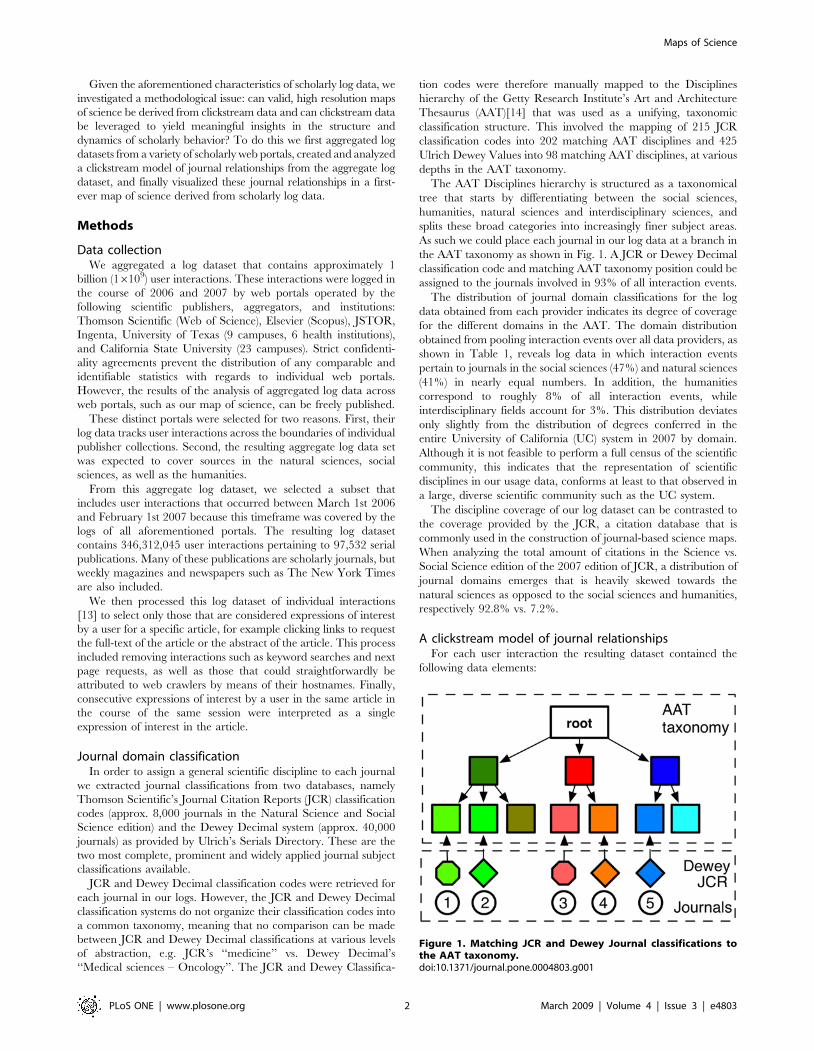
We use the session identifier and date-time to reconstruct
temporal sequences [16,17] of interactions by the same user.
These sequences can be mapped to article clickstreams, each of
which records the navigation of a user from one article to another
[18,19]. Since each article is published in a journal, these article
clickstreams can be translated to journal clickstreams. The
resulting data set is a collection of journal clickstreams that reflects
the navigation of users from one journal to another when
interacting with scholarly web portals (Fig. 2).
We used this dataset to compute relationships among journals
on the basis of their joint occurrences in the resulting journal
clickstreams. We did so by using a method similar to association
rule learning [20] that is commonly used in data mining
applications and that is based on the co-occurrence principle.
Applied to our case, this principle states that a journal vi is related
to a journal vj if vi directly precedes vj within a journal clickstream;
the strength of the relationship between vi and vj is expressed as
the probability by which one follows the other over all journal
clickstreams. When computing these journal relationships for the
entire dataset, we effectively construct a stochastic model of how
users move between pairs of journals in their online interactions.
More formally, we build a first-order Markov chain model of the
clickstream data [21] in the following way. We define each recorded
interaction u as a set that contains a session identifier s, a date-time tand the article a to which the interaction pertained, i.e. u~ s,t,af g.Our usage data log U then consists of a set of n interactions
U~ u1,u2, � � � ,unf g. We now define F the set of clickstreams
extracted from U , such that each element f [F , f5U consists of an
set of interactions with identical session identifiers, ordered by their
data-time values, i.e. f ~ Vu[U ,As : s uð Þ ^ t uið Þvt uiz1ð Þð Þ where
s uð Þ and t uð Þ denote the session identifier and date-time of
interaction u respectively.
Every interaction in the clickstream of F pertains to a particular
article ai. We can thus convert each f [F to an article clickstream
fa~ a1,a2, � � � ,akð Þ. Likewise, since each article a is published in a
journal v, we can convert every article clickstream fa to journal
clickstream fv so that each fv~ v1,v2, � � � ,vkð Þ.Over all journal clickstreams we count the number of times
N vi,vj
� �that a particular ordered journal pair vi,vj
� �was
observed. We do this for all pairs of journals vi,vj
� �in which
j~iz1, i.e. vj is immediately adjacent to vj in the journal
clickstream. Finally, we can calculate the transition probability
P vi,vj
� �~
N vi,vj
� �P
j N vi,vj
� �and form a matrix M whose entries mi,j~P vi,vj
� �.
Applying the described procedure to our log dataset results in a
matrix M that has n = 97,532 rows and columns, corresponding to
the number of unique journals, and contains 6,783,552 non-zero
entries.
The journal relationships in M are intentionally directional, i.e.
P vi,vj
� �=P vj ,vi
� �, for two reasons. First, the entries of M
represent conditional probabilities derived from clickstream
sequences, not symmetric journal similarities. The temporal order
of user interactions induces a directed relation. Second, directed
relations can be converted to undirected relations, but not vice
versa. Maintaining the directionality of journal relations thus
preserves information while at the same time establishing a
foundation for additional analysis that may or may not rely on
relation directionality.
Table 1. Comparison of journal domain classifications inusage data set to JCR (Science and Social Science editioncombined) and UC degrees conferred in 2006.
Domain Usage UC Degrees JCR
Natural Science 37% 39% 92.8%
Social Sciences 45% 46% 7.2%
Humanities 14% 15%
Source: http://www.ucop.edu/ucophome/uwnews/stat/statsum/fall2007/statsumm2007.pdf (table 9).doi:10.1371/journal.pone.0004803.t001
Figure 2. The extraction of journal clickstream data from article level log data. Usage log data consists of sequences of timed interactionevents u1,u2, . . .ð Þ. Interaction events issued by the same user from the same client can be grouped in user sessions. Each user session represents aclickstream fi that can be expressed as a sequence of the articles that were part of the session’s interaction events, i.e. a1,a2, � � �ð Þ. Since every article ispublished in a journal, we can derive journal clickstreams, i.e. v1,v2,v3, � � �ð Þ. From the collection of all journal clickstreams we can calculate theprobability P vi ,vj
� �.
doi:10.1371/journal.pone.0004803.g002
Maps of Science
PLoS ONE | www.plosone.org 3 March 2009 | Volume 4 | Issue 3 | e4803
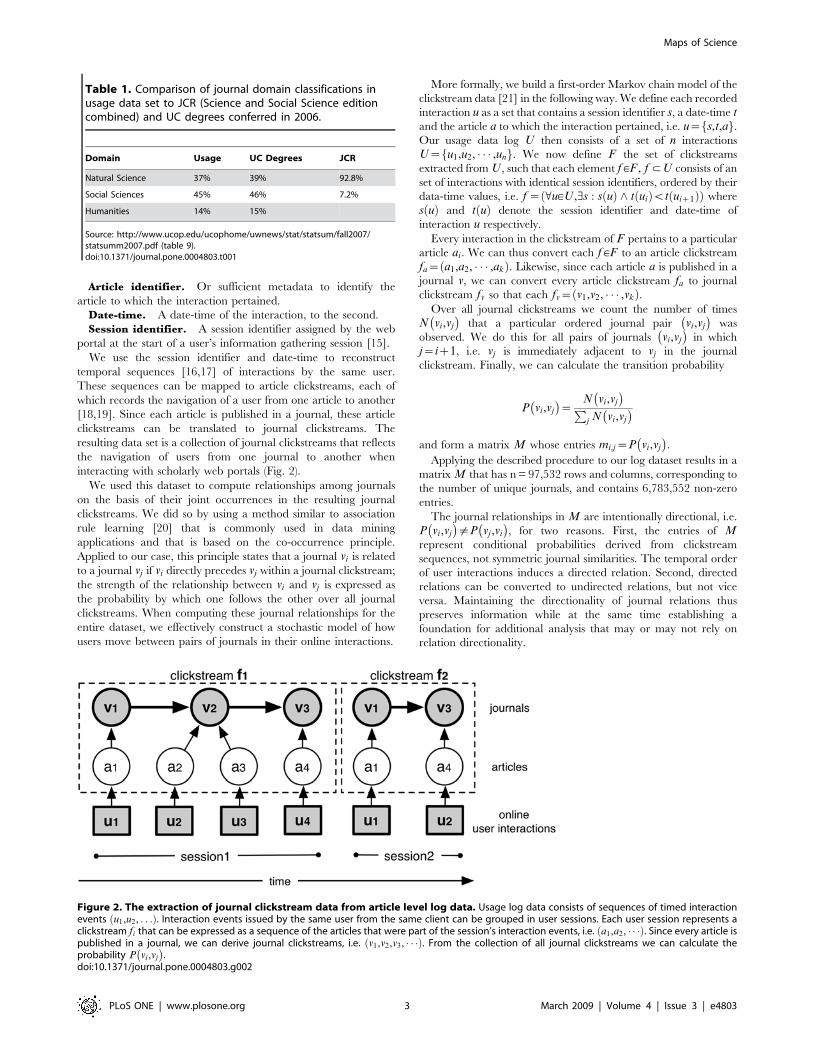
VisualizationTo visualize a clickstream map of science on the basis of M we
proceeded as follows. To only use journal relationships for which
we had a minimum number of observations to support the
particular connection, we selected the 50,000 journal pairs with
the highest N vi,vj
� �values. Although this threshold is arbitrary it
corresponds to N vi,vj
� �w170, i.e. for each journal relationship we
required at least 170 observations. The distributions in Fig. 3 show
how this threshold approximates the distribution’s ‘‘scree point’’; it
captures a wide range of edge weights while excluding journal
relationships with relatively low N vi,vj
� �values.
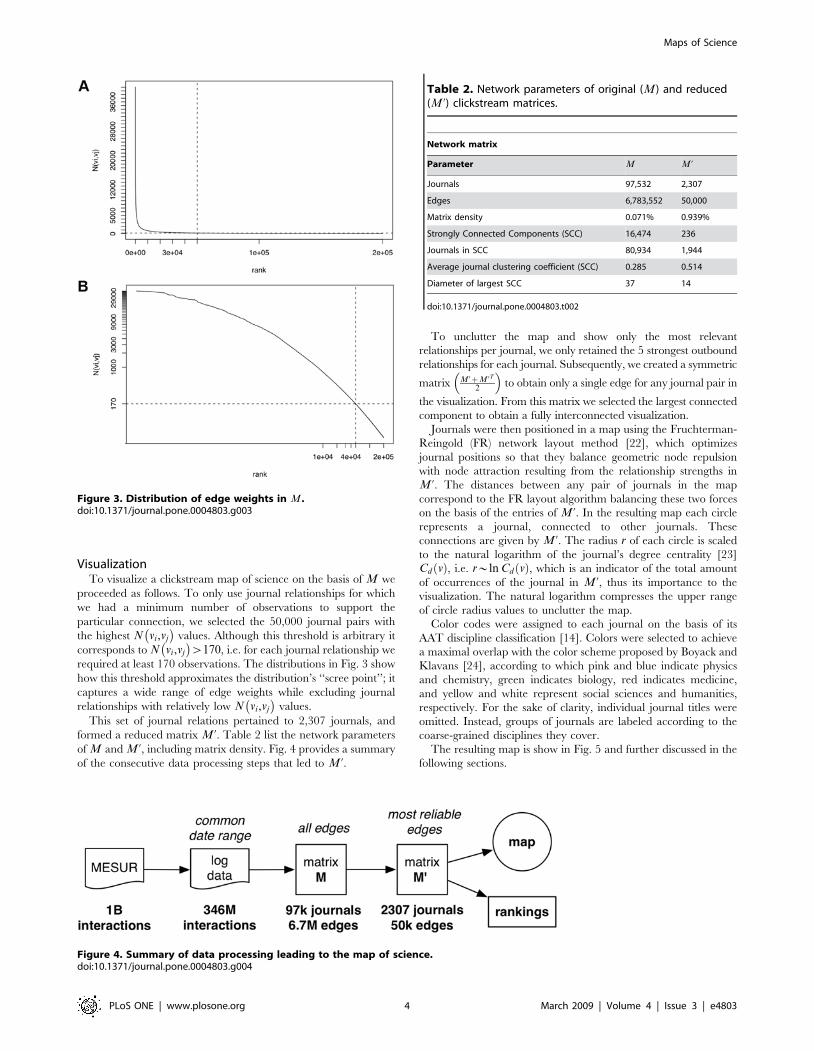
This set of journal relations pertained to 2,307 journals, and
formed a reduced matrix M ’. Table 2 list the network parameters
of M and M ’, including matrix density. Fig. 4 provides a summary
of the consecutive data processing steps that led to M ’.
To unclutter the map and show only the most relevant
relationships per journal, we only retained the 5 strongest outbound
relationships for each journal. Subsequently, we created a symmetric
matrix M ’zM ’T2
� �to obtain only a single edge for any journal pair in
the visualization. From this matrix we selected the largest connected
component to obtain a fully interconnected visualization.
Journals were then positioned in a map using the Fruchterman-
Reingold (FR) network layout method [22], which optimizes
journal positions so that they balance geometric node repulsion
with node attraction resulting from the relationship strengths in
M ’. The distances between any pair of journals in the map
correspond to the FR layout algorithm balancing these two forces
on the basis of the entries of M ’. In the resulting map each circle
represents a journal, connected to other journals. These
connections are given by M ’. The radius r of each circle is scaled
to the natural logarithm of the journal’s degree centrality [23]
Cd vð Þ, i.e. r*ln Cd vð Þ, which is an indicator of the total amount
of occurrences of the journal in M ’, thus its importance to the
visualization. The natural logarithm compresses the upper range
of circle radius values to unclutter the map.
Color codes were assigned to each journal on the basis of its
AAT discipline classification [14]. Colors were selected to achieve
a maximal overlap with the color scheme proposed by Boyack and
Klavans [24], according to which pink and blue indicate physics
and chemistry, green indicates biology, red indicates medicine,
and yellow and white represent social sciences and humanities,
respectively. For the sake of clarity, individual journal titles were
omitted. Instead, groups of journals are labeled according to the
coarse-grained disciplines they cover.
The resulting map is show in Fig. 5 and further discussed in the
following sections.
Figure 3. Distribution of edge weights in M.doi:10.1371/journal.pone.0004803.g003
Table 2. Network parameters of original (M) and reduced(M ’) clickstream matrices.
Network matrix
Parameter M M ’
Journals 97,532 2,307
Edges 6,783,552 50,000
Matrix density 0.071% 0.939%
Strongly Connected Components (SCC) 16,474 236
Journals in SCC 80,934 1,944
Average journal clustering coefficient (SCC) 0.285 0.514
Diameter of largest SCC 37 14
doi:10.1371/journal.pone.0004803.t002
Figure 4. Summary of data processing leading to the map of science.doi:10.1371/journal.pone.0004803.g004
Maps of Science
PLoS ONE | www.plosone.org 4 March 2009 | Volume 4 | Issue 3 | e4803
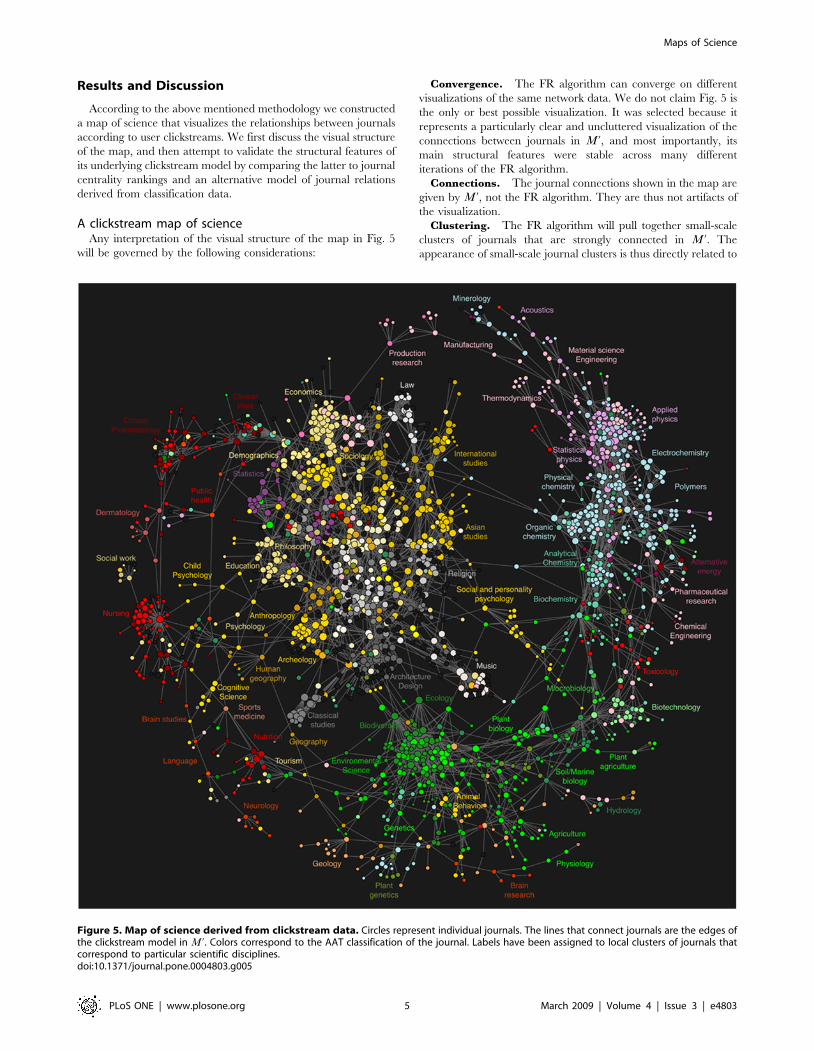
Results and Discussion
According to the above mentioned methodology we constructed
a map of science that visualizes the relationships between journals
according to user clickstreams. We first discuss the visual structure
of the map, and then attempt to validate the structural features of
its underlying clickstream model by comparing the latter to journal
centrality rankings and an alternative model of journal relations
derived from classification data.
A clickstream map of scienceAny interpretation of the visual structure of the map in Fig. 5
will be governed by the following considerations:
Convergence. The FR algorithm can converge on different
visualizations of the same network data. We do not claim Fig. 5 is
the only or best possible visualization. It was selected because it
represents a particularly clear and uncluttered visualization of the
connections between journals in M ’, and most importantly, its
main structural features were stable across many different
iterations of the FR algorithm.
Connections. The journal connections shown in the map are
given by M ’, not the FR algorithm. They are thus not artifacts of
the visualization.
Clustering. The FR algorithm will pull together small-scale
clusters of journals that are strongly connected in M ’. The
appearance of small-scale journal clusters is thus directly related to
Figure 5. Map of science derived from clickstream data. Circles represent individual journals. The lines that connect journals are the edges ofthe clickstream model in M ’. Colors correspond to the AAT classification of the journal. Labels have been assigned to local clusters of journals thatcorrespond to particular scientific disciplines.doi:10.1371/journal.pone.0004803.g005
Maps of Science
PLoS ONE | www.plosone.org 5 March 2009 | Volume 4 | Issue 3 | e4803
the entries of M ’ and they are thus not considered artifacts of the
visualization.
Geometry. Although the positions of journals and clusters
relative to each other are shaped by their connections in M ’, their
exact geometric coordinates vary depending on the layout algorithm
and are thus indeed considered artifacts of the visualization.
In summary, the connections between journals and small-scale
clusters in the network visualization in Fig. 5 are determined by
M ’. They are not artifacts of the visualization. However, one can
not draw conclusions from the exact, geometrical coordinates of
journals and clusters in the map.
To provide a visual frame of reference, we summarize the overall
visual appearance of the map of science in Fig. 5 in terms of a wheel
metaphor. The wheel’s hub consists of a large inner cluster of tightly
connected social sciences and humanities journals (white, yellow
and gray). Domain classifications for the journals in this cluster
include international studies, Asian studies, religion, music,
architecture and design, classical studies, archeology, psychology,
anthropology, education, philosophy, statistics, sociology, econom-
ics, and finance. The wheel’s outer rim results from a myriad of
connections in M ’ between journals in the natural sciences (red,
green, blue). In clockwise order, starting at 1PM, the rim contains
physics, chemistry, biology, brain research, health care and clinical
trials journals. Finally, the wheel’s spokes are given by connections
in M ’ that point from journals in the central hub to the outer rim.
The connections between the journals in the map’s rim cross
multiple domains. For example, alternative energy (rim, 3PM)
connects to pharmaceutical research and chemical engineering,
which itself further connects to toxicology studies and biotechnol-
ogy. Brain research (rim, 6PM) is connected to genetics, biology,
animal behavior, and social and personality psychology. Human
geography studies connects to geography, plant genetics, and
finally agriculture. A number of clusters are well-connected to both
the natural science and social science clusters. For example,
ecology and biodiversity (5PM) connects the domains of biology
(rim, 5PM) and architecture and design (hub, 5PM). Production
and manufacturing (12PM) bridge the domains of physics and
engineering (rim, 2PM) and economics (hub, 11PM).
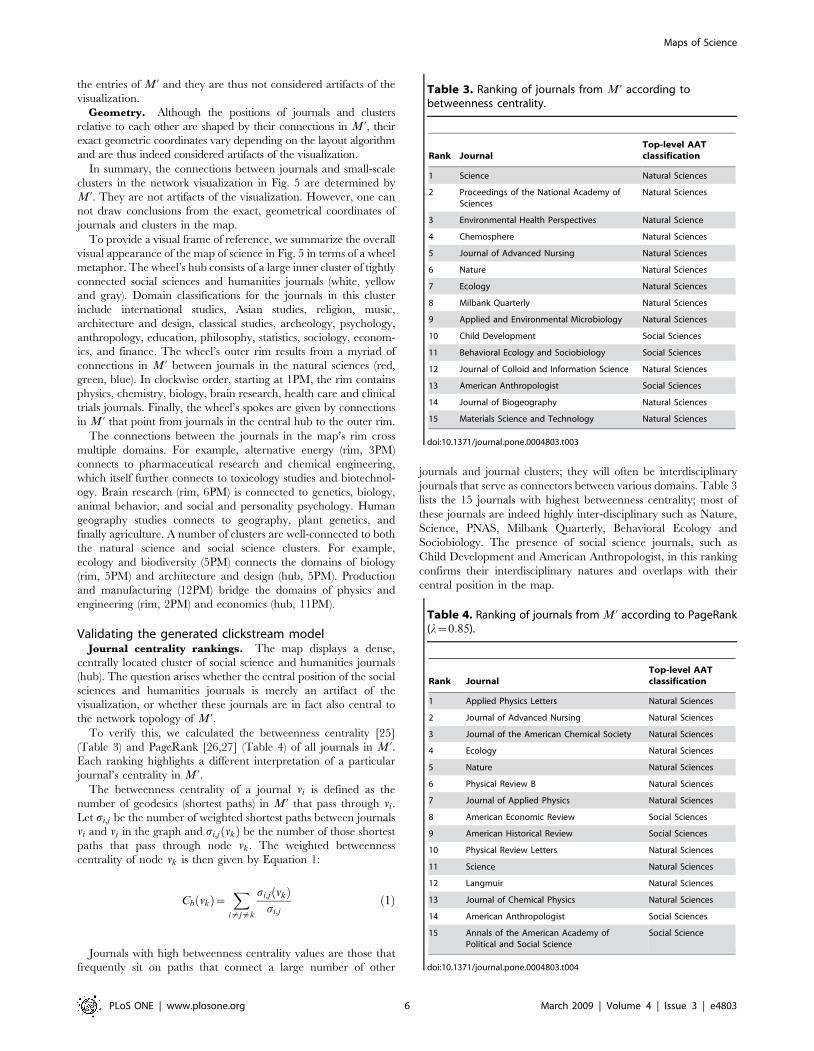
Validating the generated clickstream modelJournal centrality rankings. The map displays a dense,
centrally located cluster of social science and humanities journals
(hub). The question arises whether the central position of the social
sciences and humanities journals is merely an artifact of the
visualization, or whether these journals are in fact also central to
the network topology of M ’.To verify this, we calculated the betweenness centrality [25]
(Table 3) and PageRank [26,27] (Table 4) of all journals in M ’.Each ranking highlights a different interpretation of a particular
journal’s centrality in M ’.The betweenness centrality of a journal vi is defined as the
number of geodesics (shortest paths) in M ’ that pass through vi.
Let si,j be the number of weighted shortest paths between journals
vi and vj in the graph and si,j vkð Þ be the number of those shortest
paths that pass through node vk. The weighted betweenness
centrality of node vk is then given by Equation 1:
Cb vkð Þ~X
i=j=k
si,j vkð Þsi,j
ð1Þ
Journals with high betweenness centrality values are those that
frequently sit on paths that connect a large number of other
journals and journal clusters; they will often be interdisciplinary
journals that serve as connectors between various domains. Table 3
lists the 15 journals with highest betweenness centrality; most of
these journals are indeed highly inter-disciplinary such as Nature,
Science, PNAS, Milbank Quarterly, Behavioral Ecology and
Sociobiology. The presence of social science journals, such as
Child Development and American Anthropologist, in this ranking
confirms their interdisciplinary natures and overlaps with their
central position in the map.
Table 3. Ranking of journals from M ’ according tobetweenness centrality.
Rank JournalTop-level AATclassification
1 Science Natural Sciences
2 Proceedings of the National Academy ofSciences
Natural Sciences
3 Environmental Health Perspectives Natural Science
4 Chemosphere Natural Sciences
5 Journal of Advanced Nursing Natural Sciences
6 Nature Natural Sciences
7 Ecology Natural Sciences
8 Milbank Quarterly Natural Sciences
9 Applied and Environmental Microbiology Natural Sciences
10 Child Development Social Sciences
11 Behavioral Ecology and Sociobiology Social Sciences
12 Journal of Colloid and Information Science Natural Sciences
13 American Anthropologist Social Sciences
14 Journal of Biogeography Natural Sciences
15 Materials Science and Technology Natural Sciences
doi:10.1371/journal.pone.0004803.t003
Table 4. Ranking of journals from M ’ according to PageRank(l~0:85).
Rank JournalTop-level AATclassification
1 Applied Physics Letters Natural Sciences
2 Journal of Advanced Nursing Natural Sciences
3 Journal of the American Chemical Society Natural Sciences
4 Ecology Natural Sciences
5 Nature Natural Sciences
6 Physical Review B Natural Sciences
7 Journal of Applied Physics Natural Sciences
8 American Economic Review Social Sciences
9 American Historical Review Social Sciences
10 Physical Review Letters Natural Sciences
11 Science Natural Sciences
12 Langmuir Natural Sciences
13 Journal of Chemical Physics Natural Sciences
14 American Anthropologist Social Sciences
15 Annals of the American Academy ofPolitical and Social Science
Social Science
doi:10.1371/journal.pone.0004803.t004
Maps of Science
PLoS ONE | www.plosone.org 6 March 2009 | Volume 4 | Issue 3 | e4803

The PageRank of a journal is calculated by an iterative
procedure in which the PageRank of a journal is continuously
recalculated as a function of the PageRank of its predecessors in
the graph, according to Equation 2.
PR við Þ~1{l
Nzl
Xj
PR vj
� �O vj
� � ð2Þ
where PR við Þ denotes the PageRank of journal vi, N the number
of nodes in M ’, and O vj
� �the out-degree of the predecessor
journal vj . PageRank values converge from a set of random initial
values toward a stable ranking after a given number of iterations.
PageRank favors prestigious journals that are well-connected to
other well-connected journals. Table 3 list the 15 journals which
the highest PageRank values in M ’; this ranking indeed favors
more specialized, prestigious journals, such as Applied Physics
Letters, Ecology, Physical Review B and American Anthropolo-
gist. The presence of social science and humanities journals in the
PageRank ranking, such as American Historical review and
Annals of the American Academy of Political and Social Science,
indicates their connectedness to other highly ranking journals and
subsequently their centrality in M ’.Regardless of their use for cross-validating features of the
produced map of science, the rankings in Table 3 and Table 4
illustrate the possibility of ranking journals according to various
aspects of their centrality in clickstream data. For example, we note
that Nature and Science are among the 15 top-ranked journals in
both Table 3 and Table 4. This indicates that they have
considerable interdisciplinary appeal as well as high prestige among
users. The betweenness centrality and PageRank of PNAS diverge
more strongly; PNAS was ranked 2nd in the betweenness centrality
ranking, but 24th according to its PageRank. This suggests that
PNAS has strong interdisciplinary appeal among users, but a slightly
smaller degree of prestige compared to other top 15 journals.
Cross-validation of the clickstream model and map to theAAT
The clickstream model represented by matrix M ’ expresses the
relations between pairs of journals. An inspection of the individual
journal relationships in Table 5 may provide an informal sense of
Table 5. Sample of journals pairs with high P vi,vj
� �.
vi vj p vi ,vj
� �N vi ,vj
� �N við Þ
American Journal of International Law International Organization 0.0207 9,292 448,034
International Affairs 0.0184 8,254
International and Comparative Law Quarterly 0.0171 7,654
Foreign Policy 0.0167 7,500
American Political Science Association 0.0140 6,291
Journal of Educational Sociology American Journal of Sociology 0.0334 2,790 83,419
Journal of Higher Education 0.0303 2,529
Journal of Negro Education 0.0286 2,389
American Sociological Review 0.0276 2,303
Social Forces 0.0249 2,076
Surface Science Physical Review B 0.0704 2,555 36,282
Applied Surface Science 0.0341 1,239
Physical Review Letters 0.0339 1,230
Journal of Chemical Physics 0.0333 1,207
Applied Physics Letters 0.0327 1,188
Journal of Organic Chemistry Journal of the American Chemical Society 0.0873 4,141 47,439
Tetrahedron Letters 0.0865 4,105
Tetrahedron 0.0602 2,857
Organic Letters 0.0532 2,526
Angewandte Chemie 0.0305 1,448
Ecological Applications Ecology 0.0965 13,659 141,481
Conservation Biology 0.0524 7,408
Bioscience 0.0215 3,043
Annual Review of Ecology and Systematics 0.0215 3,043
Clinical and Experimental Allergy 0.0191 2,699
Annals of Mathematics American Journal of Mathematics 0.0705 5,392 76,526
American Mathematical Monthly 0.0579 4,432
PNAS 0.0156 1,195
Econometrica 0.0082 624
Mathematics Magazine 0.0077 587
doi:10.1371/journal.pone.0004803.t005
Maps of Science
PLoS ONE | www.plosone.org 7 March 2009 | Volume 4 | Issue 3 | e4803
the validity of journal relations in M ’. We selected 6 prominent
journals, i.e. those with high N við Þ values, and retrieved the 5
journals with which they have the highest highest probability
P vi,vj
� �connection. All journal relations in Table 5 seem highly
valid, but this is a subjective observation.
However, we can cross-validate the map’s structure, represented
by matrix M ’, in a more objective manner by comparing it to an
independent set of journal relations as demonstrated by [28].
Assume we create an alternative matrix of journal relations A from
an independent, yet trusted data source unrelated to our usage
data. If M ’’s entries correspond to the structure of A, that finding
corroborates the validity of the structure of matrix M ’.To perform such cross-validation two conditions need to be
satisfied:
1. M ’ and A must be derived from independent data sources.
2. A needs to represent journal relations at various levels of
granularity, above that of individual journal relations.
The AAT classification matches these requirements. First, the
journal classifications in the AAT are derived from two well-
established, commonly used classification schemes, namely Dewey
Decimal and JCR classification codes. These were defined
independent of our usage data and thus the relationships in M ’.Second, the AAT expresses the classification of journals at various
levels of granularity to which the structural features of our map
can be compared.
We derived a model of journal relations, represented by matrix
A, from the AAT as follows. We denote the AAT classification of
journal vi as C við Þ. Since journal classifications can be retrieved
from the AAT at various distances a from the root of the
taxonomy, we denote the journal classification of journal vi at root
distance a as Ca við Þ.For each journal pair vi,vj
� �we can retrieve the corresponding
AAT classification pair Ca við Þ,Ca vj
� �� �. We thus define the match
function f vi,vj ,a� �
such that
f vi,vj ,a� �
~1 Ca við Þ~Ca vj
� �0 Ca við Þ=Ca vj
� �(
f vi,vj ,a� �
maps each journal pair vi,vj
� �in M ’ to a binary value
depending on whether their AAT classifications match at the
particular root distance a.
We then define the AAT classification match matrix Aa whose
entries ai,j are given by f vi,vj ,a� �
; they represent a binary
indication of journal relationships according to their AAT
classifications. We can generate Aa matrices at any root distance
a. However, not all branches of the AAT taxonomy are equally
represented at aw4. We therefore chose 4 values that provided a
consistent range of classification granularities, namely a[ 1,2,3,4f geach of which corresponds to an increasingly detailed classification
level with 4 being the most specific. The root distances a and the
number of distinct classifications at that level in the taxonomy Nc
are listed in Table 6.
We now formulate the null-hypothesis H0 as follows:
H0 = ‘‘Over all non-zero entries of M ’, the magnitude of
N vi,vj
� �is not related to the probability that ai,j~1.’’
The probability of rejecting H0 increases as a decreases, since
classifications are being retrieved closer to the AAT root and thus
result in increasingly general associations.
We test the stated null-hypothesis by performing a Pearson’s x2
analysis (with Yates’ continuity correction) on four 262 contin-
gency tables constructed over a pairwise comparison of the non-
zero entries of M ’ and ai,ja at each a[ 1,2,3,4f g.For each non-zero entry in M ’ we thus compare the following
two factors for the corresponding journal pair vi,vj
� �:
Factor 1 N vi,vj
� �is either above or below the median of Nk
values, denoted m0:5 Nkð Þvs.
Factor 2 ai,j,a is either 0 or 1
where Nk denotes the the set of all non-zero entries in M ’.If the set of journal connections in M ’ are unrelated to those
given by their AAT classifications, i.e. if H0 holds, we expect the
frequencies in the cells of the 262 contingency tables to match
those predicted from their sum- and row-totals on the assumption
of statistical independence.
However, pv0:0001 values were found at all a levels, i.e. for
a~1 : pv0:0001, a~2 : pv0:0001, a~3 : pv0:0001, and
a~4 : pv0:0001. We can thus reject the null-hypothesis H0 at
high levels of confidence for each a level, and conclude that the
entries of M ’ are indeed related to the AAT classifications of the
journals vi,vj
� �thereby corroborating the validity of M ’ at least to
the degree that the AAT can be considered a valid taxonomy.
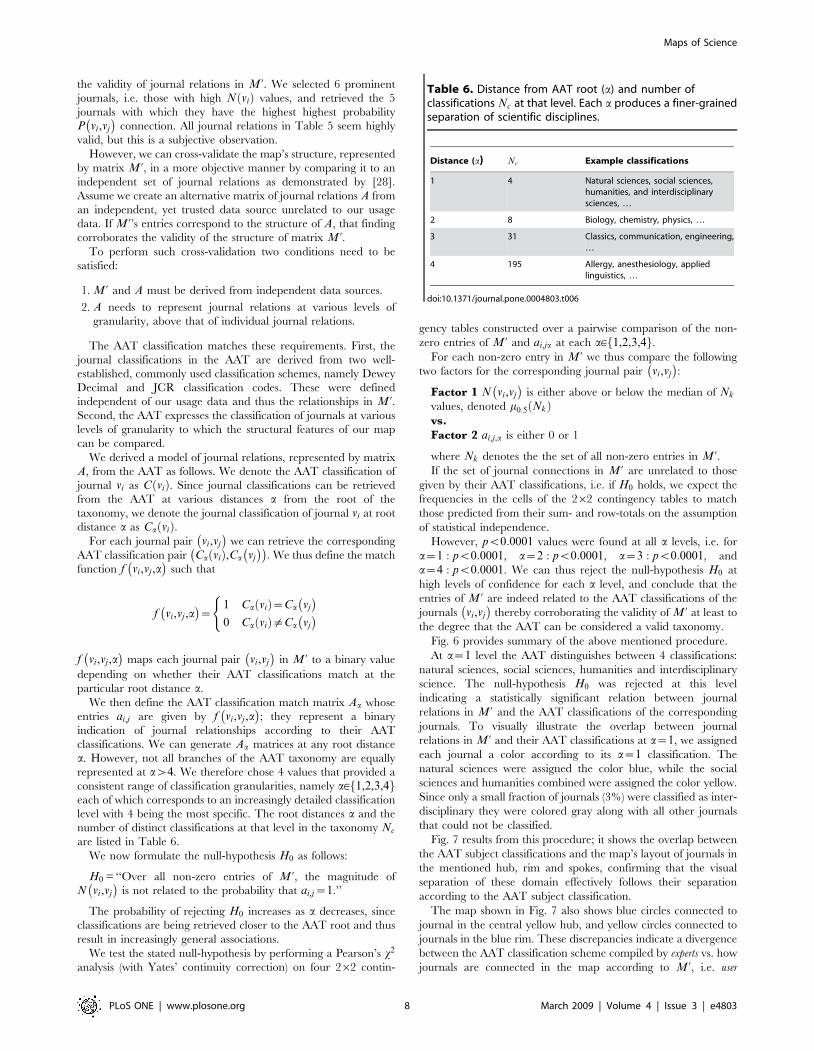
Fig. 6 provides summary of the above mentioned procedure.
At a~1 level the AAT distinguishes between 4 classifications:
natural sciences, social sciences, humanities and interdisciplinary
science. The null-hypothesis H0 was rejected at this level
indicating a statistically significant relation between journal
relations in M ’ and the AAT classifications of the corresponding
journals. To visually illustrate the overlap between journal
relations in M ’ and their AAT classifications at a~1, we assigned
each journal a color according to its a~1 classification. The
natural sciences were assigned the color blue, while the social
sciences and humanities combined were assigned the color yellow.
Since only a small fraction of journals (3%) were classified as inter-
disciplinary they were colored gray along with all other journals
that could not be classified.
Fig. 7 results from this procedure; it shows the overlap between
the AAT subject classifications and the map’s layout of journals in
the mentioned hub, rim and spokes, confirming that the visual
separation of these domain effectively follows their separation
according to the AAT subject classification.
The map shown in Fig. 7 also shows blue circles connected to
journal in the central yellow hub, and yellow circles connected to
journals in the blue rim. These discrepancies indicate a divergence
between the AAT classification scheme compiled by experts vs. how
journals are connected in the map according to M ’, i.e. user
Table 6. Distance from AAT root (a) and number ofclassifications Nc at that level. Each a produces a finer-grainedseparation of scientific disciplines.
Distance (a) Nc Example classifications
1 4 Natural sciences, social sciences,humanities, and interdisciplinarysciences, …
2 8 Biology, chemistry, physics, …
3 31 Classics, communication, engineering,…
4 195 Allergy, anesthesiology, appliedlinguistics, …
doi:10.1371/journal.pone.0004803.t006
Maps of Science
PLoS ONE | www.plosone.org 8 March 2009 | Volume 4 | Issue 3 | e4803
clickstreams. For example, the AAT assigns numerous journals in
biology, neurology and hydrology to the social sciences and
humanities whereas their connections in M ’ place them within the
cluster of natural sciences (rim, 6PM). Conversely, several journals in
clinical pharmacology and statistics are assigned to the natural
sciences by the AAT although their connections place them within
the cluster of social science and humanities journals (hub, 10PM).
Psychology (rim, hub 8PM) is an example of a domain whose
connections place it on the intersection of the social sciences and
natural sciences. Psychology journals are nearly equally classified
within both the natural sciences and the social sciences by the AAT.
Future ResearchThis article seeks to address a basic methodological question:
can accurate maps of science be derived from clickstream data?
Our maps are the first of their kind and reveal numerous features
of scientific activity. However, several pertinent issues require
further study, but were outside the scope of this article.
First, users’ clickstreams can be shaped by various navigation
patterns. Users can follow citation links, follow the results of full-
text searches, download articles on the basis of social recommen-
dations, etc. Our clickstream map is thus necessarily the result of
an overlay of an unknown combination of such navigation
patterns. An analysis of the divergence between maps derived
from usage, citation and text mining data might disambiguate the
many influences that shape clickstream maps.
Second, when users navigate scholarly web portals their
behavior will be shaped by the interfaces of the particular web
portal [29]. In this paper we attempted to minimize such
influences by aggregating usage log data from a variety of web
portals. However, more research is necessary to determine the
precise influence of interface effects on the creation of maps of
science from clickstream data. In addition, the usefulness of
various interaction types as indicators of user interest merits
further investigation. For example, are full-text downloads
stronger indicators of user interests than requests to view an
article’s abstract?
Third, we have adopted a lowest common denominator
approach to building a clickstream model under first-order
Markov Chain assumptions. Scholarly behavior may very well
be more goal-oriented and less sporadic than web traffic. Our
clickstream data lends itself well to tracing higher-order regular-
ities in usage behavior. An investigation of models of usage
behavior under various Markov assumptions and parameters will
thus be an interesting venue for future research. Given our
particular visualization methodology, i.e. network visualizations of
pair-wise connected journals, it is however not certain that higher-
order Markov models of our clickstream data will necessarily
provide more accurate maps of science.
Finally, the promise of the deriving maps of science from usage
log data lies in its ability to track scientific behavior as it takes place
and track contemporary trends in scientific activity. Therefore
future research will focus on a longitudinal, comparative analysis
between citation maps and usage maps to determine the parameters
of the relationship between usage and citation behavior. This
however requires the collection, aggregation and analysis of
additional usage and citation data which is forthcoming.
ConclusionSeveral web enterprises have successfully used clickstream data
as a means to enhance their impact, for example through the
introduction of recommender systems. Clickstream data of
scholarly web portals have thus far not received significant
attention. This is remarkable since the map of science that we
described here, as well as other findings of our MESUR project
[13], strongly suggest that scholarly logs hold valuable information
about the dynamics of scholarship.
Log datasets have attractive characteristics when compared to
citation datasets: they can be aggregated to cover all scholarly
disciplines, and they reflect the activities of a broader scholarly
community. But, most importantly, the immediacy of log datasets
offers the possibility to study the dynamics of scholarship in real-
time, not with a multi-year delay, as is currently the case with
citation data. The resulting potential for a wide variety of analysis
of the structure and dynamics of scholarship, such as trend analysis
and prediction [30], should not be underestimated.
There can exist stark differences between what people claim
they do and what they actually do [31]. This also applies to the
distinction between citing behavior and online information seeking
behavior. The first is a public and explicit expression of influence
by scholarly authors, whereas the latter results from the private
navigation behavior of scholarly users of web portals. This
distinction leads to different insights regarding scholarly activity
depending on whether it is mapped on the basis of citation data
versus scholarly log data. Our map of science derived from
clickstream data may thus run counter to accepted wisdom which
is at this point mostly based on citation data, yet it offers a first-
ever glimpse of this scholarly terra incognita.
Our map represents the structure of scholarly activity from an
observational perspective, not from a prescriptive or motivational
one. User interactions with scholarly web portals are shaped by
many constraints, including citation links, search engine results,
and user interface features. In this paper we do not attempt to
explain or motivate these interactions, but merely to demonstrate
Figure 6. Cross-validating the map structure given by M’ to journal relationships derived from AAT journal classifications, i.e.matrix Aa.doi:10.1371/journal.pone.0004803.g006
Maps of Science
PLoS ONE | www.plosone.org 9 March 2009 | Volume 4 | Issue 3 | e4803

how their overall structure can be charted and described from
clickstream maps of science.
Maps constructed from clickstream data can serve numerous
functions. Like citation maps they provide a means to visually
assess the relationships between various domains and journals.
However, clickstream maps of science can offer an immediate
perspective on what is taking place in science and can thus aid the
detection of emerging trends, inform funding agencies, and aid
researchers in exploring the interdisciplinary relationships between
various scientific disciplines. Clickstream maps can furthermore be
used as the basis for exploration and recommendation services that
rank journals according to the various parameters of network
topology, so that researchers can identify influential journals in any
particular domain of interest.
Scholarly log datasets still present some significant challenges.
There is no established framework for the aggregation of datasets
across web portals, there are no standards for recording logs, or for
the determination of what exactly constitutes an expression of
interest in a specific article. There are privacy concerns regarding
users of web portals and concerns regarding the sharing of what
ultimately is business intelligence by operators of web portals. And
there is an understanding that clickstreams can be manipulated. As
Figure 7. Cross-validating the map of science’s layout by retrieving each journal’s top-level AAT classification (natural sciences vs.social sciences and humanities). This map colors journals according to whether the AAT classifies them as either social sciences and humanitiesjournals (yellow) vs. natural science journals (blue). Highly connected clusters corresponding to biology and psychology contain a mix of journalsclassified in either the social and natural sciences.doi:10.1371/journal.pone.0004803.g007
Maps of Science
PLoS ONE | www.plosone.org 10 March 2009 | Volume 4 | Issue 3 | e4803
a matter of fact, the incentives to do so would increase if metrics
for the assessment of impact of articles, journals, authors,
departments and institutions derived from log data would become
used as an addition to the established citation-based impact
metrics. Determining the feasibility of such novel metrics is of
significant importance to the scholarly community and has thus
become the objective of several research initiatives including the
MESUR project (http://www.mesur.org/).
Acknowledgments
The authors would like to thank Kevin Boyack, Katy Boerner, Dick
Klavans, and Michael Kurtz for their advice and comments at various
stages of this work. The authors also express their gratitude to Murtha Baca
and Diane Lazar of the Getty Research Institute, Vocabulary Program
who provided the AAT taxonomy.
Data files. The journal matrix data that was used to produce the maps
in this paper is available upon request from the corresponding author.
Author Contributions
Conceived and designed the experiments: JB. Performed the experiments:
JB. Analyzed the data: JB RC. Wrote the paper: JB HVdS.
References
1. Garfield E (1970) Citation indexing for studying science. Nature 227: 669–671.
2. Boyack KW, Wylie BN, Davidson GS (2002) Domain visualization usingVxInsight for science and technology management. J Am Soc Inf Sci Technol
53: 764–774.3. Boyack KW, Klavans R, Boerner K (2005) Mapping the backbone of science.
Scientometrics 64: 351–374.
4. Leydesdorff L (1994) The generation of aggregated journal-journal citation mapson the basis of the cd-rom version of the science citation index. Scientometrics 31.
5. de Moya-Anegon F, Vargas-Quesada B, Chinchilla-Rodrıguez Z, Corera-Alvarez E, Munoz-Fernandez FJ, et al. (2007) Visualizing the marrow of science.
Journal of the American Society for Information Science and Technology 58.
6. Chen C, Zhang J, Zhu W, Vogeley M (2007) Delineating the citation impact ofscientific discoveries. In: IEEE/ACM Joint Conference on Digital Libraries
(JCDL 2007). Vancouver, British Columbia, Canada. pp 19–28.7. Rosvall M, Bergstrom CT (2008) Maps of random walks on complex networks
reveal community structure. Proceedings of the National Academy of SciencesUSA 105: 1118–1123.
8. Kurtz MJ, Eichhorn G, Accomazzi A, Grant CS, Demleitner M, et al. (2004)
Worldwide use and impact of the NASA Astrophysics Data System digitallibrary. Journal of the American Society for information science 56: 36–45.
9. Brody T, Harnad S, Carr L (2006) Earlier web usage statistics as predictors oflater citation impact. Journal of the American Society for Information Science
and Technology 57: 1060–1072.
10. Davis PM, Lewenstein BV, Simon DH, Booth JG, Connolly MJL (2008) Openaccess publishing, article downloads, and citations: randomised controlled trial.
British Medical Journal 337: a568-.11. Luwel M, Moed HF (1998) Publication delays in the science field and their
relationship to the ageing of scientific literature. Scientometrics 41: 29–40.
12. Egghe L, Rousseau R (2000) The influence of publication delays on the observedaging distribution of scientific literature. Journal of the American Society for
information science 51: 158–165.13. Bollen J, Van de Sompel H, Rodriguez MA (2008) Towards usage-based impact
metrics: first results from the MESUR project. In: Joint Conference on DigitalLibraries (JCDL2006). Pittsburgh, PA.
14. J Paul Getty Trust. Art and Architecture Thesaurus. http://www.getty.edu/.
15. Huberman BA (2001) The laws of the Web: patterns in the ecology ofinformation MIT Press.
16. Aizen J, Huttenlocher D, Kleinberg J, Novak A (2004) Traffic-based feedback on
the web. Proceedings of the National Academy of Sciences of the United States
of America 101: 5254–5260.
17. Kleinberg J (2008) Temporal dynamics of on-line information streams. In:
Garofalakis M, Gehrke J, Rastogi R, eds. Data Stream Management: Processing
High-Speed Data Streams. Springer.
18. Huberman BA, Pirolli PLT, Pitkow JE, Lukose RM (1998) Strong regularities in
world wide web surfing. Science 280: 95–97.
19. Adar E, Huberman BA (2000) The economics of surfing. Quarterly Journal of
Electronic Commerce 1: 203–214.
20. Aggarwal CC, Yu PS (1998) Mining large itemsets for association rules. IEEE
Data Engineering Bulletin 21.
21. Pirolli P, Pitkow JE (1999) Distributions of surfers’ paths through the world wide
web: Empirical characterization. World Wide Web 2: 29–45.
22. Fruchterman TMJ, Reingold EM (1991) Graph drawing by force-directed
placement. Software -Practice and Experience 21: 1129–1164.
23. Wasserman S, Faust K (1994) Social Network Analysis. Cambridge: Cambridge
University Press.
24. Harris E (2006) Nature news - 2006 gallery: ‘‘brilliant display’’, map of science.
Nature 444: 985–991.
25. Brandes U (2001) A faster algorithm for betweenness centrality. Journal of
Mathematical Sociology 25: 163–177.
26. Brin S, Page L (1998) The anatomy of a large-scale hypertextual web search
engine. Computer Networks and ISDN Systems 30: 107–117.
27. Bianchini M, Gori M, Scarselli F (2005) Inside pagerank. ACM Trans Inter
Tech 5: 92–128.
28. Bollen J, Van de Sompel H (2006) Mapping the structure of science through
usage. Scientometrics 69: 227–258.
29. Davis PM, Price JS (2006) eJournal interface can influence usage statistics:
implications for libraries, publishers, and project COUNTER. Journal of the
American Society for Information Science and Technology 57: 1243–1248.
30. Bettencourt LMA, Kaiser DI, Kaur J, Castillo-Chavez C, Wojick D (2008)
Population modeling of the emergence and development of scientific fields.
Scientometrics; in press.
31. Nederhof AJ (1985) Methods of coping with social desirability bias - A review.
European Journal of Social Psychology 15: 263–280.
Maps of Science
PLoS ONE | www.plosone.org 11 March 2009 | Volume 4 | Issue 3 | e4803