Embed Size (px)
Citation preview

EPRI Project Manager M. Duvall
ELECTRIC POWER RESEARCH INSTITUTE 3420 Hillview Avenue, Palo Alto, California 94304-1338 ▪ PO Box 10412, Palo Alto, California 94303-0813 ▪ USA
800.313.3774 ▪ 650.855.2121 ▪ [email protected] ▪ www.epri.com
Cleveland Transportation Electrification Roadmap 1018579
Final Report, May 2009
Cosponsor The Cleveland Foundation 1422 Euclid Ave., Suite 1300 Cleveland, OH 44115
Project Manager R. Stuebi

DISCLAIMER OF WARRANTIES AND LIMITATION OF LIABILITIES
THIS DOCUMENT WAS PREPARED BY THE ORGANIZATION(S) NAMED BELOW AS AN ACCOUNT OF WORK SPONSORED OR COSPONSORED BY THE ELECTRIC POWER RESEARCH INSTITUTE, INC. (EPRI). NEITHER EPRI, ANY MEMBER OF EPRI, ANY COSPONSOR, THE ORGANIZATION(S) BELOW, NOR ANY PERSON ACTING ON BEHALF OF ANY OF THEM:
(A) MAKES ANY WARRANTY OR REPRESENTATION WHATSOEVER, EXPRESS OR IMPLIED, (I) WITH RESPECT TO THE USE OF ANY INFORMATION, APPARATUS, METHOD, PROCESS, OR SIMILAR ITEM DISCLOSED IN THIS DOCUMENT, INCLUDING MERCHANTABILITY AND FITNESS FOR A PARTICULAR PURPOSE, OR (II) THAT SUCH USE DOES NOT INFRINGE ON OR INTERFERE WITH PRIVATELY OWNED RIGHTS, INCLUDING ANY PARTY'S INTELLECTUAL PROPERTY, OR (III) THAT THIS DOCUMENT IS SUITABLE TO ANY PARTICULAR USER'S CIRCUMSTANCE; OR
(B) ASSUMES RESPONSIBILITY FOR ANY DAMAGES OR OTHER LIABILITY WHATSOEVER (INCLUDING ANY CONSEQUENTIAL DAMAGES, EVEN IF EPRI OR ANY EPRI REPRESENTATIVE HAS BEEN ADVISED OF THE POSSIBILITY OF SUCH DAMAGES) RESULTING FROM YOUR SELECTION OR USE OF THIS DOCUMENT OR ANY INFORMATION, APPARATUS, METHOD, PROCESS, OR SIMILAR ITEM DISCLOSED IN THIS DOCUMENT.
ORGANIZATION(S) THAT PREPARED THIS DOCUMENT
EDV Commercialization
Energy and Environmental Research Associates, LLC
The University of Toledo
Northeast Ohio Areawide Coordinating Agency (NOACA), Fiscal Agent
FirstEnergy Corp
Electric Power Research Institute (EPRI)
NOTE
For further information about EPRI, call the EPRI Customer Assistance Center at 800.313.3774 or e-mail [email protected].
Electric Power Research Institute, EPRI, and TOGETHER…SHAPING THE FUTURE OF ELECTRICITY are registered service marks of the Electric Power Research Institute, Inc.
Copyright © 2009 Electric Power Research Institute, Inc. All rights reserved.

CITATIONS
This report was prepared by
EDV Commercialization 16928 Helene Lane Morgan Hill, CA 95037
Principal Investigator R. Graham
Energy and Environmental Research Associates, LLC 2 Babcock Farms Lane Pittsford, NY 14534
Principal Investigators J. Winebrake E. Green
The University of Toledo College of Business Administration, MS 103 The University of Toledo Toledo, OH 43606
Principal Investigators Dr. M. Vonderembse Dr. T. S. Ragu-Nathan
Northeast Ohio Areawide Coordinating Agency (NOACA), Fiscal Agent 1299 Superior Avenue Cleveland, OH 44114
Principal Investigator A. Wainright
iii

FirstEnergy Corp 76 S Main Street Akron, OH 44308
Principal Investigators S. B. Briggs E. M. Buzzelli M. J. Jirousek P. J. Kelly H. D. Rosebrock E. J. Shaw
Electric Power Research Institute (EPRI) 3420 Hillview Avenue Palo Alto, CA 94304
Principal Investigators M. Alexander M. Duvall E. Knipping
This document describes research sponsored by EPRI and The Cleveland Foundation.
This publication is a corporate document that should be cited in the literature in the following manner:
Cleveland Transportation Electrification Roadmap. EPRI, Palo Alto, CA, and The Cleveland Foundation, Cleveland, OH: 2009. 1018579.
iv

PRODUCT DESCRIPTION
This document defines a strategy, a roadmap, to be used by Cleveland area stakeholders (business, government, universities, planning and economic development organizations, environmental advocates, and utilities) to shift away from fossil fuel toward electricity as the fuel of choice for vehicular transportation. It provides recommendations in the form of action plans to move the region forward to capture the value made clear in the companion to this report, Regional Economic Impacts of Electric Drive Vehicles and Technologies: Case Study of the Greater Cleveland Area EPRI, Palo Alto, CA: 2008. 1018578. That report clearly defines the economic value to the region if vehicular transportation is increasingly electrified and an industry is developed to support vehicle electrification.
Results and Findings For both environment and supply security reasons, electric transportation and grid modernization will likely be major industries over the coming decades. Cleveland has a competitive advantage and the ability to capture a large share of these markets. With the right level of leadership, speed, and collaboration, the Cleveland area can use that competitive advantage to produce long-term prosperity. By focusing attention on vehicular electric transportation and grid modernization that complement the region’s existing strengths, the region can compete nationally and internationally.
Challenges and Objectives Time is of the essence, because other states are also focused on redevelopment and see energy technologies as an important future. The objective is for the Cleveland area to move immediately to capture the value made clear in Regional Economic Impacts of Electric Drive Vehicles and Technologies: Case Study of the Greater Cleveland Area EPRI, Palo Alto, CA: 2008. 1018578.
Applications, Values, and Use This document should be used as a roadmap for execution by the regional leadership team to ensure that the region is focused and moving promptly to capture opportunities associated with vehicular electrification, both those identified here and those that will arrive in the future.
EPRI Perspective Research and development, as well as proactive participation by FirstEnergy, is critical to the success of a transportation electrification program in the Cleveland area. EPRI is in a position to support this initiative by providing R&D expertise. Furthermore, EPRI is developing products that can be demonstrated and eventually produced in the Cleveland area. And finally, EPRI is in the forefront of the effort to define and develop the modern grid connectivity and hardware required to support electric vehicles.
v

Approach The goal of this report is to provide a list of critical actions and recommendations that can be implemented in the Cleveland area to enable achievement of the benefits described in Regional Economic Impacts of Electric Drive Vehicles and Technologies: Case Study of the Greater Cleveland Area EPRI, Palo Alto, CA: 2008. 1018578. The recommendations were derived from the principal investigator’s experience as program manager for Electric Transportation at EPRI and from the association of EPRI with California and Western Governors’ Association stakeholders as they developed similar action plans.
Keywords Battery electric vehicles (BEVs) Grid modernization Non-road electrification Plug-in hybrid electric vehicles (PHEVs) Smart grid Transportation electrification
vi

EXECUTIVE SUMMARY
This report is a roadmap outlining an action plan for stakeholders in the Cleveland area to implement in the near, mid, and long term in order to expand businesses and jobs related to vehicular transportation electrification. Its companion, EPRI report 10185781, clearly defines the economic value to the Northeast Ohio if transportation is electrified and an industry is developed to support electrification.
To participate in the transition to electricity as the vehicular transportation fuel of choice and to reap the potential benefits, all stakeholders—including business, government at all levels, universities, planning and economic development organizations, environmental advocates, and utilities—must be proactive. Preparing for a transition of this magnitude is not easy. The key message of this report is the importance of leadership, commitment, and a sense of urgency, without which the region will find it very difficult to shift to an economy in which transportation is not solely reliant on petroleum, and is increasingly supplied by electricity.
The urgency of implementing the recommendations contained in this roadmap has only increased with the significant changes that have occurred nationally and locally since the scope of work was developed for this project. A new president has been elected with a different energy vision, the country has entered a recession with little sign of relief, and as a result of the recession and credit problems the automotive industry is facing very difficult circumstances. The automakers’ woes are directly affecting the Cleveland area’s automotive plants and large auto supplier base. Transportation electrification is a promising solution to all of these challenges.
Background
U.S. dependence on foreign petroleum has reached a point at which it directly impacts the nation’s security and economic well-being. Public policy makers and industry are striving to reduce this dependence by moving toward use of alternative fuels, especially for transportation, which remains the largest consumer of imported petroleum products. Electricity has the potential to become the leading alternative energy source for vehicles, thanks to its availability, reliability, cost, and ability to expand with U.S. resources as demand escalates. Using electricity brings economic value to regions in terms of jobs associated with local investment in energy production.
Plug-in electric hybrid vehicles (PHEVs) are increasingly recognized as a near-term solution to the pressing environmental and economic challenges posed by continued reliance on petroleum for vehicular transportation. PHEVs offer greatly improved fuel efficiencies with commercially
1 Regional Economic Impacts of Electric Drive Vehicles and Technologies: Case Study of the Greater Cleveland Area. EPRI, Palo Alto, CA: 2008. 1018578.
vii

available technologies without subjecting customers to long-held concerns about electric vehicles, such as range, reliability and recharge times.
Awareness of the need for transportation electrification is growing. In striking contrast to the lack of news regarding PHEVs as recently as 2005, newspapers from the Wall Street Journal to local papers now regularly report the development of PHEV and battery electric vehicle (BEV) configurations by major automotive manufacturers worldwide. More than 15 PHEV and BEV programs have been announced by U.S. and foreign automakers, with delivery scheduled to begin in late 2010. And even as its financial condition deteriorated, General Motors (GM) committed to continuing the development of its Chevy Volt electric vehicle, and in February 2009 announced plans to open the country’s first large-scale battery assembly plant.
Furthermore, the Obama Administration has publicly stated its support for PHEV development and application in federal fleets, and President Obama has suggested a market penetration of 1 million PHEVs by 2015. The American Recovery and Reinvestment Act of 2009 includes billions of dollars for advanced battery research, battery plant construction, and PHEV tax credits and demonstration programs. Government loans to the U.S. auto industry have been granted with an emphasis on the industry embarking on an expanded initiative to develop and market fuel-efficient electric drive cars.
The emergence of a PHEV fleet will be built on the current hybrid vehicle technology base. Significant volume means a growing demand for electricity and the infrastructure to support the growth. By 2020, thousands of PHEVs could be plugging into the grid in the Cleveland region alone, and by 2030 the auto industry could potentially be producing 7 to 9 million PHEVs per year for the U.S. market, all demanding plug-in access to the grid. This growth in demand will occur at the same time as a parallel national initiative to modernize and improve the efficiency of the power grid providing electricity to homes and industry, making it imperative to address the need for connectivity between this grid and the electric transportation system.
Chapter 1 of this report projects how the market share for PHEVs and their proportion of the nationwide fleet might increase, and suggests that the Cleveland region can receive sizeable economic benefits from participating in the business opportunities that result from shifting to electricity as the transportation fuel of choice.
Why Cleveland and Northeast Ohio?
Northeast Ohio is ideally positioned to reap the economic, social, and environmental benefits of transportation electrification. It has a strong automotive manufacturing and supply base, close proximity to other automotive manufacturing facilities, a history of automotive technology innovation, educational institutions that have historically focused on automotive technology development, and a core of companies that support the components and systems that will enable future smart grid development. The Cleveland area is also an ideal location for deployment of PHEVs thanks to its population density and core downtown business environment. And, the Cleveland area needs a lower-emitting transportation system to help bring the region into compliance with local air quality standards.
Chapter 2 inventories the region’s existing strengths and suggests that key regional benefits of transportation electrification built on these strengths can include the following:
viii

• Attraction of research and development dollars increased employment as the region develops an industrial base to meet the needs of the switch to electric drive vehicles and electric transportation infrastructure.
• Increased employment as the region’s infrastructure is modernized to meet the growing need for electricity and the more efficient use of electricity.
• Reduced out-of-pocket expenses for private and commercial users of electric vehicle transportation.
• Reduced emissions and associated heath benefits.
These benefits have been documented in the companion to this report, EPRI 10185782. That report states: “With petroleum prices at or above 2006 levels, significant regional economic benefits can be gained through the use of electric transportation technologies in the Cleveland region. In addition, we show that targeted large-scale development of industries that support the transition to an electric transportation future could have tremendous economic benefits for the region. In all, the effects of a shift from petroleum to electricity in the transportation sector could potentially generate tens of thousands of jobs and increase economic output by billions of dollars annually.”
Opportunities
Taking action to reap these benefits could not be more important than it is today. Now is the time to seize the opportunities created by the economic stimulus package passed by Congress and signed into law by President Obama in February 2009 and by the automobile industry’s commitment to electric vehicles as it revitalizes over the coming months and years. This roadmap identifies electric transportation research and development opportunities, business development and job expansion opportunities, and approaches to acquiring federal and state funding to help finance the transition.
Research and Development
Research and development (R&D) is the catalyst that will enable the Cleveland region to prosper and establish a competitive advantage in the realm of vehicular transportation electrification. The region already has in place the research infrastructure necessary to move promptly to meet industry needs and to attract federal and state funding that will result in technology development and manufacturing jobs. Chapter 3 details research and development opportunities in the following areas:
• Electric on-road and non-road vehicle technologies.
• Advanced battery engineering and manufacturing.
• Onboard vehicle and vehicle-to-grid communication and control technology.
• Lightweight material development.
2 Regional Economic Impacts of Electric Drive Vehicles and Technologies: Case Study of the Greater Cleveland Area. EPRI, Palo Alto, CA: 2008. 1018578.
ix

• Grid modernization systems and components.
The chapter further suggests that to capitalize on these R&D opportunities, the region should establish a Northeast Ohio Transportation Electrification Alliance consisting of Northeast Ohio universities – e.g. Case Western Reserve University, Cleveland State University, The University of Akron, The University of Toledo, Youngstown State University, NASA Glenn Research Center, the Center for Automotive Research (CAR) at The Ohio State University, manufacturers, unions, planning organizations, economic development organizations, manufacturing advocates, environmental advocates, and FirstEnergy. The alliance would execute the following high-level tasks:
• Complete a state-of-technology review.
• Develop a technology innovation recommendation.
• Establish technology collaborations.
• Acquire funding.
• Execute electric drive R&D.
• Establish an education program.
Business Development and Job Expansion
According to the U.S. Bureau of Labor Statistics, the Midwest’s auto parts manufacturing industry lost more than 52,200 jobs, or 12.7% of its employment, between 1992 and 2006. This decline continued and accelerated in the 2008–09 recession, which has caused severe disruption in the auto industry. Clearly, the industry is in need of capital infusion and corresponding job creation that could occur as early as 2010 as PHEVs and BEVs are introduced in production quantities.
Chapter 4 proposes that the objective for system and component production should be to return the number of jobs available at auto industry suppliers in the Cleveland area to 1992 levels by 2020. Given the anticipated electrification of vehicular transportation, this goal is modest, achievable, and conservative. The chapter identifies opportunities in vehicle production, battery production and recycling, and infrastructure systems and components that can drive this job growth.
Funding
Federal and state funding will be required to execute a significant shift to electric vehicle transportation. The focus on energy security, energy efficiency, and reduced fossil fuel consumption has already motivated the inclusion in the federal Energy Independence and Security Act of 2007 and the American Recovery and Reinvestment Act of 2009 of research, development, and demonstration (RD&D) funding for PHEV and non-road applications. It behooves Northeast Ohio to be active in the solicitation of such federal funds, particularly because in the current economic climate, competition for the dollars available will be furious. Chapter 5 outlines potential sources of federal and state funds and suggests that eventual regional cooperation in the pursuit of federal funds might bestow a competitive advantage.
x

Strategic Actions and Key Recommendations
Strategic actions at the regional, state, and federal levels should be initiated to enable the Cleveland region to recognize the financial, social, and environmental benefits of a shift to electric transportation and its connectivity to a modern grid. Chapter 6 outlines these actions, suggesting that regional actions should include vehicle deployment, infrastructure deployment, and demonstrations, and that state actions can be organized into near-term, mid-term, and long-term categories.
Chapter 7 narrows this list of actions to a critical few and provides a schedule with the objective of creating near-term momentum. It emphasizes first that the keys to a bright transportation energy future will be speed, collaboration, use of existing resources, and employee development. Then it lists these critical path action steps:
• Select a leader who currently holds a major industry or government post or is recently retired but widely recognized and respected.
• Establish collaborative teams.
• Execute an education campaign in all sectors—citizens, companies, and government agencies.
• Review and select the focus technologies for the region. This report presents some ideas but not a final selection.
• Aggressively pursue state and federal R&D funding. Move immediately to attract state matching funds to use to apply for federal R&D funding in conjunction with area universities, NASA Glenn, and other research collaboratives.
• Urge congressional appropriation committees to fully fund the PHEV and R&D investments that were authorized in 2008.
• Aggressively pursue battery plant production in the area, with funding coming from the Energy Independence and Security Act of 2007.
• Identify infrastructure investment opportunities in northeastern Ohio that qualify for funding under the American Recovery and Reinvestment Act of 2009, such as truck stop electrification, port and airport electrification, and transit system projects. Align with the area’s congressional representatives to ensure that these projects receive funding.
• Conduct a readiness assessment of the electricity infrastructure, develop a PHEV modernization plan, and integrate with smart grid programs that can receive federal funding.
• Engage with senior management of those companies developing PHEV and BEV vehicles, especially those already manufacturing in the region. Establish a working relationship between automotive industry executives and regional stakeholders to develop a program that supports their movement to clean technology vehicles. Join with the industry to begin a clean technology development and production program in northeastern Ohio.
• Make a commitment to government acquisition of PHEV and BEV vehicles.
xi

The chapter concludes by elaborating on these key recommendations for the near term (2009–2015):
• Educate leaders, businesses, and citizens.
• Proactively identify and establish electrification businesses.
• Aggressively solicit federal and state funding.
• Leverage the future to finance current infrastructure modifications. As part of this step, audit the current Cleveland area electricity infrastructure from the following perspectives:
– initial connection for PHEVs and BEVs, with homeowners requiring safety and connection education
– development of public plug access for those who do not have access to home infrastructure
– development of connectivity systems that enable remote billing and time-of-use charging (smart-car-to-intelligent-grid connectivity)
– longer-term fast-charge access in shopping malls and other major traffic locations
– non-road infrastructure such as providing communication systems and charger technology at airports and ports
– review of the value/opportunity for PHEV and BEV battery systems to be an integral component of wind and solar systems
• Develop a collaborative strategy in meetings between state governors.
• Launch an awareness campaign.
• Provide cash buy-down grants.
• Start a non-road electrification campaign.
• Demonstrate PHEV and BEV technology.
Under the current difficult economic conditions, it is critical that Cleveland area stakeholders take action to implement these recommendations. The potential for job expansion in the area is significant. Failure to take decisive and timely action will allow other regions of the country to reap the economic development benefits of vehicular transportation electrification. Following this roadmap will help the Cleveland area solidify its economic, social, and environmental future. The time for action is now!
xii
CONTENTS
1 PROJECT BACKGROUND....................................................................................................1-1 The Need for Transportation Electrification...........................................................................1-1 Plug-ins Are Coming—And Non-road Electrification Is Growing...........................................1-1 Capitalizing on the Shift to Electric Transportation................................................................1-4
2 HOW THE CLEVELAND AREA CAN BENEFIT FROM TRANSPORTATION ELECTRIFICATION...................................................................................................................2-1
Regional Strengths................................................................................................................2-1 Regional Economic Benefits .................................................................................................2-2 Environmental Benefits .........................................................................................................2-3
Greenhouse Gas Emissions.............................................................................................2-4 Air Quality Impacts ...........................................................................................................2-7 Emissions .........................................................................................................................2-8 Ozone and Particulate Matter...........................................................................................2-9 Acid, Nutrient and Mercury Deposition ...........................................................................2-11 Visibility...........................................................................................................................2-13 Air Quality Conclusions ..................................................................................................2-13
3 RESEARCH AND DEVELOPMENT OPPORTUNITIES ........................................................3-1 Transportation Electrification R&D Needs.............................................................................3-1 Establishing a Northeast Ohio Transportation Electrification Alliance...................................3-2 Technology Development Opportunities ...............................................................................3-3
Electric On-road and Non-road Vehicle Technologies .....................................................3-3 Motor Controls / Power Electronics..............................................................................3-4 Specific Motor Applications..........................................................................................3-4
Front-wheel Drive Motor / Transmission .................................................................3-4 Bus Motor-Transmission Combination ....................................................................3-5 Electric Accessory Drive Systems...........................................................................3-5
xiii

Advanced Battery Engineering and Manufacturing ..........................................................3-5 Communication and Control Technology .........................................................................3-6 Lightweight Material Development ...................................................................................3-6 Grid Modernization Systems and Components ................................................................3-7
4 BUSINESS DEVELOPMENT AND JOB EXPANSION OPPORTUNITIES............................4-1 Job Expansion Target ...........................................................................................................4-1 Vehicle and Parts Production................................................................................................4-2 Battery Production and Recycling .........................................................................................4-4 Grid Modernization Systems and Components.....................................................................4-7 Summary of Job Growth Potential.........................................................................................4-7
5 ACQUIRING FEDERAL AND STATE FUNDING ..................................................................5-1 Funds Available from the Federal Government.....................................................................5-1 Funds Available from State Governments.............................................................................5-3 Midwestern Regional Cooperation: A Long-Term Goal.........................................................5-3
6 STRATEGIC ACTIONS FOR STAKEHOLDERS...................................................................6-1 Regional Actions ...................................................................................................................6-1
Vehicle Deployment..........................................................................................................6-1 Infrastructure Deployment ................................................................................................6-2 Demonstrations ................................................................................................................6-2 Utility Preparation .............................................................................................................6-3
State Government Actions ....................................................................................................6-3 Near-Term (Within 3 Years) .............................................................................................6-4 Mid-Term (3–10 Years) ....................................................................................................6-4 Long-Term (More Than 10 Years)....................................................................................6-4
Federal Government Actions.................................................................................................6-5
7 CONCLUSION AND KEY RECOMMENDATIONS ................................................................7-1 Keys to the Future.................................................................................................................7-1 Critical Path Action Steps......................................................................................................7-2 Key Recommendations for the Near Term (2009–2020) ......................................................7-3
xiv

LIST OF FIGURES
Figure 1-1 New Vehicle Market Share: Medium PHEV Scenario ..............................................1-3 Figure 1-2 Growth of PHEVs and eVMT in Nationwide Fleet ....................................................1-4 Figure 2-1 Year 2010 comparison of PHEV 20 GHG emissions when charged
hypothetically with electricity from individual power plant technologies (12,000 miles driven per year). .................................................................................................................2-4
Figure 2-2 Year 2050 comparison of PHEV 20 GHG emissions charged hypothetically with electricity from individual power plant technologies (12,000 miles driven per year). ..................................................................................................................................2-5
Figure 2-3 Effect of PHEVs on the Net Emissions of Several Pollutants (ton y-1) ......................2-9 Figure 2-4 Annual 4th Highest 8-Hour-Ozone (ppb): Difference between PHEV Case and
Base Case........................................................................................................................2-10 Figure 2-5 Annual 8th Highest 24-Hour Average Concentrations (µg m-3) of PM2.5:
Difference between PHEV Case and Base Case ............................................................2-11 Figure 2-6 Annual Deposition (kg N Ha-1) of Total Nitrogen for 2030: Difference between
PHEV Case and Base Case ............................................................................................2-12 Figure 7-1 Immediate Actions Proceeding from Formation of Regional Teams ........................7-2 Figure 7-2 Near-Term Timeline for Identifying Opportunities and Pursuing Funding.................7-4
xv


LIST OF TABLES
Table 4-1 Characteristics of the Business Environment in the United States and Japan ..........4-4
Table 4-2 Potential for Job Expansion in Cleveland Area by 2030 Related to Transportation Electrification and Grid Modernization .......................................................4-8
xvii


1 PROJECT BACKGROUND
This chapter sketches the coming transition to plug-in hybrid electric vehicles (PHEVs) and suggests that Northeast Ohio is well-positioned to derive significant benefit as a center for developing, manufacturing, and deploying PHEV technology to meet growing transportation demand.
The Need for Transportation Electrification
U.S. dependence on foreign petroleum has reached the point where it directly impacts our nation’s security and economic well-being. Public policy makers and industry are striving to reduce this dependence by moving toward use of alternative fuels, especially for transportation, which remains the largest consumer of imported petroleum products. Currently the transportation sector consumes 60% of the nation’s oil supply, 80% of which is imported. Electricity has the potential to become the leading alternative energy source for vehicles, thanks to its availability, reliability, cost, and ability to expand with U.S. resources as demand escalates.
Less than 4% of electricity in the United States is generated from oil; the rest comes from nuclear, coal, hydro, natural gas, wind, and solar, with the percentage of each dependent upon regional generation mix. Each of these sources has a smaller environmental footprint than petroleum as a transportation fuel. Several power generation technologies – such as nuclear, wind, and solar – emit no measurable pollutants. Advanced environmental control technologies, such as carbon capture and storage for coal-fired power plants, are in the early stages of development and when deployed in the future will improve upon the existing environmental performance of fossil-fired power plants. In contrast, future petroleum supplies may come from even more environmentally challenging sources such as tar sands or oil shale.
The nation’s energy future can be made more secure by developing the technologies to connect transportation to the broad portfolio of domestically-available electric energy sources. Energy storage systems being developed for transportation enhance overall societal energy efficiency, serve to store wind and solar energy, and can even make complex drive systems on rail and other non-road vehicles more efficient.
Plug-ins Are Coming—And Non-road Electrification Is Growing
Plug-in electric hybrid vehicles (PHEVs) are increasingly recognized as a near-term solution to the pressing environmental and economic challenges posed by continued reliance on petroleum for vehicular transportation. PHEVs offer greatly improved fuel efficiencies with commercially
1-1

Project Background
available technologies without subjecting customers to long-held concerns about electric vehicles, such as range, reliability and recharge times.
Awareness of the need for transportation electrification is on the rise. In striking contrast to the lack of news regarding PHEVs as recently as 2005, newspapers from the Wall Street Journal to local papers now regularly report the development of PHEV and battery electric vehicle (BEV) configurations by major automotive manufacturers worldwide. More than 15 PHEV and BEV programs have been announced by U.S. and foreign automakers, with delivery scheduled to begin in late 2010. A few companies will retrofit hybrid vehicles with additional battery capacity to add all-electric range, thereby increasing fuel economy. Industry leaders such as General Motors (GM), Nissan, and Toyota each have stated that electric vehicles are the future and are committing significant internal resources to meet the technical challenges. Even as its financial condition deteriorated, GM pledged to continue the development of its Chevy Volt electric vehicle and in February 2009 announced plans to open the country’s first large-scale battery assembly plant.3
Furthermore, the Obama Administration has publicly stated its support for PHEV development and application in federal fleets, and President Obama has suggested a market penetration of 1 million PHEVs by 2015. The American Recovery and Reinvestment Act of 2009 includes billions of dollars for advanced battery research, battery plant construction, and PHEV tax credits and demonstration programs. Government loans to the U.S. auto industry have been granted with an emphasis on the industry embarking on an expanded initiative to develop and market fuel-efficient electric drive cars.
Hybrid vehicles are currently in production and are available from GM, Ford, Chrysler, Daimler, Nissan, and Toyota. The emergence of a PHEV fleet will be built on this technology base, proving the capability of computer-controlled energy management systems and advanced batteries, and showing that the auto industry can provide a vehicle that meets consumer expectations for performance and amenities while also significantly reducing fuel consumption and emissions. The transition is further supported by the interest in large but niche applications for a battery electric vehicle that has the potential for 100-mile-plus range thanks to advanced battery systems.
On-road vehicles aside, non-road electrification—truck stop and port electrification, plus electrification of lawn mowers, commercial yard tractors, forklifts, construction equipment, and rail—also represents a very large market with significant electric drive penetration today that can be increased. Non-road is a mature market that can outpace the growth of on-road vehicles with minimum technology modifications.
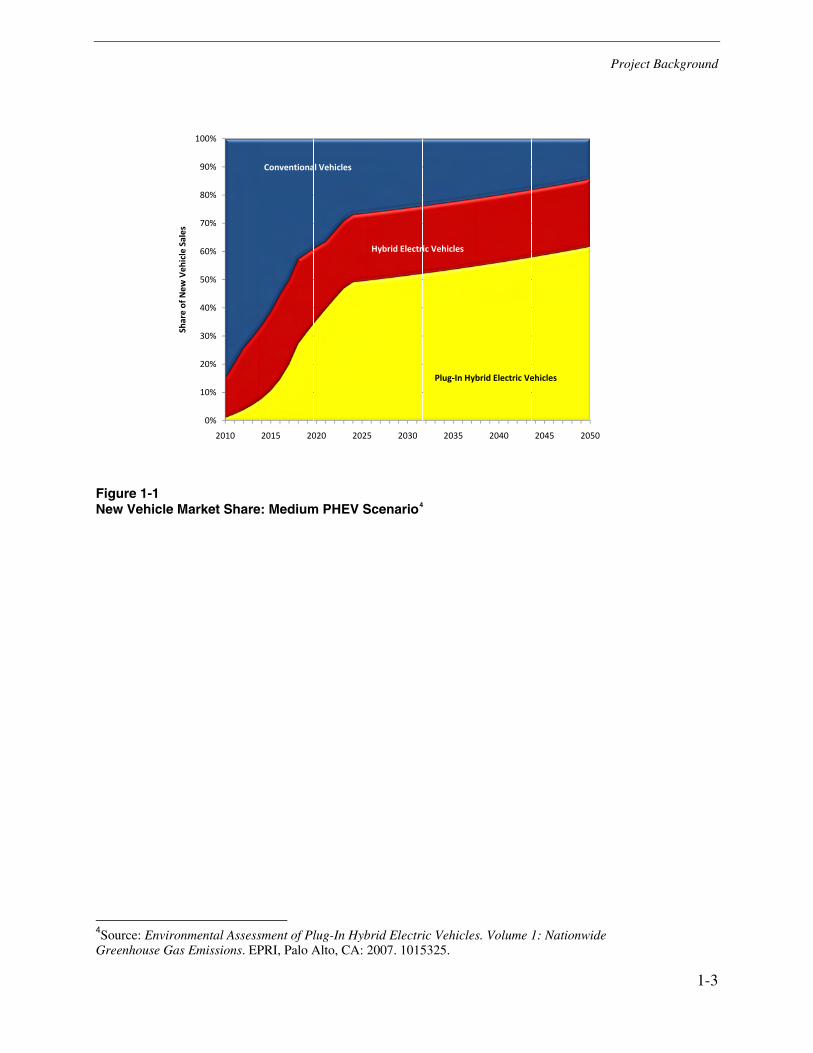
How fast will the market share of electric vehicles grow? Figure 1-1 shows medium scenario projections for new vehicle market share. In this scenario, PHEVs will reach a 30% market share by 2020 and a 60% market share by 2050. Figure 1-2 shows how the market share for PHEVs and their proportion of the nationwide fleet might increase, along with electric vehicle miles traveled (eVMT).
3Source: “GM Plans to Unveil Several New Voltec Electric Car Concepts Throughout 2009,” posted on February 9, 2009, on the Chevy Volt Electric Car Site, http://gm-volt.com/2009/02/09/gm-plans-to-unveil-several-new-voltec-electric-car-concepts-throughout-2009/.
1-2
Project Background
Figure 1-1 New Vehicle Market Share: Medium PHEV Scenario4
4Source: Environmental Assessment of Plug-In Hybrid Electric Vehicles. Volume 1: Nationwide Greenhouse Gas Emissions. EPRI, Palo Alto, CA: 2007. 1015325.
1-3
1
2
3
4
5
6
7
8
9
10
Shareof
New
Veh
icleSales
0%
0%
0%
0%
0%
0%
0%
0%
0%
0%
0%
2010 2015 20
Conventiona
020 2025
al Vehicles
5 2030
Hybrid Electr
2035
ic Vehicles
Plug In Hyb
2040
brid Electric Ve
2045 20
ehicles
050

Project Background
Figure 1-2 Growth of PHEVs and eVMT in Nationwide Fleet5
Capitalizing on the Shift to Electric Transportation
The transition to electricity as the transportation fuel of choice will present many opportunities that Northeast Ohio region can capitalize on in the months and years to come. Assuming that the automotive industry will build them, the public will demand them, and public policy makers will incentivize them, PHEVs will be on the market beginning in 2010. By 2020, thousands of PHEVs could be plugging into the grid in the Cleveland region alone, and by 2030 the auto industry could potentially be producing 7 to 9 million PHEVs per year for the U.S. markets, all demanding plug-in access to the grid.
This growth in demand for transportation electricity will occur at the same time as a parallel national initiative to modernize and improve the efficiency and reliability of the power grid providing electricity to homes and industry. Clearly, it is critical that the U.S. utility grid be prepared for the switch to electricity for vehicular transportation, and that the need for connectivity between the existing grid and the electric transportation system be addressed.
5Source: Environmental Assessment of Plug-In Hybrid Electric Vehicles. Volume 1: Nationwide Greenhouse Gas Emissions. EPRI, Palo Alto, CA: 2007. 1015325.
1-4

Project Background
One key to taking advantage of the economic development opportunities presented by this transition will be a proactive commitment by all stakeholders. Examples include:
• Federal and state government—establishing R&D tax credits for the developing technology and incentives for economic development and market development.
• Universities—aggressively pursuing R&D dollars and educating engineering students to bring focus to electric drive technology and infrastructure.
• Local government—retraining the current employment base, offering relocation/expansion incentives.
• Business—strategic planning to take advantage of the opportunities, making capital investments in R&D, modifying training and facilities to enable new technology development.
The following chapters address in greater detail the question of how the Cleveland region can receive sizeable economic benefits from participating in the business opportunities that result from shifting to electricity as the transportation fuel of choice.
1-5

2 HOW THE CLEVELAND AREA CAN BENEFIT FROM TRANSPORTATION ELECTRIFICATION
Northeast Ohio is ideally positioned to derive significant benefit as a center for developing, manufacturing, and deploying electric vehicle technology to meet growing transportation demand. This chapter explores the existing strengths of the region that make it an optimal location for a transportation electrification / PHEV economic development initiative, and looks at the significant economic and environmental benefits that can accrue if such an initiative is undertaken as described in this roadmap.
Regional Strengths
Ohio is second only to neighboring Michigan in production of cars and light trucks, representing 16.5% of total U.S. output. General Motors, Honda, Ford, and Chrysler all have a major presence in the state. Ohio’s cost of doing business and cost of living are below the national average and lower than in competing states Michigan and Illinois. Ohio’s revamped tax structure is the lowest in the Great Lakes region, with an effective tax rate of 3.6% for new capital investments compared to the region’s average of 5.7%.
Northeast Ohio has a history of developing new vehicle technologies and the infrastructure to support a transition. A strong manufacturing base exists, and the region’s compact area of operation lends itself to becoming the research, development, and demonstration site for the electrification of transportation vehicles. The current automotive, off-road transport, and infrastructure supply industries in the region are solid enterprises that have the ability to adapt and expand to meet growing demand for electric vehicle systems and components and for support infrastructure. Major suppliers that call Northeast Ohio home include Eaton, Dana, Goodyear, Parker Hannifin, and Poly One.
The region also has a proven record of attracting venture capital. A forthcoming report, Cleveland Environmental Assessment of Plug-in Hybrid Electric Vehicles, reveals that 73 companies in Northeast Ohio attracted more than $259 million in venture investment in 2008. That brings the two-year total to $577 million—almost halfway to a five-year $1.2 billion goal set by the Venture Capital Advisory Task Force. That’s how much private investment the task force estimated in 2006 would be needed to support a pipeline of innovative companies being hatched in the region.
And Northeast Ohio has a strong university contingent that can attract research and development funds from federal and state governments and direct them toward advanced transportation and grid modernization technologies. More than 250,000 degree-seeking students are enrolled in institutions of higher learning in the area, representing one of the strongest concentrations of
2-1

How the Cleveland Area Can Benefit From Transportation Electrification
educational institutions in the United States, with particular strengths in engineering and technology. Ohio also offers tremendous R&D capabilities, with the NASA Glenn Research Center—the only NASA facility north of the Mason-Dixon Line, with expertise and emphasis on power and propulsion—Ohio State University’s Center for Automotive Research (CAR)and the world-renowned Battelle Memorial Institute.
More than 4 million people live within a 250-mile radius of Cleveland, the largest U.S. population within an area of this size. The area offers a talented workforce of more than 2 million people and a population density that equates to a vehicle miles traveled (VMT) pattern reasonable for PHEV and BEV applications.
The region has these other strengths as well:
• A dynamic business environment with thriving ventures in bioscience, alternative energy technologies, and advanced manufacturing and polymers (lightweight automotive components and battery chemistries).
• A good mix of industries that produce electronics, sensors, industry controls, and instrument controls and electronics (ICE).
• An existing strong metropolitan planning process.
• A history of looking carefully at strategic initiatives.
• A strong public transit background.
• A strong utility-industry partnership.
• Attractive real estate costs.
• A history of favorable union agreements and a labor force willing to work to expand production.
Regional Economic Benefits
Significant regional economic benefits can be derived from a successful long-term initiative to electrify on-road and non-road transportation in the Cleveland area. Key benefits include the following:
• Attraction of research and development dollars.
• Increased employment as the region develops an industrial base to meet the needs of the switch to electric drive vehicles and electric transportation infrastructure.
• Increased employment as the region’s infrastructure is modernized to meet the growing need for electricity and the more efficient use of electricity.
• Reduced out-of-pocket expenses for the consumer and for commercial users of electric transportation.
2-2

How the Cleveland Area Can Benefit From Transportation Electrification
These benefits have been documented in the companion to this report, EPRI 10185786. That report states: “With petroleum prices at or above 2006 levels, significant regional economic benefits can be gained through the use of electric transportation technologies in the Cleveland region. In addition, we show that targeted large-scale development of industries that support the transition to an electric transportation future could have tremendous economic benefits for the region. In all, the effects of a shift from petroleum to electricity in the transportation sector could potentially generate tens of thousands of jobs and increase economic output by billions of dollars annually.”
Thus, potential economic benefits include not only those related to job retention and growth but also those related to use of electric transportation by the area’s population. For more details see EPRI report 10185787.
Environmental Benefits
Interest in electric transportation, particularly plug-in hybrid electric vehicles (PHEVs), has increased dramatically in recent years. Much of this interest is based on the projected environmental benefits of electrifying transportation, which offers the prospect of achieving a net reduction in greenhouse gas emissions, improvements in air quality and reduced atmospheric deposition of pollutants due to the electrification of transportation.
EPRI conducted a detailed environmental assessment of the impacts associated with the adoption of PHEVs, in collaboration with the Natural Resources Defense Council (NRDC). In contrast to other studies, the EPRI-NRDC analysis accounted for the evolution of the electric and transportation sectors and how their evolution may be impacted by an aggressive penetration of PHEVs in the study timeframe.
The EPRI-NRDC study comprised of two volumes, EPRI 1053258 and EPRI 10153269. Volume 2 is recognized as the most comprehensive analysis of greenhouse gas emissions and air quality impacts of widespread adoption of plug-in hybrid electric vehicles. The results of the first environmental assessment were released in July 2007 at a press event held in the National Press Club in Washington, D.C. with participation from EPRI, NRDC, Edison International, Austin Energy, and General Motors.
6 Regional Economic Impacts of Electric Drive Vehicles and Technologies: Case Study of the Greater Cleveland Area. EPRI, Palo Alto, CA: 2008. 1018578. 7 Regional Economic Impacts of Electric Drive Vehicles and Technologies: Case Study of the Greater Cleveland Area. EPRI, Palo Alto, CA: 2008. 1018578. 8 Environmental Assessment of Plug-In Hybrid Electric Vehicles, Volume 1: Nationwide Greenhouse Gas Emissions. EPRI, Palo Alto, CA: 2007: 1015325. 9 Environmental Assessment of Plug-In Hybrid Electric Vehicles, Volume 2: United States Air Quality Analysis Based on AEO-2006 Assumptions for 2030. EPRI, Palo Alto, CA: 2007: 1015326.
2-3
How the Cleveland Area Can Benefit From Transportation Electrification
The environmental assessment produced two reports: one focusing on greenhouse gas (GHG) emissions and one focusing on air quality impacts. The following is a summary of the key conclusions of the report:
Greenhouse Gas Emissions
The EPRI-NRDC study describes the first detailed, nationwide analysis of greenhouse gas (GHG) impacts of plug-in hybrid electric vehicles. The “well-to-wheels” analysis accounted for emissions from the generation of electricity to charge PHEV batteries and from the production, distribution and consumption of gasoline and diesel motor fuels.
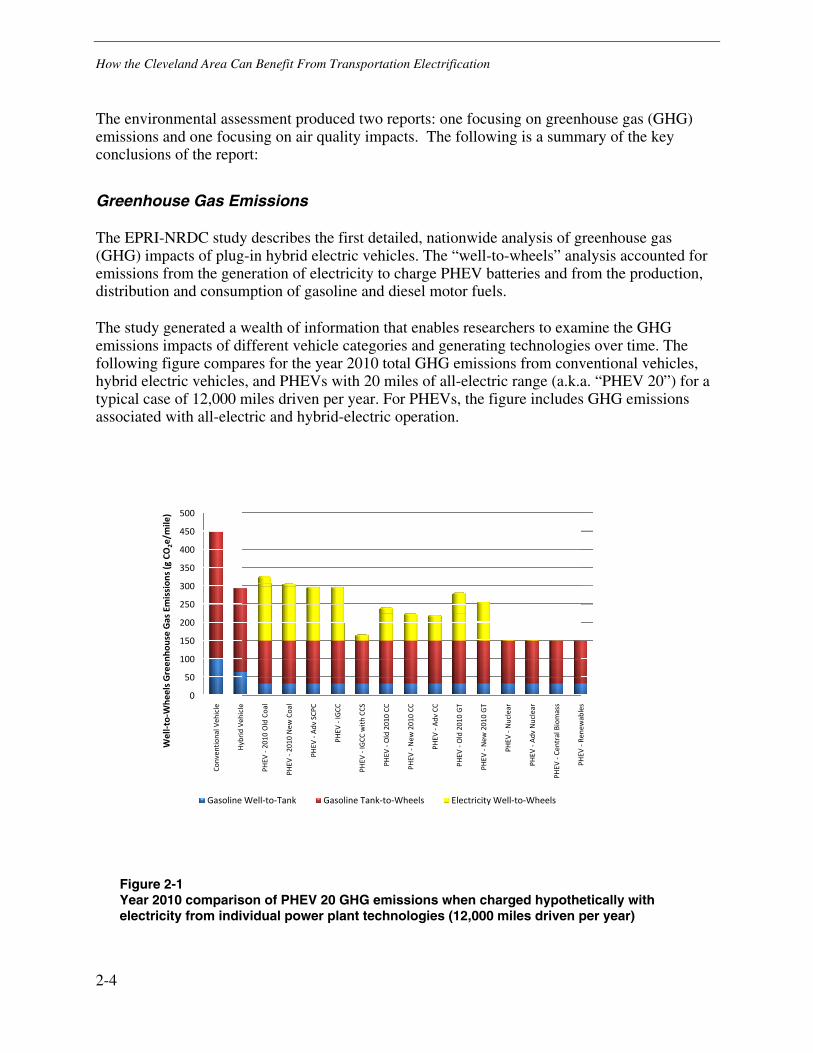
The study generated a wealth of information that enables researchers to examine the GHG emissions impacts of different vehicle categories and generating technologies over time. The following figure compares for the year 2010 total GHG emissions from conventional vehicles, hybrid electric vehicles, and PHEVs with 20 miles of all-electric range (a.k.a. “PHEV 20”) for a typical case of 12,000 miles driven per year. For PHEVs, the figure includes GHG emissions associated with all-electric and hybrid-electric operation.
Figure 2-1 Year 2010 comparison of PHEV 20 GHG emissions when charged hypothetically with electricity from individual power plant technologies (12,000 miles driven per year)
2-4
5
10
15
20
25
30
35
40
45
50
WelltoWhe
elsGreen
houseGas
Emission
s(gCO
2e/m
ile)
0
50
00
50
00
50
00
50
00
50
00
Conven
tionalV
ehicle
HybridVe
hicle
Gasoline
HybridVe
hicle
PHEV
2010
OldCo
al
PHEV
2010
New
Coal
Well to Tank
PHEV
Adv
SCPC
PHEV
IGCC
Gasoline
PHEV
IGCC
with
CCS
PHEV
Old2010
CC
PHEV
New
2010
CC
e Tank to Whe
PHEV
New
2010
CC
PHEV
Adv
CC
PHEV
Old2010
GT
eels Elect
PHEV
New
2010
GT
PHEV
Nuclear
tricity Well to
PHEV
Adv
Nuclear
PHEV
CentralBiomass
PHEV
Rene
wables
Wheels
PHEV
Rene
wables

How the Cleveland Area Can Benefit From Transportation Electrification
From this figure, it is clear that the carbon intensity of the generation technology supplying the required electricity plays a significant role in the GHG emissions impact associated with PHEVs. In 2010, vehicle-charging solely from current coal technologies results in 28% to 34% lower GHG emissions compared to the conventional vehicle and 1% to 11% higher GHG emissions compared to the hybrid electric vehicle. However, it is important to note that vehicles will charge from a portfolio of generation technologies. Therefore, it is important to perform detailed dispatch simulations to understand the actual emissions associated to PHEV charging.
It is also important to note that the electricity generation portfolio is also improving over time. By 2050, GHG emissions fall as new technologies enter the electric generating fleet and higher emitting technologies gradually phase out. By 2050, vehicle efficiency has improved, so all three components of well-to-wheel GHG emissions are lower. The PHEV 20 produces approximately the same GHG emissions as an HEV if powered by electricity from coal-fired power plants that do not capture CO2, and has 37% lower GHG emissions than the HEV if charged by coal-fired power plants with CO2 capture and storage.
Figure 2-2 Year 2050 comparison of PHEV 20 GHG emissions charged hypothetically with electricity from individual power plant technologies (12,000 miles driven per year)
2-5
5
10
15
20
25
30
35
40
WelltoWhe
elsGreen
houseGas
Emission
s(gCO
2e/m
ile)
0
50
00
50
00
50
00
50
00
Conven
tionalV
ehicle
Gasoline
HybridVe
hicle
PHEV
2050
Ad
SCPC
Well to Tank
PHEV
2050
Adv
SCPC
PHEV
2050
IGCC
Gasoline
PHEV
2050
IGCC
with
CCS
e Tank to Whe
PHEV
2050
Adv
CC
PHEV
2050
Nuclear
eels Elect
PHEV
2050
Adv
Nuclear
tricity Well to
PHEV
CentralBiomass
PHEV
Rene
wables
Wheels

How the Cleveland Area Can Benefit From Transportation Electrification
The preceding examples show the strong dependence of PHEV GHG emissions on the source of electricity. As noted earlier, PHEVs will not be drawing power solely from individual generating technologies but rather from a suite of resources that include fossil, nuclear, hydroelectric and renewable technologies. Electric sector capacity expansion and dispatch models allow us to evaluate the types of generation sources that are built and how there are operated in order to dispatch power to serve the electric load from grid-connected vehicles.
Total system emissions from a given level of PHEV are determined by a combination of the vehicle type (PHEV with a 10, 20 or 40 miles of electric range), annual vehicle miles traveled by vehicle type, and the results of these advanced, state-of-the-science electric sector simulations.
The EPRI-NRDC study evaluated a series of scenarios to examine changes in the electric sector and transportation sectors over the 2010 to 2050 horizon.
• Three scenarios represent high, medium, and low levels of both CO2 and total GHG10 emissions intensity for the electric sector as determined primarily by the mix of generating technologies.
• Three scenarios represent high, medium, and low penetration of PHEVs in the 2010 to 2050 timeframe.
From these two sets of scenarios emerge nine different outcomes spanning the potential long-term GHG emissions impacts of PHEVs, as shown in the following table.
Table 2-1 Annual greenhouse gas emissions reductions from PHEVs in the year 2050
Electric Sector CO2 Intensity 2050 Annual GHG Reduction (million metric tons) High Medium Low
Low 163 177 193
Medium 394 468 478 PHEV Fleet Penetration
High 474 517 612
The following conclusions emerged from the modeling exercises:
• Annual and cumulative GHG emissions are reduced significantly across each of the nine scenario combinations.
• Annual GHG emissions reductions were significant in every scenario combination of the study, reaching a maximum reduction of 612 million metric tons in 2050 (High PHEV fleet penetration, Low CO2 intensity electric sector case).
• Cumulative GHG emissions reductions from 2010 to 2050 can be large, ranging from 3.4 to 10.3 billion metric tons.
10 CO2 is the dominant greenhouse gas resulting from operation of natural gas and coal-fired power plants. Full fuel cycle GHG emissions include N2O and CH4, primarily from upstream processes related to the production and transport of the fuel source.
2-6

How the Cleveland Area Can Benefit From Transportation Electrification
• Finally, each region of the country will yield net reductions in GHG emissions in all the scenarios evaluated.
Air Quality Impacts
The objective of the air quality portion of the EPRI-NRDC was to evaluate the impact of plug-in hybrid electric vehicles (PHEVs) on key air quality parameters for a future-year scenario with substantial penetration of PHEVs in the U.S. light-duty vehicle fleet (passenger cars and light-trucks). The results of the analysis identify the potential that PHEVs offer for widespread air quality benefits for multiple pollutants (including ozone, particulate matter and deposition rates for sulfur, nitrogen and mercury) in the United States. Some pollutants show regions of negative benefit; however, population-exposure and deposition-flux calculations show that the overwhelming majority of the population and land area of the United States benefit from the penetration of the PHEVs in the vehicle fleet.
In order to meet this objective, a suite of computational modeling tools are used to compare two scenarios:
• A base case scenario assuming no PHEVs in the vehicle fleet, and
• A PHEV case scenario assuming a high penetration of PHEVs in the vehicle fleet (approximately 40% of on-road vehicles and 50% of new vehicle sales in 2030).
It is important to consider several important caveats regarding the study methodology:
• In order to remain consistent with the U.S. Department of Energy Annual Energy Outlook 2006, this study did not include any CO2 or greenhouse gas policies in the analysis of generation options for new capacity builds in the study timeframe. The previous section of this report summarized the impact of different electric sector CO2 intensity futures on net greenhouse gas emissions; lowering the CO2 intensity of the electricity portfolio has the potential to also lower emissions of other pollutants, but the extent of this effect was not evaluated in the EPRI-NRDC study. Future studies are being developed to explore these synergistic impacts.11
• New power-plants built to satisfy new demand, both in the base case and the PHEV case, have been assumed to be located where current generation facilities exist. Due to the inherent uncertainty in predicting the siting of new power plants, this is a necessary simplification that can have consequences in the air quality model due to the superposition of emissions. It is important to note that any new power plant sitings will need to address Prevention of Significant Deterioration (PSD) and New Source Review (NSR) requirements
11 The scenario explored in this study represents an appropriate framework from an air quality perspective at this time. Determining the air quality impacts of PHEVs under national CO2 or greenhouse gas policies or constraints would necessitate defining specific details, including, but not limited to, the nature of the policy and whether one uniform policy applies across different economic sectors or whether different policies apply to individual economic sectors (or groupings of economic sectors). This study does not seek to define potential CO2 policies. Notwithstanding, technologies implemented to satisfy a greenhouse gas policy on the electric sector are expected to lower air quality criteria emissions from the sector and result in a concomitant improvement to air quality from the adoption of PHEVs.
2-7

How the Cleveland Area Can Benefit From Transportation Electrification
in their permits and operate in such fashion to address any future air quality regulations that may be enacted in the study timeframe.
• The air quality model configuration used in this study did not include a module for explicit treatment of the chemistry and transport dynamics of large industrial plumes, such as those from power plants.
Emissions
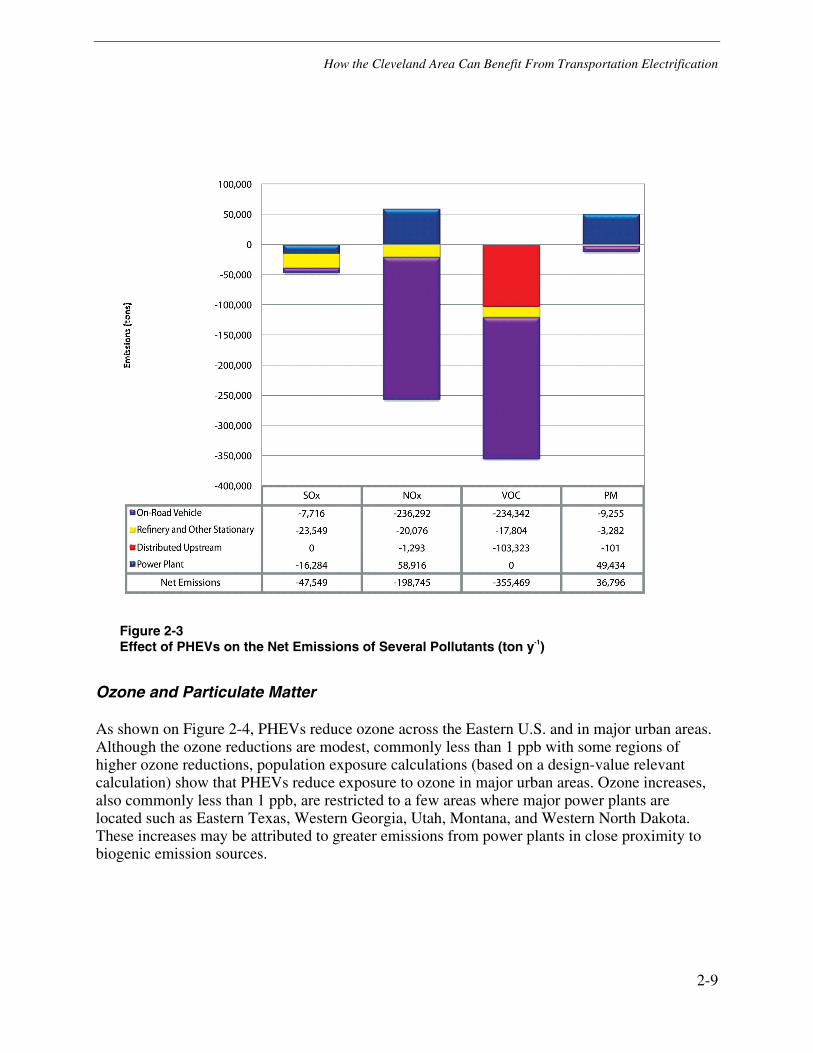
Figure 2-3 summarizes the impact of PHEVs on the net emissions of several pollutants that influence air quality, including sulfur dioxide (SO2), nitrogen oxides (NOx), volatile organic compounds (VOC) and direct emissions of particulate matter (PM). Primary emissions of particulate matter (PM) increase by 10% with the use of PHEVs due primarily to the large growth in coal generation assumed in the study. However, as shown in the next section, significant reductions in VOC and NOx emissions from the transportation sector lead to less secondary particulate matter. This reduction in secondary PM formation leads to much lower ambient concentrations of total PM overall for most of the United States. The air quality benefit is particularly pronounced over the Ohio River Valley.
2-8
How the Cleveland Area Can Benefit From Transportation Electrification
Figure 2-3 Effect of PHEVs on the Net Emissions of Several Pollutants (ton y-1)
Ozone and Particulate Matter
As shown on Figure 2-4, PHEVs reduce ozone across the Eastern U.S. and in major urban areas. Although the ozone reductions are modest, commonly less than 1 ppb with some regions of higher ozone reductions, population exposure calculations (based on a design-value relevant calculation) show that PHEVs reduce exposure to ozone in major urban areas. Ozone increases, also commonly less than 1 ppb, are restricted to a few areas where major power plants are located such as Eastern Texas, Western Georgia, Utah, Montana, and Western North Dakota. These increases may be attributed to greater emissions from power plants in close proximity to biogenic emission sources.
2-9

How the Cleveland Area Can Benefit From Transportation Electrification
Figure 2-4 Annual 4th Highest 8-Hour-Ozone (ppb): Difference between PHEV Case and Base Case
PHEVs reduce high 24-hour average PM concentrations across the Eastern U.S., in California and in the Pacific Northwest due mainly to reductions in PM2.5. These reductions, shown in Figure 3-3, are generally less than 0.5 μg m-3 but they are consistent. Annual average PM2.5 and PM10 show similar patterns of widespread, small reductions. There are some areas where PHEVs increase 24-hour and annual average PM2.5 such as Eastern Texas and Oklahoma due to an increase in power-plant emissions.
2-10

How the Cleveland Area Can Benefit From Transportation Electrification
Figure 2-5 Annual 8th Highest 24-Hour Average Concentrations (µg m-3) of PM2.5: Difference between PHEV Case and Base Case
Primary emissions of particulate matter (PM) increase by 10% with the use of PHEVs due primarily to the large growth in coal generation assumed in the study.
In most regions, particulate matter concentrations decrease due to significant reductions in VOC and NOx emissions from the transportation sector leading to less secondary PM. In general, as shown on the previous figures, increases in PM emissions from the electric sector are more than offset by significant reductions in VOC and NOx emissions from the transportation sector leading to less secondary particulate matter.
Acid, Nutrient and Mercury Deposition
Changes in power-plant operations and building of new power plants change the sulfate deposition patterns in many parts of the Eastern United States. However, the net impact of PHEVs over the entire continental United States is that of decreased sulfate deposition.
PHEVs reduce nitrate acid deposition in much of the Eastern United States including the Ohio River valley. As shown in Figure 2-6, total nitrogen deposition is reduced with PHEVs throughout the Eastern United States and near all major urban areas due to lower mobile source ammonia emissions with PHEVs.
2-11

How the Cleveland Area Can Benefit From Transportation Electrification
Figure 2-6 Annual Deposition (kg N Ha-1) of Total Nitrogen for 2030: Difference between PHEV Case and Base Case
There are shifts in the patterns of mercury deposition due to PHEVs, with decreases being more widespread. Overall, despite a minor increase associated with EGU mercury emissions, mercury deposition is decreased in the U.S. Mercury deposition is influenced by both emissions and atmospheric chemistry as well. Chemical reactions cycle mercury from its elemental form to oxidized forms that can deposit more readily in rain or by contact with the Earth’s surface. The lower levels of atmospheric ozone in the PHEV scenario cause more of the mercury to remain in the elemental form and thereby decrease the amount deposited on the surface.
Mercury emissions increase by 2.4% with increased generation needs to meet PHEV charging loads. The study assumes that mercury is constrained by a cap-and-trade program, with the option for using banked allowances, proposed by EPA during the execution of the study. The electric sector modeling indicates that utilities take advantage of the banking provision to realize early reductions in mercury that result in greater mercury emissions at the end of the study timeframe (2030). As a result, PHEVs do not increase the U.S. contribution to the global mercury budget over the long term. Moreover, PHEVs serve to enhance the benefit of early banking by allowing the oxidant pool to have further decreased by the time these banked allowances are emitted.
2-12

How the Cleveland Area Can Benefit From Transportation Electrification
Visibility
Visibility is improved by PHEVs at Class I areas throughout the United States. The visibility improvements are not substantial in the Northern and Central United States but are considerable in the Eastern United States (e.g., the Appalachians) and California, especially Southern California.
Air Quality Conclusions
Because of the significant reduction in emissions from gasoline and diesel fuel use and because caps are in place for some conventional pollutants for the electric power sector, the EPRI-NRDC study found that in many regions deployment of PHEVs would reduce exposures to ozone and particulate matter, and reduce deposition rates for acids, nutrients, and mercury. This is particularly so for the Ohio River Valley region of the Midwest U.S.
The key results of the air quality study are summarized below:
• The air quality modeling performed in this study employed a conservative representation of future power-plant technologies.
• In most regions of the United States, PHEVs result in small yet significant improvements in ambient air quality and reductions in the deposition of various pollutants.
• SO2 emissions are capped nationwide for the electric sector and do not increase with the adoption of PHEVs. Electric sector NOx emissions are similarly capped for a broad region of the U.S.
• Considering the electric and transportation sectors together, total emissions of VOC, NOx and SO2 from the electric sector and transportation sector combined decrease due to PHEVs.
• The reductions in these pollutants lead to widespread improvements in ozone and total particulate matter concentrations, particularly in urban areas.
• The study assumes that the mercury emissions are constrained by a cap-and-trade program proposed by EPA during the execution of the study. The study results show a reduction in total mercury deposition rates over the United States due to PHEVs.
• The study showed very small regions of negative impacts—some of these impacts can be explained due to the limitations of the models used in the study. Nonetheless, these results can be used to guide future air quality management and planning to avoid any negative impacts.
Overall, the air quality benefits from PHEVs are due to a reduction of vehicle emissions below levels required by current regulation (due to their non-emitting operation in all-electric mode), and because most electricity generation emissions are constrained by existing regulatory caps.
2-13

How the Cleveland Area Can Benefit From Transportation Electrification
Any additional increase in the amount of all-electric vehicle miles traveled or further emissions constraints on the electric sector would tend to magnify these benefits. For more details, see EPRI report 101532512 and EPRI report 101532613. Both reports are available to the public at no cost.
12 Environmental Assessment of Plug-In Hybrid Electric Vehicles, Volume 1: Nationwide Greenhouse Gas Emissions. EPRI, Palo Alto, CA: 2007: 1015325. 13 Environmental Assessment of Plug-In Hybrid Electric Vehicles, Volume 2: United States Air Quality Analysis Based on AEO-2006 Assumptions for 2030. EPRI, Palo Alto, CA: 2007: 1015326.
2-14

3 RESEARCH AND DEVELOPMENT OPPORTUNITIES
Research and development (R&D) is the catalyst that will enable the Cleveland region to prosper and establish a competitive advantage in the realm of vehicular transportation electrification. The region already has in place the research infrastructure necessary to move promptly to meet industry needs and to attract federal and state funding that will result in technology development and manufacturing jobs. This chapter identifies some research and development opportunities and recommends an R&D approach that can be used in the Cleveland area.
Transportation Electrification R&D Needs
The following list suggests some of the areas related to electrifying vehicular transportation in which additional R&D is needed:
• Electric drive vehicle systems, components, and software.
• Advanced electric motors.
• Advanced battery chemistries, including polymer applications.
• Nano materials for battery applications.
• Battery subsystems such as cooling systems.
• Battery computer control systems (software).
• Onboard charging systems.
• Electrically driven accessory systems.
• Off-board “plug” stations and related security and communication systems.
• Communication/networking hardware and software.
• Smart meter systems for vehicle-to-grid interconnectivity.
• Vehicle and grid sensors and controls.
• Fast charging systems for advanced batteries in public locations.
• Manufacturing processes/procedures for flexible manufacturing systems.
• Next-generation automation processes/systems for battery and vehicle manufacturing.
• Remote power development and linkage between vehicle and power generation.
3-1

Research and Development Opportunities
• Vehicle connection systems that will enable use of renewable energy.
• Energy monitoring and measuring systems.
• Remote billing—hardware and software systems.
• Vehicle monitoring and controls for “emission free zone” operation.
• Electricity systems/transformers enabling reverse electricity flow (stemming from millions of vehicles plugged into the grid in unison).
This list by no means captures all the areas that should be explored. While some of these technologies are already being developed, the electric transportation industry is at a very early stage of development. Increases in system efficiencies and durability, along with reductions in weight, will be seen and an infinite number of product variations will be required as the electric transportation business expands into a global market. In addition, the products will migrate to other industries as automotive volume drives down the purchase price.
Establishing a Northeast Ohio Transportation Electrification Alliance
Establishment of a collaborative Northeast Ohio transportation electrification alliance (hereafter Alliance) is critical to supporting a transition to electric transportation and reaping the benefits for the region. The alliance should include northeastern Ohio universities – e.g. Case Western Reserve University, Cleveland State University, The University of Akron, The University of Toledo, Youngstown State University, NASA Glenn Research Center, the Center for Automotive Research (CAR) at The Ohio State University – manufacturers, unions, planning organizations, economic development organizations, manufacturing advocates, environmental advocates, and FirstEnergy. The alliance should focus on identifying vehicle manufacture and assembly techniques, and electric drive components and systems that can be advanced through R&D and moved along a path to commercialization, ensuring a role for Northeast Ohio in manufacturing, assembling, and distributing these technologies. As a component of this research program, engineering students and future manufacturing technicians will be educated to ensure future development and quality manufacturing.
The alliance should execute the following high-level tasks:
1. Complete a state-of-technology review. This review would establish a technology roadmap to be followed the subsequent R&D initiative. The analysis would review the state of technology for hybrid drive systems currently in production or proposed. The analysis would further identify manufacturers, establish the financial condition of the manufacturers, and assign a probability to whether the identified technology will achieve commercialization. The analysis would also determine if the current technology can be improved to create improvements in system efficiency and manufacturability.
2. Develop a technology innovation recommendation. Based on the technology review, the alliance would develop a research plan for chosen technologies that have the potential to be developed, improved, and manufactured in Northeast Ohio. The research plan would include a detailed statement of work, budget, and schedule for each technology identified. The
3-2

Research and Development Opportunities
alliance would also establish a cost analysis for electric drive components to determine current and target component costs to achieve significant market penetration.
3. Establish technology collaborations. The alliance would establish collaborative partnerships with current technology developers where possible to advance the state of their technology, leading to production agreements in Ohio. The team will conduct meetings with prospective collaborative partners whose technologies have been reviewed in the technology review and deemed worthy of further R&D investment. Intellectual property and other appropriate agreements will be executed as part of this task, setting the stage for a planned R&D effort.
4. Acquire funding. Alliance members would work collaboratively to attract state and federal investments to the area for plant and employee development as well as research and development funding.
5. Execute electric drive R&D. Alliance members would execute the R&D on the chosen technologies. Each R&D project would have a clearly defined technology goal complemented by a detailed schedule and budget.
6. Establish an education program. The alliance would establish an education program that emphasizes attracting engineering students to the electric drive technology field. In addition, the program would work with the manufacturing industry to initiate dissemination of electric drive materials as part of manufacturing education programs and eventually as part of state education programs.
Technology Development Opportunities
Many technology development opportunities will rise to the surface over the next 10 years as the nation moves to electric transportation to reduce its dependence on foreign oil and modernizes the grid to enable energy efficiency and electric transportation to flourish. The technology descriptions in the remainder of this chapter provide a glimpse of the potential R&D opportunities that by the Northeast Ohio Transportation Electrification Alliance might consider as transportation is electrified.
Electric On-road and Non-road Vehicle Technologies
Electric on-road vehicles include the PHEVs currently being developed by the automotive industry as well as the BEVs that are the next generation of those built in the 1990s. Non-road electric vehicles include those operated in commercial applications such as airport baggage handling vehicles, port gantry cranes, forklifts, lawn mowers, and sweepers.
The following technologies apply to the commercialization of PHEVs, BEVs, and electric non-road applications.
3-3

Research and Development Opportunities
Motor Controls / Power Electronics
A drive motor system essentially consists of two parts: the drive motor itself and the electronics used to drive the motor. Motor drive electronics is a relatively mature industry because of long-standing use in industrial vehicles and specialized control applications like electric trains and buses. Drive electronics is also a very interesting area for research because of the wide applicability of the resulting knowledge; similar electronics can be used for systems ranging from 1kW accessory motors to 100kW drive motors. This is similar to the wide applicability of engine research; combustion engines for golf carts and buses do not share any parts, but research into components like valves, camshafts, and materials is applicable to both.
Below are two of examples of research going on in this area:
• In June 2008, Dow Corning Corporation was awarded a three-year, $2.4 million contract by the U.S. Department of Energy to develop a next-generation propulsion inverter for high-efficiency hybrid electric vehicles, PHEVs, and fuel cell vehicles. Inverters control the power output and generation of hybrid vehicles during acceleration and deceleration. The project aims to reduce the cost and size of the inverter by 50% or more and at the same time boost its performance.14
• The Oak Ridge National Laboratory’s Power Electronics and Electric Machinery Research Center (PEEMRC), the U.S. Department of Energy’s premier broad-based research center for power electronic and electric machinery development, has dramatically advanced the technology of soft-switched inverters, multilevel inverters, DC-DC converters, motor control techniques, and efficient, compact electric machines.15
Specific Motor Applications
The next three technologies concern the second part of a motor drive system, the drive motor itself. This can roughly be described as the iron and copper element—separate from the electronics and software—that converts the electrical output from the motor drive electronics into rotational motion. Motor design is a very mature aspect of engineering, having undergone well over a hundred years of active development. Although there is always more to learn about making good motors, these tasks are primarily concerned with the development of motors for particular applications that are currently not well-served.
Front-wheel Drive Motor / Transmission
High-power motors are being developed for front-wheel-drive cars with conventional automatic transmissions. Front-wheel-drive cars have difficult packaging restrictions as a result of the need
14Source: “Dow Corning wins $2.4 million for hybrid vehicle work,” by Ben LaMothe, Michigan Business Review, June 24, 2008.
15Source: Power Electronics and Electric Machinery Research Center, Oak Ridge National Laboratory, http://peemrc.ornl.gov.
3-4

Research and Development Opportunities
to fit the axial length of the engine and transmission between the suspension components for the front wheels. Typically, front-wheel-drive cars are designed around specific engine-transmission combinations that are already optimized for minimal length, leaving no margin that could be used to add a high-power motor. Hybrids that have been developed so far require either custom transmissions (Prius, Escape) or custom engines and low-power motors (Civic, Accord). Based on research into state-of-the-art motors, EPRI believes it is possible to package a high-power motor in roughly the same volume as a conventional torque converter in an automatic transmission.
Bus Motor-Transmission Combination
A number of applications currently exist for a large-scale motor-transmission combination, including electric transit buses with overhead power and fuel-cell buses. This unit would be a self-contained module featuring integrated cooling and lubrication, and two to three speeds. Currently this market is served by units constructed from parts that were not designed together and are not well integrated, or units that are not easily sourced within the U.S. market.
Electric Accessory Drive Systems
A large number of applications exist for low-cost accessory drive motors in the 1–3kW range, in both the alternative and conventional vehicle markets. Electric steering is becoming an increasingly standard option, and electric air conditioning is likely to be a desirable feature in luxury cars in the future to lower noise. Motors currently being built for these applications are relatively complicated and use expensive manufacturing techniques. Reducing this cost would greatly increase the application area of this market.
Advanced Battery Engineering and Manufacturing
Significant press coverage is given to the importance of continuing the advancement of lithium-ion batteries to meet the demands for PHEV, BEV, and non-road applications. Future efforts need to be focused on increasing the longevity and reliability of existing chemistries, developing new lithium chemistries, standardizing sizes for interchangeability among manufacturers, and developing systems that can easily be manufactured on automated assembly lines in the United States. New manufacturing approaches and techniques that would drive down costs need to be developed.
There are numerous examples of battery technology development initiatives and contracts executed by the United States Advanced Battery Consortium (USABC), such as:
• EnerDel, a joint venture between energy company Ener1 and Delphi Corporation formed in 2004, planned to start building lithium-ion batteries for the Th!nk City electric vehicle in 2008 at Delphi’s old battery plant in Indiana, with EnerDel’s goal to be the first company to cost-competitively mass produce a lithium-ion battery in the United States.16
16Source: EnerDel Web site, www.enerdel.com/.
3-5

Research and Development Opportunities
• Compact Power, Inc., of Troy, Michigan, was awarded a contract valued at $12.9 million to develop lithium-ion battery technology for PHEV applications. The contract, awarded by the USABC, is for a 27-month period beginning in January 2008 to develop batteries for 10-mile range PHEVs using high energy and high power manganese-spinel cathode chemistry.17
A critical value-added technology area is the integration of the battery, control, and cooling systems into a single unified system that can be acquired by an auto company and integrated directly into a vehicle. The intellectual property that can be established by these developments can give U.S. manufacturers a competitive advantage and lead to reduced system costs.
An example is the marriage between A123Systems and Cobasys LLC. Cobasys was the name given in 2004 to the former GM Ovonics, which supplied the NiMH battery packs for the General Motors EV1. Cobasys also supplied the NiMH packs for the current GM mild hybrid system and has extensive experience in integrating cells into battery packs and packs into vehicles. When it became clear that lithium-ion batteries would be attractive to meet the performance requirements of plug-in and series hybrid vehicles, Cobasys decided to focus on its integration experience rather than trying to develop lithium-ion chemistry. It looked at the companies working in the lithium cell arena and ultimately struck up a partnership with A123, which will focus on cell development while Cobasys handles pack integration and assembly.18
Communication and Control Technology
Communication and control technologies will play an important role in maximizing system efficiency, providing the consumer with ease of operation as well as recharging and billing, and eventually linking a vehicle’s energy storage system to the modern electricity grid. Onboard sensors, advanced chargers, and nano wireless communication devices are just three examples of the communication (internet connectivity and home networks) and locator technologies that will enable remote charging and billing, and battery remote maintenance monitoring.
Lightweight Material Development
Composite/lightweight material research is a U.S. Department of Energy priority at national labs such as the Oak Ridge National Laboratory (ORNL). For example, ORNL has established the goal of developing and validating cost-effective light-weighting materials technologies that will significantly reduce automobile weight without compromising vehicle cost, performance, safety, or recyclability. The project’s objectives are as follows:
• By 2006, develop and validate advanced material technologies that will be needed to meet the following goals:
17Source: Compact Power press release, “Compact Power, Inc. Awarded New Lithium-Ion Battery Technology Development Contract by USABC,” Troy, Michigan, January 2, 2008.
18Source: “General Motors Invites Us Behind the Curtain: Battery Development Details Revealed,” by Sam Abuelsamid, March 14, 2007, AutoblogGreen.com.
3-6

Research and Development Opportunities
– Enable significant reductions in the weight of body and chassis components and in vehicle weight (for example, 50% reduction in weight of components and 40% reduction in vehicle weight relative to 1997 baseline five-passenger vehicle)
– Exhibit performance, reliability, and safety characteristics comparable to those of conventional vehicle materials
– Be competitive, on a life-cycle basis, with costs of current materials
• By 2012, develop and validate advanced material technologies that will be needed to meet the following goals:
– Enable reductions in the weight of body and chassis components of at least 60% and in vehicle weight of 50% (relative to 1997 comparative vehicles)
– Exhibit performance, reliability, and safety characteristics comparable to those of conventional vehicle materials
– Be competitive, on a life-cycle basis, with costs of current materials19
Grid Modernization Systems and Components
PHEVs and BEVs will not be commercially successful without an electricity infrastructure that is as accessible as gasoline has become over the last hundred years. A number of organizations are focused on grid systems and components. The key will be to include electric transportation connectivity in the plans for grid modernization. EPRI, the national labs, and others such as the Galvin Electricity Initiative (led by Robert Galvin, former Chairman and CEO of Motorola) have shown strong interest in and conducted detailed studies on the importance of modernizing the electricity delivery system. Connectivity between this modernized grid and the developing intelligent electric drive vehicle (in which the PHEV is a resource to the grid, in “vehicle-to-grid” mode) is critical to maximize efficiency and consumer convenience.
The Galvin Electricity Initiative has outlined a vision of the potential and market for grid modernization. According to this vision, the transformed electricity grid for the 21st century will
• Electronically control the power system,
• Integrate electricity and communications,
• Transform the meter into a two-way consumer services gateway,
• Reintroduce direct current (DC) circuits/microgrids, and
• Enable smart, efficient end uses.20
A report released by the initiative in February 2007 predicted that “the hottest sector in the technology market over the next decade will be products that make reducing power bills and
19Source: Polymer Matrix Composites Group, Oak Ridge National Laboratory, www.ms.ornl.gov. 20Source: Slide presentation, “Electricity for the 21st Century,” developed by the Galvin Electricity Initiative and available on the initiative’s Web site at www.galvinpower.org.
3-7

Research and Development Opportunities
conserving energy as easy as managing cell phone minutes.”21 Such products will include devices that help consumers identify when they are using electricity and what they are paying for it, according to the report, The Path to Perfect Power: New Technologies Advance Consumer Control. This report gives some idea of the need for Research and Development in this area.
21 Source: Press release, “Technology Set to Revolutionize Energy Use—Marketplace, Explosion of New Innovations Will Save Money, Protect Environment,” February 26, 2007, Galvin Electricity Initiative, http://www.galvinpower.org/media/galvin.php?id=90.
3-8

4 BUSINESS DEVELOPMENT AND JOB EXPANSION OPPORTUNITIES
Research, development, and production of the technologies reviewed in the previous chapter of this report will lead to new job and business development opportunities in the Cleveland area. Cleveland has a rich history as a component supplier and final original equipment manufacturer (OEM) for the auto and truck market. Cleveland’s central location, experienced workforce, educational institutions, and existing plants and infrastructure are a strong foundation upon which the electric drive component and vehicle industry can be established.
This chapter outlines the opportunities for business development and job expansion in the Northeast Ohio presented by the electrification of vehicular transportation. The critical job development areas discussed here include vehicle production in both the conventional auto market and the specialty BEV market, battery production and recycling, and infrastructure system and component development and production.
Job Expansion Target
According to the U.S. Bureau of Labor Statistics, the Midwest’s auto parts manufacturing industry lost more than 52,200 jobs, or 12.7% of its employment, between 1992 and 2006. This time frame included three distinct periods: a period of healthy expansion in wages and employment from 1992 to 1995, a largely flat period from 1995 to 2000, and a period of unabated decline from 2000 to 2006. 22 This decline continued and accelerated in the 2008–09 recession, which has caused severe disruption in the auto industry. Clearly, the industry is in need of just the kind of infusion of jobs and capital that could occur as early as 2010 as PHEVs and BEVs are introduced in production quantities.
We propose that the objective for system and component production should be to return the number of jobs available at auto industry suppliers in the Cleveland area to 1992 levels by 2020. Given the anticipated electrification of vehicular transportation, this goal is modest, achievable, and conservative.
Our job expansion target is based on the following key assumptions:
• Plug-in hybrid drive technology can be integrated into current and future vehicle platforms and still meet the vehicle operational requirements. PHEVs will be the power technology for more than half of the vehicles produced for the U.S. market by 2030.
22Source: “The Rise and Decline of Auto Parts Manufacturing in the Midwest,” Benjamin Collins, Thomas McDonald, and Jay A. Mousa, Monthly Labor Review, October 2007, pp. 14–20.
4-1

Business Development and Job Expansion Opportunities
• The BEV market will be a solid niche market, enabling manufacturers to provide continuous market improvements and insertion into additional niches as the price drops and vehicle range is extended. The demand for these products will continue at airports and seaports, as environmental issues and high oil costs accelerate change. Even if the price of oil remains low which we believe is unlikely in the long term, electricity will remain an economically attractive alternative—with oil at $40 per barrel, for example, electricity costs about one-fourth the price of gasoline and diesel per unit of energy.
• Advanced battery systems in both on-road and non-road transportation will become a valuable component of the modern grid as they become a potential storage medium for wind and solar energy generation and become cost-effective for installation in all home, commercial, and industrial applications.
• Electricity very likely could ultimately become the fuel of choice because of its accessibility to all, its ability to utilize non-fossil-fuel generation, and the capability for connectivity between the modern grid and modern smart electric drive vehicles.
Vehicle and Parts Production
We believe that the market for electric drive systems and the vehicles that include them will be dynamic as the auto industry adjusts to survive the current negative market pressures and meets expectations from a new administration and the increasingly energy-conscious public. Rapid changes in battery technology, control systems, and infrastructure connectivity will require fast-strike, multifunctional engineering teams and manufacturing systems that can respond immediately to market gyrations. This in turn demands flexible manufacturing entities that may stand alone or be incorporated into existing manufacturing bases.
We believe these flexible systems will be further divided into (1) mass-market, high-volume organizations serving the global automotive market, and (2) niche market players that specialize in responding to a smaller yet equally fast-changing customer base. These two types of organizations will probably require two separate yet still compact manufacturing systems. The automotive and battery companies meeting the mass-market commitment will be fully automated, while the niche players should have manufacturing plants with cells that can achieve high-quality batch production.
Near-term construction jobs will be created as the manufacturing plants are developed for each of these different needs, and full-time employment will be created as the plants manufacture systems and components. Our job expansion target is based on published accounts of job opportunities being created when new plant production is projected. For example, the following two examples of niche, batch-production facilities currently proposed for other parts of the country should serve to point out the local economic potential if vehicle production entities are constructed in the Cleveland region:
• Tesla Motors production facility in San Jose, California—Although the potential economic impact of such a factory hasn’t yet been calculated, just building a 600,000-square-foot factory would result in 600 construction jobs and about $40 million in wages. Once in operation, the plant is projected to employ 800 to 1000 workers, assembling 20,000 cars a
4-2

Business Development and Job Expansion Opportunities
year.23 (Note that although the economic downturn has caused Tesla to reduce these employment expectations, this fact does not negate the potential job opportunities once the economy has recovered.)
• ZAP and Integrity Manufacturing electric vehicle plant in Simpson County, Kentucky—California-based electric car company ZAP now builds its cars in China but is partnering with Integrity Manufacturing of Kentucky to propose an $84 million facility in Kentucky that would employ 500 to 1000 workers initially and as many as 2500 later.24
The automotive manufacturing and supply companies that already exist in the Cleveland area have been supporting the automotive industry for years and can serve as building blocks for electric transportation. In 2007, 8761 workers were employed by these firms, which included the following:
• Gamco Components Group LLC
• Advanced Technology Corporation
• Ford Motor Company
• TRW Automotive
• Eaton Corporation
• Coquest Consumer Products
• Wiseco Piston Inc.
• Parker Hannifin Corporation
Those companies that adapt their products to match new market realities could provide stable employment during the transition, while those that are unwilling or unable to adapt will go out of business and make workers available to other companies.
Besides manufacturing jobs in vehicle production, an opportunity for value-added / intellectual property (IP) development is created by the fact that a control infrastructure is required to manage the movement of energy between the battery, the motor, and the engine of an electric vehicle. Keeping design and build close to each other in one region is warranted to protect the IP, hold transportation costs down, enable just-in-time supply, and support the rapid evolution of production technology.
23Source: San Jose Mercury News, August 15, 2008, p. B1.
24Source: “Kentucky Offers Incentives for Electric Car Plant,” Nancy Rodriguez, Louisville Courier-Journal, August 16, 2008.
4-3

Business Development and Job Expansion Opportunities
Battery Production and Recycling
U.S. firms dominate in manufacturing primary batteries but have failed thus far to successfully engage in lithium-ion battery manufacturing, whereas Japan manufactures 80% of the lithium-ion batteries made today. An understanding of the factors that contribute to this reality is useful in appraising the opportunities in battery production that the Cleveland region might pursue.
In July 2005, the National Institute of Standards and Technology (NIST) published a working paper that identified structural factors in the business environments of the United States and Asian countries with burgeoning activity in rechargeable batteries that might account for the Asian countries’ dominance. The paper notes that Japanese firms have generally enjoyed more supportive government policies and socio-economic conditions. Table 4-1 shows the contrasting characteristics of the business environments in the United States and Japan revealed by interviews conducted by NIST.
Table 4-1 Characteristics of the Business Environment in the United States and Japan25
United States Japan
Goal is immediate profits and maximum personal income
Goal is to gain market share
Short-term or quarterly outlook Long-term outlook, five years
Only immediate high return acceptable Low return acceptable
Little company loyalty or loyalty to suppliers Strong company loyalty and loyalty to suppliers
Little co-operation with university research Close co-operation with university research
Little government funding of company R&D programs
Government funding of strategic R&D programs
Low savings rate / high interest rates High savings rate / low interest rates
We believe identification of these challenges should motivate U.S. stakeholders to develop appropriate policies and relationships to stimulate advanced battery development domestically.
U.S. manufacturing of advanced batteries is critical to being able to meet our energy security challenge. Energy security means establishing a value chain between battery engineering and production in the United States and basic raw material suppliers both in and outside of the United States, so that mutual dependency brings long-term trust and a two-way product market.
25Source: National Institute of Standards and Technology, Chapter 4, “Structural Factors Affecting Production Decisions,” in “Why There Are No Li-ion Battery Manufacturers in the U.S.,” Advanced Technology Program (ATP) Working Paper Series, Working Paper 05-01, July 31, 2005, http://www.atp.nist.gov/eao/wp05-01/chapt4.htm.
4-4

Business Development and Job Expansion Opportunities
In addition, we cannot forget the importance of establishing battery recycling plants near battery manufacturing plants. Reuse of lithium and electronic components becomes an important part of energy security while also protecting the environment. In addition, recycling these components is another job-creating activity.
Other key points from the NIST working paper mentioned earlier that must be considered in planning for battery production in the Cleveland area include the following:
• The costs for skilled labor in a well-automated lithium-ion factory (producing three million or more cells per month) are essentially the same in the United States and Japan. Material costs in this type of factory are 75 to 80% of total manufacturing costs (or higher). By contrast, labor costs are significant for battery pack assembly, as a considerable number of hand operations are involved. Thus, labor costs play a significant role in the decision about where to place battery pack assembly.
• Most battery companies have moved pack assembly operations to China and Southeast Asia, but what this ultimately does is to help build technical capabilities of Asian engineers and scientists, resulting in stronger capabilities by Asian firms.
• Publication of battery-related technical papers from China and Korea has increased significantly over the past five years. This increase in technical capability is a result of strong government support in China and Korea for developing battery production facilities as well as for university research. These countries offer large financial incentives in order to acquire technology expertise and establish domestic manufacturing facilities that provide jobs.
• The incentives usually involve a government loan or grant to a local company for the production facility, with an American or Japanese company providing the technology through a joint venture. As a result, historically the technology has become resident in the host country and the company providing the technology has eventually been forced out of the venture.
• Worldwide, manufacturing facilities for lithium-ion batteries are expensive: a facility manufacturing three million cells per month has an annualized cost of $3–$4 per cell, so a plant making three million cells per month will cost $108–$144 million, including the cost of the land but not of the research, development, and engineering (RD&E) that produced the technology and equipment designs for the plant.
• The high cost partly results from requirements for high precision and environmental controls. In the United States, the environmental permitting process adds control requirements and costs.
• A new facility designed to produce 1000 tons of carbon anode materials or cobalt oxide cathode materials will cost about $10 per pound of these materials to build, while the cost of modifying and expanding an existing facility is around $1 per pound annualized. Materials suppliers traditionally operate on lower rates of return than do battery companies, invariably prefer modifying an existing facility to produce a new product over building a new facility, and will not do the latter without having agreements in place with customers guaranteeing to buy a specific amount of material.
• U.S. managers must include overhead from corporate staff as well as recovery of the investment in three to five years in their return-on-investment calculations. Such calculations
4-5

Business Development and Job Expansion Opportunities
made the Energizer group decide to cancel its Gainesville, Florida, lithium-ion plant when they showed that the returns from the new plant would be much lower than for alkaline cells and that Energizer could buy the cells more cheaply than they could make them.
The private sector in the United States is beginning to heed the message that producing batteries for PHEVs and BEVs is an attractive business opportunity in anticipation of the move to electrification of transportation. Toda Kogyo Corporation, a Japanese maker of battery components, bought a factory in Sarnia, Ontario, in 2008 to supply lithium-ion parts in North America, citing the forecast that the demand for lithium-ion batteries will increase exponentially in the next decade and the expectation that automakers will want a proximate source in order to keep tight inventory controls. As mentioned in Chapter 3, EnerDel plans to start building lithium-ion batteries in 2008 and as of today, they have established battery systems manufacturing facilities in Anderson, IN and cell manufacturing facilities in Castleton, IN. Top management describes EnerDel’s position as the only domestic lithium-ion battery producer today as a crucial strategic advantage, pointing out that the battery is 50% of the value of a PHEV and no vehicle company can afford to outsource 50% of a vehicle and still have reliable production.26
The potential for new jobs in the Cleveland area can be illustrated by the following examples of developments in other states:
• Battery manufacturer Electrochem opened a new $30 million, 82,000-square-foot “green” manufacturing facility in Raynham, Massachusetts, in August 2008 that was expected to provide 230 jobs in manufacturing, engineering, and research and development. The company was relocating from a much smaller facility in nearby Canton and planned to retain its employees while expanding in a region with a high concentration of battery and engineering expertise. Partnerships among the Commonwealth of Massachusetts, municipalities, and businesses, including the Commonwealth’s Tax Incremental Financing (TIF) program, were critical to enabling Electrochem to keep all its manufacturing jobs in Massachusetts while adding more as it continued to grow.27
• As of August 2008, EnerDel was eyeing sites in Indiana for expansion of its lithium-ion battery manufacturing operations. The new plant was expected to provide 478 manufacturing jobs paying $19.57 an hour.28
26Source: “U.S. Hybrids Rely on Asian Battery Power,” Justin Hyde, Detroit Free Press, June 22, 2008.
27Source: “Electrochem Opens New $30 Million Manufacturing Plant in Raynham,” Manufacturing Advancement Center (MAC) Web site, August 2008, http://www.massmac.org/newsline/0808/article05.htm.
28Source: “Anderson in Running for Battery Maker and Its 500 Jobs?” Keith Roysdon, Muncie Star Press, August 23, 2008, http://www.thestarpress.com/apps/pbcs.dll/article?AID=/20080823/NEWS01/808230316.
4-6

Business Development and Job Expansion Opportunities
Grid Modernization Systems and Components
U.S. demand for electric transmission and distribution equipment should increase 3.7% annually (including price increases) to $20.6 billion in 2011. Gains will be supported by an improved outlook for nonresidential fixed investment and a rebound in electric utility capital spending. In addition, continued increases in electric generation, by electric utilities and especially by independent power producers, will support demand for transmission and distribution equipment to more efficiently transport that power to the customer. Preventing even faster increases will be the slowdown in construction spending, particularly in the residential segment.
Among product types, the best opportunities will be in meters, driven by the continued expansion of distributed power generation and net metering. Net metering requires more advanced meter products that can measure electricity flow both from the grid and back to the grid. And as noted in Chapter 3, devices that help consumers identify when they are using electricity and what they are paying for it will be in growing demand.
In 2008, the following companies with presence in the Cleveland area were engaged in the development of grid modernization systems:
• ABB Inc.
• Eaton Corporation
• Electro-Mechanical Manufacturing
• General Electric Company
• Hitachi Data Systems Corporation
• Hubbell Inc.
• Itron Inc.
• Mitsubishi Electric Automation
• Philips Electronics North America
• Siemens Energy & Automation
• Square D Company
• Thomas & Betts Power Solutions
These companies could form the base for future job growth as they expand to meet the requirements for grid and electricity connectivity systems.
Summary of Job Growth Potential
Table 4-2 summarizes the potential for job growth in the Cleveland region based on transportation electrification and grid modernization. The new job numbers shown in the table represent only the tip of the iceberg in terms of total new regional jobs that are established as production jobs are created, because each manufacturing job translates into many additional jobs
4-7

Business Development and Job Expansion Opportunities
that support manufacturing industries. Also, it should be noted that the entities presented in Table 4-2 reflect only gross job creation, and do not reflect any job losses that might occur in companies supporting the conventional vehicle industry. More details are provided in EPRI 101857829.
Table 4-2 Potential for Job Expansion in Cleveland Area by 2030 Related to Transportation Electrification and Grid Modernization
Category Facility Capital Cost
Facility Development
Jobs
New Production
Jobs by 2020
New Production
Jobs by 2030
Auto industry suppliers*
None 1138 2238
PHEV plant 1 (1M sq. ft.)
$500M 1000 3000 4000
PHEV plant 2 (750K sq. ft.)
$375M 750 2250 3000
PHEV plant 3 (500K sq. ft.)
$250M 500 1500 2000
BEV plant (600K sq. ft.) $84M 600 800 1000
Battery plant $926M 1200 500 600
Recycling plant $185.2M 600 1000 1200
Infrastructure system supplier**
535 750
Research and development
400
TOTAL 11123 14788
*Based on 13% total increase from current jobs (8761)
**Based on 5% per year increase from current jobs (5477)
The figures in this table are based on the following assumptions:
• PHEVs will represent 60% of new car sales in the United States by 2050, but the job growth will occur from 2010 to 2020 as the automotive industry ramps up to support the new market potential.
• Production jobs available at auto industry suppliers in the Cleveland area will increase 13% by 2020 and grow continuously through 2030.
29 Regional Economic Impacts of Electric Drive Vehicles and Technologies: Case Study of the Greater Cleveland Area. EPRI, Palo Alto, CA: 2008. 1018578.
4-8
Business Development and Job Expansion Opportunities
• Global demand for PHEV technology will support job growth even if fewer man hours are required per car as automation increases. Part of the job growth will occur because technical/engineering support positions will increase as multiple vehicle options and varying platforms are demanded by the consumer.
• Jobs will increase in the companies that are currently developing systems and components that can be modified to apply to electric transportation.
• PHEV production will take place in small, quick-response facilities that may or may not be part of current automotive production facilities. Based on the number of current production facilities in the northeastern Ohio area, three PHEV production facilities of different sizes (1 million square feet, 750,000 square feet, and 500,000 square feet) are projected.
• The market for BEVs will be smaller than the market for PHEVs. A single BEV production facility will be sited in the heart of the Midwest and will employ 800 to 1000 workers, based on the model of the Tesla plant cited earlier.
• One battery manufacturing plant the same size as the Panasonic plant described earlier (US$926 million) and one smaller but more labor-intensive battery recycling plant (with lower wages as a result of lower skill requirements) will be built in the Cleveland area. Both construction jobs and permanent positions will be generated.
• Jobs in infrastructure systems and components will increase by 5% per year for the next 20 years based on the need for infrastructure modernization and the current U.S. commitment to this initiative by the federal government and individual utilities.
• Cleveland area universities should be able to attract a minimum of $10 million per year in state and federal R&D funding for the next 20 years. Of this funding, 50% ($5M per year) will go to research personnel at $150/hour and the remainder will be spent on facilities and hardware.
4-9


5 ACQUIRING FEDERAL AND STATE FUNDING
Federal and state funding will be required to help accelerate the shift to electric vehicular transportation. The focus on energy security, energy efficiency, and reduced fossil fuel consumption motivated the inclusion in the federal Energy Independence and Security Act of 2007 of research, development, and demonstration (RD&D) funding for PHEV and non-road applications. On top of that, the American Recovery and Reinvestment Act of 2009 includes billions of dollars for advanced battery research, battery plant construction, and PHEV tax credits and demonstration programs. It behooves the northeastern Ohio region to be active in the solicitation of such federal funds.
It is hard to see how the federal government will be able to meet the publicly stated and authorized funding commitments it has made since 2006. The financial issues the country is facing will place constraints on many federal government spending objectives. This does not mean no federal funding will be forthcoming, but the competition for the dollars available will be intense. Thus, state and regional commitment to advanced transportation and grid modernization projects, and cooperation and coordination amongst stakeholders, will be critical to gain a competitive advantage in the pursuit of federal funds.
Funds Available from the Federal Government
The primary source of federal funds for vehicle electrification will be the U.S. Department of Energy (DOE), even though some funds have historically been available from the U.S. Environmental Protection Agency (EPA) for truck-stop electrification and from the Federal Transit Administration (FTA) for hybrid and plug-in hybrid demonstration programs. DOE funding has been authorized in the Energy Independence and Security Act of 2007, although significant work will be required in a new Congress to ensure that a high level of funding is actually appropriated.
The Energy Independence and Security Act of 2007, under Subtitle B—Improved Vehicle Technology—provides significant funding for advanced battery, electric drive, plug-in hybrid, and fuel cell vehicle development. In particular, Section 131, Transportation Electrification, authorizes the creation of a grant program supporting projects to encourage the use of plug-in electric drive vehicles or other emerging electric vehicle technologies, and also provides funding for non-road electrification. We will briefly review details of the non-road electrification portion of the act for the insight it provides into the breadth of funding available to address this specific market opportunity. A strategy to acquire a portion of these funds is highlighted in the last chapter of this report.
5-1

Acquiring Federal and State Funding
The Act defines non-road electrification as “any equipment relating to transportation or mobile sources of air pollution that use an electric motor to replace an internal combustion engine for all or part of the work of the equipment, including (1) corded electric equipment linked to transportation or mobile sources of air pollution; and (2) electrification technologies at airports, ports, truck stops, and material-handling facilities.” It defines non-road vehicle as “a vehicle powered by a non-road engine, as that term is defined in section 216 of the Clean Air Act (42 U.S.C. 7550); or fully or partially by an electric motor powered by a fuel cell, a battery, or an off board source of electricity.”
It further defines qualified electric transportation project as “an electric transportation technology project that would significantly reduce emissions of criteria pollutants, greenhouse gas emissions, and petroleum, including
• Shipside or shoreside electrification for vessels.
• Truck-stop electrification.
• Electric truck refrigeration units.
• Battery-powered auxiliary power units for trucks.
• Electric airport ground support equipment.
• Electric material and cargo handling equipment.
• Electric or dual-mode electric rail.
• Any distribution upgrades needed to supply electricity to the project.
• Any ancillary infrastructure, including panel upgrades, battery chargers, in-situ transformers, and trenching.”30
A second example of federal funds available to expand RD&D of non-road electrification is the ongoing initiatives developed by the EPA to support the reduction of non-road emissions. The EPA has supported the development and installation of truck-stop electrification since 2003.
Occasionally the EPA issues grants to states and nonprofit organizations to demonstrate truck and locomotive idle-reduction technologies. To date, the EPA has funded demonstration of both onboard and off board idle-reduction technologies for projects in the following states: Arkansas, California, Illinois, Indiana, Massachusetts, Missouri, New York, North Carolina, Oregon, and Washington. In 2008, the EPA announced $5 million in grant awards to reduce truck engine idling by deploying a wide variety of idle-reduction technologies on trucks and at truck stops across the nation.31
30Source: Energy Independence and Security Act of 2007, Section 131. 31Source: “Idling Reduction: Innovative Funding and Incentive Opportunities,” SmartWay Transport area, EPA Web site, http://www.epa.gov/SmartwayLogistics/transport//what-smartway/idling-reduction-innovative-funding.htm.
5-2

Acquiring Federal and State Funding
Funds Available from State Governments
Two recent examples show the kind of commitment required from states to supplement federal funds:
• In March 2008, the Ohio Third Frontier Commission awarded more than $12 million in grants to 17 entities to accelerate the development and growth of the advanced energy industry in Ohio. Awards recipients were selected from the wind, solar, alternative fuel, energy storage and instruments, controls, and electronics sectors. 32
• As part of a bipartisan economic stimulus package (House Bill 554) passed in Ohio in May 2008, the Ohio Air Quality Development Authority (OAQDA) was given the task of designing and managing an $84 million advanced energy loan and grant program. The program was intended to further the growth of the advanced energy industry in Ohio.33
Another example of state funding is a program initiated in California to fund RD&D of technologies that will assist the state in achieving significant reduction of carbon emissions by 2050. With its strong emphasis on carbon emission reductions and desire to switch away from fossil fuel, the state of California has been proactive in its efforts to create incentives for the development of alternative fuels, including electricity. Such incentives have included non-road applications. For example, the passage of AB 118 authorized funding for the California Air Resources Board and the California Energy Commission to allocate to projects that reduce petroleum consumption and greenhouse gas emissions via alternative fuel technologies, including electricity, in on-road and non-road markets.
As other states adopt similar funding programs, their support will build momentum behind electric transportation in general, and will directly benefit new projects. At the same time, their presence at the table will also represent new competition for the limited matching federal dollars.
Midwestern Regional Cooperation: A Long-Term Goal
When a Northeast Ohio Transportation Electrification Alliance has been established as suggested in Chapter 3 and a strong job development initiative has begun, development of regional collaboration can extend the value of these efforts and ensure long-term sustainable growth.
Michigan, Indiana, and Ohio have a cooperative agreement to nurture and develop regional business, but all jobs are “local.” However, the market potential for EV technology in the United States and, equally important, for export is so large that if possible it makes sense to collaborate with regional neighbors. One example would be the Michigan chemical industry providing raw materials to an Ohio firm that makes the components that are inserted into batteries at a plant in Indiana.
32“Fisher Announces $12 Million for Advanced Energy Grants,” Ohio Department of Development press release, March 25, 2008, http://www.odod.state.oh.us.
33Ohio Job Stimulus Package—Advanced Energy Program Web site, http://www.ohioairquality.org/advanced_energy_program.
5-3

Acquiring Federal and State Funding
Collaboration is difficult when one considers varying state regulations, politics, investment, and competition between universities for R&D dollars. A regional initiative will require very open-minded state governors—but in the long run it can be well worth the effort. Regional powerhouse industries become global leaders. Small local competitors remain marginal.
5-4

6 STRATEGIC ACTIONS FOR STAKEHOLDERS
To participate in the shift to electricity as the transportation fuel of choice, all stakeholders including business, government at all levels, universities, planning and economic development organizations, environmental advocates, and utilities must be proactive and even aggressive. This chapter suggests strategic actions that can be undertaken by stakeholders individually or collaboratively. These suggestions require careful consideration and expansion. They are not definitive but rather represent suggested steps in the right direction.
Regional Actions
Regional actions should be planned based on the population density and industrial base that exists in the region. With the strengths detailed earlier in Chapter 2 of this report, Cleveland and its eight-county region are in an ideal position to take actions that can reap near-, mid-, and long-term benefits from transportation electrification. Such actions should provide incentives for electric vehicle deployment, infrastructure deployment, and demonstration projects.
In this regard, California can serve as a role model. As highlighted in the discussion in Chapter 5, California has passed laws to support carbon emissions reduction and the development of alternative energy for homes, commercial buildings, and transportation. California has asked multiple stakeholders for advice and input on specific actions that the state could take to achieve its carbon and emission reduction goals. In response, the California Electric Transportation Coalition (CalETC), a coalition of utilities and electric transportation businesses in California, has suggested a number of strategic steps. Several of these recommendations, involving vehicle and infrastructure deployment and demonstrations, are outlined below as a model that the Cleveland area might follow.
Vehicle Deployment
Of course, the cost of early generation electric vehicles will be higher unless and until scale of volumes of production are achieved. The following actions would create incentives for early adopters to purchase on-road and non-road electric vehicles:
• Consumer incentives in the form of vehicle incremental cost buy-down grants from $3000 to $6000 per vehicle, depending upon battery pack capacity, could be offered for the purchase of on-road PHEVs and EVs. These incentives, which would be in addition to the tax incentives established in the Emergency Economic Stabilization Act of 2008, are recommended for consideration by the region to stimulate the acquisition of electric drive vehicles.
6-1

Strategic Actions For Stakeholders
• Consumer loan guarantees and/or low-interest loans could be offered for the purchase of non-road electric vehicles and equipment, including truck stop electrification, electric standby truck refrigeration units, cargo handling equipment, airport ground support equipment, lift trucks, burden and personnel carriers, tow tractors, turf trucks, sweepers, scrubbers, and electric lawn and garden equipment.
Infrastructure Deployment
Consumer adoption of electric vehicles will be slowed if there is insufficient charging infrastructure. The following actions would create incentives for the deployment of infrastructure to enable rapid market penetration:
• Incentives in the form of buy-down grants not to exceed 5% of the total cost of purchase and installation could be offered to encourage deployment of on-road PHEV and EV infrastructure in apartment and other multifamily buildings, and installation of public electric vehicle connection infrastructure (including plug ports, wiring, charging equipment, voltage regulation, sub-panels, and time-of-use metering equipment).
• Consumer incentives in the form of buy-down grants not to exceed 50% of the total cost of purchase and installation could be offered for non-road electric vehicle and equipment infrastructure (including wiring, charging equipment, voltage regulation, and sub-panels).
• Carbon or investment credits flowing back to the utility and/or the electric vehicle consumer or general ratepayer could be offered to offset the cost of the vehicle and infrastructure.
Demonstrations
Demonstrations generate information that can be provided to potential purchasers of equipment so they can make a wise procurement decision. Demonstrations of advanced PHEVs, non-road electric transportation applications, and smart infrastructure could be incentivized as follows:
• Funding could be provided to help buy down the incremental vehicle cost of demonstration projects that place advanced prototype plug-in hybrid or electric on-road vehicles in extended fleet use. Demonstrations should be categorized by vehicle size and application into medium-duty and heavy-duty fleet vehicles and light-duty passenger vehicles.
• Funding could be provided for cost-shared development and demonstration activities utilizing existing commercial technologies in new equipment or new applications to expand the market for non-road electric transportation applications where either commercial products do not exist (for example, Class III electric lift trucks, electrified container loaders) or existing products have not been proven.
• Funding could be provided for cost-shared demonstrations of plug-in hybrid and electric vehicles implementing “smart charging” technology where communication between the electric grid and the vehicle facilitates the scheduling of vehicle charging, establishes remote billing opportunities, tracks electricity as a transportation fuel, and enables demand response and other grid-enhancing activities.
6-2

Strategic Actions For Stakeholders
Utility Preparation
A strong public-private partnership between consumers, policy stakeholders, and regional electric utilities will catalyze the electrification of transportation. We believe that the critical path to the successful commercialization of PHEV and BEV technology is based upon the availability and ease of use of the electricity infrastructure. Electricity must match and exceed the convenience of gasoline by offering home refueling, a positive convenience not available in the gasoline industry.
Enabling transportation electrification will be dependent upon the ability of the electricity infrastructure to modernize and be as available for transportation as fossil fuel is today. The utility industry, with support from government agencies, must proactively take ownership of and prepare for the transition to electricity as the fuel of choice. Key actions include the following:
• Communicate with the automotive industry at the executive level to clarify market introduction objectives, penetration projections, charge profiles, safety needs, and the like.
• Educate utility executives and personnel regarding PHEV and BEV technology, with special focus on infrastructure and advanced battery developments.
• Conduct infrastructure audits to determine utility system capabilities and to formulate requirements based on projected volume. Establish an infrastructure preparation strategy for near-term home recharging and mid-term public access charge ports on streets and at commercial and public buildings. Prepare for future demand for “quick charge” and battery exchange systems.
• Establish a research focus that generates technical know-how as well as knowledge of the value-added benefits that can flow to the utility as the transition occurs. For example, focus on use of advanced batteries—new and secondary—to combine with solar and wind systems distributed routinely to consumer and commercial applications.
• Participate in EPRI’s Program 18, Electric Transportation, to link smart grid advances to intelligent vehicle demonstration and standards development programs.
• Analyze the potential for greenhouse gas and criteria pollutant emission reduction and establish an emission monitoring and credit team.
• Establish demonstration systems to define technology internally and externally to prepare to support customer satisfaction requirements.
• Develop a consumer education campaign to provide the necessary safety assurances.
State Government Actions
The Western Governors’ Association created an initiative to look carefully at alternative fuels and develop recommendations that could be executed by the individual states to expand the use of alternative fuels. A panel reviewed a wide range of fuel options, including hydrogen, biofuels, natural gas, and electricity. The electricity team included Toyota, national labs, Southern California Edison, Arizona Public Service, and EPRI. The full report is available online from the
6-3

Strategic Actions For Stakeholders
Western Governors’ Association Web site.34 Highlights from the electricity task force recommendations that are applicable to the Cleveland area are as follows.
Near-Term (Within 3 Years)
• Support federal, state, and local demonstrations of PHEVs, BEVs, and non-road electrification by public and private entities.
• Revise government fleet purchasing programs to provide market certainty to manufacturers and promote technology demonstration.
• Include fleet purchase requirements that set fuel consumption and emission requirements to promote early purchases of PHEVs. Ensure that corporate average fleet economy (CAFE) standards recognize PHEVs/EVs in alternate fuel standards.
• At the state and local level (financial and regulatory agencies), provide incentives for consumers, including preferential tax treatment and parking benefits, such as plug-in parking slots with parking structures powered by renewable energy.
• Establish federal and state manufacturing incentives to mitigate the risk of new product development and promote domestic industry and employment.
• Offer employee training, retention, and attraction programs to prepare the current and future workforce to support electric drive technology development.
Mid-Term (3–10 Years)
• Continue and extend state and local incentives to build markets and consumer acceptance for vehicles using electric fuel, including tax incentives for consumer and private fleet purchases and investment incentives for vehicle and advanced component manufacturers.
• Commensurate with vehicle penetration, establish incentives for installation of infrastructure (utility and private)—for example, at work sites, multifamily housing, and so forth. (Please see “Utility Preparation” above.)
• Support local government investment in public infrastructure, such as public lots with recharging units, with an emphasis on renewable-source refueling projects.
• Establish professional education and training infrastructure for engineers, mechanics, educators, and first responders, including courses that focus on PHEV/EV development.
Long-Term (More Than 10 Years)
• Convene a long-term strategic team to develop and disseminate an energy vision for 2050. The vision would include a state and regional blueprint for electrifying the transportation sector, including community planning, increased grid integration, and market penetration
34 Western Governors’ Association, Transportation Fuels for the Future, February 2008, http://www.westgov.org/wga/publicat/TransFuels08.pdf.
6-4

Strategic Actions For Stakeholders
scenarios and impacts. The plan would include a comprehensive review of raw material available in the United States for advanced batteries and related technology.
• Implement state and regional business attraction programs; coordinate with members of Congress in efforts to promote investment in electric drive vehicle–related industry within their states and regions.
• Increase state and federal cooperation with the automotive and battery industries to develop demonstration partnerships, such as deployment of prototypes and insertion of advanced batteries into fleets of demonstration vehicles.
• Increase state-level cooperation with utilities, financial institutions, and others to develop new mechanisms to mitigate the up-front cost of PHEVs.
Federal Government Actions
The federal government has included significant funding in the American Recovery and Reinvestment Act of 2009 for electric transportation. It must continue establishing policy that ensures R&D funding to motivate and demonstrate a long-term national commitment to the electrification of transportation. It is imperative that the Cleveland region establish a collaborative team from industry, environmental organizations, and governing agencies to send a strong message to Congress that even in difficult financial times, transportation electrification should be a priority.
Here are some specific actions the federal government should be encouraged to take:
• Develop a transition strategy that uses energy policy, public discourse, and financial investment to move the U.S. transportation system to electricity as the fuel of choice.
• Establish a federal-level task force to define an electricity infrastructure of the future that enables the application of energy-efficiency technology improvements and achieves connectivity with the intelligent electric vehicle being developed by the industry for 2010 introduction.
• Align with the utility industry and state public utility commissions to establish an equitable “electricity-as-a-fuel” tax and tax process so that state and federal highway infrastructure grows in value rather than deteriorating as we move from fossil fuel to electricity.
• Pursue Department of Energy research with a bias toward electricity as the fuel of choice. Research should focus on infrastructure modernization, use of advanced batteries in multiple applications (vehicle and distributed energy storage), communication and connectivity issues, and the development of energy efficiency technologies such as advanced motors that can be applied in automotive and industrial/commercial applications. This action does not forego the development of more efficient engines and alternative fuels, because these technologies become an integral part of the continuous product improvement that can occur with PHEVs that operate on electricity and hybrid internal combustion as required.
• Support development of plug-in fuel cell hybrid vehicles to prepare for the longer-term transition from gasoline-powered PHEVs to hydrogen-powered PHEVs.
6-5

Strategic Actions For Stakeholders
• In cooperation with state governors and the utility industry, establish a program that audits the nation’s electricity infrastructure, creates the investment resources necessary to modernize this infrastructure, and, most important, establishes an education campaign to bring this value directly to the consumer.
• Develop a program that provides incentives to the utility industry or other means to make the necessary capital investments immediately to prepare for this shift, perhaps in the form of infrastructure investment tax credits, green electricity rates, and/or carbon credits.
• Convert government-owned and financed automotive and medium-duty truck fleets to plug-in and battery electric technology through ensuring that these comprise a minimum of 15% of the vehicles acquired per year from 2010 to 2015.
6-6
7 CONCLUSION AND KEY RECOMMENDATIONS
Preparing for the shift to electricity as the transportation fuel of choice will not be easy. Without leadership and commitment, it will be very difficult to transition to an economy in which electricity replaces fossil fuel. Decades were spent developing the gasoline infrastructure as we know it today, but we do not have decades to transition to tomorrow’s infrastructure. Focused public-private leadership is necessary to meet tomorrow’s needs.
Chapter 6 emphasized regional, state, and federal actions that should be initiated to enable the Cleveland region to recognize the economic, social, and environmental benefits of a shift to electric transportation. This final chapter narrows this list of actions to a critical few and provides a schedule with the objective of creating near-term momentum.
Keys to the Future
The economic challenges facing the United States currently and for the foreseeable future should compel the Cleveland region to implement a transportation electrification strategy with the resources currently available, R&D funding from state and federal sources aside. The keys to the future will be speed, collaboration, use of existing resources, and employee development.
• Speed—The region must not hesitate but must act immediately to find the necessary leadership, form the collaborative teams, and execute a very focused strategy for those teams as described in this section. Development of research centers must begin, and research funds should be applied for immediately and allocated to existing research facilities (such as universities and the NASA Glenn Research Center) and industry partners within the region.
• Collaboration—Collaborative teams should be created with representation from industry, labor, academia, utilities, environmental, economic development, and public policy organizations. The teams should be focused in three specific areas: (1) electric transportation industrial product development and company attraction, (2) R&D technology targets and funding acquisition, and (3) government engagement.
• Use of existing resources—There is not enough time or money available to develop new resources, but fortunately the Cleveland area already has the intellectual capital, the experience, and the industrial base to execute a plan immediately. For instance, economic development or governmental affairs personnel from leading regional organizations and industries (such as Team NEO, The Cleveland Foundation, GM, Eaton Corporation, FirstEnergy, and the City of Cleveland) can collaborate on this initiative as they have in working on previous economic development matters. Combining the existing research capabilities at NASA Glenn and the key regional universities would make a very strong team with the potential to find external support.
7-1

Conclusion And Key Recommendations
• Employee development—An employee training program must be developed to prepare existing and future employees to take advantage of the job opportunities that will become available as electric drive technology enters the marketplace. An Ohio Wright Center of Innovation could be structured through existing Ohio universities to help address this important requirement.
Critical Path Action Steps
Figure 7-1 illustrates the immediate actions that need to proceed from the formation of collaborative regional teams if the Cleveland area is to reap all the potential benefits of transportation electrification.
Establish Federal & State Communication
Decide Multi-state
Collaboration ?
Determine Region Competitive Advantage
Develop Federal & State
Proposals
Develop & Execute Education Campaign
Immediate Actions
Form Collaborative
Regional Team
Figure 7-1 Immediate Actions Proceeding from Formation of Regional Teams
These are the critical path action steps that must be taken:
• Select a leader who currently holds a major industry or government post or is recently retired but widely-recognized and respected.
• Establish collaborative teams, such as those proposed above.
7-2

Conclusion And Key Recommendations
• Execute an education campaign in all sectors—citizens, companies, and government agencies.
• Review and select the focus technologies for the region. This report presents some ideas but not a final selection.
• Aggressively pursue state and federal R&D funding. Move immediately to attract state matching funds to use to apply for federal R&D funding in conjunction with area universities and NASA Glenn.
• Urge congressional appropriation committees to fully fund the PHEV and R&D investments that were authorized in 2008.
• Aggressively pursue battery plant production in the area, with funding coming from the Energy Independence and Security Act of 2007.
• Identify infrastructure investment opportunities in northeastern Ohio that qualify for funding under the American Recovery and Reinvestment Act of 2009, such as truck stop electrification, port and airport electrification, and transit system projects. Align with the area’s congressional representatives to ensure that these projects receive funding.
• Conduct a readiness assessment of the electricity infrastructure, develop a PHEV modernization plan, and integrate with smart grid programs that can receive federal funding.
• Engage with senior management of those companies developing PHEV and BEV vehicles, especially those already manufacturing in the region. Establish a working relationship between automotive industry executives and regional stakeholders to develop a program that supports their movement to clean technology vehicles. Join with the industry to begin a clean technology development and production program in northeastern Ohio.
• Make a commitment to government acquisition of PHEV and BEV vehicles.
Key Recommendations for the Near Term (2009–2020)
Figure 7-2 shows the beginning of a timeline for identifying R&D opportunities along with potential new products and new businesses and for applying for federal and state funds.
7-3

Conclusion And Key Recommendations
20102009
Tax Credits, Emissions Credits, Relocation Support
Export
US Consumption
Job Growth
EconomicProsperity
Sup
port
ing
Fac
torie
s
2020 20122011 2015
Technology Commercialization
Product Development
Plant Capital
New Business Attraction
New Business
Identification
Spin-Off Current
Products
Product Opportunity
Review
Technology R&D
Funding
Technology Identification
Federal & State
Contracts
Federal & State
Proposals
Fin
anci
al In
cent
ives
Auto Flexible Mfg
Niche Auto Prod.
Battery Mfg
Battery Recycle
Grid Modernization
Figure 7-2 Near-Term Timeline for Identifying Opportunities and Pursuing Funding
Here are our key recommendations for action during the 2009–2020 period:
• Educate leaders, businesses, and citizens—Education that defines the current challenges, highlights the opportunities, and teaches leaders how to benefit from these opportunities is the most important first step and can be achieved with minimum resource expenditure. Education must not be presentation-based but must be interactive and collaborative, with the objective of moving from discussion to immediate action.
• Proactively identify and establish electrification businesses—This report only suggests a direction for determining potential business opportunities. Forums should be established for all stakeholders to conduct high-level discussions on types of electrification businesses that might be needed. Automotive and utility executives must provide a document specifying near-, mid-, and long-term requirements so the research and supply communities can develop the necessary strategy to meet these requirements. We cannot emphasize enough the need for senior-level communication to bring trust and confidence to the initiative.
• Aggressively solicit federal and state funding—The Cleveland region must come together to become a strong player in the acquisition of state and federal dollars. Collaborative teams need to be developed immediately to identify funding sources and those opportunities that offer the region a competitive advantage. The teams must include manufacturing, unions, energy suppliers, environmentalists, and public agencies.
• Leverage the future to finance current infrastructure modifications—Grid modernization will drive efficiencies in all manufacturing sectors. Modernization requirements—technological and financial—must be identified and addressed by the public
7-4

Conclusion And Key Recommendations
and private sectors. A pathway to the future must be envisioned clearly enough to attract federal and state funding, research focus, and capital investment by companies.
As part of this step, the current electricity transmission and distribution infrastructure in the Cleveland area should be evaluated to assess its capability to support a PHEV, BEV, and non-road electrification demand. A strategic plan should be prepared in order to execute the audit recommendations. The infrastructure should be assessed from the following perspectives:
– initial connection for PHEVs and BEVs, with homeowners requiring safety and connection education
– development of public plug access for those who do not have access to home infrastructure
– development of connectivity systems that enable remote billing and time-of-use charging (smart-car-to-intelligent-grid connectivity)
– fast-charge access in shopping malls and other major traffic locations
– non-road infrastructure such as providing communication systems and charger technology at airports and ports
– review of the value/opportunity for PHEV and BEV battery systems to be an integral component of wind and solar systems
• Develop a collaborative strategy in meetings between state governors—Competition between Midwestern states and between regions in the states will be devastating. We cannot emphasize enough our earlier comment that cooperation breeds large international business opportunities. We recommend that when Cleveland has established its transition efforts, the region work with the state to engage with other state governors to develop a collaborative strategy.
• Launch an awareness campaign—Awareness campaigns and education seem to be obvious tools to help with the shift to electric transportation. However, crafting the message and determining the individual to carry the message cannot be taken lightly. The message must be heard not only by the stakeholders most directly involved but equally by the consuming public that will be asked to adjust to the shift. For instance, customers need to understand that adaption of EDVs will cause their electricity bills to increase, although by less than their expenditures on gasoline will decrease.
• Provide cash buy-down grants—A State of Ohio grant program should be developed that establishes a consumer incentive to purchase on-road and non-road electric vehicles. The grant should be in the form of a $3000 to $6000 cash purchase rebate.
• Start a non-road electrification education campaign—A non-road electrification education campaign should be launched to increase awareness to the value of electrifying non-road equipment and identify potential financing to support the acquisition of electric drive systems in all non-road applications.
• Demonstrate PHEV and BEV technology—The automotive industry development of these technologies should be supported by mini-fleets of PHEV and BEV vehicles. These mini-fleets should be given high visibility and the operating results should be published, with the
7-5

Conclusion And Key Recommendations
goal of reducing new technology concerns. The operating data should be sufficiently convincing to motivate full fleet acquisition by regional businesses and governments and the consuming public. The information obtained should be used to raise public awareness of the technology.
The urgency of implementing these recommendations has only increased with the significant changes that have occurred nationally and locally since the scope of work was developed for this project. A new president has been elected with a different energy vision, the country has entered a recession with little sign of relief, and as a result of the recession and credit problems the automotive industry is facing very difficult circumstances. The automakers’ woes are directly affecting the Cleveland area’s automotive plants and large auto supplier base. Transportation electrification is a promising solution to all of there challenges.
7-6