Embed Size (px)
Citation preview

1 | Cleopatra Hospitals Group 3Q2018 EARNINGS RELEASE
Cleopatra Hospitals Group S.A.E. 3Q2018 EARNINGS RELEASE
Cairo, Egypt | 04 December 2018
Cleopatra Hospitals Group Reports 3Q2018 Results
3Q2018 Financial & Operational Highlights1 9M2018 Financial & Operational Highlights
Cairo, 04 December 2018
Cleopatra Hospital Group S.A.E. (CLHO.CA on the Egyptian Exchange), Egypt’s largest private hospital group by number of
hospital beds and number of operating hospitals, reported today its consolidated results for third quarter ended 30 September 2018.
The Group saw its consolidated revenues climb 32% y-o-y to EGP 388.3 million during the quarter. This rapid growth comes as the
Group continues to reap the benefits of higher volumes, favourable pricing and an optimum case mix. The volume of cases served
increased at a steady pace during the period, adding further momentum to revenue growth. Net profit for 3Q2018 stood at EGP 91.6
million, a 186% y-o-y expansion. CHG’s net profit margin expanded by 13 percentage points during the period to record 24% during
3Q2018. This notable upswing in profitability comes as the Group begins to reap the benefits of its cross-asset integration program
and persists in fostering efficiencies across the full breadth of its operations.
On a year-to-date basis, Cleopatra Hospitals Group saw revenues expand by 30% y-o-y to record EGP 1,062.1 million in 9M2018.
Net profit stood at EGP 225.0 million in 9M2018, up 166% y-o-y and yielding a net profit margin of 21%. The Group’s hospitals
served 671,600 cases during the first nine months of 2018, representing a 6% increase compared to 9M2017. CHG maintained
impressive rates of volume and revenue growth despite the partial closure of Cairo Specialized Hospital (CSH), one of its four
institutions, for renovations during the first half of 2018.
In parallel with this release, Cleopatra held an Ordinary General Meeting (OGM) and Extraordinary General Meeting (EGM) in
order to move forward with the addition of two new hospitals to the Group’s platform, and for an amendment to Cleopatra’s Articles
of Associations for the addition of two new board members: Mr. Tarek Kabil and Ms. Samia El Baroudy.
Commenting on Cleopatra Hospitals Group’s performance for 3Q2018, Chief Executive Officer Ahmed Ezzeldin said:
“The Group’s performance in the third quarter of 2018 continued on the very promising path we had embarked on during the first
half of the year. During the quarter, we made significant progress on multiple fronts, leveraging our strong cashflow to deliver on
our long-term growth strategy. The 32% y-o-y top-line growth we saw during the quarter is an encouraging indication that the Group
is heading in the right direction, and is testament to the effectiveness of our comprehensive, long-term rationalization program that
has seen our revenues more than double on an annualized basis between 2015 and 2018. In line with our goal of providing the
highest quality healthcare and superior clinical outcomes, CHG has not stood still when it comes to enhancing the quality and variety
1 EBITDA, Earnings before Interest, Tax, Depreciation and Amortization adjusted for provisions, impairments, LTIP, acquisitions expenses and excluding
contributions from other income.
Cases served includes number of in-patients, outpatient visits and ER visits.
EGP 388.3 million
Total Consolidated
Revenue (+32% y-o-y)
EGP 114.1 million
Adj. EBITDA
(29% margin)
EGP 91.6 million
Net Income
+186% y-o-y
(24% margin)
+233,723 Cases Served
(+6% y-o-y)
EGP 1,062.1 million
Total Consolidated
Revenue (+30% y-o-y)
EGP 283.3 million
Adj. EBITDA
(27% margin)
EGP 225.0 million
Net Income
+166% y-o-y
(21% margin)
+671,600 Cases Served
(+6% y-o-y)
2 | Cleopatra Hospitals Group 3Q2018 EARNINGS RELEASE
Cleopatra Hospitals Group S.A.E. 3Q2018 EARNINGS RELEASE
Cairo, Egypt | 04 December 2018
of the services and procedures offered by its institutions. We continued to strengthen our position as an industry-leader in
cardiovascular intervention services, pushing forward our Centres of Excellence model with the inauguration of a new
catheterization lab at Al Shorouk Hospital. I am also pleased to report that our polyclinic model is on track to launch in during the
first quarter of 2019 and is expected to add to our ability to reach even more patients across Cairo.”
During the third quarter of 2018, Cleopatra Hospitals Group served a total of 233,723 patients, 6.1% more than in 3Q2017. This
uptick in patient volumes was driven by a 7.3% increase in the number of outpatient visits during the quarter. CHG admitted a
growing number of patients despite a partial closure at one of its four facilities, Cairo Specialized Hospital, where the intensive care
unit, operating rooms and other spaces were undergoing renovation. Growing caseloads at the Group’s hospitals were balanced by
an upward adjustment in price points. This approach has allowed CHG to capture greater value from its portfolio of services and
procedures: 3Q2018 saw year-on-year increases of more than a fifth in average revenue per outpatient (21.7%), more than quarter
in average revenue per inpatient (25.6%), and more than a third in revenue per surgery (36.4%). Meanwhile, management continued
to foster operational efficiencies through favourable cross-asset procurement programs and the renegotiation of terms with
consulting physicians, coupled with the streamlining of internal processes and investments in technology. Gross profit for 3Q2018
recorded a 56% y-o-y increase to EGP 142.1 million, yielding a six percentage-point improvement in gross profit margin to 37%.
On a year-to-date basis, CHG’s gross profit rose by 49% y-o-y to reach EGP 365.1 million during 9M2018, with the gross profit
margin climbing four percentage points to 34%.
Profitability from core operations grew impressively during the period, with EBITDA up 63% y-o-y to EGP 114.1 million in
3Q2018, and the Group’s EBITDA margin expanding by five percentage points to 29%. On a year to date basis, 9M2018 saw CHG
post an EBTIDA of EGP 283.3 million, growing 54% y-o-y to yield an EBITDA margin of 27%. EBITDA growth during the nine-
month period was buoyed by an impairment reduction amounting to EGP 10.3 million during the second quarter of 2018, the
culmination of management’s efforts to improve the quality of CHG’s receivables, upgrade collection processes, and conservatively
write-off bad debts.
During the quarter, the Group completed the renovations to Cairo Specialized Hospital’s façade. This is yet another step taken
towards completing the extensive renovations that the Group has been carrying out at CSH over the last several quarters. The
hospital now hosts new operating rooms and ICUs alongside the fully renovated façade. Over the coming months, renovations will
focus on patient rooms and the hospital’s entrances. During the next phase of renovations at CSH, the Group will be working closely
with a leading German multidisciplinary engineering consultancy firm that will also be in charge of renovating the interior of its
other hospitals in addition to the work being done for the Al Shorouk Hospital’s extension and the Group’s Beni Suef project.
“The third quarter saw us integrate Group medical committees into our platform as an important milestone to launching the CHG
Medical Council. Each of the committees oversee different aspects of the Group’s operations, ranging from care quality and patient
safety, and infection control, to more bureaucratic aspects revolving around accreditations and ethics. The integration of these
committees brings us closer to strengthening our internal infrastructure and enhancing our internal accountability, enabling the
Group to continue to provide the highest quality medical services.” Ezzeldin concluded.
—Ends—

3 | Cleopatra Hospitals Group 3Q2018 EARNINGS RELEASE
Cleopatra Hospitals Group S.A.E. 3Q2018 EARNINGS RELEASE
Cairo, Egypt | 04 December 2018
Operational Review During the third quarter of 2018, Cleopatra Hospitals Group continued to make progress on its cross-asset integration program, focusing on improving service quality, clinical outcomes and overall patient experience. Key highlights included the continued investment in infrastructure and technology upgrades, standardization of information technology frameworks, rollout of new quality control and reporting initiatives, initial steps to grow the Group’s client base particularly from medical tourism as well as supporting human resources development. During the summer months, CHG operated an in-house clinic at a bustling development along the North Coast, a region where adequate medical care is in demand during its high-season. CHG filled a much needed supply gap in the area, providing much-needed ER services, an ambulance and first-aid along the beach. Infrastructure and Technology Total CAPEX additions across CHG’s four hospitals reached EGP 120 million in the first nine months of 2018. These include the recent investments undertaken at Al-Shorouk Hospital, which saw the delivery of a new cardiac catheter lab, along with multiple other new medical equipment and machinery at Cleopatra Hospital where a new ESWL machine was installed and a new X-ray machine is expected to be delivered in the fourth quarter. To complement the investment in new medical equipment, CHG has also been working on improving its infrastructure. During the quarter, important steps were taken towards the completion of the renovations being undertaken at CSH. The hospital now has new operating rooms, ICUs, and a newly renovated façade. In the coming months, renovations will focus on improving patient rooms and the Hospital’s entrances. During the first three quarters of the year, the group has completed purchase orders for nearly EGP 57 million of medical capex and is expecting to spend another EGP 6.8 million before the end of 2018. Information Technology During the quarter, the Group made progress on the rollout of its Group-wide HIS /Enterprise Resource Planning (ERP) system. The Clinisys HIS/ERP system at CSH was launched on 1 October of this year and, once rolled out across the Group’s network of hospitals, is set to improve its data management and backup framework while guaranteeing the protection of patients’ personal data and improving the Group’s inventory management and purchasing processes. The Unified Patient Medical record framework is fully functioning across all departments, with all front and back office modules fully running. Clinisys will be next rolled out at the East & West Polyclinic in January 2019, with Group-wide adoption of the system expected by January 2020. The management is now working towards an implementation plan across the rest of the hospitals. CHG is also in the final phases of kicking off its mobile application platform which will enable patients to access their files, history in addition to booking features. Quality Enhancement Delivering the highest quality services is at the forefront of the Group’s operational strategy. The Group witnessed significant improvements across all medical and non-medical KPIs during the quarter, a testament to its efforts in ensuring it delivers the best possible patient care. As such, the third quarter saw the Group set out plans for the development of the CHG Medical Council and Board. Its committees will comprise of renowned specialised consultants from the Group’s hospitals with the objectives of ensuring further improvements in direct patient care, developing centres of clinical speciality excellence, organizing professional development training for all Group staff members, while working towards adding new medical services to the Group’s service offering. The Council will also work towards obtaining the JCI accreditation in line with the Group’s objective of becoming a centre of operational excellence. The target is to have a fully operational CHG Medical Council by 1Q 2019. The Group also retained the services of a world-class external engineering consultancy firm, Vital Konzept, who will assist in the renovations of CHG’s hospitals.
9,6
36
9,3
31
3Q2017 3Q2018
# of Surgeries(Rev/surgery)
14
6,28
9
15
7,01
4
3Q2017 3Q2018
# of OP Clinic Visits(Rev/visit)
12
,945
12
,627
3Q2017 3Q2018
# of Inpatients(Rev/stay)
61
,145
64
,082
3Q2017 3Q2018
# of ER Visits(Rev/visit)
EGP 8,851
EGP 274 EGP 333
EGP 6,140 EGP 7,714
EGP 266 EGP 208
EGP 6,488

4 | Cleopatra Hospitals Group 3Q2018 EARNINGS RELEASE
Cleopatra Hospitals Group S.A.E. 3Q2018 EARNINGS RELEASE
Cairo, Egypt | 04 December 2018
Human Resources The Group continued to invest in the professional and personal skill development of its staff with over 378 cumulative days of training across the Group’s four hospitals involving more than 324 employees. The training focused on enhancing the patients’ safety and quality of care with courses such as: Advanced and Basic Life Support (ALS & BLS), International Life Saving (ILS), Apples & Oranges Healthcare and Business Etiquette for nurses. During the quarter, the Group launched a new Training Needs Analysis to ensure that the training delivered continues to be focused on key development areas. In line with the Group’s efforts to fully automate its HR practices, two new modules were launched in 3Q2018. The first, which covers recruitment, introduced a new applicant tracking system alongside a consolidated database to gather, analyse and manage incoming applications. The second, which focuses on training and aims to analyse the ROI of training, successfully saw the full upload on training data for 2017 and 2018 onto a new database. The Group’s HR department also focused on internal staff movement and promoting from within in line with the Group’s strategy aimed at staff retention and succession planning. During the quarter, the Group continued to secure agreements with reputable nursing colleges across the country, which sees the Group have access to top-tier nursing interns in Egypt. As of 3Q2018, the Group hired 45% of its nursing interns across its four hospitals. Vertical Expansion The Group continued to make progress towards the delivery of its two new polyclinics, which are at the heart of CHG’s sustainable growth strategy. The facilities are scheduled to become fully operational in the first quarter of 2019 and will house around 27 new clinics, a full suite of diagnostic services and two pharmacies. Through its new polyclinics, the Group will also be launching its new home care and visits services, which will allow the Group to expand its reach even further and help an increasing number of patients across Cairo. Finishing work at the East Cairo branch has been finalised during the third quarter under the guidance of a new management team. At the West Cairo branch, finishing work is close to being completed and the polyclinic is expected to be ready by year end. During the quarter, the new management team also set out comprehensive plans to ensure an effective and efficient kick-off of operations once the polyclinics are given the final go ahead. As part of this strategy, the new polyclinics will work to deliver decreased waiting times for OPD services while also delivering new services such as laser treatments. Both polyclinics will be fully operated through the group’s new ERP/HIS system. The Group has also selected the consultants and specialities that will be offered in its polyclinics. The polyclinics will not just help extend the Group’s reach in outpatient services and fill a supply gap in remote areas but will also help drive up volume at the Group’s hospitals. Once operational, the polyclinics will be referring patients to the Group’s hospitals in line with the Group’s feeder network strategy. Key Corporate Developments In conjunction with this 3Q2018 result’s publication, two shareholders meetings were held as follows:
An Extraordinary General Meeting (EGM) where the shareholders approved the amendment of the Group’s Articles of Association.
An Ordinary General Meeting (OGM) was held where the following was approved:
o Executing El Katib Hospital transaction, for which the Group had previously announced the signing of binding documentation. The OGM approved the first stage of the transaction concerning the acquisition of its real estate assets, and to start liaising with its current operators to ensure a smooth transfer of the business once the various regulatory approvals are obtained.
o Entering a long-term lease agreement for an additional 50-bed specialized hospital in East Cairo. The OGM approved entering a lease agreement for the hospital building as well as the transfer of its operations to CHG following the satisfaction of conditions precedent.
o The nomination of two new board members:
73
3
99
9
3Q2017 3Q2018
# of Catheterizations(Rev/catheterization)
EGP 30,512
EGP 23,076
Historical figures have been adjusted to
account for standardization of KPI reporting
across all hospitals

5 | Cleopatra Hospitals Group 3Q2018 EARNINGS RELEASE
Cleopatra Hospitals Group S.A.E. 3Q2018 EARNINGS RELEASE
Cairo, Egypt | 04 December 2018
- Tarek Kabil, a former Minister of Trade and Industry of Egypt,
will assume the position of independent board member. Prior to
this, Mr. Kabil was a partner at Abraaj Group and as head of the
Abraaj Performance Acceleration Group for MENA, Turkey,
and Central Asia, successfully led performance improvement in
more than 40 countries. He previously held leadership positions
in PepsiCo for 18 years, most recently holding the position of
President of PepsiCo International for Middle East and Africa
for beverages and snacks, and at Procter and Gamble (P&G) for
12 years, leading the start-up of P&G paper business in GCC. - Samia El Baroudy as a representative of Care Healthcare
Limited. Ms. El Baroudy holds extensive experience in the private equity and consultancy space across the region. She holds a M.S. in Management Science and Engineering from Stanford University and a BA in Economics also from Stanford University.
Financial Review
Revenues
Consolidated revenues expanded by 32% y-o-y to record EGP 388.3 million in 3Q2018.
Solid group-level growth was supported by an expansion in revenues across CHG’s
portfolio of services and procedures. Surgeries delivered a standout performance during
3Q2018, accounting for 21% of consolidated revenue growth for the period. Meanwhile,
the Group continues to reap the benefits of its investment in additional cardiac
catheterization capacity. Such procedures generated 14% of consolidated revenue growth
in 3Q2018, having contributed just 2% a year previously. As a percentage of total revenues,
proceeds from inpatient services remained the largest contributor, bringing in a quarter of
consolidated revenues during the third quarter of 2018. The contributions from surgeries
and outpatient clinics were essentially unchanged from their levels a year previously,
recording 21% and 13% of consolidated revenues respectively. Catheterization services
contributed 8% of consolidated revenues in the year to 3Q2018, up from 6% in 3Q2017.
CHG’s consolidated revenues grew by 30% y-o-y to EGP 1,062.1 million in 9M2018.
Visits to CHG facilities grew by 6% year-on-year during 9M2018, but the primary driver
of revenue growth has been an upward adjustment in price points and a more favourable
sales mix. The Group’s wide variety of high-quality treatments and consistent delivery of
superior medical outcomes enabled it to propel the period’s top-line expansion.
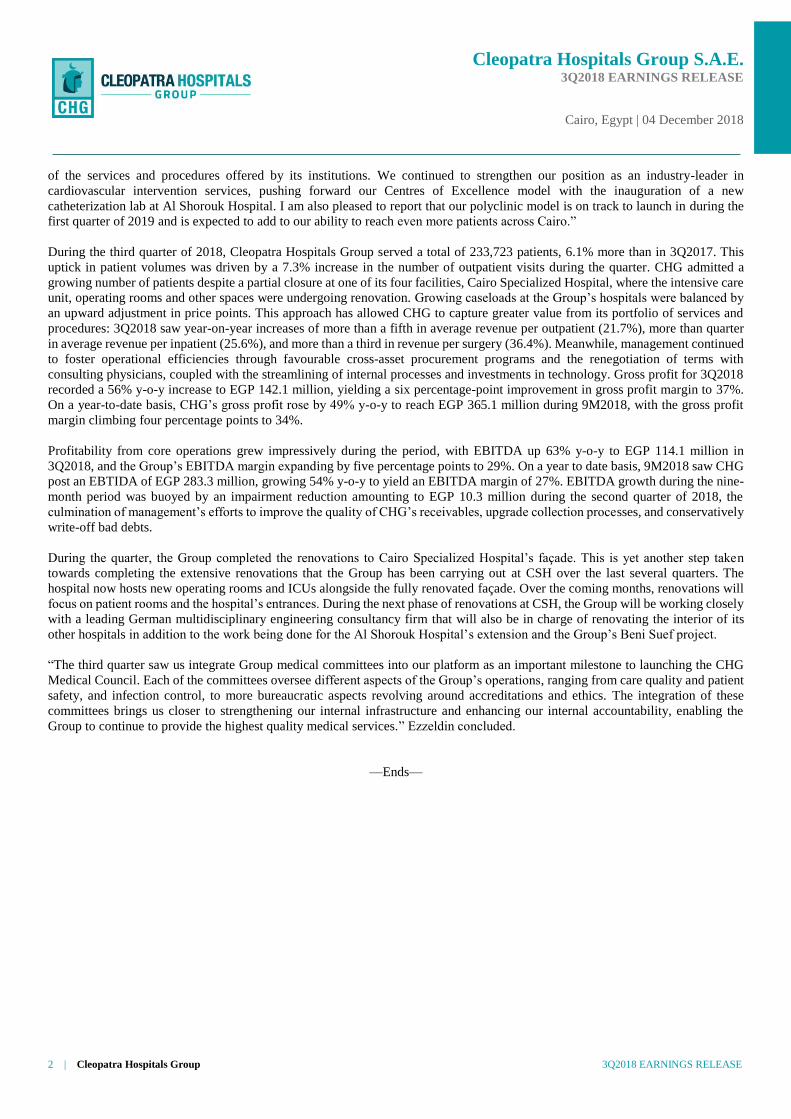
Cleopatra Hospital maintained its position as the largest contributor to the Group’s top-
line, generating 47% of CHG’s revenues in 3Q2018. Despite ongoing renovations during
the period, Cairo Specialized Hospital “CSH” made the second largest contribution at 19%,
followed by Nile Badrawi Hospital “NBH” (17%) and Al Shorouk Hospital “ASH” (17%).
47%
19%
17%
17%
Revenue by Hospital (3Q2018)
Cleopatra Hospital
Cairo Specialised Hospital
Nile Badrawi Hospital
Al Shorouk Hospital
21%
13%25%
9%
8%
4%5%14%
Revenue by Segment (3Q2018)
SurgeriesOutpatient ClinicsInpatientsLaboratoriesCardiac CatheterizationEmergency RoomRadiologyAll Others
6 | Cleopatra Hospitals Group 3Q2018 EARNINGS RELEASE
Cleopatra Hospitals Group S.A.E. 3Q2018 EARNINGS RELEASE
Cairo, Egypt | 04 December 2018
COGS
Cost of goods sold rose by 22% y-o-y to record EGP 246.3 million in the third quarter of
2018, trailing growth in consolidated revenues by a full 10%. Synergies and operational
efficiencies have helped reduced CHG’s COGS/Sales ratio from 69% in 3Q2017 to 63%
in 3Q2018. The fastest growing component of the Group’s COGS in 3Q2018 was fees paid
to consulting physicians, which rose at 28% y-o-y to make the second largest contribution
to total COGS, at 29%. Outlays on salaries and wages expanded by almost a quarter in
3Q2018 (24%) and composed just under a quarter of total COGS (24%). Outlays on
medical supplies grew at 13% y-o-y, contributing 31% of total COGS, while other expenses
grew by 26% and contributed 16% of total COGS. COGS rose by 22% y-o-y on a year-to-
date basis, posting EGP 697.0 million in 9M2018. Such cost increases outlined above are
natural corollaries of the heightened caseload experienced in the year to date, and CHG
management continues to seek all opportunities to sustainably control operational outlays.
Gross Profit
Upward adjustment in price points and Group-level synergies have enabled CHG to capture
greater value from its portfolio of services and procedures. Gross profit for 3Q2018 reached
EGP 142.1 million, up 56% y-o-y and representing a gross profit margin of 37% - an
expansion of six percentage points. Gross profit at Cleopatra Hospital, the main contributor
to CHG’s top-line, was up by 60% y-o-y to contribute 55% of Group-level gross profit.
Nile Badrawi Hospital posted the most rapid rate of growth in gross profit, at 84% y-o-y,
and made the second largest contribution to consolidated gross profit with 17%. Gross
profit from Cairo Specialized Hospital grew by 26% y-o-y and composed a sixth of the
total, while Al Shorouk Hospital’s gross profit expanded by 40% y-o-y to contribute 12%
of consolidated gross profit. On a year-to-date basis, CHG’s gross profit grew by 49% y-
o-y to post EGP 365.1 million during 9M2018. The gross profit margin stood at 34% for
the nine-month period.
G&A Expenses
General and administrative (G&A) expenses consist of the company’s non-medical staff
costs, including those of senior management and Group-level professional consulting fees.
G&A expenses also include the Group’s Long-Term Incentive Program (LTIP), a non-cash
charge linked to share price appreciation and EBITDA growth, the LTIP has a four-year
maturity period maturing by 30 June 2020, after which amounts will be disbursed. Outlays
for G&A purposes rose slightly in 3Q2018, increasing by 6% y-o-y to record EGP 45.7
million.
Impairments fell by 88% y-o-y reflecting an enhanced working capital position, primarily
attributed to improved receivables collections at NBH and CSH.
94
48 3
7 35
12
7
63 5
3 51
18
6
77 6
9 66
Cleopatra Cairo Specialised Nile Badrawi Al Shorouk
Revenue Progression by Hospital (EGP mn)
3Q16
3Q17
3Q18

7 | Cleopatra Hospitals Group 3Q2018 EARNINGS RELEASE
Cleopatra Hospitals Group S.A.E. 3Q2018 EARNINGS RELEASE
Cairo, Egypt | 04 December 2018
EBITDA
CHG’s EBITDA, factoring out acquisition expenses, impairments, the LTIP’s non-cash
charge, and contributions from other income, reached EGP 114.1 million in 3Q2018. This
represents a rapid 63% expansion since 3Q2017 and has yielded an EBITDA margin of
29%, up 5% from the previous year. On a year-to-date basis, EBITDA for the first nine
months of 2018 increased by 54% y-o-y to post EGP 283.3 million, yielding a margin of
27%.
Net Profit
The Group’s net profit stood at EGP 91.6 million in 3Q2018. The figure represents an
increase of 186% on the EGP 32.0 million. CHG’s net profit margin more than doubled
over the same period, jumping to 24% from 11% in 3Q2017. On a year-to-date basis, net
profit for the first nine months of 2018 registered a 166% increase to EGP 225.0 million,
representing a net profit margin of 21%.
CAPEX Total CAPEX outlays recorded EGP 58.8 million in 3Q2018, bringing the year-to-date total to EGP 120 million. The Group’s expenditures were primarily focused on hospital renovation and upgrades as well as the procurement of new state-of-the-art equipment, including its expansion drive in the cardiac catheterization space.

8 | Cleopatra Hospitals Group 3Q2018 EARNINGS RELEASE
Cleopatra Hospitals Group S.A.E. 3Q2018 EARNINGS RELEASE
Cairo, Egypt | 04 December 2018
Recent Corporate Developments
STATEMENT REGARDING ABRAAJ GROUP OWNERSHIP
Abraaj Capital manages private equity funds for limited partner investors, including but not limited to the EBRD, KFW/DEG,
PROPARCO, the IFC and other Development Finance Institutions (DFI) in addition to other institutional investors. Abraaj Capital
does not own any direct stake and indirectly owns less than 5% of Cleopatra through its investment as a limited partner in the private
equity funds it manages. These funds, together with certain DFI co-investors, own a c.69% shareholding in Cleopatra.
Renovations Snapshots
East Cairo Polyclinic, façade & internal civil works completed
Cairo Specialized Hospital Post-Renovation
Nile Badrawi façade post renovation

9 | Cleopatra Hospitals Group 3Q2018 EARNINGS RELEASE
Cleopatra Hospitals Group S.A.E. 3Q2018 EARNINGS RELEASE
Cairo, Egypt | 04 December 2018
ABOUT CLEOPATRA HOSPITALS GROUP S.A.E.
The Group is the largest private hospital group in Egypt by number of hospital beds and number of operating hospitals. The company
holds majority stakes in four leading hospitals in the Greater Cairo Area: Cleopatra Hospital, Cairo Specialized Hospital, Nile
Badrawi Hospital and Al Shorouk Hospital, offering a full array of general and emergency healthcare services.
Shareholder Information EGX: CLHO.CA
Listed: June 2016
Shares Outstanding: 1,600 million
For further information, please contact:
Cleopatra Hospitals Group S.A.E.
Hassan Fikry
Corporate Strategy & Investor Relations Director
T: +2 (0)2 2241 7471
investors.cleopatrahospitals.com
Forward-Looking Statements
This communication contains certain forward-looking statements. A forward-looking statement is any statement that does not relate
to historical facts and events, and can be identified by the use of such words and phrases as “according to estimates”, “anticipates”,
“assumes”, “believes”, “could”, “estimates”, “expects”, “intends”, “is of the opinion”, “may”, “plans”, “potential”, “predicts”,
“projects”, “should”, “to the knowledge of”, “will”, “would”, or, in each case, their negatives, or other similar expressions that are
intended to identify a statement as forward-looking. This applies, in particular, to statements containing information on future
financial results, plans, or expectations regarding our business and management, our future growth or profitability and general
economic and regulatory conditions and other matters affecting us.
Forward-looking statements reflect our management’s (“Management”) current views of future events, are based on Management’s
assumptions, and involve known and unknown risks, uncertainties, and other factors that may cause our actual results, performance,
or achievements to be materially different from any future results, performance, or achievements expressed or implied by these
forward-looking statements. The occurrence or non-occurrence of an assumption could cause our actual financial condition and
results of operations to differ materially from, or fail to meet expectations expressed or implied by, such forward-looking statements.
Our business is subject to a number of risks and uncertainties that could also cause a forward-looking statement, estimate, or
prediction to become inaccurate. These risks include fluctuations in the prices of raw materials or employee costs required by our
operations, its ability to retain the services of certain key employees, its ability to compete successfully, changes in political, social,
legal, or economic conditions in Egypt, worldwide economic trends, the impact of war and terrorist activity, inflation, interest rate
and exchange rate fluctuations, and Management’s ability to timely and accurately identify future risks to our business and manage
the risks mentioned above.
Certain figures contained in this document, including financial information, have been subject to rounding adjustments.
Accordingly, in certain instances, the sum or percentage change of the numbers contained in this document may not conform exactly
to the total figure given.
69%
31%
Shareholder Structure (as of December 2018)
Care Healthcare Ltd. Free Float

10 | Cleopatra Hospitals Group 3Q2018 EARNINGS RELEASE
Cleopatra Hospitals Group S.A.E. 3Q2018 EARNINGS RELEASE
Cairo, Egypt | 04 December 2018
Consolidated Statement of Income All figures in EGP mn 3Q2018 3Q2017 % change 9M2018 9M2017 % change
Revenues 388.3 293.2 32% 1062.1 817.1 30%
Cost of sales (246.3) (202.3) 22% (697.0) (572.4) 22%
Gross profit 142.1 91.0 56% 365.1 244.7 49%
Gross Profit Margin 37% 31% 34% 30%
General & administrative expenses (45.7) (43.2) 6% (134.7) (117.0) 15%
Cost of acquisition activities (0.3) (0.7) -60% (4.6) (2.0) 126%
Provisions 0.5 (0.4) -232% (3.7) (4.9) -26%
Other income (1.0) 2.3 -143% 2.9 4.9 -40%
EBIT 95.6 49.0 95% 225.1 125.6 79%
EBIT Margin 25% 17% 21% 15%
Interest income 32.0 13.7 134% 94.1 40.6 132%
Interest expense (9.2) (20.6) -55% (30.9) (54.8) -44%
Profit before tax 118.4 42.1 181% 288.3 111.4 159%
PBT Margin 30% 14% 27% 14%
Income tax (24.7) (6.4) 283% (61.7) (24.1) 156%
Deferred tax (2.1) (3.7) -42% (1.6) (2.7) -38%
Net profit after tax 91.6 32.0 186% 225.0 84.6 166%
Net Profit Margin 24% 11% 21% 10%
Distributed as follows:
Shareholders of the company 86.3 28.3 205% 210.9 76 177%
Minority rights 5.3 3.7 43% 14.1 8.6 64%
Profit for the period 91.6 32 186% 225.0 84.6 166%
Consolidated Statement of Comprehensive Income All figures in EGP mn 3Q2018 3Q2017 % change 9M2018 9M2017 % change
Net Profit 91.6 32.0 186% 225.0 84.6 166%
Other comprehensive income - - - - - -
Total comprehensive income for the year 91.6 32.0 186% 225.0 84.6 166%
Total comprehensive income attributable to:
Owners of the company 86.3 28.3 205% 210.9 76.0 177%
Non-controlling interest 5.3 3.7 43% 14.1 8.6 64%
Total comprehensive income for the year 91.6 32.0 186% 225.0 84.6 166%

11 | Cleopatra Hospitals Group 3Q2018 EARNINGS RELEASE
Cleopatra Hospitals Group S.A.E. 3Q2018 EARNINGS RELEASE
Cairo, Egypt | 04 December 2018
Consolidated Statement of Financial Position All figures in EGP mn 31 December 2017 30 September 2018
Non-current assets
Fixed assets 472.5 516.7
Intangible assets 241.0 241.0
Payment under investment 143.6 143.6
Total non-current assets 857.1 901.3
Current assets
Inventory 30.1 35.6
Accounts receivables 185.4 299.0
Other receivables and debit balances 22.1 38.2
Due from related parties 5.4 24.1
Cash 1,007.1 963.5
Total current assets 1,250.2 1,360.4
Total assets 2,107.3 2,261.7
Equity
Share capital 800.0 800.0
Reserves 270.2 274.2
Retained earnings 260.3 445.8
Equity attributable to the parent company 1,330.5 1,520.0
Non-controlling interest 55.7 68.5
Total equity 1,386.2 1,588.5
Non-current liabilities
Long term debt – non-current portion 276.3 167.9
Long term incentive plan 24.8 41.6
Deferred tax liability 64.4 66.1
Total non-current liabilities 365.6 275.6
Current liabilities
Provisions 21.6 18.0
Creditors and other credit balances 246.3 299.7
CPLTD 75.6 32.6
Current income tax 12.0 47.4
Total current liabilities 355.5 397.6
Total liabilities 721.0 673.2
Total liabilities & shareholders’ equity 2,107.3 2,261.7

12 | Cleopatra Hospitals Group 3Q2018 EARNINGS RELEASE
Cleopatra Hospitals Group S.A.E. 3Q2018 EARNINGS RELEASE
Cairo, Egypt | 04 December 2018
Consolidated Statement of Cash Flow
All figures in EGP mn 30 September 2017 30 September 2018
Cash flow from operating activities:
Profit before tax 111.4 288.3
Adjustments for:
Depreciation 24.0 32.6
Amortization of intangible assets 4.0 -
Allowance for impairments of current assets 7.3 (3.6)
Provisions (3.7) (3.6)
Capital gain (loss) (0.7) (0.5)
Credit/Debit interest 13.3 (63.2)
Changes in current tax liability (30.6) (26.3)
Fixed assets write off 3.3 -
Share-based payments financial liabilities 11.4 16.8
Operating profits before changes in working capital 139.7 240.4
Changes in working capital:
Change in inventory (2.0) (5.3)
Change in trade receivables, debtors and other debit balances (63.0) (114.6)
Change in due from related parties 0.1 (18.7)
Change in trade payables and other credit balances 40.4 66.6
Net cash flow from operating activities 115.3 168.5
Cash flow from investment activities:
Proceeds from sale of fixed assets 1.0 0.6
Payments for purchase of fixed assets (65.3) (47.3)
PUC purchased (34.4) (29.6)
Advanced payments for purchase of fixed assets (8.4) (12.0)
Payments for acquisition of a subsidiary, net cash acquired (0.6) -
Payments under investment - -
Credit interest collected 41.7 94.4
Time deposits with maturity more than 3 months 178.2 11.0
Net cash flow from investment activities 112.1 17.3
Cash flow from financing activities:
Dividends paid (14.0) (21.7)
Proceeds from borrowings - -
Repayment of borrowings (97.9) (130.9)
Cash proceed from overdraft 83.6 60.0
Cash paid to overdraft - (80.6)
Interest paid (63.6) (45.2)
Net cash flow from financing activities (91.9) (218.3)
Net change in cash & cash equivalents during the period 135.4 (32.6)
Cash & cash equivalents at the beginning of the period 44.4 996.1
Cash & cash equivalents at the end of the period 179.8 963.5