Embed Size (px)
Citation preview
79
Classification of Arid & Semi-Arid Areas: A Case Study in Western
Australia
Guy Leech
Abstract
Arid and semi-arid environments present challenges for ecosystems and the human activities within them. Climate classifications are one method of understanding the climate of these regions, giving regional-scale insight into parameters such as temperature and precipitation. This essay qualitatively compares the application of four different climate classification schemes (Köppen-Trewartha, Guetter-Kutzbach, De Martonne and Erinç) to a transect across Western Australia. The classification schemes show a distinct climatic gradient from the wet coast to the dry continental interior, with the most pronounced gradient located near the coast. Strong agreement is found between weather stations and classifications for wet and dry years, indicating that the weather systems on the coast also govern weather inland. Historically wet and dry periods, as well as long-term drying trends were also identified for the coastal regions, which could affect the livelihoods of many people. A long-term drying trend is also evident at Kalgoorlie-Boulder, the most arid, inland town. These results show that climate classifications can identify major trends and shifts in climate on a decadal or yearly basis, and it is hoped that they will become more widely used for this form of analysis.
Introduction
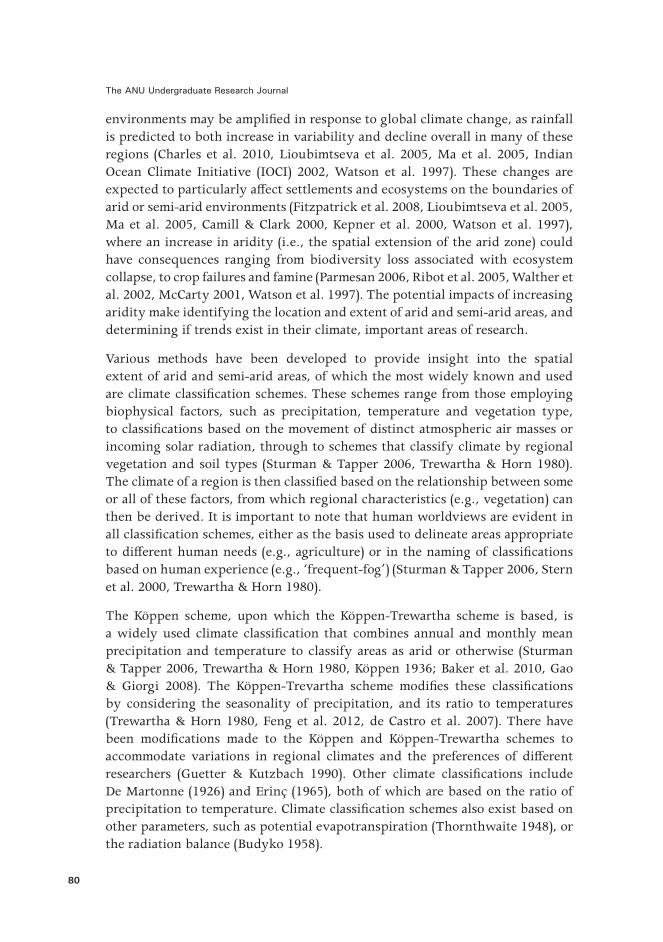
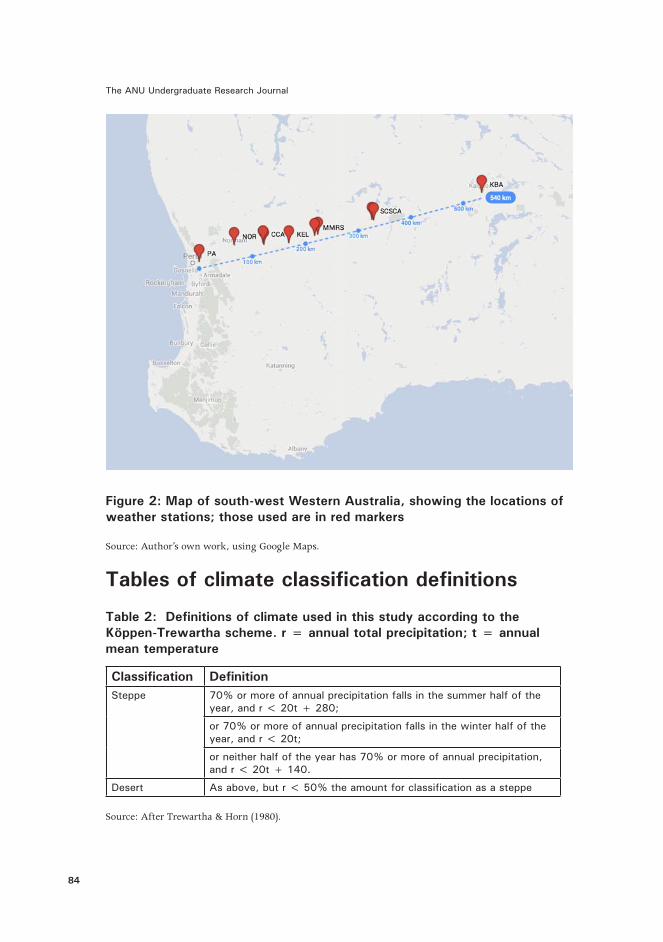
Arid and semi-arid environments make up a large portion of the Earth’s surface (Figure 1), and present challenges for human ecosystems located within them. These regions are generally defined as having low average rainfall, often associated with high temperatures, which impose fundamental limits on animal and plant populations, and on human activities such as agriculture (CSIRO 2011, Ludwig & Asseng 2006, Ribot et al. 2005, John et al. 2005, Vörösmarty et al. 2000, Watson et al. 1997). The challenges presented by arid and semi-arid
The ANU Undergraduate Research Journal
80
environments may be amplified in response to global climate change, as rainfall is predicted to both increase in variability and decline overall in many of these regions (Charles et al. 2010, Lioubimtseva et al. 2005, Ma et al. 2005, Indian Ocean Climate Initiative (IOCI) 2002, Watson et al. 1997). These changes are expected to particularly affect settlements and ecosystems on the boundaries of arid or semi-arid environments (Fitzpatrick et al. 2008, Lioubimtseva et al. 2005, Ma et al. 2005, Camill & Clark 2000, Kepner et al. 2000, Watson et al. 1997), where an increase in aridity (i.e., the spatial extension of the arid zone) could have consequences ranging from biodiversity loss associated with ecosystem collapse, to crop failures and famine (Parmesan 2006, Ribot et al. 2005, Walther et al. 2002, McCarty 2001, Watson et al. 1997). The potential impacts of increasing aridity make identifying the location and extent of arid and semi-arid areas, and determining if trends exist in their climate, important areas of research.
Various methods have been developed to provide insight into the spatial extent of arid and semi-arid areas, of which the most widely known and used are climate classification schemes. These schemes range from those employing biophysical factors, such as precipitation, temperature and vegetation type, to classifications based on the movement of distinct atmospheric air masses or incoming solar radiation, through to schemes that classify climate by regional vegetation and soil types (Sturman & Tapper 2006, Trewartha & Horn 1980). The climate of a region is then classified based on the relationship between some or all of these factors, from which regional characteristics (e.g., vegetation) can then be derived. It is important to note that human worldviews are evident in all classification schemes, either as the basis used to delineate areas appropriate to different human needs (e.g., agriculture) or in the naming of classifications based on human experience (e.g., ‘frequent-fog’) (Sturman & Tapper 2006, Stern et al. 2000, Trewartha & Horn 1980).
The Köppen scheme, upon which the Köppen-Trewartha scheme is based, is a widely used climate classification that combines annual and monthly mean precipitation and temperature to classify areas as arid or otherwise (Sturman & Tapper 2006, Trewartha & Horn 1980, Köppen 1936; Baker et al. 2010, Gao & Giorgi 2008). The Köppen-Trevartha scheme modifies these classifications by considering the seasonality of precipitation, and its ratio to temperatures (Trewartha & Horn 1980, Feng et al. 2012, de Castro et al. 2007). There have been modifications made to the Köppen and Köppen-Trewartha schemes to accommodate variations in regional climates and the preferences of different researchers (Guetter & Kutzbach 1990). Other climate classifications include De Martonne (1926) and Erinç (1965), both of which are based on the ratio of precipitation to temperature. Climate classification schemes also exist based on other parameters, such as potential evapotranspiration (Thornthwaite 1948), or the radiation balance (Budyko 1958).
Classification of Arid & Semi-Arid Areas: A Case Study in Western Australia
81
Figu
re 1
: G
loba
l map
sho
win
g ar
id a
nd s
emi-ar
id a
reas
Sour
ce: M
illen
nium
Eco
syst
em A
sses
smen
t 200
5.
The ANU Undergraduate Research Journal
82
This essay investigates these four climate classification schemes to illuminate differences and similarities between them, and to determine whether any one provides a more accurate or useful representation of the climate of Western Australia. An evaluation of the applicability and usefulness of yearly climate classifications to studying inter-annual variability and long-term trends is another central aspect of this study. A transect of Western Australia, from the coast to the arid interior, is used to examine how the climate of different areas is classified and whether spatial and temporal variation in classification between schemes exists. Trends in classifications and climate are investigated in relation to other studies of the region.
Data and Methods
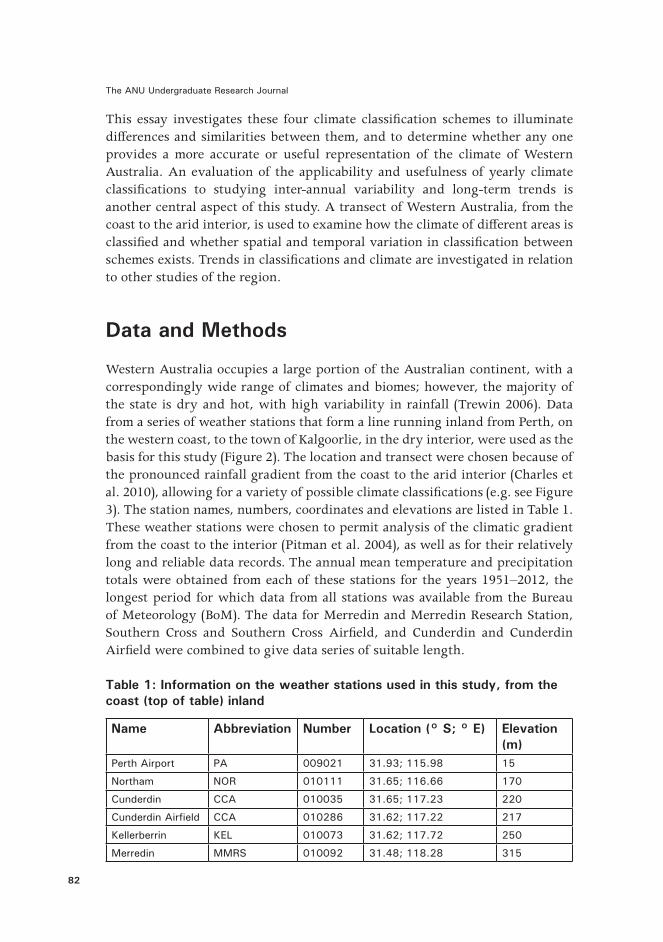
Western Australia occupies a large portion of the Australian continent, with a correspondingly wide range of climates and biomes; however, the majority of the state is dry and hot, with high variability in rainfall (Trewin 2006). Data from a series of weather stations that form a line running inland from Perth, on the western coast, to the town of Kalgoorlie, in the dry interior, were used as the basis for this study (Figure 2). The location and transect were chosen because of the pronounced rainfall gradient from the coast to the arid interior (Charles et al. 2010), allowing for a variety of possible climate classifications (e.g. see Figure 3). The station names, numbers, coordinates and elevations are listed in Table 1. These weather stations were chosen to permit analysis of the climatic gradient from the coast to the interior (Pitman et al. 2004), as well as for their relatively long and reliable data records. The annual mean temperature and precipitation totals were obtained from each of these stations for the years 1951–2012, the longest period for which data from all stations was available from the Bureau of Meteorology (BoM). The data for Merredin and Merredin Research Station, Southern Cross and Southern Cross Airfield, and Cunderdin and Cunderdin Airfield were combined to give data series of suitable length.
Table 1: Information on the weather stations used in this study, from the coast (top of table) inland
Name Abbreviation Number Location (° S; ° E) Elevation (m)
Perth Airport PA 009021 31 .93; 115 .98 15
Northam NOR 010111 31 .65; 116 .66 170
Cunderdin CCA 010035 31 .65; 117 .23 220
Cunderdin Airfield CCA 010286 31 .62; 117 .22 217
Kellerberrin KEL 010073 31 .62; 117 .72 250
Merredin MMRS 010092 31 .48; 118 .28 315
Classification of Arid & Semi-Arid Areas: A Case Study in Western Australia
83
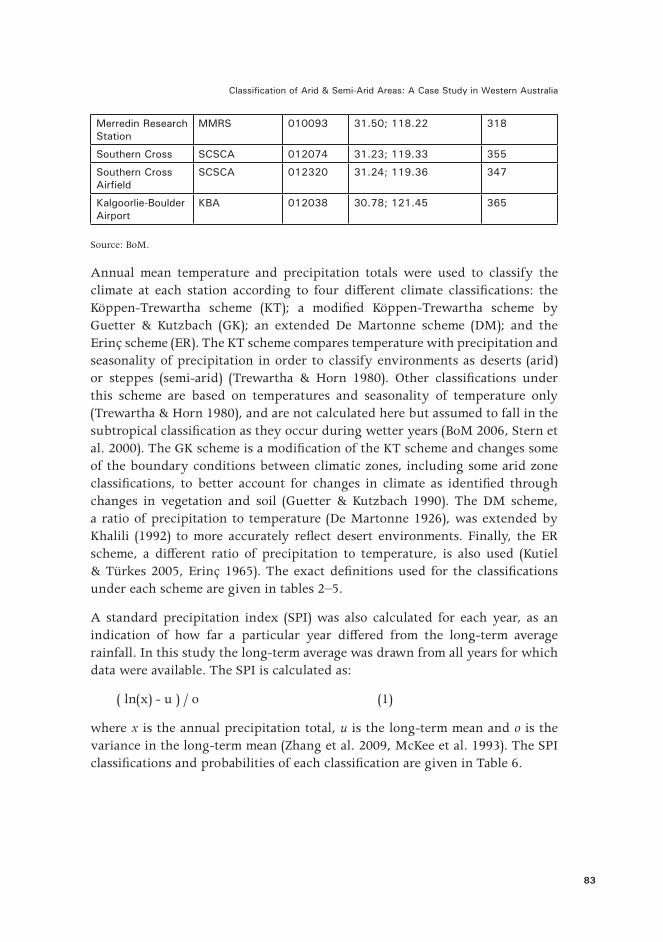
Merredin Research Station
MMRS 010093 31 .50; 118 .22 318
Southern Cross SCSCA 012074 31 .23; 119 .33 355
Southern Cross Airfield
SCSCA 012320 31 .24; 119 .36 347
Kalgoorlie-Boulder Airport
KBA 012038 30 .78; 121 .45 365
Source: BoM.
Annual mean temperature and precipitation totals were used to classify the climate at each station according to four different climate classifications: the Köppen-Trewartha scheme (KT); a modified Köppen-Trewartha scheme by Guetter & Kutzbach (GK); an extended De Martonne scheme (DM); and the Erinç scheme (ER). The KT scheme compares temperature with precipitation and seasonality of precipitation in order to classify environments as deserts (arid) or steppes (semi-arid) (Trewartha & Horn 1980). Other classifications under this scheme are based on temperatures and seasonality of temperature only (Trewartha & Horn 1980), and are not calculated here but assumed to fall in the subtropical classification as they occur during wetter years (BoM 2006, Stern et al. 2000). The GK scheme is a modification of the KT scheme and changes some of the boundary conditions between climatic zones, including some arid zone classifications, to better account for changes in climate as identified through changes in vegetation and soil (Guetter & Kutzbach 1990). The DM scheme, a ratio of precipitation to temperature (De Martonne 1926), was extended by Khalili (1992) to more accurately reflect desert environments. Finally, the ER scheme, a different ratio of precipitation to temperature, is also used (Kutiel & Türkes 2005, Erinç 1965). The exact definitions used for the classifications under each scheme are given in tables 2–5.
A standard precipitation index (SPI) was also calculated for each year, as an indication of how far a particular year differed from the long-term average rainfall. In this study the long-term average was drawn from all years for which data were available. The SPI is calculated as:
( ln(x) - u ) / o (1)
where x is the annual precipitation total, u is the long-term mean and o is the variance in the long-term mean (Zhang et al. 2009, McKee et al. 1993). The SPI classifications and probabilities of each classification are given in Table 6.
The ANU Undergraduate Research Journal
84
Figure 2: Map of south-west Western Australia, showing the locations of weather stations; those used are in red markers
Source: Author’s own work, using Google Maps.
Tables of climate classification definitions
Table 2: Definitions of climate used in this study according to the Köppen-Trewartha scheme. r = annual total precipitation; t = annual mean temperature
Classification DefinitionSteppe 70% or more of annual precipitation falls in the summer half of the
year, and r < 20t + 280;
or 70% or more of annual precipitation falls in the winter half of the year, and r < 20t;
or neither half of the year has 70% or more of annual precipitation, and r < 20t + 140 .
Desert As above, but r < 50% the amount for classification as a steppe
Source: After Trewartha & Horn (1980).
Classification of Arid & Semi-Arid Areas: A Case Study in Western Australia
85
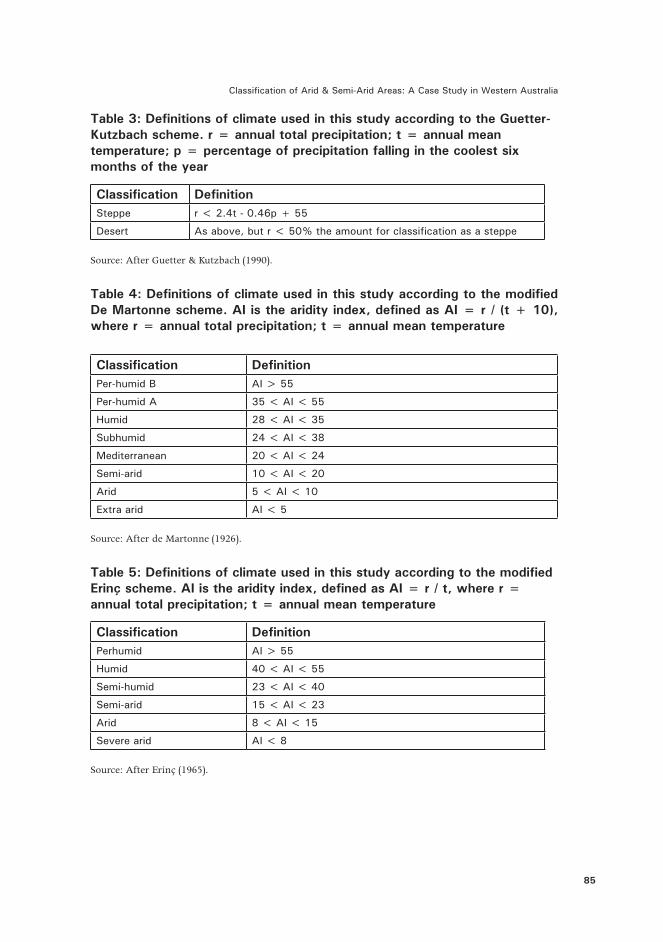
Table 3: Definitions of climate used in this study according to the Guetter-Kutzbach scheme. r = annual total precipitation; t = annual mean temperature; p = percentage of precipitation falling in the coolest six months of the year
Classification DefinitionSteppe r < 2.4t - 0.46p + 55
Desert As above, but r < 50% the amount for classification as a steppe
Source: After Guetter & Kutzbach (1990).
Table 4: Definitions of climate used in this study according to the modified De Martonne scheme. AI is the aridity index, defined as AI = r / (t + 10), where r = annual total precipitation; t = annual mean temperature
Classification DefinitionPer-humid B AI > 55
Per-humid A 35 < AI < 55
Humid 28 < AI < 35
Subhumid 24 < AI < 38
Mediterranean 20 < AI < 24
Semi-arid 10 < AI < 20
Arid 5 < AI < 10
Extra arid AI < 5
Source: After de Martonne (1926).
Table 5: Definitions of climate used in this study according to the modified Erinç scheme. AI is the aridity index, defined as AI = r / t, where r = annual total precipitation; t = annual mean temperature
Classification DefinitionPerhumid AI > 55
Humid 40 < AI < 55
Semi-humid 23 < AI < 40
Semi-arid 15 < AI < 23
Arid 8 < AI < 15
Severe arid AI < 8
Source: After Erinç (1965).
The ANU Undergraduate Research Journal
86
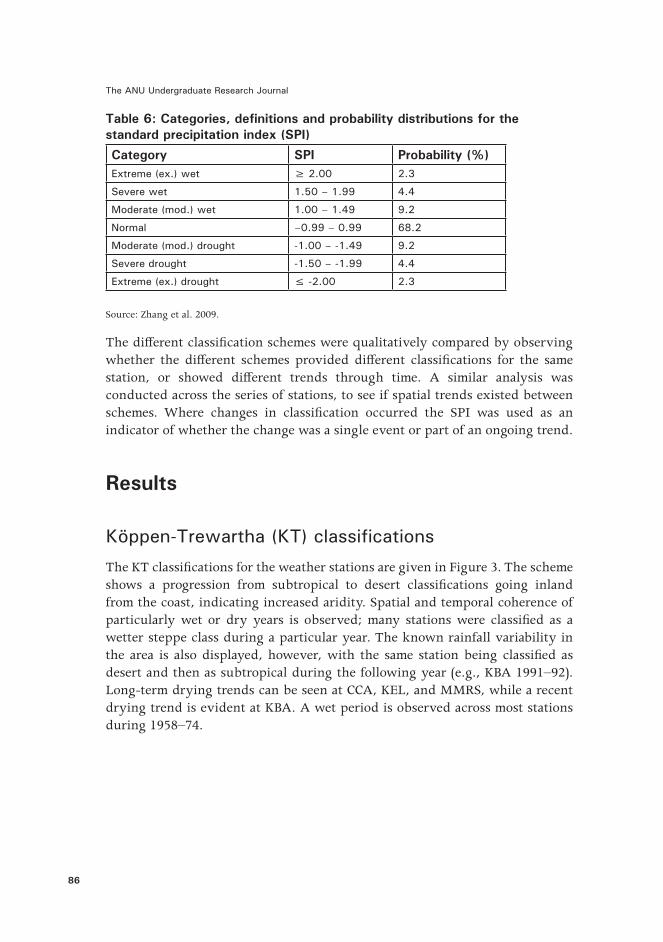
Table 6: Categories, definitions and probability distributions for the standard precipitation index (SPI) Category SPI Probability (%)Extreme (ex .) wet ≥ 2.00 2 .3
Severe wet 1.50 – 1.99 4 .4
Moderate (mod .) wet 1.00 – 1.49 9 .2
Normal –0.99 – 0.99 68 .2
Moderate (mod .) drought -1.00 – -1.49 9 .2
Severe drought -1.50 – -1.99 4 .4
Extreme (ex .) drought ≤ -2.00 2 .3
Source: Zhang et al. 2009.
The different classification schemes were qualitatively compared by observing whether the different schemes provided different classifications for the same station, or showed different trends through time. A similar analysis was conducted across the series of stations, to see if spatial trends existed between schemes. Where changes in classification occurred the SPI was used as an indicator of whether the change was a single event or part of an ongoing trend.
Results
Köppen-Trewartha (KT) classifications
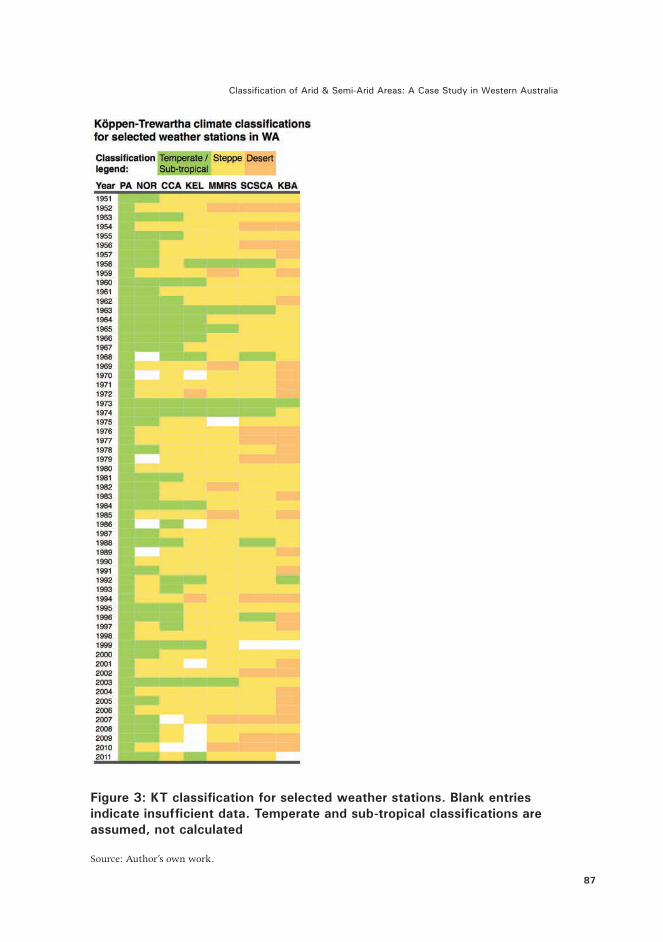
The KT classifications for the weather stations are given in Figure 3. The scheme shows a progression from subtropical to desert classifications going inland from the coast, indicating increased aridity. Spatial and temporal coherence of particularly wet or dry years is observed; many stations were classified as a wetter steppe class during a particular year. The known rainfall variability in the area is also displayed, however, with the same station being classified as desert and then as subtropical during the following year (e.g., KBA 1991–92). Long-term drying trends can be seen at CCA, KEL, and MMRS, while a recent drying trend is evident at KBA. A wet period is observed across most stations during 1958–74.
Classification of Arid & Semi-Arid Areas: A Case Study in Western Australia
87
Figure 3: KT classification for selected weather stations. Blank entries indicate insufficient data. Temperate and sub-tropical classifications are assumed, not calculated
Source: Author’s own work.
The ANU Undergraduate Research Journal
88
Guetter-Kutzbach (GK) classifications
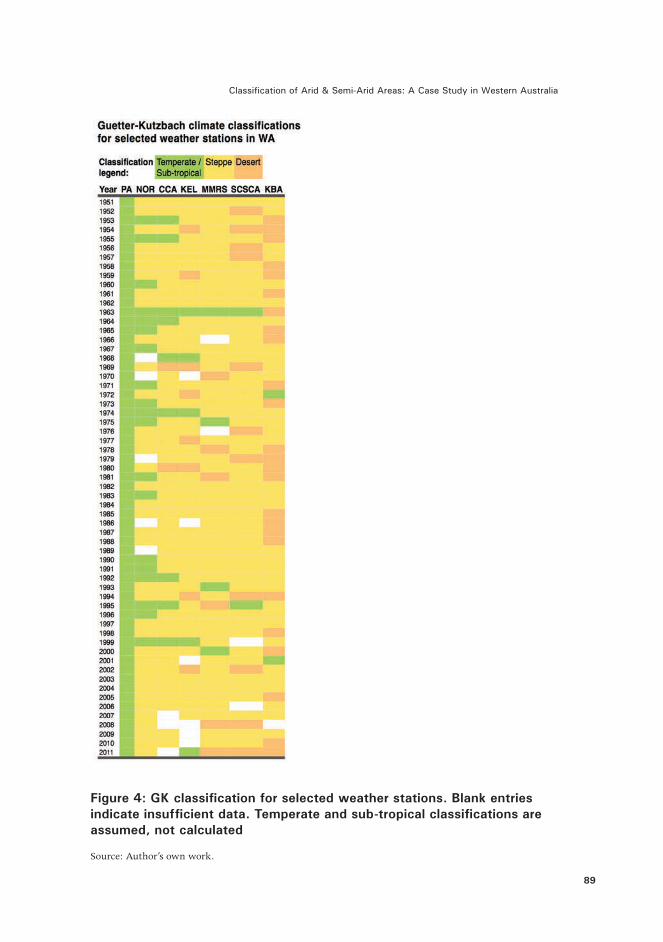
The yearly GK classifications for each weather station are shown in Figure 4. The climatic progression from the wet coast to the dry interior is again observed. Spatial and temporal coherence of wet and dry years is seen, although dramatic changes in classification at the same station between some years are also observed, indicating the high variability of rainfall. A recent drying trend appears at NOR, while a dry period from 1969–79 is observed at most stations.
De Martonne (DM) classifications
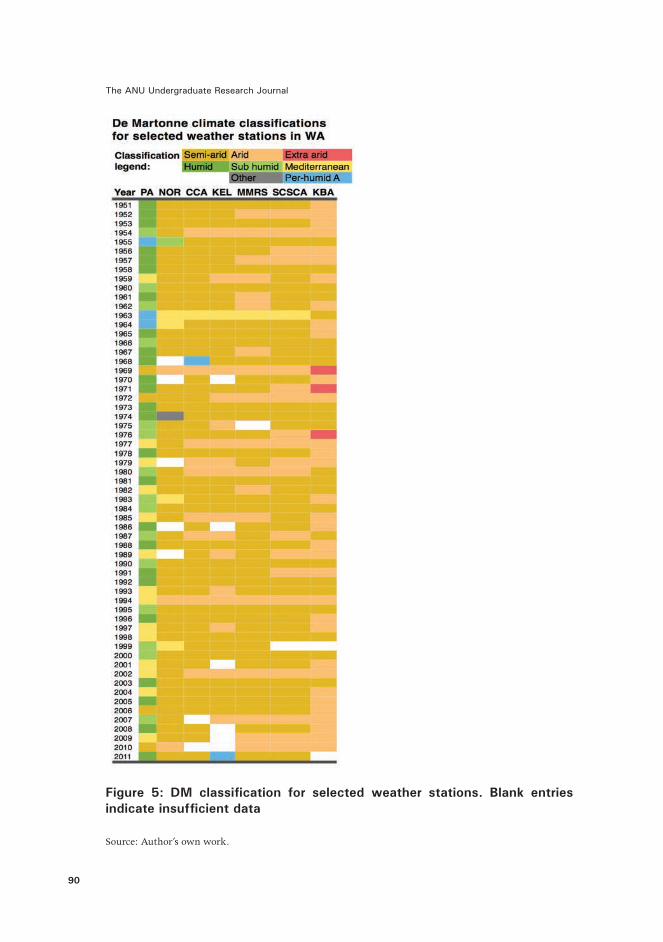
The classifications given by the DM scheme are shown in Figure 5. This scheme shows a clear climatic gradient from the wet coast to the dry interior, although there is often a distinct (two or more classes) difference between PA and NOR climates. Again, spatial and temporal coherence are observed in wet and dry years. A long-term drying trend can be seen for PA, while KBA shows a more recent drying trend; a dry period is observed from 1969–80 at KEL, MMRS and SCSCA. High rainfall variability between years is again observed for some locations and years.
Erinç (ER) classifications
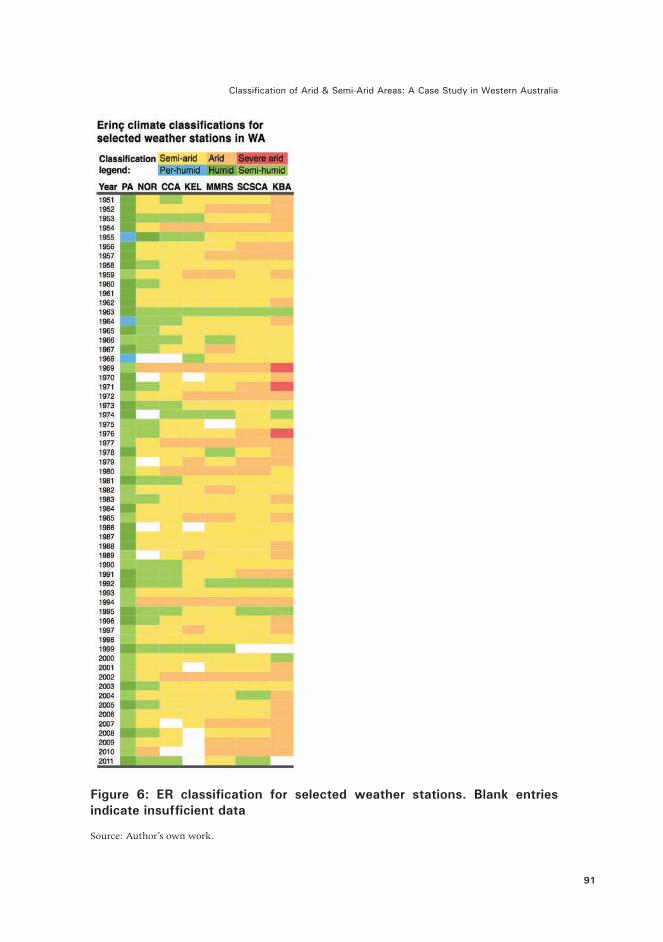
The climate classifications under the ER scheme are shown in Figure 6. A gradient from the wet coast to the dry interior is visible, although the change in classification from PA to NOR is often dramatic (two or more classes). Spatial and temporal coherence of dry and wet years are observed, although large differences in classification occur between some years, indicating high rainfall variability. A long-term drying trend is evident at PA and KBA, while a wetting trend can be seen at SCSCA. A wet period from 1963–68 is observed at many stations, while a dry period from 1969–80 is observed at most.
Classification of Arid & Semi-Arid Areas: A Case Study in Western Australia
89
Figure 4: GK classification for selected weather stations. Blank entries indicate insufficient data. Temperate and sub-tropical classifications are assumed, not calculated
Source: Author’s own work.
The ANU Undergraduate Research Journal
90
Figure 5: DM classification for selected weather stations. Blank entries indicate insufficient data
Source: Author’s own work.
Classification of Arid & Semi-Arid Areas: A Case Study in Western Australia
91
Figure 6: ER classification for selected weather stations. Blank entries indicate insufficient data
Source: Author’s own work.
The ANU Undergraduate Research Journal
92
Standard Precipitation Index (SPI)
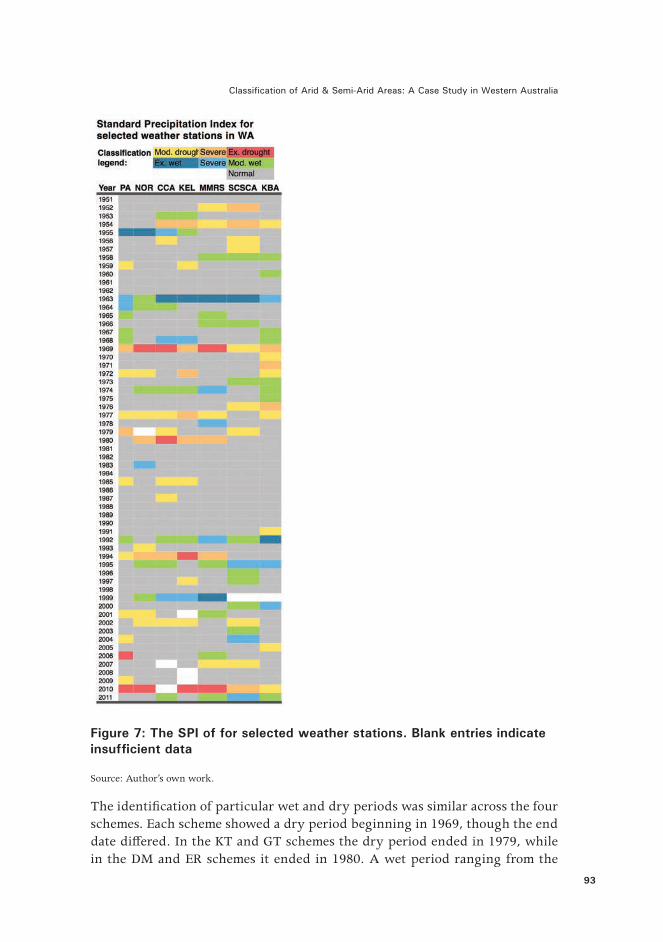
The SPI of each station for all years is shown in Figure 7. High annual variability in rainfall is visible, with conditions changing from extreme to normal between many years, and from severe drought to severely wet. A wet period during the 1960s is visible, as is a dry period from 1969–80. A dry period at PA can be seen from 2001–10, which may be an indication of long-term drying. SCSCA appears to show a long-term wetting trend.
DiscussionThe climatic gradient from the WA coast, at Perth, to the arid interior, at Kalgoorlie-Boulder, is evident in each of the classification schemes used. The DM and ER schemes illustrate this, and also showed a distinct jump from the climate of Perth (PA) to the next station inland (NOR), showing the influence of the ocean and elevation (NOR is ~155 m above PA [see Table 1]) on climate. The advantages displayed by these schemes are due to the increased number of classification types, which allows greater insight into subtle differences and changes in the climate of an area.
All of the classification schemes examined showed spatial and temporal coherence in wet and/or dry years; i.e., if one station was particularly wet, it was likely that others were as well. This indicates that the climate in this area of Western Australia is governed by the same weather systems, although rainfall decreases as the systems move inland. All the stations, however, also showed dramatic differences in classification between some years, indicating the onset of particularly wet or dry conditions, which reflects the high rainfall variability of the region (Trewin 2006). No scheme showed better insight than another into these phenomena, although the greater number of classifications within the DM and ER schemes was of benefit in making distinctions between moderately dry years and extremely dry years.
Classification of Arid & Semi-Arid Areas: A Case Study in Western Australia
93
Figure 7: The SPI of for selected weather stations. Blank entries indicate insufficient data
Source: Author’s own work.
The identification of particular wet and dry periods was similar across the four schemes. Each scheme showed a dry period beginning in 1969, though the end date differed. In the KT and GT schemes the dry period ended in 1979, while in the DM and ER schemes it ended in 1980. A wet period ranging from the
The ANU Undergraduate Research Journal
94
early 1960s until 1969 was also identified in the KT and ER schemes. These differences are a likely consequence of the precise yet somewhat arbitrary definitions of the climatic boundaries, rather than actual reflections of the aridity of the area at that time.
Temporal trends in climate differed most between schemes. The KT, DM and ER schemes showed a drying trend at KBA with the broad agreement between schemes indicating that this trend is likely to be a real phenomenon, and should be investigated more closely. The KT and GK schemes showed evidence of a drying trend at NOR, while the ER and DM schemes showed a recent drying trend at PA. The fact that both of these pairs of schemes are based on the same principles (see Data and Methods, above) means that these trends are more likely to be spurious. The latter trend, however, is also supported by the SPI, suggesting that it is a real phenomenon. The ER scheme and SPI also suggest a long-term wetting trend at SCSCA, indicating another area that is ripe for further research.
The drying trends described above corroborate earlier studies of south-west Western Australia that identify decreasing rainfall in the region from the late 1960s (Hennessy et al. 2007, Power et al. 2005, IOCI 2002, Smith et al. 2000, Hennessy et al. 1999). The identification in this study of a particularly wet period in the 1960s, followed by a distinctly dry decade, reveals, however, that the drying trend observed in previous studies may be exaggerated, as the 1970s appear drier when compared to the preceding decade. The use of individual stations in this study, as opposed to the areal averages generally used in previous studies, provides greater insight into exactly where these drying trends are most evident, although the results reported here conflict with some previous small-scale work. For example, Pitman et al. (2004) predicted that decreases in rainfall should be expected near the coast, with increases in rainfall further inland; the results presented here suggest a coastal drying trend, but also suggest a drying trend inland at KBA, and a wetting trend at SCSCA, which is also inland.
In terms of methodology, this study shows the usefulness and applicability of yearly climate classifications for studying long-term trends. The ability to detect long-term and emerging trends is of vital importance in climatic studies; the fact that climate classifications, generally assumed to be static and requiring long periods of data, are able to provide this insight on a decadal (and sometimes yearly) basis is an important result. It is hoped that the use of classifications for studying climate can be continued, and that the clear and accessible nature of these classifications may aid communication of climate and climate change concepts.
The limitations of the results and analysis presented here primarily stem from the limitations of climatic classifications in general. The use of discrete cut-offs, especially when combined with a small number of weather stations, can lead to
Classification of Arid & Semi-Arid Areas: A Case Study in Western Australia
95
arbitrary divisions between areas, although this is offset somewhat in the DM and ER schemes because of their many classifications. Additionally, the classification schemes used here only make use of temperature and precipitation data; other schemes that are based on different parameters would be of value for further comparison. Some data and statistical limitations are also present in this study: the calculation of SPI from all available years of data means it may downplay recent trends, and the lack of data for some years, together with the combining of data from different stations, introduces potential errors in the analysis.
Future research in this area should concentrate on the particular drying or wetting trends identified above, or on comparing the results above to those obtained from other classification schemes. Further data collection or reanalysis of weather stations across Australia would benefit future studies of this nature.
Conclusion
This essay examines differences between four climate classification schemes, using data from a transect of weather stations in Western Australia. A distinct climatic gradient is identified from the wet coast to the dry continental interior, and it is most pronounced at the coast. Strong agreement is found between weather stations and classifications for wet and dry years, indicating that the same weather systems govern rainfall in this region. Historically wet and dry periods are also identified. Long-term drying trends are found for the coastal regions and the most arid, inland town; these trends could affect the livelihoods of many people. The use of climate classifications is shown to be useful for identifying long and short-term climatic trends, although they are less useful for understanding spatial variation. It is hoped that future studies on climatic trends may consider the use of these, or other, climate classifications.
Acknowledgements
I would like to thank Janette Lindesay for guidance on this project.
Bibliography
Baker B, Diaz H, Hargrove W & Hoffman F 2010, ‘Use of the Köppen–Trewartha Climate Classification to Evaluate Climatic Refugia in Statistically Derived Ecoregions for the People’s Republic of China’, Climatic Change, vol. 98, no. 1, pp. 113–31.
The ANU Undergraduate Research Journal
96
Budyko MI 1958, The Heat Balance of the Earth’s Surface, Weather Bureau, Washington.
Bureau of Meteorology (BoM) 2013, ‘Climate Data Online’, accessed June 2014, <http://www.bom.gov.au/climate/data/>.
Camill P & Clark JS 2000, ‘Long-term Perspectives on Lagged Ecosystem Responses to Climate Change: Permafrost in Boreal Peatlands and the Grassland/Woodland Boundary’, Ecosystems, vol. 3, no. 6, pp. 534–44.
Charles SP, Silberstein R, Teng J, Fu G, Hodgson G, Gabrovsek C, Crute J, Chiew FHS, Smith IN, Kirono DGC, Bathols JM, Li LT, Yang A, Donohue RJ, Marvanek SP, McVicar TR, Van Niel TG & Cai W 2010, Climate Analyses for South-West Western Australia, a report to the Australian Government from the CSIRO South-West Western Australia Sustainable Yields Project, Australia.
CSIRO 2011, ‘Sustainability in Australia’s Arid Lands’, online document, <http://www.csiro.au/Outcomes/Water/Rural-and-regional-water/arid-land-sustainability.aspx>.
de Castro, M., Gallardo, C., Jylha, K., &Tuomenvirta, H. 2007, “The use of a climate-type classification for assessing climate change effects in Europe from an ensemble of nine regional climate models”, Climatic Change, vol. 81, no. 1, pp. 329–341.
De Martonne E 1926, ‘Une nouvelle fonction climatologique: L’indice d’aridité’, La Meteorologie, vol. 2, pp. 449–58.
Erinç S 1965, An Attempt on Precipitation Efficiency and a New Index, Istanbul Üniversitesi.
Feng S, Ho CH, Hu Q, Oglesby RJ, Jeong SJ & Kim, BM 2012, ‘Evaluating Observed and Projected Future Climate Changes for the Arctic using the Köppen-Trewartha Climate Classification’, Climate Dynamics, vol. 38, no. 7–8, pp. 1359–373.
Fitzpatrick MC, Gove AD, Sanders NJ & Dunn RR 2008, ‘Climate Change, Plant Migration, and Range Collapse in a Global Biodiversity Hotspot: The Banksia (Proteaceae) of Western Australia’, Global Change Biology, vol. 14, no. 6, pp. 1337–352.
Gao X & Giorgi F 2008, ‘Increased Aridity in the Mediterranean Region under Greenhouse Gas Forcing Estimated from High Resolution Simulations with a Regional Climate Model’, Global and Planetary Change, vol. 62, no. 3, pp. 195–209.
Classification of Arid & Semi-Arid Areas: A Case Study in Western Australia
97
Guetter PJ & Kutzbach JE 1990, ‘A Modified Köppen Classification Applied to Model Simulations of Glacial and Interglacial Climates’, Climatic Change, vol. 16, no. 2, pp. 193–215.
Hennessy K, Fitzharris B, Bates B, Harvey N, Howden S, Hughes L, Warrick S & Warrick R (eds) 2007, ‘Australia and New Zealand. Climate Change 2007: Impacts, Adaptation and Vulnerability’, contribution of Working Group II to the Fourth Assessment Report of the Intergovernmental Panel on Climate Change, Cambridge University Press, pp. 507–40.
Hennessy KJ, Suppiah R & Page CM 1999, ‘Australian Rainfall Changes, 1910–1995’, Australian Meteorological Magazine, vol. 48, no. 1, pp. 1–13.
Indian Ocean Climate Initiative (IOCI) 2002, Climate Variability and Change in Southwest Western Australia, Indian Ocean Climate Initiative Panel, Perth.
John M, Pannell D & Kingwell R 2005, ‘Climate Change and the Economics of Farm Management in the Face of Land Degradation: Dryland Salinity in Western Australia’, Canadian Journal of Agricultural Economics / Revue Canadienne d’Agroeconomie, vol. 53, no. 4, pp. 443–59.
Kepner WG, Watts CJ, Edmonds CM, Maingi JK, Marsh SE & Luna G 2000, ‘A Landscape Approach for Detecting and Evaluating Change in a Semi-arid Environment’, Environmental Monitoring and Assessment, vol. 64, no. 1, pp. 179–95.
Khalili A 1992, ‘Arid and Semi Arid Regions of Iran’, Proceeding of Seminar on the Problems of Iranian Deserts and Kavirs, pp. 566–79.
Köppen W 1936, ‘Das geographische system der klimate’, in Köppen W & Geiger R (eds), Handbuch der klimatologie, vol. 1, part C, Gebrüder Borntraeger, Berlin.
Kutiel H & Türkes M 2005, ‘New Evidence for the Role of the North Sea–Caspian Pattern on the Temperature and Precipitation Regimes in Continental Central Turkey’, Geografiska Annaler: Series A: Physical Geography, vol. 87, no. 4, pp. 501–13.
Lioubimtseva E, Cole R, Adams JM & Kapustin G 2005, ‘Impacts of Climate and Land-cover Changes in Arid Lands of Central Asia’, Journal of Arid Environments, vol. 62, no. 2, pp. 285–308.
Ludwig F & Asseng S 2006, ‘Climate Change Impacts on Wheat Production in a Mediterranean Environment in Western Australia’, Agricultural Systems, vol. 90, no. 1, pp. 159–79.
Ma Z-G, Fu C-B & Dan L 2005, ‘Decadal Variations of Arid and Semi-arid Boundary in China’, Chinese Journal of Geophysics, vol. 48, no. 3, pp. 575–81.
The ANU Undergraduate Research Journal
98
McCarty JP 2002, ‘Ecological Consequences of Recent Climate Change’, Conservation Biology, vol. 15, no. 2, pp. 320–31.
McKee TB, Doesken NJ & Kleist J 1993, ‘The Relationship of Drought Frequency and Duration to Time Scales’, Preprints of the Eighth Conference on Applied Climatology, pp. 179–84.
Millennium Ecosystem Assessment 2005, Ecosystems and Human Well-being: Desertification Synthesis, World Resources Institute, Washington.
Parmesan C 2006, ‘Ecological and Evolutionary Responses to Recent Climate Change’, Annual Review of Ecology, Evolution, and Systematics, vol. 37, pp. 637–69.
Pitman AJ, Narisma GT, Pielke RA Sr & Holbrook NJ 2004, ‘Impact of Land Cover Change on the Climate of Southwest Western Australia’, Journal of Geophysical Research, vol. 109, D18109.
Power S, Sadler B & Nicholls N 2005, ‘The Influence of Climate Science on Water Management in Western Australia: Lessons for Climate Scientists’, Bulletin of the American Meteorological Society, vol. 86, no. 6, pp. 839–44.
Rahimi J, Ebrahimpour M & Khalili A 2012, ‘Spatial Changes of Extended De Martonne Climatic Zones Affected by Climate Change in Iran’, Theoretical and Applied Climatology, online in advance of publication, DOI: 10.1007/s00704-012-0741-8.
Ribot JC, Magalhães AR & Panagides S 2005, Climate Variability, Climate Change and Social Vulnerability in the Semi-arid Tropics, Cambridge University Press.
Smith IN, McIntos, P, Ansell TJ, Reason CJC & McInnes K 2000, ‘Southwest Western Australian Winter Rainfall and its Association with Indian Ocean Climate Variability’, International Journal of Climatology, vol. 20, no. 15, pp. 1913–930.
Stern H, de Hoedt G & Ernst J 2000, ‘Objective Classification of Australian Climates’, Australian Meteorological Magazine, vol. 49, no. 2, pp. 87–96.
Sturman A & Tapper N 2006, The Weather and Climate of Australia and New Zealand, 2nd edn, Oxford University Press, South Melbourne.
Thornthwaite CW 1948, ‘An Approach Toward a Rational Classification of Climate’, Geographical Review, vol. 38, no. 1, pp. 55–94.
Trewartha GT 1968, An Introduction to Climate, McGraw-Hill, New York.
Classification of Arid & Semi-Arid Areas: A Case Study in Western Australia
99
Trewartha GT & Horn LH 1980, An Introduction to Climate, 5th edn., McGraw-Hill, New York.
Trewin B 2006, ‘Australian Deserts, Climatic Aspects of Australia’s Deserts’, in 2006 Year Book Australia, Australian Bureau of Statistics, Canberra.
Vörösmarty CJ, Green P, Salisbury J & Lammers RB 2000, ‘Global Water Resources: Vulnerability from Climate Change and Population Growth’, Science, vol. 289, no. 5477, pp. 284–88.
Walther, G-R, Post E, Convey P, Menzel A, Parmesan C, Beebee TJC, Fromentin J-M, Hoegh-Guldberg O & Bairlein F 2002, ‘Ecological Responses to Recent Climate Change’, Nature, vol. 416, no. 6879, pp. 389–95.
Watson RT, Zinyowera MC & Moss RH 1997, The Regional Impacts of Climate Change: An Assessment of Vulnerability, Cambridge University Press.
Zhang Q, Xu CY & Zhang Z 2009, ‘Observed Changes of Drought/Wetness Episodes in the Pearl River Basin, China, Using the Standardized Precipitation Index and Aridity Index’, Theoretical and Applied Climatology, vol. 98, no. 1, pp. 89–99.
This text taken from The ANU Undergraduate Research Journal Volume Five 2013, published 2014 by ANU Press, The Australian National
University, Canberra, Australia.