Embed Size (px)
Citation preview

8/3/2019 Classification Chapter6 Stream Process
http://slidepdf.com/reader/full/classification-chapter6-stream-process 1/46
Stream Processes
Stream Surveys, Effective Discharge
Rosgen Classification, Streamways, Evolution
Andy Ward, Professor
Food, Agricultural and Biological Engineering
The Ohio State University

8/3/2019 Classification Chapter6 Stream Process
http://slidepdf.com/reader/full/classification-chapter6-stream-process 2/46
Stream Stability
Natural stream channel stability is
achieved by allowing the river to develop a
stable dimension, pattern and profile such
that channel features are maintained andthe stream system neither aggrades nor
degrades
Correctly engineered rigid channels can be
part of a stable stream system.

8/3/2019 Classification Chapter6 Stream Process
http://slidepdf.com/reader/full/classification-chapter6-stream-process 3/46
Indicators Of The Effective Discharge StageIndicators Of The Effective Discharge Stage
A bench that is below the bankfull stage
will usually have signs of coarse
material. An active floodplain will often exhibit
sands, some soil structure, and
vegetation
If there is a good soil structure and high
organic matter content you are probably
above the effective discharge stage.

8/3/2019 Classification Chapter6 Stream Process
http://slidepdf.com/reader/full/classification-chapter6-stream-process 4/46
Effective Discharge Stage IndicatorsEffective Discharge Stage Indicators
Top Of A Point Bar Top Of A Point Bar DepositionalDepositional MaterialsMaterials
Grade Breaks Moss On Boulders
Stain Lines On Boulders

8/3/2019 Classification Chapter6 Stream Process
http://slidepdf.com/reader/full/classification-chapter6-stream-process 5/46
Are Scour Lines
Bankfull Indicators?
Cut BanksCut Banks
Are Poor IndicatorsAre Poor IndicatorsOf BankfullOf Bankfull

8/3/2019 Classification Chapter6 Stream Process
http://slidepdf.com/reader/full/classification-chapter6-stream-process 6/46
Identify land use conditions and changes
Become familiar with conditions at the site
Identify a reference reach
Develop a regional curve
Evaluate existing stream gages
Identify resource needs to conduct the field work
Visit with people who are familiar with the watershed
Purpose
Conducting a Stream and
Watershed Reconnaissance

8/3/2019 Classification Chapter6 Stream Process
http://slidepdf.com/reader/full/classification-chapter6-stream-process 7/46
If a channel relocation is proposed and the currentchannel is stable then only survey the currentchannel.
If the current channel is unstable then a referencereach that represents the stable form of the currentchannel should be surveying in addition to the
current channel.
Reach Survey

8/3/2019 Classification Chapter6 Stream Process
http://slidepdf.com/reader/full/classification-chapter6-stream-process 8/46
Stream Geomorphology SurveyStream Geomorphology Survey Do a survey of one or more representative reaches that
are at least 20 bankfull widths long. Measure the channel profile
Measure the channel cross-section at several locations.
Measure all grade breaks along the profile & cross-section

8/3/2019 Classification Chapter6 Stream Process
http://slidepdf.com/reader/full/classification-chapter6-stream-process 9/46
Radius of curvature
Meander length
Sinuosity
Conduct a Pebble Count
Pools and RifflesPools and Riffles

8/3/2019 Classification Chapter6 Stream Process
http://slidepdf.com/reader/full/classification-chapter6-stream-process 10/46
Riffle Pools Features
(Spaced at 5-7 Bankfull Widths)

8/3/2019 Classification Chapter6 Stream Process
http://slidepdf.com/reader/full/classification-chapter6-stream-process 11/46
One meander length is equal to
10-14 Bankfull Widths

8/3/2019 Classification Chapter6 Stream Process
http://slidepdf.com/reader/full/classification-chapter6-stream-process 12/46

8/3/2019 Classification Chapter6 Stream Process
http://slidepdf.com/reader/full/classification-chapter6-stream-process 13/46
Dimensions
Riffle BlackLick
85
95
105
-40 -20 0 20 40 60 80 100 120
Width from River Left to Right (ft)
E l e v a t i o n ( f t )
Maximum
Bankfull depth
Width at twice max
Bankfull depth
Bankfull width
Mean
Bankfull depth

8/3/2019 Classification Chapter6 Stream Process
http://slidepdf.com/reader/full/classification-chapter6-stream-process 14/46
Using Reach DataUsing Reach Data
Analyze the data to refined estimates of : Effective discharge width, depth, and cross-sectional area
Effective discharge
Mean bankfull flow velocity
Channel bed slope
Shear stress or tractive force at bankfull discharge
1.1 Riffle Typical Cross-Section
88
90
92
94
96
98
100
102
0 5 10 15 20 25 30 35 40
Width from River Left to Right (ft)
E
l e
v
a
t i o
n
( f t )y = -0.0017x + 94.6
R2 = 0.96
y = -0.0016x + 87.6
R2 = 0.99
y = -0.0014x + 89.0
R2 = 0.99
80
85
90
95
100
0 1000 2000 3000 4000 5000 6000
Channel Distance (ft)
E l e v
a t i o
n
( f t )
bed w ater srf Terrace --- BKF --- x-sectio n Linear (B KF)

8/3/2019 Classification Chapter6 Stream Process
http://slidepdf.com/reader/full/classification-chapter6-stream-process 15/46
Profile
86
88
90
92
94
96
98
0 100 200 300 400 500 600 700 800 900
Channel Distance (ft)
E l e v a t i o n
( f t )
bed water srf Terrace --- BKF

8/3/2019 Classification Chapter6 Stream Process
http://slidepdf.com/reader/full/classification-chapter6-stream-process 16/46
Rosgen Classification Of Natural Streams

8/3/2019 Classification Chapter6 Stream Process
http://slidepdf.com/reader/full/classification-chapter6-stream-process 17/46
Rosgen Stream Classification

8/3/2019 Classification Chapter6 Stream Process
http://slidepdf.com/reader/full/classification-chapter6-stream-process 18/46

8/3/2019 Classification Chapter6 Stream Process
http://slidepdf.com/reader/full/classification-chapter6-stream-process 19/46

8/3/2019 Classification Chapter6 Stream Process
http://slidepdf.com/reader/full/classification-chapter6-stream-process 20/46
Stream Type: AW/D < 12 Sinuosity > 1- 1.2 ER < 1.4 S 4 - 10 %

8/3/2019 Classification Chapter6 Stream Process
http://slidepdf.com/reader/full/classification-chapter6-stream-process 21/46

8/3/2019 Classification Chapter6 Stream Process
http://slidepdf.com/reader/full/classification-chapter6-stream-process 22/46
Stream Type: BW/D > 12 Sinuosity > 1.2 ER > 1.4 -2.2 S 2-4%

8/3/2019 Classification Chapter6 Stream Process
http://slidepdf.com/reader/full/classification-chapter6-stream-process 23/46

8/3/2019 Classification Chapter6 Stream Process
http://slidepdf.com/reader/full/classification-chapter6-stream-process 24/46

8/3/2019 Classification Chapter6 Stream Process
http://slidepdf.com/reader/full/classification-chapter6-stream-process 25/46
Stream Type: CW/D > 12 Sinuosity > 1.2 ER > 2.2 S < 2%

8/3/2019 Classification Chapter6 Stream Process
http://slidepdf.com/reader/full/classification-chapter6-stream-process 26/46

8/3/2019 Classification Chapter6 Stream Process
http://slidepdf.com/reader/full/classification-chapter6-stream-process 27/46
Stream Type: DW/D > 40 Sinuosity > 1.2 ER n/a S < 2%

8/3/2019 Classification Chapter6 Stream Process
http://slidepdf.com/reader/full/classification-chapter6-stream-process 28/46

8/3/2019 Classification Chapter6 Stream Process
http://slidepdf.com/reader/full/classification-chapter6-stream-process 29/46

8/3/2019 Classification Chapter6 Stream Process
http://slidepdf.com/reader/full/classification-chapter6-stream-process 30/46
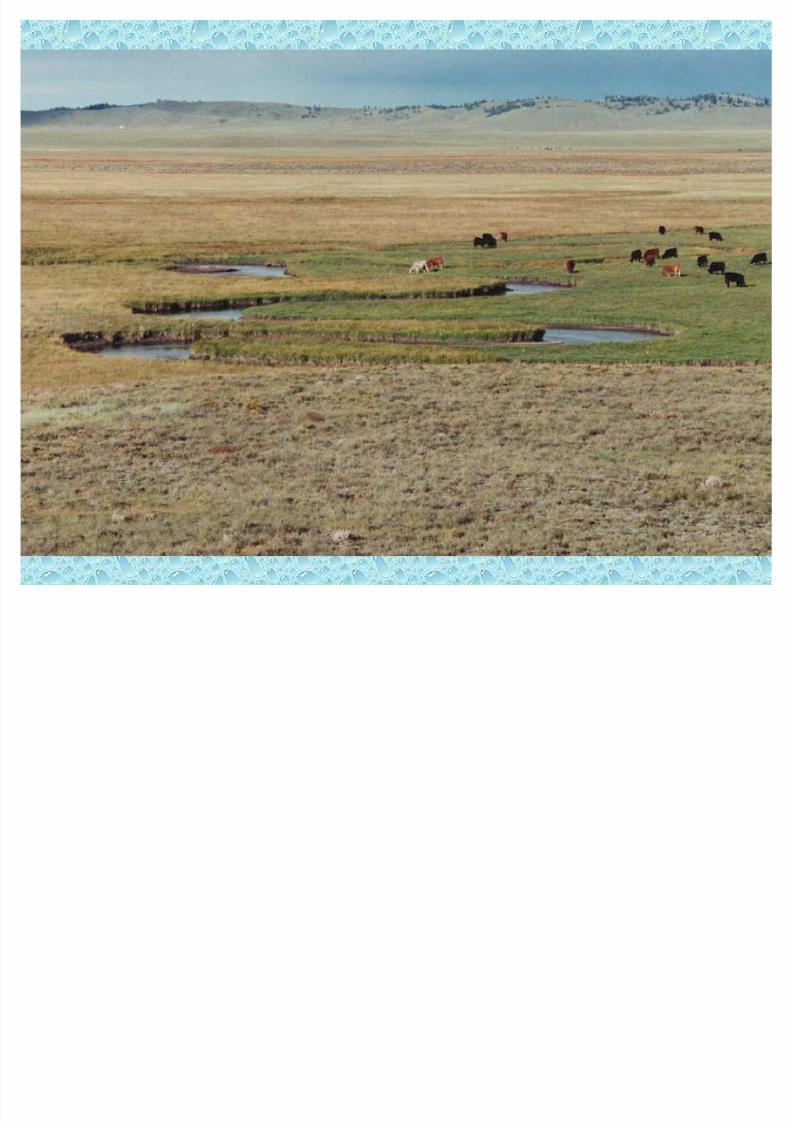
Stream Type: EW/D < 12 Sinuosity > 1.5 ER > 2.2 S < 2%

8/3/2019 Classification Chapter6 Stream Process
http://slidepdf.com/reader/full/classification-chapter6-stream-process 31/46
8/3/2019 Classification Chapter6 Stream Process
http://slidepdf.com/reader/full/classification-chapter6-stream-process 32/46

8/3/2019 Classification Chapter6 Stream Process
http://slidepdf.com/reader/full/classification-chapter6-stream-process 33/46
A Type E Stream In Ohio

8/3/2019 Classification Chapter6 Stream Process
http://slidepdf.com/reader/full/classification-chapter6-stream-process 34/46
Type E Stream In An Urban Park

8/3/2019 Classification Chapter6 Stream Process
http://slidepdf.com/reader/full/classification-chapter6-stream-process 35/46

8/3/2019 Classification Chapter6 Stream Process
http://slidepdf.com/reader/full/classification-chapter6-stream-process 36/46
Stream Type: FW/D > 12 Sinuosity > 1.2 ER < 1.4 S < 2%

8/3/2019 Classification Chapter6 Stream Process
http://slidepdf.com/reader/full/classification-chapter6-stream-process 37/46

8/3/2019 Classification Chapter6 Stream Process
http://slidepdf.com/reader/full/classification-chapter6-stream-process 38/46
Stream Type: GW/D < 12 Sinuosity > 1.2 ER < 1.4 S 2-4%

8/3/2019 Classification Chapter6 Stream Process
http://slidepdf.com/reader/full/classification-chapter6-stream-process 39/46
Typical Problems
Higher downstream flows in the receiving ditch orstream
Higher upstream flows
Outlets restricted
Reduced conveyance due to deposited sediment
Reduced conveyance due to increased roughness
Bank failures
Floodplain modifications
New bridges and/or culverts

8/3/2019 Classification Chapter6 Stream Process
http://slidepdf.com/reader/full/classification-chapter6-stream-process 40/46
Bridges & Culverts
Culverts are often made toowide. This causes depositionupstream and scourdownstream
New culverts often change thedirection of flow and thebedslope. These changes canalso result in downstream
bank instability problems. Use a multi-stage design
for the culvert.

8/3/2019 Classification Chapter6 Stream Process
http://slidepdf.com/reader/full/classification-chapter6-stream-process 41/46
Streamway Concept

8/3/2019 Classification Chapter6 Stream Process
http://slidepdf.com/reader/full/classification-chapter6-stream-process 42/46
Streamway Width
We analyzed 47 published sets of data and toaccount for meander migrations and uncertaintyin the equation we tested a new equation that is a
function of drainage area and provided astreamway that encompassed 41 of the 47 sites:
Streamway width =120*DA 0.43
Where DA is in square miles and the width is in feet.

8/3/2019 Classification Chapter6 Stream Process
http://slidepdf.com/reader/full/classification-chapter6-stream-process 43/46
1989
1951
1966
1980
1997
Drainage Area
30 sq. mi.
Streamway
120 * DA 0.43 = 518 ft
Salt Creek Vinton County, Ohio

8/3/2019 Classification Chapter6 Stream Process
http://slidepdf.com/reader/full/classification-chapter6-stream-process 44/46
Channel Evolution
Pre-Development
Downcutting
Widening
Restored Floodplain

8/3/2019 Classification Chapter6 Stream Process
http://slidepdf.com/reader/full/classification-chapter6-stream-process 45/46
Life at the River!Life at the River!

8/3/2019 Classification Chapter6 Stream Process
http://slidepdf.com/reader/full/classification-chapter6-stream-process 46/46
Thank You!