Embed Size (px)
Citation preview
1
CLASS PROBLEMS
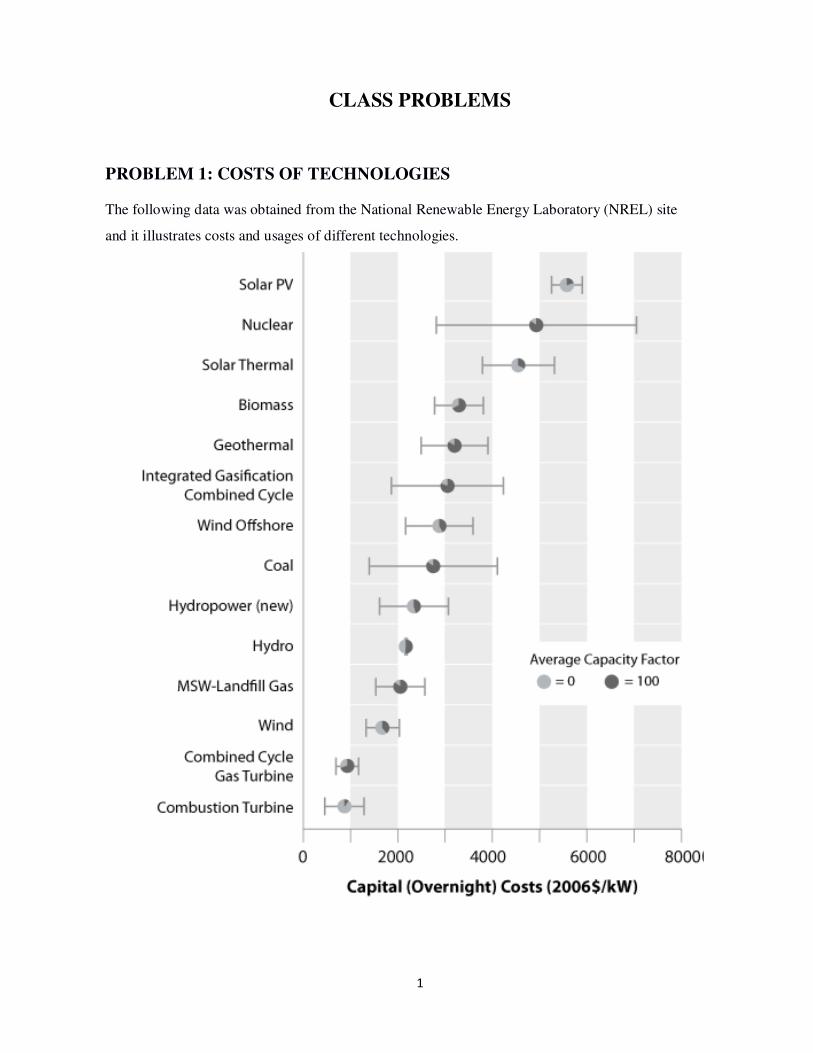
PROBLEM 1: COSTS OF TECHNOLOGIES
The following data was obtained from the National Renewable Energy Laboratory (NREL) site
and it illustrates costs and usages of different technologies.

2

3
The variable costs for the different technologies (USA) are: coal 15 $/MWh, natural gas 40
$/MWh, fuel 80 $/MWh, nuclear 12 $/MWh and biomass 42 $/MW.
Rates for CO2 emissions are 1.02, 0.51 and 0.76 ton/MWh for, respectively, coal, natural
gas, and fuel. The costs for CO2 emissions are estimated at 15 $/ton.
Consider the life span of plants to be 30 years and an interest rate of 10%.
a) Calculate the levelized costs for the different technologies: solar PV, nuclear, coal, wind,
CCGT, and CT, with and without CO2 costs.
b) Is it fair to compare dispatchable and non-dispatchable (intermittent) technologies based
on their levelized cost of energy? Justify.
c) Are the results obtained in a) applicable in Europe, for example? Justify.

4
PROBLEM 1A: CAPACITY FACTORS OF TECHNOLOGIES IN
PORTUGAL
In 2013, the capacity factors of Portuguese power stations are shown in Table.
[GWh] [MW] � =�������
���
ℎ = ���.�����.
����
[h]
Total
generation
47837 Installed
capacity
17792 0.31 2689
Renewable 28373 Renewable 10913 0,30 2600 Big hydro 12146 Big hydro 5239 0,26 2318
Small hydro 1337 Small hydro 413 0,37 3237
Wind 11751 Wind 4368 0,31 2690
Thermal 1160 Thermal 467 0,28 2484
Cogeneration 1532 Cogeneration 343 0,51 4467
Solar 446 Solar 282 0,18 1582
Non-renewable 18307 Non-renewable 6879 0,30 2661
Coal 10953 Coal 1756 0,71 6237 Natural gas (CCGT) 1501 Natural gas (CCGT)
3829 0,04 392
Cogeneration (nat. gas)
5407 Cogeneration (nat. gas)
929 0,67 5820
Others 446 Others 364 0,14 1225
Cogeneration 211 Cogeneration 199 0,12 1060
Pumped storage generation
1157
Consumption of pumps
1458
Import balance 2776 Imports 5229 Exports 2447
Total
demand
49155
a) What is meant by capacity factor? And utilization?
b) Which technologies have abnormal capacity factors or load utilizations? What are the
grounds on which such numbers?
c) With the data of the problem 1 and the capacity factors listed in the table, calculate
the levelized costs for the different technologies: solar PV, coal, wind and CCGT.

5
PROBLEM 2: TECHNOLOGY ADOPTION AND SYSTEM COST Consider the following numerical example1 that illustrates the adoption of generation
technologies. Three technologies are available: base (1), intermediate (2) and peak (3).
These technologies feed an hypothetical electric system, characterized by the
monotonous load duration curve given in equation (1).
D = 22000 – 1.37h (1)
D is the system load and h represents the amount of hours that the system load is above
a specific load level D (in MW). Table 1 has the most significant generation costs.
Table 1
Generation Technology Fixed Cost
$/MW/Year
Variable Cost
$/MWh
Base (1) 240000 20
Intermediate (2) 160000 35
Peak (3) 80000 80
a) Explain how the load duration curve is obtained;
b) With respect to the technologies presented here, explain the meaning of the values in
Table 1;
c) Calculate the values for the installed capacity (power) of the different technologies in
order to minimize the total system cost;
d) For the optimized system, calculate the total cost and the average cost for the total
generated energy ($/MWh);
e) Again, for the optimized system, calculate the average cost for the energy generated by
each technology ($/MWh).
1 This example comes from the article “Capacity Payments in Imperfect Electricity Market: Need and Design”, Utilities Policy, 2008, P. Joskow. The methodology presented in this article refers to works by Boiteux (EdF), published in the 50's. This is, therefore, a classical electric system planning approach. P. Joskow, who is in favor of deregulation of electricity markets, says that well-functioning markets should reproduce the results idealized by central planning.

6
PROBLEM 3: MARKET-BASED COST RECOVERY IN THE
BALANCED SYSTEM WITH MARKET PRICES EQUAL TO
MARGINAL COSTS
In Problem 2, we have determined the balanced system, in which the generation powers of
the different technologies were chosen in order to minimize the total system cost. The results
that were obtained are shown in Table 1.
Table 1
Generation technology Fixed Cost
$/MW/Year
Variable Cost
$/MWh
Base (1) 240000 20
Intermediate (2) 160000 35
Peak (3) 80000 80
Suppose that the costs incurred by the different technologies are recovered through the
market, where it is assumed that energy offers and market prices are based on marginal
costs.
a) What do you understand by average cost and marginal cost?
b) Identify the time period where each technology is marginal.
c) Calculate the revenue obtained through the market by each technology.
d) Compare the values obtained in the previous question with those from Table 1.
Divide the profits of each technology by the individual installed capacity. What is the value
that you have found?
e) Justify capacity payments in electric energy markets
7
PROBLEM 4: MARKET-BASED COST RECOVERY IN AN
UNBALANCED SYSTEM WITH MARKET PRICES EQUAL TO
MARGINAL COSTS
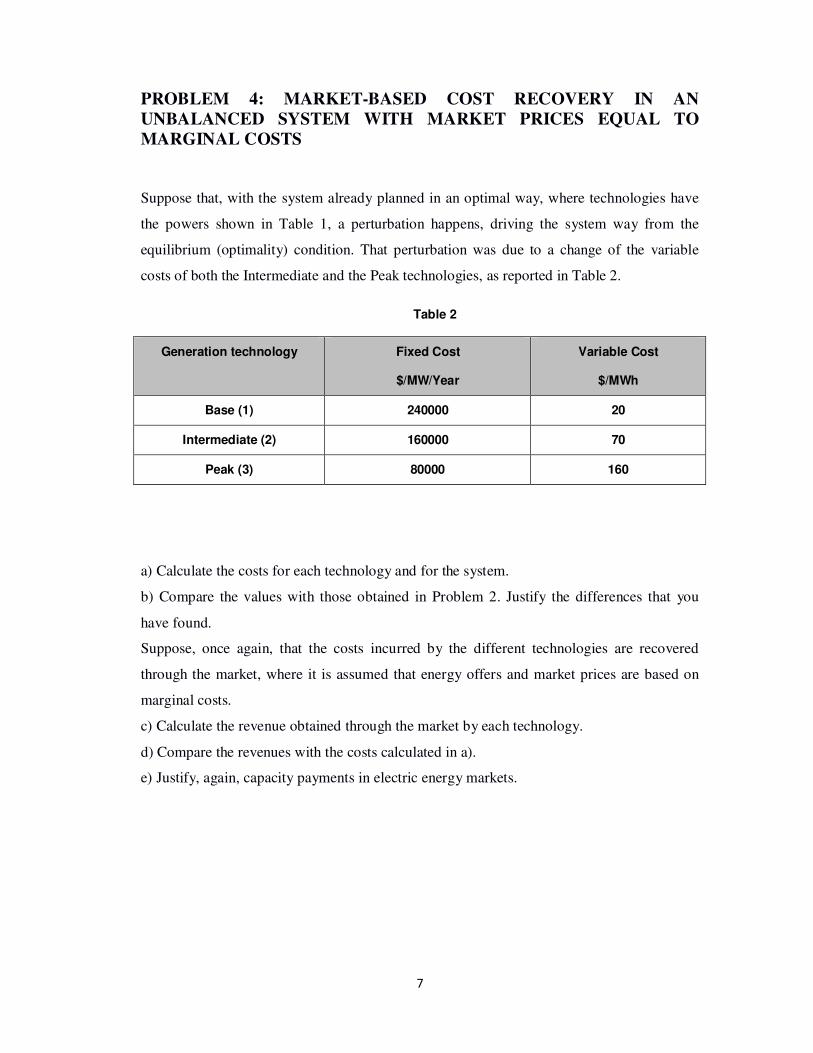
Suppose that, with the system already planned in an optimal way, where technologies have
the powers shown in Table 1, a perturbation happens, driving the system way from the
equilibrium (optimality) condition. That perturbation was due to a change of the variable
costs of both the Intermediate and the Peak technologies, as reported in Table 2.
Table 2
Generation technology Fixed Cost
$/MW/Year
Variable Cost
$/MWh
Base (1) 240000 20
Intermediate (2) 160000 70
Peak (3) 80000 160
a) Calculate the costs for each technology and for the system.
b) Compare the values with those obtained in Problem 2. Justify the differences that you
have found.
Suppose, once again, that the costs incurred by the different technologies are recovered
through the market, where it is assumed that energy offers and market prices are based on
marginal costs.
c) Calculate the revenue obtained through the market by each technology.
d) Compare the revenues with the costs calculated in a).
e) Justify, again, capacity payments in electric energy markets.

8
PROBLEM 5 – Incomes for Transportation and Distribution Companies The following figures represent the evolution in time of the income received by two
Portuguese companies, REN and EDP Distribution. These incomes are due to the activities
of transportation and distribution of electricity, respectively.

9
Group discussion in class:
a) REN and EDP Distribution are considered natural monopolies. What does it mean?
b) In relation to the figures, describe the meaning of the different components. How were the
numbers shown in the pictures obtained?
c) How do you justify the evolution in time of the different components? Calculate the
relation between the incomes obtained by REN and those obtained by EDP
Distribution (do not count in the concession rents). Comment on the results.
d) If the rate of return is the same for both companies and is worth 9%, calculate its RAV
(Regulatory Asset Value basis) of 2002 and 2011? Assuming t=0% (tax rate).
10
PROBLEM 6 – AGGREGATED OFFER AND DEMAND CURVES;
MARKET PRICE AND QUANTITY.
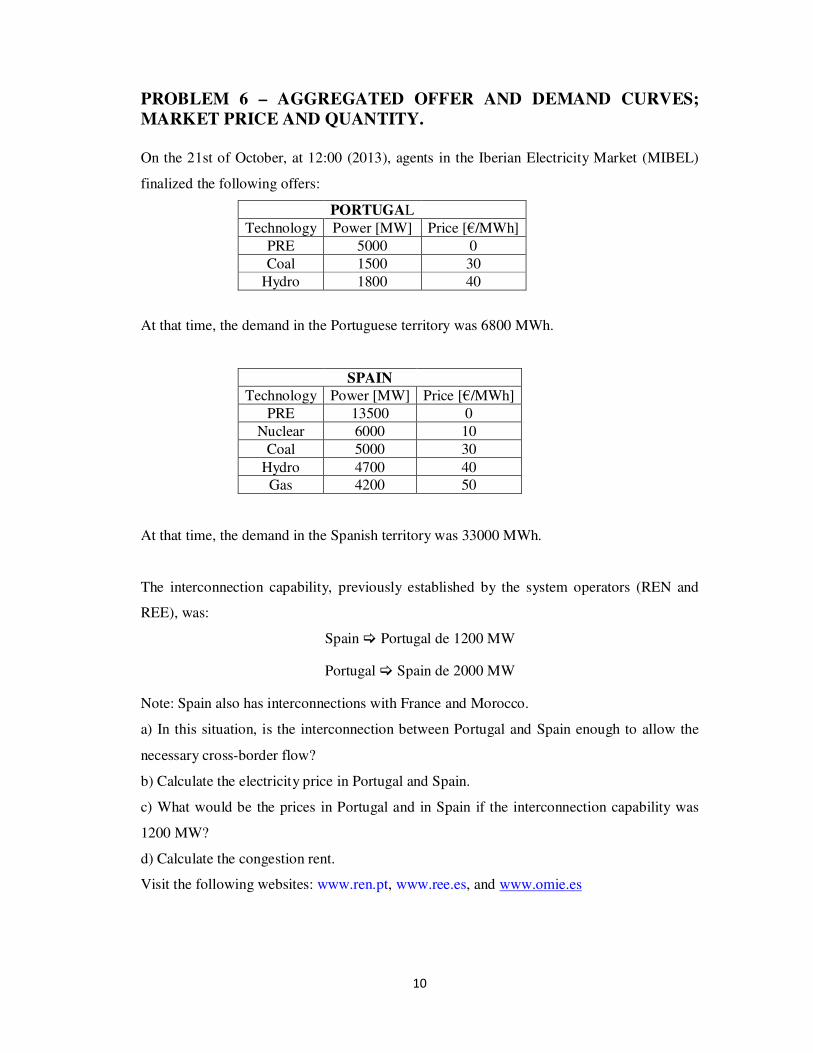
On the 21st of October, at 12:00 (2013), agents in the Iberian Electricity Market (MIBEL)
finalized the following offers:
PORTUGAL
Technology Power [MW] Price [€/MWh]
PRE 5000 0
Coal 1500 30
Hydro 1800 40
At that time, the demand in the Portuguese territory was 6800 MWh.
SPAIN
Technology Power [MW] Price [€/MWh]
PRE 13500 0
Nuclear 6000 10
Coal 5000 30
Hydro 4700 40 Gas 4200 50
At that time, the demand in the Spanish territory was 33000 MWh.
The interconnection capability, previously established by the system operators (REN and
REE), was:
Spain � Portugal de 1200 MW
Portugal � Spain de 2000 MW
Note: Spain also has interconnections with France and Morocco.
a) In this situation, is the interconnection between Portugal and Spain enough to allow the
necessary cross-border flow?
b) Calculate the electricity price in Portugal and Spain.
c) What would be the prices in Portugal and in Spain if the interconnection capability was
1200 MW?
d) Calculate the congestion rent.
Visit the following websites: www.ren.pt, www.ree.es, and www.omie.es
11
PROBLEMA 7 – PROJECT FINANCE
An entrepreneur wants to make an investment in a specific generation technology that is
subject to a feed-in tariff (in €/MWh), with a cost of 1100€ per installed kW. The O&M
costs are 20 €/kW and the average capacity factor from this technology is 25%.
1. Assuming a required rate of return for the investment of 10% and a plant lifetime equal to
the duration of the feed-in tariff, 20 years, calculate the tariff level that will render the
investment viable.
2. Now, assume that the tariff is the one calculated previously, and that 75% of the
investment comes from a 20-year loan with an interest rate of 5%. Assume a capacity factor
for this technology of 28%. Assume that inflation is zero
3. Calculate the net present value of the project.
4. What is the rate of return on equity for the project?
5. Retrace your calculations considering that the inflation rate is 2%.
PROBLEM 8 – TARIFFS: LOW VOLTAGE CONSUMER
A residential consumer (BTN, in Portugal) that has not embraced the liberalized market, and
is still in the transition market, has an annual consumption of around 3000 kWh and an
installed power of 6.9 kVA.
a) Assuming that this consumer is using the simple tariff (“tarifa simples”, in Portuguese),
compute the cost for his consumption, with and without VAT.
What is the average cost of energy?
b) This consumer is considering the adoption of the time-of-use, two-rate tariff.
What should be the conditions to adopt this type of tariff?
c) In practice, how is the maximum power of 6.9 kVA controlled?

12
PROBLEM 9: TARIFF: BIG CONSUMER
A big consumer High Voltage (60 kV) (AT, in Portugal), that has not opted yet for the
liberalized market, has a constant load diagram with a load of 20 MW.
a) Compute the cost associated with this energy consumption. What's the average cost of the
energy?
b) In order to reduce costs, this consumer is thinking about making an investment (for a
lifetime of 20 years with a discount rate of 6%) that will allow the installation to work only
in valley (“vazio”) and super-valley (“super vazio”) periods. What should be the maximum
investment level?
PROBLEM 10 – Average cost vs. marginal cost
In many references in Economy, figures similar to the one that follows, showing unitary
costs, are presented.
1. Demonstrate analytically that, at the intersection of the curves for average and marginal
cost, these costs are equal.
2. The producer sells at marginal cost. Is that reasonable? Justify.
3. Indicate an activity where the costs might be well characterized by the figure.
4. Is the electric energy industry characterized by the situation described in the figure?
Justify.

13
PROBLEM 11 – Theory of the Firm: Producers
Assume that a manufacturing process is characterized by the production function given by
the Cobb-Douglas expression
� = ���, � = 0,1�$�
Where K e L (e.g., capital and labor) are input variables (production factors) and Y
represents the output variable (production).
The production factors have unitary prices given by:
%& = 3
%( = 5
a) What type of returns to scale has this manufacturing process? Justify.
b) On the K and L axes draw the isoquant for Y=10�. What's the meaning of this curve?
c) Again, on the K and L axes draw a cost line. What's the meaning of the slope of this line?
d) Compute the minimum cost for the producer for an output quantity Y=10�. What's the
average cost of production?
e) If the unitary costs of the production factors are kept constant and the output production is
increased, will the average cost of production change? Justify.
PROBLEM 12 – Theory of the consumer
A consumer is characterized by the following expression for the utility function where a1 and
a2 are the consumer goods. Note that the utility function gives an order for the preferences.
��*+, *$ = 100*+�,,
*$�,-
The consumer goods a1 and a2 have the unitary prices given by:
%+ = 2
%$ = 4

14
The available consumer income is 90.
a) In the plane (a1, a2), draw the indifference curves. What do these curves mean?
b) Consider two distinct consuming profiles on the same indifference curve. Any point over
the line connecting the two points has an utility that is higher than the one given by the
indifference curve. Justify this.
c) What is the condition that implies that a given consuming profile has a higher utility than
another consuming profile?
d) What are the conditions for utility maximization given a specific available income?
Calculate for the parameters given in the problem.
e) What happens if the available income increases to 100, while keeping the unitary costs
constant? What if the price of good a2 decreases to p2=3, keeping the income constant?
PROBLEM 13 Single market (adjustment)
The following figures present the interaction between consumers and producers of a given
product market.
p
q
D
S
A
Fig. 1
Fig. 2
15
a) Explain how are obtained the supply and demand curbs of the market
b) What are the return to scale presented in figures? Justify
c) Apply the price and quantity adjustments to markets presented in figures.
d) In the two figures, the market demand is the same, given by ( ) qqpD 4,04,1 −=
The supply functions are different and are given by ( ) qqpS 6,04,0 += and
( ) qqpS 2,02,1 −= . With the adjustment of quantity, establish and solve the equations
of evolution of the two markets.
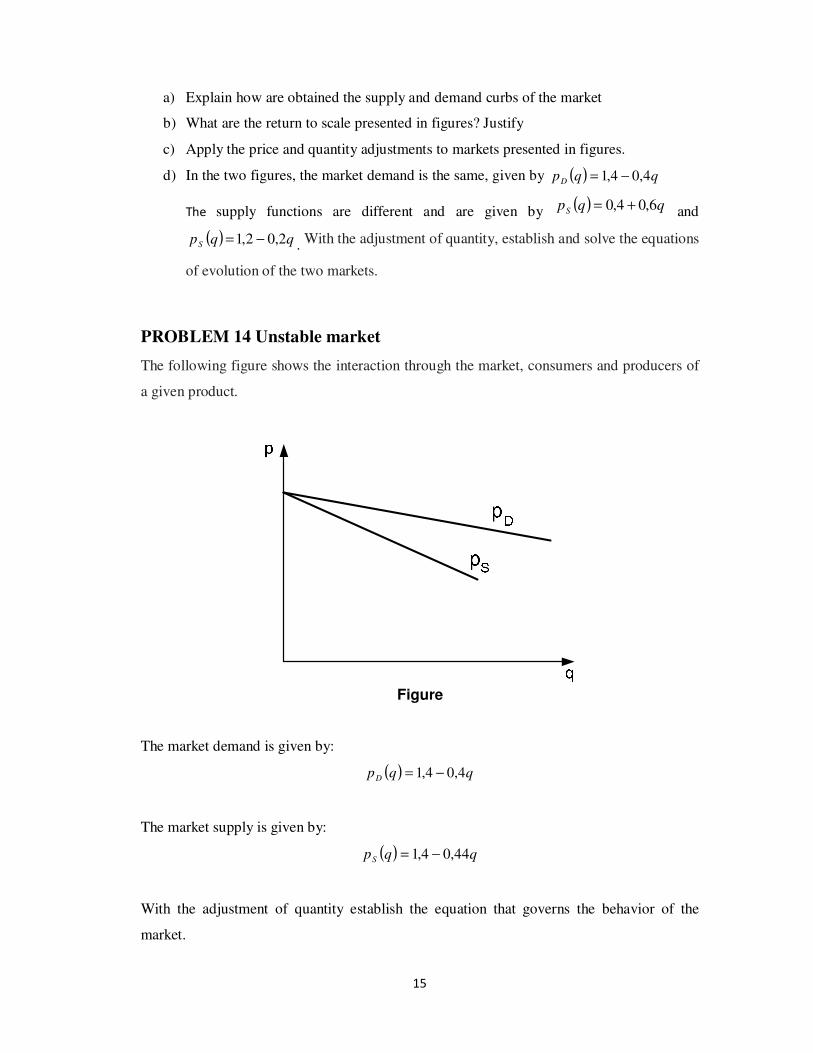
PROBLEM 14 Unstable market
The following figure shows the interaction through the market, consumers and producers of
a given product.
Figure
The market demand is given by:
( ) qqpD 4,04,1 −=
The market supply is given by:
( ) qqpS 44,04,1 −=
With the adjustment of quantity establish the equation that governs the behavior of the
market.

16
b) The system is stable or unstable? Justify.
c) What is the result obtained for the quantity of product on the market? What is the selling
price of the product? Justify.
d) With the adjustment of price what results are obtained?
PROBLEM 15 Monopoly
The following figure shows a situation characterized by a monopoly.
p
q
C. averageC. marginal
A
B
Demand
Figure
The total cost of the monopolist is given by:
qqCT 2100)( +=
The market supply is given by:
( ) qqpD
5.0140 −=
a) In the situation where the monopoly is regulated, the regulator tries to fix the price at
the point A or point B? Justify.
b) Determine the price and quantity characterizing the point A.
c) In the situation, where the monopoly is unregulated, the monopolist theoretically
maximizes the profit. Determine the point (quantity and price) that maximizes profit.
d) Compare the values of the previous question with the values obtained at point A.

17
PROBLEM 16: Perfect Competition
The following figure shows a situation of perfect competition.
Figure
The designation of perfectly competitive market reflects a situation characterized by:
a) A multitude of consumers and a large number of producers, i.e. each agent has a small
size that does not allow it, alone, continuously influence market development.;
b) Producers; firms, produce a homogenous product;
c) Agents have complete information;
d) There are no barriers to entry and exit of firms.
1. What mean these conditions?
2. What kind of return to scale presents the perfect competition? Justify.


![[Larson 1983] problem solving through problems](https://img.dokumen.tips/doc/110x75/55890695d8b42adb4c8b470c/larson-1983-problem-solving-through-problems.jpg)