Embed Size (px)
Citation preview
1
3
4
5
6 Q1
7
8
1 0
1112131415
1617181920212223
2 4
46
47
48
49
50
51
52
53
54
55
56
57
58
59
60
61
62
Q2
Knowledge-Based Systems xxx (2013) xxx–xxx
KNOSYS 2624 No. of Pages 16, Model 5G
14 September 2013
Contents lists available at ScienceDirect
Knowledge-Based Systems
journal homepage: www.elsevier .com/ locate /knosys
Class imbalance and the curse of minority hubs
0950-7051/$ - see front matter � 2013 Elsevier B.V. All rights reserved.http://dx.doi.org/10.1016/j.knosys.2013.08.031
⇑ Corresponding author. Tel.: +386 30380238.E-mail addresses: [email protected] (N. Tomašev), [email protected]
(D. Mladenic).
Please cite this article in press as: N. Tomašev, D. Mladenic, Class imbalance and the curse of minority hubs, Knowl. Based Syst. (2013), http://dx.d10.1016/j.knosys.2013.08.031
Nenad Tomašev ⇑, Dunja MladenicInstitute Jozef Stefan, Artificial Intelligence Laboratory, Jamova 39, 1000 Ljubljana, Slovenia
25262728293031323334353637
a r t i c l e i n f o
Article history:Received 6 May 2013Received in revised form 28 August 2013Accepted 29 August 2013Available online xxxx
Keywords:Class imbalanceClass overlapClassificationk-Nearest neighborHubnessCurse of dimensionality
38394041424344
a b s t r a c t
Most machine learning tasks involve learning from high-dimensional data, which is often quite difficultto handle. Hubness is an aspect of the curse of dimensionality that was shown to be highly detrimental tok-nearest neighbor methods in high-dimensional feature spaces. Hubs, very frequent nearest neighbors,emerge as centers of influence within the data and often act as semantic singularities. This paper dealswith evaluating the impact of hubness on learning under class imbalance with k-nearest neighbor meth-ods. Our results suggest that, contrary to the common belief, minority class hubs might be responsible formost misclassification in many high-dimensional datasets. The standard approaches to learning underclass imbalance usually clearly favor the instances of the minority class and are not well suited for han-dling such highly detrimental minority points. In our experiments, we have evaluated several state-of-the-art hubness-aware kNN classifiers that are based on learning from the neighbor occurrence modelscalculated from the training data. The experiments included learning under severe class imbalance, classoverlap and mislabeling and the results suggest that the hubness-aware methods usually achieve prom-ising results on the examined high-dimensional datasets. The improvements seem to be most pro-nounced when handling the difficult point types: borderline points, rare points and outliers. On mostexamined datasets, the hubness-aware approaches improve the classification precision of the minorityclasses and the recall of the majority class, which helps with reducing the negative impact of minorityhubs. We argue that it might prove beneficial to combine the extensible hubness-aware voting frame-works with the existing class imbalanced kNN classifiers, in order to properly handle class imbalanceddata in high-dimensional feature spaces.
� 2013 Elsevier B.V. All rights reserved.
45
63
64
65
66
67
68
69
70
71
72
73
74
75
76
77
78
79
1. Introduction
Nearest-neighbor methods form an important group of tech-niques involved in solving various types of machine learning tasks.They are based on a simple assumption that neighboring pointsshare certain common properties. Often enough, they also sharethe same label, which is why so many different k-nearest neighborclassification algorithms have been developed over the years[28,54,36,64,53,90].
The basic k-nearest neighbor algorithm (kNN) [19] is quite sim-ple. The label in the point of interest is derived from its k-nearestneighbors by a majority vote. The kNN rule has some favorableasymptotic properties [11].
Under the basic kNN approach, no model is generated in thetraining phase and the target function is inferred locally whenthe query is made to the system. Methods with this property aresaid to perform lazy learning.
80
81
82
83
84
Algorithms which induce classification models usually adoptthe maximum generality bias [33]. In contrast, the k-nearest neigh-bor classifier exhibits high specificity bias, since it retains all theexamples. The specificity bias is considered a desired property ofalgorithms designed for handling highly imbalanced data. Not sur-prisingly, kNN has been advocated as one way of handling suchimbalanced data sets [84,33].
Data sets with significant class imbalance often pose difficultiesfor learning algorithms [87], especially those with a high generalitybias. Such algorithms tend to over-generalize on the majority class,which in turn leads to a lower performance on the minority class.Designing good methods capable of coping with highly imbalanceddata still remains a daunting task.
Certain concerns have recently been raised about the applicabil-ity of the basic kNN approach in imbalanced scenarios [23]. Themethod requires high densities to deliver good probabilityestimates. These densities are often closely related to class size,which makes kNN somewhat sensitive to the imbalance level. Thedifference among the densities between the classes becomes criticalin the overlap regions. Data points from the denser class (usually themajority class) are often encountered as neighbors of points from theless dense category (usually the minority class). In high-dimensional
oi.org/
85
86
87
88
89
90
91
92
93
94
95
96
97
98
99
100
101
102
103
104
105
106
107
108
109
110
111
112
113
114
115
116
117
118
119
120
121
122
123
124
125
126
127
128
129
130
131
132
133
134
135
136
137
138
139
140
141
142
143
144
145
146
147
148
149
150
151
152
153
154
155
156
157
158
159
160
161
162
163
164
165
166
167
168
169
170
171
172
173
174
175
176
177
178
179
180
181
182
183
184
185
2 N. Tomašev, D. Mladenic / Knowledge-Based Systems xxx (2013) xxx–xxx
KNOSYS 2624 No. of Pages 16, Model 5G
14 September 2013
data the task is additionally complicated by the well known curse ofdimensionality.
High dimensionality often exhibits a detrimental influence onclassification, since all data is sparse and density estimates tendto become less meaningful. It also gives rise to the phenomenonof hubness [59], which greatly affects nearest neighbor methodsin high-dimensional data. The distribution of neighbor occurrencesbecomes skewed to the right and most points either never occur ink-neighbor sets or occur very rarely. A small number of points,hubs, account for most of the observed neighbor occurrences. Hubsare very frequent nearest neighbors1 and, as such, exhibit a sub-stantial influence on subsequent reasoning.
The hubness issue first emerged in music retrieval and recom-mendation systems, where some songs were being too frequentlyretrieved, even in such cases where it was impossible to discernsome reasonable semantic correlation to the queries [3,2]. Suchsong hubs were detrimental to the system performance. It was ini-tially thought that this was merely a consequence of the discrepan-cies between the perceptual similarity and the specific similaritymeasures employed by the systems. It was later demonstrated thatintrinsically high-dimensional data with finite and well-definedmeans has a certain tendency for exhibiting hubness [59,51,60,61]and that changing the similarity measure can only reduce, but notentirely eliminate the problem. Boundary-less high-dimensionaldata does not necessarily exhibit hubness [47], but this case doesnot arise often in practical applications. The phenomenon of hub-ness will be discussed in more detail in Section 3.
The fact that neighbor occurrence distributions assume a cer-tain shape in high-dimensional data gives us additional informa-tion which can be taken into account in algorithm design. Severalsimple hubness-aware kNN classification methods have recentlybeen proposed in an attempt to tackle this problem explicitly. Aninstance-weighting scheme was first proposed in [59], which re-duces the bad influence of hubs during voting. An extension ofthe fuzzy k-nearest neighbor framework was shown to besomewhat better on average [81], introducing the concept ofclass-conditional hubness of neighbor points and building an occur-rence model which is used in classification. This approach was fur-ther improved by considering the information content of eachneighbor occurrence [75]. An alternative approach in treating eachoccurrence as a random event was explored in [79], where it wasshown that some form of Bayesian reasoning might be yet anotherfeasible way of dealing with changes in the occurrence distribu-tion. More details on the algorithms will be given in Section 3.4.
1.1. Project goal
The phenomenon of hubness has not been studied under theassumption of class imbalance in high-dimensional data and itsimpact on learning with kNN methods in skewed label distribu-tions was unknown. This raises some concerns, as most real-worlddata is intrinsically high-dimensional and many important prob-lems are also class-imbalanced.
The goal of this project was to examine the influence of hubnesson learning under class imbalance, as well as test the performanceand robustness of the existing hubness-aware kNN classificationmethods in order to evaluate whether they might be appropriatefor handling such highly complex classification tasks.
Most misclassification is known to occur in borderline regions,where different classes meet and overlap. Class imbalance posesa problem only if a significant class overlap is present [56], so bothof these factors must be considered carefully. In our experiments,
1 Formally, in accordance with the existing definitions in the literature [59], we willsay that hubs are points that have an occurrence count exceeding the mean (k) bymore than two standard deviations of the neighbor occurrence distribution.
Please cite this article in press as: N. Tomašev, D. Mladenic, Class imbalance an10.1016/j.knosys.2013.08.031
we have generated several synthetic imbalanced high-dimensionaldata sets with severe overlap between different distributions in or-der to see if the hubness-aware algorithms are able to overcomethis obstacle by relying on their occurrence models.
Real-world data labels are not always very reliable. Data is usu-ally labeled by people and people make mistakes. This is why wedecided to examine the influence of very high levels of artificiallyinduced mislabeling on the classification process.
1.2. Contributions
This research is the first attempt to correlate hubness as an as-pect of the dimensionality curse with the problem of learning un-der class imbalance. Our analysis shows some surprising results, asour tests suggest that the minority class induces high misclassifi-cation of the majority class in many high-dimensional datasets,contrary to the low-dimensional case. We do not imply that thiswould always be the case, but it is an entirely new possibility thathas so far been overlooked in algorithm design and needs to becarefully considered and taken into account.
We have performed an extensive experimental evaluation andshown that the recently proposed hubness-aware neighbor occur-rence models achieve promising performance in several difficulttypes of classification problems: learning under class imbalance,mislabeling and class overlap in intrinsically high-dimensionaldata.
Our experiments suggest that the observed improvements stemfrom being able to better handle the difficult point types: border-line points, rare points and outliers. Additionally, the analysis re-veals that, in most cases, the hubness-aware methods improvethe recall of the majority class and the precision of the minorityclasses. This helps in improving the classification performance inpresence of minority hubs.
Based on these encouraging results and the extensibility of thehubness-aware voting frameworks, we argue that it might be ben-eficial to combine them with the existing techniques for classimbalanced data classification, in order to improve system perfor-mance in high-dimensional data under the assumption of hubness.
2. Related work
2.1. Class imbalanced data classification
The problem of learning from imbalanced data has recently at-tracted attention of both industry and academia alike. Many classi-fication algorithms used in real-world systems and applications fail
Fig. 1. The change in the distribution shape of 10-occurrences (N10) in i.i.d.Gaussian data with increasing dimensionality when using the Euclidean distance.The graph was obtained by averaging over 50 randomly generated data sets. Hub-points exist also with N10 > 60, so the graph displays only a restriction of the actualdata occurrence distribution.
d the curse of minority hubs, Knowl. Based Syst. (2013), http://dx.doi.org/

186
187
188
189
190
191
192
193
194
195
196
197
198
199
200
201
202
203
204
205
206
207
208
209
210
211
212
213
214
215
216
217
218
219
220
221
222
223
224
225
226
227
228
229
230
231
232
233
234
235
236
237
238
239
240
241
242
243
244
245
246
247
248
249
250
251
252
253
254
255
256
257
258
259
260
261
262
263
264
265
266
267
268
N. Tomašev, D. Mladenic / Knowledge-Based Systems xxx (2013) xxx–xxx 3
KNOSYS 2624 No. of Pages 16, Model 5G
14 September 2013
to meet the performance requirements when faced with severeclass distribution skews [31,18,39,5] and overlapping data distribu-tions [56]. Various approaches have been developed in order to dealwith this issue, including some forms of class under-sampling orover-sampling [9,24,30,45,91,4,25,46,93], synthetic data genera-tion [67], misclassification cost-sensitive techniques [49,68],decision trees [44], rough sets [42], kernel methods [89,34], ensem-bles [21,22] or active learning [15,14]. Novel classifier designs arestill being proposed [48].
Many classification approaches for handling class imbalanceddata are extensions of the basic kNN rule. Introducing an explicitbias towards the minority class is a standard strategy, either byintroducing instance weights [65,86] or in some other way [92].Even though such a bias might help in handling some minorityclasses in some datasets, global weighting approaches are knownto face certain problems. Namely, performance depends mostlyon the levels of imbalance in certain regions of the data spacewhere different classes overlap, which often varies and is not con-stant throughout the data volume. Taking the local class distribu-tions into account seems to be a somewhat more flexibleapproach [12].
The examplar-based kNN [41] introduces the concept of pivotminority points that are expanded to Gaussian balls, which makesthem closer to other minority examples.
It has been suggested that the main problem when workingwith kNN under class imbalance lies in trying to estimate the priorclass probabilities in the points of interest [43] and that somewhatmore complex probabilistic models are required. When not muchtraining data is available, semi-supervised approaches might beemployed [26].
269
270
271
272
273
274
275
2.2. Hubness-aware methods
Hubness of the data is known to be detrimental to various ma-chine learning and data mining tasks [59]. Several robust hubness-aware methods have recently been proposed for classification[59,81,79,75,76], instance selection for time series analysis [8],clustering [80,82], information retrieval [70], bug duplicate detec-tion [69] and metric learning [73,74,63].
276
277
278
279
280
281
282
283
284
285
286
287
288
289
290
291
292
Table 1Classification accuracy of kNN and four hubness-aware kNN algorithms (hw-kNN,NHBNN, h-FNN, HIKNN) on one compromised high dimensional 3-category image
3. The hubness phenomenon
3.1. Emergence of hubs
Let D ¼ ðx1; y1Þ; ðx2; y2Þ; . . . ; ðxn; ynÞ be the data set, where eachxi 2 Rd resides in a high-dimensional Euclidean space2 andyi 2 c1; c2; . . . ; cC are instance labels. Denote by DkðxiÞ the k-neighbor-hood defined by the nearest neighbors of xi. Also, let NkðxiÞ be thenumber of k-occurrences (occurrences in k-neighbor sets) of xi andby Nk;cðxiÞ the number of such occurrences in neighborhoods of ele-ments from class c. We will also refer to Nk;c as class-conditionaloccurrence frequency.
The phenomenon of hubness is expressed as an increased skew-ness of the k-neighbor occurrence distribution in high dimensions.This is illustrated in Fig. 1 for the Gaussian mixture data. A certainnumber of hub-points occur very frequently and permeate most k-neighbor sets, while most other points occur very rarely. This con-stitutes a sort of an information loss, as most available informationis very poorly utilized. We will refer to the rarely occurring pointsas anti-hubs or orphans.
2 For the sake of simplicity, we will restrict our discussion on the Euclidean case, asthis is where the hubness phenomenon has been shown to arise as a consequence ofdistance concentration. It is, of course, possible for hubs to emerge in categorical ormixed datasets as well.
Please cite this article in press as: N. Tomašev, D. Mladenic, Class imbalance an10.1016/j.knosys.2013.08.031
Dimensionality reduction cannot entirely eliminate the prob-lem [60]. Only by reducing the dimensionality well below theintrinsic dimensionality of the data it is possible to achieve a signif-icant decrease in data hubness. This leads to an information lossthat might also hurt system performance. It seems that takingthe hubness into account while working with high-dimensionaldata might be a better practical decision.
Hubness is related to the distance concentration phenomenon,which is another well-known aspect of the dimensionality curse.The relative contrast between the maximal and the minimal dis-tance observed on the data decreases with increasing dimensional-ity, thereby making it harder to distinguish between relevant andirrelevant points [20,1]. Some researchers have even been inclinedto question whether the concept of nearest neighbors is meaning-ful in high dimensional spaces [13].
Due to the concentration of distances, high-dimensional datalies approximately on hyper-spheres centered around clustermeans. Data points closer to the means have a much higher prob-ability of being included in k-neighbor sets. Most hubs emerge pre-cisely in the central cluster regions and the neighbor occurrencefrequency can be used as a good indicator of local point centralityin intrinsically high-dimensional data [82].
3.2. Good and bad hubness
In labeled data, some k-occurrences are good and some are bad.Occurrences are bad when there is label mismatch – when an ob-served point and its neighbor do not share the same label. Badoccurrences are, naturally, detrimental to kNN classification.Hub-points that frequently occur as bad neighbors are referred toas bad hubs and their overall bad occurrence frequency as bad hub-ness. So, by NkðxiÞ ¼ GNkðxiÞ þ BNkðxiÞ, hubness of a point is decom-posed into good and bad hubness.
3.3. ‘‘How bad can it be?’’: motivating examples
All misclassification in nearest-neighbor methods is ultimatelya result of label mismatches in k-neighbor sets. In very high dimen-sional data, bad hubness of individual points becomes more impor-tant, as hubs become more influential and have a higher impact onthe classification process. We will illustrate the increased influenceof hubs by considering a peculiar data set described in [71].
The data comprised a set of 2731 quantized image representa-tions based on Haar wavelet features, belonging to 3 different cat-egories, with some imbalance. An unexpected problem wasencountered while varying the dimensionality in order to deter-mine the optimal size of the visual word vocabulary. The kNN clas-sification performance deteriorated significantly in higherdimensions and even ended up being worse than zero-rule. The re-sults are shown in Table 1.
Subsequent analysis of the data had revealed the underlyingcauses behind the apparent drop in classifier performance. Itturned out that exactly 5 images had been assigned empty repre-sentations (zero vectors) due to an I/O error. Removing these 5points was enough to raise the kNN classification accuracy from21.2% to around 90%. It was astonishing that only 5 erroneous
dataset.
Data set 5-NN hw-kNN NHBNN h-FNN HIKNN
ImNet3Err 21.2 ± 2.1 27.1 ± 11.3 59.5 ± 3.2�
59.5 ± 3.2�
59.6 ± 3.2�
d the curse of minority hubs, Knowl. Based Syst. (2013), http://dx.doi.org/

293
294
295
296
297
298
299
300
301
302
303
304
305
306
307
308
309
310
311
312
313
314
315
316
317
318
319
320
321
322
323
324
325
326
327
328
329
330
331
332
333
334
335
336
337
338
339
340341
343343
344
345
346
347
348
349
350351
353353
354
355
356
357
358
359
360
361
362
363
Fig. 3. The proportion of bad image hubs in the majority and the minority class, forseveral different feature representations: SIFT, SURF and ORB.
4 N. Tomašev, D. Mladenic / Knowledge-Based Systems xxx (2013) xxx–xxx
KNOSYS 2624 No. of Pages 16, Model 5G
14 September 2013
points (out of 2731) were enough to render kNN useless. It wasdetermined that this was a consequence of hubness.
An increase in data dimensionality had resulted in these 5points becoming prominent hubs in a clearly pathological way,due to an interplay of certain properties of the metric and the fea-ture representation. This is illustrated in Fig. 2. Most observedoccurrences induced label mismatches, since the hub points be-longed to the minority class.
This extreme example was a consequence of erroneous dataprocessing and it might be argued that it does not reflect wellthe phenomena that occur in error-free data. However, it is usuallynot the erroneous points that become hubs in practice [58]. It isvery difficult to predict where the hubs would emerge for a givendata set.
In order to better illustrate that the minority class points mightpose certain problems when they become hubs in high-dimen-sional data, we will briefly mention another real-world example,on WIKImage data [55,78], a set of publicly available Wikipediaimages. The distribution of bad hubs for a binary ‘‘person detec-tion’’ problem (WM-l1) is shown in Fig. 3. The majority class ac-counts for 79.5% of the data, yet it contains only a small portionof the bad hubs within the data, under several different featurerepresentations: SIFT, SURF and ORB. This phenomenon will be dis-cussed in more detail in Section 4.2, as it has significant conse-quences for data analysis.
An image data visualization tool has recently become available[77] that allows for quick and easy detection of critical hub pointsin the data and can be used to examine the nature of their influ-ence. This allows the developers to detect and correct similar is-sues in their image search and object detection systems.
3.4. Hubness-aware classification
Several hubness-aware k-nearest neighbor methods have re-cently been proposed for robust high-dimensional dataclassification.
� hw-kNN: This weighting algorithm [59] is the simplest wayto reduce the influence of bad hubs – they are simplyassigned lower voting weights. Each neighbor vote isweighted by e�hbðxiÞ, where hbðxiÞ is the neighbor’s standard-ized bad hubness score. All neighbors still vote by theirown label (unlike in the algorithms considered below),which might prove disadvantageous sometimes, as impliedby the example in Table 1.
� h-FNN: ucðxiÞ ¼Nk;cðxiÞNkðxiÞ
(relative class hubness) can be inter-preted as the fuzziness of the event that xi had occurredas a neighbor. Hence, h-FNN [81] integrates class hubness
Fig. 2. The 5 major hub-points in the data from the example analyzed in Table 1.We see that most of their hubness is in fact bad hubness. Hubs are not necessarilybad, but that is indeed often the case in practice.
Please cite this article in press as: N. Tomašev, D. Mladenic, Class imbalance an10.1016/j.knosys.2013.08.031
into a fuzzy k-nearest-neighbor voting framework [38].This means that the label probabilities in the point of inter-est are estimated as:
d the c
ucðxÞ ¼P
xi2DkðxÞucðxiÞPxi2DkðxÞ
Pc2CucðxiÞ
ð1Þ
Special care has to be given to anti-hubs and their occurrencefuzziness is estimated as the average fuzziness of points from thesame class. Optional distance-based vote weighting is possible.
� NHBNN:Each k-occurrence can be treated as a randomevent. What NHBNN [79] does is that it essentially per-forms a Naive-Bayesian inference from these k events.
pðyi ¼ cjDkðxiÞÞ /
pðyi ¼ cÞYk
t¼1
pðxit 2 DkðxiÞjyi ¼ cÞ:ð2Þ
Even though k-occurrences are highly correlated, NHBNN still offerssome improvement over the basic kNN. Anti-hubs are, again, trea-ted as a special case.
� HIKNN:Recently, class-hubness was also exploited in aninformation-theoretic approach to k-nearest neighbor clas-sification [75]. Rare occurrences have higher self-informa-tion (Eq. (3)) and and are favored by the algorithm. Hubs,on the other hand, lie closer to cluster centers and carry lesslocal information relevant for the particular query.
364
366366
pðxit 2 DkðxÞÞ �NkðxitÞ
N
Ixit¼ log
1pðxit 2 DkðxÞÞ
ð3Þ
367
368
369
Occurrence self-information is used to define the absolute and rel-ative relevance factors in the following way:
370
372372
aðxitÞ ¼Ixit�minxj2DIxj
log n�minxj2DIxj
; bðxitÞ ¼Ixit
log Nð4Þ
373
374
375
376
377
The final fuzzy vote combines the information contained in theneighbor’s label with the information contained in its occurrenceprofile. The relative relevance factor is used for weighting the twoinformation sources. This is shown in Eq. (5)
urse of minority hubs, Knowl. Based Syst. (2013), http://dx.doi.org/
379379
380
382382
383
384
385
386
387
389389390
391
392
393
394
395
396
397
398
399
400
401
402
403
404
405
406
407
408
409
410
411
412
413
414
415
416
417
418
419
420
421
422
423
424
425
426
427
428
429
430
431
432
433
434
435
436
437
438
N. Tomašev, D. Mladenic / Knowledge-Based Systems xxx (2013) xxx–xxx 5
KNOSYS 2624 No. of Pages 16, Model 5G
14 September 2013
Please10.101
�pkðyi ¼ cjxit 2 DkðxiÞÞ ¼Nk;cðxitÞNkðxitÞ
¼ �pk;cðxitÞ
pkðyi ¼ cjxitÞ �aðxitÞ þ ð1� aðxitÞÞ � �pk;cðxitÞ; yit ¼ c
ð1� aðxitÞÞ � �pk;cðxitÞ; yit – c
�ð5Þ
The final class assignments are given by the weighted sum of thesefuzzy votes, as shown in Eq. (6). The distance weighting factordwðxitÞ yields mostly minor improvements and can be left out inpractice.
k
ucðxiÞ /Xt¼1
bðxitÞ � dwðxitÞ � pkðyi ¼ cjxitÞ ð6Þ
439
440
441
442
443
444
445
446
447
448
449
450
451
452
453
454
455
456
457
458
459
460
461
462
463
464
465
466
467
468
469
470
471
472
473
474
475
476
477
478
479
480
481
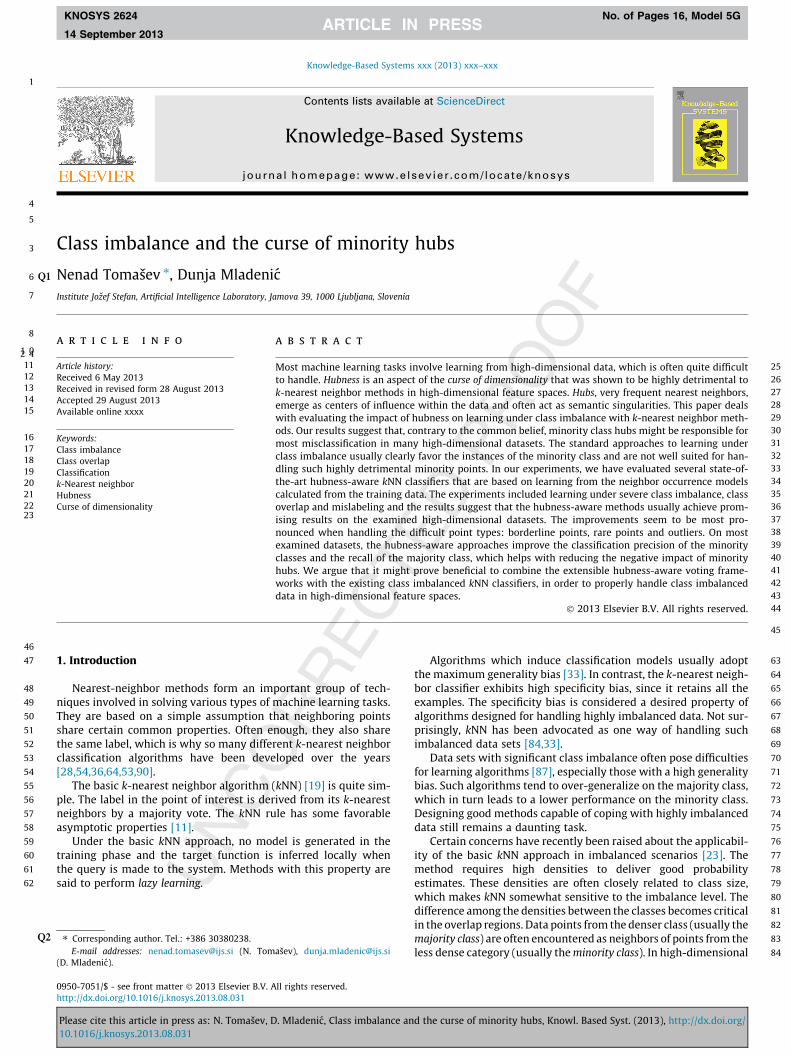
Fig. 4. An illustrative example. Point under consideration is marked by ‘‘x’’ and NN(x) = xb . However, xb is a mislabeled point. Reasoning by the 1-NN rule, we wouldconclude that y = 1, which is probably wrong, looking at the data. On the otherhand, if we were to reason according to class hubness, we would infer y = 0, becausexb was previously a neighbor of instances labeled ‘‘0’’. This shows how learning fromprevious occurrences can help in making the nearest neighbor classifiers less proneto errors in mislabeled data sets.
NHBNN, HIKNN, and h-FNN utilize class-conditional occurrencefrequency estimates to perform classification based on the neigh-bor occurrence models. In high-dimensional data, this might besomewhat better than voting by label [75].
Computing all the k-neighbor sets accurately in the trainingphase could sometimes become overly time-consuming whenworking with big data. In such cases, approximate kNN graph con-struction methods can be considered instead. One such approach[10] was analyzed in [75] and it was shown that hubness-awarealgorithms outperform the kNN baseline on high-dimensional dataeven if the entire graph is approximated in linear time (instead ofHðdn2Þ) and that very good approximations are usually availablewith a modest time investment (Hðdn1:2Þ or Hðdn1:4Þ).
4. Hypotheses and methodology
4.1. Bad hubness in mislabeled data
Obviously, mislabeled and noisy instances both contribute tothe overall bad hubness of the data. The case discussed in Table1 and Fig. 2 is a rather extreme example of how much damagecan be caused by noisy measurements in many dimensions. Theimpact of erroneous labels and inaccurate numeric values is thehighest precisely when they are present in hub-points. Hubs caneasily spread both correct and incorrect/corrupted information.
Unfortunately, as we have already seen, there is no guaranteethat errors will be contained among the rarely occurring examples.The exact distribution of hubness among data points dependsheavily on the particular choice of feature representation and sim-ilarity measure and is, in general, very hard to predict.
Hypothesis: By using the neighbor occurrence models learnedon the training data, the hubness-aware kNN algorithms shouldin most cases be able to cope with bad hubness caused by misla-beling and/or noisy data.
A neighbor occurrence model is any model that can be used forpredicting the probability of a certain point occurring as a neighborin a kNN set of a query point that belongs to a specific class. In ourexperiments, these probabilities are directly estimated from thekNN graph on the training data, based on the class-conditionaloccurrence frequencies of all the training points.
In our experiments we have focused on the former, as it is easierto evaluate. Noise, on the other hand, can take various forms(Gaussian, non-Gaussian), be present in various intensities and dis-tributed in various ways across the data.
An illustrative example explaining how the class-conditionaloccurrence information can be used in order to help with dealingwith mislabeled data points is given in Fig. 4.
Mislabeled examples are not uncommon in large, complex sys-tems. Detecting and correcting such data points is not an easy taskand many correction algorithms have been proposed in an attemptto solve the problem [29,27,83]. Regardless, some errors always re-
cite this article in press as: N. Tomašev, D. Mladenic, Class imbalance an6/j.knosys.2013.08.031
main in the data. This is why robustness to mislabeling is veryimportant in classification algorithms.
4.2. Bad hubness under class imbalance
The usual interpretation of the bad influence of class imbal-anced data on kNN classification is that the majority class pointswould often become neighbors of the minority class examples,due to the relative difference in densities between different catego-ries. As neighbors, they would often cause misclassification of theminority class. Consequently, the methods which are being pro-posed for imbalanced data classification and (briefly outlined inSection 2.1]), are focused primarily on rectifying this by improvingthe overall classifier performance on the minority class. Naturally,something has to be sacrificed in return and usually it is the recallof the majority class.
This is certainly reasonable. In many real-world problems themisclassification cost is much higher for the minority class. Somewell known examples include cancer diagnosis, oil spill recogni-tion, earthquake prediction, terrorist detection, etc. However,things are not so simple as they might seem. Often enough, the costof misclassifying the majority class is almost equally high. In frauddetection [16,17], accusing innocent people of fraud might losecustomers for the companies involved and incur a significantfinancial loss. Even in breast cancer detection it has recently beenshown that the current diagnostic techniques lead to significantover-diagnosis of cancer cases [37]. This leads to many otherwisehealthy women being admitted for treatment and subjected to var-ious drug courses and/or operating procedures.
In Section 3.3, we have seen how things may go awry if theminority instances turn into bad hubs. This can be caused by noiseor mislabeling, but it is not necessarily the case in practice. Prob-lems might arise in completely ‘clean’ datasets as well.
Hypothesis: The examples outlined in Section 3.3 had led us tohypothesize that, in intrinsically high-dimensional data, the pri-mary concern should be the minority class hubs causing misclassifi-cation of the majority class points instead of the other way around.
This is exactly the opposite of what most imbalanced data clas-sification algorithms are trying to solve. It is a very importantobservation, especially because most of the data that is being auto-matically processed and mined is in fact high-dimensional andexhibits hubness, whether it is text, images, video, time series,etc. [59,60,71,62].
If our hypothesis were to hold, this would pose a new challengefor the imbalanced data classification algorithm design, as future
d the curse of minority hubs, Knowl. Based Syst. (2013), http://dx.doi.org/

482
483
484
485
486
487
488
489
490
491
492
493
494
495
496
497
498
499
500
501
502
503
504
505
506
507
508
509
510
511
512
513
514
515
516
517
518
519
520
521
522
523
524
525
526
527
528
529
530
531
532
533
534
535
536
537
538
539
540
541
542
543
544
545
546
547
548
549
6 N. Tomašev, D. Mladenic / Knowledge-Based Systems xxx (2013) xxx–xxx
KNOSYS 2624 No. of Pages 16, Model 5G
14 September 2013
algorithms would need to incorporate mechanisms of improvingboth the minority and the majority class recall at the same time.This is non-trivial problem.
Such a phenomenon is easy to overlook, as it is highly counter-intuitive. In lower dimensional data, most misclassification inimbalanced data sets occurs in border regions where classes over-lap and have different densities. As the minority classes usuallyhave a lower density in those regions, they get misclassified moreoften. However, most misclassification in high-dimensional data iscaused by bad hubs – and they can emerge in unpredictable places.As point-wise occurrence frequencies depend heavily on the choiceof metric and feature representation, the arising structure of influ-ence does not necessarily reflect the semantics of the data well. Infact, hubs often become semantic singularities and places wherethe semantic consistency of the kNN structure becomes most com-promised [59–61].
With that in mind, consider a simplified example given in Fig. 5.The 1-NN misclassification rate for a particular hub-point wouldtrivially be maximized if its label were to match the minority classin its occurrence profile. In the more general case of kNN, these la-bel mismatches do not necessarily induce misclassification, but acumulative effect of several co-occurring hub points would havethe same negative outcome. If we were to think of hubness as apurely geometric property that is not well aligned with datasemantics, we would expect the distribution of classes in theoccurrence profiles of major hubs to tend towards the (local) classpriors. In those cases, the minority class in the occurrence profilewould often match the overall minority class. This means thatmost label mismatches would be caused by the minority hubs.
550
551
552
553
554
555
556
557
558
559
560
561
4.3. Methodology
We propose to analyze the interplay between hubness and classimbalance in several steps. First, we perform a detailed analysis ofclass-to-class occurrence distributions and the kNN confusionmatrices in order to detect the principal gradients of misclassifi-cation. We proceed by examining the distributions of differenttypes of points among different classes. This includes a character-ization of points into hubs, regulars and anti-hubs [59], as well asthe characterization of points into safe, borderline, rare and outli-ers [52]. Points are considered safe if 4 or 5 of their 5-NNs belong totheir class, borderline if it is 2 or 3, rare if only 1 neighbor share thesame label and outliers otherwise. Finally, we evaluate the perfor-
Fig. 5. An illustrative example. xh is a hub, neighbor to many other points. There is acertain label distribution among its reverse nearest neighbors, defining theoccurrence profile of xh . It is obvious that most damage would be done to theclassification process by xh if it were to share the label of the minority part of itsreverse neighbor set. On average, we would expect this to equal the overallminority class in the data. This suggests that minority hubs might have a higheraverage tendency to become bad hubs and that this might prove to be, in general,quite detrimental to classifier performance.
Please cite this article in press as: N. Tomašev, D. Mladenic, Class imbalance an10.1016/j.knosys.2013.08.031
mance of the hubness-aware classification approaches by compar-isons to the baseline kNN and characterize the nature of theirimprovements by examining the improvements in the precisionand recall of both the majority and minority class or classes. Boththe accuracy and the F1-score [88] will be used to evaluate theoverall aggregate classifier performance.
We propose to analyze the influence of mislabeling on thehubness-aware classification process by randomly introducingmislabeling into the training data during the cross-validation foldswhile testing the algorithms on existing real-world datasets. Byobserving how the classification performance changes for differentmislabeling levels, we are able to estimate the robustness of differ-ent approaches. This testing functionality is fully supported in theHub Miner library (http://ailab.ijs.si/nenad_tomasev/hub-miner-library/), which we have used in our experiments.
A general approach to hubness-aware classification is outlinedin Fig. 6.
562
563
564
565
566
567
568
569
570
571
572
573
574
575
576
577
578
579
580
581
5. Experiments and discussion
In order to test the above stated hypotheses, we performedextensive experimental evaluation.
The results have been structured in the following way: Section5.2 examines the role of minority hubs in class imbalanced kNNclassification and presents a series of experiments that supportour initial hypothesis stated in Section 4.2. Section 5.3 deals withrobustness to high mislabeling levels and confirms our hypothesisthat the neighbor occurrence models learned on the training datacan increase the kNN classification performance under high misla-beling levels. Section 5.4 examines algorithm performance undersevere class overlap in high-dimensional class imbalanced Gauss-ian mixtures.
5.1. Data overview
In our experiments we have used both low hubness data sets(mostly balanced) and high-hubness image data sets (mostlyimbalanced). The former were taken from the UCI repository(http://archive.ics.uci.edu/ml/datasets.html), the latter from theImageNet public collection (http://www.image-net.org/). More infoon the image data feature representation is available in [75,71].
From the first five image data sets we removed a random subsetof instances from all the minority classes in order to make the dataeven more imbalanced for the experiments. The relevant proper-ties of the data sets are given in Table 2. The listed UCI data setswere mostly not imbalanced and we included the results in Table3 only for comparison with the mislabeled case which follows inSection 5.3. The classification accuracies given in Table 3 have al-ready been reported in our earlier work [75,73] and will serve asa starting point for further analysis.
All classification tests were performed as 10-times 10-foldcross-validation. Corrected re-sampled t-test was used to detectstatistical significance [6]. Manhattan metric was used in all real-world experiments, while the Euclidean distance was used fordealing with Gaussian mixtures in Section 5.4. All feature valuesin UCI and ImageNet data were normalized to the [0,1] range. Allthe hubness-aware algorithms were tested under their defaultparameter configurations, according to what was specified in therespective papers.
5.2. Class imbalanced data
While analyzing the connection between hubness and classimbalance we will focus on the image datasets shown in the low-er half of Table 2. To measure the imbalance of a particular data-
d the curse of minority hubs, Knowl. Based Syst. (2013), http://dx.doi.org/

582
583
584
585
Fig. 6. The hubness-aware analytic framework: learning from past neighbor occurrences.
Table 2Summary of the real-world data sets. Each data set is described by the following set of properties: size, number of features (d), number of classes (c), skewness of the 5-occurrencedistribution (SN5 ), the percentage of bad 5-occurrences (BN5), the degree of the largest hub-point (max N5), relative imbalance of the label distribution (RImb) and the size of themajority class (pðcMÞ).
Data set Size d C SN5 BN5 (%) max N5 RImb pðcMÞ (%)
Diabetes 768 8 2 0.19 32.3 14 0.30 65.1Ecoli 336 7 8 0.15 20.7 13 0.41 42.6Glass 214 9 6 0.26 25.0 13 0.34 35.5Iris 150 4 3 0.32 5.5 13 0 33.3Mfeat-factors 2010 216 10 0.83 7.8 25 0 10Mfeat-fourrier 2000 76 10 0.93 19.6 27 0 10Ovarian 2534 72 2 0.50 15.3 16 0.28 64Segment 2310 19 7 0.33 5.3 15 0 14.3Sonar 208 60 2 1.28 21.2 22 0.07 53.4Vehicle 846 18 4 0.64 35.9 14 0.02 25.8
ImNet3 2731 416 3 8.38 21.0 213 0.40 50.2ImNet4 6054 416 4 7.69 40.3 204 0.14 35.1ImNet5 6555 416 5 14.72 44.6 469 0.20 32.4ImNet6 6010 416 6 8.42 43.4 275 0.26 30.9ImNet7 10,544 416 7 7.65 46.2 268 0.09 19.2ImNet3Imb 1681 416 3 3.48 17.2 75 0.72 81.5ImNet4Imb 3927 416 4 7.39 38.2 191 0.39 54.1ImNet5Imb 3619 416 5 9.35 41.4 258 0.48 58.7ImNet6Imb 3442 416 6 4.96 41.3 122 0.46 54ImNet7Imb 2671 416 7 6.44 42.8 158 0.46 52.1
Table 3Experiments on UCI and ImageNet data. Classification accuracy is given for kNN, hubness-weighted kNN (hw-kNN), hubness-based fuzzy nearest neighbor (h-FNN), naivehubness-Bayesian k-nearest neighbor (NHBNN) and hubness information k-nearest neighbor (HIKNN). All experiments were performed for k = 5. The symbols �/� denotestatistically significant worse/better performance (p < 0:05) compared to kNN. The best result in each line is in bold.
Data set kNN hw-kNN h-FNN NHBNN HIKNN
Diabetes 67.8 ± 3.7 75.6 ± 3.7 � 75.4 ± 3.2 � 73.9 ± 3.4 � 75.8 ± 3.6 �Ecoli 82.7 ± 4.2 86.9 ± 4.1 � 87.6 ± 4.1 � 86.5 ± 4.1 � 87.0 ± 4.0 �Glass 61.5 ± 7.3 65.8 ± 6.7 67.2 ± 7.0 � 59.1 ± 7.5 67.9 ± 6.7 �Iris 95.3 ± 4.1 95.8 ± 3.7 95.3 ± 3.8 95.6 ± 3.7 95.4 ± 3.8Mfeat-factors 94.7 ± 1.1 96.1 ± 0.8 � 95.9 ± 0.8 � 95.7 ± 0.8 � 96.2 ± 0.8 �Mfeat-fourier 77.1 ± 2.2 81.3 ± 1.8 � 82.0 ± 1.6 � 82.1 ± 1.7 � 82.1 ± 1.7 �Ovarian 91.4 ± 3.6 92.5 ± 3.5 93.2 ± 3.5 93.5 ± 3.3 93.8 ± 2.9Segment 87.6 ± 1.5 88.2 ± 1.3 88.8 ± 1.3 � 87.8 ± 1.3 91.2 ± 1.1 �Sonar 82.7 ± 5.5 83.4 ± 5.3 82.0 ± 5.8 81.1 ± 5.6 85.3 ± 5.5Vehicle 62.5 ± 3.8 65.9 ± 3.2 � 64.9 ± 3.6 63.7 ± 3.5 67.2 ± 3.6 �
ImNet3 72.0 ± 2.7 80.8 ± 2.3 � 82.4 ± 2.2 � 81.8 ± 2.3 � 82.2 ± 2.0 �ImNet4 56.2 ± 2.0 63.3 ± 1.9 � 65.2 ± 1.7 � 64.6 ± 1.9 � 64.7 ± 1.9 �ImNet5 46.6 ± 2.0 56.3 ± 1.7 � 61.9 ± 1.7 � 61.8 ± 1.9 � 60.8 ± 1.9 �ImNet6 60.1 ± 2.2 68.1 ± 1.6 � 69.3 ± 1.7 � 69.4 ± 1.7 � 69.9 ± 1.9 �ImNet7 43.4 ± 1.7 55.1 ± 1.5 � 59.2 ± 1.5 � 58.2 ± 1.5 � 56.9 ± 1.6 �ImNet3Imb 72.8 ± 2.4 87.7 ± 1.7 � 87.6 ± 1.6 � 84.9 ± 1.9 � 88.3 ± 1.6 �ImNet4Imb 63.0 ± 1.8 68.8 ± 1.5 � 69.9 ± 1.4 � 69.4 ± 1.5 � 70.3 ± 1.4 �ImNet5Imb 59.7 ± 1.5 63.9 ± 1.8 � 64.7 ± 1.8 � 63.9 ± 1.8 � 65.5 ± 1.8 �ImNet6Imb 62.4 ± 1.7 69.0 ± 1.7 � 70.9 ± 1.8 � 68.4 ± 1.8 � 70.2 ± 1.8 �ImNet7Imb 55.8 ± 2.2 63.4 ± 2.0 � 64.1 ± 2.3 � 63.1 ± 2.1 � 64.3 ± 2.1 �
Avg. 69.77 75.40 76.38 75.23 76.75
N. Tomašev, D. Mladenic / Knowledge-Based Systems xxx (2013) xxx–xxx 7
KNOSYS 2624 No. of Pages 16, Model 5G
14 September 2013
set, we will observe two quantities: pðcMÞ, which is the relativesize of the majority class – and relative imbalance (RImb) of the
Please cite this article in press as: N. Tomašev, D. Mladenic, Class imbalance an10.1016/j.knosys.2013.08.031
label distribution which we define as the normalized standarddeviation of the class probabilities from the absolutely homoge-
d the curse of minority hubs, Knowl. Based Syst. (2013), http://dx.doi.org/

586
587
588
589
590
591
592
593
594
595
596
597
598
599
600
601
602
603
604
605
606
607
608
609
610
611
612
613
614
615
616
617
618
619
620
621
622
623
624
625
626
627
628
629
630
631
632
633
634
Table 4Class-to-class hubness between different classes in ImNet7Imb for k = 5. Each rowcontains the outgoing occurrence rate towards other categories. For instance, in thefirst row we see that only 56% of all neighbor occurrences of points from the first classare in the neighborhoods of elements from the same class. The diagonal elements(self-hubness) are given in bold, as well as the majority class.
p(c) c1 c2 c3 c4 c5 c6 c7
c1 0.05 0.56 0.05 0.04 0.12 0.11 0.05 0.07c2 0.08 0.05 0.48 0.11 0.03 0.17 0.09 0.07c3 0.05 0.06 0.14 0.32 0.06 0.25 0.12 0.05c4 0.08 0.04 0.06 0.04 0.62 0.15 0.02 0.07c5 0.52 0.01 0.02 0.02 0.01 0.85 0.08 0.01c6 0.17 0.05 0.07 0.05 0.01 0.39 0.42 0.01c7 0.05 0.02 0.10 0.02 0.05 0.13 0.02 0.66
Fig. 7. The incoming hubness towards each category expressed by other categoriesin the data shown for ImNet7Imb data set. The 7 bars in each group representcolumns of the class-to-class k-occurrence Table 4. Neighbor sets were computedfor k = 5. We see that most hubness expressed by the minority classes is directedtowards the majority class. This gives some justification to our hypothesis that inhigh-dimensional data with hubness it is mostly the minority class instances thatcause misclassification of the majority class and not the other way around.
Fig. 8. Average bad hubness exhibited by each class from data sets ImNet3Imb-ImNet7Imb plotted against relative class size (pðcÞ=pðcMÞ). We see that the minorityclasses exhibit on average much higher bad hubness than the majority classes.
Table 5The average 5-NN confusion matrix for ImNet7Imb data after 10-times 10-fold cross-validation. Each row displays how elements of a particular class were assigned toother classes by the 5-NN classifier. The overall number of false negatives (FN) andfalse positives (FP) for each category is calculated. The results for the majority classare in bold.
p(c) c1 c2 c3 c4 c5 c6 c7 FN
c1 0.05 42.9 13.5 3.8 11.8 6.2 60.7 1.1 97.1c2 0.08 22.8 48.0 15.3 8.9 54.9 77.1 0.0 179.0c3 0.05 8.9 21.0 13.0 3.3 25.6 55.2 0.0 114.0c4 0.08 44.0 6.0 2.0 100.5 15.5 43.0 0.0 110.5c5 0.52 78.5 36.7 25.9 21.9 1028.1 200.9 0.0 363.9c6 0.17 16.9 19.1 10.2 4.3 142.9 254.6 0.0 193.4c7 0.05 17.9 8.3 6.1 12.1 41.0 36.9 3.7 122.3
FP 189.0 104.6 63.3 62.3 286.1 473.8 1.1
8 N. Tomašev, D. Mladenic / Knowledge-Based Systems xxx (2013) xxx–xxx
KNOSYS 2624 No. of Pages 16, Model 5G
14 September 2013
nous mean value of 1/c for each class. In other words,
RImb ¼ffiffiffiffiffiffiffiffiffiffiffiffiffiffiffiffiffiffiffiffiffiffiffiffiffiffiffiffiffiffiffiffiffiffiffiffiffiffiffiffiffiffiffiffiffiffiffiffiffiffiffiffiffiffiffiffiffiffiffiffiffiffiffiffiffiffiffiffiffiffiffiffiffiffiP
c2CðpðcÞ � 1=CÞ2� �
=ððC � 1Þ=CÞÞr
.
Unbalancing the original five datasets (ImNet3-ImNet7) seemsnot to have increased the overall difficulty in terms of the achievedclassification accuracy and the total induced bad hubness (Table 2).As bad hubness is not directly caused by class imbalance andresults as an interplay of various contributing factors, this is notaltogether surprising.
ImNetImb data sets were selected via random undersamplingand it is always difficult to predict the effects of data reductionon hubness. Removing anti-hubs makes nearly no difference, butremoving hub-points certainly does. After a hub is removed andall neighbor lists are recalculated, the occurrence profiles of manyother hub-points change, as they fill in the thereby released ‘emptyspaces’ in neighbor lists where the removed hub participated.
Please cite this article in press as: N. Tomašev, D. Mladenic, Class imbalance an10.1016/j.knosys.2013.08.031
5.2.1. Correlating bad hubness and class imbalanceConsider a class-to-class k-occurrence matrix for the ImNe-
t7Imb dataset that is given in Table 4. Each row contains averageoutgoing hubness from one category to another. On the diagonalwe are able to see the percentage of occurrences of points fromeach category in neighborhoods of points from the same category(i.e. good hubness). We see that in ImNet7Imb the majority classhas highest relative good hubness. It also seems that most of thebad hubness expressed by the minority classes is directed towardsthe majority class. We can see this more clearly by observing thegraph of incoming hubness, shown in Fig. 7. In this case, most badhubness is generated by the minority classes and most of thisbad influence is directed towards the majority class (c5).
Since individual label mismatches do not necessarily cause mis-classification, analyzing the class-to-class k-occurrence matrix is initself not sufficient. The kNN confusion matrix helps in analyzingthe actual misclassification gradients and the confusion matrixfor ImNet7Imb data is given in Table 5, generated by averagingafter 10 runs of 10-fold cross validation.
Several things in Table 5 are worth noting. First of all, themajority class FP rate is lower than its FN rate, which means thatmore errors are made on average by misclassifying the majorityclass points than by misclassifying the minority class points intothe majority class. Also, the highest FP rate is not achieved bythe majority class, but rather by one of the minority classes – c6.Both of these observations are very important, as we have alreadymentioned that there are various scenarios where the cost of mis-classifying the majority class points is quite high [16,17,37].
The previously discussed correlation between relative class sizeand bad hubness can be established also by inspecting a collectionof imbalanced data sets (ImNet3Imb-ImNet7Imb) at the sametime. Pearson correlation between class size and class-conditionalbad hubness is �0.76 when taken for k = 5. This implies that theremight be a very strong negative correlation between the two quan-
d the curse of minority hubs, Knowl. Based Syst. (2013), http://dx.doi.org/

635
636
637
638
639
640
641
642
643
644
645
646
647
648
649
650
651
652
653
654
655
656
657
658
659
660
661
662
663
664
665
666
667
668
669
670
671
672
673
674
675
676
677
678
679
680
681
682
683
684
685
686
687
688
689
690
691
692
Fig. 10. Average hubness of different point types in different categories. Safe pointsare not consistently the points of highest hubness. Quite frequently borderlineexamples and even rare points of the minority classes end up being neighbors toother points. This also means that less typical points exhibit a substantial influenceon the classification process.
Fig. 11. Average 5-NN bad hubness of different point types shown both for ImNetand high-dimensional synthetic Gaussian mixtures given in Table 9, Section 5.4. Wegive both bad hubness distributions here for easier comparison. It is clear that theyare quite different. In the analyzed image data, most bad influence is exhibited byatypical class points (borderline examples, rare points, outliers), while most badinfluence in the Gaussian mixture data is generated by safe points. The latter isquite counterintuitive, as we usually expect for such typical points to be located inthe inner regions of class distributions.
N. Tomašev, D. Mladenic / Knowledge-Based Systems xxx (2013) xxx–xxx 9
KNOSYS 2624 No. of Pages 16, Model 5G
14 September 2013
tities and that the minority classes indeed exhibit high bad hub-ness relative to their size. A plot of all pðcÞ
pðcM Þ;BN5ðcÞ
� �is shown in
Fig. 8.In Section 4.2, we have conjectured that bad hubs among the
minority points are expected to have higher bad hubness on aver-age. In order to check this hypothesis, we have examined class dis-tributions among different types of points, namely: hubs, anti-hubsand bad hubs. Similarly to hubs [60], bad hubs were formally de-fined as those points that have an unusually high bad occurrencefrequency: fx : BNkðxÞ > lBNkðxÞ þ 2 � rBNkðxÞg. We took as manyanti-hubs as hub-points, by taking those with least occurrencesfrom the ordered list.
Class distributions among these types of points can be com-pared to the prior distribution over all data points. The comparisonfor ImNet7Imb data is shown in Fig. 9. Similar trends are present inthe rest of the image data sets, as well. We see that the class distri-bution is entirely different for different types of points. This needsto be taken into account when modeling the data. Most impor-tantly, we see that in this data set, all top bad hubs come fromthe minority classes, in accordance with our hypothesis. In the restof the examined image data sets the situation is very similar,though the majority class is naturally not always at 0% amongthe top hubs, but it is always less frequent than among all pointscombined.
By considering the anti-hub distribution in Fig. 9, we might alsogain some insight into the outlier structure of the data. Previous re-search [59–61,80] suggests that outliers tend to be anti-hubs in thedata, though anti-hubs are not always outliers. The fact that classc1 contributes so much to anti-hubs suggests that this particularminority class consists mostly of outliers.
In Fig. 10 we can see the distribution of occurrence frequenciesamong safe points, borderline points, rare points and outliers givenseparately for each category of the ImNet7Imb data set. The resultsindicate a strong violation of the cluster assumption, as point hub-ness is closely linked to within-cluster centrality [80,82]. High hub-ness of borderline points indicates that data clusters are nothomogenous with respect to the label space. Indeed, our initialtests have shown that this data does not cluster well. Another thingworth noting is that points that we usually think of as reliablemight have a detrimental influence on the classification process,which is clear from examining the hubness/bad hubness distribu-tion across different point types for c6, which has a high overallbad hubness and FP rate. It is precisely the safe points that exhibitboth the highest hubness (AVG. 11.66) and the highest bad hub-ness (AVG. 6.63). This is yet another good illustration of the differ-ences between low-dimensional and high-dimensional data.Intuitively, we would expect the safe points to be located in theinnermost part of the class distribution space and not to becomeneighbors to many other points from different categories. This is
693
694
695
696
697
698
699
700
701
702
703
704
705
706
707
708
Fig. 9. Distribution of classes among different types of points in ImNet7Imb data:hubs, anti-hubs and bad hubs. We see that there are nearly no majority class pointsamong the top bad hubs in the data. Data points of class c6 exhibit highest badhubness, which explains the high FP rate observed in Table 5
Please cite this article in press as: N. Tomašev, D. Mladenic, Class imbalance an10.1016/j.knosys.2013.08.031
precisely what happens here and is yet another slightly counterin-tuitive result.
Bad occurrence distributions summarized in Fig. 11 illustratethat different underlying bad hub structures exist in different typesof data. In the analyzed image data (ImNet3-7, ImNetImb3-7), thepreviously described pathological case of safe/inner points arisingas top bad hubs in the data is still more an exception than a rule,while in high-dimensional Gaussian mixtures it becomes a domi-nating feature. Further analysis of the synthetic datasets is givenin Section 5.4, where class overlap is discussed.
5.2.2. Hubness-aware classification under class imbalanceIn order to learn more about the way in which the hubness-
aware classifiers handle the minority and the majority class points,we have performed an in-depth analysis of the classification re-sults summarized in Table 3, by focusing on certain imbalancedimage datasets.
Unbalancing the original five datasets (ImNet3-ImNet7) seemsnot to have increased the overall difficulty in terms of the achievedclassification accuracy and the total induced bad hubness (Table2]). As bad hubness is not directly caused by class imbalance andresults as an interplay of various contributing factors, this is notaltogether surprising.
ImNetImb data sets were selected via random undersamplingand it is always difficult to predict the effects of data reductionon hubness. Removing anti-hubs makes nearly no difference, but
d the curse of minority hubs, Knowl. Based Syst. (2013), http://dx.doi.org/
709
710
711
712
713
714
715
716
717
718
719
720
721
722
723
724
725
726
727
728
729
730
731
732
733
734
735
736
737
738
739
740
741
742
743
744
745
746
747
Table 6Precision and recall for each class and each method separately on ImNet7Imb data set. Values greater or equal to the score achieved by kNN are given as bold. The last columnrepresents the Spearman correlation between the improvement over kNN in precision or recall and the size of the class. In other words, corrImp ¼ corr pðcÞ
max pðcÞ ; improvement� �
.
Priors: c1 c2 c3 c4 c5 c6 c7 Avg. corrImp
Method Measure 0.05 0.08 0.05 0.08 0.52 0.17 0.05
kNN Precision 0.20 0.32 0.18 0.62 0.78 0.35 0.31 0.39Recall 0.31 0.21 0.10 0.47 0.74 0.57 0.03 0.35
hw-kNN Precision 0.46 0.39 0.28 0.72 0.79 0.41 0.58 0.52 �0.96Recall 0.30 0.30 0.19 0.73 0.81 0.59 0.17 0.44 �0.43
h-FNN Precision 0.65 0.46 0.37 0.72 0.69 0.44 0.76 0.58 �0.86Recall 0.18 0.19 0.09 0.73 0.92 0.43 0.12 0.38 �0.07
NHBNN Precision 0.36 0.37 0.22 0.62 0.79 0.47 0.45 0.47 �0.39Recall 0.43 0.22 0.22 0.80 0.81 0.50 0.20 0.45 �0.68
HIKNN Precision 0.55 0.45 0.30 0.74 0.78 0.40 0.67 0.55 �0.75Recall 0.24 0.23 0.14 0.74 0.84 0.61 0.17 0.42 0.0
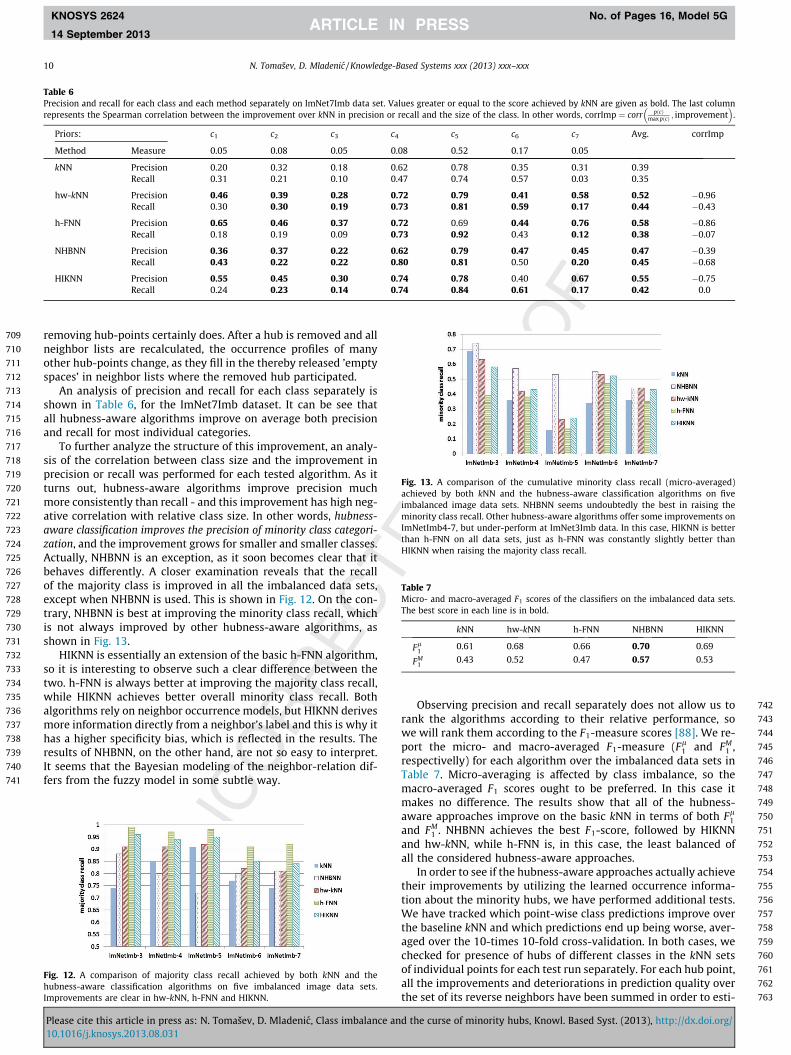
Fig. 13. A comparison of the cumulative minority class recall (micro-averaged)achieved by both kNN and the hubness-aware classification algorithms on fiveimbalanced image data sets. NHBNN seems undoubtedly the best in raising theminority class recall. Other hubness-aware algorithms offer some improvements onImNetImb4-7, but under-perform at ImNet3Imb data. In this case, HIKNN is betterthan h-FNN on all data sets, just as h-FNN was constantly slightly better thanHIKNN when raising the majority class recall.
Table 7Micro- and macro-averaged F1 scores of the classifiers on the imbalanced data sets.The best score in each line is in bold.
kNN hw-kNN h-FNN NHBNN HIKNN
Fl1
0.61 0.68 0.66 0.70 0.69
FM1
0.43 0.52 0.47 0.57 0.53
10 N. Tomašev, D. Mladenic / Knowledge-Based Systems xxx (2013) xxx–xxx
KNOSYS 2624 No. of Pages 16, Model 5G
14 September 2013
removing hub-points certainly does. After a hub is removed and allneighbor lists are recalculated, the occurrence profiles of manyother hub-points change, as they fill in the thereby released ’emptyspaces’ in neighbor lists where the removed hub participated.
An analysis of precision and recall for each class separately isshown in Table 6, for the ImNet7Imb dataset. It can be see thatall hubness-aware algorithms improve on average both precisionand recall for most individual categories.
To further analyze the structure of this improvement, an analy-sis of the correlation between class size and the improvement inprecision or recall was performed for each tested algorithm. As itturns out, hubness-aware algorithms improve precision muchmore consistently than recall - and this improvement has high neg-ative correlation with relative class size. In other words, hubness-aware classification improves the precision of minority class categori-zation, and the improvement grows for smaller and smaller classes.Actually, NHBNN is an exception, as it soon becomes clear that itbehaves differently. A closer examination reveals that the recallof the majority class is improved in all the imbalanced data sets,except when NHBNN is used. This is shown in Fig. 12. On the con-trary, NHBNN is best at improving the minority class recall, whichis not always improved by other hubness-aware algorithms, asshown in Fig. 13.
HIKNN is essentially an extension of the basic h-FNN algorithm,so it is interesting to observe such a clear difference between thetwo. h-FNN is always better at improving the majority class recall,while HIKNN achieves better overall minority class recall. Bothalgorithms rely on neighbor occurrence models, but HIKNN derivesmore information directly from a neighbor’s label and this is why ithas a higher specificity bias, which is reflected in the results. Theresults of NHBNN, on the other hand, are not so easy to interpret.It seems that the Bayesian modeling of the neighbor-relation dif-fers from the fuzzy model in some subtle way.
748
749
750
751
752
753
754
755
756
757
758
759
760
761
762
763
Fig. 12. A comparison of majority class recall achieved by both kNN and thehubness-aware classification algorithms on five imbalanced image data sets.Improvements are clear in hw-kNN, h-FNN and HIKNN.
Please cite this article in press as: N. Tomašev, D. Mladenic, Class imbalance an10.1016/j.knosys.2013.08.031
Observing precision and recall separately does not allow us torank the algorithms according to their relative performance, sowe will rank them according to the F1-measure scores [88]. We re-port the micro- and macro-averaged F1-measure (Fl
1 and FM1 ,
respectivelly) for each algorithm over the imbalanced data sets inTable 7. Micro-averaging is affected by class imbalance, so themacro-averaged F1 scores ought to be preferred. In this case itmakes no difference. The results show that all of the hubness-aware approaches improve on the basic kNN in terms of both Fl
1
and FM1 . NHBNN achieves the best F1-score, followed by HIKNN
and hw-kNN, while h-FNN is, in this case, the least balanced ofall the considered hubness-aware approaches.
In order to see if the hubness-aware approaches actually achievetheir improvements by utilizing the learned occurrence informa-tion about the minority hubs, we have performed additional tests.We have tracked which point-wise class predictions improve overthe baseline kNN and which predictions end up being worse, aver-aged over the 10-times 10-fold cross-validation. In both cases, wechecked for presence of hubs of different classes in the kNN setsof individual points for each test run separately. For each hub point,all the improvements and deteriorations in prediction quality overthe set of its reverse neighbors have been summed in order to esti-
d the curse of minority hubs, Knowl. Based Syst. (2013), http://dx.doi.org/

764
765
766
767
768
769
770
771
772
773
774
775
776
777
778
779
780
781
782
783
784
785
786
787
788
789
790
791
792
793
794
795
796
797
798
799
800
801
802
803
804
805
806
807
808
809
810
811
812
813
814
815
Fig. 14. The average number of improvements in prediction quality among thereverse neighbors of hubs points, on ImNet7Imb data.
Fig. 15. The average number of improvements in prediction quality among thereverse neighbors of bad hubs points, on ImNet7Imb data.
N. Tomašev, D. Mladenic / Knowledge-Based Systems xxx (2013) xxx–xxx 11
KNOSYS 2624 No. of Pages 16, Model 5G
14 September 2013
mate the overall change in prediction quality in the kNN sets wherethe hub point occurs. The results for the ImNet7Imb dataset areshown in Fig. 14. Similarly, we can focus on bad hubs specificallyand the distribution of average improvements in prediction qualityin presence of bad hubs is shown in Fig. 15.
In both cases, the improvements are most pronounced for classc6, which is not the majority class and is the class with highest badhubness on the dataset. This suggests that the improvements areindeed obtained by exploiting the relevant hubness information.
The property of hw-kNN, h-FNN and HIKNN of significantly rais-ing the recall of the majority class is a very useful one, especiallysince they are able to do so without harming the minority class re-
Table 8Experiments on mislabeled data. 30% Mislabeling was artificially introduced to each datstatistically significant worse/better performance (p < 0:05) compared to kNN. The best re
Data set kNN hw-kNN
Diabetes 54.1 ± 3.7 64.7 ± 3.9 �Ecoli 68.1 ± 5.6 80.2 ± 4.7 �Glass 50.6 ± 7.3 61.6 ± 7.3 �Iris 71.1 ± 8.5 88.2 ± 6.0 �Mfeat-factors 70.7 ± 2.3 91.4 ± 1.5 �Mfeat-fourier 57.1 ± 2.5 75.0 ± 2.1 �Ovarian 58.1 ± 6.6 76.3 ± 6.1 �Segment 62.7 ± 2.2 81.1 ± 1.9 �Sonar 61.5 ± 7.7 70.8 ± 6.8 �Vehicle 48.2 ± 3.9 57.5 ± 3.9 �
ImNet3 51.0 ± 2.3 69.9 ± 2.2 �ImNet4 44.6 ± 1.4 52.5 ± 1.3 �ImNet5 40.0 ± 1.4 47.2 ± 1.4 �ImNet6 49.5 ± 1.7 55.1 ± 1.4 �ImNet7 33.1 ± 1.1 44.8 ± 1.1 �ImNet3Imb 56.7 ± 3.0 78.7 ± 2.2 �ImNet4Imb 51.8 ± 1.7 55.0 ± 1.7 �ImNet5Imb 50.7 ± 2.1 53.5 ± 2.0 �ImNet6Imb 54.7 ± 2.1 55.8 ± 2.0 �ImNet7Imb 33.1 ± 2.3 52.0 ± 1.9 �
Avg. 53.37 65.57
Please cite this article in press as: N. Tomašev, D. Mladenic, Class imbalance an10.1016/j.knosys.2013.08.031
call. This helps with handling class imbalanced data under theassumption of hubness.
As most standard approaches to learning under class imbalanceaim in the opposite direction, it might be useful to consider hybridapproaches in the future, by combining both types of predictionstrategies. As the hubness-aware classification methods mostlymodify the final voting, they can easily be combined with over-sampling/under-sampling [9,30,45,91,4,40], instance weighting[66] or examplar-based learning [41]. They can also, in principle,support cost-sensitive learning, unlike many other kNN methods.This is made possible by the occurrence model, as not every occur-rence has to be given the same weight when calculating Nk;cðxÞ.Distance-weighted occurrence models were already considered[72], but cost-sensitive occurrence models are certainly an optionthat we wish to explore in our future work.
5.3. Robustness to mislabeling
Instance mislabeling is not unrelated to class imbalance [35].Algorithm performance depends on the distribution of mislabelingacross the categories in the data. Even more importantly, the im-pact of mislabeling on algorithm performance in high-dimensionaldata depends heavily on the average hubness of mislabeled exam-ples. Mislabeling anti-hubs makes no difference whatsoever. Mis-labeling even a couple of hub-points should be enough to causesignificant misclassification.
In our experiments, mislabeling was distributed uniformlyacross different categories and only the training data on eachcross-validation fold was mislabeled. Evaluation was performedon the original labels. An overview of algorithm performance under30% mislabeling rate is shown in Table 8. The results confirm ourhypothesis that the hubness-aware algorithms exhibit much higherrobustness to mislabeling than kNN.
Out of the compared hubness-aware algorithms, h-FNN domi-nates in this experimental setup. On many datasets h-FNN is nomore than 1–2% less accurate than before, which is astoundingconsidering the level of mislabeling in the data. On the other hand,the hubness-weighting approach (hw-kNN) fails in this case and isnot able to cope with such high mislabeling rates.
Similarly, Fig. 16 shows the drop in accuracy as mislabeling isslowly introduced in the data. The kNN performance seems to bedecreasing at a linear rate with increasing noise. At the same time,
a set at random. All experiments were performed for k = 5. The symbols �/� denotesult in each line is in bold.
h-FNN NHBNN HIKNN
66.2 ± 3.4 � 66.1 ± 3.4 � 65.4 ± 3.9 �85.8 ± 4.1 � 79.3 ± 4.8 � 81.7 ± 4.6 �62.8 ± 6.8 � 56.8 ± 6.6 61.5 ± 6.7 �90.7 ± 5.4 � 93.2 ± 4.6 � 87.8 ± 6.3 �94.9 ± 1.1 � 94.7 ± 1.2 � 93.9 ± 1.2 �81.0 ± 1.7 � 80.7 ± 1.9 � 78.7 ± 1.7 �81.1 ± 5.6 � 79.4 ± 5.6 � 78.3 ± 5.5 �84.3 ± 1.7 � 83.8 ± 1.6 � 80.8 ± 1.7 �72.4 ± 6.4 � 72.9 ± 6.3 � 71.4 ± 6.8 �58.1 ± 4.0 � 56.8 ± 4.0 � 59.2 ± 3.8 �
81.2 ± 1.8 � 80.6 ± 1.6 � 75.3 ± 2.0 �63.3 ± 1.3 � 63.1 ± 1.2 � 57.6 ± 1.3 �60.6 ± 1.2 � 60.0 ± 1.2 � 53.1 ± 1.3 �68.0 ± 1.3 � 67.4 ± 1.3 � 62.8 ± 1.4 �57.6 ± 1.1 � 56.8 ± 1.1 � 51.0 ± 1.1 �87.0 ± 1.6 � 81.1 ± 2.2 � 83.2 ± 2.1 �68.7 ± 1.7 � 67.3 ± 1.8 � 63.9 ± 1.7 �64.2 ± 2.0 � 60.5 ± 1.8 � 60.6 ± 1.2 �69.7 ± 1.7 � 66.6 ± 1.9 � 62.8 ± 2.0 �62.9 ± 1.9 � 61.1 ± 1.9 � 58.6 ± 1.7 �
73.03 71.41 69.38
d the curse of minority hubs, Knowl. Based Syst. (2013), http://dx.doi.org/

816
817
818
819
820
821
822
823
824
825
826
827
828
829
830
831
832
833
834
835
836
837
838
839
840
841
842
843
844
845
846
847
848
849
850
851
852
853
854
855
856
857
858
859
860
861
862
863
864
865
866
867
868
869
870
871
872
873
874
875
876
877
Fig. 16. The drop in accuracy as the mislabeling rate increases. The kNN accuracydrops linearly, but that is not the case with hubness-aware approaches, whichretain good performance even under high mislabeling rates.
12 N. Tomašev, D. Mladenic / Knowledge-Based Systems xxx (2013) xxx–xxx
KNOSYS 2624 No. of Pages 16, Model 5G
14 September 2013
hubness-aware approaches retain most of their accuracy as themislabeling rate goes all the way up to 40–50%. This can be ex-plained by the fact that the voting in the hubness-aware ap-proaches is based on the hub occurrence profiles and very highnoise levels are required in order to sufficiently compromise theoccurrence profiles of the most prominent hubs.
5.4. Overlapping categories
Class imbalance is by itself usually not enough to cause seriousmisclassification. It has to be coupled with some overlap betweendifferent class distributions.
In order to independently study the impact of severe class over-lap on the classification performance, we have performed extensive
Table 9Classification accuracies on synthetic Gaussian mixture data for k = 10. For each data set, thThe symbols �/� denote statistically significant worse/better performance (p < 0:01) comp
Data set Size SN10 BN10 (%) kNN
DS1 1244 6.68 53.5 43.8 ± 3.1DS2 1660 4.47 49.2 48.4 ± 2.8DS3 1753 5.50 42.0 67.3 ± 2.3DS4 1820 3.45 51 52.2 ± 2.6DS5 1774 4.39 46.3 59.2 ± 2.7DS6 1282 3.98 45.6 58.6 ± 3.3DS7 1662 4.64 41.5 65.0 ± 2.4DS8 1887 4.19 40.0 71.0 ± 2.3DS9 1661 5.02 47.5 57.9 ± 2.7DS10 1594 4.82 46.9 57.5 ± 2.9
Avg. 58.09
Please cite this article in press as: N. Tomašev, D. Mladenic, Class imbalance an10.1016/j.knosys.2013.08.031
analysis on high-dimensional synthetic data. Assuring substantialoverlap between classes in high-dimensional data is non-trivial,as points tend to be spread far apart. A degree of overlap high en-ough to induce severe misclassification was required, in order tomake the data challenging for nearest-neighbor methods. A seriesof 10 synthetic data sets was generated as random 100-dimensional10-category Gaussian mixtures. High overlap degree was achievedby placing each feature distribution center randomly within a cer-tain multiple of the standard deviation from some other randomlychosen, previously determined, distribution center.
As shown in Table 9, all the data sets exhibited very high hub-ness and very high bad hubness. Imbalance level in the data wasmoderate. There were no clear majority or minority classes, butsome overall imbalance was present, with RImb �0.2 in mostdata sets. As in previous experiments, we performed 10-times10-fold cross validation and the corrected re-sampled t-test wasused to verify the statistically significant differences. For thisround of experiments, we have opted for setting the neighbor-hood size to k = 10, in order to reach better estimates in the bor-derline regions. As the data was Gaussian, the Euclidean distancewas used.
The results are given in Table 9. The baseline kNN is on averageonly able to achieve 58.09% accuracy, while NHBNN stands bestamong the hubness-aware methods with an impressive averageaccuracy of 86.18%. Not only NHBNN, but all hubness-aware ap-proaches clearly and convincingly outperform kNN in this experi-mental setup. The weighted approach (hw-kNN) was againslightly inferior to the class-hubness-based methods (h-FNN,NHBNN, HIKNN). The differences in the macro-averaged F1-scoreare even more pronounced, as shown in Fig. 17, which suggeststhat hubness-aware voting helps in successfully dealing with classdistribution overlap.
Fig. 18 shows the precision that each of the algorithmsachieves on safe points, borderline examples, rare points and out-liers, separately [52]. Not surprisingly, kNN is completely incapa-ble of dealing with rare points and outliers – and performs badlyeven on borderline points. We should point out that the reasonwhy the precision is not 100% on safe points is that k = 5 is used(as described in [52]) to determine point types, but here we areobserving 10-NN classification. Hubness-aware methods achievehigher precision on all point types, safe points included. The dif-ference in performance is most pronounced for more difficultpoint types and this is where most of the improvement stemsfrom. Also, we are able to see why NHBNN scores better thanthe other hubness-aware algorithms on this data. It performs bet-ter when classifying all the difficult point types in the overlap re-gions. On average, NHBNN manages to correctly assign the labelsto more than 90% of borderline points, about 75% of rare pointsand 35% of outliers. We have verified that this is indeed truefor all 10 examined Gaussian mixtures. It is interesting to note
e skewness of the N10 distribution is given along with the bad occurrence rate (BN10).ared to kNN. The best result in each line is in bold.
hw-kNN h-FNN NHBNN HIKNN
64.4 ± 5.3 � 72.6 ± 2.8 � 80.7 ± 2.4 � 65.8 ± 3.0 �73.6 ± 6.9 � 79.3 ± 2.2 � 83.9 ± 2.2 � 73.1 ± 2.5 �85.3 ± 2.6 � 86.8 ± 1.7 � 90.0 ± 1.4 � 86.7 ± 1.9 �72.8 ± 2.3 � 78.4 ± 2.2 � 81.9 ± 2.0 � 72.2 ± 2.3 �80.2 ± 3.4 � 84.6 ± 1.8 � 87.2 ± 1.5 � 81.1 ± 2.1 �80.0 ± 3.3 � 81.7 ± 2.5 � 86.6 ± 2.2 � 79.4 ± 2.5 �84.6 ± 2.4 � 85.4 ± 1.9 � 90.1 ± 1.5 � 84.5 ± 2.0 �82.7 ± 2.5 � 85.9 ± 1.9 � 88.4 ± 1.8 � 83.9 ± 2.3 �76.3 ± 3.3 � 82.3 ± 2.0 � 87.5 ± 1.7 � 77.7 ± 2.4 �78.1 ± 3.3 � 81.1 ± 2.3 � 85.5 ± 1.9 � 77.7 ± 2.2 �
77.80 81.81 86.18 78.21
d the curse of minority hubs, Knowl. Based Syst. (2013), http://dx.doi.org/

878
879
880
881
882
883
884
885
886
887
888
889
890
891
892
893
894
Fig. 17. Macro-averaged F1 score on overlapping Gaussian mixture data.
Fig. 19. Misclassification towards the class c1 that exhibits highest overall badhubness on DS0. NHBNN and NB clearly outperform kNN here.
N. Tomašev, D. Mladenic / Knowledge-Based Systems xxx (2013) xxx–xxx 13
KNOSYS 2624 No. of Pages 16, Model 5G
14 September 2013
that the same trend is not detected in ImgNet data that was dis-
895896
897
898
899
900
901
902
903
904
905
906
907
908
909
910
911
912
Fig. 18. Classification precision on certain types of points on DS0: safe points,borderline points, rare examples and outliers. We see that the baseline kNN iscompletely unable to deal with rare points and outliers and this is precisely wherethe improvements in hubness-aware approaches stem from.
Table 10Classification accuracy of a selection of algorithms on Gaussian mixture data. The resultsneighbor-weighted kNN (NWKNN), adaptive kNN (AKNN), J48 implementation of the Qneighborhood size of k = 10 was used in the nearest-neighbor-based approaches, where a
Data set FNN PNN NWKNN
DS1 36.6 ± 3.0 39.8 ± 3.5 46.5 ± 3.3DS2 40.5 ± 2.9 35.9 ± 3.2 54.0 ± 2.6DS3 61.5 ± 2.7 71.3 ± 2.4 67.4 ± 2.5DS4 46.6 ± 2.4 43.4 ± 4.6 56.5 ± 2.9DS5 52.3 ± 2.9 54.1 ± 4.3 61.8 ± 2.6DS6 51.5 ± 3.0 51.5 ± 3.5 62.2 ± 3.0DS7 59.0 ± 2.7 60.0 ± 4.0 66.9 ± 2.6DS8 67.8 ± 2.6 72.6 ± 2.6 71.5 ± 2.5DS9 51.9 ± 2.7 48.9 ± 4.6 61.7 ± 2.6DS10 51.0 ± 2.7 47.8 ± 4.2 62.1 ± 2.5
Avg. 51.87 52.53 61.06
Please cite this article in press as: N. Tomašev, D. Mladenic, Class imbalance an10.1016/j.knosys.2013.08.031
cussed in Section 5.2. Bad hubness in ImgNet data is not exclu-sively due to class overlap, so it is a different story altogether.
As a final remark, we report the performance of some otherwell-known algorithms on class overlap data. Table 10 contains asummary of results given for the fuzzy k-nearest-neighbor (FNN)[38], probabilistic nearest neighbor (PNN) [32], neighbor-weightedkNN (NWKNN) [65], adaptive kNN (AKNN) [85], J48 (a WEKA [88]implementation of the Quinlan’s C4.5 algorithm [57]), random for-est classifier [7] and Naive Bayes [50]. Default parameter configu-rations were used for the Weka implementations of the tree-basedalgorithms.
The first thing to notice is that FNN scores much worse than itshubness-aware counterpart h-FNN. This shows that there is a largedifference in semantics between the fuzziness derived from directand reverse k-nearest neighbor sets. The best performance amongall the tested hubness-unaware kNN methods is attained by theadaptive kNN (AKNN), which is not surprising since it was de-signed specifically for handling class-overlap data [85]. Its perfor-mance is still, however, somewhat inferior to that of NHBNN, atleast in this experimental setup.
Decision trees, on the other hand, seem to have been heavily af-fected by the induced class overlap, as using either C4.5 or randomforest classifiers results in low overall accuracy rates. Naive Bayeswas the best among the tested approaches on these GaussianMixtures.
Fig. 19 shows how both NHBNN and Naive Bayes outperformthe kNN baseline by reducing the misclassification caused by aclass with high bad hubness.
An ROC curve that maps the TP rate against the FP rate is shownin Fig. 20 for DS0, where c5 is taken as the negative class and allother points are treated as positives. The area under the ROC curve(AUC) in this case is 0.923 for kNN, 0.974 for NWKNN, 0.965 forhw-kNN, 0.989 for NHBNN and 0.998 for Naive Bayes. Of course,the ROC analysis in the multi-class case is a bit more complex,
are given for fuzzy k-nearest-neighbor (FNN), probabilistic nearest neighbor (PNN),uinlan’s C4.5 algorithm, random forest classifier and Naive Bayes, respectivelly. A
pplicable. Results better than than the ones of NHBNN in Table 9 are given in bold.
AKNN J48 R. Forest Naive Bayes
79.5 ± 2.6 42.4 ± 4.3 59.5 ± 3.7 95.6 ± 1.382.7 ± 2.1 47.3 ± 3.9 65.4 ± 3.9 97.1 ± 0.988.7 ± 1.7 48.9 ± 3.9 69.2 ± 3.1 98.6 ± 0.284.7 ± 1.7 44.0 ± 3.7 59.7 ± 3.7 98.4 ± 0.283.2 ± 2.1 45.6 ± 2.9 64.1 ± 3.2 98.3 ± 0.178.6 ± 3.2 52.1 ± 4.2 67.2 ± 3.1 97.3 ± 1.190.1 ± 1.5 51.0 ± 3.7 70.7 ± 2.6 98.3 ± 0.785.2 ± 1.9 50.2 ± 3.7 67.1 ± 3.1 98.7 ± 0.484.5 ± 2.0 43.9 ± 3.6 64.5 ± 3.7 98.3 ± 0.779.6 ± 2.0 46.2 ± 3.8 64.0 ± 3.1 97.9 ± 0.8
83.68 47.16 65.14 97.85
d the curse of minority hubs, Knowl. Based Syst. (2013), http://dx.doi.org/

913
914
915
916
917
918
919
920
921
922
923
924
925
926
927
928
929
930
931
932
933
934
935
936
937
938
939
940
941
942
943
944
945
946
947
948
949
950
951
952
953
954
955
956
957
958
959
960
961
962
963
964
965
966
967
968
969
970
971
972
973
974
975
976
977
978
97998098198298398498598698798898999099199299399499599699799899910001001100210031004100510061007100810091010101110121013101410151016101710181019102010211022102310241025102610271028102910301031
Fig. 20. A one-vs-all ROC curve where one of the classes with a lower TP rate (c5) istaken as the negative class, on DS0.
14 N. Tomašev, D. Mladenic / Knowledge-Based Systems xxx (2013) xxx–xxx
KNOSYS 2624 No. of Pages 16, Model 5G
14 September 2013
but Fig. 20 illustrates the common trends in this high-dimensionalGaussian Mixture data.
What these comparisons reveal is that the currently availablehubness-aware k-nearest neighbor approaches rank rather wellwhen compared to the other kNN-based methods, but there is alsosome room for improvement.
6. Conclusions and future work
Hubness is an important aspect of the curse of dimensionalityrelated to k-nearest neighbor methods. It has a negative impacton the performance of many information systems, as it allowsthe errors to easily propagate through the data. In this paper, wehave shown that it further complicates the issues concerninglearning under class imbalance in high-dimensional data.
Class imbalance poses great difficulties for most machine learn-ing methods and has been a focus of many serious studies. In low-to-medium-dimensional data, the majority class is known to oftencause misclassification of the minority class.
Surprisingly, we have shown that this intuitive consequence ofthe difference in average relative density gradients does not neces-sarily hold in intrinsically high-dimensional data, under theassumption of hubness. In such cases, minority classes frequentlyexhibit high bad hubness and have the capacity to induce severemisclassification of the majority class. In high-dimensional data,most misclassification is caused by the classes which have themajority among the bad hubs. We have shown that the minorityclasses often achieve this bad hub majority and become the princi-pal sources of misclassification.
High-dimensional geometry allows for some more unexpectedresults, as we have shown that bad hubness is not expressed onlyby borderline points, but also by points expected to lie in the inte-riors of class distributions. This represents a strong violation of thecluster assumption.
In order to see if the arising problems can be solved by utilizingthe neighbor occurrence models in order to predict and rectify thedetrimental hub point occurrences, we have performed an exten-sive evaluation of several state-of-the-art hubness-aware k-nearestneighbor classifiers: hw-kNN, h-FNN, NHBNN and HIKNN. Themethods were compared on high-dimensional problems involvingclass imbalance, mislabeling and class overlap. The results suggestthat the tested approaches exhibit promising levels of robustnessand tolerance to the arising problems. The Naive Bayesian way ofhandling the occurrence models was able to achieve very high pre-cision when handling borderline examples, rare points and outliers.
A high misclassification rate caused by the minority class exam-ples in many high-dimensional datasets suggests that the tradi-tional kNN approaches to handling class imbalanced data that
Please cite this article in press as: N. Tomašev, D. Mladenic, Class imbalance an10.1016/j.knosys.2013.08.031
involve adopting an explicit bias towards the minority points arenot in general well suited for the high-dimensional case. The designof these methods should be extended to support the modeling ofminority-induced misclassification, in order to reduce the negativeimpact of bad hubs. One way to do this would be to employ theneighbor occurrence modeling within the class imbalanced kNNmethods, by combining them with the existing hubness-awareapproaches.
In future work we intend to investigate the possibilities for cost-sensitive learning and boosting in building the occurrence modelsfor hubness-aware classification. We also plan on extending andimproving the existing algorithms now that we have gained a dee-per understanding of their advantages and disadvantages. Addi-tionally, we will investigate various hubness-aware datapreprocessing schemes for filtering out the mislabeled/noisy data.
Acknowledgments
This work was supported by the Slovenian Research Agency, theICT Programme of the EC under XLike (ICT-STREP-288342), andRENDER (ICT-257790-STREP).
References
[1] C.C. Aggarwal, A. Hinneburg, D.A. Keim, On the surprising behavior of distancemetrics in high dimensional spaces, in: Proceedings of the 8th InternationalConference on Database Theory, 2001, pp. 420–434.
[2] J. Aucouturier, Ten Experiments on the Modelling of Polyphonic Timbre,Technical report, Doct. dissert., Univ. of Paris 6, 2006.
[3] J. Aucouturier, F. Pachet, Improving timbre similarity: how high is the sky?,Journal of Negative Results in Speech and Audio Sciences 1 (2004)
[4] G.E.A.P.A. Batista, R.C. Prati, M.C. Monard, A study of the behavior of severalmethods for balancing machine learning training data, SIGKDD ExplorationsNewsletter 6 (1) (2004) 20–29.
[5] R. Batuwita, V. Palade, Micropred: effective classification of pre-miRNAs forhuman miRNA gene prediction, Bioinformatics 25 (8) (2009) 989–995.
[6] R. Bouckaert, E. Frank, Evaluating the replicability of significance tests forcomparing learning algorithms, in: H. Dai, R. Srikant, C. Zhang (Eds.), Advancesin Knowledge Discovery and Data Mining, Springer, Berlin Heidelberg, 2004,pp. 3–12.
[7] L. Breiman, Random forests, Machine Learning 45 (1) (2001) 5–32.[8] K. Buza, A. Nanopoulos, L. Schmidt-Thieme, Insight: efficient and effective
instance selection for time-series classification, in: Advances in KnowledgeDiscovery and Data Mining, PAKDD’11, Springer-Verlag, Berlin, Heidelberg,2011, pp. 149–160.
[9] N.V. Chawla, K.W. Bowyer, L.O. Hall, W.P. Kegelmeyer, Smote: Syntheticminority over-sampling technique, Journal of Artificial Intelligence Research16 (2002) 321–357.
[10] J. Chen, H. Fang, Y. Saad, Fast approximate kNN graph construction for highdimensional data via recursive Lanczos bisection, Journal of Machine LearningResearch 10 (2009) 1989–2012.
[11] C.J. Stone, Consistent nonparametric regression, Annals of Statistics 5 (1977)595–645.
[12] H. Dubey, V. Pudi, Class based weighted k-nearest neighbor over imbalancedataset, in: J. Pei, V. Tseng, L. Cao, H. Motoda, G. Xu (Eds.), Advances inKnowledge Discovery and Data Mining, Springer, Berlin Heidelberg, 2013, pp.305–316.
[13] R.J. Durrant, A. Kabán, When is ‘nearest neighbour’ meaningful: a conversetheorem and implications, Journal of Complexity 25 (4) (2009) 385–397.
[14] S. Ertekin, J. Huang, C.L. Giles, Active learning for class imbalance problem, in:Proceedings of the 30th ACM SIGIR Conference, ACM, New York, NY, USA,2007, pp. 823–824.
[15] S.E. Ertekin, J. Huang, L. Bottou, C.L. Giles, Learning on the border: activelearning in imbalanced data classification, in: Proceedings of CIKM Conference,2007.
[16] K. Ezawa, M. Singh, S.W. Norton, Learning goal oriented Bayesian networks fortelecommunications risk management, in: Proceedings of the 13thInternational Conference on Machine Learning, Morgan Kaufmann, 1996, pp.139–147.
[17] K.J. Ezawa, T. Schuermann, Fraud/uncollectible debt detection using a bayesiannetwork based learning system: a rare binary outcome with mixed datastructures, in: Procedings of the 11th Conference on Uncertainty in AI, MorganKaufmann Publishers Inc., San Francisco, CA, USA, 1995, pp. 157–166.
[18] A. Fernandez, S. Garcia, F. Herrera, Addressing the classification withimbalanced data: open problems and new challenges on class distribution,in: Proceedings of HAIS conference, Springer, Berlin Heidelberg, 2011, pp. 1–10.
d the curse of minority hubs, Knowl. Based Syst. (2013), http://dx.doi.org/

1032103310341035103610371038103910401041104210431044104510461047104810491050105110521053105410551056105710581059106010611062106310641065106610671068106910701071107210731074107510761077107810791080108110821083108410851086108710881089109010911092109310941095109610971098109911001101110211031104110511061107110811091110111111121113111411151116
1117111811191120112111221123112411251126112711281129113011311132113311341135113611371138113911401141114211431144114511461147114811491150115111521153115411551156115711581159116011611162116311641165116611671168116911701171117211731174117511761177117811791180118111821183118411851186118711881189119011911192119311941195119611971198119912001201
N. Tomašev, D. Mladenic / Knowledge-Based Systems xxx (2013) xxx–xxx 15
KNOSYS 2624 No. of Pages 16, Model 5G
14 September 2013
[19] E. Fix, J. Hodges, Discriminatory analysis, nonparametric discrimination:consistency properties, Technical report, USAF School of Aviation Medicine,Randolph Field, 1951.
[20] D. François, V. Wertz, M. Verleysen, The concentration of fractional distances,IEEE Transactions on Knowledge and Data Engineering 19 (7) (2007) 873–886.
[21] M. Galar, A. Fernandez, E. Barrenechea, H. Bustince, F. Herrera, A review onensembles for the class imbalance problem: bagging-, boosting-, and hybrid-based approaches, IEEE Transactions on Systems, Man, and Cybernetics, Part C:Applications and Reviews 42 (4) (2012) 463–484.
[22] N. Garca-Pedrajas, C. Garca-Osorio, Boosting for class-imbalanced datasetsusing genetically evolved supervised non-linear projections, Progress inArtificial Intelligence 2 (1) (2013) 29–44.
[23] V. Garcia, R.A. Mollineda, J.S. Sanchez, On the k-nn performance in achallenging scenario of imbalance and overlapping, Pattern Analysis andApplication 11 (2008) 269–280.
[24] V. Garcia, J. Sanchez, R. Martn-Félez, R. Mollineda, Surrounding neighborhood-based smote for learning from imbalanced data sets, Progress in ArtificialIntelligence 1 (4) (2012) 347–362.
[25] N. Garcia-Pedrajas, J. Perez-Rodriguez, A. de Haro-Garcia, Oligois: scalableinstance selection for class-imbalanced data sets, IEEE Transactions onCybernetics 43 (1) (2013) 332–346.
[26] A.K. Ghosh, A probabilistic approach for semi-supervised nearest neighborclassification, Pattern Recognition Letters 33 (9) (2012) 1127–1133.
[27] D. Guan, W. Yuan, Y.-K. Lee, S. Lee, Identifying mislabeled training data withthe aid of unlabeled data, Applied Intelligence 35 (2011) 345–358.
[28] T. Hastie, R. Tibshirani, Discriminant adaptive nearest neighbor classification,IEEE Transactions on Pattern Analysis and Machine Intelligence 18 (6) (1996)607–616.
[29] K. Hayashi, A simple extension of boosting for asymmetric mislabeled data,Statistics and Probability Letters 82 (2012) 348–356.
[30] H. He, Y. Bai, E.A. Garcia, S. Li, Adasyn: adaptive synthetic sampling approachfor imbalanced learning, in: IJCNN’08, 2008, pp. 1322–1328.
[31] H. He, E.A. Garcia, Learning from imbalanced data, IEEE Transactions onKnowledge and Data Engineering 21 (9) (2009) 1263–1284.
[32] C.C. Holmes, N.M. Adams, A probabilistic nearest neighbor method forstatistical pattern recognition, Journal of the Royal Statistical Society B 64(2002) 295–306.
[33] R.C. Holte, L.E. Acker, B.W. Porter, Concept learning and the problem of smalldisjuncts, Proceedings of the 11th International Conference on AI, vol. 1,Morgan Kaufmann Publishers Inc., 1989, pp. 813–818.
[34] X. Hong, S. Chen, C.J. Harris, A kernel-based two-class classifier for imbalanceddata sets, IEEE Transactions on Neural Networks (2007) 28–41.
[35] J.V. Hulse, T.M. Khoshgoftaar, A. Napolitano, Skewed class distributions andmislabeled examples, in: Proceedings of the Seventh IEEE InternationalConference on Data Mining Workshops, ICDMW ’07, IEEE Computer Society,Washington, DC, USA, 2007, pp. 477–482.
[36] R. Jensen, C. Cornelis, A new approach to fuzzy-rough nearest neighbourclassification, in: Proceedings of the 6th International Conference on RoughSets and Current Trends in ComputingRSCTC ’08, Springer-Verlag, Berlin,Heidelberg, 2008, pp. 310–319.
[37] M. Kalager, H. Adami, M. Bretthauer, R. Tamimi, Overdiagnosis of invasivebreast cancer due to mammography screening: results from the norwegianscreening program, Annals of Internal Medicine 156 (2012) 491–499.
[38] J.E. Keller, M.R. Gray, J.A. Givens, A fuzzy k-nearest-neighbor algorithm, IEEETransactions on Systems, Man and Cybernetics (1985) 580–585.
[39] D. Kuang, C. Ling, J. Du, Foundation of mining class-imbalanced data, in: P.-N.Tan, S. Chawla, C. Ho, J. Bailey (Eds.), Advances in Knowledge Discovery andData Mining, Lecture Notes in Computer Science, vol. 7301, Springer, BerlinHeidelberg, 2012, pp. 219–230.
[40] M. Kubat, S. Matwin, Addressing the curse of imbalanced training sets: one-sided selection, in: Proceedings of the Fourteenth International Conference onMachine Learning, Morgan Kaufmann, 1997, pp. 179–186.
[41] Y. Li, X. Zhang, Improving k-nearest neighbor with exemplar generalization forimbalanced classification, in: Advances in Knowledge Discovery and DataMining, Springer, 2011, pp. 321–332.
[42] J. Liu, Q. Hu, D. Yu, A comparative study on rough set based class imbalancelearning, Knowledge-Based Systems 21 (8) (2008) 753–763.
[43] W. Liu, S. Chawla, Class confidence weighted knn algorithms for imbalanceddata sets, Advances in Knowledge Discovery and Data Mining, vol. 6635,Springer, 2011, pp. 345–356.
[44] W. Liu, S. Chawla, D.A. Cieslak, N.V. Chawla, A robust decision tree algorithmfor imbalanced data sets, in: SDM, SIAM, 2010, pp. 766–777.
[45] X.-Y. Liu, J. Wu, Z.-H. Zhou, Exploratory under-sampling for class-imbalancelearning, in: Proceedings of the Sixth International Conference on DataMining, ICDM ’06, IEEE Computer Society, Washington, DC, USA, 2006, pp.965–969.
[46] V. Lopez, A. Fernández, J.G. Moreno-Torres, F. Herrera, Analysis ofpreprocessing vs. cost-sensitive learning for imbalanced classification. openproblems on intrinsic data characteristics, Expert Systems with Applications39 (7) (2012) 6585–6608.
[47] T. Low, C. Borgelt, S. Stober, A. Nürnberger, The hubness phenomenon: fact orartifact?, in: C. Borgelt, M.N. Gil, J.M. Sousa, M. Verleysen (Eds.), TowardsAdvanced Data Analysis by Combining Soft Computing and Statistics, Studiesin Fuzziness and Soft Computing, vol. 285, Springer, Berlin Heidelberg, 2013,pp. 267–278.
Please cite this article in press as: N. Tomašev, D. Mladenic, Class imbalance an10.1016/j.knosys.2013.08.031
[48] M.D. Martino, A. FernáNdez, P. Iturralde, F. Lecumberry, Novel classifierscheme for imbalanced problems, Pattern Recognition Letters 34 (10) (2013)1146–1151.
[49] K. McCarthy, B. Zabar, G. Weiss, Does cost-sensitive learning beat sampling forclassifying rare classes?, in: Proceedings of the 1st International Workshop onUtility-Based Data Mining, UBDM ’05, ACM, New York, NY, USA, 2005, pp 69–77.
[50] T.M. Mitchell, Machine Learning, McGraw-Hill, 1997.[51] A. Nanopoulos, M. Radovanovic, M. Ivanovic, How does high dimensionality
affect collaborative filtering?, in: Proceedings of the Third ACM Conference onRecommender Systems, RecSys ’09, ACM, New York, NY, USA, 2009, pp 293–296.
[52] K. Napierala, J. Stefanowski, Identification of different types of minority classexamples in imbalanced data, in: Proceedings of the HAIS Conference,Springer, Berlin, 2012, pp. 139–150.
[53] S. Ougiaroglou, A. Nanopoulos, A.N. Papadopoulos, Y. Manolopoulos, T.Welzer-druzovec, Adaptive knearest neighbor classification based on adynamic number of nearest neighbors, in: Proceedings of ADBIS Conference,ADBIS 2007, 2007.
[54] J. Peng, D.R. Heisterkamp, H.K. Dai, Adaptive quasiconformal kernel nearestneighbor classification, IEEE Transactions on Pattern Analysis and MachineIntelligence 26 (5) (2004) 656–661.
[55] D. Pracner, N. Tomašev, M. Radovanovic, D. Mladenic, M. Ivanovic, WIKImage:correlated image and text datasets, in: Proceedings of the 14th InternationalMulticonference on Information Society (IS 2011), vol. A, Ljubljana, Slovenia,2011, pp. 141–144.
[56] R. Prati, G. Batista, M. Monard, Class imbalances versus class overlapping: ananalysis of a learning system behavior, in: Proceedings of the MexicanInternational Conference on Artificial Intelligence, RSCTC ’08, 2004, pp. 312–321.
[57] R. Quinlan, C4.5: Programs for Machine Learning, Morgan KaufmannPublishers, 1993.
[58] M. Radovanovic, Representations and Metrics in High-Dimensional DataMining, Izdavacka knjizarnica Zorana Stojanovica, Novi Sad, Serbia, 2011.
[59] M. Radovanovic, A. Nanopoulos, M. Ivanovic, Nearest neighbors in high-dimensional data: the emergence and influence of hubs, in: Proceedings of the26th International Conference on Machine Learning (ICML), 2009, pp. 865–872.
[60] M. Radovanovic, A. Nanopoulos, M. Ivanovic, Hubs in space: popular nearestneighbors in high-dimensional data, Journal of Machine Learning Research 11(2010) 2487–2531.
[61] M. Radovanovic, A. Nanopoulos, M. Ivanovic, On the existence of obstinateresults in vector space models, in: Proceedings of the 33rd AnnualInternational ACM SIGIR Conference on Research and Development inInformation Retrieval, 2010, pp. 186–193.
[62] M. Radovanovic, A. Nanopoulos, M. Ivanovic, Time-series classification inmany intrinsic dimensions, in: SDM, SIAM, 2010, pp. 677–688.
[63] D. Schnitzer, A. Flexer, M. Schedl, G. Widmer, Local and global scaling reducehubs in space, Journal of Machine Learning Research (2012) 2871–2902.
[64] Y. Song, J. Huang, D. Zhou, H. Zha, C.L. Giles, Iknn: Informative k-nearestneighbor pattern classification, in: Proceedings of the 11th EuropeanConference on Principles and Practice of Knowledge Discovery in Databases,PKDD 2007, Springer-Verlag, Berlin, Heidelberg, 2007, pp. 248–264.
[65] S. Tan, Neighbor-weighted k-nearest neighbor for unbalanced text corpus,Expert Systems with Applications 28 (2005) 667–671.
[66] S. Tan, Neighbor-weighted k-nearest neighbor for unbalanced text corpus,Expert Systems with Applications 28 (2005) 667–671.
[67] P. Thanathamathee, C. Lursinsap, Handling imbalanced data sets withsynthetic boundary data generation using bootstrap re-sampling andadaboost techniques, Pattern Recognition Letters 34 (12) (2013) 1339–1347.
[68] K.M. Ting, An instance-weighting method to induce cost-sensitive trees, IEEETransactions on Knowledge and Data Engineering 14 (3) (2002) 659–665.
[69] N. Tomašev, G. Leban, D. Mladenic, Exploiting hubs for self-adaptive secondaryre-ranking in bug report duplicate detection, in: Proceedings of the ITIConference, ITI 2013, 2013.
[70] N. Tomašev, J. Rupnik, D. Mladenic, The role of hubs in cross-lingual superviseddocument retrieval, in: Proceedings of the PAKDD Conference, PAKDD 2013,2013.
[71] N. Tomašev, R. Brehar, D. Mladenic, S. Nedevschi, The influence of hubness onnearest-neighbor methods in object recognition, in: Proceedings of the 7thIEEE International Conference on Intelligent Computer Communication andProcessing (ICCP), 2011, pp. 367–374.
[72] N. Tomašev, D. Mladenic, The influence of weighting the k-occurrences onhubness-aware classification methods, in: Proceedings of the SiKDDConference, 2011.
[73] N. Tomašev, D. Mladenic, Hubness-aware shared neighbor distances for high-dimensional k-nearest neighbor classification, in: Proceedings of the 7thInternational Conference on Hybrid Artificial Intelligence Systems, HAIS ’12,2012.
[74] N. Tomašev, D. Mladenic, Hubness-aware shared neighbor distances for high-dimensional k-nearest neighbor classification, Knowledge and InformationSystems, 2012.
[75] N. Tomašev, D. Mladenic, Nearest neighbor voting in high dimensional data:learning from past occurrences, Computer Science and Information Systems 9(2012) 691–712.
d the curse of minority hubs, Knowl. Based Syst. (2013), http://dx.doi.org/

120212031204120512061207120812091210121112121213121412151216121712181219122012211222122312241225 Q31226122712281229
1230123112321233123412351236123712381239124012411242124312441245124612471248124912501251125212531254
1255
16 N. Tomašev, D. Mladenic / Knowledge-Based Systems xxx (2013) xxx–xxx
KNOSYS 2624 No. of Pages 16, Model 5G
14 September 2013
[76] N. Tomašev, D. Mladenic, Hub co-occurrence modeling for robust high-dimensional knn classification, in: Proceedings of the ECML/PKDD Conference,Springer, 2013.
[77] N. Tomašev, D. Mladenic, Image hub explorer: evaluating representations andmetrics for content-based image retrieval and object recognition, in:Proceedings of the ECML/PKDD Conference, Springer, 2013.
[78] N. Tomašev, D. Pracner, R. Brehar, M. Radovanovic, D. Mladenic, M. Ivanovic, S.Nedevshi, Object recognition in wikimage data based on local invariant imagefeatures, in: Proceedings of the IEEE ICCP Conference, IEEE, 2013.
[79] N. Tomašev, M. Radovanovic, D. Mladenic, M. Ivanovic, A probabilisticapproach to nearest neighbor classification: Naive hubness bayesian k-nearest neighbor, in: Proceeding of the CIKM Conference, 2011.
[80] N. Tomašev, M. Radovanovic, D. Mladenic, M. Ivanovic, The role of hubness inclustering high-dimensional data, Advances in Knowledge Discovery and DataMining, vol. 6634, Springer, 2011, pp. 183–195.
[81] N. Tomašev, M. Radovanovic, D. Mladenic, M. Ivanovic, Hubness-based fuzzymeasures for high-dimensional k-nearest neighbor classification, InternationalJournal of Machine Learning and Cybernetics, 2013.
[82] N. Tomašev, M. Radovanovic, D. Mladenic, M. Ivanovic, The role of hubness inclustering high-dimensional data, IEEE Transactions on Knowledge and DataEngineering 99 (2013) (PrePrints).
[83] H. Valizadegan, P.-N. Tan, Kernel based detection of mislabeled trainingexamples, in: SDM, SIAM, 2007.
[84] A. van den Bosch, T. Weijters, H.J.V.D. Herik, W. Daelemans, When smalldisjuncts abound, try lazy learning: a case study (1997).
[85] J. Wang, P. Neskovic, L.N. Cooper, Improving nearest neighbor rule with asimple adaptive distance measure, Pattern Recognition Letters 28 (2007) 207–213.
Please cite this article in press as: N. Tomašev, D. Mladenic, Class imbalance an10.1016/j.knosys.2013.08.031
[86] S. Wang, X. Li, J.-F. Xia, X.-P. Zhang, Weighted neighborhood classifier for theclassification of imbalanced tumor dataset, Journal of Circuits, Systems, andComputers (2010) 259–273.
[87] G.M. Weiss, Mining with rarity: a unifying framework, SIGKDD Explorationsand Newsletters 6 (2004) 7–19.
[88] I.H. Witten, E. Frank, Data Mining: Practical Machine Learning Tools andTechniques, second ed., Morgan Kaufmann Publishers, 2005.
[89] G. Wu, E.Y. Chang, KBA: kernel boundary alignment considering imbalanceddata distribution, IEEE Transactions on Knowledge and Data Engineering 17 (6)(2005) 786–795.
[90] H. Zhang, A.C. Berg, M. Maire, J. Malik, Svm-knn: discriminative nearestneighbor classification for visual category recognition, Proceedings of the 2006IEEE Computer Society Conference on Computer Vision and PatternRecognition – CVPR ’06, Vol. 2, IEEE Computer Society, Washington, DC, USA,2006, pp. 2126–2136.
[91] J. Zhang, I. Mani, KNN approach to unbalanced data distributions: a case studyinvolving information extraction, in: Proceedings of the ICML’2003 Workshopon Learning from Imbalanced Datasets, 2003.
[92] X. Zhang, Y. Li, A positive-biased nearest neighbour algorithm for imbalancedclassification, in: J. Pei, V. Tseng, L. Cao, H. Motoda, G. Xu (Eds.), Advances inKnowledge Discovery and Data Mining, Lecture Notes in Computer Science,vol. 7819, Springer, Berlin Heidelberg, 2013, pp. 293–304.
[93] L. Zhou, Performance of corporate bankruptcy prediction models onimbalanced dataset: the effect of sampling methods, Knowledge-BasedSystems 41 (2013) 16–25.
d the curse of minority hubs, Knowl. Based Syst. (2013), http://dx.doi.org/