Embed Size (px)
Citation preview
34th International North Sea Flow Measurement Workshop 25-28 October 2016
1
Clamp on Ultrasonic Flow Meters vs A Fiscal Orifice Station.
How Accurate Are Clamp on Meters Out of The Box?
Andrew Runcie, PX Limited Paul Daniel, METCO | Emerson Process Management
1 INTRODUCTION Total E&P operated the St Fergus Gas Terminal and Associated Pipelines from 1977 till March 2016 when operations were transferred over to PX limited on behalf of North Sea Mid stream Partners. There are 2 pipelines that feed the terminal where Natural Gas is processed, Metered and Exported to the National Grid Network. 1.1 FUKA (Frigg UK Pipeline) The Frigg UK pipeline (FUKA) currently transports gas from the following fields to the phase 3 process trains at St Fergus Gas Terminal: Alwyn Area fields Bruce Area Fields Buzzard Field Captain Field Ross Area fields Claymore/Piper/Tartan Gas from these fields is metered prior to entering the FUKA pipeline. The Gas is then processed at the St Fergus Gas terminal to meet the National Grid Transportation specifications. The Gas is metered immediately prior to entering the National Grid. 1.2 Vesterled Pipeline:
Gas from the Heimdal area is transported through the GASSCO Transportation network and is routed through the Heimdal riser platform where it is metered prior to Entering the Vesterled platform. Upon entering St Fergus the Gas is then passed through the Phase 2 Process trains and then metered immediately prior to being exported to the National Grid Gas transportation Network.

34th International North Sea Flow Measurement Workshop 25-28 October 2016
2
A high level block diagram of the St Fergus terminal is presented in Figure 1, showing the location of the sales gas metering. Immediately prior to the Sales Gas meters there is a cross over facility to enable Phase 2 Gas to be comingled with the Phase 3 Gas and exported via either the Sales gas 1 or Sales Gas 2 Metering stations.
Figure 1 : St Fergus Process Schematic Diagram
With an ultimate aim to facilitate allocation during periods when the cross-over is in use Siemens FUG1010 single channel clamp on Ultrasonic Meters were installed in 2011 by Able instruments in 3 of the Ph2 Process trains along with a new Daniels 700XA chromatograph. The Meters were installed on 24” Carbon Steel Flow lines flowing natural gas at around 45BarA and 10°c with a Gas velocity between 0 and 20m/s. This Paper describes some of the key measurement issues experienced by the operator in recent years and the steps taken to meet these challenges.
The areas covered in this paper are:
a) Use of a Clamp on meter straight out of the box
- Initial performance tests with comparisons against the Sales gas metering station
b) Further work carried out to improve the meter performance with comparison
tests against the fiscal metering station
ST. FERGUS SCHEMATIC DIAGRAM (NO PRETREATMENT CROSSOVERS AVAILABLE)
PHASE 3
PHASE 2
FUEL FLARE
FUEL FLARE
LIQUID TO BP
PHASE 1 SALES GAS METERS
PHASE 2 SALES GAS METERS
NITROGEN
NITROGEN
ST FERGUS TERMINAL
LIQUID TO BP
LIQUID TO SHELL
CALCULATED LANDED MASS FROM UK PIPELINE
CALCULATED LANDED MASS FROM NW PIPELINE
M3
M2
POSTTREATMENT CROSS OVER

34th International North Sea Flow Measurement Workshop 25-28 October 2016
3
2 SYSTEM DESIGN AND OPERATION The meters are clamped onto the outlet of each process stream along with a strap on Temperature RTD. A common Pressure transmitter exists at the outlet of the Ph2 Process system. The Volume flow rate and stream Temperature from each Flow Meter is communicated to a Dedicated S600 flow computer via serial link as well as the unormalised Gas composition from a dedicated Emerson 700XA Gas chromatograph and the Ph2 outlet Pressure. Using the composition from the Gas chromatograph, the flow computer calculates the density and compressibility at stream conditions in accordance with AGA8 (1994) [1]. The Mass flow rate for each stream is then calculated and summed to give the total Phase 2 Mass flowrate. The St Fergus Sales Gas 2 Export Metering station consists of 6 x 24” Orifice plate meter runs with Daniels type Senior Sonic Orifice Plate Carriers.
Figure 2 : St Fergus Phase 2 Process Schematic Diagram
During normal operations, the Clamp-on flow meters are in series with the Sales gas Metering station and can be directly compared, however there are occasions when the Phase 2 Gas is comingled with the Phase 3 Gas and is exported via either the Sales gas 1 or Sales Gas 2 Metering stations.

34th International North Sea Flow Measurement Workshop 25-28 October 2016
4
The meters installed on streams 1200 & 1300 are shown in Figures 3 &4.
Figure 3 : Stream 1200 clamp on meter Figure 4 : Stream 1300 clamp on meter installation installation
Figure 5 below shows a plot of both the Sales Gas Export 2 Daily reported mass and the Phase 2 Process Gas Daily reported mass for a period in 2012/2013. The clamp-on USM meters match the sales gas metering station very well.
Figure 5 : Production data
0
5000
10000
15000
20000
25000
30000
35000
01
/11
/12
08
/11
/12
15
/11
/12
22
/11
/12
29
/11
/12
06
/12
/12
13
/12
/12
20
/12
/12
27
/12
/12
03
/01
/13
10
/01
/13
17
/01
/13
24
/01
/13
31
/01
/13
07
/02
/13
14
/02
/13
21
/02
/13
28
/02
/13
Metering 2 Sales Gas Daily Report Mass (t) Process Gas 2 Daily Report Mass (t)

34th International North Sea Flow Measurement Workshop 25-28 October 2016
5
3 MEASUREMENT THEORY For Clamp on ultrasonic Meters two principles are generally available, these are; Doppler or time transit principle. For this application the more common time transit principle was used. 3.1 Transit-Time Measuring Principle The principle is based on the time difference it takes for an ultrasonic pulse to travel a defined distance both with and against flow. As the medium in which the signals propagate is flowing, the transit time of the
ultrasonic signals in the flow direction is shorter than against the flow direction. The transit time difference, delta t, is measured and facilitate the determination of the average flow velocity along the propagation path of the ultrasonic signals. A flow profile correction is then performed in order to obtain the area averaged flow velocity, which
is proportional to the volumetric flow rate. Figure 6 shows a single refelective path design. The received ultrasonic signals are checked for their usefulness for the measurement and the plausibility of the measured values evaluated. The complete measuring cycle is controlled by integrated microprocessors. Disturbance signals will be eliminated. The clamp-on ultrasonic meter may be mounted and configured in a Reflective mode (Figure 7) or Diagonal mode (Figure 8). For a single reflective path, both of the transducers are mounted on the same side of the pipe making correct positioning of the transducers easier.
Figure 7 : Reflection mode Figure 8 : Diagonal mode
For a Diametric paths, the transducers are mounted on opposite sides of the pipe. In the case of high signal attenuation by the medium, pipe and coatings, a diagonal mode with 1 sound path may be most appropriate.
Figure 6 : Transit time principle

34th International North Sea Flow Measurement Workshop 25-28 October 2016
6
The preferred method of installation depends on the application. As the transducers can be mounted with the transducer mounting fixture in reflection mode or diagonal mode, the number of sound paths can be adjusted optimally for the application. 3.2 Flow Calibration Factor Normally, the flow stream is parallel to the axis of the pipe. On this basis, the calibration factor of a clamp-on ultrasonic flow meter is proportional to the cosine of the beam angle relative to the pipe axis (ref Siemens FUG1010 operating instruction
manual). However, this reveals that if the angle of flow stream is not in line with the pipe axis, the flow calibration factor could be compromised. This most often occurs when the sensor mounting location is within close proximity of a bend or other pipe obstruction. 3.2 Achievable Accuracy Within the industry many of the meter manufacturers claim that a level of uncertainty of ±2% is achievable at a calibration facility, however for industrial applications it is thought within the industry that the achievable level of performance with a typical clamp-on meter, with a good installation base, is typically between 1–3 % of reading.

34th International North Sea Flow Measurement Workshop 25-28 October 2016
7
4 INITIAL CLAMP ON METER PERFORMANCE TESTS During 2012 the performance of the flow meters against the Sales gas 2 Metering system was monitored. This itself posed some problems in how this could be achieved since the individual data points were not fed in the Total PI system and were therefore not available in the historian. Since the Mass for the combined Phase 2 Meters is reported in the Flow computer as a daily Total, it was decided to compare the reported daily Mass from both systems. Figure 9 shows the Percentage Difference between the Reported Sales Gas 2 Metering station versus the Combined Phase 2 Process Gas Daily Mass Total. Figure 9 also shows the periods when the cross over is opened, hence the large % differences during these periods. With the Cross over periods removed the average % difference for the period in the graph in figure 9 is given as -1.058%.
Figure 9 : Sales Gas vs Process Gas: 2012 -2013 trend
From the Trend, it is clear that there is a negative bias in the Phase 2 Process gas flow meters. The Mass totals for Phase 2 against the percentage difference between the phase 2 clamp-on meters and the sales gas metering station was also compared. The results can be seen on Figure 10.
Figure 10 : Sales gas vs Process gas post 2012 -2013 trend
-5.0
-4.0
-3.0
-2.0
-1.0
0.0
1.0
2.0
3.0
4.0
5.0
01
/11
/20
12
15
/11
/20
12
29
/11
/20
12
13
/12
/20
12
27
/12
/20
12
10
/01
/20
13
24
/01
/20
13
07
/02
/20
13
21
/02
/20
13
07
/03
/20
13
21
/03
/20
13
04
/04
/20
13
18
/04
/20
13
Dif
fere
nce
(%
)
Sales Gas 2 Versus Process 2 (t/day) %Diff Crossover usage
-5.0
-4.0
-3.0
-2.0
-1.0
0.0
1.0
2.0
3.0
4.0
5.0
30
346
27
518
25
932
24
303
22
973
21
820
20
764
19
758
18
898
17
381
16
543
15
365
14
240
13
349
12
777
12
192
11
560
10
486
98
29
91
70
82
99
70
72
63
15
53
55
48
45
44
95
41
80
37
74
33
04
29
24
24
93
22
68
18
05
Dif
fere
nce
(%
)
Tonnes / Day
Sales Gas 2 v %DIff

34th International North Sea Flow Measurement Workshop 25-28 October 2016
8
The results in figure 10 clearly show that the meters appear to perform around ±1% at the lower flow rates up to 5000 tonnes/day, however the performance starts to degrade after this point at flows up to 20000 tonnes/day as can also been seen in figure 5. After reviewing the data, it was decided to contact the Vendor, Able instruments, with a view to try and tune the Meters to Match the output from the Sales gas metering station to within ±1% so that the meters can be used for Allocation purposes. Within the Flow Meters there is an option to adjust the meter output to match that of an external or reference meter by entering a Calibration Factor(Kc factor). The factor Kc (slope correction) assumes that the flow range produces a linear response. The Kc factor is calculated as follows:
�� = �����������
�������������− 1� �100
(1) There is also another Option within the Flow meter to select a methodology by which the response can be linearized or optimised by tabulating the results of a series of calibration points into a table. The Flow meters were originally set with a KC value of 4%. During June 2013, the vendor re-positioned the transducers on all 3 streams and adjusted the Kc value to 3.0 & 3.3% on stream 1200 and 1300. It was decided not to adjust stream 1100 since it is rarely used. This is seen in the Graph in figure 11 below, where the error bias shifts from negative to Positive.
34th International North Sea Flow Measurement Workshop 25-28 October 2016
9
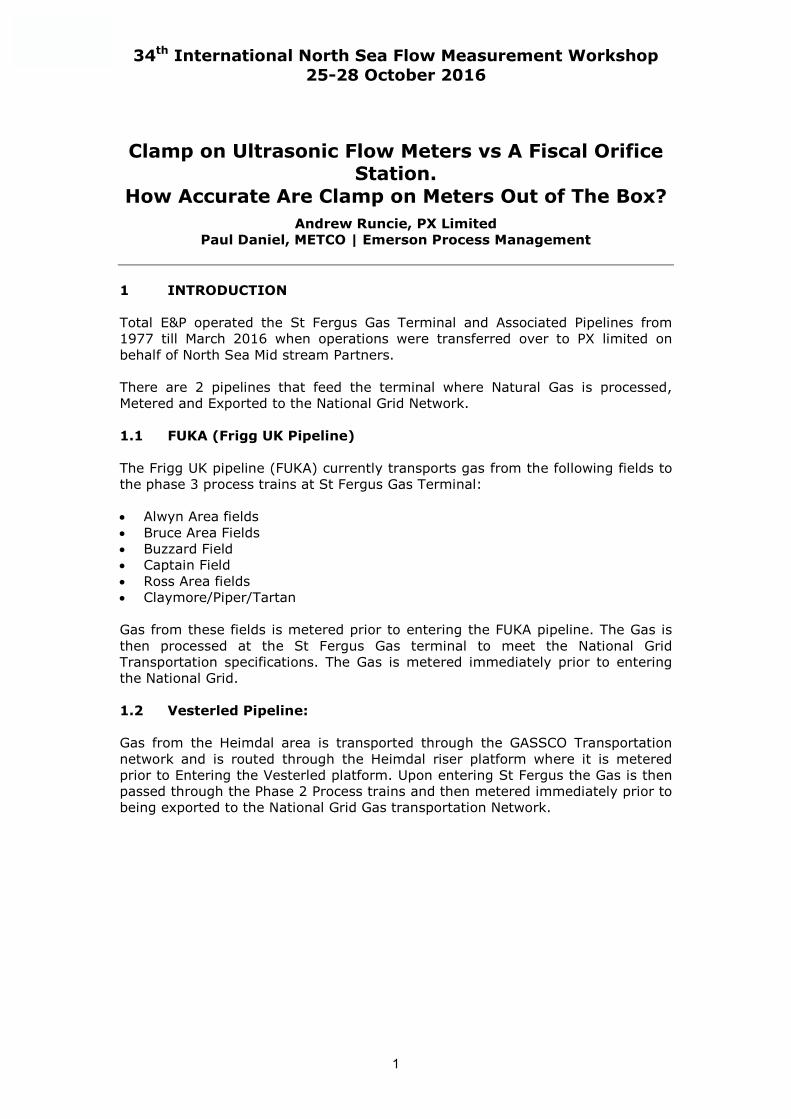
Figure 11 : Sales gas vs Process gas post 2013 -2014 trend
After a period of collecting more data, it was decided to again adjust the KC values on both streams. Stream 1200 was adjusted to 2.8 % and stream 1300 was increased to 3.4%. This change appeared to have shifted the Bias so that is was more evenly distributed however during the period after the change, the flow rates were significantly increased and the error became more negatively biased. This is possibly due to the use of stream 1100 and other process related activities’.
Figure 12 : Sales gas 2 vs %Diff post Able Testing –June 2013 to Jan 2014
-5.0
-4.0
-3.0
-2.0
-1.0
0.0
1.0
2.0
3.0
4.0
5.0
25
,37
5
18
,55
3
16
,06
7
13
,92
7
11
,87
5
9,7
47
8,9
89
8,0
95
7,7
94
7,6
10
7,3
85
6,9
18
6,7
00
6,5
82
5,6
67
5,0
43
3,8
20
3,6
65
3,3
96
3,0
83
3,0
14
2,9
58
2,9
08
2,7
23
2,5
79
2,4
95
2,4
63
2,3
52
2,2
08
2,1
48
2,1
22
1,9
82
1,8
83
1,7
74
1,7
26
1,6
63
1,6
05
1,5
67
Dif
fere
nce
(%
)
Tonnes / Day
Sales Gas 2 Versus Process 2 (t/day)

34th International North Sea Flow Measurement Workshop 25-28 October 2016
10
Figure 12 above shows the change in meter performance after the KC Factor changes from June 2014 till January 2014. It can be seen there that there is a slight increase in performance over the operating range 5 CLAMP ON METER OPTIMISATION To further improve the performance of the meters, the meters were upgraded to dual channel meters during 2014 and the KC Factors were adjusted again. The strap on RTD’s were removed and insertion RTD’s were fitted just downstream of the meters during 2015. The results however were mixed, on stream 1200 the performance was greatly improved however on stream 1300 the performance was varied over the operating range of the meter as can be seen in figure 13.
Figure 13 : Sales gas vs Process gas post 2014 -2015 trend
After some investigation work it was clear that there were problems with the installation of the stream 1300 meter. The Sound coating of the meter was removed and re-applied to the pipe and the meter re-fitted. The correct thickness of the sound coat was also entered into the Meter configuration. This has led to a significant an improvement in the performance of the clamp-on meters as can be seen in figures 14 and 15.
-5.0
-4.0
-3.0
-2.0
-1.0
0.0
1.0
2.0
3.0
4.0
5.0
01
/01
/201
4
01
/02
/201
4
01
/03
/201
4
01
/04
/201
4
01
/05
/201
4
01
/06
/201
4
01
/07
/201
4
01
/08
/201
4
01
/09
/201
4
01
/10
/201
4
01
/11
/201
4
01
/12
/201
4
01
/01
/201
5
01
/02
/201
5
01
/03
/201
5
01
/04
/201
5
01
/05
/201
5
01
/06
/201
5
01
/07
/201
5
01
/08
/201
5
01
/09
/201
5
01
/10
/201
5D
iffe
ren
ce (
%)
Sales Gas 2 Versus Process 2 (t/day)
Testing of Flow MetersKC value changedon 1200 and 1300
Sound coat replaced on stream 1300
Stream 1300 only Online

34th International North Sea Flow Measurement Workshop 25-28 October 2016
11
Figure 14 : Sales gas vs Process gas post 2015 -2016 trend
Figure 15 : Sales gas 2 vs %Diff December 2015 –May 2016
Figure 15 shows the difference versus the sales gas 2 flow rate since the stream 1300 sound coat was re-applied and the meter setup correctly. From the graph it is clear that there is a significant improvement across the flow range, and the meters tend to perform within 1% of the Sales gas 2 daily mass total.
-5.0
-4.0
-3.0
-2.0
-1.0
0.0
1.0
2.0
3.0
4.0
5.0
01
/11
/20
15
08
/11
/20
15
15
/11
/20
15
22
/11
/20
15
29
/11
/20
15
06
/12
/20
15
13
/12
/20
15
20
/12
/20
15
27
/12
/20
15
03
/01
/20
16
10
/01
/20
16
17
/01
/20
16
24
/01
/20
16
31
/01
/20
16
07
/02
/20
16
14
/02
/20
16
21
/02
/20
16
28
/02
/20
16
06
/03
/20
16
13
/03
/20
16
20
/03
/20
16
27
/03
/20
16
03
/04
/20
16
10
/04
/20
16
17
/04
/20
16
24
/04
/20
16
01
/05
/20
16
08
/05
/20
16
15
/05
/20
16
22
/05
/20
16
Dif
fern
ce (
%)
Sales Gas 2 Versus Process 2 (t/day) %Diff
Meter Repositioned and sound coat replaced on stream 1300
-5.0
-4.0
-3.0
-2.0
-1.0
0.0
1.0
2.0
3.0
4.0
5.0
16
172
12
428
11
875
11
747
11
454
11
239
11
008
10
865
10
625
10
367
10
223
10
128
99
96
95
40
94
01
92
11
91
22
90
24
89
27
86
86
85
54
84
54
83
69
83
22
81
00
80
50
78
86
76
03
74
10
72
08
70
63
63
58
60
70
55
33
49
28
Dif
fere
nce
(%
)
Sales Gas 2 Versus Process 2 (t/day)

34th International North Sea Flow Measurement Workshop 25-28 October 2016
12
6 SUMMARY AND CONCLUSION The Clamp on meter has proven itself to be capable in delivering a performance of better than ±1% of reading when compared to the Gas Export metering system. However, it is clear that the most important factor in achieving an acceptable level of performance is ensuring that the meters are installed correctly and sited at a suitable location ensuring that the meter is located where there is little or no effect of noise from the process. The meters should also be located where disturbances in the flow such as bends that can cause changes to the flow profile is avoided. The addition of flow linearization curves within the flow computer for the individual meters may also improve the perfomance of the meters over the operating range and is an option currently being considered.

34th International North Sea Flow Measurement Workshop 25-28 October 2016
13
7 NOTATION The notation used in this paper is as follows: m/s Metres per second
°c Degrees Centigrade
KC Calibration Factor
t Mass (tonnes) 8 REFERENCES [1] AMERICAN GAS ASSOCIATION , Compressibility Factor of Natural Gas and
Related Hydrocarbon Gases. American Gas Association Transmission Measurement Committee Report No. 8 (1994)
[2] AMERICAN GAS ASSOCIATION. Measurement of Gas by Mulithpath
Utlrasonic Flow meters. American Gas Association Transmission Measurement Committee Report No.9,2000.
[3] BSI British Standards. Guide to the Selection, installation, operation and
calibration of diagnoal path transit time ultrasonic flow meters for industrial gas applications. BS 7965:2009
[4] SEMINAR ON ULTRASONIC FLOW METER CONDITION BASED
MONITORING. Organised by the United Kingdom Department of Energy and Climate change(DECDC), aberdeen Exhibition and conference centre(AECC),2011.
[5] JWF Survey of Bruce Gas Export Meters by clamp on Meters using Flexim
Clamp on Meters Report. [6] Survey report for St Fergus Clamp on meters By Able Instruments UK ltd. [7] TUV NEL Good Practice Guide - An introduction to non-invasive ultrasonic
flow metering 9 ACKNOWLEDGEMENTS The authors would like to thank the following for their input to the issues described in this paper: TOTAL UK Ltd EMERSON Ian Bates Jonathan Ritchie GASSCO Frode Bjellend


![External circuit for gas meters - acam messelectronic … circuit for gas meters TDC-GP30 in gas meters ams Application Note Page 2 [v1-01] 2017-Jan-31 Document Feedback Content Guide](https://img.dokumen.tips/doc/110x75/5aad26aa7f8b9a693f8dfac1/external-circuit-for-gas-meters-acam-messelectronic-circuit-for-gas-meters.jpg)