Embed Size (px)
Citation preview

Cladding Attachment Over Thick Exterior Insulating Sheathing P. Baker, P. Eng, and R. Lepage Building Science Corporation
January 2014
NOTICE
This report was prepared as an account of work sponsored by an agency of the United States government. Neither the United States government nor any agency thereof, nor any of their employees, subcontractors, or affiliated partners makes any warranty, express or implied, or assumes any legal liability or responsibility for the accuracy, completeness, or usefulness of any information, apparatus, product, or process disclosed, or represents that its use would not infringe privately owned rights. Reference herein to any specific commercial product, process, or service by trade name, trademark, manufacturer, or otherwise does not necessarily constitute or imply its endorsement, recommendation, or favoring by the United States government or any agency thereof. The views and opinions of authors expressed herein do not necessarily state or reflect those of the United States government or any agency thereof.
Available electronically at http://www.osti.gov/bridge
Available for a processing fee to U.S. Department of Energy and its contractors, in paper, from:
U.S. Department of Energy Office of Scientific and Technical Information
P.O. Box 62 Oak Ridge, TN 37831-0062
phone: 865.576.8401 fax: 865.576.5728
email: mailto:[email protected]
Available for sale to the public, in paper, from: U.S. Department of Commerce
National Technical Information Service 5285 Port Royal Road Springfield, VA 22161 phone: 800.553.6847
fax: 703.605.6900 email: [email protected]
online ordering: http://www.ntis.gov/ordering.htm
Printed on paper containing at least 50% wastepaper, including 20% postconsumer waste

iii
Cladding Attachment Over Thick Exterior Insulating Sheathing
Prepared for:
The National Renewable Energy Laboratory
On behalf of the U.S. Department of Energy’s Building America Program
Office of Energy Efficiency and Renewable Energy
15013 Denver West Parkway
Golden, CO 80401
NREL Contract No. DE-AC36-08GO28308
Prepared by:
P. Baker, P. Eng, and R. Lepage
Building Science Corporation
30 Forest Street
Somerville, MA 02143
NREL Technical Monitor: Cheryn Engebrecht
Prepared under Subcontract No. KNDJ-0-40337-03
January 2014

iv
[This page left blank]
v
Contents List of Figures ............................................................................................................................................ vi List of Tables ............................................................................................................................................. vii Definitions ................................................................................................................................................. viii Executive Summary ................................................................................................................................... ix 1 Problem Statement ............................................................................................................................... 1
1.1 Introduction ..........................................................................................................................1 1.2 Background ..........................................................................................................................1 1.3 Relevance to Building America’s Goals ..............................................................................3 1.4 Cost Effectiveness ................................................................................................................3 1.5 Tradeoffs and Other Benefits ...............................................................................................5
2 Previous Research ............................................................................................................................... 6 3 Analysis and Test Method ................................................................................................................. 14
3.1 System Mechanics .............................................................................................................14 3.1.1 Numerical Analysis ................................................................................................15 3.1.2 Material Property Testing ......................................................................................18 3.1.3 Boundary Condition Testing ..................................................................................21 3.1.4 Discrete Load Component Testing ........................................................................23
3.2 Environmental Exposure ....................................................................................................25 3.2.1 Long-Term Movement (Creep)..............................................................................27 3.2.2 Diurnal Movement .................................................................................................29
4 Discussion ........................................................................................................................................... 31 4.1 Previous Research ..............................................................................................................31 4.2 System Mechanics .............................................................................................................34
4.2.1 Moment Resistance of Fasteners ...........................................................................34 4.2.2 Strut and Tie Model (Low Friction).......................................................................36 4.2.3 Static Friction .........................................................................................................39
4.3 Environmental Exposure ....................................................................................................40 5 Conclusions and Recommendations ............................................................................................... 46 References ................................................................................................................................................. 48 Appendix A: BEopt Simulation Graphs .................................................................................................. 50
Dallas, Texas ............................................................................................................................50 Kansas City, Missouri ..............................................................................................................51 Boston, Massachusetts .............................................................................................................52 Duluth, Minnesota....................................................................................................................53

vi
List of Figures Figure 1. Theorized forces providing vertical displacement resistance ............................................... 2 Figure 2. Typical ASTM D1761 test setup ................................................................................................. 8 Figure 4. Short-term gravity load response test setup .......................................................................... 9 Figure 5. Short-term load versus deflection for assemblies with 4 in. of exterior insulation ........... 10 Figure 6. Short-term load versus deflection for assemblies with 8 in. of exterior insulation ........... 10 Figure 7. Long-term gravity load response test setup ......................................................................... 11 Figure 8. Long-term load versus deflection for assemblies with 4 in. of exterior insulation ........... 12 Figure 9. Forces providing vertical displacement resistance .............................................................. 15 Figure 10. Free body diagram of bending resistance of a fastener .................................................... 16 Figure 11. Free body diagram of compression resistance of insulation ............................................ 17 Figure 12. Free body diagram of the friction resistance between material layers ............................. 18 Figure 13. Measurement locations for fastener dimensions ................................................................ 19 Figure 14. Example of insulation compression Test B ......................................................................... 20 Figure 15. Example of a static COF test ................................................................................................. 21 Figure 16. Precompression force test setup .......................................................................................... 21 Figure 17. Relaxation of screw fastener precompression forces over a 2-day time period ............. 22 Figure 18. Example of a friction only system test ................................................................................. 23 Figure 19. Screenshot of data acquisition system output .................................................................... 24 Figure 20. Discrete load component testing of small scale wall assemblies with XPS .................... 25 Figure 21. Test wall assemblies under construction ............................................................................ 26 Figure 22. Exposed wall assemblies loaded to representative cladding weights.............................. 26 Figure 23. Lightweight cladding panel installed over the test wall assemblies ................................. 27 Figure 24. Deflection measurement location ......................................................................................... 27 Figure 25. Long-term environmental exposure of lightweight claddings ........................................... 28 Figure 26. Long-term environmental exposure of medium-weight claddings .................................... 28 Figure 27. Long-term environmental exposure of heavyweight claddings ........................................ 29 Figure 28. Diurnal movement of simulated medium-weight cladding system over XPS insulated
wall assembly...................................................................................................................................... 30 Figure 29. Simple screw cantilever bending test ................................................................................... 36 Figure 30. Measured versus calculated strut and tie load component resistance ............................ 38 Figure 31. Measured versus calculated friction load component resistance ..................................... 39 Figure 32. Change of precompression forces over time ...................................................................... 40 Figure 33. Sample of ambient versus cladding cavity temperatures .................................................. 41 Figure 34. Proposed acceptable band of movement of furring over XPS insulation with a low load
per fastener ......................................................................................................................................... 42 Figure 35. Long-term deflection of a furring strip loaded to 30 lb/fastener in a stable environment43 Figure 36. Long-term deflection of a furring strip loaded to 30 lb/fastener in an exposed
environment ........................................................................................................................................ 43 Figure 37. Furring strip movement recorded after the first day of “set in” ........................................ 45 Figure 38. Annualized energy related costs versus average source energy savings for Dallas...... 50 Figure 39. Average source energy savings reduction versus insulation level for Dallas ................. 50 Figure 40. Annualized energy related costs versus average source energy savings for Kansas
City ....................................................................................................................................................... 51 Figure 41. Average source energy savings reduction versus insulation level for Kansas City ...... 51 Figure 42. Annualized energy-related costs versus average source energy savings for Boston .. 52 Figure 43. Average source energy savings reduction versus insulation level for Boston .............. 52 Figure 44. Annualized energy related costs versus average source energy savings for Duluth .... 53 Figure 45. Average source energy savings reduction versus insulation level for Duluth ................ 53
Unless otherwise noted, all figures were created by BSC.

vii
List of Tables Table 1. Benchmark House Characteristics ............................................................................................. 4 Table 2. Parametric Steps and Cost .......................................................................................................... 4 Table 3. Reference Cities............................................................................................................................ 5 Table 4. Yield Modes From AFPA TR-12 ................................................................................................... 6 Table 5. Materials Used in the Laboratory and Field Testing ............................................................... 14 Table 6. Insulation Materials .................................................................................................................... 14 Table 7. Average Fastener Dimensions .................................................................................................. 19 Table 8. Screw Bending Yield Moment ................................................................................................... 19 Table 9. Elastic Range Modulus of Compression of Insulation Products .......................................... 20 Table 10. Static Friction Test Results ..................................................................................................... 21 Table 11. Furring Strip Precompression Forces .................................................................................... 22 Table 12. Environmental Exposure Test Panel Simulated Cladding Weights .................................... 26 Table 13. Mean Measured Load of 4-in. Insulation Assemblies at 0.015-in. and 0.125-in. Deflection32 Table 14. Maximum Allowable Insulation Thickness (in.) Excerpt From the NYSERDA/SFA Table . 32 Table 15. Calculated Cladding Load (lb/Fastener) Based on NYSERDA/SFA Table .......................... 32 Table 16. BSC 4 in. Test Results (Highlighted in Orange) at 0.015-in. Deflection Limit and
1.5 Divisor Applied Compared to NYSERDA/SFA Table ................................................................ 33 Table 17. BSC 4 in. Test Results (Highlighted in Orange) at 0.125 in. Deflection Limit and 1.5
Divisor Applied Compared to NYSERDA/SFA Table....................................................................... 33 Table 18. Predicted Load Resistance Component of Screw Bending ................................................. 34 Table 19. Effects of Beam Length on the Predicted Load Resistance Component of Screw Bending35 Table 20. Predicted Versus Measured Screw Bending Capacity (Assuming Bending at Face of
Framing) .............................................................................................................................................. 35 Table 21. Predicted Versus Measured Screw Bending Capacity (Assuming Bending at ¼ in. Into
Framing) .............................................................................................................................................. 35 Table 22. Predicted Versus Measured Screw Bending Capacity (Assuming Bending at ½ in. Into
Framing) .............................................................................................................................................. 36 Table 23. Elastic Range Compression Modulus of Insulation .............................................................. 37 Table 24. Modeled Compression Strut Capacity for XPS insulation ................................................... 38 Table 25. Coefficients of Thermal Expansion ........................................................................................ 41
Unless otherwise noted, all tables were created by BSC.
viii
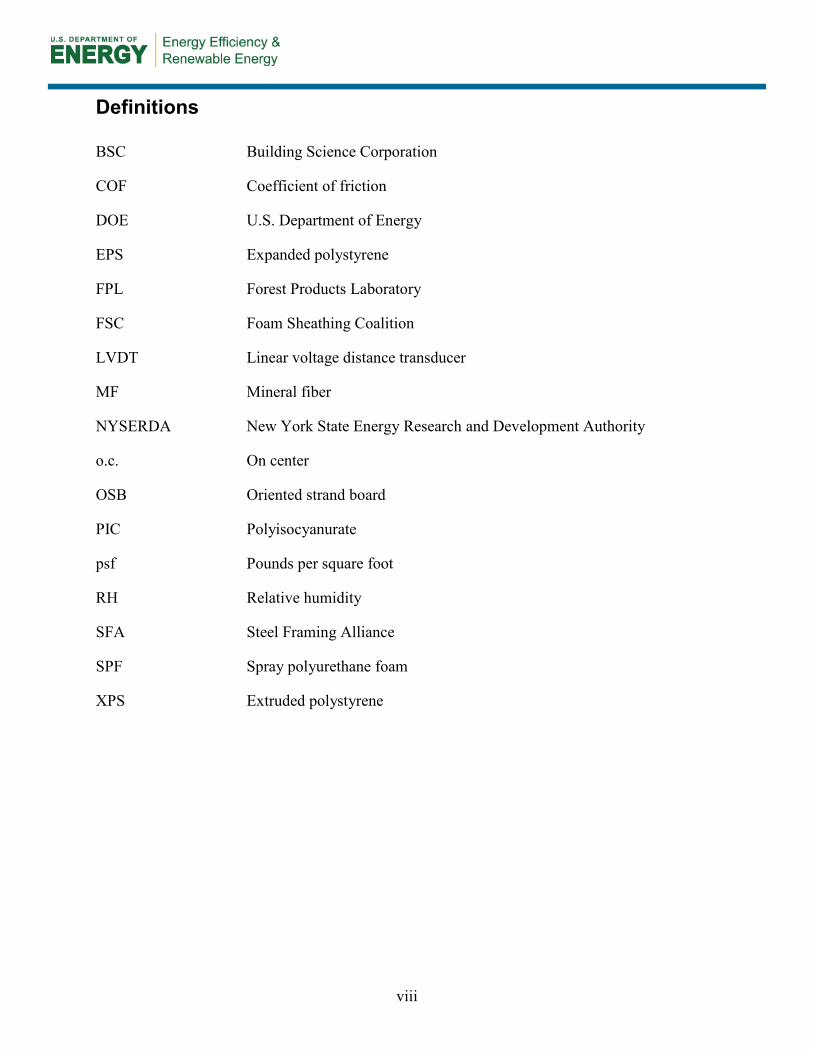
Definitions
BSC Building Science Corporation
COF Coefficient of friction
DOE U.S. Department of Energy
EPS Expanded polystyrene
FPL Forest Products Laboratory
FSC Foam Sheathing Coalition
LVDT Linear voltage distance transducer
MF Mineral fiber
NYSERDA New York State Energy Research and Development Authority
o.c. On center
OSB Oriented strand board
PIC Polyisocyanurate
psf Pounds per square foot
RH Relative humidity
SFA Steel Framing Alliance
SPF Spray polyurethane foam
XPS Extruded polystyrene

ix
Executive Summary
The addition of insulation to the exterior of buildings is an effective means of increasing the thermal resistance of both wood framed walls as well as mass masonry wall assemblies. For thick layers of exterior insulation (levels > 1.5 in.), the use of wood furring strips attached through the insulation back to the structure has been used by many contractors and designers as a means to provide a convenient cladding attachment location (Straube and Smegal 2009; Pettit 2009; Joyce 2009; Ueno 2010).
The research presented in this report is intended to help develop a better understanding of the system mechanics involved and the potential for environmental exposure induced movement between the furring strip and the framing. Building Science Corporation sought to address the following research questions:
1. What are the relative roles of the mechanisms and the magnitudes of the force that influence the vertical displacement resistance of the system?
2. Can the capacity at a specified deflection be reliably calculated using mechanics based equations?
3. What are the impacts of environmental exposure on the vertical displacement of furring strips attached directly through insulation back to a wood structure?
The system mechanics portion of the research examined some of the discrete load components that help develop the vertical load resistance capacity of furring strips attached directly through insulation back to a wood structure. It was theorized that the capacity of the system is developed from several sources, including the moment resistance of the fasteners (including both bending strength of the fastener and the bearing strength of the furring and framing members), the compressive strength of the rigid insulation, as well as the static friction between the layers.
The system mechanics research provided some useful insights into the magnitude of the various load components, even if many of the exact mechanisms cannot be accurately predicted. The research was designed to focus on three mechanisms for resisting vertical gravity loads: (1) screw bending; (2) friction; and (3) a strut and tie effect. The bending capacities of the screw fasteners were noted to contribute a much lower amount to the system total vertical deflection resistance capacity when compared to the other studied mechanisms. From the results it appears that friction forces in the assembly may be significant, particularly at initial and small vertical deflections. While the presence of friction in the assembly may be significant, there is not enough information yet available to determine how to best account for, and make use of, the friction in the assemblies from a design perspective. The amount of friction due to precompression1 can be quite variable, as measured precompression forces were noted to change dramatically over time and with changing environmental conditions. The strut and tie model was demonstrated to provide additional capacity; however, the results were not clear, as other unanticipated factors appear to affecting the total capacity.
1 Precompression forces are the clamping forces generated in the assembly by attachment of the furring strips with the screw fasteners.

x
It was found that the theorized load components that were modeled do not provide a sufficiently accurate prediction of the measured load components to be used in a reliable design model. There were several factors to this, including sensitivity of the inputs, potential changes to the load resistance model depending on the amount of deflection, variability in the boundary conditions, as well as some additional system effects that are still not understood, identified, or quantified. Further study of the load component mechanisms may help to further refine our understanding and help us develop more accurate models that could be used for assembly design.
The second part of the testing work completed was a study on the impacts of climate exposure on the vertical movement of furring strips attached over exterior insulation. A total of 12 assemblies were constructed (four different insulation types loaded to three different levels, 8 lb/fastener, 15 lb/fastener, 30 lb/fastener) in an outdoor exposed environment. Vertical deflection movements of the furring strip with respect to the framing were measured at various intervals between July 2012 and September 2012.
The results of the long-term exposure tests reinforced much of the industry experience with this approach to cladding attachment over 4 in. of exterior insulation. Lightweight claddings (such as wood, fiber cement, and vinyl siding) represent the majority of the cladding that has been, and is currently being used with this type of attachment system. These claddings coupled with a fastener spacing of 16–24 in. o.c. are representative of low load per fastener assemblies. To date, no known problems have occurred with these systems. The low measured movement and apparent resistance to creep is in line with this experience.
For heavier claddings such as traditional stucco and adhered stone veneers, the per-fastener load would be expected to be higher. Under medium load (15 lb/fastener), assemblies installed over 4 in. of insulation seem to be demonstrating good performance, though more data are recommended to be collected. Under heavy load (30 lb/fastener), there appears to be a potential for long-term creep of the assemblies. More study is needed for these assemblies.
All of the test assemblies had notable movement within a range of deflections. With a daily movements on the order of ± 1/64 in. to ± 1/32 in. being measured for one of the assemblies. In service deflection limits for the assemblies should be set to account for this movement.
1
1 Problem Statement
1.1 Introduction The addition of insulation to the exterior of buildings is an effective means of increasing the thermal resistance of both wood-framed walls as well as mass masonry wall assemblies. The location of the insulation to the exterior of the structure has many direct benefits, including better effective R-value from reduced thermal bridging, better condensation resistance, reduced thermal stress on the structure, as well as other commonly associated improvements such as increased airtightness and improved water management (Hutcheon 1964; Lstiburek 2007).
For thick layers of exterior insulation (levels > 1.5 in.), the use of wood furring strips attached through the insulation back to the structure has been used by many contractors and designers as a means to provide a convenient cladding attachment location (Straube and Smegal 2009; Pettit 2009; Joyce 2009; Ueno 2010).
While the approach has been demonstrated to be effective, there is significant resistance to its widespread implementation due to a lack of research and understanding of the mechanisms involved in the development of the vertical displacement resistance capacity. In addition, the long term in service performance of the system has been questioned due to potential creep effects of the assembly under the sustained dead load of the cladding and the effects of varying environmental conditions.
1.2 Background The residential building sector consumes approximately 21% of the primary energy used in the United States (DOE/EIA 2008). While new code standards are pushing for more energy-efficient buildings, there are a significant amount of existing buildings that are in great need of energy retrofits. In the past, retrofits of existing residential buildings typically involved the filling of framed cavity walls with insulation; however, the amount of effective thermal resistance that could be added was limited by the existing stud cavity depth (wood-framed walls) or strapping depth (common for mass masonry walls), the insulation material used (commonly fiberglass/ mineral fiber or cellulose), and the amount of thermal bridging present from the wood framing.
The addition of insulation to the exterior of existing buildings has been demonstrated to be an effective means to overcome these limitations and provide higher effective R-values for building wall assemblies. The benefits of this approach extend beyond just added thermal resistance; benefits of increased building durability and airtightness are often also realized.
The use of exterior insulation has been common practice for many decades on buildings, particularly behind brick or masonry veneer claddings. Exterior insulation and finish systems use exterior insulation as a composite cladding assembly, providing the support structure for a lightweight finish coat.
Building Science Corporation (BSC) has been at the forefront of using exterior insulation approaches on residential buildings for several decades. The use of furring strips as the primary cladding attachment location is a strategy that has been used on many private as well as Building America supported projects (Pettit 2009; Ueno 2010).
2
The push for lower energy buildings has resulted in an increase of projects that are looking to use thick layers (> 1.5 inches) of exterior insulation on their buildings. This increase resulted in an increase in questions regarding the effectiveness of using furring strips attached through the insulation back to the structure.
In reaction to this, research into the performance of these systems has been funded by several groups such as the Foam Sheathing Coalition (FSC), the New York State Energy Research and Development Authority (NYSERDA), and the Steel Framing Alliance (SFA). The focus of this past research by FSC and NYSERDA/SFA was to try to develop prescriptive code tables for attaching cladding to framing over continuous insulation (Bowles 2010). The tables that were developed used an initial deflection limit of 0.015 in. as a basis for design. By limiting the initial deflection to 0.015 in., the intent was to keep long-term deflection due to potential creep of the system within acceptable limits, though these acceptable limits were not defined.
Research conducted by BSC was aimed at expanding on this previous research to include several types of insulation as well as to examine both short-term (initial loading) and long-term (sustained loading) performance of the system (Baker 2013).
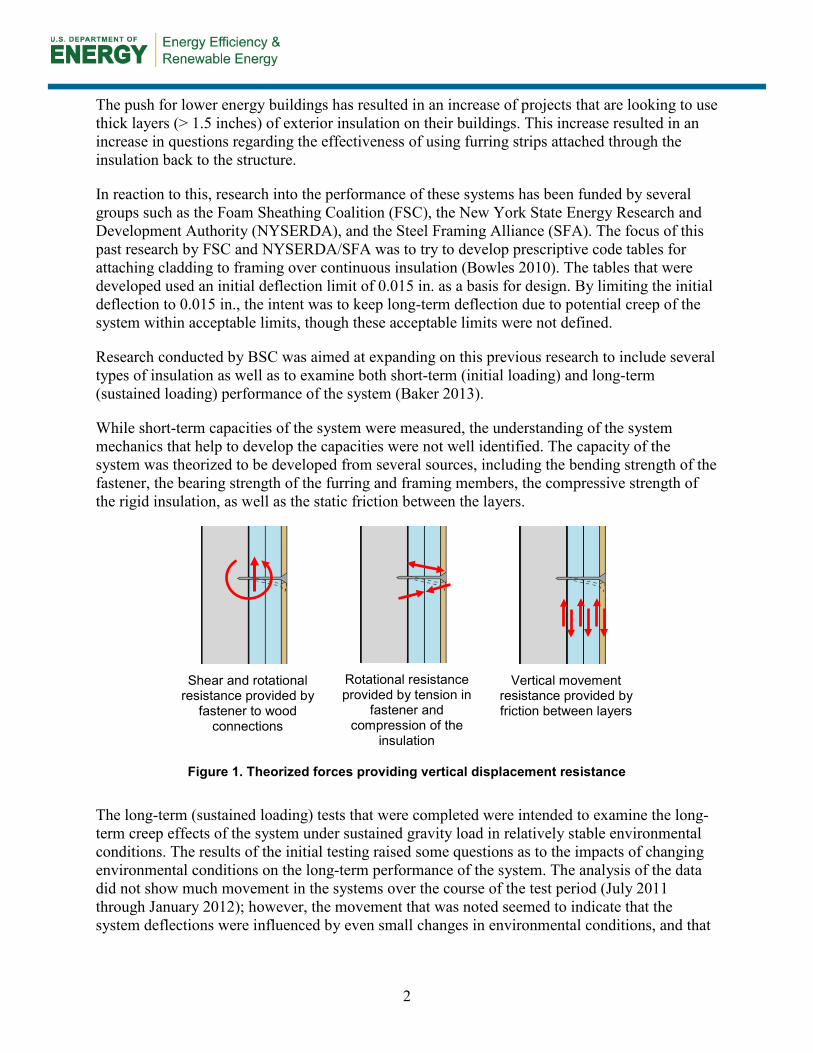
While short-term capacities of the system were measured, the understanding of the system mechanics that help to develop the capacities were not well identified. The capacity of the system was theorized to be developed from several sources, including the bending strength of the fastener, the bearing strength of the furring and framing members, the compressive strength of the rigid insulation, as well as the static friction between the layers.
Shear and rotational
resistance provided by fastener to wood
connections
Rotational resistance provided by tension in
fastener and compression of the
insulation
Vertical movement
resistance provided by friction between layers
Figure 1. Theorized forces providing vertical displacement resistance
The long-term (sustained loading) tests that were completed were intended to examine the long-term creep effects of the system under sustained gravity load in relatively stable environmental conditions. The results of the initial testing raised some questions as to the impacts of changing environmental conditions on the long-term performance of the system. The analysis of the data did not show much movement in the systems over the course of the test period (July 2011 through January 2012); however, the movement that was noted seemed to indicate that the system deflections were influenced by even small changes in environmental conditions, and that
3
these changes may have greater impacts on the vertical movement of the furring strips than the effects of sustained gravity dead loads imposed by the cladding.
The research presented in this report is intended to help develop a better understanding of the system mechanics involved and the potential for environmental exposure to induce movement in the system. BSC sought to address the following research questions:
1. What are the relative roles of the mechanisms and the magnitudes of the force that influence the vertical displacement resistance of the system?
2. Can the capacity at a specified deflection be reliably calculated using mechanics based equations?
3. What are the impacts of environmental exposure on the vertical displacement of furring strips attached directly through insulation back to a wood structure?
1.3 Relevance to Building America’s Goals The use of exterior insulation on wall assemblies is an effective means to provide additional thermal resistance to enclosure assemblies. The technique is particularly well suited to retrofit projects that might otherwise be limited (in terms of space conditioning energy use reductions) due to existing construction dimensional constraints. This fits directly into the Building America goals of substantial reductions in energy consumption. While the energy benefits are apparent and easy to understand, the practical implementation has run into barriers that have slowed widespread adoption.
The results of the research is intended to provide specific guidance for cladding attachment over thicker layers of exterior insulation and evaluate the potential of developing mechanics based equations as a means of evaluation and design of the system capacities. It will also provide some preliminary data on field performance of the systems. The applicability of this research will extend to all climate zones and housing types.
1.4 Cost Effectiveness In most circumstances, the exterior retrofit of a home with exterior insulation comes as part of a larger scope of work for a building retrofit. The choice to add exterior insulation is usually triggered by a need (or desire) to reclad or overclad the building. The driving force behind installing new cladding can be from any number of sources, including existing water management problems, comfort or durability concerns, end of service life for the cladding, or aesthetic concerns. The need to replace the cladding provides an opportunity for the designer or contractor to include exterior insulation as a means to increase the energy performance of the building at the same time. The cost effectiveness of this from an energy perspective is therefore dependent on the cost of the insulation as well any associated components above and beyond new cladding installation.
A preliminary evaluation was completed looking at the incremental cost of the varying thicknesses of insulation installed to the exterior of the wall assemblies. This preliminary cost analysis used foil-faced polyisocyanurate (PIC) as the baseline exterior insulation. Cost data for the exterior insulation was taken from RS Means Construction Data (Reed Construction Data 2011). Costs included in the analysis were the installed cost of the insulation material, 1 × 3

4
wood furring strips spaced at 16 in. o.c., and wood screws spaced at 24 in. o.c. vertically for the attachment of the furring back to the structure. A cost markup of $100/window in the reference model was used as an estimate of the additional cost for trim extensions that would be needed to account for the additional thickness of foam added to the exterior of the home. This value is an estimate, as actual costs can be highly variable due to the many different design choices available for window placement, exterior window trim design, and attachment.
Other items such as house wrap or sheathing tape, self-adhered membrane flashings, metal flashings, siding, and siding fasteners were omitted from the analysis, as these items are associated with recladding and water management, and would be part of the retrofit project regardless of the addition of exterior insulation.
Simulations were run using BEopt simulation software developed by the National Renewable Energy Laboratory. An example home was used as the baseline to help demonstrate the benefits of using exterior insulation as part of a house energy retrofit. This benchmark home was assumed to be around 1950s era two-story slab-on-grade construction and had the following basic characteristics (Table 1).
Table 1. Benchmark House Characteristics
House Characteristics Square Footage Finished Floor Area 2312
Ceiling Area 1156 Slab Area 1156 Wall Area 2799
Window Area 410 (17.7% glazing ratio) The wall conductance performance was isolated from all other aspects of the home, to examine the effectiveness of this single strategy. Given the assumed age of the home, the benchmark home had an uninsulated wall cavity (as per guidance from the 2011 Building America Benchmark Protocol). The following parametrics were run to see the effectiveness of the added thermal resistance to the energy performance and utility cost (Table 2). The analysis assumed that the cost of the measure is financed over a 5-year period at a 7% interest rate. An additional fuel escalation rate of 2% was also included in the analysis.
Table 2. Parametric Steps and Cost
Parametric Step Cost/ft2 Benchmark (Uninsulated 2 × 4 Wall) N/A
R-13 Cavity Fill Insulation $2.20 R-13 Cavity Fill + 1 in. Exterior Insulation (R-6.5) $3.55
R-13 Cavity Fill + 1.5 in. Exterior Insulation (R- 9.75) $3.76 R-13 Cavity Fill + 2 In. Exterior Insulation (R-13) +
1 × 4 Wood Furring $5.73
R-13 Cavity Fill + 2 Layers of 1.5-in. Exterior Insulation (R-19.5) + 1 × 4 Wood Furring
$7.19
R-13 Cavity Fill + 2 Layers of 2-In. Exterior Insulation (R-26) + 1 × 4 Wood Furring
$7.58

5
Simulations were run for the following cities (Table 3):
Table 3. Reference Cities
City Climate Zone Dallas, Texas 3A
Kansas City, Missouri 4A Boston, Massachusetts 5A
Duluth, Minnesota 7A Results indicated that for cold climate zones (4 and higher), insulation up to 1.5 in. was shown to be a cost-optimized solution. This was mainly due to this being the tipping point before which additional costs associated with the furring strips and additional screw fasteners required for cladding attachment needed to be added to the system. Insulation thickness above 2 in. was still demonstrated to be cost neutral as part of this simplified analysis in all cities except for Dallas.
While the analysis run focused on conductance improvements only, there is some argument to be made that the addition of exterior insulation would likely also improve the overall airtightness of the assemblies as well (Ueno 2010). The benefits from increased airtightness are known to be very important in cold climate construction; however, it is also more difficult to isolate and apportion to individual measures.
1.5 Tradeoffs and Other Benefits Using exterior insulation has many additional benefits other than simply increased thermal resistance. The single largest benefit is the increased condensation resistance that this strategy provides for cold climate buildings. The placement of the insulation to the exterior of the building acts to keep all of the structural elements at a much more even temperature throughout the year, reducing the risk of interstitial condensation. For wood structures, this can significantly reduce the potential for wood decay; an added benefit is that the seasonal thermal and moisture variations of the wood frame are greatly reduced. In masonry buildings, the potential for freeze-thaw is practically eliminated, since this approach not only keeps the masonry warmer, but also addresses the exterior rainwater absorption into the masonry (which is the leading moisture source related to freeze-thaw damage to buildings).
In addition to keeping the structure warm and preventing condensation, the use of the furring strips creates a significant upgrade in water management. The increase in drainage and drying that is provided by the ¾-in. gap created by the furring strips provides so much additional protection against water infiltration problems (Lstiburek 2009) that the use of a drainage gap is a base recommendation for most cladding installations regardless of whether or not exterior insulation is used. The fact that the furring strips are an intrinsic component of this system provides a significant added benefit to the long-term durability of these wall assemblies.

6
2 Previous Research
Several groups such as the FSC, NYSERDA, and SFA have funded research into the vertical load capacity of furring strips, installed over exterior insulation, that are fastened back to a wood or steel structure. The primary goal of this past research by FSC and NYSERDA/SFA was to develop prescriptive code tables for attaching cladding to framing over continuous insulation (Bowles 2010). The research methodology adopted used wood joint connection theory as the basis for the analysis, in particular the European Yield Theory that examined the performance of gapped wood to wood connections.
The European Yield Theory (first conceived in the 1940s) is based on an equilibrium of forces caused by rotation of fasteners in wood members; this theory predicts performance of the connection at the point where yielding of materials (wood or fastener) has developed. The equations as set out in the American Forest and Paper Association (AFPA) Technical Report 12 General Dowel Equations for Calculating Lateral Connection Values predict performance of a multitude of failure modes, with the governing mode being the one with the lowest yield capacity. A visual representation of the potential failure modes (AFPA 1999) is included in Table 4.
Table 4. Yield Modes From AFPA TR-12
Yield Mode Description Graphic
Im Main member bearing failure
Is Side member bearing
II Side and main member bearing

7
Yield Mode Description Graphic
IIIm Main member bearing and dowel yielding in the side member
IIIs Side member bearing and dowel yielding in the main member
IV Dowel yielding in the side and main member
Research conducted by the U.S. Department of Agriculture Forest Products Laboratory (FPL) verified the yield equations with empirical data for gaps up to 1 in. (Aune and Patton-Mallory 1986a, 1986b). For small gaps (0.009–0.04 in.) an air gap was used or a slip sheet such as polyethylene was placed between the two wood members to remove friction and other forces from the assembly. For larger gaps (½ in. and 1 in.), the void was filled with expanded polystyrene (EPS) insulation. Effects of friction and compression resistance of the insulation were captured with the tests that included the insulation. These tests that were conducted with EPS insulation, gave way to the idea of possibly adopting the yield equations for the application of wood furring strips over exterior insulation.
The NYSERDA research was focused on the specific application exterior insulation for above-grade wall construction. To accomplish this, a representative matrix of construction strategies that could be used to install cladding over exterior insulation (either from direct attachment or through the use of furring strips attached back through insulation to the structure), was tested with the intent of calibrating the measured results of the testing to the predicted results of the yield equations.

8
The testing was conducted following ASTM D1761 - 06 Standard Test Methods for Mechanical Fasteners in Wood (Figure 2) and examined:
• Main member (studs/substrate) o 2 x studs (spray polyurethane
foam [SPF] worst case density) o 33 mil (20 g) and 54 mil (16 g)
studs o 7/16 in. and ¾ in. oriented
strand board (OSB)
• Side member (furring/cladding) o ¾ in. and ⅜ in. pine o 33 mil (20 g) steel hat channel
• Fasteners o Nails o Wood screws o Lag screws o Self-drilling/tapping screws
(steel connections).
Figure 2. Typical ASTM D1761 test setup
For wood frame test specimens, the measured data were compared to the predicted performance of the yield equations as determined by the TR-12 (and calculated based on actual properties of the materials used in the testing). This research concluded that the 5% offset yield prediction as calculated using the TR-12 formulas, resulted in a reasonably accurate prediction of the shear load at a deflection of 0.015 in. While there was no mathematical connection between these values, the research team considered this to be an adequate basis for designing for a 0.015-in. deflection limit given the scope of the research. In addition, a divisor of 1.5 was applied to the calculated results to address potential concerns of assembly creep under sustained loads. The methodology was used to develop prescriptive code tables for attaching furring strips to framing over continuous insulation (Bowles 2010).
In 2011, research conducted by BSC under the Building America Program examined both short-term loading as well as long-term loading of wall assemblies using furring strips fastened back through the insulation as the primary cladding support structure (Baker 2013). The research was aimed at answering three key questions:
1. Is there a difference in performance given varying exterior insulation types?
2. How does the performance compare for large thicknesses of insulation (4 in. and 8 in.)?
3. What are the impacts of sustained loading (creep) under relatively stable environmental conditions?

9
The test plan differed in several ways from previous work conducted in that it used full scale wall assemblies in lieu of small scale samples. The decision to conduct the test on full scale samples was to reduce the impacts of installation variability in construction and capture the system effects of the assembly. The test plan also expanded upon previous testing (which had typically been limited to EPS insulation only) to include multiple insulation types:
• EPS
• Extruded polystyrene (XPS)
• Foil-faced PIC
• Rigid mineral fiber (MF).
The test plan was separated into two distinct sections: a “short-term” or initial loading section, and a “long-term” or sustained loading section.
The short-term load testing was conducted on 4 × 8 wall panels with two 1 × 3 wood furring strips spaced 24 in. o.c. (Figure 4). The furring strips were attached with #10 wood screws spaced 16 in. o.c. vertically (14 total). Tests were conducted at both 4-in. thickness of insulation as well as at 8-in. thickness. The testing was conducted by applying a specific load to the furring strips via a hydraulic ram connected to a metal angle that spanned between the bottoms of the two furring strips. The corresponding vertical deflection measurements were recorded at each furring strip for each load increment. The measurements were taken between the stud framing and the furring so that just the deflection of the furring with respect to the framing was captured. The resulting load deflection plots can be seen in Figure 5 and Figure 6.
Figure 3. Short-term gravity load response test setup

10
Figure 4. Short-term load versus deflection for assemblies with 4 in. of exterior insulation
(Baker 2013)
Figure 5. Short-term load versus deflection for assemblies with 8 in. of exterior insulation
(Baker 2013)
1/64" 1/32" 1/16" 1/8"
0
5
10
15
20
25
30
35
40
45
50
55
60
65
70
75
0 0.015 0.03 0.045 0.06 0.075 0.09 0.105 0.12 0.135 0.15 0.165 0.18 0.195 0.21 0.225 0.24
Load vs. Vertical Displacement of Furring Strip over 4" of Insulation
4" MF 4" EPS 4" PIC 4" XPS
deflection (in)
Load
(lbs
per f
aste
ner)
MFPIC
EPS XPS
1/64" 1/32" 1/16" 1/8"
0
5
10
15
20
25
30
35
40
45
50
55
60
65
70
75
0 0.015 0.03 0.045 0.06 0.075 0.09 0.105 0.12 0.135 0.15 0.165 0.18 0.195 0.21 0.225 0.24
Load vs. Vertical Displacement of Furring Strip over 8" of Insulation
8" MF 8" EPS 8" PIC 8" XPS
deflection (in)
Load
(lbs
per f
aste
ner) EPS
XPSMF
PIC
11
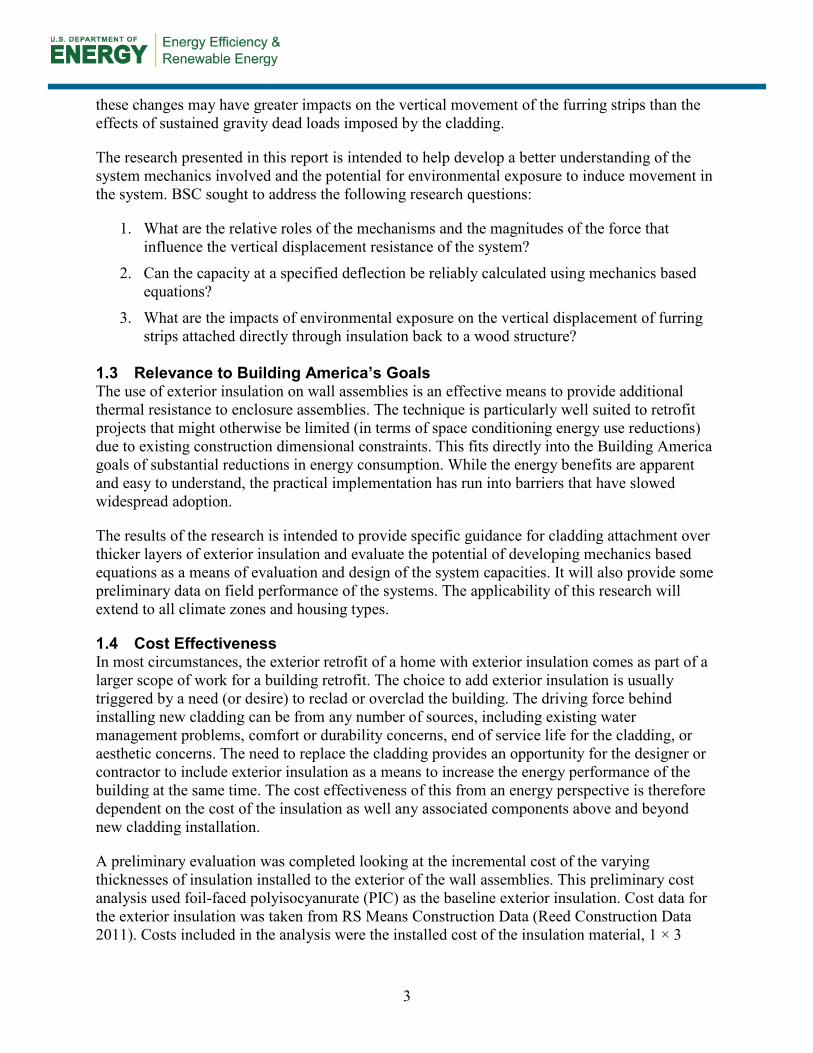
The long-term vertical deflection testing was conducted on 2 × 8 wall panels with a single 1 × 3 wood furring (Figure 7). The furring strip was attached with #10 wood screws spaced 16 in. o.c. vertically (7 total). Tests were conducted at 4-in. thickness of insulation only. The test panels were loaded to a total load of 210 lb using dead weights hung from the bottom of the furring strip. This load level provides the following equivalent loads:
• 13 psf (if furring is spaced at 24 in. o.c.)
• 20 psf (if furring is spaced at 16 in. o.c.)
• 30 lb/fastener. A fifth test panel was constructed using XPS as the insulation material installed to a 4-in. thickness. The intent was to examine the relative impact of a reduced load magnitude. This reference panel was loaded to a total load of 60 lb. This load level provides the following equivalent loads:
Figure 6. Long-term gravity load response test setup
• 3.75 psf (if furring is spaced at 24 in. o.c.)
• 5 psf (if furring is spaced at 16 in. o.c.)
• 8.6 lb/fastener. The measured deflections were plotted as a function of time (Figure 8), with a positive deflection on the graph indicating a downward movement of the furring strip.
The results of the testing indicated that for low per fastener loads (< 10 lb) very little movement both under initial loading and long-term loading was observed (~1/200 in.). This would be representative of lightweight claddings (< 5 psf) installed on a fastener spacing up to 24 in. o.c. vertically and horizontally, or medium-weight claddings (claddings around 10 psf) installed on a more dense fastener spacing of 12 in. o.c. both horizontally and vertically.
For higher per-fastener loads (30 lb), initial deflection was observed to be < 1/32 in. of assemblies with 4 in. of exterior insulation and 1/16 in. for assemblies with 8 in. of exterior insulation. Long-term loading at this magnitude also demonstrated very stable performance in the laboratory environment. Most assemblies did not record a deflection > 1/32 in., with the exception of the PIC sample which had a deflection of approximately 3/32 in. It should be noted that the PIC sample was bumped on a few occasions during the test due to the proximity of other test equipment near the long-term test setup. Two jumps in the data were correlated back to the noted disturbances. Given the very small deflections recorded and the sensitivity of the

12
measurement equipment used, the data gathered for the PIC setup may not be providing as clear an indication of the performance of the PIC product.
Figure 7. Long-term load versus deflection for assemblies with 4 in. of exterior insulation
(Baker 2013) In the early stages of the testing (the first 3 weeks after the initial loading), very minor additional downward vertical movement was seen. The temperature and relative humidity (RH), however, were maintained at a more stable range. In all cases a very slight trend for additional deflection can be seen. The magnitude, though, was on the order of 1/400 in., and it might not result from creep effects from sustained loading. More substantial movement seemed to occur shortly after the first 3 weeks, when the temperature in the laboratory increased slightly (by approximately 5°F) and the RH dropped (from approximately 55% RH to 40% RH). Movements on the order of 1/100 in. were observed.
Looking at the complete dataset, a slight trend in the movement appeared to result from fluctuations in the temperature and RH. The temperature in the laboratory space fluctuated between 60°F and 75°F and the RH fluctuated between 60% and 30% over the course of the testing. Deflection movement in the test setups seems to track to these environmental changes. A drop in the RH results in a general trend of an increase in the vertical downward deflection of the furring strips. It was interesting to note that the converse is true as well. An increase in the RH seems to correspond to an upward vertical movement of the furring strips. This was true for all insulations except for EPS. The movement of the EPS test panel demonstrated a reverse trend, where a drop in the RH resulted in an upward vertical movement of the furring strips.
1/64"
1/32"
1/16"
1/8"
0
10
20
30
40
50
60
70
80
90
-0.03
0.00
0.03
0.06
0.09
0.12
0.15
Jul/11 Aug/11 Sep/11 Oct/11 Nov/11 Dec/11 Jan/12
Tem
pera
ture
(F) a
nd R
elat
ive
Hum
idity
(%)
Defle
ctio
n (in
)
Time
Vertical deflection movment of a wood furring strip (loaded to 30lbs/fastener) over time
XPS (8.6 lbs/fastener) XPS (30 lbs/fastener) EPS (30 lbs/fastener) PIC (30lbs/fastener)
MF (30 lbs/fastener) Temperature (F) RH (%)
Jump in deflection readings coincided with construction activities near the PIC test set up
PIC
MFXPS
XPS (8.6 lbs/fastener)EPS

13
The test conducted at 5 psf on the XPS sample demonstrated very stable performance with almost no movement seen in the sample, even with changing temperature and RH.
From the test data, it was difficult to differentiate movements of the samples that result from prolonged loading (creep) or from environmental changes. Both positive as well as negative movements were noted. The movements from environmental changes were most likely caused by material expansion and contraction from moisture adsorption or thermal changes. Given the limited testing, the magnitude of this effect cannot be predicted at this point. In addition, material property changes may affect performance over the range of actual in-service temperatures. This was not accounted for in the testing. Additional testing of exterior samples exposed to a variety of temperature and humidity conditions is recommended.

14
3 Analysis and Test Method
There are notable gaps in the general understanding of how the vertical load resistance is actually developed in the assembly. System mechanics (such as fastener bending/bearing, insulation compression, and friction forces between layers) were theorized as impacting the system capacity, but had not been measured or quantified. It was felt that understanding the factors that affect the development of system capacity was going to be important in order to examine means to engineer the attachment system. In addition, the potential for creep of the system was still not well understood or quantified. Several conceivable sources of creep in the system could be identified, such as expansion and contraction of wood, expansion and contraction of insulation, relaxation of wood fibers, and plastic deformation of insulation. From the observed sensitivity of the assemblies to slight environmental changes experienced in relatively stable environments, and since many of the conceivable sources are affected by temperature and RH, it was felt that the performance of these systems needed to be examined in exposed environments.
The research plan intended to help develop a better understanding of the mechanics involved and the potential for environmental exposure to induce unpredicted movement in the system. The testing was conducted using the following materials in order to limit variables in the research (Table 5 and Table 6).
Table 5. Materials Used in the Laboratory and Field Testing
Component Material Framing 2 × 4 SPF standard wood framing
Sheathing 7/16 in. OSB Building Wrap Dupont Tyvek Building Wrap
Insulation 4 in. thick rigid insulating sheathing (2 layers of 2 in. various types listed below)
Furring Strips Nominal 1 × 3 SPF utility-grade lumber Screws 6-in. long standard #10 pan head wood screws
Table 6. Insulation Materials
Insulation Type Product Brand Type II EPS Plastispan Plastifab Type IV XPS C-200 Owens Corning
Foil Faced PIC Thermax CI DOW Chemical Rigid MF RB80 Roxul
3.1 System Mechanics The system mechanics portion of the research examined some of the discrete load components that help develop the vertical load resistance capacity of furring strips attached directly through insulation back to a wood structure. The intent was to gain a better understanding of the system

15
mechanisms to help guide the development of design tools or recommendations for the attachment of the furring strips.
It was theorized that the capacity of the system is developed from several sources, including the moment resistance of the fasteners (including both bending strength of the fastener and the bearing strength of the furring and framing members), the compressive strength of the rigid insulation, as well as static friction between layers (a simple diagram of these mechanisms is presented in Figure 9).
Shear and rotational
resistance provided by fastener to wood
connections
Rotational resistance provided by tension in
fastener and compression of the
insulation
Vertical movement
resistance provided by friction between layers
Figure 8. Forces providing vertical displacement resistance
3.1.1 Numerical Analysis A series of mechanics-based equations were proposed to be evaluated as a starting point to examine the potential of developing a predictive model for the measured capacity of the assemblies at specific deflection magnitudes. This is a departure from past research and general wood connection design that looked to a strength limit state design where capacity, not movement, was considered.

16
3.1.1.1 Moment Resistance of Fasteners
The vertical displacement resistance due to the bending of the fasteners was theorized to function similarly to either a simple cantilevered beam or a beam that is fixed at one end and free and guided on the other end. The magnitude of the vertical load component at a given deflection would therefore be determined based on the following equations:
1. Cantilevered beam
P =∆3𝐸𝐼
x3
2. Beam that is fixed at one end and guided at the other
P =∆12𝐸𝐼
x3
Where:
P = applied vertical load ∆ = vertical displacement x = distance between structure and
furring E = modulus of elasticity of the screw I = area moment of inertia
Figure 9. Free body diagram of bending resistance of a fastener

17
3.1.1.2 Strut and Tie Model (No Friction)
The vertical displacement resistance due to the compression strut developed by the furring bearing on the insulation is theorized to be based on the compression modulus of the insulation. The magnitude of the vertical load component at a given deflection would therefore be determined using the following equation:
𝑃 = 𝐹𝑡 sinθ = Fc tanθ
Where: P = applied vertical load Ft = tension force in the fastener Fc = compression force in the
insulation And the compression force in the insulation determined using the following equation:
𝐹𝑐 = δKinsulAt Where: δ = deflection normal to the insulation Kinsul = elastic range compression modulus
of the insulation At = tributary area of the compression
strut component
Figure 10. Free body diagram of compression resistance of insulation

18
3.1.1.3 Static Friction Model The vertical static friction capacity is theorized to be based on the friction resistance of the various layers due to a normal compressive force applied to the system from precompression (clamping force of the furring during attachment) and postcompression (compression strut developed by the rotation of the fastener). The magnitude of the vertical load component for the static friction could therefore be determined using the following equation:
𝑃 = 𝑓𝑟 = 𝜇(𝐹𝑐 + 𝐹𝑝)
where:
fr = friction resistance between the materials
µ = coefficient of friction (COF) 𝐹𝑐 = normal force to the materials due
to the compression strut 𝐹𝑝 = normal force to the materials due
to precompression forces
Figure 11. Free body diagram of the friction resistance between material layers
These equations were used to develop an analysis spreadsheet to compare predicted performance to measured performance.
3.1.2 Material Property Testing Certain key material properties were measured as part of the testing. The values were used as inputs for the mechanics based analysis spreadsheet. The following material properties were measured:
1. Screw bending yield strength
2. Elastic compression modulus of insulation
3. Static COFs. 3.1.2.1 Screw Bending Yield Strength The screw bending strengths were determined following ASTM F1575 - 03(2008) Standard Test Method for Determining Bending Yield Moment of Nails (ASTM 2008). A sample of five fasteners, used for the testing, was taken from the quantity used in the rest of the laboratory and field testing. The fastener dimensions were measured and recorded prior to testing (Figure 13). The results are displayed in Table 7 and Table 8 below.

19
Figure 12. Measurement locations for fastener dimensions
Table 7. Average Fastener Dimensions
Five Specimen Average (in.)
Root Diameter
Thread Diameter Length Shank
Diameter Head
Diameter 0.1315 0.193 6 0.1455 0.3505
Table 8. Screw Bending Yield Moment
Specimen No.
Yield Load P (lbf)
Yield Strength F (psi)
1 210 207,838 2 201 198,930 3 223 220,705 4 207 204,869 5 201 198,931
Average 208.4 206,255 3.1.2.2 Elastic Compression Modulus of Insulation The elastic range compressive modulus of the insulation materials was determined following the guidelines set out by ASTM D1621 - 10 Standard Test Method for Compressive Properties of Rigid Cellular Plastics (ASTM 2010). The testing was conducted on 6 × 6-in. samples of 2-in. thick insulation products. Two sets of tests were completed (Table 9); the first following the standard test protocol that loads the entire surface of the insulation evenly (Test A), and a second modified protocol that point loaded a 6-in. long section of 1 × 3 furring installed on top of the insulation sample (Test B). The intent of Test B set was to better approximate the performance of the insulation in the specific application being researched and to see if there was a discernible edge effect (load spreading) resulting from the insulation being loaded under the wood furring strip.

20
Table 9. Elastic Range Modulus of Compression of Insulation Products
Material Elastic Range Modulus
(psi) Test A Test B
EPS 250 269 XPS 353 368 MF 16 28 PIC 429 350
Figure 13. Example of insulation compression Test B
3.1.2.3 Coefficients of Static Friction The static COFs for each insulation material to building wrap interfaces were determined following the guidelines set out in ASTM D1894 - 11e1 Standard Test Method for Static and Kinetic Coefficients of Friction of Plastic Film and Sheeting (ASTM 2011) (Table 10). A minimum of four tests were completed for each interface. The testing was conducted using a 5-lb normal force being applied to a material sled pulled along the surface interface. The peak load was measured during each test to capture the static COFs.

21
Table 10. Static Friction Test Results
Static COF EPS 0.27 XPS 0.23 MF 0.45 PIC 0.26
Figure 14. Example of a static COF test
3.1.3 Boundary Condition Testing The installation of the wood furring strips to the wood structure results in a compression force being applied to the insulation prior to any vertical load being applied to the furring strips. This precompression force has an impact on the friction resistance of the assembly. From past testing using standard pan head wood screws, it was noted that the limiting factor in precompression forces developed in the system was a bearing failure of the wood furring at the wood screw head (overdriving the wood screws). Using this as a baseline, tests were conducted that measure the clamping force of a furring strip to wood structure attachment. A 500-lb load cell was placed between a wood furring strip and a 2 × 4 wood stud. A standard drill set to a #13 ratchet setting was used to drive the screw through the furring strip into the 2 × 4 stud. The screw was first driven so that the screw head was flush with the top edge of the furring strip and the load was recorded. The screw was then driven so that it was overdriven approximately ¼ in. into the furring, and the load was recorded a second time. This test was repeated seven times with the results listed in Table 11 below.
Figure 15. Precompression force test setup

22
Table 11. Furring Strip Precompression Forces
Surface (lb)
¼-in. Depth (lb)
1 139.9 168.3 2 150.1 207.1 3 163.4 196.8 4 132.6 132.6 5 158 202.7 6 191.8 237.5 7 114.3 114.3
Average 150.0 179.9 Std Dev 24.7 43.9
CV 16% 24% Another test was conducted that examined the potential for relaxation of the precompression forces over time. For this test, EPS insulation as well as OSB was added to the assembly. During the test the time, load, temperature, and RH were recorded. During the first day the sample was held at relatively stable environmental conditions. After the first day, the setup was moved to a climate chamber with different environmental conditions. The results of the test can be seen in Figure 17.
Figure 16. Relaxation of screw fastener precompression forces over a 2-day time period
0
10
20
30
40
50
60
70
80
90
100
0
25
50
75
100
125
150
0.0 0.5 1.0 1.5 2.0
Tem
pera
ture
(F)/
Rela
tive
Hum
idity
(%)
Load
(lbs
)
Time (days)
Change of pre-compression forces over time
Load Temp, °F RH, %

23
Looking at the data, an initial load reduction down to approximately 60% of the original precompression force was noted within a few hours. At that point, the forces seem to stabilize. Changing the environmental conditions had a significant impact on the force as well, with a further reduction down to approximately 35% of the original precompression force. 3.1.4 Discrete Load Component Testing The second phase to the system mechanics research looked to isolate the theorized load components by testing small scale wall test assemblies. The testing was completed on a small scale wall samples that measured 32 in. in length. Each sample was constructed as a variation on the following design:
• 32-in. long 2 × 4 wood stud
• 7/16-in. OSB
• Spun-bonded polyolefin building wrap
• 4 in. of exterior insulation (2 layers of 2 in.)
• 1 × 3-ft wood furring strip attached with three 6-in. long #10 wood screws spaced at 8 in. from each end and 8 in. o.c.
A specialized testing apparatus (Figure 18) was designed and constructed. This testing apparatus was designed to impose a deflection to the furring strip. The design of the system was such that the small-scale wall assembly would be assembled in a horizontal position. This was done primarily to allow the friction resistance of the assemblies to be tested (see below). A linear voltage distance transducer (LVDT) and an s-beam load cell were utilized to measure the applied deflection of the furring strip as well as the generated load.
Figure 17. Example of a friction only system test
24
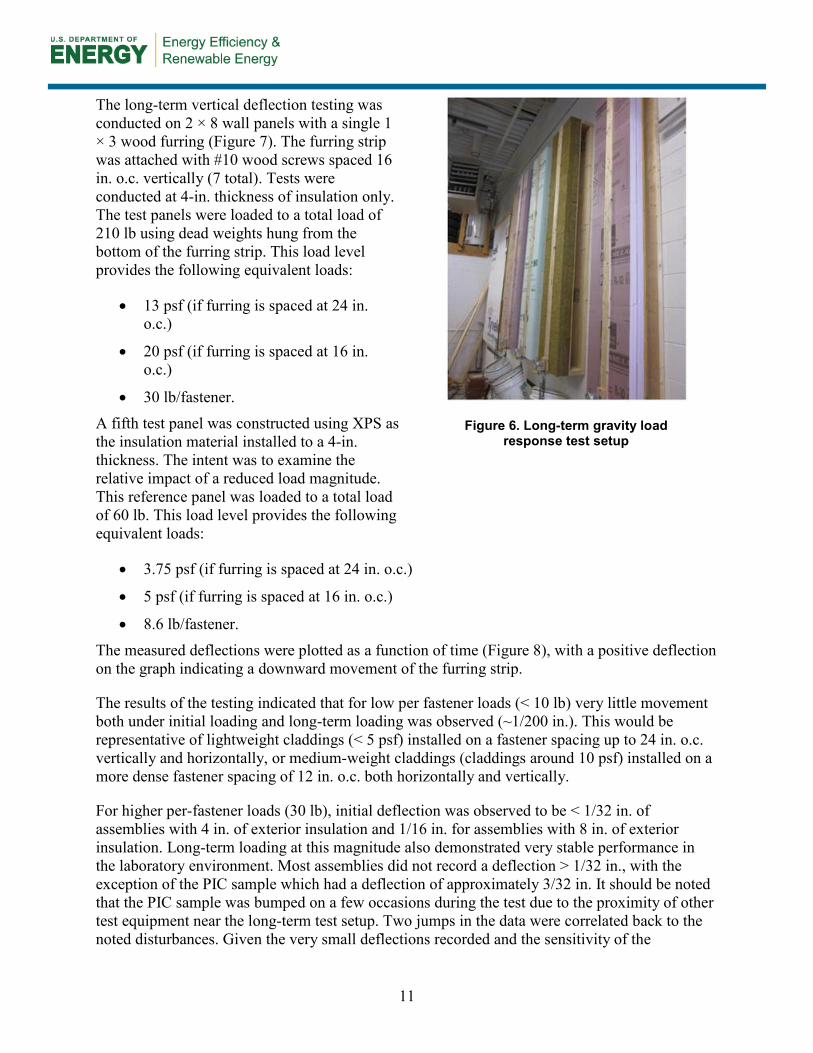
The sensors were connected to a data acquisition system that took simultaneous measurements of both the imposed deflection and the generated load every 0.5 s and recorded it in a data table. A screenshot of the sample output is provided in Figure 19.
Figure 18. Screenshot of data acquisition system output
3.1.4.1 Moment Resistance of Fasteners Model The first in the series of tests that were conducted was done to isolate the bending resistance forces of the screw fasteners. For these tests, the insulation was omitted from the assembly and the assembly was constructed with a 4-in. air gap between the furring strips and the building wrap. Three screw fasteners spaced 8 in. from each end and 8 in. o.c. were used to attach the furring strip to the stud framing. These screws also supported the furring to create the gap between the furring strip and the building wrap. No additional materials were used to maintain the space.
3.1.4.2 Strut and Tie Model (No Friction) The second in the series of tests that were conducted was done to try to isolate the strut and tie component of the assembly. This variation of the wall assembly was constructed with a layer of polyethylene between the insulation and the building wrap. It was understood that screw bending resistance would not be eliminated; however, given that screw tension was key to the development of the capacity and was part of the strut and tie assembly, no alternate test approach was thought to be reasonable. To compensate for this, the intent was to look to the results of moment resistance of fasteners testing and possibly back out the screw bending capacity from the strut and tie model.
3.1.4.3 Static Friction Model The third in the series of tests that were conducted was done to isolate the friction resistance forces in the assembly. This variation of the wall assembly was constructed without any fasteners. Instead, weights were added to the top of the furring strip to impose a normal force on the assembly that would be similar to precompression forces generated by the clamping action of
25
the screws in the assembly. With no screws in the assembly, mechanisms that would be associated with screw bending or strut and tie resistance is effectively eliminated.
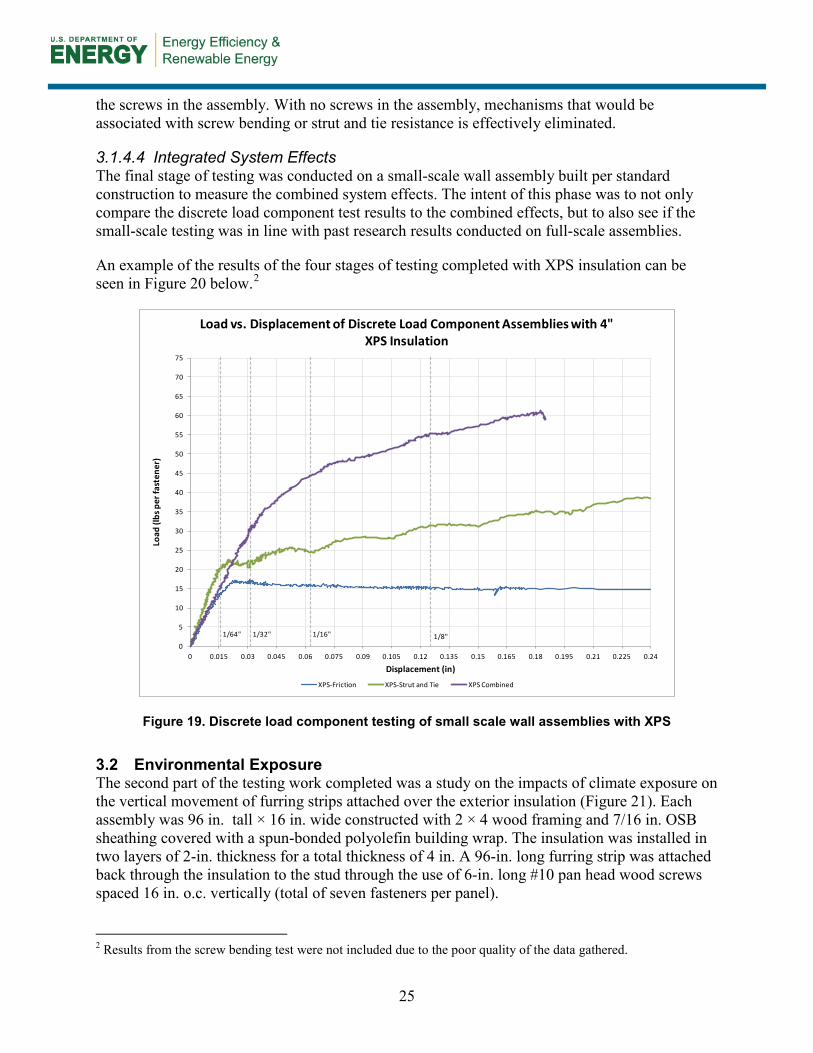
3.1.4.4 Integrated System Effects The final stage of testing was conducted on a small-scale wall assembly built per standard construction to measure the combined system effects. The intent of this phase was to not only compare the discrete load component test results to the combined effects, but to also see if the small-scale testing was in line with past research results conducted on full-scale assemblies.
An example of the results of the four stages of testing completed with XPS insulation can be seen in Figure 20 below.2
Figure 19. Discrete load component testing of small scale wall assemblies with XPS
3.2 Environmental Exposure The second part of the testing work completed was a study on the impacts of climate exposure on the vertical movement of furring strips attached over the exterior insulation (Figure 21). Each assembly was 96 in. tall × 16 in. wide constructed with 2 × 4 wood framing and 7/16 in. OSB sheathing covered with a spun-bonded polyolefin building wrap. The insulation was installed in two layers of 2-in. thickness for a total thickness of 4 in. A 96-in. long furring strip was attached back through the insulation to the stud through the use of 6-in. long #10 pan head wood screws spaced 16 in. o.c. vertically (total of seven fasteners per panel). 2 Results from the screw bending test were not included due to the poor quality of the data gathered.
1/64" 1/32" 1/16" 1/8"0
5
10
15
20
25
30
35
40
45
50
55
60
65
70
75
0 0.015 0.03 0.045 0.06 0.075 0.09 0.105 0.12 0.135 0.15 0.165 0.18 0.195 0.21 0.225 0.24
Load
(lbs
per
fast
ener
)
Displacement (in)
Load vs. Displacement of Discrete Load Component Assemblies with 4" XPS Insulation
XPS-Friction XPS-Strut and Tie XPS Combined
26
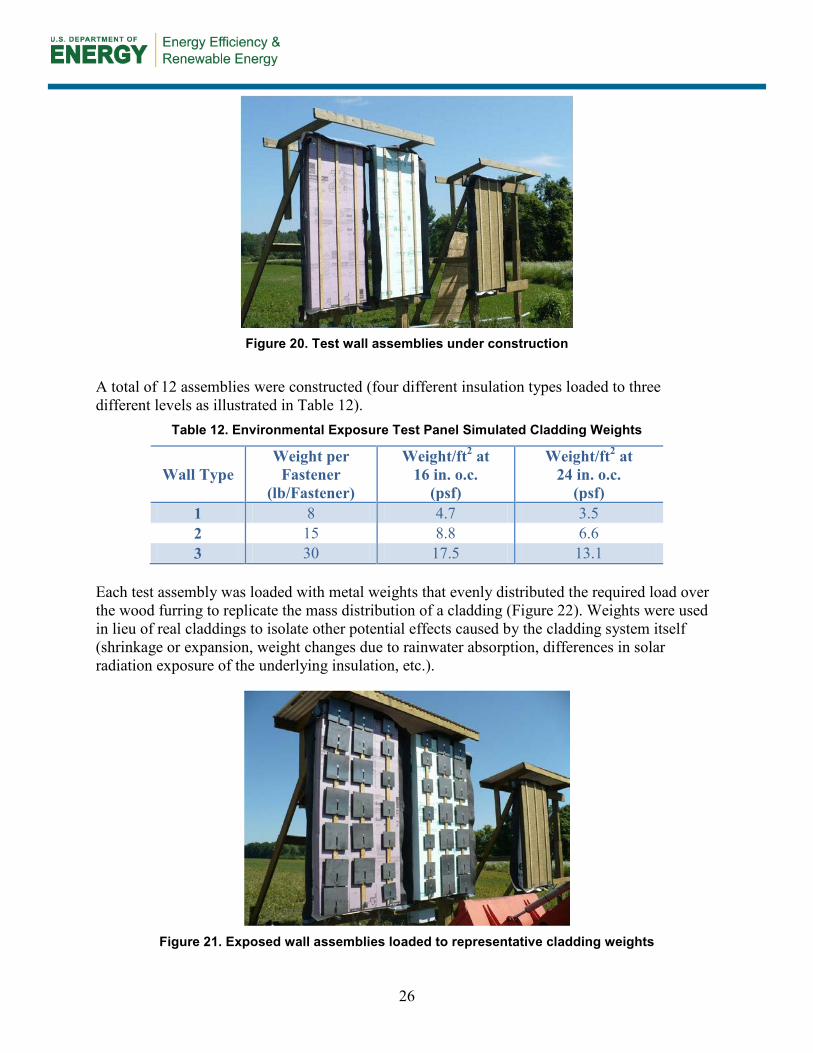
Figure 20. Test wall assemblies under construction
A total of 12 assemblies were constructed (four different insulation types loaded to three different levels as illustrated in Table 12).
Table 12. Environmental Exposure Test Panel Simulated Cladding Weights
Wall Type Weight per
Fastener (lb/Fastener)
Weight/ft2 at 16 in. o.c.
(psf)
Weight/ft2 at 24 in. o.c.
(psf) 1 8 4.7 3.5 2 15 8.8 6.6 3 30 17.5 13.1
Each test assembly was loaded with metal weights that evenly distributed the required load over the wood furring to replicate the mass distribution of a cladding (Figure 22). Weights were used in lieu of real claddings to isolate other potential effects caused by the cladding system itself (shrinkage or expansion, weight changes due to rainwater absorption, differences in solar radiation exposure of the underlying insulation, etc.).
Figure 21. Exposed wall assemblies loaded to representative cladding weights
27
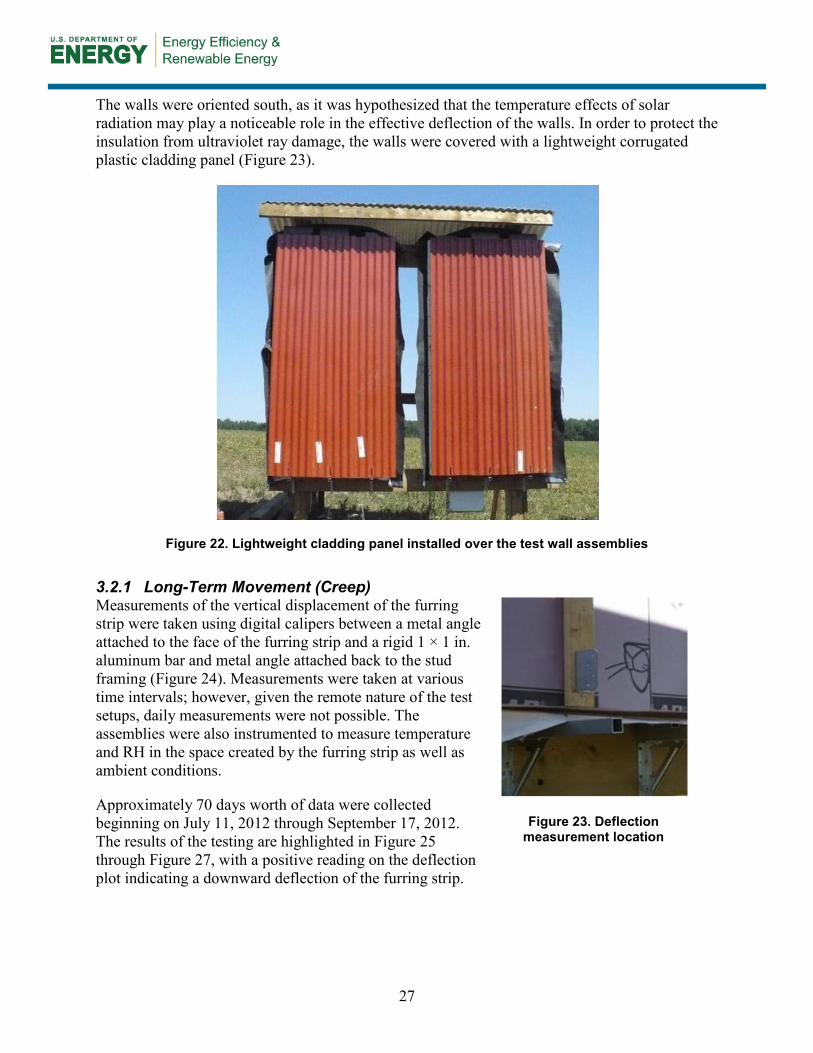
The walls were oriented south, as it was hypothesized that the temperature effects of solar radiation may play a noticeable role in the effective deflection of the walls. In order to protect the insulation from ultraviolet ray damage, the walls were covered with a lightweight corrugated plastic cladding panel (Figure 23).
Figure 22. Lightweight cladding panel installed over the test wall assemblies
3.2.1 Long-Term Movement (Creep) Measurements of the vertical displacement of the furring strip were taken using digital calipers between a metal angle attached to the face of the furring strip and a rigid 1 × 1 in. aluminum bar and metal angle attached back to the stud framing (Figure 24). Measurements were taken at various time intervals; however, given the remote nature of the test setups, daily measurements were not possible. The assemblies were also instrumented to measure temperature and RH in the space created by the furring strip as well as ambient conditions.
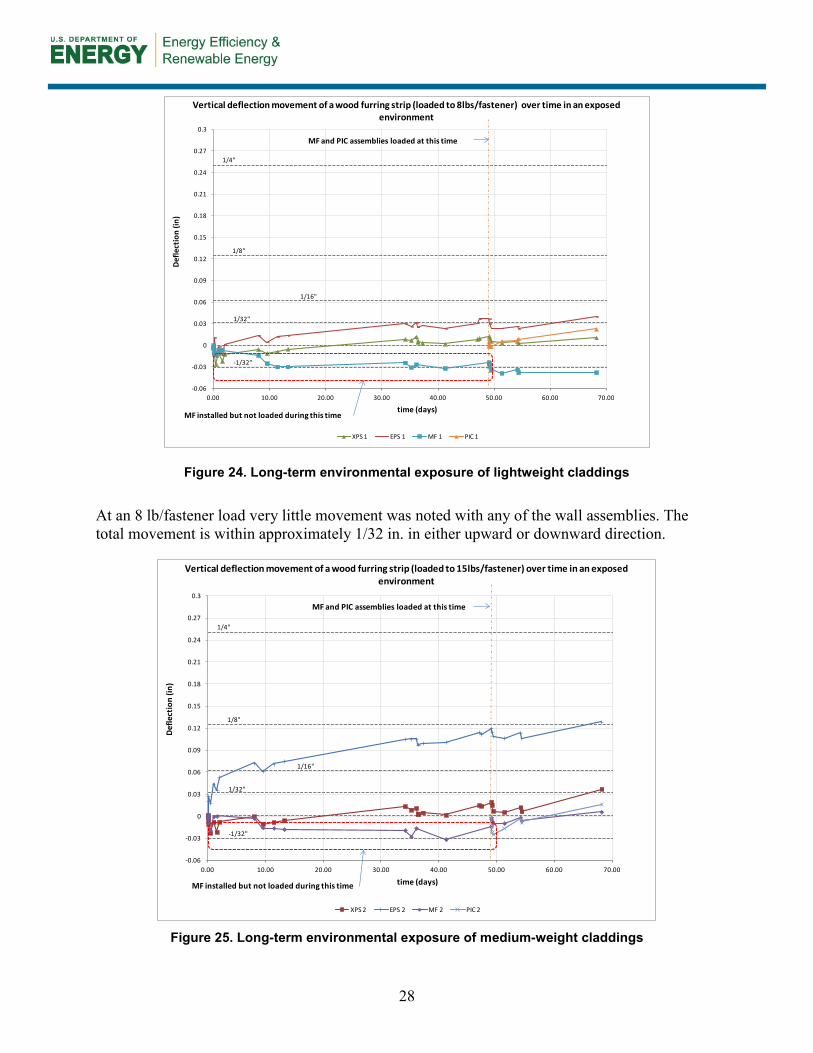
Approximately 70 days worth of data were collected beginning on July 11, 2012 through September 17, 2012. The results of the testing are highlighted in Figure 25 through Figure 27, with a positive reading on the deflection plot indicating a downward deflection of the furring strip.
Figure 23. Deflection measurement location
28
Figure 24. Long-term environmental exposure of lightweight claddings
At an 8 lb/fastener load very little movement was noted with any of the wall assemblies. The total movement is within approximately 1/32 in. in either upward or downward direction.
Figure 25. Long-term environmental exposure of medium-weight claddings
-1/32"
1/32"
1/16"
1/8"
1/4"
-0.06
-0.03
0
0.03
0.06
0.09
0.12
0.15
0.18
0.21
0.24
0.27
0.3
0.00 10.00 20.00 30.00 40.00 50.00 60.00 70.00
XPS 1 EPS 1 MF 1 PIC 1
time (days)
Vertical deflection movement of a wood furring strip (loaded to 8lbs/fastener) over time in an exposedenvironment
Defle
ctio
n(in
)
MF and PIC assemblies loaded at this time
MF installed but not loaded during this time
-1/32"
1/32"
1/16"
1/8"
1/4"
-0.06
-0.03
0
0.03
0.06
0.09
0.12
0.15
0.18
0.21
0.24
0.27
0.3
0.00 10.00 20.00 30.00 40.00 50.00 60.00 70.00
XPS 2 EPS 2 MF 2 PIC 2
time (days)
Vertical deflection movement of a wood furring strip (loaded to 15lbs/fastener) over time in an exposedenvironment
Defle
ctio
n(in
)
MF and PIC assemblies loaded at this time
MF installed but not loaded during this time
29
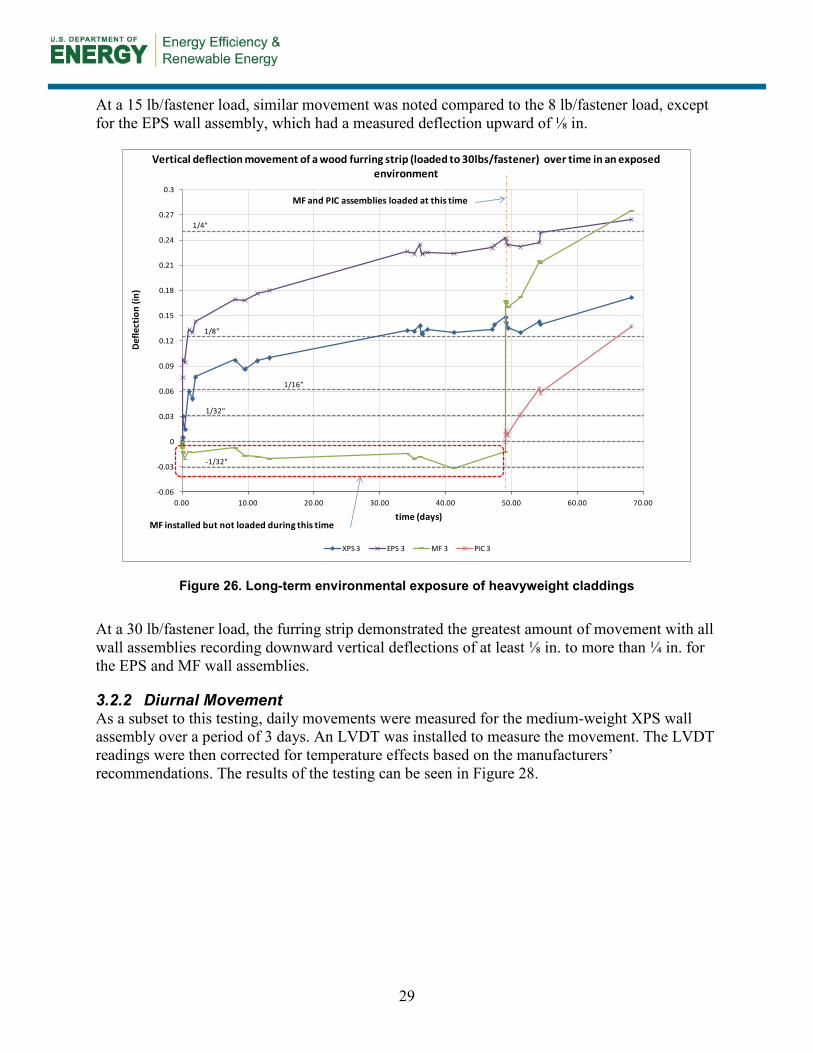
At a 15 lb/fastener load, similar movement was noted compared to the 8 lb/fastener load, except for the EPS wall assembly, which had a measured deflection upward of ⅛ in.
Figure 26. Long-term environmental exposure of heavyweight claddings
At a 30 lb/fastener load, the furring strip demonstrated the greatest amount of movement with all wall assemblies recording downward vertical deflections of at least ⅛ in. to more than ¼ in. for the EPS and MF wall assemblies.
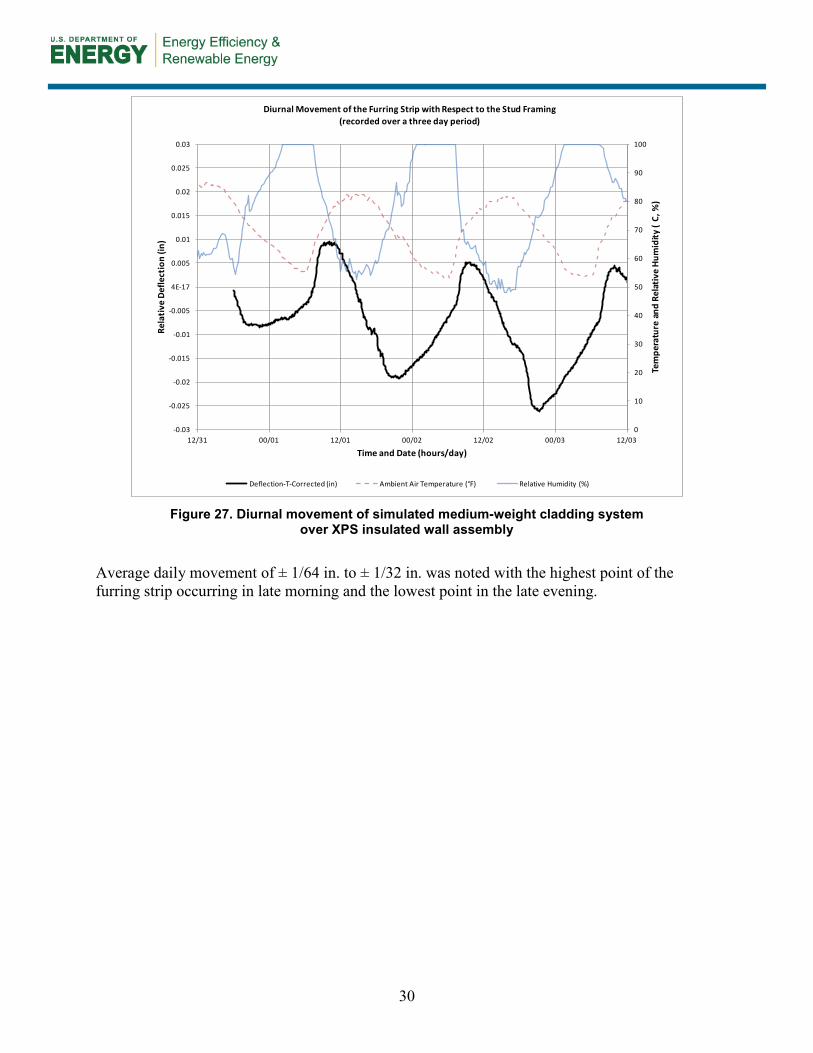
3.2.2 Diurnal Movement As a subset to this testing, daily movements were measured for the medium-weight XPS wall assembly over a period of 3 days. An LVDT was installed to measure the movement. The LVDT readings were then corrected for temperature effects based on the manufacturers’ recommendations. The results of the testing can be seen in Figure 28.
-1/32"
1/32"
1/16"
1/8"
1/4"
-0.06
-0.03
0
0.03
0.06
0.09
0.12
0.15
0.18
0.21
0.24
0.27
0.3
0.00 10.00 20.00 30.00 40.00 50.00 60.00 70.00
XPS 3 EPS 3 MF 3 PIC 3
time (days)
Vertical deflection movement of a wood furring strip (loaded to 30lbs/fastener) over time in an exposedenvironment
Defle
ctio
n(in
)
MF and PIC assemblies loaded at this time
MF installed but not loaded during this time
30
Figure 27. Diurnal movement of simulated medium-weight cladding system
over XPS insulated wall assembly
Average daily movement of ± 1/64 in. to ± 1/32 in. was noted with the highest point of the furring strip occurring in late morning and the lowest point in the late evening.
0
10
20
30
40
50
60
70
80
90
100
-0.03
-0.025
-0.02
-0.015
-0.01
-0.005
4E-17
0.005
0.01
0.015
0.02
0.025
0.03
12/31 00/01 12/01 00/02 12/02 00/03 12/03
Tem
pera
ture
and
Rel
ativ
e Hu
mid
ity (
C, %
)
Rela
tive
Defle
ctio
n (in
)
Time and Date (hours/day)
Deflection-T-Corrected (in) Ambient Air Temperature (°F) Relative Humidity (%)
Diurnal Movement of the Furring Strip with Respect to the Stud Framing (recorded over a three day period)

31
4 Discussion
4.1 Previous Research The conclusions of the 1986 FPL research was that the yield equations do predict reasonably well the joint yield strength based on the yield strength of wood in bearing and a fastener in bending for small gaps and the configurations considered. While these equations do predict a joint yield limit, they do not, however, provide a prediction of deflection at yield, or take into account other effects such as friction, tension-compression strut (fastener tension to insulation compression), or head effects of the fastener (head fixity providing additional rotational resistance).
Of the testing that was completed most of the tests were conducted using very small gaps (0.009–0.04 in.) with only three configurations that used larger gaps (½–1 in.) with rigid insulation placed between the two wood members. For these tests, no attempts to eliminate friction between the insulation and the wood members were made. While in concept this assembly may be considered similar to the assemblies presented in this report, the tests were conducted using very large 40 d nails (0.225-in. shank diameter), and relatively small gaps (1 in. or less) compared to the research presented here. Given these conditions, it is possible that while friction and insulation compression were present in the measured data, the stiffness of the fastener may have been the dominant load resistance mechanism, which would help to verify calculated results of the yield equations. A significant enough difference in the test setup of the FPL research, that direct comparison of the test data would not be applicable to current research.
Looking to the results of the NYSERDA/SFA research, a comparison was done between the proposed prescriptive code table and the results of the 4-in. thick insulation testing conducted by BSC in 2011 (Bowles 2010, Baker 2013).
The mean capacity of the BSC tests was calculated at the 0.015-in. (1/64-in.) deflection (the initial deflection limit proposed in the NYSERDA/SFA research), as well as at 0.125 in. (⅛-in.) deflection (Table 13). These results were compared to the proposed table from the NYSERDA/SFA.
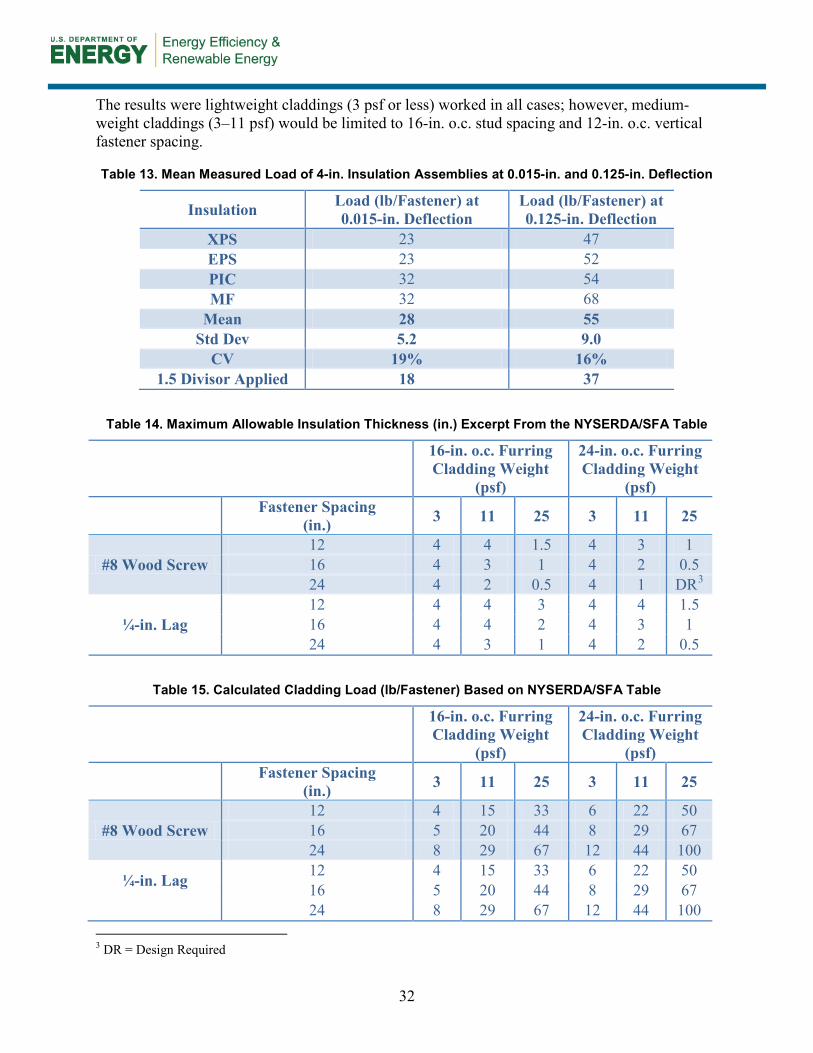
Table 14 is a direct excerpt of the NYSERDA/SFA Table that lists the maximum thickness of insulation for a given cladding weight, fastener type, and fastener spacing. Table 15 represents the calculated load per fastener given based on the cladding and fastener criteria in Table 14.
The measured BSC results, using the proposed NYSERDA/SFA 0.015-in. deflection limit and the 1.5 divisor, resulted in a maximum cladding weight per fastener of 18 lb (Table 13). This result was compared to the calculated cladding weights in Table 15, with the highlighted cells representing configurations that have a weight per fastener that is less than the determined 18 lb (Table 16). A direct comparison cannot be made since the BSC testing used standard #10 wood screws and the NYSERDA/SFA table has values for #8 wood screws and ¼-in. lag bolts. The properties of a #10 wood screw fall between these other screws, and a general agreement with the #8 underpredicting capacity, and the ¼-in. lag slightly overpredicting the capacity was seen.
32
The results were lightweight claddings (3 psf or less) worked in all cases; however, medium-weight claddings (3–11 psf) would be limited to 16-in. o.c. stud spacing and 12-in. o.c. vertical fastener spacing.
Table 13. Mean Measured Load of 4-in. Insulation Assemblies at 0.015-in. and 0.125-in. Deflection
Insulation Load (lb/Fastener) at 0.015-in. Deflection
Load (lb/Fastener) at 0.125-in. Deflection
XPS 23 47 EPS 23 52 PIC 32 54 MF 32 68
Mean 28 55 Std Dev 5.2 9.0
CV 19% 16% 1.5 Divisor Applied 18 37
Table 14. Maximum Allowable Insulation Thickness (in.) Excerpt From the NYSERDA/SFA Table
16-in. o.c. Furring Cladding Weight
(psf)
24-in. o.c. Furring Cladding Weight
(psf)
Fastener Spacing
(in.) 3 11 25 3 11 25
#8 Wood Screw 12 4 4 1.5 4 3 1 16 4 3 1 4 2 0.5 24 4 2 0.5 4 1 DR3
¼-in. Lag 12 4 4 3 4 4 1.5 16 4 4 2 4 3 1 24 4 3 1 4 2 0.5
Table 15. Calculated Cladding Load (lb/Fastener) Based on NYSERDA/SFA Table
16-in. o.c. Furring Cladding Weight
(psf)
24-in. o.c. Furring Cladding Weight
(psf)
Fastener Spacing
(in.) 3 11 25 3 11 25
#8 Wood Screw 12 4 15 33 6 22 50 16 5 20 44 8 29 67 24 8 29 67 12 44 100
¼-in. Lag 12 4 15 33 6 22 50 16 5 20 44 8 29 67
24 8 29 67 12 44 100 3 DR = Design Required
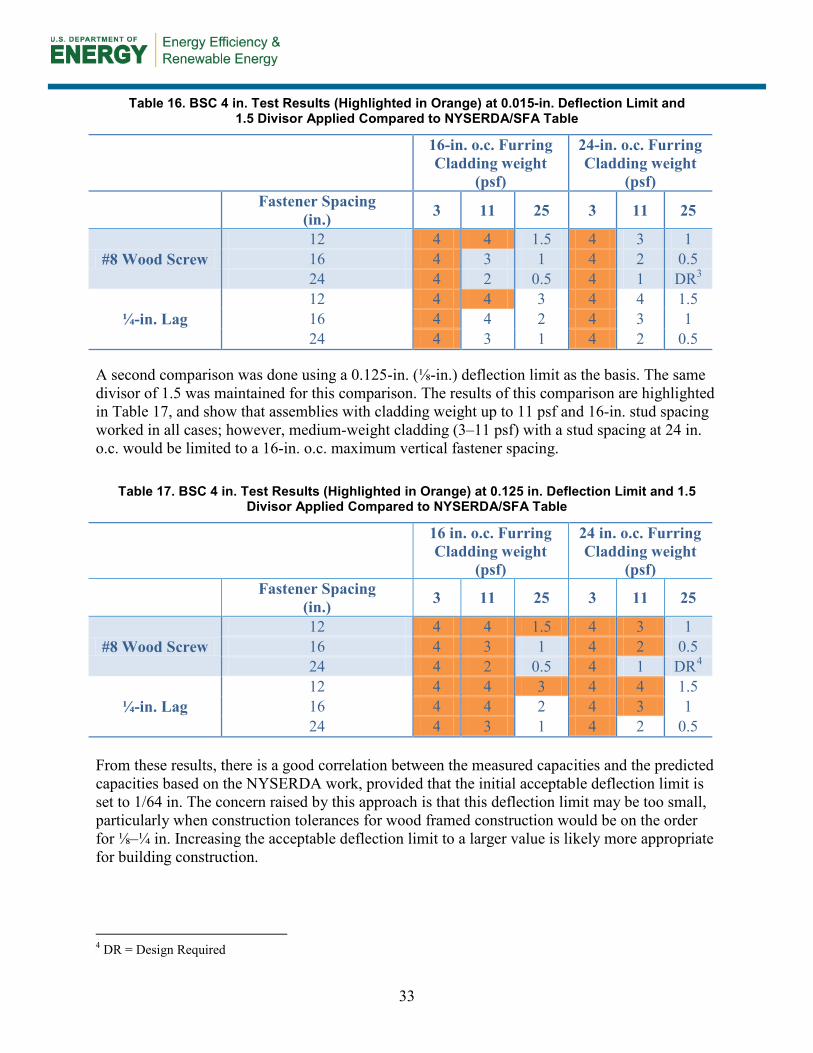
33
Table 16. BSC 4 in. Test Results (Highlighted in Orange) at 0.015-in. Deflection Limit and 1.5 Divisor Applied Compared to NYSERDA/SFA Table
16-in. o.c. Furring Cladding weight
(psf)
24-in. o.c. Furring Cladding weight
(psf)
Fastener Spacing
(in.) 3 11 25 3 11 25
#8 Wood Screw 12 4 4 1.5 4 3 1 16 4 3 1 4 2 0.5 24 4 2 0.5 4 1 DR3
¼-in. Lag 12 4 4 3 4 4 1.5 16 4 4 2 4 3 1 24 4 3 1 4 2 0.5
A second comparison was done using a 0.125-in. (⅛-in.) deflection limit as the basis. The same divisor of 1.5 was maintained for this comparison. The results of this comparison are highlighted in Table 17, and show that assemblies with cladding weight up to 11 psf and 16-in. stud spacing worked in all cases; however, medium-weight cladding (3–11 psf) with a stud spacing at 24 in. o.c. would be limited to a 16-in. o.c. maximum vertical fastener spacing.
Table 17. BSC 4 in. Test Results (Highlighted in Orange) at 0.125 in. Deflection Limit and 1.5 Divisor Applied Compared to NYSERDA/SFA Table
16 in. o.c. Furring Cladding weight
(psf)
24 in. o.c. Furring Cladding weight
(psf)
Fastener Spacing
(in.) 3 11 25 3 11 25
#8 Wood Screw 12 4 4 1.5 4 3 1 16 4 3 1 4 2 0.5 24 4 2 0.5 4 1 DR4
¼-in. Lag 12 4 4 3 4 4 1.5 16 4 4 2 4 3 1 24 4 3 1 4 2 0.5
From these results, there is a good correlation between the measured capacities and the predicted capacities based on the NYSERDA work, provided that the initial acceptable deflection limit is set to 1/64 in. The concern raised by this approach is that this deflection limit may be too small, particularly when construction tolerances for wood framed construction would be on the order for ⅛–¼ in. Increasing the acceptable deflection limit to a larger value is likely more appropriate for building construction.
4 DR = Design Required

34
4.2 System Mechanics The systems mechanics research was separated into two distinct phases. The first phase was a review of mechanics based equations that may be applicable to the load components developed in the system. Part of this analysis was the determination of specific material properties that were needed as inputs for the equations, as well as boundary conditions. The second phase was completed for two purposes: (1) to measure the relative load resistance magnitudes of the system mechanics; and (2) to check the results against the mechanics based equations to help evaluate the validity of the model.
4.2.1 Moment Resistance of Fasteners There were two beam models proposed to evaluate the bending capacity of the fasteners. The first was a beam with a fixed end and free and guided end on the other, the second was a simple cantilevered beam. It was felt that these two equations would represent the bounding extreme conditions that may be experienced by a fastener in this application with the cantilever being more similar to Mode IIIs failure and the guided beam being more similar to the failure mode IV as described in the AFPA TR-12 (AFPA 1999). Both of the equations are based on the moment area of inertia of the circular dowel. This is a simple approximation of the characteristics of the screw fasteners and does not account for the effects of the thread geometry, wood bearing, and head fixity in the prediction of the capacity. The calculated results of this analysis revealed different predicted values with the simple cantilever predicting only ¼ of the capacity of the beam with a free and guided end.
Table 18. Predicted Load Resistance Component of Screw Bending
Deflection (in.)
Cantilever Guided Beam 4 in.
(lb/fastener) 4 in.
(lb/fastener) 0 0.00 0.00
0.01 0.20 0.79 0.02 0.39 1.58 0.03 0.59 2.37 0.04 0.79 3.15 0.05 0.99 3.94 0.06 1.18 4.73 0.07 1.38 5.52 0.08 1.58 6.31 0.09 1.77 7.10 0.1 1.97 7.89 0.11 2.17 8.67 0.12 2.37 9.46
Varying the effective length of the fastener impacted the results. If the assumption was made that the bend occurs right at the face of the framing (sheathing in this case), a higher capacity would be predicted. However, if the bending occurs at some point slightly inboard of the face of the framing (carrying with it some bearing failure of the wood member that is not accounted for with
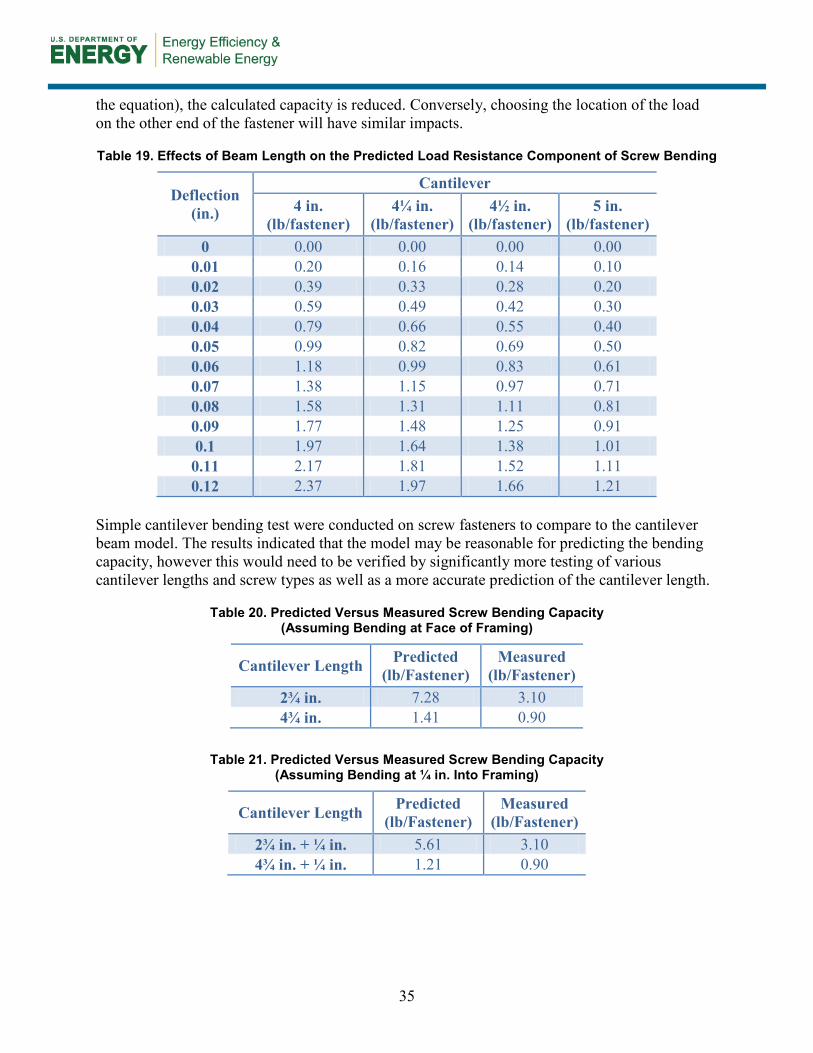
35
the equation), the calculated capacity is reduced. Conversely, choosing the location of the load on the other end of the fastener will have similar impacts.
Table 19. Effects of Beam Length on the Predicted Load Resistance Component of Screw Bending
Deflection (in.)
Cantilever 4 in.
(lb/fastener) 4¼ in.
(lb/fastener) 4½ in.
(lb/fastener) 5 in.
(lb/fastener) 0 0.00 0.00 0.00 0.00
0.01 0.20 0.16 0.14 0.10 0.02 0.39 0.33 0.28 0.20 0.03 0.59 0.49 0.42 0.30 0.04 0.79 0.66 0.55 0.40 0.05 0.99 0.82 0.69 0.50 0.06 1.18 0.99 0.83 0.61 0.07 1.38 1.15 0.97 0.71 0.08 1.58 1.31 1.11 0.81 0.09 1.77 1.48 1.25 0.91 0.1 1.97 1.64 1.38 1.01 0.11 2.17 1.81 1.52 1.11 0.12 2.37 1.97 1.66 1.21
Simple cantilever bending test were conducted on screw fasteners to compare to the cantilever beam model. The results indicated that the model may be reasonable for predicting the bending capacity, however this would need to be verified by significantly more testing of various cantilever lengths and screw types as well as a more accurate prediction of the cantilever length.
Table 20. Predicted Versus Measured Screw Bending Capacity (Assuming Bending at Face of Framing)
Cantilever Length Predicted (lb/Fastener)
Measured (lb/Fastener)
2¾ in. 7.28 3.10 4¾ in. 1.41 0.90
Table 21. Predicted Versus Measured Screw Bending Capacity (Assuming Bending at ¼ in. Into Framing)
Cantilever Length Predicted (lb/Fastener)
Measured (lb/Fastener)
2¾ in. + ¼ in. 5.61 3.10 4¾ in. + ¼ in. 1.21 0.90

36
Table 22. Predicted Versus Measured Screw Bending Capacity (Assuming Bending at ½ in. Into Framing)
Cantilever Length Predicted (lb/Fastener)
Measured (lb/Fastener)
2¾ in. + ½ in. 4.41 3.10 4¾ in. + ½ in. 1.05 0.90
Figure 28. Simple screw cantilever bending test
The range of calculated results was then compared to the measured test data from the discrete load component tests. The measured results for the three screws used in the small-scale test set up were < 5 lb of total resistance (up to ¼ in. of deflection). Unfortunately, a more accurate reading could not be taken due to sensitivity of the applied deflection from the test apparatus.5 The results demonstrated that the cladding load carry capacity by bending resistance of typical screws will be small for larger (e.g., 4-in.) gaps. That is, load resistance of 1–2 lb/fastener could be expected for deflections that might be considered reasonable in service (up to ¼ in.).
It would appear that the load resistance due to the bending of a fastener would be more closely predicted using a simple cantilever beam model than the guided beam. It should be noted, however, that double bending of the fastener has been noted in past testing. For double bending of the fastener, a beam with a fixed end and free but guided end would appear to be more appropriate. It seems reasonable that as deflection increases, the load resistance mode may change. Other aspects that may have impacts that are not accounted for in the equations are related to head fixity or potential bearing effects of the screw shaft on the insulation.
4.2.2 Strut and Tie Model (Low Friction) The numerical model was based on the elastic range compression resistance of the insulation. The compressive strength of the insulation materials was measured and the elastic range modulus 5 Rate of loading appeared to have an effect on the load magnitude registered.
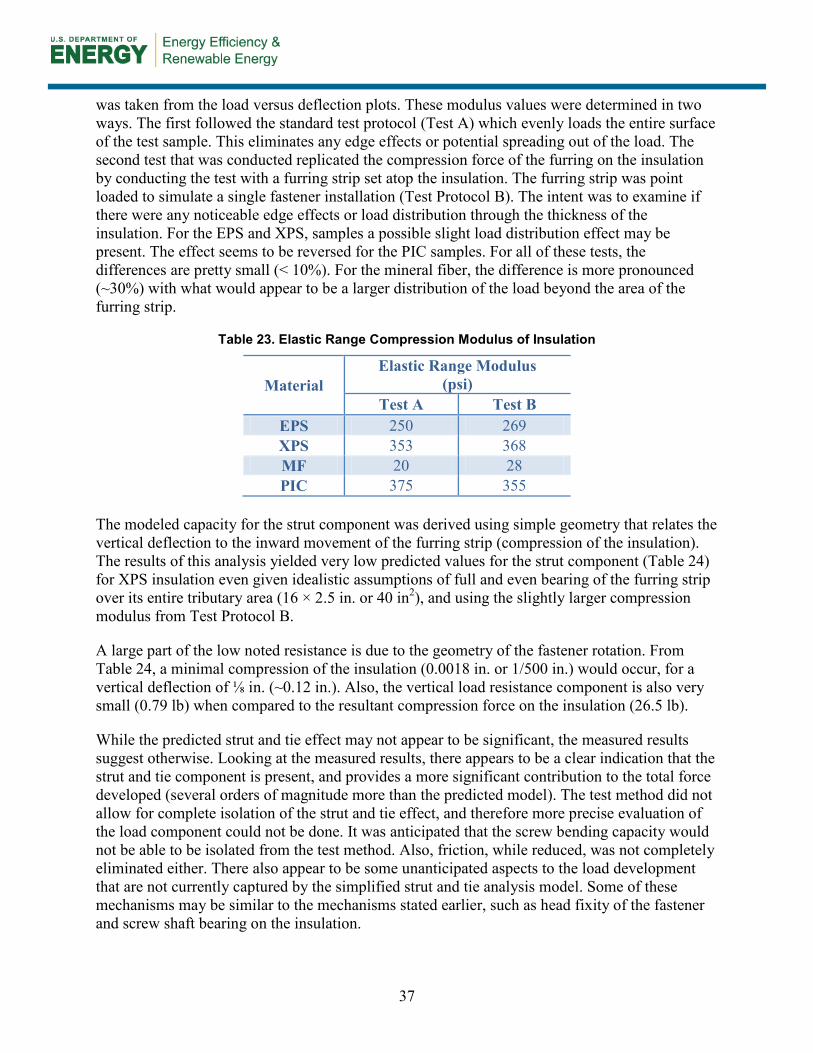
37
was taken from the load versus deflection plots. These modulus values were determined in two ways. The first followed the standard test protocol (Test A) which evenly loads the entire surface of the test sample. This eliminates any edge effects or potential spreading out of the load. The second test that was conducted replicated the compression force of the furring on the insulation by conducting the test with a furring strip set atop the insulation. The furring strip was point loaded to simulate a single fastener installation (Test Protocol B). The intent was to examine if there were any noticeable edge effects or load distribution through the thickness of the insulation. For the EPS and XPS, samples a possible slight load distribution effect may be present. The effect seems to be reversed for the PIC samples. For all of these tests, the differences are pretty small (< 10%). For the mineral fiber, the difference is more pronounced (~30%) with what would appear to be a larger distribution of the load beyond the area of the furring strip.
Table 23. Elastic Range Compression Modulus of Insulation
Material Elastic Range Modulus
(psi) Test A Test B
EPS 250 269 XPS 353 368 MF 20 28 PIC 375 355
The modeled capacity for the strut component was derived using simple geometry that relates the vertical deflection to the inward movement of the furring strip (compression of the insulation). The results of this analysis yielded very low predicted values for the strut component (Table 24) for XPS insulation even given idealistic assumptions of full and even bearing of the furring strip over its entire tributary area (16 × 2.5 in. or 40 in2), and using the slightly larger compression modulus from Test Protocol B.
A large part of the low noted resistance is due to the geometry of the fastener rotation. From Table 24, a minimal compression of the insulation (0.0018 in. or 1/500 in.) would occur, for a vertical deflection of ⅛ in. (~0.12 in.). Also, the vertical load resistance component is also very small (0.79 lb) when compared to the resultant compression force on the insulation (26.5 lb).
While the predicted strut and tie effect may not appear to be significant, the measured results suggest otherwise. Looking at the measured results, there appears to be a clear indication that the strut and tie component is present, and provides a more significant contribution to the total force developed (several orders of magnitude more than the predicted model). The test method did not allow for complete isolation of the strut and tie effect, and therefore more precise evaluation of the load component could not be done. It was anticipated that the screw bending capacity would not be able to be isolated from the test method. Also, friction, while reduced, was not completely eliminated either. There also appear to be some unanticipated aspects to the load development that are not currently captured by the simplified strut and tie analysis model. Some of these mechanisms may be similar to the mechanisms stated earlier, such as head fixity of the fastener and screw shaft bearing on the insulation.

38
Table 24. Modeled Compression Strut Capacity for XPS insulation
Vertical Deflection
(in.)
Fastener Angular Rotation
(deg)
Theoretical Foam
Compression (in.)
Compression Force on
Insulation (lb)
Vertical Load
Resistance (lb)
0 0 0.00000 0.0 0.00 0.01 0.14 0.00001 0.2 0.00 0.02 0.29 0.00005 0.7 0.00 0.03 0.43 0.00011 1.7 0.01 0.04 0.57 0.00020 2.9 0.03 0.05 0.72 0.00031 4.6 0.06 0.06 0.86 0.00045 6.6 0.10 0.07 1.00 0.00061 9.0 0.16 0.08 1.15 0.00080 11.8 0.24 0.09 1.29 0.00101 14.9 0.34 0.1 1.43 0.00125 18.4 0.46 0.11 1.58 0.00151 22.3 0.61 0.12 1.72 0.00180 26.5 0.79
Figure 29. Measured versus calculated strut and tie load component resistance
1/64" 1/32" 1/16" 1/8"0
5
10
15
20
25
30
35
40
45
50
55
60
65
70
75
0 0.015 0.03 0.045 0.06 0.075 0.09 0.105 0.12 0.135 0.15 0.165 0.18 0.195 0.21 0.225 0.24
Load
(lbs
per
fast
ener
)
Displacement (in)
Load vs. Displacement of Discrete Load Component Assemblies with 4" XPS Insulation
XPS-Friction XPS-Strut and Tie XPS Combined Modeled Strut and Tie
Magnitude of modeled strut and tie component
Magnitude of measured strut and tie component

39
4.2.3 Static Friction The modeled static friction component was based on the measured static COF (between the insulation and the building wrap) and the normal forces applied to the assembly. The calculated peak friction component for the assembly with XPS insulation (COF 0.23 between XPS and building wrap) and an applied normal force of 240 lb is 56 lb.
The discrete load component testing validated the friction model. The small scale XPS wall assembly was loaded to a total normal force of 240 lb (representing 80 lb/fastener). The friction force recorded was 51.9 lb (7% difference from the calculated value). The results are shown in Figure 31.
It was interesting to note, however, that even under significant precompression forces, some deflection still occurred prior to full development of the friction capacity. This does not fit an idealized friction model that should have no movement prior to exceeding static friction. It is currently not known what the contributing factors are; however, some assumptions are that the assembly layers are not perfectly engaged and a “setting in” of the assembly occurs at initial loading.
Figure 30. Measured versus calculated friction load component resistance
With static COFs ranging from 0.23 to 0.45, somewhere on the order of 25%–45% of the precompression force would be available to resist vertical displacement. With 150 lb of precompression force, this could be on the order of 35–65 lb/fastener, which could provide enough capacity to support even heavyweight claddings, at least initially.
1/64" 1/32" 1/16" 1/8"0
5
10
15
20
25
30
35
40
45
50
55
60
65
70
75
0 0.015 0.03 0.045 0.06 0.075 0.09 0.105 0.12 0.135 0.15 0.165 0.18 0.195 0.21 0.225 0.24
Load
(lbs
per
fast
ener
)
Displacement (in)
Load vs. Displacement of Discrete Load Component Assemblies with 4" XPS Insulation
XPS-Friction XPS-Strut and Tie XPS Combined Calculated Static Friction
Magnitude of calculated friction component
Magnitude of measured friction component
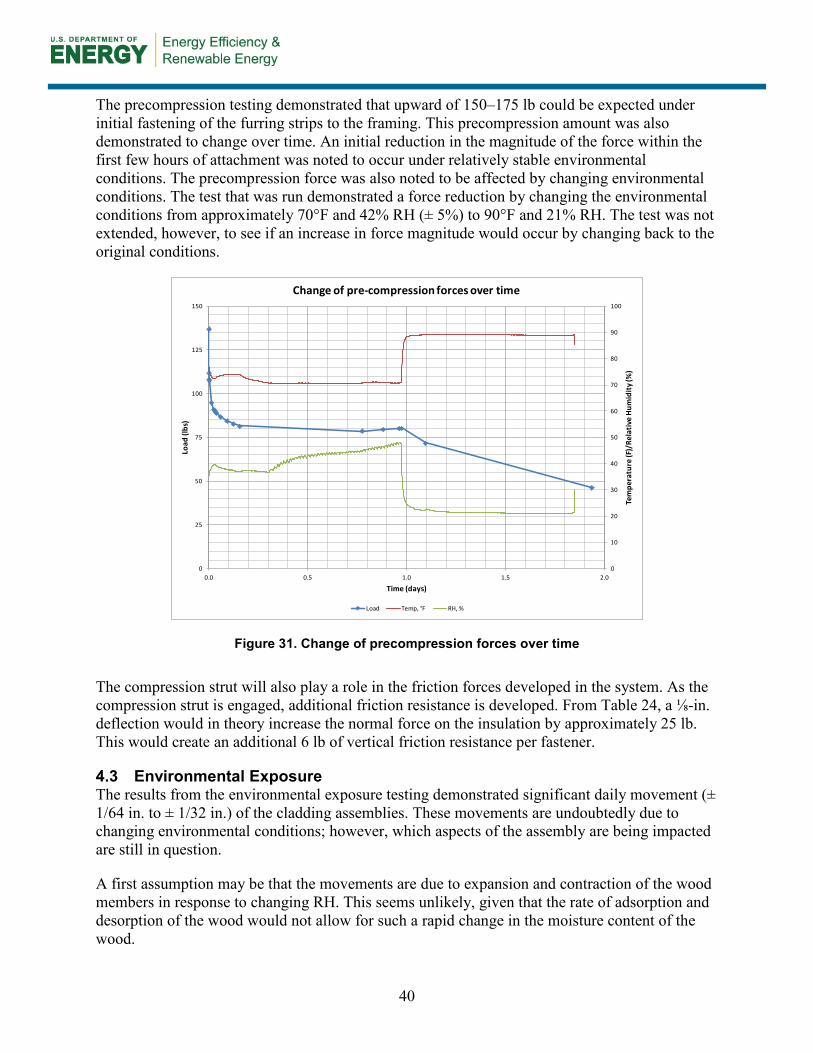
40
The precompression testing demonstrated that upward of 150–175 lb could be expected under initial fastening of the furring strips to the framing. This precompression amount was also demonstrated to change over time. An initial reduction in the magnitude of the force within the first few hours of attachment was noted to occur under relatively stable environmental conditions. The precompression force was also noted to be affected by changing environmental conditions. The test that was run demonstrated a force reduction by changing the environmental conditions from approximately 70°F and 42% RH (± 5%) to 90°F and 21% RH. The test was not extended, however, to see if an increase in force magnitude would occur by changing back to the original conditions.
Figure 31. Change of precompression forces over time
The compression strut will also play a role in the friction forces developed in the system. As the compression strut is engaged, additional friction resistance is developed. From Table 24, a ⅛-in. deflection would in theory increase the normal force on the insulation by approximately 25 lb. This would create an additional 6 lb of vertical friction resistance per fastener.
4.3 Environmental Exposure The results from the environmental exposure testing demonstrated significant daily movement (± 1/64 in. to ± 1/32 in.) of the cladding assemblies. These movements are undoubtedly due to changing environmental conditions; however, which aspects of the assembly are being impacted are still in question.
A first assumption may be that the movements are due to expansion and contraction of the wood members in response to changing RH. This seems unlikely, given that the rate of adsorption and desorption of the wood would not allow for such a rapid change in the moisture content of the wood.
0
10
20
30
40
50
60
70
80
90
100
0
25
50
75
100
125
150
0.0 0.5 1.0 1.5 2.0
Tem
pera
ture
(F)/
Rela
tive
Hum
idity
(%)
Load
(lbs
)
Time (days)
Change of pre-compression forces over time
Load Temp, °F RH, %

41
Thermal expansion of materials is another likely possibility. Examples of linear coefficients of thermal expansion of the materials used in the test assemblies can be seen in Table 25. The values provided for the insulation materials were taken directly from the manufacturers’ product data. The values for wood and steel are for generic materials.
Table 25. Coefficients of Thermal Expansion
Material Coefficient of Thermal Expansion (10-6 in./in./°F)
EPS 35 XPS 35 MF 3 PIC Not available from manufacturer Steel 7.3 Wood 2 to 3
The thermal expansion of wood is generally considered to be minimal (2 × 10⁻⁶ in./in./°F to 3 × 10⁻⁶ in./in./°F), while the thermal expansion of insulation materials can be much higher (35 × 10-
6 in./in./°F for the XPS insulation used in the testing).
Average deltas in ambient temperature were commonly in the 30°F range between daytime highs and nighttime lows, with even hotter temperatures being recorded immediately behind the cladding (Figure 33). The cavity space behind the cladding showed even greater daily temperature fluctuations (40°–60°F).
Figure 32. Sample of ambient versus cladding cavity temperatures
20
30
40
50
60
70
80
90
100
110
120
8/18/2012 8/25/2012 9/1/2012 9/8/2012 9/15/2012
Tem
pera
ture
(F)
Date
Ambient vs. Cladding Cavity Relative Humidity
Temp, °F Temp, °F

42
As a rough estimate, if the full thickness of the XPS insulation were to equilibrate to the same temperature variations, the expected amount of expansion would be on the order of 4/100 in. Based on the same simple geometry from the strut and tie analysis, that amount of expansion could result in a vertical movement on the order of 3/16 in. if unrestrained and no compression occurs. Based on this it seems likely that the thermal expansion of the insulation is a likely source of the daily movements that were recorded during this test. However, other sources such as expansion and contraction of the screw fastener cannot be discounted.
The daily variations should be kept in mind when examining the long-term deflection graphs. Since it is known that daily movement of the furring strips occurs, the graphs should be examined keeping in mind a band of acceptable deflection.
Figure 33. Proposed acceptable band of movement of furring over XPS insulation with a low load per fastener
For low load applications (≤ 8 lb/fastener) no definitive indication of long-term creep is apparent. For medium load applications (8–15 lb/fastener), no definitive indication of long-term creep is apparent. With the exception of the EPS wall assembly, longer term monitoring is recommended to determine more definitively if a potential for long-term creep exists. For heavier load applications (15–30 lb/fastener), there is a notable trend in downward deflection.
A comparison was made between the previous year’s long-term test data (Figure 35) and the environmental exposure data (Figure 36). Both charts have the same vertical scale so that a direct comparison of the observed movement can be made.
-1/32"
1/32"
1/16"
1/8"
1/4"
-0.06
-0.045
-0.03
-0.015
6E-17
0.015
0.03
0.045
0.06
0.075
0.09
0.105
0.12
0.135
0.15
0.165
0.18
0.195
0.21
0.225
0.24
0.255
0.27
0.285
0.3
0.00 10.00 20.00 30.00 40.00 50.00 60.00 70.00
XPS 1
time (days)
Lightweight cladding (8lbs/fastener) movement over time
Tem
pera
ture
(F) /
Rel
ativ
e Hu
mid
ity (%
)
Defle
ctio
n(in
)
MF and PIC assemblies loaded at this time

43
Figure 34. Long-term deflection of a furring strip loaded to 30 lb/fastener in a stable environment
Figure 35. Long-term deflection of a furring strip loaded to 30 lb/fastener in an exposed
environment
1/64"
1/32"
1/16"
1/8"
-0.06
-0.03
0.00
0.03
0.06
0.09
0.12
0.15
0.18
0.21
0.24
0.27
0.30
Jul/11 Aug/11 Sep/11 Oct/11 Nov/11 Dec/11 Jan/12
Defle
ctio
n (in
)
Time
Vertical deflection movment of a wood furring strip (loaded to 30lbs/fastener) over time in a controlled environment
XPS (8.6 lbs/fastener) XPS (30 lbs/fastener) EP (30 lbs/fastener) PIC (30lbs/fastener)
-1/32"
1/32"
1/16"
1/8"
1/4"
-0.06
-0.03
0
0.03
0.06
0.09
0.12
0.15
0.18
0.21
0.24
0.27
0.3
0.00 10.00 20.00 30.00 40.00 50.00 60.00 70.00
XPS 3 EPS 3 MF 3 PIC 3
time (days)
Vertical deflection movement of a wood furring strip (loaded to 30lbs/fastener) over time in an exposedenvironment
Defle
ctio
n(in
)
MF and PIC assemblies loaded at this time
MF installed but not loaded during this time

44
These results clearly demonstrate the effects of climate exposure on the potential for vertical deflection of the furring strips, as the assemblies loaded to the same level in a controlled laboratory environment demonstrated only a fraction of the movement.
While the difference in the magnitude of the deflection may be large, on a building scale, this amount of deflection may be acceptable or even normal for a cladding system. Unfortunately, there is not enough information available on cladding system movement to know for certain. Some areas that could be examined are places such as rim boards that will commonly undergo significant shrinkage. This movement of the underlying structure does not seem to affect cladding systems that are installed over the top, even brittle claddings such as stucco.
Even if more information on cladding system movement were known, it may not be directly transferable. The assemblies with furring strips attached over exterior insulation would tend to move as a single sheet. The concern with this movement is penetrations through the cladding such as at windows and doors. Bearing of the cladding on these elements could damage the element or the cladding itself. A strategy to mitigate this would be the use of a deflection joint between the cladding and the penetrating element. For example, a backer rod on sealant joint between the stucco cladding and a window element could be used.
Another aspect that should be considered is the potential for “setting in” of the assembly. For cladding such as adhered stone veneers and stucco, the initial deflection is not as significant an issue since the hydration of the mortars has not occurred and the cladding is a viscous fluid (and not solid) when the initial movement takes place. For these claddings, deflection after about the first day would be a more informative metric.
The 30 lb/fastener MF test assembly demonstrated a clear “setting in” at the time of loading. It seems plausible that friction forces were low and the assembly upon loading deflected to the point where adequate capacity could be developed from the strut and tie and associated friction forces. Figure 37 shows the measured movement of the furring strips loaded to 30 lb/fastener beginning the day after initial loading occurred. The net movement after the initial set-in period is much smaller with the values of the four assemblies being in closer agreement.

45
Figure 36. Furring strip movement recorded after the first day of “set in”
-1/32"
1/32"
1/16"
1/8"
1/4"
-0.06
-0.03
0
0.03
0.06
0.09
0.12
0.15
0.18
0.21
0.24
0.27
0.3
0.00 10.00 20.00 30.00 40.00 50.00 60.00 70.00
XPS 3 EPS 3 MF 3 PIC 3
time (days)
Vertical deflection movement of a wood furring strip (loaded to 30lbs/fastener) over time after a 1day set in period
Defle
ctio
n(in
)MF and PIC assemblies loaded at this time
46
5 Conclusions and Recommendations
The purpose of the research was to address the following questions:
1. What are the relative roles of the mechanisms and the magnitudes of the force that influence the vertical displacement resistance of the system? The system mechanics research provided some useful insights into the magnitude of the various load components, even if many of the exact mechanisms cannot be accurately predicted. The bending capacities of the screw fasteners were noted to contribute a much lower amount to the system total vertical deflection resistance capacity when compared to the other studied mechanisms. From the results, it appears that friction forces in the assembly may be significant, particularly at initial and small vertical deflections. While the presence of friction in the assembly may be significant, there is not enough information yet available to determine how to best account for, and make use of, the friction in the assemblies from a design perspective. The amount of friction due to pre-compression can be quite variable, as measured precompression forces were noted to change dramatically over time and with changing environmental conditions. The strut and tie model was demonstrated to provide additional capacity; however, the results were not clear as other unanticipated factors appear to affect the total capacity. More study of the system mechanics is still needed. Areas of research that require more exploration include:
• Bearing resistance of the insulation on the shaft of the fastener (both short-term
and long-term)
• Effects of wood shrinkage and the impacts on system capacity should the furring strip disengage from the insulation
• Effects of temperature and RH on insulation materials (dimensions, strength).
2. Can the capacity at a specified deflection be reliably calculated using mechanics-based equations? It was found that the theorized load components that were modeled do not provide a sufficiently accurate prediction of the measured load components to be used in a reliable design model. There were several factors to this, including sensitivity of the inputs, potential changes to the load resistance model depending on the amount of deflection, variability in the boundary conditions, as well as some additional system effects that are still not understood, identified, or quantified. Further study of the load component mechanisms may help to further refine our understanding and help us to develop more accurate models that could be used for assembly design.
3. What are the impacts of environmental exposure on the vertical displacement of furring strips attached directly through insulation back to a wood structure? The results of the long-term exposure tests reinforced much of the industry experience with this approach to cladding attachment over 4 in. of exterior insulation. Lightweight claddings (such as wood, fiber cement, and vinyl siding) represent the majority of the cladding that has been, and is currently being used with this type of attachment system.
47
These claddings coupled with a fastener spacing of 16–24 in. o.c. are representative of low load per fastener assemblies. To date, no known problems have occurred with these systems. The low measured movement and apparent resistance to creep is in line with this experience.
Medium-weight assemblies (15 lb/fastener) installed over 4 in. of insulation seem to be demonstrating good performance, though more data are recommended to be collected. Under heavy load (30 lb/fastener), there appears to be a potential for long-term creep of the assemblies. More study is needed for these assemblies.
All of the test assemblies had notable movement within a range of deflections. With a daily movements on the order of ± 1/64 in. to ± 1/32 in. being measured for one of the assemblies. In service deflection limits for the assemblies should be set to account for this movement.

48
References
American Forest and Paper Association. (1999). “General Dowel Equations for Calculating Lateral Connection Values. Technical Report 12”, Washington, DC: American Forest and Paper Association.
American Society for Testing and Materials. (2008). “ASTM F1575 - 03(2008) Standard Test Method for Determining Bending Yield Moment of Nails” West Conshohocken, PA: ASTM International.
American Society for Testing and Materials. (2010). “ASTM D1621 - 10 Standard Test Method for Compressive Properties of Rigid Cellular Plastics” West Conshohocken, PA: ASTM International.
American Society for Testing and Materials. (2010). “ASTM D1894 - 11e1 Standard Test Method for Static and Kinetic Coefficients of Friction of Plastic Film and Sheeting” West Conshohocken, PA: ASTM International.
Aune, P; Patton-Mallory, M. (1986a) “Lateral Load-Bearing Capacity of Nailed Joints Based on the Yield Theory”, Forest Products Laboratory Research Paper FPL RP 469, Madison, WI: U.S. Department of Agriculture, Forest Service Forest Products Laboratory.
Aune, P; Patton-Mallory, M. (1986b) “Lateral Load-Bearing Capacity of Nailed Joints Based on the Yield Theory Experimental Verification”. Forest Products Laboratory Research Paper FPL RP 470, Madison, WI: U.S. Department of Agriculture, Forest Service Forest Products Laboratory.
Baker, P. (2013). “External Insulation of Masonry Walls and Wood Framed Walls”, NREL Report No. SR-5500-54643, Golden, CO: National Renewable Energy Laboratory. Retrieved from http://www.nrel.gov/docs/fy13osti/54643.pdf
Bowles, L. (2010). “Fastening Systems for Continuous Insulation” Albany, NY: New York State Energy Research and Development Authority. Retrieved from http://www.nyserda.ny.gov/-/media/Files/Publications/Research/Other%20Technical%20Reports/fastening-systems-for-continuous-insulation.pdf
DOE/EIA. 2008. Annual Energy Review 2007 DOE/EIA-0384(2007). Washington, D.C.: U.S. Department of Energy/Energy Information Administration.
Hutcheon, N.B. (1964). “Principles Applied to an Insulated Masonry Wall.” Ottawa, ON: National Research Council of Canada. http://web.mit.edu/parmstr/Public/NRCan/CanBldgDigests/cbd050_e.html. Accessed June 2013.
Joyce, D. (2009). “Retrofitting Exterior Insulation.” Journal of Light Construction. www.jlconline.com/building-envelope/retrofitting-exterior-insulation.aspx. Accessed June 2013.
Lstiburek, J.W. (2007). “Building Sciences: The Perfect Wall.” ASHRAE Journal 50):74–78.
49
Lstiburek, J.W. (2009). “Building Sciences: Building in Extreme Cold.” ASHRAE Journal 51:56–59.
Pettit, B. (2009). “Deep Energy Retrofit of a Sears Roebuck House: A Home for the Next 100 Years.” High Performing Buildings 2, Spring 2009.
Reed Construction Data (2011). RSMeans CostWorks 2011, 15th Annual Edition. Norwell, MA.
Straube, J.F.; Smegal, J. (2009) Building America Special Research Project – High-R Walls Case Study Analysis. RR-0903. Buildingscience.com.
Ueno, K. (2010). “Residential Exterior Wall Superinsulation Retrofit Details and Analysis.” Performance of the Exterior Envelopes of Whole Buildings XI. Atlanta, GA: American Society of Heating, Refrigerating and Air-Conditioning Engineers, Inc.

50
Appendix A: BEopt Simulation Graphs
Dallas, Texas
Utility Rates: $0.13/kWh, $1.09/therm
Figure 37. Annualized energy related costs versus average source energy savings for Dallas
Figure 38. Average source energy savings reduction versus insulation level for Dallas

51
Kansas City, Missouri
Utility Rates: $0.08/kWh, $1.23/therm
Figure 39. Annualized energy related costs versus average source energy savings for Kansas City
Figure 40. Average source energy savings reduction versus insulation level for Kansas City
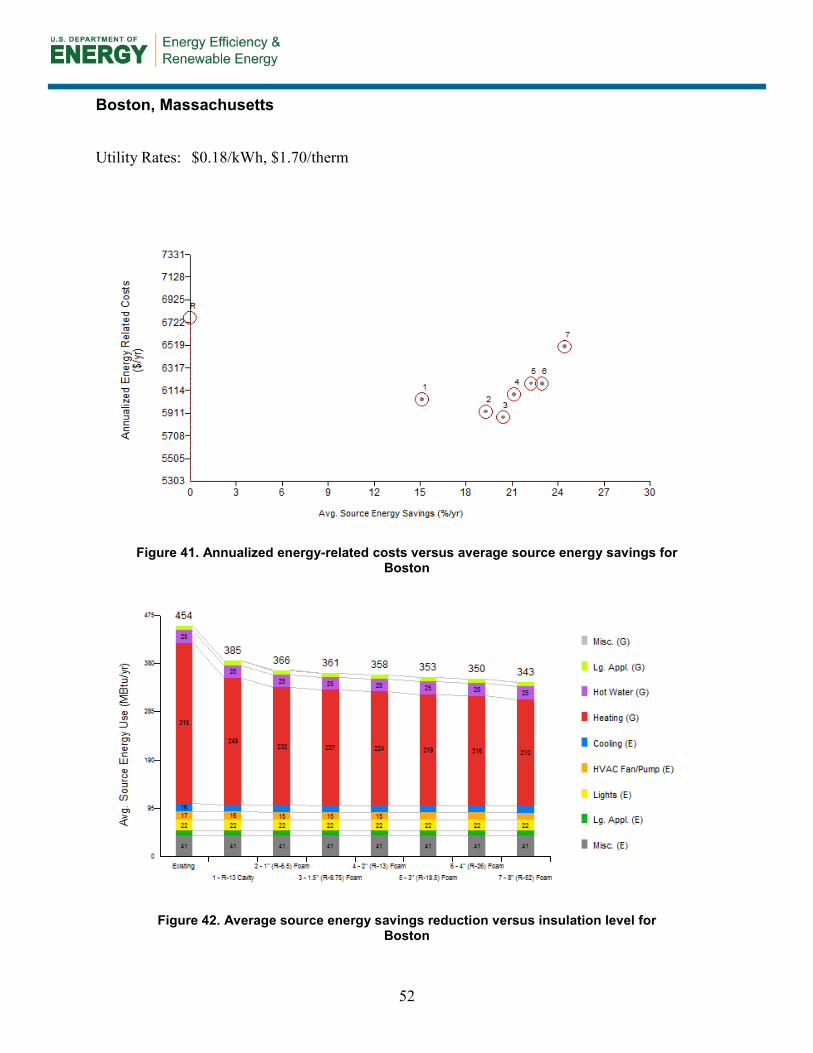
52
Boston, Massachusetts
Utility Rates: $0.18/kWh, $1.70/therm
Figure 41. Annualized energy-related costs versus average source energy savings for Boston
Figure 42. Average source energy savings reduction versus insulation level for Boston

53
Duluth, Minnesota
Utility Rates: $0.10/kWh, $0.87/therm
Figure 43. Annualized energy related costs versus average source energy savings for Duluth
Figure 44. Average source energy savings reduction versus insulation level for Duluth

DOE/GO-102014-3894 ▪ January 2014
Printed with a renewable-source ink on paper containing at least 50% wastepaper, including 10% post-consumer waste.


![ROADS AND MARITIME SERVICES TRAFFIC SYSTEMS · [2] AS 2276.1 – Cable for traff ic signal installation [3] AS 3808 – Insulating and sheathing materials for electric cables [4]](https://img.dokumen.tips/doc/110x75/5f05361c7e708231d411d522/roads-and-maritime-services-traffic-systems-2-as-22761-a-cable-for-traff-ic.jpg)


