Embed Size (px)
Citation preview

CityLINK
Multi-Criteria Analysis Detail Report
i

CityLINK
Multi-Criteria Analysis Detail Report
i
© InfraPlan (Aust) Pty Ltd. 2017
The information contained in this document produced by InfraPlan (Aust) Pty Ltd is solely for the use of the Client for the purposes for which it has been prepared and InfraPlan (Aust) Pty Ltd undertakes no duty or accepts any responsibility to any third party who may rely on this document. All rights reserved. No sections or elements of this document may be removed from this document, reproduced, electronically stored or transmitted in any form without the written permission of InfraPlan (Aust) Pty Ltd.

CityLINK
Multi-Criteria Analysis Detail Report
ii
Contents
Contents ...................................................................................................................................... ii
Report Structure .......................................................................................................................... 6
Introduction ................................................................................................................................ 7
CityLINK Route MCA Summary ..................................................................................................... 9
1 Theme 1: Place-making and a vibrant city ....................................................................... 10
1.1 Corridor ability to support the 30 Year Plan vision for infill and corridor development .......... 11
1.1.1 Number of properties within a 300m catchment of the route that have a ‘Capital
Value: Site Value’ ratio of less than 1.3 ......................................................................... 11
1.1.2 Cubic metres of transit supportive zones and policy areas (urban corridor,
regeneration and so on) that support increased development potential within a 300m
catchment of the route .................................................................................................. 12
1.1.3 Recent approved development applications within 200m of the route ....................... 13
1.1.4 Average size of parcels within the within a 300m catchment of the route .................. 14
1.1.5 Amount of heritage, character or protected zoning provisions that could have
implications for future development potential (within a 300m catchment of the route)
15
1.2 Ability to support emerging and existing main streets providing a range of local services to the
community ............................................................................................................................... 16
1.2.1 Length of active frontage along the route ..................................................................... 16
1.2.2 The number of café and restaurant seats within a 300m catchment of the route ....... 17
1.2.3 Capacity of short-term accommodation (hotels, hostels etc.) within a 300m catchment
of the route .................................................................................................................... 18
1.2.4 Transit supportive and main street land use mix of the immediate route frontage (up
to 50m)........................................................................................................................... 19
1.3 An environment that is potentially dynamic and adaptable to be ‘living space’ including open
space and landscape amenity. ................................................................................................. 21
1.3.1 Amount of publicly accessible open space within a 300m catchment of the route ..... 21
1.3.2 Quality of the amenity of main streets .......................................................................... 22
2 Theme 2: Connectivity for the local economy and community ......................................... 25
2.1 Connect the inner and middle suburbs to the CBD, enhancing access to employment,
education, healthcare, entertainment and other opportunities in the CBD ........................... 26
2.1.1 Interchange opportunities with other AdeLINK routes and existing tram line ............. 26
2.1.2 Number of significant attractor/generators along the route ........................................ 26
2.1.3 Number of student registrations within a 300m catchment of the route..................... 29
2.1.4 Number of jobs within a 300m catchment of the route ................................................ 30

CityLINK
Multi-Criteria Analysis Detail Report
iii
2.1.5 Number of residents within a 300m catchment that work in the Adelaide CBD .......... 31
2.2 Connect the city to the inner and middle suburbs, enhancing access to activity centres,
employment, education, healthcare, entertainment and other opportunities ...................... 32
2.2.1 Number of people residing within a 300m catchment .................................................. 32
2.2.2 Number of tertiary students within a 300m catchment ................................................ 33
2.2.3 Number of persons employed within a 300m catchment ............................................. 34
2.3 Reduce transport disadvantage and social severance. ............................................................. 35
2.3.1 Number of households without a motor vehicle within a 300m catchment ................ 35
2.3.2 Average SEIFA 'relative disadvantage' score of residents within a 300m catchment ... 36
3 Theme 3: Integrated transport ........................................................................................ 37
3.1 Improve the customer’s perception of the public transport experience, including safety,
frequency of services and reliability. ....................................................................................... 38
3.1.1 Ratio of shared running lanes versus separated running lanes ..................................... 38
3.1.2 Levels of competing traffic: traffic volumes along route (existing) ............................... 40
3.2 Least direct road impacts including movement of traffic, freight ............................................ 42
3.2.1 Volume to capacity ratio (v:c) of the road route ........................................................... 42
3.2.2 Scale of impacts to commercial and emergency vehicle access and mobility .............. 43
3.3 Least direct impacts on severance for pedestrians and cyclists. .............................................. 45
3.3.1 Number of times the route crosses over a bike route................................................... 45
3.3.2 Impact on or ability to retain bike routes along the tram route ................................... 47
3.3.3 Number of times the tram route crosses an Active City Pedestrian Link ...................... 48
3.3.4 Number of pedestrian refuges or crossings impacted (requiring removal) .................. 49
3.4 Ability to integrate with and/or replace current public transport services (including bus, train,
O-Bahn) .................................................................................................................................... 50
3.4.1 Interchange opportunities with Adelaide Metro Bus and Train services ...................... 50
3.5 Impact on the current network role and function (e.g. freight routes versus commuter routes)
.................................................................................................................................................. 53
3.5.1 Alignment (or conflict) with the route role and function .............................................. 53
3.6 Impact to signalised intersections ............................................................................................ 57
3.6.1 Number of intersections with tram turning movements .............................................. 57
3.6.2 Number of intersections with tram through movements ............................................. 58
4 Theme 4: Economic impacts ........................................................................................... 60
4.1 Patronage Potential (Revenue) ................................................................................................. 61
4.2 Constructability and business impacts...................................................................................... 62
4.2.1 Potential risks to underground services ........................................................................ 62

CityLINK
Multi-Criteria Analysis Detail Report
iv
4.2.2 Count of businesses with street frontage to the route ................................................. 63
4.2.3 Number of vehicle access points that could be impacted (e.g. laneways, driveways
etc.) ................................................................................................................................ 64
4.3 Potential for property uplift and value capture ........................................................................ 65
4.3.1 Property value uplift potential ...................................................................................... 65
4.4 Least route impacts on (property acquisition, trees, services, car parking, heritage items) ... 66
4.4.1 Number of on street parks affected .............................................................................. 66
4.4.2 Impacts on median, including trees and islands (calculation to be determines upon
review of actual routes, but to include removal of trees) ............................................. 68
4.4.3 Number of heritage items along the route frontage (up to 50m) ................................. 68
4.5 Potential for contributions from government land .................................................................. 70
4.5.1 Amount of local and state government owned land along the route (within a 300m
catchment) ..................................................................................................................... 70
4.5.2 Measure the amount of SA Housing Trust land along the route (within a 300m
catchment) ..................................................................................................................... 71
4.5.3 Amount of Urban Renewal Authority land along the route (within a 300m catchment)
72
5 Theme 5: Environmental sustainability ........................................................................... 73
5.1 An environment that enables walking and public transport use .............................................. 74
5.1.1 Enables walking and public transport use ..................................................................... 74
5.1.2 Enables cycling ............................................................................................................... 76
Appendix A: Multi-Criteria Analysis Process ................................................................................ 77
Purpose of the Multi-Criteria Analysis ........................................................................................ 77
How does the Multi-Criteria Analysis Work? ............................................................................... 78

CityLINK
Multi-Criteria Analysis Detail Report
5
The following analysis was undertaken by InfraPlan Pty Ltd on the request of the Department of
Planning, Transport and Infrastructure. The intent of this report is to provide a multi criteria analysis
of several route options for the AdeLINK Tram network, including the routes as per the Integrated
Transport and Land Use Plan (ITLUP), 2015. MCA processes are often applied by State Government
Departments and Treasuries to assess project options. This report does not contain any modelling, or
engineering data and as such the AdeLINK routes are only stated as potential options.
AdeLINK has the potential to attract investment, boost economic growth and encourage urban
renewal and jobs, as well as bring residents and visitors to the city centre. Providing high quality public
transport services will also help drive market demand for residential development in the CBD, inner
and middle metropolitan Adelaide. In 2013, the development of the Integrated Transport and Land
Use Plan (ITLUP) involving 2,500 participants stated they support trams as a first priority (83% of inner
and 78% of middle suburban residents).
Planning for AdeLINK forms part of the overall electrification of public transport in Adelaide. The study
comprises several key steps before concluding with a detailed business case for delivering the AdeLINK
tram network (as shown in the diagram below). This is an essential process for establishing the
rationale for funding options. The first step, an extensive multi-criteria assessment (MCA) process to
assess route options, is now complete and contained in this report. It involved the testing of the
original AdeLINK tram network against other potential routes identified in conjunction with Council
officers through consultation and workshops.
The MCA Summary Report summarises the routes assessed in the MCA, providing guidance as to the
route options to be taken forward to the Design Labs and Community Open Days. The results are also
presented as standalone studies for each corridor. Criteria are unweighted to comply with
Infrastructure Australia requirements.
It is important to note that the MCA is one step in the process, and will assist in determining the
final preferred routes for AdeLINK.
The next phase of the study involves Design Labs, which will explore the integration opportunities
between land use, street attributes and tram corridor planning (e.g. station locations) with Council
staff and the community. This will provide a framework for more detail planning of the tram lines
including stop locations, and identifying constraints and opportunities that will inform the design of
each corridor.
Following the Design Labs, a number of studies will commence in February 2017 to model the urban
development outcomes (patronage demand); develop the operation framework of the tram system,
including potential stabling options; assessment of road traffic operations and integration with bus
and train services; and potential road and track layouts, including the location and style of tram stops
within an urban design framework.

CityLINK
Multi-Criteria Analysis Detail Report
6
Report Structure
This Multi-Criteria Analysis (MCA) Detail Report is to be read in conjunction with the ‘AdeLINK MCA
Summary Report’, which provides the project overview, an outline of the MCA process (see Appendix
A of this report), contextual framework and a summary of the results. Each corridor-specific ‘Detail
Report’ provides an explanation of the methodology undertaken and details the comparative MCA
assessment of each route option. This format is illustrated below.
This report details the results for the 45 measures used in the multi-criteria analysis that have been
grouped under 5 themes, which form the chapters of this detailed report.

CityLINK
Multi-Criteria Analysis Detail Report
7
Introduction
The MCA criteria was refined for the purpose of assessing CityLINK, due to unique city-centre
environment and ‘loop’ configuration. The following was considered to create difficulty for application
of the MCA used for the other AdeLINK corridors for CityLINK:
The ‘loop’ configurations all within close proximity meant that theoretical walking catchments
significantly overlapped, encompassing much of the City centre and would yield the same
results for some spatially assessed measures making the MCA less effective. This was
overcome by reducing the common walking catchment to 300m to allow for variance in the
comparative analysis.
Since ITLUP, Frome Street has been designated as a bicycle corridor through the City. It is
unlikely a tram would be a suitable addition to the street.
Many measures are not applicable in the same way as for the suburban links, i.e. as commuter
corridors to the City centre.
This refinement was undertaken during a workshop with the Project Management Team (Department
of Planning, Transport and Infrastructure and InfraPlan) with transport and planning staff from the
Adelaide City Council. Outcomes of this workshop included determining final CityLINK route options
and appropriately revised criteria and measures. Figure 1 (overleaf) illustrates the three route options
brought forward for the MCA, and for which the Criteria and Measures have been applied throughout
this report.
Option A: via Morphett Street, Sturt/Halifax Street and Hutt Street (distance 4.73km).
Option B: West Terrace, Gouger/Angas Street and Hutt Street (distance 4.14km).
Option C: via Morphett Street, Sturt/Halifax Street and Pulteney Street (distance 4.15km).

CityLINK
Multi-Criteria Analysis Detail Report
8
Figure 1: CityLINK route options. Broken line represents infrastructure under construction.

CityLINK
Multi-Criteria Analysis Detail Report
9
CityLINK Route MCA Summary
CityLINK
Option A: via Morphett Street, Sturt/Halifax Street
and Hutt Street
Option B: West Terrace, Gouger/Angas Street and Hutt
Street
Option C: via Morphett Street, Sturt/Halifax Street and
Pulteney Street
Total score 26
24
24
The scores for CityLINK options were comparative, with Option A scoring marginally higher than
Options B and C.
Option A scored well in the following measures:
Number of residents (within 300m catchment) that work in the Adelaide CBD
Number of employed persons within the 300m catchment
Number of tertiary students within the 300m catchment
Number of properties within a 300m catchment of the route that have a ‘Capital Value: Site
Value’ ratio of less than 1.3:1
Option B scored well in the following measures:
Transit supportive and main street land use mix of the corridor frontage (up to 50m)
Number of significant attractors/generators within the tram corridors (e.g. schools, activity
centres etc.)
Number of student registrations within a 300m catchment
Option C scored well in the following measures:
Cubic metres of transit supportive zones and policy areas (urban corridor, regeneration and
so on) that support increased development potential within a 300m catchment of the route
Number of tertiary students within the 300m catchment
Number of jobs within a 300m catchment

CityLINK
Multi-Criteria Analysis Detail Report
10
1 Theme 1: Place-making and a vibrant city
Facilitating 30 Year Plan growth targets, uplift potential of the inner and
middle suburbs and vibrant main street activity and neighbourhoods.

CityLINK
Multi-Criteria Analysis Detail Report
11
1.1 Corridor ability to support the 30 Year Plan vision for infill and
corridor development
1.1.1 Number of properties within a 300m catchment of the route that have a ‘Capital
Value: Site Value’ ratio of less than 1.3
The capital value: site value ratio (CV:SV ratio) of a property is a proxy measure of the development
potential of a residential property. While it does not necessarily determine if a property will be
developed, this measure demonstrates which CityLINK option has more (or less) residential properties
which may be suitable for redevelopment. The CityLINK Options that have a number of properties
with a CV:SC ratio of 1.3:1 are rated higher for this measure.
Data source: Provided by Department of Planning, Transport and Infrastructure, Population, Land and
Housing Analysis Unit.
Confidence Scale Level: A
CityLINK Option A has more properties with a CV:SV of 1.3:1 in comparison to Options B and C. This is
due to the 300m catchment for Option A incorporating more of the south-east residential areas.
Figure 2: Parcels with a CV:SV less than 1.3
Route Option Summary Score
CityLINK A Number of properties with CVSV ratio of 1.3:1 or less:
420 3
CityLINK B Number of properties with CVSV ratio of 1.3:1 or less:
268 1
CityLINK C Number of properties with CVSV ratio of 1.3:1 or less:
239 1

CityLINK
Multi-Criteria Analysis Detail Report
12
1.1.2 Cubic metres of transit supportive zones and policy areas (urban corridor,
regeneration and so on) that support increased development potential within a
300m catchment of the route
Zoning information was sourced from Data SA (administered by DPTI) in June 2016. It was then clipped
to a 300m catchment of each route using GIS, and the area of each zone, policy area and precinct was
measured. Each zone was then cross-checked against Adelaide City Council’s Development Plan to
ascertain whether it supported infill, medium or high density development (or the like) and to what
height. If so, the areas of those zones were totalled and multiplied by the allowable heights to
determine the maximum development potential for that route option.
In the Capital City Zone, Policy Area 13 there is no enforced height restriction. To account for this, the
average height of all recently built and approved developments (over $10 million in value) as well as
those under construction within this Policy Area was calculated (based on DPTI information current to
29 November 2016) to ascertain a market-based figure. In reality, the potential for this Policy Area
could be greater and therefore a confidence rating of B was applied for this measure.
Confidence Scale Level: B
Option C has scored the highest for this measure as it had a substantially higher rate of development
potential of over 10 million m3 of transit supportive zoning when compared to Options A and B. This
is due to its Pulteney Street alignment, which allows for a greater proportion of Capital City Zone,
Policy Area 13 (with no height restriction) to be captured. Comparatively, Options A and B have much
closer development potential, with the mild difference reflective of Option B’s shorter length, and as
such have received the same score.
Route Option Summary Score
CityLINK A Total development supportive area: 82,652,000 m3
Average per km: 17,474,000 m3 2
CityLINK B Total development supportive area: 77,318,000 m3
Average per km: 18,676,000 m3 2
CityLINK C Total development supportive area: 95,228,000 m3
Average per km: 22,947,000 m3 3

CityLINK
Multi-Criteria Analysis Detail Report
13
1.1.3 Recent approved development applications within 200m of the route
DPTI’s ‘New Investment in Metropolitan Adelaide’ map shows developments over $10 million in
Adelaide City, developments over 4 storeys within an Urban Corridor Zone of an identified Inner
Metropolitan Suburb or developments over $3 million within the Port Adelaide Regional Centre Zone
of the City of Port Adelaide Enfield. It is important to note that the number of developments is not an
indication of the size, scale and potential influence on urban regeneration.
For the purpose of this measure, only developments with significant activity generating potential, such
as apartments and hotels, are counted. Recent developments along North Terrace have also been
included in this measure to ensure consistency. Completed developments and commercial
developments such as office blocks and hospitals were excluded. The map was last updated in
November 2016.
Data source: Metropolitan Adelaide Investment – DPTI, Department of Planning, Transport and
Infrastructure, South Australia: http://www.dpti.sa.gov.au/planning/adelaide_investment
Confidence Scale Level: A
Data shows that route Options A and C capture a more significant amount of recently approved
developments in the CBD when compared to Option B. It is clear that a number of applications in the
south ward would not be serviced by Option B. Therefore, Options A and C rate higher for this
measure.
Figure 3: Recently approved development applications.
Route Option No. of projects
Levels Dwellings Hotel Rooms Score
CityLINK A 26 420 3,702 808 3
CityLINK B 19 333 2,548 356 2
CityLINK C 25 403 3,632 808 3

CityLINK
Multi-Criteria Analysis Detail Report
14
1.1.4 Average size of parcels within the within a 300m catchment of the route
The average size of cadastral land parcels is used to determine which option is likely to have the
greatest potential for significant uplift. For example, it would be easier for a developer to purchase
one large land parcel, rather than buy a number of adjacent smaller parcels to construct a larger
development.
Cadastral and zoning data was received from DPTI, and analysed using GIS to ascertain the average
parcel size within a 300m catchment. Parcels where only a portion of its area lie within a 300m
catchment were counted as part of this assessment.
Confidence Scale Level: A
While the average size of a cadastral parcel within a 300m catchment of the three route options do
not significantly differ, a marginally larger average parcel size can be found throughout Option C (33
m2 larger that Option A and 29 m2 larger that Option B). Average parcel sizes for Options A and B are
similar. While there are slight differences in average parcel sizes between the three options, the
significance of such is too minimal to warrant a significant difference in MCA scoring. Therefore, all
three options are rated equally for this measure.
Figure 4: Land Parcel sizes.
Route Option Summary Score
CityLINK A Average parcel size: 972 m2 1
CityLINK B Average parcel size: 976 m2 1
CityLINK C Average parcel size: 1,005 m2 1

CityLINK
Multi-Criteria Analysis Detail Report
15
1.1.5 Amount of heritage, character or protected zoning provisions that could have
implications for future development potential (within a 300m catchment of the
route)
Heritage, character and historic preservation zones by their very nature have limitations on the type,
intensity and scale of development that can occur. The desired urban form in these areas is generally
lower density with housing of a particular era to protect the character of those precincts.
This type of zoning unfortunately offers relatively lower potential for increased density, and therefore
increased transit demand. Therefore, this measure seeks to determine which option has a lower
amount of protective zoning (both in total and average per km), and hence could likely support a
greater population over time.
Data was acquired from Data SA and processed in GIS to gain the 300m catchments before being
assessed manually against each Council’s Development Plan to determine if zoning is restrictive.
Confidence Scale Level: A
The amount of protective zoning within 300m of the subject routes is highest for Option A when
compared to Options B and C. Option C has the least amount of protectively zoned land, both in total
and when averaged per kilometre of route due to its alignment which avoids the Historic Conservation
Zones in the south-east of the CBD. Therefore, Option C scores the highest for this measure.
Route Option Summary Score
CityLINK A Amount of protective zoning: 120,970 m2
Average per km: 25,580 m2 -3
CityLINK B Amount of protective zoning: 64,580 m2
Average per km: 15,600 m2 -2
CityLINK C Amount of protective zoning: 13,720 m2
Average per km: 3,310 m2 -1

CityLINK
Multi-Criteria Analysis Detail Report
16
1.2 Ability to support emerging and existing main streets providing a
range of local services to the community
1.2.1 Length of active frontage along the route
Digital inspection was used to determine the length of active frontages along the three route options.
After assessing the frontage types a digital ruler was used to measure the length of active frontages
in metres. ‘Active Frontages’ were identified if they met the following criteria:
building frontage adjacent footpath (no separation between footpath and built frontage from
car parking or similar);
accessibility (building main access directly off footpath);
visually permeable façade (majority of the building frontage is not a blank structures/ solid
walls); and
retail or commercial land use.
To ensure a level of consistency and accuracy, pathways and breakages along active frontages were
not measured. The MCA score was determined by comparing the overall lengths in metres of each
route option. The rating was determined at the discretion of Urban Design Professionals using
judgement, but there is likely to be a lack of detail to warrant a high confidence scale overall.
Confidence Scale Level: D
Figure 5: Example of Active Street Frontage: Gouger Street, Adelaide CBD (Google Maps).
In comparison to Options B and C, Option A has a marginally greater length of active frontages along
its proposed route. However, this may be due to the additional length of Option A when compared to
Options B and C. Therefore, all three Options score equally for this measure.
Route Option Summary Score
CityLINK A 2,717m Per km: 574m
1
CityLINK B 2,401m Per km: 580m
1
CityLINK C 2,499m Per km: 602m
1
CityLINK
Multi-Criteria Analysis Detail Report
17
1.2.2 The number of café and restaurant seats within a 300m catchment of the route
This measure seeks to determine which route may be most beneficial in transporting residents,
tourists and workers to the various leisure opportunities that the Adelaide CBD has to offer. Using
2014 Meshblock data supplied by Adelaide City Council the number of café and restaurant seats within
a 300m catchment of each subject route was calculated.
The three CityLINK routes were overlayed on maps supplied by the Adelaide City Council with 300m
buffers. The data inside of the buffers were then counted for each route. Only survey blocks fully
within, or their majority, were included in the assessment.
For consistency, data within a 300m catchment of North Terrace were included for all CityLINK options.
Confidence Scale Level: B
The presence of restaurant and café seats within a 300m catchment is highest in total for Option A
and highest per kilometre of route in Option B. Option C has the lowest number of seats in total and
per kilometre of route due to its alignment which does not significantly capture the Rundle Street East
precinct. Therefore, Option C rates lowest for this measure.
Figure 6: Number of restaurant and cafe seats
Routes Option Summary Score
CityLINK A 300m catchment seats: 40,980
300m catchment density per km: 5,983 3
CityLINK B 300m catchment seats: 39,461
300m catchment density per km: 6,304 3
CityLINK C 300m catchment seats: 32,620
300m catchment density per km: 5,644 2

CityLINK
Multi-Criteria Analysis Detail Report
18
1.2.3 Capacity of short-term accommodation (hotels, hostels etc.) within a 300m
catchment of the route
This measure seeks to determine which route may best service short-term accommodation
establishments such as hotels and hostels within the Adelaide CBD. Using 2014 Meshblock data
supplied by Adelaide City Council the accommodation capacity of establishments within a 300m
catchment of each subject route was calculated.
The three CityLINK routes were overlayed on maps supplied by the Adelaide City Council with 300m
buffers. The data inside of the buffers were then counted for each route. Only survey blocks fully
within, or their majority, were included in the assessment.
For consistency, data within a 300m catchment of North Terrace were included for all CityLINK options.
Confidence Scale Level: B
As Figure 7 displays, the majority of short-term accommodation in the Adelaide CBD is captured by all
three CityLINK options along North Terrace. Option B, however, misses out on a number of
establishments near Light Square which are captured by Options A and C. Therefore, CityLINK Options
A and C rate higher for this measure.
Figure 7: Short term accommodation location and capacity
Routes Option Summary Score
CityLINK A 300m catchment accommodation capacity: 8,155
300m catchment density per km: 1,191 3
CityLINK B 300m catchment accommodation capacity: 7,021
300m catchment density per km: 1,122 2
CityLINK C 300m catchment accommodation capacity: 8,072
300m catchment density per km: 1,397 3

CityLINK
Multi-Criteria Analysis Detail Report
19
1.2.4 Transit supportive and main street land use mix of the immediate route frontage
(up to 50m)
Activities need to be co-located to meet the needs of the economy and people’s lifestyle choices.
Compatible uses should be mixed vertically within the same building or horizontally on adjacent sites,
and be within walking distance of each other. The co-location of many compatible uses would reduce
car travel and increase walking, cycling and public transport use. Locally, traffic congestion would be
reduced, air quality improved, health improved and accessibility maximised.
Vibrant precincts would attract more business and employment, along with leisure, recreational and
entertainment facilities.
A mix of mostly retail commercial, public services, education and higher density residential uses
generally typify vibrant precincts. While this data layer does not consider density, a presence of
residential use within the 50m catchment could lend itself to increased population densities, if not
already.
The data used in this assessment has been sourced from the ‘Generalised Land Use’ spatial layer
available from Data SA, a State administered open data source. It is updated regularly by DPTI.
The data set used for this assessment was published in May 2016.
Confidence Scale Level: A
The land use mix aligning the subject routes shows that Option B facilitates a more vibrant precinct
with human scale uses when compared to the land uses mixes for Options A and C. Therefore, Option
B rates higher in this measure.
Figure 8: Generalised land use mix - 50m catchment.

CityLINK
Multi-Criteria Analysis Detail Report
20
Figure 9: Percentage of land use - Route (50m catchment).
Route Option Summary Score
CityLINK A
Significant land uses:
Residential
General commercial
2
CityLINK B
Significant land uses:
Retail commercial
Education
Public institution
3
CityLINK C
Significant land uses:
Recreation
Retail Commercial
2
0%
10%
20%
30%
40%
50%
60%
70%
80%
90%
100%
CityLINK A CityLINK B CityLINK C
Land Uses in CityLINK 50m catchment zone
AGRICULTURE
COMMERCIAL
EDUCATION
NONPRIVATE_RESID
PUB_INSTITUTION
RECREATION
RESERVE
RESIDENTIAL
RET_COMMERCIAL
UTIL_INDUSTRY
VACANT
VACANT_RESID

CityLINK
Multi-Criteria Analysis Detail Report
21
1.3 An environment that is potentially dynamic and adaptable to be
‘living space’ including open space and landscape amenity.
1.3.1 Amount of publicly accessible open space within a 300m catchment of the route
For this measure, a dataset of accessible reserves and open space was acquired from DPTI (2012
record). Clipped to a 300m buffer of each route option, the amount of open space for each route was
calculated in GIS and totalled for that route option. Results were also assessed per kilometre.
Confidence Scale Level: B
Figure 10 demonstrates the presence of publicly accessible open space within a 300m catchment of
the three route options. Option B is the greatest performer due to its extended alignment along West
Terrace, therefore capturing the western parklands. While Option C connects the CBD’s four public
squares, it captures far less of the outer parklands compared the other two Options and contains only
34.6% of the publicly accessible open space compared to Option B. Therefore, Option B rates highest
for this measure.
Figure 10: Public open space.
Route Option Summary Score
CityLINK A Total public open space: 444,090 m2
Average per km: 93,890 m2 2
CityLINK B Total public open space: 607,460 m2
Average per km: 146,730 m2 3
CityLINK C Total public open space: 209,970 m2
Average per km: 50,595 m2 1

CityLINK
Multi-Criteria Analysis Detail Report
22
1.3.2 Quality of the amenity of main streets
The methodology to score the amenity of the Main Streets along the CityLINK routes was as follows:
1. A site visit was undertaken of the entire length of each route option.
2. The route was divided into sections where the amenity of the Main Street varied.
3. Each section was assessed by separately rating the following three components:
a. visual grain / visual appeal;
b. sense of security night-time activity; and
c. people present (the vibe).
The rating of these components ranged from 0 (very poor) to 4 (very good). These components are
described below (it is noted that there are other components that contribute to Main Street Amenity
(such as the quality of walking and cycling), however these are assessed in other sections of this MCA).
The ratings were averaged over the section and then colour coded to low, medium or high
Main Street amenity.
A map was prepared illustrating the locations of the low, medium or high amenity along each
route, refer to Figure 11
The MCA score was determined from comparing the amenity illustrated on these maps.
Visual Grain and Visual Appeal: Fine grain and visually interesting main streets
The ‘grain’ refers to the pattern of the arrangement and size of buildings and allotments; and the
degree to which an area's pattern of street-blocks and street junctions is respectively small and
frequent, or large and infrequent. Fine grain environments contain more activity and places of
interest. They are more supportive of walking, cycling and public transport use. Coarse grain
environments are often highly car dependent.
Visually appealing main streets encourage visitors and are; clean, well maintained, landscaped,
interesting and diverse, have street furniture. Refer example images below.
Very Poor = 0
Coarse grain, high fences. Litter. Large areas of roads and car parking.
Very Good = 4
Fine grain land-use, street scaping, interesting architecture, street furniture, well-maintained.

CityLINK
Multi-Criteria Analysis Detail Report
23
Sense of Security and Night-Time Activity: A sense of feeling safe, as well as actually being safe, along
the main street.
Measures of security include, lighting, visual surveillance, out of hours’ activity, good sight lines,
activity, refer to example images below.
Very Poor = 0
Little surveillance from adjoining land uses. No lighting, low activity, little after-hours activity.
Very Good = 4
Good surveillance from adjoining land uses. Good lighting. High activity.
People Present (the ‘Vibe’): A main street where people visit, meet and stay. A vibrant environment
that is enjoyable and interesting.
Very Poor = 0
No activities to attract people, poor general amenity, no shade or shelter.
Very Good = 4
People often present, activities that encourage ‘staying’, cafes, seating, shade, shelter.
Confidence Scale Level: D
The rating was determined by urban design professionals using their judgement, and an overall rating
was required even though a route could vary greatly from section to section.
Main street amenity levels along each of the subject routes vary significantly based on the precincts
they pass through. Areas of high main street amenity are largely focussed around Gouger Street, Hutt
Street south and partially East Terrace north. As Option C does not pass through any of these precincts
and is characterised by minor, sporadic stretches of medium levels of main street amenity, this Option
is rated lowest for this measure.

CityLINK
Multi-Criteria Analysis Detail Report
24
Figure 11: Colour-coded assessment of route sections – high, medium or low main street amenity.
Route Option Summary Score
CityLINK A High amenity along Hutt Street South captured 1
CityLINK B Gouger Street has the longest stretch of high amenity 1
CityLINK C Small, sporadic stretches of medium amenity 0

CityLINK
Multi-Criteria Analysis Detail Report
25
2 Theme 2: Connectivity for the local economy and community
Creating a connected city which connects its residents to employment,
education, services and recreation.
CityLINK
Multi-Criteria Analysis Detail Report
26
2.1 Connect the inner and middle suburbs to the CBD, enhancing
access to employment, education, healthcare, entertainment and
other opportunities in the CBD
2.1.1 Interchange opportunities with other AdeLINK routes and existing tram line
A desktop assessment of proposed routes and interchange opportunities with the existing Glenelg to
AEC track and planned City Tramline Extension on North Terrace from King William Street to East
Terrace, including three proposed stations; Museum (near Kintore Avenue), University (east of
Pulteney Street) and East Terrace (at the Royal Adelaide Hospital).
This assessment assumes network extensions and stop locations that have been part of previous MCAs
but which have not yet been fully defined. Design changes affecting the above assumptions may affect
the interchangeability between routes and services.
Confidence Scale Level C
All Options share existing West Terrace, City West and ARS stops plus future Museum stop on North
Terrace.
CityLINK A: This loop includes future University and East Terrace stops on North Terrace. The loop
crosses King William Street and the existing line at Halifax / Sturt Street, providing interchange at the
existing City South stop.
CityLINK B: This loop includes future University and East Terrace stops on North Terrace. The loop
crosses King William Street and the existing line at Angas / Gouger Street, providing an interchange
opportunity between the existing Victoria Square stop and a Gouger Street stop near King William
Street.
CityLINK C: The loop crosses King William Street and the existing line at Halifax / Sturt Street, providing
interchange at the existing City South stop.
Route Option Summary Score
CityLINK A Six shared stops on North Terrace (West to East Terraces), interchange at Hurtle Square (UnleyLINK) and City South, King William Street
2
CityLINK B Six shared stops on North Terrace (West Terrace to East Terrace), interchange at Pulteney / Angas Street (UnleyLINK) and King William / Gouger Street with walking transfer to the Victoria Square
1
CityLINK C Four shared stops on North Terrace (West Terrace to Museum), shared stops on Pulteney Street (UnleyLINK) and interchange at City South, King William Street
2
2.1.2 Number of significant attractor/generators along the route
Significant attractors and trip generators along the potential routes were assessed to determine which
route would be most beneficial in connecting people to such destinations. Potential attractors were
chosen and narrowed down for each route, by removing attractors that may have significant
patronage generated but unlikely to be accessed by light rail users i.e. Hardware Stores (Bunnings
Warehouse, Masters etc.) or may have significant patronage at some times, but irregularly (function
centres, halls and so on).

CityLINK
Multi-Criteria Analysis Detail Report
27
To achieve this, digital inspection was used to identify the significant attractors in each of the potential
routes. Typically, this involved attractors such as schools, shopping centres, activity centres,
community facilities and services, employment hubs, and tourist attractions. These were listed in
tabular form with major significant attractors underlined and weighted higher for the purpose of MCA
comparative scoring.
The rating was determined at the discretion of Urban Design Professionals using their judgement, but
there was no data or relevant studies available.
Confidence Scale Level: D
When comparing the three options for CityLINK, Option B was found to have the most significant
attractors overall and in terms of major attractors with a frontage to the potential route. Both Options
A and C have similar numbers of significant attractors and both capture 12 major attractors. As Option
B has more attractors overall, it scores highest for this measure.
CityLINK A CityLINK B CityLINK C
Tertiary Education Tertiary Education Tertiary Education
UniSA City West
TAFE SA City Campus
Adelaide College of the Arts
UniSA City East
Adelaide University
UniSA City West
SAE Creative Media Institute
UniSA City East
Adelaide University
UniSA City West
TAFE SA City Campus
Adelaide College of the Arts
UniSA City East
Adelaide University
Schools Schools Schools
Adelaide High School
Christian Brothers College
Adelaide High School
St Marys College
Eynesbury College
St Aloysius College
Christian Brothers College
WEA adult Learning
Adelaide High School
Shopping Precincts Shopping Precincts Shopping Precincts
Rundle Street Precinct
Hutt Street Precinct
Rundle Street Precinct
Central Markets Precinct
Gouger Street Precinct
Hutt Street Precinct
Rundle Street Precinct
Rundle Mall
Cultural Facilities Cultural Facilities Cultural Facilities
Tandanya National Aboriginal Cultural Institute
Botanic Gardens
SA Museum
The Arts Theatre
The Royalty Theatre
Tandanya National Aboriginal Cultural Institute
SA Museum
SA Art Gallery
Festival Plaza
Adelaide Convention Centre

CityLINK
Multi-Criteria Analysis Detail Report
28
SA Art Gallery
Festival Plaza
Adelaide Convention Centre
Botanic Gardens
SA Museum
SA Art Gallery
Festival Plaza
Adelaide Convention Centre
Community Services Community Services Community Services
Calvary Wakefield Hospital
Old Royal Adelaide Hospital
State Library of SA
Adelaide Railway Station
North Terrace Biomedical Precinct
Victoria Square Court Precinct
SA Police HQ
Calvary Wakefield Hospital
Old Royal Adelaide Hospital
State Library of SA
Adelaide Railway Station
North Terrace Biomedical Precinct
Old Royal Adelaide Hospital
State Library of SA
Adelaide Railway Station
North Terrace Biomedical Precinct
Route Option Summary Score
CityLINK A 20 significant attractors
12 of which are major 2
CityLINK B 29 significant attractors
15 of which are major 3
CityLINK C 16 significant attractors
12 of which are major 2

CityLINK
Multi-Criteria Analysis Detail Report
29
2.1.3 Number of student registrations within a 300m catchment of the route
This measure seeks to determine which route may be best in assisting students in accessing
educational facilities within the Adelaide CBD. Using 2014 Meshblock data supplied by Adelaide City
Council the student enrolment numbers of each educational facility within a 300m catchment of each
subject route was calculated.
The three CityLINK routes were overlayed on maps supplied by the Adelaide City Council with 300m
buffers. The data inside of the buffers were then counted for each route. Only survey blocks fully
within, or their majority, were included in the assessment.
For consistency, data within a 300m catchment of North Terrace were included for all CityLINK options.
Confidence Scale Level: B
As displayed in Figure 12, Option B has the most significant number of student enrolments within a
300m catchment of the proposed route. While all three route options will service the four most
populous educational facilities (UniSA City East & West campuses, Adelaide University and Adelaide
High School), Option B additionally services a number of populous educational facilities within and
around Victoria Square. Therefore, Option B rates highest for this measure.
Figure 12: Location of educational facilities and enrolment numbers
Route Option Summary Score
CityLINK A 300m catchment students: 57,134
300m catchment density per km: 8,341 2
CityLINK B 300m catchment students: 63,321
300m catchment density per km: 10,115 3
CityLINK C 300m catchment students: 56,851
300m catchment density per km: 9,836 2

CityLINK
Multi-Criteria Analysis Detail Report
30
2.1.4 Number of jobs within a 300m catchment of the route
This measure seeks to determine which route may be best in assisting Adelaide CBD employees in
accessing their place of work. Using 2014 Meshblock data supplied by Adelaide City Council the
number of employees within a 300m catchment of each subject route was calculated.
The three CityLINK routes were overlayed on maps supplied by the Adelaide City Council with 300m
buffers. The data inside of the buffers were then counted for each route. Only survey blocks fully
within, or their majority, were included in the assessment.
For consistency, data within a 300m catchment of North Terrace were included for all CityLINK options.
Confidence Scale Level: B
As displayed in Figure 13, Option A’s alignment through the significantly residential south-east of the
CBD means that in total and per route kilometre there are less jobs compared to Options B and C.
Options B and C are both closely aligned with the commercial core of the CBD, therefore servicing
more populous employment hubs. Option C is the best performer with 1,282 additional jobs per
kilometre and 2,571 additional jobs in total when compared to Option B.
Figure 13: Employment location and density
Route Option Summary Score
CityLINK A 300m catchment jobs: 58,084
300m catchment density per km: 8,479 1
CityLINK B 300m catchment jobs: 63,144
300m catchment density per km: 10,087 2
CityLINK C 300m catchment jobs: 65,715
300m catchment density per km: 11,369 3

CityLINK
Multi-Criteria Analysis Detail Report
31
2.1.5 Number of residents within a 300m catchment that work in the Adelaide CBD
The number of people working in the Adelaide CBD that live within a 300m catchment of each route
option was calculated using 2011 ABS Census data by SA1 for resident location and SA2 for
employment location. Data was clipped and exported using GIS to obtain a total.
Each population was also divided by the route length to show the population density per km of that
option, highlighting which option provides the greatest city workforce per km of track.
Confidence Scale Level: B
As shown in Figure 14, Option A has the highest number of Adelaide CBD employees within a 300m
catchment. Due to Option A’s alignment through the well-populated residential area in the south-east
of the Adelaide CBD it captures 174 additional employees per kilometre compared to Option B and 46
more than Option C. Therefore, Option A rates highest for this measure.
Figure 14: Catchment population employed in the Adelaide CBD.
Route Option Summary Score
CityLINK A 300m catchment Adelaide city employees: 2,713
300m catchment density per km: 574 3
CityLINK B 300m catchment Adelaide city employees: 1,657
300m catchment density per km: 400 1
CityLINK C 300m catchment Adelaide city employees: 2,191
300m catchment density per km: 528 2

CityLINK
Multi-Criteria Analysis Detail Report
32
2.2 Connect the city to the inner and middle suburbs, enhancing
access to activity centres, employment, education, healthcare,
entertainment and other opportunities
2.2.1 Number of people residing within a 300m catchment
The population of each route option’s 300m catchment was calculated using 2011 ABS Census data by
Meshblock (the smallest collection area). Using GIS, data was clipped to a 300m catchment,
representing a reasonable walking distance to light rail, before being exported to obtain a total.
Each catchment population was also divided by the route length to show the population density per
km, highlighting which option provides the greatest population per km of track.
Confidence Scale Level: B
As displayed in Figure 15, each route option passes through areas with varying population densities.
This is reflected in the 300m catchment population density for each route, whereby Option B’s
alignment through the central CBD does not capture areas of significant residential population when
compared to potions A and C. Per kilometre of route, Option A contains a mere 22 additional persons
when compared to Option C and 1,307 persons overall. Therefore, Options A is rated highest for this
measure.
Figure 15: Route population density.
Route Option Summary Score
CityLINK A 300m catchment resident population: 9,941
300m catchment density per km: 2,102 3
CityLINK B 300m catchment resident population: 6,633
300m catchment density per km: 1,602 1
CityLINK C 300m catchment resident population: 8,634
300m catchment density per km: 2,080 2

CityLINK
Multi-Criteria Analysis Detail Report
33
2.2.2 Number of tertiary students within a 300m catchment
The number of tertiary students residing within a 300m catchment of the potential routes was
obtained through 2011 ABS census data at SA1 level. Using GIS, this data was clipped to a 300m buffer
around the potential routes to determine possible patronage levels of tertiary students.
While the ABS is a reliable source and this data is likely to be indicative of current trends, the collection
dates of such data could inflict upon the validity of this count as those who were attending a tertiary
institution in 2011 may have completed their studies at the time of this assessment.
Confidence Scale Level: B
Similar numbers of tertiary students within a 300m catchment of Option A and Option C are noted.
Option C captures 80 additional students per kilometre and an extra 36 students overall when
compared to Option A. Option B has 520 fewer students overall compared to Option A and 52 less per
kilometre of track making it the lowest performer of this measure.
Figure 16: number of tertiary students
Route Option Summary Score
CityLINK A 300m catchment tertiary students: 2,435 students
300m catchment density per km: 515 students 3
CityLINK B 300m catchment tertiary students: 1,915 students
300m catchment density per km: 463 students 2
CityLINK C 300m catchment tertiary students: 2,471 students
300m catchment density per km: 595 students 3

CityLINK
Multi-Criteria Analysis Detail Report
34
2.2.3 Number of persons employed within a 300m catchment
The number of employees working within a 300m catchment of the potential routes was obtained
through 2011 ABS census data at SA1 level. This was then clipped to a 300m buffer around the
potential routes to determine possible patronage levels of the working population.
While the ABS is a reliable source and this data is likely to be indicative of current trends, the collection
dates of such data may inflict upon the validity of this count.
Confidence Scale Level: B
Each of the three CityLINK options differ in the number of employed residents within a 300m
catchment. It is clear that Option B captures fewer employed residents due to its alignment which
avoids significant residential areas towards the south-east of the CBD. Options A and C capture a more
significant number of employed residents, however Option A performs best by capturing the highest
number of employees in total and per kilometre of route.
Figure 17: Number of Employed Residents
Route Option Summary Score
CityLINK A 300m catchment employed residents: 4,717 employees
300m catchment density per km: 997 employees 3
CityLINK B 300m catchment employed residents: 2,939 employees
300m catchment density per km: 710 employees 1
CityLINK C 300m catchment employed residents: 3,807 employees
300m catchment density per km: 917 employees 2

CityLINK
Multi-Criteria Analysis Detail Report
35
2.3 Reduce transport disadvantage and social severance.
2.3.1 Number of households without a motor vehicle within a 300m catchment
This measure highlights transport disadvantage as a result of either choice or circumstance.
Households without a private motor vehicle rely more heavily on public transport to access services,
jobs, goods and leisure opportunities.
Data was extracted from the ABS 2011 Census, via Table Builder at the SA1 level. Using GIS, this data
was then clipped to each of the routes 300m catchments and the total number calculated. Only SA1’s
fully within, or their majority, were included in the assessment.
Confidence Scale Level: B
Option B has the lowest number of households without a motor vehicle within a 300m catchment of
the proposed route. While Options A and C are home to a similar number of households without motor
vehicles in total, per route kilometre, Option C shows the most benefit. Due to minimal differences in
numbers, Options A and C are rated equally for this measure.
Figure 18: Houses without a motor vehicle.
Route Option Summary Score
CityLINK A Dwellings without a motor vehicle: 1,486
Average per km: 314 2
CityLINK B Dwellings without a motor vehicle: 1,087
Average per km: 263 1
CityLINK C Dwellings without a motor vehicle: 1,544
Average per km: 372 2
CityLINK
Multi-Criteria Analysis Detail Report
36
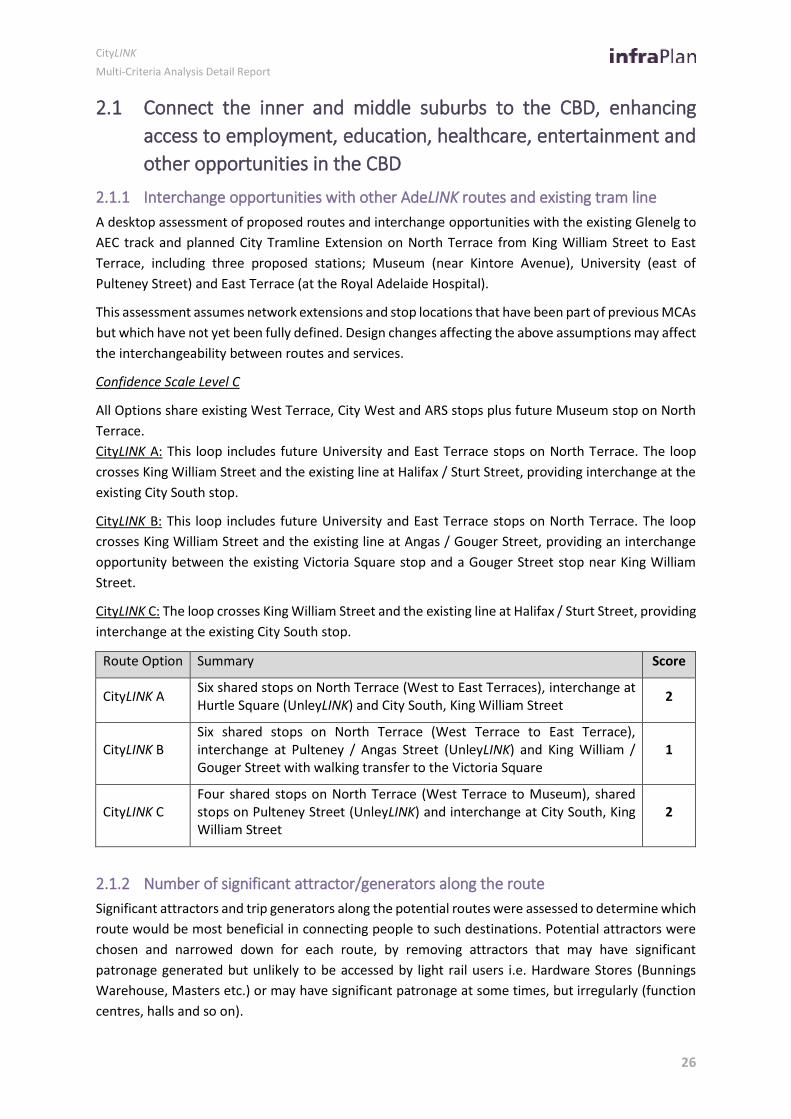
2.3.2 Average SEIFA 'relative disadvantage' score of residents within a 300m catchment
The Socio-Economic Indexes for Areas (SEIFA) is an amalgamation of data compiled by the ABS ranking
areas in Australia according to relative socio-economic disadvantage. It is commonly applied to
identify a community’s socio-economic standing, based on a number of Census variables (including:
employment status, level of education and income). A higher score on the SEIFA index means a lower
level of disadvantage, while a lower score means a higher level of disadvantage.
The most frequently applied SEIFA index is the Index of Relative Socio-Economic Disadvantage, which
includes the broadest range of social disadvantage indicators and summarises a range of information
about the economic and social conditions of people and households within an area (geographies at
SA1 level). This is the index applied for this analysis with scores averaged over 300m catchments.
Confidence Scale Level: B
While there is only 20 SEIFA point separating Option A (highest average score) and Option C (lowest
average score) this is a notable difference when comparing a small geographical area such as the
Adelaide CBD. As Option C has the lowest average SEIFA score of the three options, there is greater
potential for disadvantage to be addressed through improved transport infrastructure. Option C
therefore scores highest for this measure.
Figure 19: SEIFA relative disadvantage scores.
Route Option Summary Score
CityLINK A Average SEIFA score: 995.20 1
CityLINK B Average SEIFA score: 989.25 1
CityLINK C Average SEIFA score: 975.13 2

CityLINK
Multi-Criteria Analysis Detail Report
37
3 Theme 3: Integrated transport
Providing an efficient public transport system that moves more
people, more reliably, more often.

CityLINK
Multi-Criteria Analysis Detail Report
38
3.1 Improve the customer’s perception of the public transport
experience, including safety, frequency of services and reliability.
3.1.1 Ratio of shared running lanes versus separated running lanes
A desktop assessment of likely in-road track arrangement and traffic lane allowance based on aerial
photography assessment of existing road width and lane provision. For the purpose of maximising
service efficiency and reliability, separated running is preferred to shared running. Loss of medians,
followed by changes to on-street parking is preferred over loss of lane availability and vehicle capacity.
This assessment considers the total loop, including any parts of North Terrace.
Loop lengths and percentages are given for the total loop, including existing and planned track
portions on North Terrace. Applied loop lengths are as follows:
Route Option CityLINK A CityLINK B CityLINK C
Length (km) 6.85 6.26 5.78
Data source: Desktop assessments of existing road cross sections, lane arrangements and road
furniture.
As potential designs and cross sections have not yet been undertaken for CityLINK, some assumptions
have been made. Future investigations and geometric design is likely to result in some variation from
the assumed arrangements assessed here. Due to the degree of assumption and unknown design
detail both routes are assumed to use shared running.
Confidence Scale Level: C
CityLINK A:
Street / section Shared / separated Distance (km)
East Terrace / Hutt Street separated 1.28
Halifax / Sturt Street shared 1.53
Whitmore Square separated 0.21
Morphett Street separated 0.64
Light Square separated 0.18
Currie Street separated 0.50
West Terrace separated 0.30
Total 4.63.km

CityLINK
Multi-Criteria Analysis Detail Report
39
CityLINK B:
Street / section Shared / separated Distance (km)
East Terrace / Hutt Street separated 0.99
Angas / Gouger Street (Hutt Street to Victoria
Square)
separated 1.11
Angas / Gouger Street (Victoria Square (west) to
Morphett Street)
shared 0.53
Angas / Gouger Street (Morphett Street to West
Terrace)
separated 0.55
West Terrace separated 0.96
Total 4.14km
CityLINK C:
Street / section Shared / separated Distance (km)
Pulteney Street separated 1.24
Halifax / Sturt Street shared 0.97
Whitmore Square separated 0.21
Morphett Street separated 0.64
Light Square separated 0.18
Currie Street separated 0.50
West Terrace separated 0.30
Total 4.03km
Route Option Summary Score
CityLINK A 67% separated, 33% shared 1
CityLINK B 87% separated, 13% shared 3
CityLINK C 76% separated, 24% shared 2

CityLINK
Multi-Criteria Analysis Detail Report
40
3.1.2 Levels of competing traffic: traffic volumes along route (existing)
Traffic volumes have been assessed along the selected routes: traffic volumes have the potential to
impact on the travel time of trams, and therefore making it a less viable travel option. Corridors with
higher traffic volumes attract a lower comparative rating. Numbers are displayed as vpd (vehicles per
day).
Data source: supplied by Adelaide City Council: derived from various sources (2014-2015) and SCATS
data (2015-2016)
Confidence Scale Level: A
Given the 'loop function' of CityLINK, the tram route would incorporate different roads with varied
traffic volumes: this makes a direct comparison of routes ambiguous (as opposed to the comparison
of two linear and parallel routes). Some comparative sections between options can be reflected, such
as:
- north-south comparison of Option C on Pulteney Street and Options A and B on Hutt Street:
given Pulteney Street carries more traffic, Options A and B could be preferred for this
section.
- east-west comparison of Option B on Angas/Gouger Streets and Options A and C on
Halifax/Sturt Street: given Gouger Street carries more traffic, Options A and C could be
preferred for this section.
- North-south comparison of Option B on West Terrace, and Options A and C on Morphett
Street: West Terrace carries a significant traffic volume, therefore Option A and C could be
preferred for this section.
Overall, Option A incorporates the most routes with lower traffic volumes (namely Halifax Street/Sturt
Street), incorporates less running on West Terrace which has significant traffic volumes (in comparison
to Option B) and is therefore the route option that could have the least impact on travel times of
trams.
Route Option
Summary Score
CityLINK A
18,900 vpd on East Terrace (between Rundle Road and Grenfell Street), 20,800 vpd on Hutt Street (between Pirie Street and Flinders Street), 19,300 vpd on Hutt Street (between Angas and Halifax Street), 4,400 vpd on Halifax Street (between Hutt Street and Pulteney Street), 6,400 vpd on Halifax Street (between Pulteney Street and King William Street), 5,500 vpd on Sturt Street (between King William Road and Whitmore Square), 11,300 vpd on one-way section of Whitmore Square, 22,500 on Morphett Street (between Gouger Street and Franklin Street), 16,700 vpd on Light Square (one-way section north), 21,700 on Currie Street (between Light Square and West Terrace), 42,600 vpd on West Terrace (between Currie Street and Hindley Street.
-1
CityLINK B
18,900 vpd on East Terrace (between Rundle Road and Grenfell Street), 20,800 vpd on Hutt Street (between Pirie Street and Flinders Street), 19,300 vpd on Hutt Street, 7,300 vpd on Angas Street (between Hutt and Frome), 8,700 vpd on Angas Steet (between Pulteney and King William), 12,700/14,00 vpd on Gouger Street (between King William and Morphett Street), 12,000 vpd on Gouger Street between Morphett Street and West Terrace, 62,900 vpd on West Terrace (between Grote Street and Waymouth
-2

CityLINK
Multi-Criteria Analysis Detail Report
41
Street, 52,600 vpd on West Terrace (between Waymouth Street and Currie Street, 42,600 vpd on West Terrace (between Currie Street and Hindley Street.
CityLINK C
21,900 vpd on Pulteney Street (between Rundle and Grenfell), 27,500 vpd on Pulteney Street (between Flinders Street and Wakefield Street), 29,200 vpd on Pulteney Street (between Angas and Carrington Streets), 6,400 vpd on Halifax Street (between Pulteney Street and King William Street), 5,500 vpd on Sturt Street (between King William Road and Whitmore Square), 11,300 vpd on one-way section of Whitmore Square, 22,500 on Morphett Street (between Gouger Street and Franklin Street), 16,700 vpd on Light Square (one-way section north), 21,700 on Currie Street (between Light Square and West Terrace), 42,600 vpd on West Terrace (between Currie Street and Hindley Street.
-2

CityLINK
Multi-Criteria Analysis Detail Report
42
3.2 Least direct road impacts including movement of traffic, freight
3.2.1 Volume to capacity ratio (v:c) of the road route
Scoring favours those roadways with a lower volume to capacity ratio. This is a proxy measure of
congestion levels where a road with V:C ratio = 1.0 is operating at maximum capacity and therefore
heavily congested. Roads with a lower V:C ratio (i.e. up to 1.0) will receive a higher score.
Projection of future traffic impact is not possible at this stage as transport modelling has not been
undertaken for the full range of AdeLINK route options. The transport projections include only the
links as shown in ITLUP and therefore can only be used to assess impacts from those routes, thus
comparative impacts are difficult to assess.
Outputs from DPTI’s strategic transport model (MASTEM) for 2016 have been used. This data provides
an indication of the V:C ratio for each section of the corridors. AM Peak traffic assessed for traffic lanes
on all routes.
Confidence Scale Level: C
Option A: The V:C ratio on East Terrace is 0.45, increasing to 0.59 and 0.61 on Hutt Street. The ratio
falls on the eastern section of Hallifax Street to 0.19 before rising to 0.54 on the approach to Pulteney
Street. Sturt Street has a V:C of 0.48 before increasing to 0.67 on the one-way section of Whitmore
Square. Morphett Street has a relatively high V:C of 1.09, before dropping slightly to 0.96 on Currie
Street. West Terrace (between Currie Street and Hindley Street) has a V:C of 0.51.
Option B: The V:C ratio on East Terrace is 0.45, increasing to 0.59 on Hutt Street. Angas Street (east)
has a V:C of before rising to 0.52 on Angas Street (west). Gouger Street has a V:C ratio of 0.67 on
Gouger Street before dropping to 0.6 n the approach to West Terrace. West Terrace V:C ration
decrease from south to north along West Terrace, from 0.58 to 0.51 between Currie Street and Hindley
Street.
Option C: The northern section of Pulteney Street has a V:C ratio of 0.85, increasing to 0.98 between
Flinders Street and Wakefield Street before decreasing to 0.93 on the approach to Halifax Street.
Halifax Street has a V:C ratio of 0.54. Sturt Street has a V:C of 0.48 increasing to 0.67 on the one-way
section of Whitmore Square. Morphett Street has a relatively high V:C of 1.09, before dropping slightly
to 0.96 on Currie Street. West Terrace (between Currie Street and Hindley Street) has a V:C of 0.51
It is noted that any impacts may be addressed through detailed design at a later stage.
Route Summary Score
CityLINK A The V:C ratio (AM peak) indicate that Morphett Street and Currie Street are currently nearing or at capacity, therefore trams corridors may impact further on these roads carrying capacity.
-1
CityLINK B Gouger Street has the highest V:C ratio (AM peak) along this route, but still has capacity.
0
CityLINK C The V:C ratio (AM peak) indicate that Morphett Street, Currie Street and Pulteney Street are currently nearing or at capacity, therefore trams corridors may impact further on these roads carrying capacity.
-2

CityLINK
Multi-Criteria Analysis Detail Report
43
3.2.2 Scale of impacts to commercial and emergency vehicle access and mobility
A desktop assessment of access points, driveways and emergency services locations and primary
routes to determine impacts resulting from possible roadway changes along proposed CityLINK routes.
This assessment documents existing capability for right turn and crossing movements on the proposed
routes other than at signalised intersections. Where tram lines are assumed to be separated from
other traffic, it is assumed that these crossing or turning movements would be prohibited or
signalised. Where shared running is used, some bans and/or restrictions (eg peak period bans) may
be put in place.
Emergency vehicle access routes are assumed to provide direct links from hospitals with emergency
departments, city Police stations and the SA Metropolitan Fire Service to the main arterial routes
through the parklands surrounding the City of Adelaide. These routes, hospitals, fire and police
stations are identified in Figure 20.
In the absence of concept designs, assumptions have been made about alignments, road closures and
access restrictions. This is a design consideration that will require detailed investigation at future
stages. Changes to routes, typical arrangements and alignments may affect the impacts assessed here.
Existing and planned tracks on North Terrace in front of the Royal Adelaide and New Royal Adelaide
Hospitals shows there is no inherent incompatibility between trams and emergency service vehicle
access. Separated tramlines can provide improved access for emergency vehicles as they are
permitted to use the tram lanes for emergency access, removing them from general traffic lanes and
thus avoiding traffic congestion.
Confidence Scale Level D
Figure 20: Emergency service locations

CityLINK
Multi-Criteria Analysis Detail Report
44
Separated running in a central alignment limits shopfront impacts but restricts turning movements,
altering the route taken to access shopfronts. The impact is greatest where roadways currently have
no restrictions. Hutt Street and West Terrace are already heavily restricted as is Halifax Street between
Pulteney and King William Streets. Some streets are expected to utilise shared running which does not
prohibit turning movements but may impose restrictions, such as banning turns during peak hour, to
minimise delays to tram services.
Emergency vehicle access beyond the city is unlikely to be significantly impacted by any of these
options. Limitations within the city are likely to be limited to the loop route, mainly during the
construction phase. If separated running permits Emergency vehicles to access tram lanes as is
currently the case, movement within the city may actually be enhanced in some cases.
Route Summary Score
CityLINK A
Impacts to Morphett Street (both business and residential towers), bus access on Currie Street and traffic disruptions around the squares are the major points. Halifax Street works will alter traffic movements in an area that already has imposed traffic restrictions.
-1
CityLINK B
Changes in access for businesses and the public to the Central Market and surrounding businesses will be a significant design challenge for this route. Use of West Terrace avoids difficulties through Morphett Street and the Squares.
Impacts to access at the future Wakefield Calvary hospital, allowances can be made to track construction.
-1
CityLINK C
Pulteney Street running will significantly change traffic behaviour and permissions in this street, though direct street access points are limited. Impacts to Morphett Street (both business and residential towers), bus access on Currie Street and traffic disruptions around the squares are the major points. Halifax Street works will alter traffic movements in an area that already has imposed traffic restrictions.
-2

CityLINK
Multi-Criteria Analysis Detail Report
45
3.3 Least direct impacts on severance for pedestrians and cyclists.
It is critical that the design of the tram route incorporates a high level of amenity and permeability for
walking and cycling in the city, and any potential adverse impacts and mitigated.
Potential adverse impacts to cyclists and pedestrians that may result from a tram corridor can include:
Tram infrastructure may reduce road crossing opportunities and/or form tripping hazards
restrictions into/out of side streets may reduce permeability;
the road reserve width may be insufficient to accommodate trams as well as bicycle lanes and
sufficient footpath widths;
pedestrian waiting times at traffic signals could be increased.
Cycle route crossings that are at signalised intersections were not assessed because it is unlikely that
traffic movements at these locations would be affected. It is expected that bicycle lanes would be
retained or upgraded as part of the tram corridor design, but this cannot be confirmed until future
planning is undertaken. Therefore, if a tram route shares an existing cycle route it is assumed that
there are potential impacts at this stage.
3.3.1 Number of times the route crosses over a bike route
To determine the number of times a CityLINK route option crosses a BikeDirect cycling route, the three
route options were overlayed onto the Adelaide CBD BikeDirect Network (refer Figure 21). The route
options were also overlayed onto the future Bikeways Network from the Adelaide City Council
SmartMove Strategy 2012-2022 (refer Figure 22). The number of times a subject tram route crosses
over an existing or future cycling route was then counted.
Confidence Scale Level: C
Figure 21: DPTI BikeDirect cycling network overlayed with CityLINK options

CityLINK
Multi-Criteria Analysis Detail Report
46
Figure 22: Future City Bikeways Network (ACC SmartMove) overlayed with CityLINK options
Option A and C scored lower than Option B as it crosses additional north-south cycling routes without
traffic signals. Of particular note is the contra-flow route that links the Rugby Street Bikeway to the
Frome Street Bikeway. Options A and C crossed the contra-flow route that connects South Terrace to
the Central Market.
Route Summary Score
CityLINK A 4 cyclist crossings possibly affected. Currie St/Elizabeth St; Sturt St/Whitmore Square; Sturt St/Russell St; Halifax St/Castle St/Regent St South.
-2
CityLINK B 2 crossings possibly affected. West Tce/Waymouth St; Gouger St/Compton St
-1
CityLINK C 3 crossings possibly affected. Currie St/Elizabeth St; Sturt St/Whitmore Square; Sturt St/Russell St.
-2

CityLINK
Multi-Criteria Analysis Detail Report
47
3.3.2 Impact on or ability to retain bike routes along the tram route
The impact to the cycle routes along each corridor will be determined by the final design. It is likely
that shared vehicle/tram lanes would have less impacts on the cycle lanes, however in some cases
separated lanes may require additional road width that could have implications for cycle lanes and/or
car parking depending upon road width and configuration. It is assumed that on Major Cycling Routes,
the bicycle lanes would be retained or upgraded as part of the corridor design. This will need to be
confirmed as part of future planning stages.
The impacts or ability to retain cycling routes along the CityLINK rote options was assessed using the
outputs of measure 3.3.1 ‘Number of times the route crosses over a bike route’.
Confidence Scale Level: B
Option B has less impacts to existing cycle routes due to the long length of off-road shared path along
West Terrace, and that there are no existing cycle lanes on Gouger Street.
Route Summary Score
CityLINK A
Shared path along West Terrace (280m) - not impacted.
Currie Street is not a cycle route – not impacted.
Morphett Road & Whitmore Square has existing cycle lanes (1300m) – potential impacts.
Sturt St/Halifax Street has existing cycle lanes (1600m) and is on the ACC future Bikeways network – potential impacts.
Hutt St has existing cycle lanes south of Grenfell St (980m) – potential impacts.
Total length impacted = 4160m
-2
CityLINK B
Shared path along West Terrace (950m) - not impacted.
Gouger Street does not have bicycle lanes (it is identified by ACC as a ‘possible alternative Bikeways route’ - as it is a ‘possible alternative’, it is not included at this stage).
Angas Street has existing bicycle lanes (1000m) – potential impacts.
Hutt St has existing cycle lanes south of Grenfell St (700m) – potential impacts.
Total length impacted = 2650m
-1
CityLINK C
Shared path along West Terrace (280m)- not impacted.
Currie Street is not a cycle route – not impacted.
Morphett Road & Whitmore Square has existing cycle lanes (1300m) – potential impacts.
Sturt St/Halifax Street has existing cycle lanes (1000m) and is on the ACC future Bikeways network – potential impacts.
Pulteney Street has existing cycle lanes (1200m) – potential impacts.
Total length impacted = 3780m
-2

CityLINK
Multi-Criteria Analysis Detail Report
48
3.3.3 Number of times the tram route crosses an Active City Pedestrian Link
The Active City Pedestrian Links are identified in the ACC SmartMove Strategy as prioritised walking
routes to key destinations (refer to Figure 23). These streets are planned for footpath widening to
accommodate pedestrian demand, improve walking conditions, comply with DDA requirements and
increase safe road crossings.
Given the city environment and signalised crosswalks at intersection, pedestrian severance would
likely only occur mid-block or at unsignalised junctions. Therefore, the impacts to severance of
walkability was assessed by overlaying the CityLINK options onto the Active Cross City Links.
Confidence Scale Level: B
Figure 23: Proposed north-south pedestrian 'active' cross-city links (ACC SmartMove) overlayed with CityLINK options
Option A has the most potential impacts to the active city pedestrian links. Note that where pedestrian
links cross a tram route at a signalised intersection, it is assumed that there will not be any impacts
and this crossing is therefore not counted.
Route Summary Score
CityLINK A 5 crossings possibly affected. Currie St/Elizabeth St; Sturt St/Russell St; Halifax Street/Surflen St; Halifax St/Castle St/Regent St; Halifax St/Cardwell St
-2
CityLINK B 3 crossings possibly affected Gouger St/Lowe St; Gouger St/Compton St; Angas St/Moore St/Chancery Ln.
-1
CityLINK C 3 crossings possibly affected. Currie St/Elizabeth St; Sturt St/Russell St; Halifax Street/Surflen St.
-1

CityLINK
Multi-Criteria Analysis Detail Report
49
3.3.4 Number of pedestrian refuges or crossings impacted (requiring removal)
The methodology to determine the number of pedestrian refuges and crossings possibly requiring
removal primarily involved a desktop analysis through digital inspection. High resolution satellite
imagery was utilised to count the number of median refuges and pedestrian actuated crossings
(PAC’s). Signalised intersections were not included because it is assumed that they would be retained.
The higher the number of pedestrian crossings reflects the higher level of pedestrian activity. It is
assumed that the design of the tram route would improve pedestrian amenity, accessibility and
permeability and this is reflected in the scoring. It was considered that some routes would be
improved for pedestrian cross-ability with the installation of pedestrian crossings at tram stops.
The rating was determined at the discretion of Urban Design Professionals using their judgement, but
there may be a lack of detail and overall analysis to warrant an accurate impact of the removal of
pedestrian crossing and refuges in some areas.
Confidence Scale Level: D
In comparison to Options B and C, Option A has the highest aggregate number of pedestrian refuges
that may require removal or be impacted by tram implementation. It is likely that some existing
crossings may not be impacted, but improved through design and the location of stops.
As each option has a similar number of pedestrian crossing locations that could be impacted, and due
to the low confidence rating of this data, each option scores -1 to reflect a potential degree of impact.
Route Option Summary Score
CityLINK A Pedestrian actuated crossings: 0
Pedestrian refuges: 12
Total: 12
-1
CityLINK B Pedestrian actuated crossings: 2
Pedestrian refuges: 5
Total: 7
-1
CityLINK C Pedestrian actuated crossings: 0
Pedestrian refuges: 8
Total: 8
-1

CityLINK
Multi-Criteria Analysis Detail Report
50
3.4 Ability to integrate with and/or replace current public transport
services (including bus, train, O-Bahn)
3.4.1 Interchange opportunities with Adelaide Metro Bus and Train services
A desktop assessment of proposed routes and interchange opportunities with existing bus routes and
stop locations. It is assumed that when concept and detailed designs for a CityLINK loop service are
developed, that bus stop locations will be considered to enhance connectivity and provide interchange
opportunities between modes. This assessment assumes that wherever services intersect, an
interchange opportunity is available.
Interchangeability between bus and tram services is affected by proximity of bus and tram stop
locations. Tram stops for the proposed City loop services are have not been defined and construction
of a City loop track is likely to affect locations of existing bus stops, particularly where services run
parallel. Therefore, this is an issue for major consideration throughout future design stages. Concept
and detailed design stages will need to consider relocation of bus stops to provide the best
interchange opportunities while preventing bottlenecks at new tram stops.
Confidence Scale Level D
All bus routes in or out of the city will cross or run parallel to all CityLINK loop route options at some
point. Location of tram stops near intersections with crossing routes will provide interchange
opportunities for passengers on these services, particularly where bus stops are in close proximity.
Shared routes provide ideal interchange opportunities if bus stops are located close to tram stops.
Train services are already well integrated with tram services via the Adelaide Railway Station stop on
North Terrace. All CityLINK loop options include this stop.
North Terrace (east of King William Street), East Terrace / Hutt Street, Halifax / Sturt Street, and parts
of Morphett Street are currently serviced by the 98 (City & North Adelaide) and 99 (City Connector)
Free City Connector services.
North Terrace (east of King William Street), East Terrace / Hutt Street, Halifax / Sturt Street, and parts
of Morphett Street are currently serviced by the 98 (City & North Adelaide) and 99 (City Connector)
free loop services.

CityLINK
Multi-Criteria Analysis Detail Report
51
Figure 24: 98 and 99 City Connector loop service map
CityLINK A: This route shares North Terrace, East Terrace, Hutt Street, Morphett Street and Currie
Street with existing bus services and stops. This route option also crosses Pulteney and King William
Streets which are Public transport routes.
The Clarendon Street terminus, on the north-eastern corner of the Currie Street / Clarendon Street
intersection is the only bus terminus and stabling facility within the city. Buses currently access the
facility from Currie Street. A sheltered, bus-only, right turn lane is provided in the median for west-
bound buses, this access would be negatively affected by a tram route in this roadway.
CityLINK B: This route shares North Terrace, East Terrace, Hutt Street, and West Terrace with existing
bus services and stops. Gouger and Angas Streets do not currently carry public transport services but
the proposed route crosses Pulteney, King William and Morphett Streets which are Public transport

CityLINK
Multi-Criteria Analysis Detail Report
52
routes. Though not a direct parallel to the existing 99 service, this tram loop may affect this route
while providing numerous intersection points with the 98 service. Interconnecting, rather than
duplicating city connector routes provides better city coverage than the current services.
CityLINK C: This route shares North Terrace, Pulteney Street, Morphett Street and Currie Street with
existing bus services and stops. This route option also crosses King William Street which is a Public
transport route.
The Clarendon Street terminus, on the north-eastern corner of the Currie Street / Clarendon Street
intersection is the only bus terminus and stabling facility within the city. Buses currently access the
facility from Currie Street. A sheltered, bus-only, right turn lane is provided in the median for west-
bound buses, this access would be negatively affected by a tram route in this roadway.
Route Option Summary Score
CityLINK A Intersects or runs parallel to all city bus routes, includes ARS stop, likely to impact the 99 City Connector bus service. Major impacts to bus access to Clarendon Street terminus.
0
CityLINK B Intersects or runs parallel to all city bus routes, includes ARS stop. May impact the 99 City Connector bus service.
1
CityLINK C Intersects or runs parallel to all city bus routes, includes ARS stop, likely to impact the 99 City Connector bus service. Major impacts to bus access to Clarendon Street terminus.
0

CityLINK
Multi-Criteria Analysis Detail Report
53
3.5 Impact on the current network role and function (e.g. freight
routes versus commuter routes)
3.5.1 Alignment (or conflict) with the route role and function
Alignment (or conflict) with the route role and function: ‘Transport corridors’ are required to serve
more than one transport function. Roads are not all the same. While many roads look similar, each
road needs to provide its own specific function (or combination of functions) depending on its location
in the transport network, the type and volume of users and the adjacent land use. The land use and
urban design along these corridors has significant implications on the role and function of the corridor
and highlights the importance of integrated land use/transport planning. The Department of Planning,
Transport and Infrastructure defines the role and function of transport corridors in A Functional
Hierarchy for South Australia’s Land Transport Network. However, this Functional Hierarchy (used in
the assessment for the suburban routes) has not been applied to the Adelaide City Council, therefore
the assessment for the CityLINK routes utilises the Adelaide Design Manual street typologies and the
Smart Move Strategy link and place classifications (future link and place reflecting a 30 year vision).
Data source: Adelaide City Council resources: Adelaide Design Manual (2016) and Smart Move Strategy
(2012)
Confidence Scale Level: C
Neither the Adelaide Design Manual or the Smart Move Strategy typologies explicitly define the routes
for trams, therefore professional judgement has been applied as to how a tram corridor would
accord/conflict with these typologies/classifications. None of the tram route options for CityLINK
appear to significantly align or conflict with the street typology descriptions in the Adelaide Design
Manual or the Smart Move Strategy future 'links' as described in the 'Link and Place'. Where there
appears to be a degree of alignment, (such as with Retail Streets or Boulevards) each option has
benefits that another does not, therefore all options for this measure appear equally beneficial.
Figure 25: Hierarchy: Adelaide Design Manual street typologies

CityLINK
Multi-Criteria Analysis Detail Report
54
Figure 26: Smart Move Strategy link classification (reflecting future traffic volumes)
Hierarchy: Adelaide Design Manual street typologies
Option A Option B Option C
Boulevards (Gateway): Gateway Boulevards should "accommodate all modes of travel" and "and integrated public transport amenities.". It should be noted that the current tram network in the City operate on Boulevard (ceremonial and gateway) street typologies, therefore it can be assumed that future tram corridors in the city may accord with this street type. The current tram routes through on the southern section of King William Road predominantly operates on Gateway Boulevards therefore a longer length of the CityLINK tram corridor for Option B on West Terrace would accord with current condition.
approximately 300m on West Terrace between North Tce and Currie Street
approximately 940m on West Terrace between North Tce and Gouger Street
approximately 300m on West Terrace between North Tce and Currie Street
Boulevards (Transit): As stated in the Adelaide Design Manual "Transit Boulevards define the spatial structure of the city and cater for high levels of public transport and pedestrian usage, due to their high frequency and turnover of transport services". Boulevard (Transit) currently operates as a bus transit boulevard, therefore servicing and route planning has the potential to be compromised with a tram route on Currie Street.
approximately 500m on Currie Street between West Tce and Light Square
none approximately 500m on Currie Street between West Tce and Light Square

CityLINK
Multi-Criteria Analysis Detail Report
55
Terraces (City): It is not explicit in the Adelaide Design Manual if tram corridors would align or conflict with tram corridors. Therefore this street typology is considered 'neutral' and none of the three options are considered
approximately 500m on East Tce between North Terrace and Bartels Road
approximately 500m on East Tce between North Terrace and Bartels Road
none
Retail Streets (high activity): Retail Streets (high activity) could benefit from tram corridors, specifically the CityLINK which has the potential to connect metropolitan areas to retail activities. Option B provides the longest length of this street typology with alignment of tram corridors.
none approximately 550m on Gouger Street between King William St and Morphett St
none
Retail Streets (local activity): Retail streets (local activity) could benefit from tram corridors, specifically the CityLINK which has the potential to connect local residential areas to local retail activities. Option A provides the longest length of this street typology with alignment of tram corridors.
approximately 800m on Hutt St between East Terrace and Halifax Street, and 950m on Sturt/Halifax between Whitmore Square and Hurtle Square
approximately 500m on Hutt St between East Terrace and Angas Street
approximately 950m on Sturt/Halifax between Whitmore Square and Hurtle Square
Streets (City): the Adelaide Design Manual describes Streets as ' Traditionally mixed use, Streets share a broad function from residential, commercial, retail and institutional and provide connection from the wider City' which seems to accord with tram corridors. Option C provides the longest length of this street typology with alignment of tram corridors.
approximately 630m on Morphett Street between Whitmore Square and Light Square
approximately 550m on Angas Street between Pulteney Street and King William Street
approximately 630m on Morphett Street between Whitmore Square and Light Square, and 1,250 on Pulteney Street between North Terrace and Halifax Street
Streets (Local) Approximately 550m on Halifax Street between Hutt Street and Pulteney Street
approximately 550m on Angas Street between Pulteney Street and Hutt Street, and 550m on Gouger Street between Morphett street and West Tce
none
Squares: street typology for Squares do not seem to align or conflict with the operating of trams from the definition of their role or function defined as "provide local identity, recreational opportunities and reflect the character and uniqueness of each location".
approximately 200m around Whitmore Square, and 200m around Light Square
none approximately 200m around Whitmore Square, and 200m around Light Square
Parklands (not applicable) none none none
Small Streets and Laneways (not applicable)
none none none

CityLINK
Multi-Criteria Analysis Detail Report
56
Smart Move Strategy link classification (reflecting future traffic volumes)
Option A Option B Option C
Metropolitan I (not applicable) none none none
Regional II: The Smart move strategy define "Regional Links" as "Carries traffic of regional-wide origin" which somewhat accords with tram corridors, and their ability to encourage travel mode shift. However, traffic not generated from tram catchments of metropolitan spurs of the AdeLINK network may conflict with the tram movements.
approximately 300m on West Terrace between North Tce and Currie Street
approximately 940m on West Terrace between North Tce and Gouger Street
approximately 300m on West Terrace between North Tce and Currie Street
District III: The Smart move strategy define "District Links" as "Carries traffic of district-wide origin" with an average distance travelled of 3km to 7km. This accords with metropolitan tram corridors, and their ability to encourage travel mode shift. However, traffic not generated from tram catchments of metropolitan spurs of the AdeLINK network may conflict with the tram movements.
approx 1300m on East Tce and Hutt Street between North Terrace and Halifax Street, and 1310m on Morphett Street, Light Square, and Currie Street from Whitmore Square to West Terrace
approx 990m on East Tce and Hutt Street between North Terrace and Angas Street
approx 1260m on Pulteney Street between North Terrace and Halifax Street, and 1310m on Morphett Street, Light Square and Currie Street from Whitmore Square to West Terrace
Neighbourhood IV: The Smart move strategy define "District Links" as "Carries traffic of neighbourhood-wide origin" with an average distance travelled of 1km to 3km. This accords with purpose of the CityLINK in distributing locally generated traffic through the CAB, and its ability to encourage travel mode shift for CBD residents and businesses.
approx 1780m on Sturt Street, Halifax Street and Whitmore Square between Hutt Street and Morphett Street
approx 2200m on Angas and Gouger Streets between Hutt Street and West Terrace
approx 1240m on Sturt Street, Halifax Street and Whitmore Square between Pulteney Street and Morphett Street
Local V (not applicable) none none none
MCA SCORES: 1 1 1
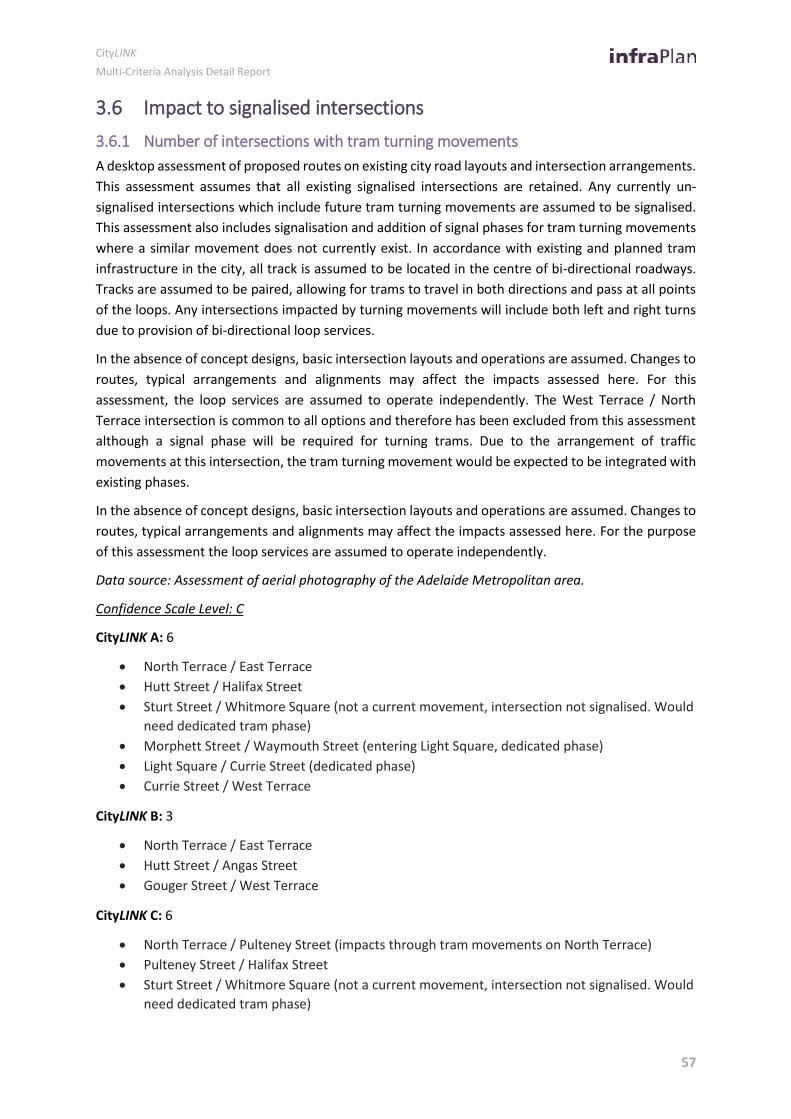
CityLINK
Multi-Criteria Analysis Detail Report
57
3.6 Impact to signalised intersections
3.6.1 Number of intersections with tram turning movements
A desktop assessment of proposed routes on existing city road layouts and intersection arrangements.
This assessment assumes that all existing signalised intersections are retained. Any currently un-
signalised intersections which include future tram turning movements are assumed to be signalised.
This assessment also includes signalisation and addition of signal phases for tram turning movements
where a similar movement does not currently exist. In accordance with existing and planned tram
infrastructure in the city, all track is assumed to be located in the centre of bi-directional roadways.
Tracks are assumed to be paired, allowing for trams to travel in both directions and pass at all points
of the loops. Any intersections impacted by turning movements will include both left and right turns
due to provision of bi-directional loop services.
In the absence of concept designs, basic intersection layouts and operations are assumed. Changes to
routes, typical arrangements and alignments may affect the impacts assessed here. For this
assessment, the loop services are assumed to operate independently. The West Terrace / North
Terrace intersection is common to all options and therefore has been excluded from this assessment
although a signal phase will be required for turning trams. Due to the arrangement of traffic
movements at this intersection, the tram turning movement would be expected to be integrated with
existing phases.
In the absence of concept designs, basic intersection layouts and operations are assumed. Changes to
routes, typical arrangements and alignments may affect the impacts assessed here. For the purpose
of this assessment the loop services are assumed to operate independently.
Data source: Assessment of aerial photography of the Adelaide Metropolitan area.
Confidence Scale Level: C
CityLINK A: 6
North Terrace / East Terrace
Hutt Street / Halifax Street
Sturt Street / Whitmore Square (not a current movement, intersection not signalised. Would
need dedicated tram phase)
Morphett Street / Waymouth Street (entering Light Square, dedicated phase)
Light Square / Currie Street (dedicated phase)
Currie Street / West Terrace
CityLINK B: 3
North Terrace / East Terrace
Hutt Street / Angas Street
Gouger Street / West Terrace
CityLINK C: 6
North Terrace / Pulteney Street (impacts through tram movements on North Terrace)
Pulteney Street / Halifax Street
Sturt Street / Whitmore Square (not a current movement, intersection not signalised. Would
need dedicated tram phase)

CityLINK
Multi-Criteria Analysis Detail Report
58
Morphett Street / Waymouth Street (entering Light Square, dedicated phase)
Light Square / Currie Street (dedicated phase)
Currie Street / West Terrace
Route Option Summary Score
CityLINK A 6 intersections with tram turning movements, including 2 new signal phases and 1 new signalised intersection
-2
CityLINK B 3 intersections with tram turning movements -1
CityLINK C 6 intersections with tram turning movements, including 2 new signal phases and 1 new signalised intersection
-2
3.6.2 Number of intersections with tram through movements
A desktop assessment of proposed routes on existing city road layouts and intersection arrangements.
This assessment assumes that all existing signalised intersections are retained. Any currently un-
signalised intersections which include future tram turning movements are assumed to be signalised.
This assessment also includes signalisation and addition of signal phases for tram turning movements
where a similar movement does not currently exist. In accordance with existing and planned tram
infrastructure in the city, all track is assumed to be located in the centre of bi-directional roadways.
Tracks are assumed to be paired, allowing for trams to travel in both directions and pass at all points
of the loops. Any intersections impacted by turning movements will include both left and right turns
due to provision of bi-directional loop services.
In the absence of concept designs, basic intersection layouts and operations are assumed. Changes to
routes, typical arrangements and alignments may affect the impacts assessed here. For the purpose
of this assessment the loop services are assumed to operate independently of suburban routes.
Data source: Assessment of aerial photography of the Adelaide Metropolitan area.
Confidence Scale Level: C
CityLINK A: 13 intersections affected
East Terrace / Rundle Road
East Terrace / Grenfell Street
East Terrace / Pirie Street
Hutt Street / Flinders Street
Hutt Street / Wakefield Street
Hutt Street / Angas Street
Halifax Street / Pulteney Street (Hurtle
Square)
Halifax Street / King William Street
Whitmore Square to Morphett St (not a
current movement, intersection not
signalised. Would need dedicated tram
phase)
Morphett Street / Gouger Street
Morphett Street / Grote Street
Morphett Street / Franklin Street
Currie Street / Gray Street
CityLINK B: 14 intersections affected
East Terrace / Rundle Road
East Terrace / Grenfell Street
East Terrace / Pirie Street
Hutt Street / Flinders Street

CityLINK
Multi-Criteria Analysis Detail Report
59
Hutt Street / Wakefield Street
Angas Street / Frome Street
Angas Street / Pulteney Street
Angas Street / King William Street
(Victoria Square)
Gouger Street / Morphett Street
West Terrace / Grote Street
West Terrace / Franklin Street
West Terrace / Waymouth Street (unless
restricted to left-in, left-out only. Not
currently signalised)
West Terrace / Currie Street
West Terrace / Hindley Street
CityLINK C: 12 intersections affected
Pulteney Street / Rundle Street
Pulteney Street / Grenfell Street
(Hindmarsh Square)
Pulteney Street / Pirie Street
Pulteney Street / Flinders Street
Pulteney Street / Wakefield Street
Pulteney Street / Carrington Street
Halifax Street / King William Street
Whitmore Square to Morphett St (not
a current movement, intersection not
signalised. Would need dedicated
tram phase)
Morphett Street / Gouger Street
Morphett Street / Grote Street
Morphett Street / Franklin Street
Currie Street / Gray Street
Route Option Summary Score
CityLINK A 13 intersections with tram through movements including one new signalised intersection
-2
CityLINK B 14 intersections with tram through movements including one potential new intersection (or access restriction)
-2
CityLINK C 12 intersections with tram through movements including one new signalised intersection
-2

CityLINK
Multi-Criteria Analysis Detail Report
60
4 Theme 4: Economic impacts
Supporting a modern and innovative city which provides investment
opportunities and return on property and infrastructure investment.

CityLINK
Multi-Criteria Analysis Detail Report
61
4.1 Patronage Potential (Revenue)
DPTI have provided patronage data for the 98 and 99 Free City Connector services, gathered by bus
drivers over a 15-day period in October 2016. This data shows average weekday patronage on the 99A
and 99C services to be a combined 883 passengers. Combined with 98A and C services, this daily
average over the sample period rises to 2,744 per day, however only 2,058 boarding’s are within the
city square, the remainder are made north of North Terrace. The data, while indicative, is over a very
short period and does not provide insight into destinations or interchange with other services.
Estimation of patronage based on residential catchment is not possible in the form applied to
suburban links. These assessments assumed the City as a destination and took a percentage of the
catchment based on journey to work and employment data. This data does not exist for the city in the
same format.
In addition, determining patronage on the loop service will require balancing against existing tram
services and makes assumptions about how suburban links interconnect and allow transfer of
passengers to access destinations, all of which is not only undefined at this stage but is also very
difficult to predict with any degree of accuracy or reliability.
The reader is therefore referred to the various measures that would be used in any patronage
calculations to be used as a proxy indicator of patronage potential for CityLINK loop options. These
include Criteria 1, 4, 5, 7 and 11.

CityLINK
Multi-Criteria Analysis Detail Report
62
4.2 Constructability and business impacts
4.2.1 Potential risks to underground services
A desktop analysis of underground services was conducted using the Location SA Map Viewer online
tool and focussing on underground services that would be affected by the assumed alignment of the
proposed CityLINK tram routes. This assessment includes services located in the centre of roadways
and within medians and services crossing the carriageway. This assessment does not include locations
of inspection and access pits or depth of service below ground. Service locations and impacts are
approximated only, full site surveys will be required to confirm detailed service locations and impact
assessment.
Data sources: Desktop assessment of underground services within the road reserves of each of the
routes using the Location SA web viewer at http://location.sa.gov.au/viewer/.
Precise location and condition of infrastructure is unknown and an engineering survey is required to
fully assess the impact of construction. Stormwater pipes are not included in this assessment as they
are not shown on Location SA web viewer.
Confidence Scale Level: C
Based on this desktop assessment, the scale of impacts for the three options assessed are similar, but
Option B impacts far less on SAPN infrastructure than other options.
Route Summary Score
CityLINK A
94 Crossings
2.2km Waste Water Gravity Mains
0.1km Water mains
2.1km SAPN transmission line
-2
CityLINK B
85 Crossings
2.5km Waste Water Gravity Mains
1.1km SAPN transmission line
-1
CityLINK C
108 Crossings
2.3km Waste Water Gravity Mains
0.1km Water mains
2.2km SAPN transmission line
-2

CityLINK
Multi-Criteria Analysis Detail Report
63
4.2.2 Count of businesses with street frontage to the route
The methodology to determine the number of businesses with a primary frontage along each route
option primarily involved a desktop analysis through digital inspection. High resolution satellite
imagery and ‘street view’ functions were utilised to count the number of businesses with an
immediate frontage to each route option. Where multiple businesses were thought to exist inside of
a single building, the number of business logos on the building was counted.
A higher count of businesses with a frontage along a CityLINK route is indicative of a higher level of
impacts and potential disruption during the construction phase.
The rating was determined due to lack of detail and overall analysis to warrant an accurate impact on
businesses during the construction phase.
Confidence Scale Level: D
Each CityLINK route option has a similar number of businesses that could potentially be disrupted
during construction. While Option C has slightly fewer businesses with a frontage to the route, lack of
detail regarding the impacts of construction result in all three options being scored equally.
Route Summary Score
CityLINK A Total businesses: 287 -1
CityLINK B Total businesses: 284 -1
CityLINK C Total businesses: 246 -1

CityLINK
Multi-Criteria Analysis Detail Report
64
4.2.3 Number of vehicle access points that could be impacted (e.g. laneways, driveways
etc.)
The importance of vehicular access to buildings and businesses varies depending on their use. Vehicle
access can be important for some residents, visitors, customers, business owners, deliveries, service
vehicles and so on who rely on private or commercial vehicles to some degree. Therefore, the number
of vehicle access points along each corridor option; comprising driveways, direct business access
points and no-through laneways (where there is no alternative entry point) were counted to ascertain
the total that may affected or obstructed as a result of each alignment option. This could include
temporary disruption during construction, as well as post-construction should vehicle turning
movements be restricted. This process was undertaken manually along the length of each option, via
digital inspection.
Confidence Scale Level: C
The number of access points to businesses and residential properties is similar for all CityLINK options.
While Option C has marginally less access points that could be potentially impacted compared to
options A and B. The number of business access points for Option B mean it is rated as having a greater
impact for this measure.
Route Summary Score
CityLINK A
Residential access points: 12
Business access points: 59
Laneways: 10
Total: 81
-1
CityLINK B
Residential access points: 7
Business access points: 69
Laneways: 11
Total: 87
-2
CityLINK C
Residential access points: 7
Business access points: 59
Laneways: 11
Total: 77
-1

CityLINK
Multi-Criteria Analysis Detail Report
65
4.3 Potential for property uplift and value capture
4.3.1 Property value uplift potential
The total development supportive area (refer measure 1.1.2 ‘Cubic metres of transit supportive zones
and policy areas that support increased development potential within a 300m catchment of the route’)
was used to calculate property uplift along each of the CityLINK corridors. The outputs from this
measure were then divided by 3.5 to reflect the assumed metres per storey and convert to floor areas
(m2 from m3). The current percent of retail/commercial and residential land uses (determined from
measure 1.2.4) were then applied to reflect the land uses which will benefit from property value uplift.
Overseas research into property uplift and value capture for light rail corridors was referred to
determine quantum of property uplift.
The following rates were used when estimating property uplift along tram corridor
$3,000 per m2 for residential developments
$5,000 per m2 for commercial and retail developments
10% of total value potential based on OS research
Confidence Scale Level: C
Confidence scale C was applied due to a number of assumptions that were made while estimating
development supportive areas, and broad value uplift assumption potential. Investigations into
potential property uplift will occur as part of subsequent studies for AdeLINK. Hence figures identified
below should be considered for relativity purposes only, and not actual estimations.
Using a 10% increase in property uplift due to a tram corridor, CityLINK could potentially increase
property values by the following:
Route Option Summary Score
CityLINK A
- 82,652,000 m3 development supportive area
- 23,615,000 m2 (assuming 3.5m per storey)
- 10,627,000 m2 retail/commercial
- 4,015,000 m2 residential
- $5.2 bn in property uplift at 10%
2
CityLINK B
- 77,318,000 m3 development supportive area
- 22,091,000 m2 (assuming 3.5m per storey)
- 9,941,000 m2 retail/commercial
- 1,767,000 m2 residential
- $3.9 bn in property uplift at 10%
1
CityLINK C
- 82,652,000 m3 development supportive area
- 23,615,000 m2 (assuming 3.5m per storey)
- 12,788,000 m2 retail/commercial
- 2,993,000 m2 residential
- $5.3 bn in property uplift at 10%
2

CityLINK
Multi-Criteria Analysis Detail Report
66
4.4 Least route impacts on (property acquisition, trees, services, car
parking, heritage items)
4.4.1 Number of on street parks affected
A digital inspection was used to count the number and type of on-street carparks along each route
option. Where bays were not line marked, a digital ruler was used to measure the distance in metres
of a stretch road designated to on-street parking. This figure was then divided by 6.5 (m) (the average
length of a car park) in order to ascertain the approximate number of carparks available between side-
streets. Angled and 90-degree parking bays were measured separately from non-angled parking.
It can be assumed that there is potential to mitigate any significant loss of parking in the detailed
design phase. Angled and 90-degree parking spaces have the potential to be retained and converted
to parallel parking bays in some instances. Therefore, the count of angled and 90-degree parking
spaces has less weighting than potential impacts on parallel parks.
The number of parks in front of businesses for each route were calculated. The options with a high
and are assumed to have a greater impact on the route alignment
Confidence Scale Level: C
When comparing the three CityLINK route options, Option C has a significantly lower number of overall
on street carparks that could potentially require removal, however, a significant amount of these are
parallel. While Option B potentially impacts more on street parking than Option C, it has the lowest
count of parallel parks. Option A has the highest count of overall parking spaces and number of parks
with direct business frontage that could be potentially affected. Therefore, Option A scores lowest for
this measure.
Route Option Summary Score
CityLINK A
90-degree: 331
Angled: 375
Parallel: 167
Motorbike: 70
Total: 943 (603 with direct business frontage)
-2
CityLINK B
90-degree: 217
Angled: 332
Parallel: 130
Motorbike: 106
Total: 785 (523 with direct business frontage)
-1
CityLINK C
90-degree: 163
Angled: 113
Parallel: 266
Motorbike: 47
Total: 589 (382 with direct business frontage)
-1
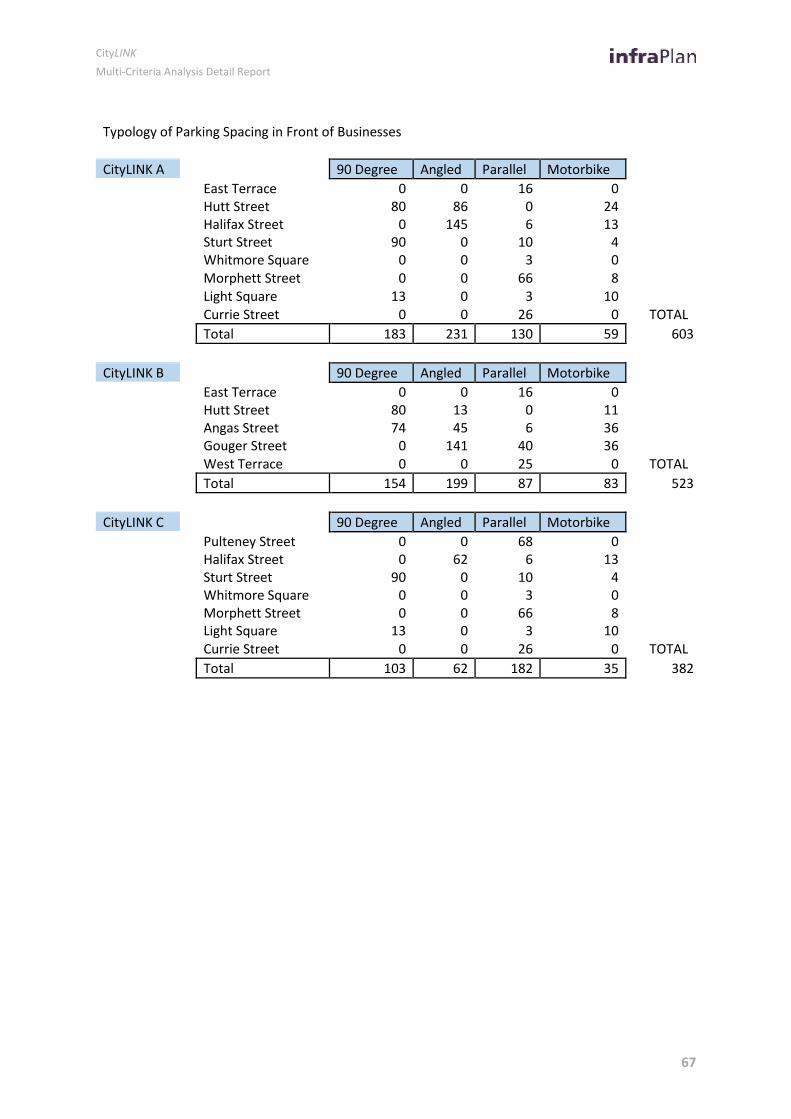
CityLINK
Multi-Criteria Analysis Detail Report
67
Typology of Parking Spacing in Front of Businesses
CityLINK A 90 Degree Angled Parallel Motorbike
East Terrace 0 0 16 0
Hutt Street 80 86 0 24
Halifax Street 0 145 6 13
Sturt Street 90 0 10 4
Whitmore Square 0 0 3 0
Morphett Street 0 0 66 8
Light Square 13 0 3 10
Currie Street 0 0 26 0 TOTAL
Total 183 231 130 59 603
CityLINK B 90 Degree Angled Parallel Motorbike
East Terrace 0 0 16 0
Hutt Street 80 13 0 11
Angas Street 74 45 6 36
Gouger Street 0 141 40 36
West Terrace 0 0 25 0 TOTAL
Total 154 199 87 83 523
CityLINK C 90 Degree Angled Parallel Motorbike
Pulteney Street 0 0 68 0
Halifax Street 0 62 6 13
Sturt Street 90 0 10 4
Whitmore Square 0 0 3 0
Morphett Street 0 0 66 8
Light Square 13 0 3 10
Currie Street 0 0 26 0 TOTAL
Total 103 62 182 35 382

CityLINK
Multi-Criteria Analysis Detail Report
68
4.4.2 Impacts on median, including trees and islands (calculation to be determines upon
review of actual routes, but to include removal of trees)
The number of trees that may require removal on each route was calculated using satellite imagery.
The number of trees situated on medians of a route options were counted.
Confidence Scale Level: D
This rating was determined as the impact to trees will be determined during the detailed design stage.
There is a lack of detail and overall analysis to warrant an accurate impact at the MCA stage. The
assessment assumes that trams would be in the centre of the road, and require existing trees to be
removed (i.e. worst case scenario). The assessment does also not consider replacement and additional
vegetation that would be considered as part of the detailed planning of the routes.
When comparing the three route options for CityLINK, Option A contains the greatest number of trees
that could potentially require removal. Options B and C contain a similar number of trees along their
routes. Due to the lack of detailed design to warrant an accurate impact on existing trees, all three
options score equally for this measure.
Route Option Summary Score
CityLINK A 65 trees -1
CityLINK B 47 trees -1
CityLINK C 43 trees -1
4.4.3 Number of heritage items along the route frontage (up to 50m)
This measure is used to assess in foresight the potential of heritage places having an impact on the
delivery of a particular route option. Planning near heritage item needs to be undertaken carefully to
ensure the preservation of sites. Hence heritage places, particularly higher tiered items, may have
implications for maintaining the character of surrounds. Contributory items (items within character
preservation zones) were omitted, as this type of zone was assessed in Theme 1..
The data used in this assessment has been sourced from the ‘Heritage Places (Point Data)’ spatial layer
available from Data SA, a State administered open data source. It is updated regularly by DPTI, with
the data set used for this assessment current as of August 2016.
Confidence Scale Level: D
As depicted in Figure 27 (overleaf), each CityLINK route option would pass a significant number of
State and Local heritage items that may be impacted or restrict how light rail systems could be
implemented. Compared to Options B and C, Option A has the greatest number of heritage items (both
in total and average per km) within an immediate 50 metre buffer zone of the route. However, given
the tram corridor alignment is being planned to remain within the road reserve, encroachment from
road widening (and therefore acquisition/construction impacts) on heritage items is not likely.
Therefore all Options are rated equally.

CityLINK
Multi-Criteria Analysis Detail Report
69
Figure 27: State and local heritage places.
Route Option Summary Score
CityLINK A
Total heritage items: 103
State: 42 Local: 61
Average per km: 22
-1
CityLINK B
Total heritage items: 60
State: 30 Local: 30
Average per km: 14
-1
CityLINK C
Total heritage items: 54
State: 21 Local: 33
Average per km: 13
-1

CityLINK
Multi-Criteria Analysis Detail Report
70
4.5 Potential for contributions from government land
4.5.1 Amount of local and state government owned land along the route (within a 300m
catchment)
Contributions from government owned land might include electrical sub-station locations, tram
stabling and so on.
Data for this measure was acquired from DPTI. It included detail of the specific land owner and was
therefore cleansed to remove government owned lands (local or state) that would be unlikely to
contribute to the project in any way. These included: Aboriginal Lands Corp, Adelaide Park Lands,
cemeteries, existing railway line corridors, SA Water Corp and existing water bodies, schools, reserves
and other community services remain in the dataset.
Confidence Scale Level: B
Despite Option A having the highest count of government owned parcels, the overall area size is the
smaller than Option C, indicating that these are mainly small parcels. Overall Option C has the highest
amount of government land with 14,364 m2 and 44,057 m2 more than Options A and B respectively.
Figure 28: Parcels of State and Local Government owned land.
Route Option Summary Score
CityLINK A
Amount of government owned land: 239,800 m2
Number of parcels: 428
Average size: 560 m2
2
CityLINK B
Amount of government owned land: 210,110 m2
Number of parcels: 290
Average size: 725 m2
1
CityLINK C
Amount of government owned land: 254,170 m2
Number of parcels: 425
Average size: 598 m2
2

CityLINK
Multi-Criteria Analysis Detail Report
71
4.5.2 Measure the amount of SA Housing Trust land along the route (within a 300m
catchment)
The data used for this measure was refined from that used in the Government Owned Land measure
to show which route may provide greatest potential for the SA Housing Trust to renew and intensify
public housing stock or sell land to allow for new private developments within a reasonable, 300m
distance from the tram route.
The data was received from DPTI from a 2016 update.
Confidence Scale Level: A
While there are few SA Housing Trust owned parcels within any of the CityLINK route options, as seen
in Figure 29, Option B has the least of all route options as most parcels are situated towards the south.
Options A has the most significant land area owned by SA Housing Trust due to its extensive southern
alignment and therefore rate highest for this measure.
Figure 29: SA Housing Trust owned parcels.
Route Option Summary Score
CityLINK A
Amount of SA Housing Trust land: 54,050 m2
Number of parcels: 144
Average size: 375 m2
3
CityLINK B
Amount of SA Housing Trust land: 45,410 m2
Number of parcels: 88
Average size: 516 m2
1
CityLINK C
Amount of SA Housing Trust land: 50,660 m2
Number of parcels: 120
Average size: 422 m2
2

CityLINK
Multi-Criteria Analysis Detail Report
72
4.5.3 Amount of Urban Renewal Authority land along the route (within a 300m
catchment)
This data was refined from that used in the Government Owned Land measure. It shows how much
land is already owned by the State administered Urban Renewal Authority (Renewal SA) is within a
300m catchment of each route and is highly likely to be redeveloped.
The data was received from DPTI from a 2016 update.
Confidence Scale Level: A
No Renewal SA land parcels are located in the Adelaide CBD. Therefore, all three options score equally
for this measure.
Route Option Summary Score
CityLINK A
Amount of Renewal SA land: 0 m2
Number of parcels: 0
Average size: 0 m2
0
CityLINK B
Amount of Renewal SA land: 0 m2
Number of parcels: 0
Average size: 0 m2
0
CityLINK C
Amount of Renewal SA land: 0 m2
Number of parcels: 0
Average size: 0 m2
0

CityLINK
Multi-Criteria Analysis Detail Report
73
5 Theme 5: Environmental sustainability
Improving Adelaide’s position as a sustainable and carbon neutral city
including reduced car dependency.

CityLINK
Multi-Criteria Analysis Detail Report
74
5.1 An environment that enables walking and public transport use
5.1.1 Enables walking and public transport use
Environments that enable walking and public transport use are made up of a variety of factors
including the quality of footpaths, road crossings, the street network, signal timings, personal safety,
shelter, visual interest and impacts from traffic. Given the high numbers of people walking in the CBD,
the footpath network is generally of a high quality, particularly on roads that would be able to facilitate
a tram.
The ACC SmartMove Strategy was reviewed for contributions to an environment that enables walking
and public transport use, as follows:
Significant City Place Locations (refer to Figure 30). These locations are identified as priorities
to ‘create a high-quality pedestrian environment, increase placemaking and opportunities for
pedestrian activities, and improve access to the expanding public transport network,
including tram, trains and bus services.
Current and future ‘evening places’ (refer to Figure 31 and Figure 32). The direction for these
locations is to ‘create a safe night-time environment for pedestrians and cyclists’. This
direction will increase passive surveillance and personal safety and security thereby
contributing to an environment that enables walking and public transport use.
These factors were rated individually and then the total route scores were compared to determine an
MCA score.
Figure 30: Significant City Place locations (ACC SmartMove Strategy)
Figure 31: Current Evening Places (ACC SmartMove Strategy)
Figure 32: Future Evening Places (ACC SmartMove Strategy)

CityLINK
Multi-Criteria Analysis Detail Report
75
Confidence Scale Level: D (Given that one score is determined for the entire route – the varying
environments along the route do not allow for firm assessment).
CityLINK A CityLINK B CityLINK C
High Quality Pedestrian Environment (Significant City Place, refer Figure 30)
0 -1 +1
Passive surveillance/personal safety (evening places, refer Figure 31)
0 0 0
Option B passes through the least Significant City Place Locations (West Terrace, Gouger St west,
Angas St east and part of Hutt St), while Option C runs almost entirely along ‘Significant City Place
Locations’. All routes run along streets with sporadic existing evening activity. Future evening
activation (as identified in ACC SmartMove Strategy) is planned along sections of all routes, but
significant sections of all routes are not included. These include the West Terrace Park Lands (Option
B), Morphett St (Options A and B), the east end of Angas St (Option A), and sections of Hutt St (Options
A and B). It was considered that all options were equivalent in this score. Therefore Option C is rated
highest for this measure.
Route Option Summary Score
CityLINK A While the route connects a number of Significant City Place locations, a large portion of the route also runs through less significant areas.
0
CityLINK B Route that runs through the least Significant City Place locations -1
CityLINK C Route runs almost entirely within Significant City Place locations 1

CityLINK
Multi-Criteria Analysis Detail Report
76
5.1.2 Enables cycling
Environments that enable cycling are made up of a variety of factors including the quality of cyclist
facilities, road crossings and the street network. These factors were considered individually and total
route scores were given accordingly.
Confidence Scale Level: D. (Given that one score is determined for the entire route – the varying
environments along the route do not allow for firm assessment).
Option B scored the highest given that it is the most direct route, and its location in the centre of the
CBD (Grote/Wakefield) allows a greater catchment & distribution to other cycling routes/destinations.
In addition, Option B has a high quality shared path along West Terrace and wide road reserves of
Grote St and Wakefield Street to facilitate wide bicycle lanes.
Route Option Summary Score
CityLINK A
No bike lanes on Currie St & conflict with high volume of buses, Morphett St poor cycling environment and one-way traffic around Light Square is not direct, Sturt/Halifax bike lanes exist and carry moderate traffic volumes.
-1
CityLINK B Most direct route. High quality shared path (West Tce), Grote St/Wakefield wide road reserve
1
CityLINK C
No bike lanes on Currie St & conflict with high volume of buses, Morphett St poor cycling environment and one-way traffic around Light Square is not direct, Sturt/Halifax bike lanes exist and carry moderate traffic volumes. Pulteney Street is direct.
-1

CityLINK
Multi-Criteria Analysis Detail Report
77
Appendix A: Multi-Criteria Analysis Process
The process evaluates both monetised and non-monetised project components in a transparent
manner to inform decision makers on investment decisions. The tool is designed to augment the
present practice of benefit cost analysis with the economic, environmental and social impacts that
land use projects have upon transport patterns, and vice versa, which may otherwise be treated in an
inconsistent fashion or be overlooked.
In conjunction with DPTI and Council officers, the InfraPlan team developed the MCA to consider all
aspects of the AdeLINK project, producing up to 45 measures to be scored under 5 themes for each
corridor option. The results are presented as standalone studies for each corridor. The outcomes of
this MCA are unweighted, such is the Infrastructure Australia preference.
Purpose of the Multi-Criteria Analysis
A MCA process will assist in evaluating the ITLUP route option, compare possible alternative
routes and determine the most appropriate route (or routes) for more detailed assessment,
including Design Labs.
The MCA is a higher level process than the Design Lab to provide information to augment the
Design Lab process.
Agreed criteria to ensure transparent land use and transport outcomes are achieved in final
route identification.
The MCA is consistent with State/Federal Treasury Guidelines and information is transferable
to the Business Case for funding (supports a Benefit Cost Assessment).
Allows for a wide range of input, including professional advice and relevant data and analysis
(final scores are limited by quality of this input).
The MCA accords with Item 2 of the Infrastructure Australia (IA) Business Case Template: Stage 3
Option Assessment Template (see Appendices) which only stipulates, ‘Nominators should refine the
long list to short list; a multi-criteria analysis (MCA) is suggested. The analysis should include
consideration of:
- The extent to which each option addresses the problems / opportunities;
- The timeframe over which the option is expected to address the problem / opportunity (i.e. the
duration of time for which benefits will be sustained in addressing the challenge);
- Economic, social and environmental impacts;
- Indicative capital and operational costs of the initiative; and delivery risk and challenges; and
- Other considerations for the initiative as appropriate.’
The more detailed Business Case will need to determine the Base Case projects to the ‘Do minimum’
or ‘Do nothing’ scenarios which are still to be determined. However, to determine the Base Case
projects, the MCA is of benefit.

CityLINK
Multi-Criteria Analysis Detail Report
78
How does the Multi-Criteria Analysis Work?
The Steps 1. Determine how the tool is to be applied. This may be determined by the selected projects
to be compared, or by the end purpose of the comparison.
2. If applicable, assign a Weighting Scale in the Comparison Summary page to be applied to
the assessment criteria. In this instance, results are not weighted.
3. Under each Project Assessment tab, assign a Confidence Level (A to E) for the relevant
data for each appraisal element. In some cases, the rating for each element will be
consistent across all compared projects, in others they will vary.
4. Assign a Rating from -3 to +3 for the project on its achievement of each appraisal element.
5. The Comparison Summary page allows for comparison of the projects assessed.
Confidence Level There are two principal approaches to the confidence level – numeric or alphabetic. The numeric
approach enables the confidence level to be incorporated into an indicator’s overall score via
multiplication. This makes for a simpler, but perhaps less transparent output, since the final summary
table does not present the calculations which lead to an overall score – i.e. whether it was due to a
high rating or confidence limit. Readers may find the results difficult to interpret.
An alphabetic system, on the other hand, leaves the final user of results in no doubt about the origin
of a weighted score for an indicator – and automatically highlights which indicators require further
clarification or supporting evidence and which are reliable. An alphabetic system with 5 grades A-E is
presented below.
A description of the nature and quality of data suggested for each appraisal element and each grade
of the Confidence Scale is given in the Assessment Criteria tab. This table provides users of this tool
with a clear guide to rating the available data and can be used to guide the gathering of new data to
target particular areas of need.
It is important that users of the tool can indicate where a choice is based on primary evidence, recent
experience in similar projects, established engineering or other physical principles etc., and where
choices of ratings are based on speculation, anecdotal evidence, unsubstantiated evidence or a
professional estimate, rather than actual data.
Confidence SCALE A-E
A Recent, relevant and accurate studies with appropriate detail and analysis to form a rigorous and defensible
basis for the assessment. Assessment has a very high degree of confidence.
B Substantial information – perhaps patchy in parts (date, accuracy, detail?) – but sufficient to provide an
accurate assessment with a fair degree of confidence.
C Some background information, but either dated, lacking appropriate detail or accuracy to form the basis for a
firm assessment. Not suitable for a score greater than –2 or +2
D Professional judgment within area of expertise. However, no relevant studies or data available. Not suitable
for score greater than +1 or –1
E Best guess of professional assessing outside their area of expertise, gut feel, no relevant studies or data. Not
suitable basis for score greater than +1 or less than –1
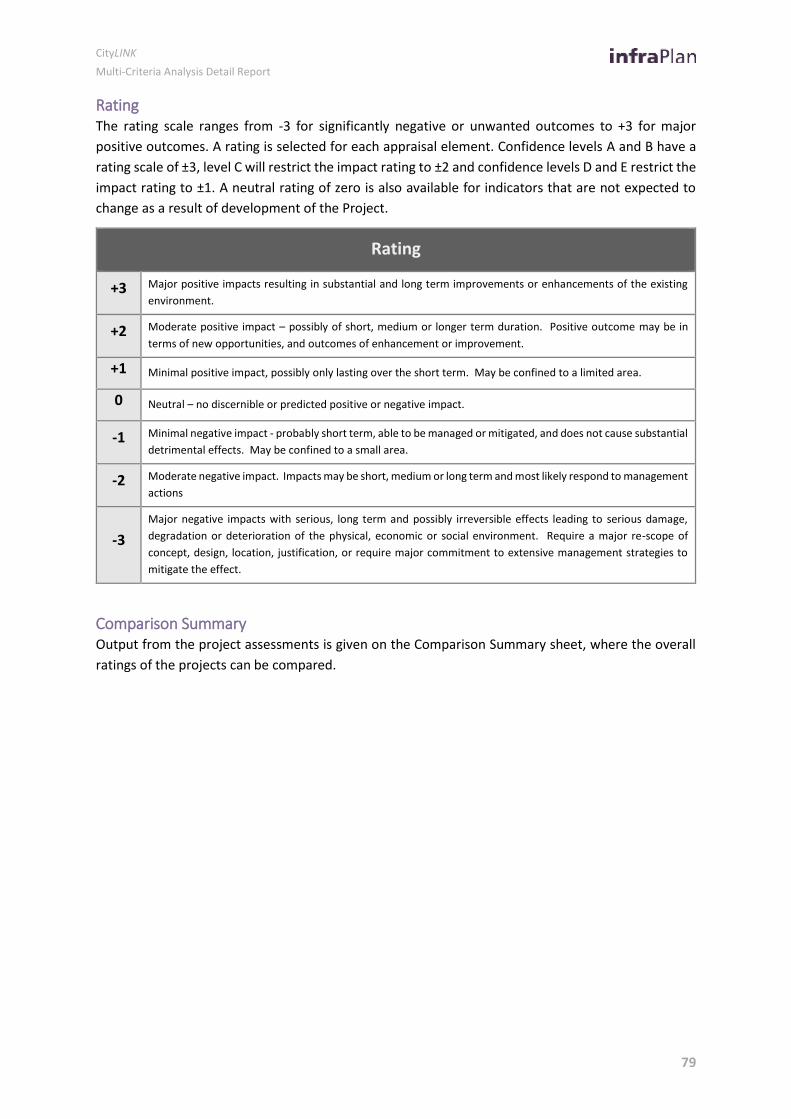
CityLINK
Multi-Criteria Analysis Detail Report
79
Rating The rating scale ranges from -3 for significantly negative or unwanted outcomes to +3 for major
positive outcomes. A rating is selected for each appraisal element. Confidence levels A and B have a
rating scale of ±3, level C will restrict the impact rating to ±2 and confidence levels D and E restrict the
impact rating to ±1. A neutral rating of zero is also available for indicators that are not expected to
change as a result of development of the Project.
Rating
+3 Major positive impacts resulting in substantial and long term improvements or enhancements of the existing
environment.
+2 Moderate positive impact – possibly of short, medium or longer term duration. Positive outcome may be in
terms of new opportunities, and outcomes of enhancement or improvement.
+1 Minimal positive impact, possibly only lasting over the short term. May be confined to a limited area.
0 Neutral – no discernible or predicted positive or negative impact.
-1 Minimal negative impact - probably short term, able to be managed or mitigated, and does not cause substantial
detrimental effects. May be confined to a small area.
-2 Moderate negative impact. Impacts may be short, medium or long term and most likely respond to management
actions
-3
Major negative impacts with serious, long term and possibly irreversible effects leading to serious damage,
degradation or deterioration of the physical, economic or social environment. Require a major re-scope of
concept, design, location, justification, or require major commitment to extensive management strategies to
mitigate the effect.
Comparison Summary Output from the project assessments is given on the Comparison Summary sheet, where the overall
ratings of the projects can be compared.