Embed Size (px)
Citation preview

step forward →
CITY OF WARWICK, RHODE ISLAND
ANNUAL FINANCIAL REPORT JUNE 30, 2018

CITY OF WARWICK, RHODE ISLAND TABLE OF CONTENTS JUNE 30, 2018
Introductory Section Page List of City Officials i Organizational Chart ii
Financial Section Independent Auditors’ Report 1-3 Management’s Discussion and Analysis 4-14
Basic Financial Statements
Exhibit Government-Wide Financial Statements: I Statement of Net Position 15 II Statement of Activities 16 Fund Financial Statements: Governmental Funds: III Balance Sheet 17-18 IV Statement of Revenues, Expenditures and Changes in Fund Balances 19-20 Proprietary Funds: V Statement of Net Position 21 VI Statement of Revenues, Expenses and Changes in Net Position 22 VII Statement of Cash Flows 23 Fiduciary Funds: VIII Statement of Net Position 24 IX Statement of Changes in Net Position 25 Notes to the Financial Statements 26-94
Required Supplementary Information
RSI-1 Budgetary Comparison Schedule - General Fund Schedule of Revenues and Expenditures (Non-GAAP Budgetary Basis) 95-97 RSI-2 Budgetary Comparison Schedule - School General Fund Schedule of Revenues and Expenditures (Non-GAAP Budgetary Basis) 98 RSI-3 Notes to Required Supplementary Information 99-100 RSI-4 Schedule of Changes in Employers’ Net Pension Liability and Related Ratios - City Employees’ Pension Plan 101 RSI-5 Schedule of Changes in Employers’ Net Pension Liability and Related Ratios - Police I and Fire Pension Plan 102 RSI-6 Schedule of Changes in Employers’ Net Pension Liability and Related Ratios - Police II Pension Plan 103 RSI-7 Schedule of Changes in Employers’ Net Pension Liability and Related Ratios - Fire II Pension Plan 104 RSI-8 Schedule of Changes in Employers’ Net Pension Liability and Related Ratios - Warwick Public School Employees’ Pension Plan 105

CITY OF WARWICK, RHODE ISLAND TABLE OF CONTENTS JUNE 30, 2018
Exhibit Page RSI-9 Schedule of City Contributions - City Employees’ Pension Plan 106 RSI-10 Schedule of City Contributions - Police I and Fire Pension Plan 107 RSI-11 Schedule of City Contributions - Police II Pension Plan 108 RSI-12 Schedule of City Contributions - Fire II Pension Plan 109 RSI-13 Schedule of City Contributions - Warwick Public School Employees’ Pension
Plan 110 RSI-14 Schedule of Investment Returns - City Pension Plans 111 RSI-15 Schedule of City Contributions - Employees’ Retirement System - Teachers 112 RSI-16 Schedule of City’s Proportionate Share of the Net Pension Liability - Employees’
Retirement System - Teachers 113 RSI-17 Schedule of Changes in Total OPEB Liability and Related Ratios 114 Supplemental, Combining and Individual Fund Statements and Schedules A-1 Combining Balance Sheet - Nonmajor Governmental Funds 115 A-2 Combining Statement of Revenues, Expenditures and Changes in Fund Balances - Nonmajor Governmental Funds 116 A-3 Combining Balance Sheet - Special Revenue Restricted City 117-118 A-4 Combining Statement of Revenues, Expenditures and Changes in Fund
Balances - Special Revenue Restricted City
119-120 A-5 Combining Balance Sheet - Special Revenue Restricted School Funds 121-127 A-6 Combining Statement of Revenues, Expenditures and Changes in Fund
Balances - Special Revenue Restricted School Funds
128-134 A-7 Combining Balance Sheet - Capital Project Funds 135 A-8 Combining Statement of Revenues, Expenditures and Changes in Fund
Balances - Nonmajor Governmental Funds - Capital Projects Funds
136 B-1 Combining Statement of Net Position - Nonmajor Proprietary Funds 137 B-2 Combining Statement of Revenues, Expenses and Changes in Net Position -
Nonmajor Proprietary Funds 138 B-3 Statement of Cash Flows - Nonmajor Proprietary Funds 139 C-1 Combining Statement of Net Position - Private Purpose Trust Funds 140 C-2 Combining Statement of Changes in Net Position - Private Purpose Trust Funds 141 D Combining Statement of Changes in Assets and Liabilities - Agency Funds 142-143 E-1 Combining Balance Sheet - Funds Which Comprise the City’s General Fund 144 E-2 Combining Statement of Revenues, Expenditures and Changes in Fund
Balances - Funds Which Comprise the City’s General Fund
145 F-1 Combining Statement of Net Position - Internal Service Funds 146 F-2 Combining Statement of Revenues, Expenses and Changes in Net Position -
Internal Service Funds
147 F-3 Combining Statement of Cash Flows - Internal Service Funds 148

CITY OF WARWICK, RHODE ISLAND TABLE OF CONTENTS JUNE 30, 2018
Exhibit Page G-1 Combining Statement of Net Position - Proprietary Funds Sewer 149G-2 Combining Statement of Revenues, Expenses and Changes in Net Position -
Proprietary Funds Sewer 150G-3 Combining Statement of Cash Flows - Proprietary Funds Sewer 151H-1 Combining Statement of Net Position - Proprietary Funds Water 152H-2 Combining Statement of Revenues, Expenses and Changes in Net Position -
Proprietary Funds Water 153H-3 Combining Statement of Cash Flows - Proprietary Funds Water 154I-1 Schedule of Tax Collections 155I-2 Analysis of Prior Year Tax Collections 156J-1 Annual Supplemental Transparency Report (MTP2) 157-159J-2 Combining Schedule of Reportable Government Services with Reconciliation to MTP2 - Municipal 160J-3 Combining Schedule of Reportable Government Services with Reconciliation to MTP2 - Education 161 Notes to Supplementary Information - Annual Supplemental Transparency Report 162-163
Statistical Section
Table Page Financial Trends: 1 Net Position by Component 1642 Changes in Net Position 165-1663 Fund Balances, Governmental Funds 1674 Changes in Fund Balances, Governmental Funds 168 Revenue Capacity: 5 Assessed Value and Actual Value of Taxable Property 169-1706 Property Tax Rates 171 Demographic and Economic Statistics: 7 Demographic and Economic Statistics 1728 Principal Employers 173 Operating Information: 9 Full-Time Equivalent City Government Employees by Function/Program 17410 Operating Indicators by Function 17511 Capital Asset Statistics by Function 176

Introductory Section

i
CITY OF WARWICK, RHODE ISLAND
MAYOR
Joseph J. Solomon
CITY COUNCIL
James Mcelroy Richard K. Corley Anthony Sinapi
Timothy J. Howe Edgar Ladouceur
Stephen P. McAllister Steve Merolla Jeremy Rix
Donna M. Travis
SCHOOL COMMITTEE
Karen A. Bachus, Chairperson Kyle D. Adams
Judith L. Cobden Nathaniel L. Cornell
David Testa
FINANCE DEPARTMENT
Brian M. Silvia, Finance Director Lynne Y. Prodger, City Treasurer Kathy D. Damicis, City Controller
SCHOOL ADMINISTRATION
Philip Thornton, Superintendent
Anthony Ferrucci, Director of Finance & Operations Robert Baxter, School Controller

School Committee City Council
School Department Legislative Department
Executive Police Dept Parks & Recreation Warwick Public Library Human Services Economic Development DPW AdminLegal Fire Dept Thayer Arena Branch Libraries Senior Centers Community Development HighwayCity Clerk Rescue Service McDermott Pool Senior Transportation Planning SanitationProbate Court WEMA Family Support Serv AutomotiveMunicipal Court Bldg Inspection Bldg MaintenancePersonnel EngineeringBoard of Canvassers Field MaintenanceFinanceTreasuryTax CollectorTax AssessorMgmnt Info SystemsPurchasing
THE CITY OF WARWICK, RHODE ISLANDGOVERNMENT ORGANIZATIONAL CHART
Citizens Of Warwick
Mayor
Executive & Administrative Public Safety Recreation Public WorksPublic Libraries
SocialServices
Planning &Economic
Development
Citizens Of Warwick
Mayor
Executive & Administrative Public Safety Recreation Public WorksPublic Libraries
SocialServices
Planning & Economic Development
ii

Financial Section

1
Independent Auditors’ Report
To the Honorable President and Members of the City Council City of Warwick, Rhode Island
Report on the Financial Statements
We have audited the accompanying financial statements of the governmental activities, the business-type activities, each major fund and the aggregate remaining fund information of the City of Warwick, Rhode Island, as of and for the year ended June 30, 2018, and the related notes to the financial statements, which collectively comprise the City of Warwick, Rhode Island’s basic financial statements as listed in the table of contents.
Management’s Responsibility for the Financial Statements
Management is responsible for the preparation and fair presentation of these financial statements in accordance with accounting principles generally accepted in the United States of America; this includes the design, implementation and maintenance of internal control relevant to the preparation and fair presentation of financial statements that are free from material misstatement, whether due to fraud or error.
Auditors’ Responsibility
Our responsibility is to express opinions on these financial statements based on our audit. We conducted our audit in accordance with auditing standards generally accepted in the United States of America and the standards applicable to financial audits contained in Government Auditing Standards, issued by the Comptroller General of the United States. Those standards require that we plan and perform the audit to obtain reasonable assurance about whether the financial statements are free from material misstatement.
An audit involves performing procedures to obtain audit evidence about the amounts and disclosures in the financial statements. The procedures selected depend on the auditors’ judgment, including the assessment of the risks of material misstatement of the financial statements, whether due to fraud or error. In making those risk assessments, the auditors consider internal control relevant to the entity’s preparation and fair presentation of the financial statements in order to design audit procedures that are appropriate in the circumstances, but not for the purpose of expressing an opinion on the effectiveness of the entity’s internal control. Accordingly, we express no such opinion. An audit also includes evaluating the appropriateness of accounting policies used and the reasonableness of significant accounting estimates made by management, as well as evaluating the overall presentation of the financial statements.
We believe that the audit evidence we have obtained is sufficient and appropriate to provide a basis for our audit opinions.

2
Opinions
In our opinion, the financial statements referred to above present fairly, in all material respects, the respective financial position of the governmental activities, the business-type activities, each major fund and the aggregate remaining fund information of the City of Warwick, Rhode Island, as of June 30, 2018 and the respective changes in financial position and, where applicable, cash flows thereof for the year then ended in accordance with accounting principles generally accepted in the United States of America.
Change in Accounting Principle
As discussed in Note 20 to the financial statements, during the fiscal year ended June 30, 2018, the City of Warwick, Rhode Island, adopted new accounting guidance, GASB Statement No. 75, Accounting and Financial Reporting for Postemployment Benefits Other than Pensions. The net position of the City of Warwick, Rhode Island, has been restated to recognize the net other postemployment benefit liability in accordance with GASB No. 75. Our opinion is not modified with respect to these matters.
Other Matters
Required Supplementary Information
Accounting principles generally accepted in the United States of America require that the management’s discussion and analysis, the budgetary comparison information and the pension and OPEB schedules, as listed in the table of contents, be presented to supplement the basic financial statements. Such information, although not a part of the basic financial statements, is required by the Governmental Accounting Standards Board, which considers it to be an essential part of financial reporting for placing the basic financial statements in an appropriate operational, economic or historical context. We have applied certain limited procedures to the required supplementary information in accordance with auditing standards generally accepted in the United States of America, which consisted of inquiries of management about the methods of preparing the information and comparing the information for consistency with management’s responses to our inquiries, the basic financial statements and other knowledge we obtained during our audit of the basic financial statements. We do not express an opinion or provide any assurance on the information because the limited procedures do not provide us with sufficient evidence to express an opinion or provide any assurance.
Other Information
Our audit was conducted for the purpose of forming opinions on the financial statements that collectively comprise the City of Warwick, Rhode Island’s basic financial statements. The introductory section, combining and individual nonmajor fund financial statements and schedules, the Annual Supplemental Transparency Report and the statistical section are presented for purposes of additional analysis and are not a required part of the basic financial statements.
The combining and individual nonmajor fund financial statements and schedules and the Annual Supplemental Transparency Report are the responsibility of management and were derived from and relate directly to the underlying accounting and other records used to prepare the basic financial statements. Such information has been subjected to the auditing procedures applied in the audit of the basic financial statements and certain additional procedures, including comparing and reconciling such information directly to the underlying accounting and other records used to prepare the basic financial statements or to the basic financial statements themselves, and other additional procedures in accordance with auditing standards generally accepted in the United States of America. In our opinion, the combining and individual nonmajor fund financial statements and schedules and the Annual Supplementary Transparency Report are fairly stated in all material respects in relation to the basic financial statements as a whole.

3
The introductory and statistical sections have not been subjected to the auditing procedures applied in the audit of the basic financial statements, and, accordingly, we do not express an opinion or provide any assurance on them.
Other Reporting Required by Government Auditing Standards
In accordance with Government Auditing Standards, we have also issued our report dated July 23, 2019 on our consideration of the City of Warwick, Rhode Island’s internal control over financial reporting and on our tests of its compliance with certain provisions of laws, regulations, contracts, and grant agreements and other matters. The purpose of that report is solely to describe the scope of our testing of internal control over financial reporting and compliance and the results of that testing, and not to provide an opinion on the effectiveness of the City of Warwick, Rhode Island’s internal control over financial reporting or on compliance. That report is an integral part of an audit performed in accordance with Government Auditing Standards in considering the City of Warwick, Rhode Island’s internal control over financial reporting and compliance.
Cranston, Rhode Island July 23, 2019

4
CITY OF WARWICK, RHODE ISLAND MANAGEMENT’S DISCUSSION AND ANALYSIS
As management of the City of Warwick, we offer readers of the City of Warwick’s financial statements this overview and analysis of the financial activities of the City of Warwick for the fiscal year ended June 30, 2018. We encourage readers to consider this information in conjunction with the additional information that is furnished in the letter of transmittal, which can be found preceding this narrative, and with the City’s financial statements which follow. Included within our discussion will be a series of comparative tables, serving to more clearly illustrate changes in the City’s financial position. These tables will reflect governmental activities, business-type activities, and total activities for the 2017 and 2018 fiscal years. FINANCIAL HIGHLIGHTS
At the close of the fiscal year, the liabilities of the City of Warwick exceeded its assets by $609,299,387 (Net Position). The City had a restatement related to the implementation of GASB #75 of its July 1, 2017 opening net position. This decreased the City’s net position by $246,309,020 in fiscal year 2017. The City’s total net position decreased by $15.8 million during fiscal year 2018. One key factor was a $9.5 million decrease in the City’s net pension liabilities which was offset by an increase in the net deferred pension inflows of $13.6 million, and a decrease in the deferred pension outflows which totaled $10.3 million. The City’s total long-term debt decreased by $12.0 million and year-end accounts payable and accrued liabilities increased by $1.4 million. Additionally, the City’s net OPEB liability decreased by $4,248,215, thus having a positive impact on the City’s net position. At the close of the current fiscal year, the City’s governmental funds reported combined ending fund balances of $36,918,875, a decrease of $5,843,509 from the prior year. This was primarily due to appropriated fund balance drawdowns for budgeted revenue within the general fund and from the reserve for education. Fiscal 2018 operating results for the general fund reflected a net decrease in total fund balance of $1,583,943 resulting in an ending fund balance of $27,436,676. The fund’s ending unassigned fund balance increased by $104,489 to a total of $22,671,446 or 7.33% of the total 2018 final budgeted expenditures.
The City’s overall investment in capital assets (net of accumulated depreciation) decreased by $133,811 during this year.

5
OVERVIEW OF THE FINANCIAL STATEMENTS This discussion and analysis is intended to serve as an introduction to the City of Warwick’s basic financial statements. The City’s basic financial statements consist of three components: (1) government-wide financial statements, (2) fund financial statements, (3) notes to the financial statements. This report also contains other supplementary information including combining statements for non-major governmental funds, enterprise funds, and other fiduciary funds.
Government-wide Statements The government-wide statements report information about the City as a whole using accounting methods similar to those used by private-sector companies. The statement of net assets includes all of the government’s assets and liabilities. All of the current year’s revenue and expenses are accounted for in the statement of activities regardless of when cash is received or paid. The two government-wide statements report on the City’s net position and how it has changed. Net position - the difference between the City’s assets and liabilities - is one way to measure the City’s financial health.
Over time, increases or decreases in the City’s net position are indicators of whether its financial health is improving or deteriorating, respectively.
To assess the overall health of the City you need to consider additional nonfinancial factors
such as changes in the City’s property tax base and the condition of the City’s roads.
The government-wide financial statements of the City are divided into two categories.
Governmental activities - Most of the City’s basic services are included here, such as education, public safety, library, recreation, social services, public works and general administration. Property taxes, charges for services and state funding finance most of these activities.
Business-Type activities - The City charges fees to customers to cover the costs of certain
services it provides. The City’s water and sewer systems are included here. Fund Financial Statements The fund financial statements provide more detailed information about the City’s most significant funds - not the City as a whole. A fund is a grouping of related accounts that is used to maintain control over resources that have been segregated for specific activities or objectives. The City, like other state and local governments, uses fund accounting to ensure and demonstrate compliance with finance-related legal requirements. All of the funds of the City can be divided into three categories: governmental funds, proprietary funds, and fiduciary funds. It is important to note that these fund categories use different accounting approaches and should be interpreted differently.

6
Governmental Funds - Most of the basic services provided by the City are reported in governmental funds, which focus on (1) how money flows into and out of those funds and (2) the balances remaining at year end that are available for spending during the next year. These funds are reported using an accounting method called the modified accrual basis of accounting, which measures cash and all other financial assets that can be readily converted to cash. The governmental fund statements provide a detailed short-term view of the City’s general government operations that helps the reader to determine whether or not there are more or fewer financial resources that can be spent in the near future to finance City programs. Because the focus of governmental funds is narrower than that of the government-wide financial statements, it is useful to compare the information presented for governmental funds with similar information presented for governmental activities in the government-wide financial statements. By doing so, readers may better understand the long-term impact of the government’s near-term financing decisions. To facilitate this comparison, a reconciliation between the governmental funds statements and the government-wide statements has been provided. The City maintains seventy-eight governmental funds and two are considered major funds for presentation purposes. Each major fund is presented in a separate column in the governmental fund balance sheet and in the governmental fund statement of revenues, expenditures, and changes in fund balances. The two major governmental funds are the General Fund and the School Unrestricted Fund. The basic governmental fund financial statements can be found on pages 17-20 of this report. Proprietary Funds - The City of Warwick maintains two different types of proprietary funds. Enterprise funds are used to report the same functions presented as business-type activities in the government-wide financial statements. The City uses an enterprise fund to account for its sewer and water operations. Internal Service Funds are used to accumulate and allocate costs internally among functions. The City uses internal service funds to account for the workers compensation self insurance fund and the healthcare self insurance funds. Because this operation benefits predominantly governmental rather than business activities, the internal service fund has been included within the governmental activities in the government-wide financial statements. The basic proprietary fund financial statements can be found on pages 21-23 of this report. Fiduciary Funds - Fiduciary funds are used to account for resources held for the benefit of parties outside the government. Fiduciary funds are not reflected in the government-wide financial statements because the resources of those funds are not available to support the City’s own programs. The accounting used for fiduciary funds is much like that used for proprietary funds. The basic fiduciary funds financial statements can be found on pages 24-25 of this report. Notes to the financial statements - The notes provide additional information that is essential to a full understanding of the data provided in the government-wide and fund financial statements. The notes to the financial statements follow the basic financial statements. Other information - In addition to the basic financial statements and accompanying notes, this report also presents certain required supplementary information. This section includes budgetary comparison schedules, as well as information concerning the City’s progress in funding its obligation to provide pension benefits to employees. Required supplementary information follows the notes to the financial statements.

7
GOVERNMENT-WIDE FINANCIAL ANALYSIS Net Position As noted earlier, net position may serve over time as a useful indicator of a government’s financial health. The City’s combined net position (government and business-type activities) totaled ($609,299,387) as of June 30, 2018. The largest portion of the City’s net position reflects its investment in capital assets such as land, building, equipment, and infrastructure, less any related outstanding debt. The City uses these capital assets to provide services to citizens; consequently, these assets are not available for future spending. Although the City’s investment in its capital assets is reported net of related debt, it should be noted that the resources needed to repay this debt must be provided from other sources, since the capital assets themselves cannot be used to liquidate these liabilities.
Governmental Business-TypeActivities Activities Total
2017 2017 20172018 (as restated) 2018 (as restated) 2018 (as restated)
Current assets $ 76,748,043 $ 82,594,573 $ 46,788,900 $ 47,100,661 $ 123,536,943 $ 129,695,234 Capital assets 124,968,775 120,860,387 186,022,924 190,265,123 310,991,699 311,125,510 Other noncurrent assets 20,992,003 23,432,912 20,992,003 23,432,912 Total assets 201,716,818 203,454,960 253,803,827 260,798,696 455,520,645 464,253,656
Deferred outflows of resources 69,353,013 78,858,359 1,377,292 2,254,059 70,730,305 81,112,418
Current liabilities 31,170,972 30,524,303 13,859,166 14,251,956 45,030,138 44,776,259 Long-term liabilities 902,339,186 917,772,915 97,299,083 109,564,870 999,638,269 1,027,337,785 Total liabilities 933,510,158 948,297,218 111,158,249 123,816,826 1,044,668,407 1,072,114,044
Deferred inflows of resources 67,947,094 41,589,503 22,934,836 25,154,162 90,881,930 66,743,665
Net Position: Invested in capital assets, net of related debt 75,011,932 72,636,198 109,768,380 104,730,106 184,780,312 177,366,304 Restricted 3,552,500 6,998,200 5,516,046 5,473,902 9,068,546 12,472,102 Unrestricted (808,951,853) (787,207,800) 5,803,608 3,877,759 (803,148,245) (783,330,041)
Total Net Position $ (730,387,421) $ (707,573,402) $ 121,088,034 $ 114,081,767 $ (609,299,387) $ (593,491,635)
An additional portion of the City’s net position represents resources that are subject to external restrictions on how they may be used. The remaining balance of unrestricted net position may be used to meet the City’s ongoing obligations to citizens and creditors. Internally imposed designations of resources are not presented as restricted net position. At the end of the current fiscal year, the City’s unrestricted net position total was negative – this was primarily due to the full accrual of the current net pension liabilities for all six city pension plans. This accrual included Warwick’s portion of the net pension liability for the state controlled teacher pension plan.

8
Changes in Net Position
During fiscal 2018, the government’s total net position decreased by $15,807,752, to a June 30, 2018 year end net position of ($609,299,387):
Governmental Business-TypeActivities Activities Total
2018 2017 2018 2017 2018 2017Revenues: Program revenues: Charges for services $ 16,677,953 $ 16,296,571 $ 32,954,249 $ 35,130,876 $ 49,632,202 $ 51,427,447 Operating grants and contributions 51,833,022 57,561,506 51,833,022 57,561,506 Capital grants and contributions 198,900 8,880 2,775,948 8,880 2,974,848 General revenues: Property taxes 228,372,805 231,060,821 228,372,805 231,060,821 Interest on property tax 2,087,162 2,093,896 2,087,162 2,093,896 State aid/in lieu of tax 10,015,034 7,667,081 10,015,034 7,667,081 Investment earnings 335,537 73,582 89,016 35,800 424,553 109,382 Tax titles 35,073 15,628 35,073 15,628 Insurance 157,875 169,230 157,875 169,230 Miscellaneous 9,585,432 6,992,822 9,585,432 6,992,822 Total revenues 319,099,893 322,130,037 33,052,145 37,942,624 352,152,038 360,072,661
Expenses: Executive and administrative 9,940,222 9,171,861 9,940,222 9,171,861 Public safety 115,089,539 116,575,178 115,089,539 116,575,178 Recreation 3,041,448 3,402,704 3,041,448 3,402,704 Public libraries 5,948,080 5,872,625 5,948,080 5,872,625 Social services 2,406,427 2,189,915 2,406,427 2,189,915 Planning and E/D 3,746,698 3,152,144 3,746,698 3,152,144 Public works 21,010,874 22,454,206 21,010,874 22,454,206 Education 179,337,008 183,235,365 179,337,008 183,235,365 Debt interest 1,393,616 1,305,527 1,393,616 1,305,527 Sewer fund 16,179,771 15,723,730 16,179,771 15,723,730 Water fund 9,866,107 10,273,789 9,866,107 10,273,789 Total expenses 341,913,912 347,359,525 26,045,878 25,997,519 367,959,790 373,357,044
Increase in Net Position (22,814,019) (25,229,488) 7,006,267 11,945,105 (15,807,752) (13,284,383)
Net Position July 1 (707,573,402) (445,301,166) 114,081,767 111,402,934 (593,491,635) (333,898,232)
Restatements for GASB No. 75 Implementation (237,042,748) (9,266,272) - (246,309,020)
Net Assets at End of Year $ (730,387,421) $ (707,573,402) $ 121,088,034 $ 114,081,767 $ (609,299,387) $ (593,491,635)
Governmental Activities. Governmental activities decreased the City’s net position by $22.8 million. Key elements are as follows:
1. The City’s net position increased by $8.8 million due to a decrease in the City’s accrued net pension liabilities which include six city and school pension plans. Accordingly the City’s net position decreased by $23.1 million following an increase of net deferred outflows (assets) relating to pension expense amortizations.
2. Per GASB75, the City accrued additional other post-employment benefits which decreased the
City’s net position by $3.9 million. Accordingly the City’s net position increased by $14.1 million following decreases of deferred inflows (liabilities) relating to other post-employment benefit amortizations.
3. General Fund GAAP surplus decreased the City’s net position by 1.6 million. Additionally, surpluses in the non-major governmental funds decreased the net position by $4.2 million.
4. Capital asset additions (net of CIP) totaled $11.4 million while fiscal 2018 depreciation expense
amounted to $7.3 million resulting in a $4.1 increase to net position.

9
5. Changes in deferred revenue accruals decreased the City’s net position by $1.6 million and increases in compensated absences decreased net position by $438,643.
Business-type Activities. Business-type activities increased the City’s net position by $7.0 million to an overall ending balance amount of $121.1 million. The key elements are as follows:
1. The Sewer Department reflected an overall increase in net position of $6.5 million. The ending net position for the Sewer Department was $104.5 million.
2. The Sewer Assessment Fund’s ending net position totaled $4.4 million, a decrease of $1.0 million from the prior year.
3. The Water Department reflected a net position increase of $1.2 million to an ending balance of
$5.9 million.
4. The Non-Major Enterprise Funds reflected an overall increase in net position of $228,337, to an ending balance of $6.2 million.
Financial Analysis of the Government’s Funds As of the end of the current fiscal year, the City’s governmental funds reported combined ending fund balances of $36,918,875, a decrease of $5,843,509 in comparison with the prior year balances. $22,646,110 or 61.3% of this the total fund balance represents unassigned fund which is available for spending at the government’s discretion. The remainder of the fund balance is reserved to indicate that it is not available for new spending because it is considered nonspendable, or has been restricted, assigned or committed.

10
Note: Transfers to and from other funds have been integrated into their respective categories.

11
The general fund is the chief operating fund of the City. At the end of the current fiscal year, the unassigned fund balance of the general fund was $22,671,446. The total fund balance was $27,436,676. As a measure of the general fund liquidity, it may be useful to compare unassigned fund balance to total fund expenditures. The unassigned fund balance represents 7.33% of total general fund budgeted expenditures. During fiscal 2018, the unassigned fund balance of the City’s general fund increased by $104,489. This is a 0.46% increase from the prior year unassigned fund balance.
Proprietary Funds: The City’s proprietary funds provide the same type of information found in the government-wide financial statements, but in more detail. Total net position of the Sewer Department amounted to $104,505,096. The funds invested in capital assets total $99,083,356, restricted funds total $5,516,046, and unrestricted net position totals ($94,306). The net position of the Sewer Assessment Fund totaled $4,433,550. This entire amount is unrestricted. The net position of the Water Department totaled $5,934,837. Of this, $10,636,523 represents the investment in capital assets while the unrestricted portion totals ($4,701,686). During fiscal 2018 Water’s net position increased by $1,240,737. The unrestricted net position of the workers compensation internal service fund amounted to $529,621. Total current liabilities was reduced by $22,258, due to a reduction in claims payable. The net position of the City’s medical healthcare internal service fund totaled $1,088,443. The fund’s net position balance is primarily composed of cash reserves which were previously held in escrow by health insurers when the City was self-insured, as well as a premium offset credit.

12
The Warwick School Department’s medical healthcare internal service fund reflected a net position balance which totaled $1,464,630. This balance represents a combination of $1,444,200 in escrow cash reserves held by the insurers, plus $1,252,686 in surplus funds (excess of premiums paid vs. claims paid) held by WB Community Health, less outstanding IBNR claims totaling $1,232,256. General Fund Budgetary Highlights During fiscal 2019, the City’s original budget of $305,271,737 was increased by $4.2 million to $309,490,408. The following budgetary adjustments were made during the year:
A budget transfer in the amount of $1,218,671 represented the re-appropriation of the fiscal 2017 school surplus to the School Department. The prior year education reserve funded this transfer.
A budget transfer in the amount of $3,000,000 was approved, providing the additional funds to the school department, with the funding source being a drawdown from the City’s unrestricted fund balance.
Capital Assets and Debt Administration Capital Assets. The City’s investment in capital assets for its governmental and business-type activities as of June 30, 2018, amounted to $310,991,699 (net of accumulated depreciation). This investment in capital assets includes land, buildings, improvements, machinery & equipment, roads and construction in progress. During this year, the City’s overall investment in capital assets (net of accumulated depreciation) decreased by approximately $133,811. Major capital asset additions during the current fiscal year included the following: 1. Fire Code Improvements-Various City Buildings - $421,507 2. School Consolidation Improvements - $10,860,932
3. Road Resurfacing - $980,154
Governmental Business-TypeActivities Activities Total
2018 2017 2018 2017 2018 2017
Land $ 18,693,825 $ 18,680,138 $ $ $ 18,693,825 $ 18,680,138 Land improvements 11,082,066 11,082,066 11,082,066 11,082,066 Buildings 138,317,024 137,552,253 2,900,797 2,900,797 141,217,821 140,453,050 Infrastructure 201,286,165 200,306,010 5,998,893 5,771,244 207,285,058 206,077,254 Equipment 21,312,905 20,869,769 298,746,134 283,284,225 320,059,039 304,153,994 Licensed vehicles 31,882,562 32,252,110 31,882,562 32,252,110 Artwork 62,950 62,950 62,950 62,950 Construction in progress 10,860,933 2,098,857 3,011,298 16,781,582 13,872,231 18,880,439
433,498,430 422,904,153 310,657,122 308,737,848 744,155,552 731,642,001 Less accumulated depreciation (308,529,655) (302,043,766) (124,634,198) (118,472,725) (433,163,853) (420,516,491)
Total $ 124,968,775 $ 120,860,387 $ 186,022,924 $ 190,265,123 $ 310,991,699 $ 311,125,510
Additional information on the City’s capital assets can be found in Note 8 of the notes to the financial statements of this report.

13
Long-term Debt. At the end of the fiscal year, the City had total bonds and loans outstanding of $133,934,768. It is broken down as follows:
General Fund Bonds Payable $ 45,912,531 Water Bonds Payable $ 67,668 Sewer Bonds Payable $ 8,551,801 Sewer SRF Loans Payable $ 79,402,768
General obligation bonds are backed by the full faith and credit of the City, including the City’s power to levy additional taxes to ensure repayment of the debt. Accordingly, all general obligation debt currently outstanding was approved by a vote of the citizens. During fiscal 2019, the City of Warwick’s general fund general obligation debt reflected a net decrease of $641,909. Sewer debt decreased by $11,014,750, and water debt decreased by $26,671. The City’s bond ratings are as follows: Moody’s …………….……...……….A1 Standard & Poors….…………….…AA State statue limits the amount of bonds a governmental entity can issue to 3% of its total assessed valuation. The current debt limitation for the City is $278,457,754. As of June 30, 2018 the City’s current outstanding general fund debt falls under the debt limitation by $232,545,223. Additional information on the City’s long-term debt can be found in Note 10 of the notes to the financial statements and in the statistical tables. Economic Factors and Next Year’s Budgets and Rates
Warwick’s average unemployment rate is 3.5%. Median family income in Warwick was $87,369. Warwick ranks third in population among Rhode Island’s 39 cities and towns.
The following factors were considered in preparing the City’s operating budget for the 2018-19 fiscal year.
The School Department budget will increase to $165.4 million. The City’s health care coverage will be administered by WB Community Health. Initially $3.8 million was drawn from the City’s fund balance and designated for the FY2018
operating budget.
The following factors were considered in preparing the City’s operating budget for the 2019-20 fiscal year.
The School Department budget will increase to $165.9 million. The City’s health care coverage will be administered by WB Community Health. Initially $2.4 million was drawn from the City’s fund balance and designated for the FY2018
operating budget.

14
Currently, the unassigned fund balance in the general fund totals $22,671,446. While the City has maintained its commitment toward ensuring a steady growth for the City surplus, it has sometimes been necessary to utilize part of this surplus to ease the burden on its taxpayers. In the final fiscal 2019 budget, the tax rate for residential property remained constant at $20.80, the commercial and industrial tax rate remained constant at $31.19, and the tangible personal property rate remained constant at $41.59. Per Rhode Island law, the inventory tax was phased out and the motor vehicle tax rate remained constant at $34.60. Requests for Information This financial report is designed to provide a general overview of the City’s finances for all those with an interest in the government’s finances. Questions concerning any information provided in this report or requests for additional financial information should be addressed to the Controller, City of Warwick Treasurer’s Office, 3275 Post Road, Warwick, RI 02886-7145.

Basic Financial Statements

EXHIBIT ICITY OF WARWICK, RHODE ISLANDSTATEMENT OF NET POSITION JUNE 30, 2018
Governmental Business-TypeActivities Activities Total
ASSETSCash and cash equivalents $ 23,711,947 $ 29,139,326 $ 52,851,273 Restricted cash and cash equivalents 3,552,500 5,516,046 9,068,546 Receivables, net:
Accrued interest receivable 379,266 379,266 Property tax receivable 6,292,557 6,292,557 Water and sewer use fees 8,526,036 8,526,036 Sewer assessments 4,248,637 4,248,637 Due from federal & state government 12,534,243 16,511,941 29,046,184 Other receivables 6,525,999 6,455 6,532,454
Internal balances 17,258,770 (17,258,770) - Other assets 4,790,243 4,790,243 Prepaids 258,318 258,318 Deposits with agent 1,444,200 99,229 1,543,429
Total current assets 76,748,043 46,788,900 123,536,943
Noncurrent assets:Sewer assessments receivable 20,992,003 20,992,003 Capital assets:
Nondepreciable assets 18,756,775 18,756,775 Construction in progress 10,860,933 3,011,298 13,872,231 Depreciable capital assets, net 95,351,067 183,011,626 278,362,693
Total noncurrent assets 124,968,775 207,014,927 331,983,702
Total assets 201,716,818 253,803,827 455,520,645
DEFERRED OUTFLOWS OF RESOURCESDeferred charge on refunding 88,185 92,800 180,985 Deferred outflows - related to pensions 69,264,828 1,284,492 70,549,320
Total deferred outflows of resources 69,353,013 1,377,292 70,730,305
LIABILITIESCurrent liabilities:
Accounts payable and accrued liabilities 20,081,887 1,943,118 22,025,005 Accrued interest payable 512,334 765,094 1,277,428 Due to federal & state government 172,830 172,830 Accrued compensated absences 2,458,000 2,458,000 Unearned revenues 2,331,927 2,331,927 Current portion of long-term debt 5,613,994 11,150,954 16,764,948
Total current liabilities 31,170,972 13,859,166 45,030,138
Noncurrent liabilities: Other liabilities 4,788,634 4,788,634 Accrued compensated absences 9,826,551 401,369 10,227,920 Unearned revenues 107,565 107,565 Retroactive payroll liability 1,172,565 1,172,565 Long-term debt 46,800,706 77,168,325 123,969,031 Net other post-employment benefits liability 391,834,850 13,994,736 405,829,586 Net pension liability 447,915,880 5,627,088 453,542,968
Total noncurrent liabilities 902,339,186 97,299,083 999,638,269
Total liabilities 933,510,158 111,158,249 1,044,668,407
DEFERRED INFLOWS OF RESOURCESAdvance collections - taxes and sewer assessments 51,905 633,665 685,570 Unavailable revenue - sewer assessments 20,992,003 20,992,003 Deferred inflows - related to OPEB 14,120,244 484,338 14,604,582 Deferred inflows - related to pensions 53,774,945 824,830 54,599,775
Total deferred inflows of resources 67,947,094 22,934,836 90,881,930
NET POSITIONNet investment in capital assets 75,011,932 109,768,380 184,780,312 Restricted for:
Debt service payments 3,552,500 5,516,046 9,068,546 Unrestricted (808,951,853) 5,803,608 (803,148,245)
Total Net Position $ (730,387,421) $ 121,088,034 $ (609,299,387)
The accompanying notes are an integral part of the financial statements
15

EXHIBIT IICITY OF WARWICK, RHODE ISLANDSTATEMENT OF ACTIVITIES FOR THE YEAR ENDED JUNE 30, 2018
Net Revenue (Expense) andProgram Revenues Changes in Net Position
Operating CapitalCharges for Grants and Grants and Governmental Business-Type
Function/Program Activities Expenses Services Contributions Contributions Activities Activities Total
Governmental activities: Legislative, judicial and general administrative $ 9,940,222 $ 2,675,160 $ $ $ (7,265,062) $ $ (7,265,062) Public safety 115,089,539 8,190,826 602,411 (106,296,302) (106,296,302) Recreation 3,041,448 959,641 (2,081,807) (2,081,807) Public libraries 5,948,080 40,720 874,307 (5,033,053) (5,033,053) Social services 2,406,427 92,073 61,628 (2,252,726) (2,252,726) Planning and economic development 3,746,698 2,057,016 1,334,141 (355,541) (355,541) Public works 21,010,874 241,015 32,623 (20,737,236) (20,737,236) Education 179,337,008 2,421,502 48,927,912 (127,987,594) (127,987,594) Interest on long-term debt 1,393,616 (1,393,616) (1,393,616)
Total governmental activities 341,913,912 16,677,953 51,833,022 - (273,402,937) - (273,402,937)
Business-type activities: Sewer 16,179,771 21,863,140 8,880 5,692,249 5,692,249 Water 9,866,107 11,091,109 1,225,002 1,225,002
Total business-type activities 26,045,878 32,954,249 - 8,880 - 6,917,251 6,917,251
Total $ 367,959,790 $ 49,632,202 $ 51,833,022 $ 8,880 (273,402,937) 6,917,251 (266,485,686)
General revenues: Property taxes 228,372,805 228,372,805 Interest on property taxes 2,087,162 2,087,162 State aid and in lieu of taxes not restricted for a specific purpose 10,015,034 10,015,034 Unrestricted investment earnings 335,537 89,016 424,553 Tax titles 35,073 35,073 Insurance proceeds 157,875 157,875 Miscellaneous 9,585,432 9,585,432 Total general revenues 250,588,918 89,016 250,677,934
Change in net position (22,814,019) 7,006,267 (15,807,752)
Net Position at Beginning of Year, as Restated (707,573,402) 114,081,767 (593,491,635)
Net Position at End of Year $ (730,387,421) $ 121,088,034 $ (609,299,387)
The accompanying notes are an integral part of the financial statements
16

EXHIBIT III CITY OF WARWICK, RHODE ISLANDBALANCE SHEET - GOVERNMENTAL FUNDS JUNE 30, 2018
School Nonmajor TotalUnrestricted Governmental Governmental
General Fund Funds Funds
ASSETS
Cash and cash equivalents $ 19,264,593 $ 8,403 $ 3,797,587 $ 23,070,583 Restricted cash and cash equivalents 3,552,500 3,552,500 Property tax receivable 6,292,557 6,292,557 Due from federal and state governments 4,249,059 433,408 7,851,776 12,534,243 Other receivables 1,849,426 283,952 3,109,935 5,243,313 Due from other funds 25,093,996 13,791,659 2,296,448 41,182,103 Prepaid items 258,318 258,318 Other assets 4,611,943 178,300 4,790,243
Total Assets $ 61,619,892 $ 14,517,422 $ 20,786,546 $ 96,923,860
LIABILITIES, DEFERRED INFLOWS OF RESOURCES AND FUND BALANCES
Liabilities: Accounts payable and accrued expenditures $ 2,934,194 $ 14,478,931 $ 1,256,272 $ 18,669,397 Due to state and federal governments 172,795 35 172,830 Due to other funds 20,402,115 4,609,661 25,011,776 Other liabilities 4,785,091 38,491 3,543 4,827,125
Total liabilities 28,294,195 14,517,422 5,869,511 48,681,128
Deferred inflows of resources:Unavailable revenues - taxes 4,572,172 4,572,172 Unavailable revenues - other 1,264,944 5,434,836 6,699,780 Advance tax collections 51,905 51,905
Total deferred inflows of resources 5,889,021 - 5,434,836 11,323,857
Fund balances: Nonspendable 258,318 258,318 Restricted 9,507,535 9,507,535 Committed for education 157,447 157,447 Assigned 4,349,465 4,349,465 Unassigned 22,671,446 (25,336) 22,646,110
Total fund balances 27,436,676 - 9,482,199 36,918,875
Total Liabilities, Deferred Inflows of Resources and Fund Balances $ 61,619,892 $ 14,517,422 $ 20,786,546 $ 96,923,860
(Continued on next page)
17

EXHIBIT IIICITY OF WARWICK, RHODE ISLANDBALANCE SHEET - GOVERNMENTAL FUNDS (CONTINUED) JUNE 30, 2018
Reconciliation of the Balance Sheet - Governmental Funds to the Statement of Net Position:
Amounts reported for governmental activities in the statement of net position (Exhibit I) are different because of the following:
Fund balances - total governmental funds (Exhibit III) $ 36,918,875
Capital assets used in governmental activities are not financial resources and, therefore, are not reported in the funds:
Governmental capital assets $ 433,498,430 Less accumulated depreciation (308,529,655) Net capital assets 124,968,775
Other long-term assets and deferred outflows are not available to pay for current-period expenditures and, therefore, are deferred in the funds:
Property tax receivables greater than 60 days 4,572,172 Interest receivable on property taxes 379,266 Other departmental revenues 4,367,853 Deferred outflows related to pensions 69,264,828 Deferred charges on refunding 88,185
Internal service funds are used by management to charge the costs of risk management to individual funds. The assets and liabilities of the internal service funds are reported with governmental activities in the statement of net position. 3,082,694
Long-term liabilities, including bonds payable and deferred inflows of resources are not due and payable in the current period and, therefore, are not reported in the funds:
Bonds payable (45,912,531) Unamortized bond issue premium (1,708,570) Capital lease (4,793,599) Compensated absences (12,284,551) Retroactive payroll due in more than one year (1,172,565) Interest payable on bonds and loans (512,334) Net pension liability (447,915,880) Deferred inflows related to pensions (53,774,945) Net OPEB obligation (391,834,850) Deferred inflows related to OPEB (14,120,244)
Net Position of Governmental Activities (Exhibit I) $ (730,387,421)
The accompanying notes are an integral part of the financial statements
18

EXHIBIT IV CITY OF WARWICK, RHODE ISLAND STATEMENT OF REVENUES, EXPENDITURES AND CHANGES IN FUND BALANCES - GOVERNMENTAL FUNDS FOR THE YEAR ENDED JUNE 30, 2018
School Nonmajor TotalGeneral Unrestricted Governmental Governmental
Fund Fund Funds FundsRevenues:
General property taxes $ 227,930,585 $ $ $ 227,930,585 Interest on taxes 2,087,162 2,087,162 Intergovernmental revenue 8,504,592 40,021,671 8,365,872 56,892,135 Medicaid 1,574,189 1,574,189 State contribution to pension plan 7,409,776 7,409,776 Charges for services 8,889,931 1,295,429 4,142,853 14,328,213 Investment income 331,164 1,500 2,038 334,702 Contributions and private grants 193,364 193,364 Other revenues 14,881,044 30,592 404,852 15,316,488
Total revenues 262,624,478 50,333,157 13,108,979 326,066,614
Expenditures: Executive and administrative 5,589,908 132,402 5,722,310 Public safety 45,865,829 2,737,722 48,603,551 Recreation 1,872,055 1,872,055 Public libraries 2,924,841 130,384 3,055,225 Social services 1,196,571 23,471 1,220,042 Planning and economic development 1,699,767 1,361,806 3,061,573 Public works 13,357,754 685,384 14,043,138 Employee benefits, fixed costs and capital 61,737,378 61,737,378 Education 164,451,136 17,853,298 182,304,434 State contribution to pension plan 7,409,776 7,409,776
Debt service:Principal 6,648,671 6,648,671 Interest and other costs 1,442,950 1,442,950
Total expenditures 134,244,103 171,860,912 31,016,088 337,121,103
Excess (Deficiency) of Revenues over Expenditures 128,380,375 (121,527,755) (17,907,109) (11,054,489)
Other Financing Sources (Uses): Proceeds from capital leases 321,207 321,207
Premium on revenue bonds issued 429,773 429,773 Proceeds from revenue bonds 4,460,000 4,460,000 Transfers in 564,426 122,012,274 9,482,733 132,059,433 Transfers out (130,528,744) (484,519) (1,046,170) (132,059,433) Total other financing sources (uses) (129,964,318) 121,527,755 13,647,543 5,210,980
Net Change in Fund Balances (1,583,943) - (4,259,566) (5,843,509)
Fund Balances at Beginning of Year 29,020,619 - 13,741,765 42,762,384
Fund Balances at End of Year $ 27,436,676 $ - $ 9,482,199 $ 36,918,875
(Continued on next page)
19

EXHIBIT IV CITY OF WARWICK, RHODE ISLANDSTATEMENT OF REVENUES, EXPENDITURES AND CHANGES IN FUND BALANCES - GOVERNMENTAL FUNDS (CONTINUED) FOR THE YEAR ENDED JUNE 30, 2018
Reconciliation of the Statement of Revenues, Expenditures and Changes in Fund Balances of Governmental Funds to the Statement of Activities:
Amounts reported for governmental activities in the statement of activities (Exhibit II) are different because of the following:
Net change in fund balances - total governmental funds (Exhibit IV) $ (5,843,509)
Governmental funds report capital outlays as expenditures. However, in the statement of activities the cost of those assets is allocated over their estimated useful lives and reported as depreciation expense.
Capital outlay 11,361,372 Depreciation expense (7,252,984)
Revenues in the statement of activities that do not provide current financial resources are not reported as revenues in the funds.
Property taxes collected after 60 days 339,932 Property interest and lien revenue - accrual basis change 102,288 Other departmental revenues 1,208,044 Deferred outflows related to pensions (9,463,840)
The issuance of long-term debt (e.g., bonds, leases) provides current financial resources to governmental funds, while the repayment of the principal of long-term debt consumes the current financial resources of governmental funds. Neither transaction, however, has any effect on net position. Also, governmental funds report the effect of premiums, discounts and similar items when debt is first issued, whereas these amounts are deferred and amortized in the statement of activities. This amount is the net effect of these differences in the treatment of long-term debt and related items.
Bonds issued (4,460,000) Premium on issued bonds (429,773) Bond payments 5,101,909 Capital lease issued (321,207) Capital lease payments 1,433,570 Accrued interest (21,709)
Some expenses reported in the statement of activities do not require the use of current financial resources and, therefore, are not reported as expenditures in governmental funds. Deferred inflows related to pensions (13,641,993) Deferred inflows related to OPEB (14,120,244) Amortization of bond premiums 225,741 Deferred charges on refunding (41,506) Change in compensated absences 438,643 Change in retroactive payroll 25,576 Change in net pension liability 8,853,508 Change in net OPEB obligation 3,909,691
The net expense of the internal service funds is reported with governmental activities. (217,528)
Change in Net Position of Governmental Activities (Exhibit II) $ (22,814,019)
The accompanying notes are an integral part of the financial statements
20

EXHIBIT V CITY OF WARWICK, RHODE ISLANDSTATEMENT OF NET POSITION - PROPRIETARY FUNDS JUNE 30, 2018
Governmental Business-Type Activities - Enterprise Funds Activities
Major Funds
Sewer Nonmajor Internal Sewer Assessment Water Enterprise ServiceFund Fund Fund Funds Total Funds
Assets: Current assets:
Cash and cash equivalents $ 14,072,672 $ 3,561,789 $ 10,322,118 $ 1,182,747 $ 29,139,326 $ 641,364 Restricted cash and cash equivalents 5,516,046 5,516,046 Water and sewer use fees 5,250,767 3,275,269 8,526,036 Sewer assessments 4,248,637 4,248,637 Due from federal and state government 11,936,334 4,575,607 16,511,941 Other receivables 6,455 6,455 1,282,686 Due from other funds 8,318,746 140,507 5,775,706 14,234,959 1,088,443 Inventory 99,229 99,229
Total current assets 45,094,565 7,810,426 13,837,123 11,540,515 78,282,629 3,012,493
Noncurrent assets: Sewer assessments receivable 20,992,003 20,992,003 Construction in progress 2,962,797 48,501 3,011,298 Depreciable capital assets, net 172,303,613 10,708,013 183,011,626 Deposits with agent - 1,444,200
Total noncurrent assets 175,266,410 20,992,003 10,708,013 48,501 207,014,927 1,444,200
Total assets 220,360,975 28,802,429 24,545,136 11,589,016 285,297,556 4,456,693
Deferred outflows of resources:Deferred charge on refunding 89,885 2,915 92,800 Deferred outflows - related to pensions 642,246 642,246 1,284,492
Total deferred outflows of resources 732,131 - 645,161 - 1,377,292 -
Liabilities: Current liabilities:
Accounts payable and accrued expenses 725,445 1,134,173 83,500 1,943,118 Accrued interest payable 761,444 3,650 765,094 Due to other funds 16,087,414 2,743,211 7,372,139 5,290,965 31,493,729 Accrued claims - IBNR - 1,373,999 Current portion of long-term debt 11,124,892 26,062 11,150,954
Total current liabilities 28,699,195 2,743,211 8,536,024 5,374,465 45,352,895 1,373,999
Noncurrent liabilities: Accrued compensated absences 195,772 205,597 401,369 Unearned revenue 107,565 107,565 Net other post-employment benefits obligation 6,997,368 6,997,368 13,994,736 Net pension liability 2,813,544 2,813,544 5,627,088 Bonds and loans payable 77,119,982 48,343 77,168,325
Total noncurrent liabilities 87,234,231 - 10,064,852 - 97,299,083 -
Total liabilities 115,933,426 2,743,211 18,600,876 5,374,465 142,651,978 1,373,999
Deferred inflows of resources:Advanced collections 633,665 633,665 Deferred inflows - revenue 20,992,003 20,992,003 Deferred inflows - related to OPEB 242,169 242,169 484,338 Deferred inflows - related to pension 412,415 412,415 824,830
Total deferred inflows of resources 654,584 21,625,668 654,584 - 22,934,836 -
Net Position: Net investment in capital assets 99,083,356 10,636,523 48,501 109,768,380 Restricted for debt service payments 5,516,046 5,516,046 Unrestricted (94,306) 4,433,550 (4,701,686) 6,166,050 5,803,608 3,082,694
Total Net Position $ 104,505,096 $ 4,433,550 $ 5,934,837 $ 6,214,551 $ 121,088,034 $ 3,082,694
The accompanying notes are an integral part of the financial statements
21

EXHIBIT VI CITY OF WARWICK, RHODE ISLANDSTATEMENT OF REVENUES, EXPENSES AND CHANGES IN NET POSITION - PROPRIETARY FUNDS FOR THE YEAR ENDED JUNE 30, 2018
Business-Type Activities - Enterprise Funds GovernmentalMajor Funds Activities
Sewer Nonmajor InternalSewer Assessment Water Enterprise ServiceFund Fund Fund Funds Total Fund
Operating Revenues:Assessments and user fees $ 15,710,104 $ 4,818,055 $ 10,701,227 $ 719,402 $ 31,948,788 $Other revenues 574,631 (6) 389,882 40,954 1,005,461 45,229,810 Total operating revenues 16,284,735 4,818,049 11,091,109 760,356 32,954,249 45,229,810
Operating Expenses: Contract services 298,074 254,968 553,042 45,034,872 Salaries and benefits 3,801,182 3,062,596 6,863,778 Materials and supplies 884,977 13,732 28,147 926,856 Depreciation and amortization 6,171,092 675,958 6,847,050 Operations 2,783,251 5,850,918 803 8,634,972 Worker’s compensation claims - 413,764
Total operating expenses 13,938,576 - 9,858,172 28,950 23,825,698 45,448,636
Operating Income (Loss) 2,346,159 4,818,049 1,232,937 731,406 9,128,551 (218,826)
Nonoperating Revenues (Expenses):Intergovernmental - Interest income 68,550 3,161 15,735 1,570 89,016 1,298 Interest expense (2,209,745) (7,935) (2,217,680) Capital contributions 8,880 8,880 Loan issuance costs (2,500) (2,500)
Total nonoperating revenues (expenses) (2,134,815) 3,161 7,800 1,570 (2,122,284) 1,298
Income (Loss) Before Contributions and Transfers 211,344 4,821,210 1,240,737 732,976 7,006,267 (217,528)
Transfers In 15,729,768 35,938 15,765,706 Transfers Out (9,473,887) (5,751,242) (35,938) (504,639) (15,765,706)
Total contributions and transfers 6,255,881 (5,751,242) - (504,639) - -
Change in Net Position 6,467,225 (930,032) 1,240,737 228,337 7,006,267 (217,528)
Net Position at Beginning of Year, as Restated 98,037,871 5,363,582 4,694,100 5,986,214 114,081,767 3,300,222
Net Position at End of Year $ 104,505,096 $ 4,433,550 $ 5,934,837 $ 6,214,551 $ 121,088,034 $ 3,082,694
The accompanying notes are an integral part of the financial statements
22

CITY OF WARWICK, RHODE ISLAND STATEMENT OF CASH FLOWS - PROPRIETARY FUNDS FOR THE YEAR ENDED JUNE 30, 2018
Governmental Business-Type Activities - Enterprise Funds Activities
Major Funds
Sewer NonmajorSewer Assessment Water Enterprise Internal Fund Fund Fund Funds Total Service Funds
Cash Flows from Operating Activities: Receipts from customers and users $ 16,617,860 $ 5,733,820 $ 11,163,542 $ 719,402 $ 34,234,624 $Payments to suppliers (4,477,361) (5,987,135) (498,730) (10,963,226) Payments to employees (3,325,623) (3,280,379) (6,606,002) Receipts from insurance charges - 45,658,083 Receipts from other operating services 574,631 (6) 389,882 40,954 1,005,461 436,022 Payments for claims - (45,625,282)
Net cash provided by (used in) operating activities 9,389,507 5,733,814 2,285,910 261,626 17,670,857 468,823
Cash Flows from Noncapital Financing Activities: Interfund borrowings (payments) (43,994) 3,191,246 (11,672) 1,003,298 4,138,878 (468,823) Transfers in from other funds 15,729,768 35,938 15,765,706 Transfers to other funds (9,473,887) (5,751,242) (35,938) (504,639) (15,765,706)
Net cash provided by (used in) noncapital financing activities 6,211,887 (2,559,996) (11,672) 498,659 4,138,878 (468,823)
Cash Flows from Capital and Related Financing Activities: Additions to property, plant and equipment (2,516,392) (88,459) (2,604,851) Capital contributions 8,880 8,880 Principal paid on bonds, loans and leases (11,014,750) (26,271) (11,041,021) Loan issuance costs (2,500) (2,500) Interest paid on bonds, loans and leases (2,237,124) (7,014) (2,244,138) Other nonoperating 1,938,883 1,938,883
Net cash provided by (used in) capital and related financing activities (13,823,003) - (121,744) - (13,944,747) -
Cash Flows from Investing Activities: Interest on investments 69,600 3,161 15,735 1,570 90,066 1,298
Net Increase (Decrease) in Cash and Cash Equivalents 1,847,991 3,176,979 2,168,229 761,855 7,955,054 1,298
Cash and Cash Equivalents at Beginning of Year 17,740,727 384,810 8,153,889 420,892 26,700,318 640,066
Cash and Cash Equivalents at End of Year $ 19,588,718 $ 3,561,789 $ 10,322,118 $ 1,182,747 $ 34,655,372 $ 641,364
Reconciliation of Operating Income (Loss) to Net Cash Provided by (Used in) Operating Activities: Operating income (loss) $ 2,346,159 $ 4,818,049 $ 1,232,937 $ 731,406 $ 9,128,551 $ (218,826) Adjustments to reconcile operating income (loss) to net cash provided by (used in) operating activities:
Depreciation and amortization 6,171,092 675,958 6,847,050 Change in assets and liabilities:
(Increase) decrease in accounts receivable 907,756 3,587,111 462,315 4,957,182 874,195 (Increase) decrease in due from other funds (2,760,977) 63,659 (2,697,318) (Increase) decrease in inventory (12,798) (12,798) (Increase) decrease in deposits with agent (9,900) (Increase) decrease in deferred outflows - related to pensions 398,623 460,042 858,665 Increase (decrease) in accounts payable and accrued expenses (196,307) 154,880 (469,780) (511,207) Increase (decrease) in due to other funds 2,446,225 (73,258) 2,372,967 Increase (decrease) in advanced collections (230,437) (230,437) Increase (decrease) in accrued compensated absences 17,249 (24,900) (7,651) Increase (decrease) in net other post-employment benefits obligation (169,262) (169,262) (338,524) Increase (decrease) in net pension liability (9,343) (697,391) (706,734) Increase (decrease) in deferred inflows - revenue (2,440,909) (2,440,909) Increase (decrease) in deferred inflows - related to pension 238,292 213,728 452,020 (176,646)
Total adjustments 7,043,348 915,765 1,052,973 (469,780) 8,542,306 687,649
Net Cash Provided by (Used in) Operating Activities $ 9,389,507 $ 5,733,814 $ 2,285,910 $ 261,626 $ 17,670,857 $ 468,823
EXHIBIT VII
The accompanying notes are an integral part of the financial statements
23

EXHIBIT VIIICITY OF WARWICK, RHODE ISLANDSTATEMENT OF NET POSITION - FIDUCIARY FUNDS JUNE 30, 2018
Pension Private Purpose AgencyTrust Funds Trust Funds Funds
AssetsCash $ 6,743,202 $ 117,468 $ 1,382,054 Investments, at fair value:
Mutual funds 318,395,311 Equity investments 82,664,094 Index funds 72,216,910 Fixed income securities 56,544,779 Group annuity contracts 4,275,997
Accrued interest receivable 9,569 Other receivable - 38,537 56,013
Total assets 540,849,862 156,005 1,438,067
Liabilities: Accounts payable and accrued expenses 327,593 155,084Due to federal and state governments 97,308Deposits held in custody for others 1,185,675
Total liabilities 327,593 - 1,438,067
Net Position:Restricted for Pension Benefits and Trust Purposes $ 540,522,269 $ 156,005 $ -
The accompanying notes are an integral part of the financial statements
24

EXHIBIT IXCITY OF WARWICK, RHODE ISLANDSTATEMENT OF CHANGES IN NET POSITION - FIDUCIARY FUNDS FOR THE YEAR ENDED JUNE 30, 2018
PrivatePurpose
Pension TrustTrust Funds Funds
AdditionsContributions:
Employer $ 33,022,675 $ 38,252 Plan members 6,656,638 Other income - transfers/miscellaneous 16,729
Total contributions 39,679,313 54,981
Investment income:Investment earnings 44,470,445 227 Less investment expense (1,602,347)
Net investment income 42,868,098 227
Total additions 82,547,411 55,208
Deductions:Benefits 44,994,860 Administrative expense 260,248 41,566
Total deductions 45,255,108 41,566
Change in Net Position 37,292,303 13,642
Net Position at Beginning of Year 503,229,966 142,363
Net Position at End of Year $ 540,522,269 $ 156,005
The accompanying notes are an integral part of the financial statements
25

CITY OF WARWICK, RHODE ISLAND NOTES TO FINANCIAL STATEMENTS JUNE 30, 2018
26
1. SUMMARY OF SIGNIFICANT ACCOUNTING POLICIES
The financial statements of the City of Warwick, Rhode Island (the City) have been prepared in conformity with principles generally accepted in the United States of America as applied to governmental units. The Governmental Accounting Standards Board (GASB) is the accepted standard-setting body for establishing government and financial reporting principles. The following notes to the basic financial statements are an integral part of the City’s Financial Report.
A. Reporting Entity
The City was established in 1642 and incorporated in 1931. In some matters, including the issuance of short- and long-term debt, the City is governed by the general laws of the State of Rhode Island. The City operates under a Council-Mayor form of government and provides the following services as authorized by its charter: public safety (police, fire and inspections), public works (sanitation, highways and streets, engineering and building maintenance), education, parks and recreation, social services and general administrative services.
The City complies with generally accepted accounting principles (GAAP). GAAP include all relevant Government Accounting Standards Boards (GASB) pronouncements. In the government-wide statement of net assets and statement of activities, Financial Accounting Standards Board (FASB) pronouncements and Accounting Principles Board (APB) opinions issued on or before November 30, 1989, have been applied unless those pronouncements conflict with or contradict GASB pronouncements, in which case, GASB prevails. Enterprise funds also apply the same principles. The accounting and reporting framework and the more significant accounting policies are discussed in subsequent subsections of this Note.
In evaluating the inclusion of other separate and distinct legal entities as component units within its financial reporting entity, the City applied the criteria prescribed by GASB Statement No.61. Under GASB Statement No. 61, a legally separate entity is required to be included as a component unit if it is fiscally dependent upon the primary government and there is a financial benefit or burden relationship present. The primary government is financially accountable if it appoints the voting majority of the organization’s governing board and 1) it is able to impose its will on that organization, or 2) there is a potential for the organization to provide specific financial benefits to, or impose specific burdens on, the primary government. A potential component unit has a financial benefit or burden relationship with the primary government if, for example, any one of the following conditions exists:
• The primary government is legally entitled to or can otherwise access the organization’s resources.
• The primary government is legally obligated or has otherwise assumed the obligation to finance the deficits of, or provide financial support to, the organization.
• The primary government is obligated in some manner for the debt of the organization.
The following entity was considered for classification as a component unit:
• Warwick School Department
Although Warwick School Department met certain criteria of the tests listed above, it is not deemed to have separate legal status apart from the City. As a result, the financial data of the Warwick School Department has been included as a major special revenue fund within the City’s financial statements.

CITY OF WARWICK, RHODE ISLAND NOTES TO FINANCIAL STATEMENTS JUNE 30, 2018
27
B. Basis of Presentation
Government-Wide Financial Statements
The statement of net position and statement of activities report information about the reporting government as a whole. They include all funds of the reporting entity except for fiduciary funds. The statements distinguish between governmental and business-type activities. Governmental activities generally are financed through taxes, intergovernmental revenues and other nonexchange revenues. Business-type activities are financed in whole or in part by fees charged to external parties for goods or services.
Fund Financial Statements
Fund financial statements of the reporting entity are organized into funds each of which is considered to be a separate accounting entity. Each fund is accounted for by providing a separate set of self-balancing accounts, which constitute its assets, deferred outflows of resources, liabilities, deferred inflow of resources, fund equity, revenues and expenditures. Funds are organized into three major categories: governmental, proprietary and fiduciary. Major individual governmental funds and enterprise funds are reported as separate columns in the fund financial statements. A fund is considered a major fund if it is the primary operating fund of the City or meets the following criteria:
• Total assets and deferred outflow of resources, liabilities and deferred inflow of resources, revenues, or expenditures of that individual governmental or enterprise fund are at least 10% of the corresponding total for all funds of that category or type, and
• Total assets and deferred outflow of resources, liabilities and deferred inflow of resources, revenues, or expenditures of the individual, governmental fund or enterprise funds are at least 5% of the corresponding total for all governmental and enterprise funds combined.
The funds of the financial reporting entity are described below:
The General Fund is the City’s primary operating fund of the City and is always classified as a major fund. It is used to account for all activities except those legally or administratively required to be accounted for in other funds.
The Special Revenue Funds are used to account for the proceeds of specific revenue sources that are committed or restricted to expenditures for specific purposes other than debt service or capital projects.
The Capital Project Funds are used to account for and report financial resources that are restricted, committed, or assigned to expenditures for capital outlays, including the acquisition or construction of capital facilities and other capital assets.
The Permanent Funds account for assets held by the City pursuant to trust agreements. The principal portion of this fund type must remain intact, but the earnings may be used to achieve the objectives of the fund.

CITY OF WARWICK, RHODE ISLAND NOTES TO FINANCIAL STATEMENTS JUNE 30, 2018
28
The Proprietary Funds are used to account for business-like activities provided to the general public. These activities are financed primarily by user charges and the measurement of financial activity focuses on net income measurement similar to the private sector. Operating revenues of the proprietary funds consist of customer/taxpayer charges for uses and services and certain other miscellaneous revenue. Operating expenses for the enterprise funds include costs of providing services, including administration and depreciation on capital assets. All other expense items not meeting the above criteria are reported as non-operating expenses. The City has three internal service funds which are used to pay insurance expenses relating to workers and employee fringe benefits claims.
The Agency Funds account for assets held by the City in a purely custodial capacity for various student groups, funds held in probate and funds held in escrow for other parties.
The Pension Trust Funds account for the funding and payment of pension benefits provided to police officers, fire fighters and municipal and school employees.
The Private Purpose Trust Funds account for resources legally in trust held by the City under various trust arrangements for the benefit of certain individuals and groups.
Major Funds
The City reports the following major funds:
Fund Brief Description Governmental General Fund: See above description School Unrestricted Fund:
The fund is used to report all financial transactions of the City of Warwick’s School Department, which are not legally required to be accounted for separately. The set aside funds: School Debt Service Fund, Early Childhood, Literacy, Student Equity, Language Assistance, Technology, Building Use, Adult Continuing Education, Athletic Gate Receipts. Summer School and Commercial Foods are included in this fund.
Proprietary Sewer Fund:
Accounts for sewer use fees and the expenses associated with providing sewer services to City residents.
Sewer Assessment Fund:
Accounts for special assessments related to the construction of the City’s sewer system, which are payable over 20 years.
Water Fund:
Accounts for water use fees and the expenses associated with water services to City residents.

CITY OF WARWICK, RHODE ISLAND NOTES TO FINANCIAL STATEMENTS JUNE 30, 2018
29
Measurement Focus
On the government-wide statement of net position and the statement of activities both governmental and business-like activities are presented using the economic resources management focus as defined in item (b) below and the accrual basis of accounting. In the fund financial statements, the "current financial resources" measurement focus or the "economic resources" measurement focus is used as appropriate:
• All governmental funds utilize a "current financial resources" measurement focus and the modified accrual basis of accounting. Only current financial assets, deferred outflow of resources, liabilities and deferred inflow of resources are generally included on their balance sheets. Their operating statements present sources and uses of available spendable financial resources during a given period. These funds use fund balance as their measure of available spendable financial resources at the end of the period. The City considers property taxes as available if they are collected within 60 days after year end.
• The proprietary funds and private purpose trust funds utilize "economic resources" measurement focus and the accrual basis of accounting. The accounting objectives of this measurement focus are the determination of net income, financial position and cash flow. All inflows of resources associated with their activities are reported. Fund equity is classified as net position.
• Agency funds are not involved in the measurement of results of operations; therefore, measurement focus is not applicable to them.
Basis of Accounting
In the government-wide statement of net position and statement of activities, both governmental and business-like activities are presented using the accrual basis of accounting. Under the accrual basis of accounting, revenues are recognized when earned and expenses are recorded when the liability is incurred or economic assets used. Revenues, expenses, gains, losses, assets, deferred outflow of resources, liabilities, and deferred inflow of resources resulting from exchange and exchange-like transactions are recognized when the exchange takes place.
In the fund financial statements, governmental funds are presented on the modified accrual basis of accounting. Under this modified accrual basis of accounting, revenues such as property taxes, are recognized when “measurable and available.” Measurable means knowing or being able to reasonably estimate the amount. Available means collectible within the current period or soon enough thereafter to pay current liabilities. Expenditures (including capital outlay) are recorded when the related fund liability is incurred, except for general obligation bond principal and interest which are reported when due.
All proprietary funds, private purpose trust funds, police, fire & city and school employees’ pension trust funds, and agency funds utilize the accrual basis of accounting. Under the accrual basis of accounting, revenues are recognized when earned and expenses are recorded as when the liability is incurred or the economic asset is used.
Amounts reported as program revenues include, charges to customers or applicants for services or privileges provided, operating grants and contributions, and capital grants and contributions. Internally dedicated resources are reported as general revenues rather than program revenues. Likewise, general revenues include all taxes.

CITY OF WARWICK, RHODE ISLAND NOTES TO FINANCIAL STATEMENTS JUNE 30, 2018
30
Proprietary funds distinguish operating revenues and expenses from nonoperating items. Operating revenues and expenses generally result from providing services in connection with proprietary fund’s principal operation. The principal operating revenue of the enterprises fund are charges for services provided in accordance with the fund's purpose. Operating expenses for the enterprise fund include the costs of providing the services, including administration and depreciation on capital assets. All other revenue and expense items not meeting these criteria are reported as nonoperating revenues and expenses.
Assets, Liabilities, Deferred Outflows/Inflows of Resources and Net Position/Fund Balance
C. Cash
Cash and cash equivalents are carried at cost. Cash equivalents include amounts invested in certificate of deposits as management believes that these certificates can be accessed at any point in time. Substantially, all of the City’s cash and cash equivalents are held in public deposit institutions. Pursuant to Section 35-10-1 of the Rhode Island General Laws, as of October 1, 1991, public institutions are required to insure accounts which hold public funds in excess of the $250,000 which is guaranteed by FDIC. At times, the City pools cash resources of its various funds to facilitate the management of cash and maximize investment returns.
D. Investments
Investments are reported at fair value. Investments are disclosed in accordance with GASB Statement No. 40, Deposits and Investments Risk Disclosures.
E. Accounts and Taxes Receivable
Receivables consist of all revenues earned at year-end and not yet received. Major receivable balances for the governmental activities include property taxes, other receivables and intergovernmental receivable. Business-type activities report service fees as its major receivables.
Accounts receivable and taxes receivable are shown net of an allowance for uncollectible accounts. The allowances are calculated based on the age of the individual receivables. In the fund financial statements, material receivables in governmental funds include revenue accruals such as property taxes collected within 60 days of year-end, grants, and other similar intergovernmental revenues since they are usually both measurable and available. Nonexchange transactions earned/measurable but not yet available are deferred in the fund financial statements in accordance with modified accrual, but not deferred in the government-wide financial statements in accordance with the accrual basis. Proprietary fund material receivables consist of all revenues earned at year end and not yet received. Allowances for uncollectible accounts receivables are based upon historical trends and the periodic aging of accounts receivable. The allowance for uncollectible accounts receivable amounted to $11,546,161 for the general fund and $256,253 for business-type activities at June 30, 2018.
Major receivable balances for the governmental activities include property taxes, amounts due from federal and state government and other receivables (49% of total government receivables). Business- type activities report service fees as its major receivables.
F. Unbilled Services Receivable
Sewer and water revenue is recorded when earned. Customers are billed quarterly. The estimated value of services provided but unbilled at year end has been included in the accompanying financial statements.

CITY OF WARWICK, RHODE ISLAND NOTES TO FINANCIAL STATEMENTS JUNE 30, 2018
31
G. Property Taxes
Real and personal property taxes are based on values assessed as of each December 31 (lien date) and attach as an enforceable lien on property as of July 1 (levy date). Taxes are due in equal quarterly installments on July 15, October 15, January 15 and April 15 annually. Taxes due and unpaid after the respective due dates are subject to interest rate at the rate of 12% per annum, calculated on the unpaid portion of the total tax. An automatic lien is placed on the taxpayer’s property if payment has not been received by the tax due date. Property taxes levied are recorded as receivables in the fiscal year of levy. Property tax revenues are recorded in accordance with the modified accrual basis of accounting in the fund financial statements.
H. Inventory
Inventory is maintained on a periodic system and is stated at cost (first in, first out method of inventory valuation). Inventory consists primarily of materials and supplies. Inventory maintained in governmental funds are recorded as expenditures when at the time of purchase.
I. Capital Assets
The accounting treatment for property, plant and equipment (capital assets) depends on whether the assets are used in governmental fund operations or proprietary fund operations and whether they are reported in the government-wide or fund financial statements.
The government-wide financial statements include all infrastructure assets in accordance with GASB Statement No. 34.
Depreciation of all exhausted capital assets is recorded as an allocated expense in the statement of activities, with accumulated depreciation reflected in the statement of net position.
Depreciation is provided over the assets’ estimated useful lives using the straight-line method of depreciation. The range of estimated useful lives by type of asset is as follows:
Description Useful Life Land improvements 20 yearsBuildings 50 yearsRoads and resurfacing 20 yearsBridges 50 yearsTraffic signals 10 yearsMain extensions 75 yearsPumping stations and hydrants 50 yearsWastewater collection system 50-75 yearsMeters 20-40 yearsDistribution lines 65 yearsMachinery, equipment and furniture 5-30 yearsVehicles 5-8 years

CITY OF WARWICK, RHODE ISLAND NOTES TO FINANCIAL STATEMENTS JUNE 30, 2018
32
Government-Wide Financial Statements
All capital assets are value at historical cost or estimated historical cost if actual is unavailable, except for donated capital assets, which are being recorded at their estimated fair value at the date of donation. Capital assets that are not being depreciated are placed in service using the replacement method of cost for any new assets and the expense is charged to depreciation.
Fund Financial Statements
In the fund financial statements, capital assets used in governmental fund operations are accounted for as capital outlay expenditures of the governmental fund upon acquisition. Capital assets used in proprietary fund operations are accounted for the same as in the government-wide financial statements.
J. Deferred Outflows/Inflows of Resources
In addition to assets, the statement of net position will sometimes report a separate section for deferred outflows of resources. This separate financial statement element, deferred outflows of resources, represents a consumption of net position or fund balance that applies to a future period or periods and so will not be recognized as an outflow of resources (expense/expenditure) until then. The City reports a deferred charge on refunding and deferred outflows related to pension in the government- wide statement of net position. A deferred charge on refunding results from the difference in the carrying value of refunded debt and its reacquisition price. This amount is deferred and amortized over the shorter of the life of the refunded or refunding debt. A deferred outflow of resources related to pension results from differences between expected and actual experience, changes in assumptions or other inputs. These amounts are deferred and included in pension expense in a systematic and rational manner over a period equal to the average of the expected remaining service lives of all employees that are provided with benefits through the pension plan (active employees and inactive employees).
In addition to liabilities, the statement of net position will sometimes report a separate section for deferred inflows of resources. This separate financial statement element, deferred inflows of resources, represents an acquisition of net position or fund balance that applies to a future period or periods and so will not be recognized as an inflow of resources (revenue) until that time. The City reports advance property tax collections in the government-wide statement of net position and in the governmental funds balance sheet. The City also reports deferred inflows of resources related to pensions and OPEB in the government-wide statement of net position. Advance property tax collections represent taxes inherently associated with a future period. This amount is recognized during the period in which the revenue is associated. A deferred inflow of resources related to pension and OPEB results from differences between expected and actual experience, changes in assumptions or other inputs. These amounts are deferred and included in pension and OPEB expense in a systematic and rational manner over a period equal to the average of the expected remaining service lives of all employees that are provided with benefits through the pension plan (active employees and inactive employees). In addition, for governmental funds, the City reports unavailable revenue, which arises only under the modified accrual basis of accounting. The governmental funds report unavailable revenues from several sources: property taxes, other City billings and solid waste management receivables. These amounts are deferred and recognized as an inflow of resources (revenue) in the period in which the amounts become available.

CITY OF WARWICK, RHODE ISLAND NOTES TO FINANCIAL STATEMENTS JUNE 30, 2018
33
K. Inter-fund Transactions
Inter-fund activity within and among the funds of the City have been classified and reported as follows:
Reciprocal Inter-Fund Activities Inter-fund loans are reported as inter-fund receivables in the lending fund and inter-fund payables in borrower funds.
Inter-fund services are reported as revenues in the seller fund and as expenditures on expenses in the purchasing fund.
Nonreciprocal Inter-Fund Activities Inter-fund transfers are reported in governmental funds as other financing uses in the funds making transfers and as other financing sources in the funds receiving transfers. In proprietary funds, transfers are reported after nonoperating revenues and expenses.
Inter-fund reimbursements are repayments from the fund responsible for particular expenditures or expenses to other funds that initially paid for them. Reimbursements are not displayed separately within the financial statements.
Inter-fund transactions are accounted for as expenditures/expenses when they constitute reimbursements from one fund to another. These transactions are accounted for as expenditures/expenses in the reimbursing fund and are recorded as reductions of expenditures/expenses in the fund receiving the reimbursement. All other inter-fund transactions are reported as transfers.
L. Taxes Collected in Advance
Tax collected in advance pertains to property taxes levied on June 30, 2018 (for fiscal year 2019) and paid prior to June 30, 2018. These advance payments could not be recognized as revenue in fiscal year 2018 and instead were reported as deferred inflows at June 30, 2018.
M. Self-Insurance
The City’s self-insurance costs for health and general liabilities are accounted for in the City’s internal service funds. Claims incurred but not paid, including those which have not been reported, are accounted for as expenses and accrued claims in those funds when incurred.
N. Encumbrances
Encumbrance accounting, under which purchase orders, contracts, and other commitments for the expenditure of funds are recorded in order to reserve that portion of the applicable appropriation, is employed in governmental funds. Open encumbrances at year end are reported as restricted, committed or assigned, and should not result in separate display of the encumbered amount within those classifications. Encumbrances do not constitute expenditures or liabilities under generally accepted accounting principles.

CITY OF WARWICK, RHODE ISLAND NOTES TO FINANCIAL STATEMENTS JUNE 30, 2018
34
O. Net Position/Fund Balance Classifications
Government-Wide Statements
Net position is classified as net assets and displayed in three components:
• Net investment in capital assets, net of related debt - consists of capital assets including restricted capital assets, net of accumulated depreciation and reduced by the outstanding balances of any bond, mortgages, notes, or other borrowings that are attributable to the acquisition, construction, or improvement of those assets.
• Restricted net position - Consists of net position with constraints placed on the use either by external groups such as creditors, grantors, contributors, laws/regulations of other governments, law through constitutional provisions, or enabling legislation.
• Unrestricted net position - All remaining net position that does not meet the definition of “restricted” or “invested in capital assets, net of related debt.”
Fund Financial Statements
Governmental fund equity is classified as fund balance in accordance with GASB Statement No. 54, Fund Balance Reporting and Governmental Fund Type Definitions. Fund balance is classified as nonspendable, restricted, committed, assigned or unassigned. These categories are described below:
• Nonspendable - Includes the amount of fund balances that cannot be spent because it is either not in spendable form or legally or contractually required to be maintained intact.
• Restricted - Includes amounts that are restricted to specific purposes. Fund balance is reported as restricted when constraints placed in the use of resources are either externally imposed by creditors, grantors, contributors, or laws or regulations of other governments, or imposed by law through constitutional provisions or enabling legislation.
• Committed Fund Balance - Includes amounts that can be used only for the specific purposes pursuant to constraints imposed by formal action of the government's highest level of decision-making authority. Those committed amounts cannot be used for any other purpose unless the government removes or changes the specified use by taking the same type of action it employed to previously commit those amounts. The City Council is the highest level of decision-making authority and utilizes City Ordinances as a formal procedure to commit fund balance. In addition, the passage of the budget by the taxpayers at the annual financial City meeting is considered the commitment of funds for the line items included in the fiscal budget.
• Assigned Fund Balance - Includes amounts that are constrained by the government's intent to be used for specific purposes, but are neither restricted nor committed. The intent should be expressed by the governing-body itself or a body (a budget or finance committee) or official to which the governing-body has delegate the authority to assign amounts to be used for specific purposes. The Mayor through the City Council has the authority to assign fund balance. Fund balance assigned by the Finance Director is documented through issuance of a memorandum
• Unassigned Fund Balance - Is the residual classification for the General Fund. This classification represents fund balance that has not been assigned to other funds and that has not been restricted, committed, or assigned to specific purposes within the General Fund. The unassigned fund balance may also include negative balances for any governmental funds if the expenditures exceed amounts restricted, committed or assigned for specific purposes.

CITY OF WARWICK, RHODE ISLAND NOTES TO FINANCIAL STATEMENTS JUNE 30, 2018
35
Application of Funds
The following policy has been established by the City in order to address the implementation of Governmental Accounting Standards Board (GASB) Statement No., 54, Fund Balance Reporting and Governmental Funds Definitions. The policy is created in consideration of unanticipated events that could adversely affect the financial condition of the City and jeopardize the continuation of necessary public service. The policy ensures that the City maintains an adequate fund balance and reserves in order to:
• Provide sufficient cash flow for daily financial needs • Provide funds for unforeseen expenditures related to emergencies • Offset significant economic downturns or revenue shortfalls • Maintain investment grade bond ratings The City maintains a spending policy in accordance with GASB Statement No. 54, Fund Balance Reporting and Governmental Fund Type Definitions. This policy states when an expenditure is incurred for purposes for which both restricted and unrestricted amounts are available, it shall be the policy of the City is to consider restricted amounts to have been used first. When expenditure is incurred for purposes for which amounts in any of the unrestricted fund balance classifications could be used, it shall be the policy of the City that committed funds would be spent first, followed by assigned amounts and then unassigned amounts.
Proprietary fund equity is classified the same as in the government-wide statements.
P. Judgments and Claims
Liabilities for legal cases and other claims against governmental funds are recorded when the ultimate liability can be estimated and such cases are expected to be liquidated with expendable available financial resources. Proprietary fund types record these liabilities using the accrual basis of accounting.
Q. Compensated Absences
Under the terms of various contracts and agreements, City employees are granted vacation, sick and personal leave in varying amounts based on length of service and bargaining unit. Unused vacation leave is paid upon an employee’s termination. Up to one-half of unused sick-leave is paid upon termination, retirement or death depending on bargaining unit. Severance pay and personal days are also paid to terminating employees depending on bargaining unit. The liability is calculated at the rate of pay in effect at June 30, 2017. The City estimates the long-term versus short-term amount of earned but unpaid vacation and sick leave relating to governmental fund employees and records it in the applicable section of the liabilities in the government-wide financial statements.
R. Pensions
For purposes of measuring the net pension liability (asset), deferred outflows of resources and deferred inflows of resources related to pensions, and pension expense, information about the fiduciary net position of the City’s various pension plans (described in greater detail in Note 14) and additions to/deductions from the pension plans net position have been determined on the same basis as they are reported by the pension plans. For this purpose, benefit payments (including refunds of employee contributions) are recognized when due and payable in accordance with the benefit terms. Investments are reported at fair value.

CITY OF WARWICK, RHODE ISLAND NOTES TO FINANCIAL STATEMENTS JUNE 30, 2018
36
S. Total Other Postemployment Benefits other than Pensions (OPEB) Liability
The total OPEB liability is measured as the portion of the actuarial present value of projected benefits that is attributed to past periods of employee service. The total OPEB liability is measured as of a date (measurement date) no earlier than the end of the employer’s prior fiscal year and no later than the end of the current fiscal year, consistently applied from period to period.
T. Estimates
The preparation of financial statements in conformity with accounting principles generally accepted in the United States of America requires management to make estimates and assumptions that affect the reported amounts of assets and liabilities and disclosure of contingent assets and liabilities at the date of the financial statements and the reported amounts of revenues and expenditures/expenses during the reporting period. Actual results could differ from those estimates.
U. Recent Accounting Pronouncements
The GASB has issued several pronouncements that have effective dates that may impact future financial presentations.
Management has not currently determined what, if any, impact implementation of the following statements may have on the financial statements.
GASB Statement No. 83, Certain Asset Retirement Obligations This Statement addresses accounting and financial reporting for certain asset retirement obligations (AROs). An ARO is a legally enforceable liability associated with the retirement of a tangible capital asset. A government that has legal obligations to perform future asset retirement activities related to its tangible capital assets should recognize a liability based on the guidance in this Statement. The requirements of this Statement are effective for reporting periods beginning after June 15, 2018. Earlier application is encouraged.
GASB Statement No. 84, Fiduciary Activities The objective of this Statement is to improve guidance regarding the identification of fiduciary activities for accounting and financial reporting purposes and how those activities should be reported. This Statement establishes criteria for identifying fiduciary activities of all state and local governments. The focus of the criteria generally is on 1) whether a government is controlling the assets of the fiduciary activity, and 2) the beneficiaries with whom a fiduciary relationship exists. Separate criteria are included to identify fiduciary component units and postemployment benefit arrangements that are fiduciary activities. The requirements of this Statement are effective for reporting periods beginning after December 15, 2018. Earlier application is encouraged.
GASB Statement No. 87, Leases The objective of this Statement is to better meet the information needs of financial statement users by improving accounting and financial reporting for leases by governments. This Statement increases the usefulness of governments’ financial statements by requiring recognition of certain lease assets and liabilities for leases that previously were classified as operating leases and recognized as inflows of resources or outflows of resources based on the payment provisions of the contract. It establishes a single model for lease accounting based on the foundational principle that leases are financings of the right to use an underlying asset. Under this Statement, a lessee is required to recognize a lease liability and an intangible right-to-use lease asset, and a lessor is required to recognize a lease receivable and a deferred inflow of resources, thereby enhancing the relevance and consistency of information about governments’ leasing activities. The requirements of this Statement are effective for reporting periods beginning after December 15, 2019. Earlier application is encouraged.

CITY OF WARWICK, RHODE ISLAND NOTES TO FINANCIAL STATEMENTS JUNE 30, 2018
37
2. STEWARDSHIP, COMPLIANCE AND ACCOUNTABILITY
A. Budgetary Data and Budgetary Compliance
In accordance with the Warwick City charter, the City has formally established budgetary accounting control for the General Fund and the School Unrestricted Fund, which is a Special Revenue Fund. The General Fund is subject to an annual operating budget submitted and recommended by City Mayor and adopted by the City Council. The City Council must hold a public hearing on the budget prior to adoption and may make changes to the budget. The General Fund Budget must be adopted no later than June 15. Should the City Council take no formal action on or prior to such day, the budget as submitted by the Mayor, shall be deemed to have been finally adopted by the City Council. The School Unrestricted Fund is subject to an annual operating budget provisionally approved by the School Committee, forwarded to the Mayor, for his review and possible amendment, with final adoption by the City Council. The annual operating budgets; appropriation amounts are supported by revenue estimates and take into account the elimination of accumulated deficits and the re-appropriation of accumulated surpluses to the extent necessary. The City’s General Fund and School Unrestricted Fund annual operating budgets are in conformance with the legally enacted budgetary basis, which is not in conformance with accounting principles generally accepted in the United States of America. The accompanying budgetary comparison schedules are reflected on the budgetary basis. The difference between the budgetary basis and the accounting principles generally accepted in the United States of America basis is explained below.
The City of Warwick makes use of an encumbrance system. Encumbrances are commitments related to unperformed contracts for goods and services. When a purchase order or commitment is placed, the City reduces the amount of the budgetary authority remaining in a budget category and records an encumbrance. When goods or services are received, the encumbrance balance is reduced and an expenditure and liability is recorded. The City’s outstanding encumbrances at year-end are carried forward as a component of committed fund balance.
Appropriations in addition to those contained in the annual operating budgets, except for the purpose of meeting a public emergency, are made upon the recommendation of the City Mayor and by a resolution adopted by the favorable votes of at least five members of the council. Amendments to the operating budgets that do not result in additional appropriations may be made within departments by means of a transfer. The Director of Finance, subject to approval of the Mayor, may at any time transfer any unencumbered appropriation balance or portion thereof between general classifications of expenditures within an office, department or agency. At the request of the Mayor and within the last three months of the fiscal year, the Council may by resolution transfer any unencumbered appropriation balance or portion thereof from one office, department or agency to another. The level at which General Fund expenditures may not legally exceed appropriations is at the department level. The Schools Unrestricted Fund, a Special Revenue Fund, does not have a legal level of control over expenditures, except that total expenditures may not exceed available revenues. Appropriations which are not expended or encumbered lapse at year end.

CITY OF WARWICK, RHODE ISLAND NOTES TO FINANCIAL STATEMENTS JUNE 30, 2018
38
B. Excess of Expenditures over Appropriations
For the year ended June 30,2018, expenditures exceeded appropriations in the following categories:
Probate court $ 13,345 Finance administration 25,707 Fire department 1,613,006 Organized crime/drug enforcement task force 2,888 Alcohol and highway safety enforcement 28,621 Administrative division 7,729 Sanitation division 137,261 Employee benefits 86,151 Insurance 193,214 Postage 15,329 Fixed costs 44,157 Pension 152,989 Operating transfer to school unrestricted fund 10,350
3. CASH DEPOSITS WITH FINANCIAL INSTITUTIONS
A. Deposits
Substantially, all of the City’s cash and cash equivalents are held in public deposit institutions. Pursuant to Section 35-10-1 of the Rhode Island General Laws, as of October 1, 1991, public deposit institutions are required to insure accounts that hold public funds in excess of the $250,000 that is guaranteed by FDIC. At times, the City pools cash resources of its various funds to facilitate the management of cash and maximize investment returns.
B. Deposit Custodial Credit Risk
Custodial credit risk in the case of deposits is the risk that in the event of a bank failure, the City’s deposits may not be returned. The State of Rhode Island requires that certain uninsured deposits be collateralized. Section 35-10.1-7 of the General Laws of the State of Rhode Island, dealing with the collateralization of public deposits, requires that all time deposits with maturities of greater than 60 days and all deposits in institutions that do not meet the minimum capital requirements of its federal regulator must be collateralized. The City does not have a formal deposit policy for custodial credit risk, but is governed by State laws as described above.
As of June 30, 2018, the City’s entire bank balance of $55,419,181 was covered by either FDIC insurance or collateral held in the City’s name.
C. Cash Equivalents
Cash equivalents are short-term, highly liquid investments that are both readily convertible to known amounts of cash and purchased within 90 days of maturity. As of June 30, 2018, cash equivalents amounted to $17,588,715. The cash equivalents consisted of money market type mutual funds held at banking institutions and were not rated.

CITY OF WARWICK, RHODE ISLAND NOTES TO FINANCIAL STATEMENTS JUNE 30, 2018
39
4. INVESTMENTS
The City invests in various types of investments, which are stated at fair value, except for nonparticipating interest earning investment contracts, which are recorded at amortized cost. By Charter the Finance Director and Treasurer have the authority to make investments subject to rules and regulations that the City Council may prescribe by ordinance. The Finance Director shall have the authority to purchase and invest prudently in the following investments for funds other than pension funds:
• Obligations of the United States government, and its agencies and instrumentalities. • Certificates of deposit and other evidence of deposit at banks, credit unions, and savings and loan
associations with offices in the State. • Bankers’ acceptance of banks with offices in the State. • Commercial paper of banks with offices in the State. • Repurchase agreements whose underlying collateral consists of U.S. government agency securities
and U.S. government sponsored corporations, plus the above, and which are offered by banks with offices in the State.
• Money market funds whose portfolios consist of the above instruments, and any other investments specifically approved by the City council.
• No-load open-end diversified management investment companies incorporated under Rhode Island General Laws designed exclusively for all State government entities, agencies and instrumentalities.
Interest Rate Risk
This is the risk that changes in market interest rates will adversely affect the fair value of an investment. Generally, the longer the maturity of an investment the greater the sensitivity of its fair value to changes in market interest rates. The City has no investments that are subject to interest rate risk.
Credit Risk
Generally, credit risk is the risk that an issuer of a debt type investment will not fulfill its obligation to the holder of the investment. This is measured by assignment of a rating by nationally recognized rating organization. U.S. government securities or obligations explicitly guaranteed by the U.S. government are not considered to have credit risk exposure. The City has no formal investment policy that limits investment choices for its pension funds.
Concentration of Credit Risk
The City does not have a formal investment policy that limits the amount that can be invested with one issuer. Currently, the City has no investments, to which this requirement applies, in any one issuer that represents more than 5% of the total investments.
Custodial Credit Risk
Custodial credit risk is the risk that in the event of financial institution failure, the City’s deposits and/or investments may not be returned. The City does not believe that it has significant custodial credit risk as substantially all investments securities are registered and held in the name of the City. Additionally, the City places deposits in financial institutions that are FDIC insured up to $250,000, rated "well capitalized" on its most recent audited financial statement/SEC filings if deposits exceed engage an outside rating agency to determine status of the institution. The City also ensures that all uninsured deposits greater than $250,000 are collateralized.

CITY OF WARWICK, RHODE ISLAND NOTES TO FINANCIAL STATEMENTS JUNE 30, 2018
40
The following is a schedule of the City’s Investments by classification:
Fair Value Less than 1 1-10 More than 10
Interest-bearing investments at fair value:Fixed income securities $ 56,544,779 $ - $ 56,544,779 $ -
Equity investments 82,664,094 Mutual funds 318,395,311 Index funds 72,216,910 Group annuity contracts 4,275,997
Total Investments $ 534,097,091
Investment Maturities (Years)
Presented below is the ratings of the City’s fixed income securities:
FixedAverage IncomeRating Securities
AAA $ 3,343,758 AA 1,679,482 A 7,305,303
BBB 12,975,766 BB 396,630 B 573,223
Unrated 30,270,617
$ 56,544,779
The City categorizes its fair value measurements within the fair value hierarchy established by generally accepted accounting principles. The hierarchy gives the highest priority to unadjusted quoted prices in active markets for identical assets or liabilities (Level 1 measurements); followed by quoted prices in inactive markets or for similar assets or with observable inputs (Level 2 measurements); and the lowest priority to unobservable inputs (Level 3 measurements). The City has the following recurring fair value measurements as of June 30, 2017:
Fair Value Level 1 Level 2 Level 3Investments by fair value level:
Fixed income securities $ 56,544,779 $ $ 56,544,779 $Equity investments 82,664,094 82,664,094 Mutual funds 72,216,910 72,216,910 Index funds 318,395,311 318,395,311 Group annuity contracts 4,275,997 4,275,997
Total Investments by Fair Value $ 534,097,091 $ 473,276,315 $ 56,544,779 $ 4,275,997

CITY OF WARWICK, RHODE ISLAND NOTES TO FINANCIAL STATEMENTS JUNE 30, 2018
41
5. STEWARDSHIP, COMPLIANCE AND ACCOUNTABILITY
Legal Debt Margin
The City’s legal debt margin as set forth by the State Statute is limited to 3% of total taxable assessed value, which approximates $278,457,754. As of June 30, 2018, the City’s debt applicable to the debt limitation is under the debt limit by $232,545,223. All other City debt has been incurred through special statutory authority which consists of approval by the legislature and voter referendum.
6. PROPERTY TAXES
The City is responsible for assessing, collecting and distributing property taxes in accordance with enabling state legislation.
Net property taxes levied for the fiscal year 2018 were based on a gross assessed value of approximately $9,647,107,318 less exemptions of $365,182,189 for a net assessed valuation of $9,281,925,129 at December 31, 2016 and amounted to a levy of $230,002,820. After abatements and adjustments, the net levy amounted to $223,451,549. Collections through June 30, 2018 amounted to $223,451,549, which represents approximately 97.4% of the adjusted tax levy.
The City recognizes property tax revenues in accordance with Section P70, “Property Taxes” of the Codification of Governmental Accounting and Financial Reporting Standards on the fund statements. Unpaid property taxes as of June 30, 2018 amount to $18,808,835 and are recorded as a receivable, net of an allowance for uncollectible property taxes of $12,516,278.
Those net property taxes receivable, which were not collected within the 60 days immediately following June 30, 2018 are recorded as deferred and amounted to $4,572,171. Property taxes recognized as revenue on the fund statements for the fiscal year ended June 30, 2018 (due to their collection within the 60 days immediately following June 30, 2018) amounted to $1,720,385. Taxes are due in equal quarterly installments on July 15, October 15, January 15 and Apri1 15 during fiscal year.
7. RECEIVABLES
Below is the detail receivables as of year end for each major fund and the aggregate remaining funds, including the applicable allowances for uncollectible accounts:
School Sewer NonmajorRestricted Sewer Assessment Water and Other
General Fund Fund Fund Fund Funds Total
Receivables: Property taxes $ 17,838,718 $ $ $ $ $ $ 17,838,718 Water and sewer use fees 5,401,264 3,381,025 8,782,289 Sewer assessment 25,240,640 25,240,640 Due from federal and state 4,249,059 433,408 11,936,334 12,427,383 29,046,184 Other receivable 1,849,426 283,952 4,503,195 6,636,573
Gross receivables 23,937,203 717,360 17,337,598 25,240,640 3,381,025 16,930,578 87,544,404
Less allowance for uncollectibles (11,546,161) (150,497) (105,756) (11,802,414)
Net Total Receivables $ 12,391,042 $ 717,360 $ 17,187,101 $ 25,240,640 $ 3,275,269 $ 16,930,578 $ 75,741,990

CITY OF WARWICK, RHODE ISLAND NOTES TO FINANCIAL STATEMENTS JUNE 30, 2018
42
8. CAPITAL ASSETS
Capital asset activity for governmental funds for the fiscal year ended June 30, 2018 was as follows:
Beginning EndingBalance Increases Decreases Transfers Balance
Governmental activities: Nondepreciable assets:
Land $ 18,680,138 $ 13,687 $ $ $ 18,693,825 Construction in progress 2,098,857 8,762,076 10,860,933 Artwork 62,950 62,950
Total nondepreciable assets 20,841,945 8,775,763 - - 29,617,708
Depreciable assets: Land improvements 11,082,066 11,082,066 Buildings 137,552,253 764,771 138,317,024 Infrastructure 200,306,010 980,155 201,286,165 Machinery and equipment 20,869,769 443,136 21,312,905 Motor vehicles 32,252,110 397,547 767,095 31,882,562
Total depreciable assets 402,062,208 2,585,609 767,095 - 403,880,722
Less accumulated depreciation for: Land improvements 9,457,184 255,291 9,712,475 Buildings 67,470,296 3,083,200 70,553,496 Infrastructure 181,624,495 1,708,392 183,332,887 Machinery and equipment 19,576,938 430,963 20,007,901 Motor vehicles 23,914,853 1,775,138 767,095 24,922,896
Total accumulated depreciation 302,043,766 7,252,984 767,095 - 308,529,655
Depreciable capital assets, net 100,018,442 (4,667,375) - - 95,351,067
Governmental Activities Capital Assets, Net $ 120,860,387 $ 4,108,388 $ - $ - $ 124,968,775
Beginning EndingBalance Increases Decreases Transfers Balance
Business-type activities: Nondepreciable assets:
Construction in progress $ 16,781,582 $ 1,631,170 $ $ (15,401,454) $ 3,011,298 Total nondepreciable assets 16,781,582 1,631,170 - (15,401,454) 3,011,298
Depreciable assets: Buildings 2,900,797 2,900,797 Machinery, equipment and furniture 5,771,244 241,875 14,226 5,998,893 Water distribution system and wastewater collection system 283,284,222 731,806 671,348 15,401,454 298,746,134
Total depreciable assets 291,956,263 973,681 685,574 15,401,454 307,645,824
Less accumulated depreciation for: Buildings 1,133,239 44,518 1,177,757 Machinery, equipment and furniture 3,895,205 404,172 14,226 4,285,151 Water distribution system and wastewater collection system 113,444,278 6,398,360 671,348 119,171,290
Total accumulated depreciation 118,472,722 6,847,050 685,574 - 124,634,198
Depreciable capital assets, net 173,483,541 (5,873,369) - 15,401,454 183,011,626
Business-Type Activities Capital Assets, Net $ 190,265,123 $ (4,242,199) $ - $ - $ 186,022,924

CITY OF WARWICK, RHODE ISLAND NOTES TO FINANCIAL STATEMENTS JUNE 30, 2018
43
Depreciation expense was charged to functions/programs as follows:
Governmental activities:Executive and administration $ 60,379 Public safety 1,517,112 Recreation 398,079 Public libraries 229,330 Social services 59,459 Planning and economic development 82,297 Public works 2,700,501 Education 2,205,827
Total Governmental Activities and Depreciation Expense $ 7,252,984
Business-type activities:Water $ 675,958 Sewer 6,171,092
Total Business-Type Activities Depreciation Expense $ 6,847,050
9. LONG-TERM LIABILITIES
A. Long-Term Liabilities
Long-term liability activity for the governmental activities for the year ended June 30, 2018 was as follows:
Beginning AmountsBalance Ending Due Within
(as restated) Additions Reductions Balance One Year
Governmental Activities:Long-term debt:
General obligation bonds $ 46,554,440 $ 4,460,000 $ 5,101,909 $ 45,912,531 $ 4,170,196 Capital lease payable 5,905,962 321,207 1,433,570 4,793,599 1,443,798 Plus amortized premium bonds 1,504,538 429,773 225,741 1,708,570
Total long-term debt 53,964,940 5,210,980 6,761,220 52,414,700 5,613,994
Other long-term liabilities:Compensated absences 12,723,194 438,643 12,284,551 2,458,000 Accrued retroactive payroll 1,198,141 25,576 1,172,565 Net pension liability 456,769,388 8,853,508 447,915,880 Total OPEB liability 395,744,541 7,929,591 11,839,282 391,834,850
Total other long-term liabilities 866,435,264 7,929,591 21,157,009 853,207,846 2,458,000
Governmental Activities Long-Term Liabilities $ 920,400,204 $ 13,140,571 $ 27,918,229 $ 905,622,546 $ 8,071,994

CITY OF WARWICK, RHODE ISLAND NOTES TO FINANCIAL STATEMENTS JUNE 30, 2018
44
Beginning AmountsBalance Ending Due Within
(as restated) Additions Reductions Balance One Year
Business-Type Activities:Long-term debt:
Bonds payable $ 10,133,560 $ $ 1,514,091 $ 8,619,469 $ 1,311,805 Loans payable 88,876,654 9,473,886 79,402,768 9,839,149 Amortized premium on bond 350,086 53,044 297,042 Net pension liability 6,333,822 706,734 5,627,088 Total OPEB liability 14,333,260 560,100 898,624 13,994,736
Total long-term debt 120,027,382 560,100 12,646,379 107,941,103 11,150,954
Other long-term liabilities:Compensated absences 409,020 7,651 401,369
Business-Type Activities Long-Term Liabilities $ 120,436,402 $ 560,100 $ 12,654,030 $ 108,342,472 $ 11,150,954
Payments on the bonds and capital leases payable that pertain to the City’s Governmental Activities are made by the Debt Service Fund. The compensated absences liability attributable to the Governmental Activities will be liquidated by the City’s General Fund and School Unrestricted Fund. The net pension obligation and net other post-employment benefits obligation attributable to the Governmental Activities will be liquidated by the City’s General Fund and School Unrestricted Fund. The accrued retroactive payroll will be paid by the School Unrestricted Fund.
B. Schedule of Bonds and Loans Payable
Outstanding Less OutstandingDate of Interest Date of Authorized Principal Maturities New PrincipalIssue Rate Maturity and Issued July 1, 2017 During Year Issues June 30, 2018
Governmental FundsGeneral fund:
School 4/30/2008 3.5/4.2 8/1/2017 $ 9,740,114 $ 542,022 $ 542,022 $ $ - School - RIHEBC 6/15/2010 5.75% 4/1/2027 3,908,000 3,908,000 3,908,000 School - RIHEBC 11/15/2010 6.29% 4/1/2027 4,212,000 4,212,000 4,212,000 School 5/26/2011 3.0/5.0 1/15/2022 8,713,480 4,779,813 994,434 3,785,379 School - RIHEBC 6/15/2013 3.52% 5/15/2033 4,295,000 3,435,000 215,000 3,220,000 School - RIHEBC 8/6/2014 3.63% 5/5/2034 3,370,000 2,960,000 135,000 2,825,000 School - refunding 8/12/2015 1.5/4.0 8/1/2025 7,140,621 6,033,910 696,875 5,337,035 School - RIHEBC 8/17/2016 3.72% 5/15/2036 4,755,000 4,625,000 175,000 4,450,000 School - RIHEBC 10/16/2017 3.72% 4/16/2032 4,460,000 - 120,000 4,460,000 4,340,000 Highway/drainage - refunding 4/30/2008 3.5/4.2 8/1/2017 685,646 88,989 88,989 - Highway/drainage - refunding 8/12/2015 1.5/4.0 8/1/2025 1,125,836 951,279 109,857 841,422 Fire 4/30/2008 3.5/4.2 8/1/2017 424,435 40,449 40,449 - Open space - refunding 4/30/2008 3.5/4.2 8/1/2017 870,396 91,011 91,011 - Open space - refunding 5/26/2011 3.0/5.0 1/15/2022 2,085,827 1,188,287 237,065 951,222 City buildings 5/26/2011 3.0/5.0 1/15/2022 1,266,653 753,715 143,244 610,471 City buildings 8/12/2015 2.0/4.5 8/1/2035 3,455,000 3,331,040 127,139 3,203,901 Library - refunding 4/30/2008 3.5/4.2 8/1/2017 2,546,610 242,697 242,697 - Recreation 4/30/2008 3.5/4.2 8/1/2017 870,396 91,011 91,011 - Recreation - refunding 5/26/2011 3.0/5.0 1/15/2022 1,830,556 905,555 211,111 694,444
Recreation - refunding 8/12/2015 1.5/4.0 8/1/2025 1,509,106 1,274,599 147,125 1,127,474
Public safety 8/12/2015 1.5/4.0 8/1/2025 3,928,436 3,320,128 383,525 2,936,603
Transportation 4/30/2008 3.5/4.2 8/1/2017 1,004,699 101,124 101,124 - Fire station 8/12/2015 2.0/4.5 8/1/2035 1,980,000 1,908,960 72,861 1,836,099 Animal shelter - refunding 5/26/2011 3.0/5.0 1/15/2022 610,184 301,851 70,370 231,481 Municipal road and bridge loan 7/17/2014 .76/3.3 9/1/2034 1,600,000 1,468,000 66,000 1,402,000
Total Governmental Funds Bonds Payable $ 76,387,995 $ 46,554,440 $ 5,101,909 $ 4,460,000 $ 45,912,531

CITY OF WARWICK, RHODE ISLAND NOTES TO FINANCIAL STATEMENTS JUNE 30, 2018
45
Outstanding OutstandingDate of Interest Date of Authorized Principal Maturities New PrincipalIssue Rate Maturity and Issued July 1, 2017 During Year Issues June 30, 2018
Enterprise FundsBonds payable: Water:
Water - refunding 5/26/2011 3.0/5.0 1/15/2022 $ 319,171 $ 196,983 $ 35,938 $ $ 161,045 Water - refunding 8/12/2015 1.5/4.0 8/1/2025 (128,393) (105,049) (11,672) (93,377)
Total water bonds payable 190,778 91,934 24,266 - 67,668 Sewer:
Sewer - refunding 4/30/2008 3.5/4.2 8/1/2017 3,066,990 242,697 242,697 - Sewer - refunding 5/26/2011 3.0/5.0 1/15/2022 2,164,129 1,148,796 247,838 900,958 Sewer - refunding 8/12/2015 1.5/4.0 8/1/2025 10,234,394 8,650,133 999,290 7,650,843
Total sewer bonds payable 15,465,513 10,041,626 1,489,825 - 8,551,801
Total Enterprise Funds Bonds Payable $ 15,656,291 $ 10,133,560 $ 1,514,091 $ - $ 8,619,469
Loans payable: Sewer - RIIB Loan 6/26/1998 2.57 9/1/2019 $ 10,200,000 $ 1,882,177 $ 608,455 $ $ 1,273,722 Sewer - RIIB Loan 8/25/1999 2.84 9/1/2019 14,750,000 3,001,112 972,529 2,028,583 Sewer - RIIB Loan 12/19/2000 2.90 9/1/2020 20,232,323 5,020,883 1,201,893 3,818,990 Sewer - RIIB Loan 4/25/2002 1.25 9/1/2022 12,000,000 4,367,371 675,320 3,692,051 Sewer - RIIB Loan 10/24/2002 1.00 9/1/2022 20,000,000 7,357,028 1,151,569 6,205,459 Sewer - RIIB Loan 11/13/2003 1.34 9/1/2024 20,000,000 8,905,000 1,035,000 7,870,000 Sewer - RIIB Loan 12/30/2004 1.40 9/1/2025 20,000,000 9,889,000 1,016,000 8,873,000 Sewer - RIIB Loan 12/15/2005 1.41 9/1/2026 5,000,000 2,500,000 250,000 2,250,000 Sewer - RIIB Loan 12/21/2006 1.27 9/1/2027 9,500,000 5,225,000 475,000 4,750,000 Sewer - RIIB Loan 12/12/2007 1.69/2.15 9/1/2026 6,942,000 4,166,000 347,000 3,819,000 Sewer - RIIB Loan 10/6/2009 1.26/3.35 9/1/2029 1,169,026 762,183 58,120 704,063 Sewer - RIIB Loan 3/6/2014 2.71 9/1/2034 7,000,000 6,434,000 286,000 6,148,000 Sewer - RIIB Loan 7/30/2015 .69/2.89 9/1/2034 10,574,900 10,116,900 462,000 9,654,900 Sewer - RIIB Loan 6/2/2016 .37/2.41 9/1/2035 8,000,000 8,000,000 356,000 7,644,000 Sewer - RIIB Loan 4/13/2017 .71/2.57 9/1/2036 3,730,000 3,730,000 3,730,000 Sewer conduit 4/30/2008 4.85 3/1/2028 4,000,000 2,645,000 190,000 2,455,000 Sewer conduit 6/26/2012 3.29 9/1/2022 2,400,000 1,529,000 235,000 1,294,000 Sewer conduit/admin 3/31/2015 1.95 9/1/2034 3,500,000 3,346,000 154,000 3,192,000
Total Enterprise Funds Bonds Payable $ 178,998,249 $ 88,876,654 $ 9,473,886 $ - $ 79,402,768
C. Debt Maturity
Debt service requirements at June 30, 2018 were as follows:
Governmental Activities
YearEnded Total
June 30, Principal Interest Debt Service
2019 $ 4,170,196 $ 1,252,821 $ 5,423,017 2020 4,303,700 1,121,877 5,425,577 2021 4,423,341 1,006,853 5,430,194 2022 3,419,415 901,014 4,320,429 2023 2,691,551 800,429 3,491,980
2024-2028 17,448,328 2,832,930 20,281,258 2029-2033 6,966,000 1,205,683 8,171,683 2034-2037 2,490,000 137,901 2,627,901
$ 45,912,531 $ 9,259,508 $ 55,172,039
Note - does not include voluntary payments to School RlHEBC bond sinking fund

CITY OF WARWICK, RHODE ISLAND NOTES TO FINANCIAL STATEMENTS JUNE 30, 2018
46
Business-Type Activities
YearEnded Total
June 30, Principal Interest Debt Service
2019 $ 1,311,805 $ 226,459 $ 1,538,264 2020 1,349,300 194,486 1,543,786 2021 1,381,659 163,383 1,545,042 2022 1,216,585 132,514 1,349,099 2023 1,131,449 94,746 1,226,195
2024-2027 2,228,671 100,011 2,328,682
$ 8,619,469 $ 911,599 $ 9,531,068
School RIHEBC Bonds
The proceeds from the bonds were used to finance the acquisition, construction, furnishing and equipping of schools and school facilities, including but not limited to various school renovation projects, and to pay the costs of issuance. The $3,908,000 bond and $4,212,000 bond require sinking fund deposits to be held on deposit by the trustee and will be paid to the bondholders in full May 2027 for both bonds. While these sinking fund deposits do not allow the City to present these payments as retirements of the respective debt, the City has effectively accumulated $3,045,000 to retire the debts in 2027. These restricted funds are shown as restricted fund balance within the debt service fund.
The future sinking fund deposit required to amortize the 2010 Revenue Bonds of $3,908,000 and $4,212,000 are as follows:
$3,908,000 Revenue Bond
Year Required Sinking Year Required SinkingEnded Fund Deposits Actual Sinking Ended Fund Deposits Actual Sinking
June 30, Principal Fund Deposits June 30, Principal Fund Deposits
2012 $ 244,250 $ 244,250 2012 $ 263,250 $ 263,2502013 244,250 244,250 2013 263,250 263,2502014 244,250 244,250 2014 263,250 263,2502015 244,250 244,250 2015 263,250 263,2502016 244,250 244,250 2016 263,250 263,2502017 244,250 244,250 2017 263,250 263,2502018 244,250 244,250 2018 263,250 263,2502019 244,250 2019 263,2502020 244,250 2020 263,2502021 244,250 2021 263,2502022 244,250 2022 263,2502023 244,250 2023 263,2502024 244,250 2024 263,2502025 244,250 2025 263,2502026 244,250 2026 263,2502027 244,250 2027 263,250
Total $ 3,908,000 $ 1,709,750 Total $ 4,212,000 $ 1,842,750
$4,212,000 Revenue Bond

CITY OF WARWICK, RHODE ISLAND NOTES TO FINANCIAL STATEMENTS JUNE 30, 2018
47
D. Loans Payable
The City has entered into nineteen loan agreements with the Rhode Island Infrastructure Bank, formerly known as Rhode Island Clean Water Finance Agency. The loan proceeds are to be used by the City for the extension and upgrade of the City’s sewer system. The Bank advances loan proceeds to the City periodically to reimburse the City for capital costs incurred on the projects. The following loan agreements were active as of June 30, 2018:
InterestAgreement Date Amount Rate Maturity Dates
June 26, 1998 $ 10,200,000 2.57% September 1, 1999-2019August 25, 1999 14,750,000 2.84% September 1, 2002-2019December 19, 2000 20,232,323 2.90% September 1, 2001-2020April 25, 2002 12,000,000 1.25% September 1, 2002-2022October 24, 2002 20,000,000 1.00% September 1, 2004-2022November 13, 2003 20,000,000 1.34% September 1, 2005-2024December 30, 2004 20,000,000 1.40% September 1, 2006-2025December 15, 2005 5,000,000 1.41% September 1, 2007-2026December 21, 2006 9,500,000 1.27% September 1, 2008-2027December 12, 2007 6,942,000 1.185-1.645% September 1, 2009-2028April 30, 2008 4,000,000 4.85% September 1, 2009-2028October 6, 2009 1,169,026 * 2.16% September 1, 2010-2029June 26, 2012 2,400,000 3.29% September 1, 2012-2022March 6, 2014 7,000,000 2.71% September 1, 2014-2034March 31, 2015 3,500,000 1.95% September 1, 2015-2034July 30, 2015 10,574,900 2.16% September 1, 2015-2034June 2, 2016 8,000,000 1.74% September 1, 2016-2035April 13, 2017 3,730,000 1.90% September 1, 2018-2037
* SFR/Stimulus Loan is shown net of $178,601 principal forgiveness the City pays an additional 0.5%
finance fee on all loans except for the loan dated April 30, 2008
The loan proceeds are to be used by the City for the extension and upgrade of the sewer system. The Bank pays project invoices certified by the City directly to the contractors or reimburses the City for costs incurred on the projects. As of June 30, 2018, loans payable of $79,402,768 are reflected in the Sewer Fund. A due from the Rhode Island Infrastructure Bank of $11,936,334 is shown for that portion of the loans, which has not been advanced as of June 30, 2018. The City is responsible to draw down and to repay the full amount of the loan.

CITY OF WARWICK, RHODE ISLAND NOTES TO FINANCIAL STATEMENTS JUNE 30, 2018
48
The debt service through maturity for the above loans is as follows:
Fiscal Year Ending June Principal Interest
2019 $ 9,839,149 $ 1,841,3482020 10,046,111 1,611,0132021 8,543,796 1,399,3962022 7,378,378 1,229,9512023 7,529,974 1,076,166
2024-2028 20,865,603 3,586,4302029-2033 9,961,857 1,604,4162034-2037 5,237,900 218,316
$ 79,402,768 $ 12,567,036
Interest, at the fixed rates indicated above, is calculated monthly based on the loan balances outstanding. The City has not completely drawn down all of the loans as of June 30, 2018. The interest through maturity shown above is based upon estimated amortization schedules prepared by Rhode Island Infrastructure Bank. The Rhode Island Infrastructure Bank loans dated December 30, 2004, December 15, 2005, December 21, 2006, December 12, 2007, April 30, 2008, October 6, 2009, June 26, 2012, March 6, 2014 and March 31, 2015, July 30, 2015, June 2, 2016 and April 13, 2017 are revenue loans. The revenue loans are secured by the revenues derived from the operation of the City’s wastewater collection system.
E. Debt Service Requirements
The City’s business-type debt service requirement relating to outstanding bond and loan obligations consist of the following:
Debt
Fiscal Year Ending June Principal Interest Service
2019 $ 11,150,954 $ 2,067,807 $ 13,218,7612020 11,395,411 1,805,499 13,200,9102021 9,925,455 1,562,779 11,488,2342022 8,594,963 1,362,465 9,957,4282023 8,661,423 1,170,912 9,832,335
2024-2028 23,094,274 3,686,441 26,780,7152029-2033 9,961,857 1,604,416 11,566,2732034-2037 5,237,900 218,316 5,456,216
$ 88,022,237 $ 13,478,635 $ 101,500,872

CITY OF WARWICK, RHODE ISLAND NOTES TO FINANCIAL STATEMENTS JUNE 30, 2018
49
F. Bonds Authorized but Unissued
The following table sets forth amounts, purposes and statutorily authorized, but unissued general obligation debt of the City.
Authorized ButPurpose Statutory Authorization Unissued Debt
Incinerator purposes P.L. Ch. 33-1966 $ 1,900,000 *Energy conservation P.L. Ch. 65-1980 600,000Sewer improvements P.L. Ch. 223-1994 417,677Open space P.L. Ch. 77-2000 175,000Open space P.L. Ch. 125/479-2006 2,000,000Recreation P.L. Ch. 77-2000 500,000Parks and recreation P.L. Ch. 74/147-2006 3,500,000Drainage P.L. Ch. 78-2002 3,000,000Building repairs P.L. Ch. 426/527-2006 5,500,000Mickey Stevens Sports Complex P.L. Ch. 385-2006 7,000,000School renovations P.L. Ch. 142/7962 & 142/2677 40,000,000
$ 64,592,677
* The City does not plan to issue the $1,900,000 authority for incinerator purposes
G. Capital Lease Commitments
The City’s capital lease program consists of two leases for the purchase of various vehicles and equipment valued at $8,742,878. Depreciation expense for the year on those assets was $1,044,941. The City may purchase leased vehicles and equipment as set forth in the lease agreements. Leases are renewed annually based on the City’s appropriation of funds sufficient to pay the obligations under the lease agreements.
Obligations of Governmental Activities under capital leases at June 30, 2018 were as follows:
Lease PaymentFiscal Year Ending June 30, Required
2019 $ 1,544,1862020 1,122,2572021 766,6252022 429,2092023 366,593
2024-2026 885,186Future minimum rental commitments 5,114,056Interest portion of payments 320,457
Principal Portion of Payments $ 4,793,599

CITY OF WARWICK, RHODE ISLAND NOTES TO FINANCIAL STATEMENTS JUNE 30, 2018
50
10. INTERFUND RECEIVABLES AND PAYABLES
Interfund balances represent short-term advances from one fund (primarily the General Fund) to another fund. The advances may represent balances resulting from operating advances or reimbursement for expenditures paid by one fund or may simply be the result of pooling financial resources to maximize income. The composition of interfund balances at June 30, 2018 is as follows:
Due From Due ToOther Funds Other Funds
General Fund $ 25,093,996 $ 20,402,115
School Unrestricted Fund 13,791,659
Nongovernmental Funds:Special detail fund 99,147City Clerk restricted fund 954,141Emergency operations - City 128,657Warwick Public library restricted fund 57,781Open space land acquisition 32,623Sewer connection grant 4,713Mooring fee reserve fund 8,011Senior center gift shop 3,448Federal asset forfeiture fund 5,975 State asset forfeiture fund 8,827 Community development block grant 57,811 IDEA 2,462,322IDEA preschool 85,378Title I 1,253,932Title II 311,748Title III 4,331Perkins Voc (even year) 230,686Homeless (even year) 18,383Fresh fruit/veg program 32,215General assembly skilss USA 3,500Big yellow bus 1,970Emergency repairs - tech 354,526 Career and tech repairs 104,406 CTE categorical odd year 43,066 CTE categorical even year 206,349 CTE reserve odd year 57 CTE reserve even year 10,909 CTE trust 19,260 Full day kindergarten 880Leadership champions 1,076CS4RI Teals innovation office grant 20 Champlin audio/video 179 Champlin Winman 61 Champlin Aldrich Gorton 3,306 Feinstein 95,785 Feinstein Scott-Comm fund 2,281 Rhode Island foundation 1,960 United Way 589 Toshiba America grant 10,000 Gen. Youth Foundation 221

CITY OF WARWICK, RHODE ISLAND NOTES TO FINANCIAL STATEMENTS JUNE 30, 2018
51
Staples Foundation 541 Shapiro Fund for Warwick 2,363 Kula foundation 6 Target 1,241 Education development center 1,444 Dorothy Rich association 314 RI Interlocal trust 133 Stop & Shop 2,913 IGT charitable contributions 2,131 Carter Family Spark Grant 10 Cedar Hill Library books 42 PTO donations 3,912 C.A.S.I.T. Italian program 4,715 James Manson memorial 5,000 Scott Tech donations 2,824 Esther Chester donation 1,597Mary Maini memorial fund 50 Carol Gray memorial fund 23 Patricia St. Amant 5,472 Day one your voice your data 1,000 City/Town contribution sports 8,425 Injury fund 202 Donations performing arts 3,600 Donations - instructional supplies 14,884 Holliman Yearbook 1,790 Technology self insurance 13,606School food service fund 140,537 2000 Open Space bond fund 1762006 School bond fund 23,1912002 Drainage bond fund 7,0002006 City buildings bond fund 28,913Capital leases 7,524
Total nongovernmental funds 2,296,448 4,609,661
Major Enterprise Funds:Sewer fund 8,318,746 16,087,414Sewer assessment fund 2,743,211 Water fund 140,507 7,372,139
Total major enterprise funds 8,459,253 26,202,764
Nonmajor Enterprise Funds:Emergency operations enterprise funds 357,580 4,902,136On-Site revolving loan fund 3,713Sewer infrastructure replacement fund 3,829Sewer renewal & replacement fund 2,414,413 385,000Water renewal & replacement fund 750,000Water restricted emergency fund 250,000Water infrastructure replacement fund 2,000,000
Total nonmajor enterprise funds 5,775,706 5,290,965
Internal Service Funds: Healthcare Management City 1,088,443
Totals $ 56,505,505 $ 56,505,505

CITY OF WARWICK, RHODE ISLAND NOTES TO FINANCIAL STATEMENTS JUNE 30, 2018
52
11. FUND BALANCES
As stated in Note 1, fund balance may be classified as one of five categories: nonspendable, restricted, committed, assigned or unassigned. See Note 1 of these financial statements for definitions of these five fund balance categories. The detail of the composition of nonspendable, restricted, committed and assigned fund balance is as follows:
School Nonmajor TotalUnrestricted Governmental Governmental
General Fund Funds Funds
Fund balances:Nonspendable for:
Prepaid expenses $ 258,318 $ $ $ 258,318 Restricted for:
Entitlement Community program of U.S. Housing 320,239 320,239 CDBG Seed program 77,190 77,190 Drug related property seizure 108,046 108,046 Open space acquisition 329,096 329,096 Library operations 123,831 123,831 Pilgrim Senior Center 27,698 27,698 Sewer connections assistance 28,446 28,446 Tourism 147,139 147,139 Public safety 31,410 31,410 Emergency operations FEMA 128,657 128,657 Waterfront safety 239,693 239,693 Maintenance of historical records 950,121 950,121 Education 1,073,797 1,073,797 Open Space acquisition 336,013 336,013 School capital improvements 648,091 648,091 Road and bridge improvements 316,047 316,047 Capital leases 7,524 7,524 Municipal building improvements 1,061,997 1,061,997 Debt service 3,552,500 3,552,500
Committed for:Education 157,447 157,447
Assigned for:Subsequent year's budget 3,800,000 3,800,000 Other 549,465 549,465
Unassigned 22,671,446 (25,336) 22,646,110
Total Fund Balances $ 27,436,676 $ - $ 9,482,199 $ 36,918,875

CITY OF WARWICK, RHODE ISLAND NOTES TO FINANCIAL STATEMENTS JUNE 30, 2018
53
12. INTER-FUND TRANSFERS
The principal purpose of inter-fund transfers is to provide a financing source to various funds that may not have the ability to cover all costs with revenue generated by the fund. The composition of inter-fund transfers for the year ended June 30, 2018 is as follows:
Transfers In Transfers Out
Major Funds:General fund $ 564,426 $ 130,528,744 School unrestricted fund 122,012,274 484,519 Sewer fund 15,729,768 9,473,887 Sewer assessment fund 5,751,242 Water fund 35,938 35,938
Nonmajor Funds:Enterprise funds 504,639 Special revenue funds 966,263 1,046,170 Debt service fund 8,516,470
Total $ 147,825,139 $ 147,825,139
13. DEFINED BENEFIT PENSION PLANS
A. City Employees’ Pension Plan
Summary of Significant Accounting Policies
Basis of Accounting
The City Employees’ Pension Trust Fund’s financial statements are prepared using the accrual basis of accounting. For the purposes of measuring the net pension liability, deferred outflows of resources and deferred inflows of resources related to pensions, and pension expense, information about the fiduciary net position of the City Employees’ Pension Plan and additions to and deductions from the Plan’s net position have been determined on the same basis as they are reported by the Plan. Plan member contributions are recognized in the period in which the contributions are due. Employer contributions are recognized when due and when the employer has made a formal commitment to provide the contributions. Benefits and refunds are recognized when due and payable in accordance with the terms of the plan. Investments are reported at fair value. Securities traded on a national or international exchange are valued at the last reported sales price at current exchange rates.
Plan Description
The City Employees’ Pension Plan covers all City employees not covered by other plans. Nonelected employees are eligible to participate after six months of employment. Elected officials are eligible on the date they assume their elected position. The City Employees’ Pension Plan is a single employer defined benefit pension plan that was established in 1965. The Municipal Retirement Board is responsible for the administration of the plan. The Board is comprised of (11) members consisting of the City's Finance
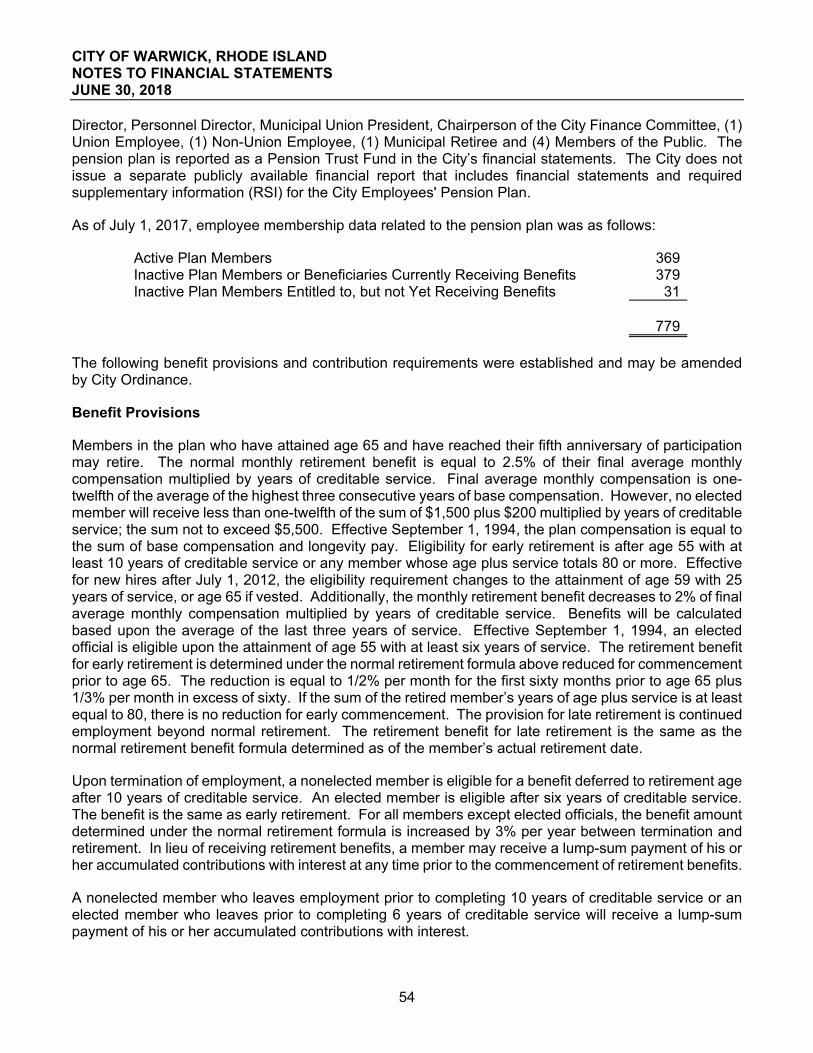
CITY OF WARWICK, RHODE ISLAND NOTES TO FINANCIAL STATEMENTS JUNE 30, 2018
54
Director, Personnel Director, Municipal Union President, Chairperson of the City Finance Committee, (1) Union Employee, (1) Non-Union Employee, (1) Municipal Retiree and (4) Members of the Public. The pension plan is reported as a Pension Trust Fund in the City’s financial statements. The City does not issue a separate publicly available financial report that includes financial statements and required supplementary information (RSI) for the City Employees' Pension Plan.
As of July 1, 2017, employee membership data related to the pension plan was as follows:
Active Plan Members 369 Inactive Plan Members or Beneficiaries Currently Receiving Benefits 379 Inactive Plan Members Entitled to, but not Yet Receiving Benefits 31 779
The following benefit provisions and contribution requirements were established and may be amended by City Ordinance.
Benefit Provisions
Members in the plan who have attained age 65 and have reached their fifth anniversary of participation may retire. The normal monthly retirement benefit is equal to 2.5% of their final average monthly compensation multiplied by years of creditable service. Final average monthly compensation is one-twelfth of the average of the highest three consecutive years of base compensation. However, no elected member will receive less than one-twelfth of the sum of $1,500 plus $200 multiplied by years of creditable service; the sum not to exceed $5,500. Effective September 1, 1994, the plan compensation is equal to the sum of base compensation and longevity pay. Eligibility for early retirement is after age 55 with at least 10 years of creditable service or any member whose age plus service totals 80 or more. Effective for new hires after July 1, 2012, the eligibility requirement changes to the attainment of age 59 with 25 years of service, or age 65 if vested. Additionally, the monthly retirement benefit decreases to 2% of final average monthly compensation multiplied by years of creditable service. Benefits will be calculated based upon the average of the last three years of service. Effective September 1, 1994, an elected official is eligible upon the attainment of age 55 with at least six years of service. The retirement benefit for early retirement is determined under the normal retirement formula above reduced for commencement prior to age 65. The reduction is equal to 1/2% per month for the first sixty months prior to age 65 plus 1/3% per month in excess of sixty. If the sum of the retired member’s years of age plus service is at least equal to 80, there is no reduction for early commencement. The provision for late retirement is continued employment beyond normal retirement. The retirement benefit for late retirement is the same as the normal retirement benefit formula determined as of the member’s actual retirement date.
Upon termination of employment, a nonelected member is eligible for a benefit deferred to retirement age after 10 years of creditable service. An elected member is eligible after six years of creditable service. The benefit is the same as early retirement. For all members except elected officials, the benefit amount determined under the normal retirement formula is increased by 3% per year between termination and retirement. In lieu of receiving retirement benefits, a member may receive a lump-sum payment of his or her accumulated contributions with interest at any time prior to the commencement of retirement benefits.
A nonelected member who leaves employment prior to completing 10 years of creditable service or an elected member who leaves prior to completing 6 years of creditable service will receive a lump-sum payment of his or her accumulated contributions with interest.

CITY OF WARWICK, RHODE ISLAND NOTES TO FINANCIAL STATEMENTS JUNE 30, 2018
55
A nonelected member who has completed 10 years of creditable service or an elected member who has completed 6 years of creditable service, and who is totally disabled as determined by the City’s medical board is eligible for disability retirement. The disability retirement benefit formula is the same as normal retirement but reduced by worker’s compensation payments.
Any married nonelected member with 10 years creditable service or any married elected member with 6 years of creditable service who dies while still employed after age 50 is eligible for pre-retirement death benefits. The benefit is the same as vested deferred or early retirement with reduction for each month by which benefit commencement precedes age 65 and further reduced to reflect the optional form of payment which provides payments at the same rate to the surviving spouse. A member’s surviving spouse may elect to receive a lump-sum payment equal to the member’s accumulated contributions with interest in lieu of the annuity described above.
Any terminated member with a deferred vested benefit or an active member not eligible for the surviving spouse’s annuity described above is eligible for death benefits before retirement benefits equal to one lump-sum pay of the member's accumulated contributions with interest.
Effective September 1, 1994, a member may, in lieu of receiving one half of his or her accumulated sick pay in cash at termination or retirement, receive a pension service credit for unused sick pay (6-month maximum).
Contributions
The City’s annual contribution to the plan is based upon an actuarially determined amount recommended by an independent actuary. During fiscal 2018, this contribution amounted to 26.2% of covered payroll. In addition, the nonelected plan members contribute 8.5% of their annual base compensation and longevity compensation. Elected plan members contribute 8.5% of their annual base compensation plus $20.00 per month. Administrative costs are included in the actuarial valuation as part of the normal cost and financed through contributions.
Investments
Investment Policy
The pension plan’s policy in regard to the allocation of invested assets is established and may be amended by a majority vote of the Municipal Pension Board members. It is the policy of the City to pursue an investment strategy that reduces risk through prudent diversification of the portfolio across a broad selection of distinct asset classes. The pension plan’s investment policy is long term and strategic in nature. The policy refrains from dramatically shifting asset class allocations over short time spans, and it seeks to be fully invested using cash equivalents for liquidity purposes.
The long-term rate of return on pension plan investments was determined using a building block method in which best-estimate ranges of future real rates of return are developed for each major asset class. These ranges are combined to produce the expected long-term rate of return by weighing the expected future rates of return by the target asset allocation percentage plus expected inflation.

CITY OF WARWICK, RHODE ISLAND NOTES TO FINANCIAL STATEMENTS JUNE 30, 2018
56
Best estimates of geometric real rates of return for each major asset class included in the pension plan's target asset allocation as of June 30, 2018 are summarized in the following table:
Target Long-Term ExpectedAsset Class Allocation Real Rate of Return
Fixed income core 37.50% 3.90%Large cap domestic equity 30.00% 7.80%Small cap domestic equity 12.50% 8.25%International equity developed 13.75% 7.80%International equity emerging 5.00% 8.75%Commodities 1.25% 4.65%
Rate of Return
For the year ended June 30, 2018, the annual money-weighted rate of return on pension plan investments, net of pension plan investment expense, was 9.08%. The money-weighted rate of return expresses investment performance, net of investment expense, adjusted for the changing amounts actually invested.
Net Pension Liability
The City’s net pension liability was measured as of June 30, 2018. The components of the net pension liability of the City at June 30, 2018 were as follows:
Total pension liability $ 176,855,366 Plan fiduciary net position 134,055,398
City's Net Position Liability $ 42,799,968
Plan fiduciary net position as a percentage of the total pension liability 75.80%
Actuarial Assumptions
The following actuarial assumptions were used in the actuarial valuation dated July 1, 2017 and were rolled forward to the measurement date of June 30, 2018.
Actuarial cost method Entry Age Normal Actuarial Cost Method Inflation 2.25% Salary increases 3.00% to 7.00% including inflation Investment rate of return 6.90% Mortality rates Based upon the RP-2000 Healthy Annuitant Mortality
Tables for Males and Females, as appropriate, projected with Scale AA from 2000

CITY OF WARWICK, RHODE ISLAND NOTES TO FINANCIAL STATEMENTS JUNE 30, 2018
57
Measurement of the Net Pension Liability
Discount Rate
The net pension liability is measured as the total pension liability, less the amount of the pension plan’ fiduciary net position. In actuarial terms, this will be the accrued liability less the market value of assets (not the smoothed actuarial value of assets that is often encountered in actuarial valuations performed to determine the employer’s contribution requirement).
A single discount rate of 6.90% was used to measure the total pension liability. This single discount rate was based on the expected rate of return on pension plan investments of 6.90%. The projection of cash flows used to determine this single discount rate assumed that plan member contributions will be made at the current contribution rate and that employer contributions will be made at rates equal to the difference between actuarially determined contribution rates and the member rate. Based on these assumptions, the pension plan’s fiduciary net position was projected to be available to make all projected future benefit payments of current plan members. Therefore, the long-term expected rate of return on pension plan investments was applied to all periods of projected benefit payments to determine the total pension liability.
Increase (Decrease)Total Pension Plan Fiduciary Net Pension
Liability (a) Net Position (b) Liability (a)-(b)
Balances as of July 1, 2017 $ 170,101,420 $ 124,934,249 $ 45,167,171
Changes for the year: Service cost 3,470,808 3,470,808 Interest 11,508,757 11,508,757 Differences between expected and actual experience 1,973,093 1,973,093 Contributions - employer 6,194,245 (6,194,245)Contributions - employee 1,888,875 (1,888,875)Net investment income 11,247,563 (11,247,563)Benefit payments, including refunds of contributions (10,198,712) (10,198,712) - Administrative expense (21,413) 21,413 Other charges 10,591 (10,591)
Net changes 6,753,946 9,121,149 (2,367,203)
Balances as of June 30, 2018 $ 176,855,366 $ 134,055,398 $ 42,799,968
Sensitivity of the Net Pension Liability to Changes in the Discount Rate
Below is a table providing the sensitivity of the net pension liability to changes in the discount rate. In particular, the table presents the plan’s net pension liability if it was calculated using a single discount rate that is 1 percentage point lower (5.90%) or 1 percentage point higher (7.90%) than the single discount rate:
Current1% Decrease Discount Rate 1% Increase
(5.90%) (6.90%) (7.90%)
City Employees’ Pension Plan $ 63,241,170 $ 42,799,968 $ 25,608,671

CITY OF WARWICK, RHODE ISLAND NOTES TO FINANCIAL STATEMENTS JUNE 30, 2018
58
Pension Expense and Deferred Outflows of Resources and Deferred Inflows of Resources Related to Pensions
For the year ended June 30, 2018, the City Employee Pension Plan recognized pension expense of $8,662,109. As of June 30, 2018, the City reported deferred outflows of resources and deferred inflows of resources related to pensions from the following sources:
Deferred Outflows of Resources
Deferred Inflows of Resources
Difference between expected and actual experience $ 1,670,663 $ 175,674 Changes of assumptions 2,831,772 Net difference between projected and actual
earning on pension plan investments 5,267,498 6,098,033
Total $ 9,769,933 $ 6,273,707
Amounts reported as deferred outflows of resources and deferred inflows of resources related to pensions will be recognized in future pension expense as follows:
Net DeferredOutflows (Inflows)
Year Ended June 30, Resources
2019 $ 3,924,546 2020 1,427,740 2021 (1,373,868) 2022 (482,192)
$ 3,496,226
B. Police I and Fire Pension Plan
Summary of Significant Accounting Policies
Basis of Accounting
The Police I and Fire Pension Trust Fund’s financial statements are prepared using the accrual basis of accounting. For the purposes of measuring the net pension liability, deferred outflows of resources and deferred inflows of resources related to pensions, and pension expense, information about the fiduciary net position of the Police I and Fire Pension Plan and additions to and deductions from the Plan’s net position have been determined on the same basis as they are reported by the Plan. Plan member contributions are recognized in the period in which the contributions are due. Employer contributions are recognized when due and when the employer has made a formal commitment to provide the contributions. Benefits and refunds are recognized when due and payable in accordance with the terms of the plan. Investments are reported at fair value. Securities traded on a national or international exchange are valued at the last reported sales price at current exchange rates.

CITY OF WARWICK, RHODE ISLAND NOTES TO FINANCIAL STATEMENTS JUNE 30, 2018
59
Plan Description
The City of Warwick’s Police I and Fire Pension Plan covers all City Police Officers that were appointed before February 1, 1971, and all permanent members of the City’s Fire Department appointed before May 29, 1992. The Police I and Fire Pension Plan is a single-employer defined benefit pension plan that was established in 1953. There is no separate financial report issued for the pension plan. The pension plan is reported as a Pension Trust Fund in the City’s financial statements. The City does not issue a separate publicly available financial report that includes financial statements and required supplementary information (RSI) for the Police I and Fire Pension Plan.
As of July 1, 2017, employee membership date related to the pension plan was as follows:
Active Plan Members 24 Inactive Plan Members or Beneficiaries Currently Receiving Benefits 406 Inactive Plan Members Entitled to, but not Yet Receiving Benefits - 430
The following benefit provisions and contribution requirements were established and may be amended by City Ordinance.
Benefit Provisions - Police Officers
Benefits provided to remaining active police officers are in accordance with the City’s Code of Ordinances. Retirement, death, and disability benefits payable to retired members and beneficiaries are indexed in accordance with the base salary increases provided to active members of the police force.
Benefit Provisions - Firefighters
Participating firefighters in the plan who have completed 20 years of service may retire. The normal annual retirement benefit is equal to 50% of highest annual salary plus 1% of salary for each year of service in excess of 20 years (maximum 10). For pension purposes, annual salary includes regular, longevity and holiday pay.
Any firefighter retiring after July 23, 1996 may also irrevocably elect to have his or her pension calculated under the City’s Fire II Pension Plan. The Fire II benefit formula is 50% of the final year’s compensation. Plus 2% for each year of service from 20 to 25 years, plus 3% for each year of service from 25 to 30 years with a fixed compounded cost of living adjustment.
A participant who is unable to perform active duty as a firefighter, which the Board of Public Safety finds to be permanently incapacitating, is eligible to receive disability retirement benefits. The service-related disability retirement benefit for disabilities involving heart, lung, cancer or other social security disabilities is 66 2/3% of the highest annual salary, reduced for each dollar of earned income in excess of the salary the member would earn as an active employee, to a minimum of 50% of annual salary. The other service related and nonservice related benefit is 50% of annual salary.
A member is eligible for a return of contributions without interest for terminations prior to the completion of 10 years of service. For termination after the completion of 10 years of service, but prior to eligibility for retirement, the employee is eligible for a deferred benefit equal to 2 1/2% of annual salary at termination, multiplied by the number of full years of service, payable on the 20th anniversary of employment.

CITY OF WARWICK, RHODE ISLAND NOTES TO FINANCIAL STATEMENTS JUNE 30, 2018
60
The Plan provides death benefits to a participant’s spouse and dependents if the participant dies while actively employed. Per City Ordinance, the service-related death benefit is 50% of the deceased member’s average salary, payable to the surviving spouse until death or earlier remarriage. However, it must be noted that Rhode Island State Law, Chapter 45-21-4, raises the percentage to 67.5%. For nonservice-related death, the annual benefit is 30% of the deceased member’s highest annual salary, payable to the surviving spouse until death or remarriage. The benefit for surviving children is 10% of the deceased member’s highest annual salary, payable to each surviving child until age 18 (or for life if such child becomes permanently disabled prior to the member’s death). The maximum family death benefit for service-related death is 75% of the deceased member’s highest annual salary and for nonservice-related deaths 50% of the highest annual salary.
A lump-sum payment equal to the member’s accumulated contributions without interest shall be paid to the estate of any active member who dies with no surviving spouse or children.
Benefits provided to remaining active police officers and firefighters are in accordance with the proposed restatement of Section 15-19 of the City’s Code of Ordinances. Retirement, death and disability benefits payable to retired members and beneficiaries are indexed in accordance with the base salary increases provided to active members of the police force.
Funding Policy
Active plan members contribute 7% of their covered earnings (regular, holiday and longevity). In addition, the City is required to contribute an actuarially determined amount each year, calculated in accordance with its pension ordinances. The statutory contribution level includes a 40-year amortization of the unfunded actuarial liability as a level percentage of payroll. During fiscal 2018, this contribution amounted to $17,934,399. Administrative costs are netted against investment return in the actuarial valuation.
Investments
Investment Policy
The pension plan’s policy in regard to the allocation of invested assets is established and may be amended by the Plan’s fiduciary custodian, the City Finance Director. It is the policy of the City to pursue an investment strategy that reduces risk through prudent diversification of the portfolio across a broad selection of distinct asset classes. The pension plan’s investment policy is long term and strategic in nature. The policy refrains from dramatically shifting asset class allocations over short time spans, and it seeks to be fully invested using cash equivalents for liquidity purposes.
The long-term rate of return on pension plan investments was determined using a building block method in which best-estimate ranges of future real rates of return are developed for each major asset class. These ranges are combined to produce the expected long-term rate of return by weighing the expected future rates of return by the target asset allocation percentage plus expected inflation.

CITY OF WARWICK, RHODE ISLAND NOTES TO FINANCIAL STATEMENTS JUNE 30, 2018
61
Best estimates of geometric real rates of return for each major asset class included in the pension plan’s target asset allocation as of June 30, 2018 are summarized in the following table:
Target Long-Term Expected
Asset Class Allocation Real Rate of Return
Fixed income core 37.50% 3.90%Large cap domestic equity 30.00% 7.80%Small cap domestic equity 12.50% 8.25%International equity developed 13.75% 7.80%International equity emerging 5.00% 8.75%Commodities 1.25% 4.65%
Rate of Return
For the year ended June 30, 2018, the annual money-weighted rate of return on pension plan investments, net of pension plan investment expense, was 8.47%. The money-weighted rate of return expresses investment performance, net of investment expense, adjusted for the changing amounts actually invested.
Net Pension Liability
The components of the net pension liability of the City at June 30, 2018 were as follows:
Total pension liability $ 296,861,721 Plan fiduciary net position 73,738,390
City’s Net Position Liability $ 223,123,331
Plan fiduciary net position as a percentage of the total pension liability 24.84%
Actuarial Assumptions
The following actuarial assumptions were used in the July 1, 2017 valuation and rolled forward to the measurement date of June 30, 2018.
Actuarial cost method Entry Age Normal Actuarial Cost Method Inflation 2.25% Salary increases 3.50% to 13.50% including inflation Investment rate of return 6.90% Mortality rates Based upon the RP-2000 Healthy Annuitant Mortality
Tables for Males and Females, as appropriate, projected with Scale AA from 2000

CITY OF WARWICK, RHODE ISLAND NOTES TO FINANCIAL STATEMENTS JUNE 30, 2018
62
Measurement of the Net Pension Liability
Discount Rate
The net pension liability is measured as the total pension liability, less the amount of the pension plan’s fiduciary net position. In actuarial terms, this will be the accrued liability less the market value of assets (not the smoothed actuarial value of assets that is often encountered in actuarial valuations performed to determine the employer’s contribution requirement).
A single discount rate of 6.90% was used to measure the total pension liability. This single discount rate was based on the expected rate of return on pension plan investments of 6.90%. The projection of cash flows used to determine this single discount rate assumed that plan member contributions will be made at the current contribution rate and that employer contributions will be made at rates equal to the difference between actuarially determined contribution rates and the member rate. Based on these assumptions, the pension plan’s fiduciary net position was projected to be available to make all projected future benefit payments of current plan members. Therefore, the long-term expected rate of return on pension plan investments was applied to all periods of projected benefit payments to determine the total pension liability.
Increase (Decrease)Total Pension Plan Fiduciary Net Pension
Liability (a) Net Position (b) Liability (a)-(b)
Balances as of July 1, 2017 $ 294,066,490 $ 71,756,352 $ 222,310,138
Changes for the year: Service cost 653,640 653,640 Interest 19,565,475 19,565,475 Differences between expected and actual experience 4,604,032 4,604,032 Contributions - employer 17,934,399 (17,934,399)Contributions - employee 175,440 (175,440)Net investment income 5,911,507 (5,911,507)Benefit payments, including refunds of contributions (22,027,916) (22,027,916) - Administrative expense (22,453) 22,453 Other charges 11,061 (11,061)
Net changes 2,795,231 1,982,038 813,193
Balances as of June 30, 2018 $ 296,861,721 $ 73,738,390 $ 223,123,331
Sensitivity of the Net Pension Liability to Changes in the Discount Rate
Below is a table providing the sensitivity of the net pension liability to changes in the discount rate. In particular, the table presents the plan’s net pension liability if it was calculated using a single discount rate that is 1 percentage point lower (5.90%) or 1 percentage point higher (7.90%) than the single discount rate:
Current1% Decrease Discount Rate 1% Increase
(5.90%) (6.90%) (7.90%)
Police I & Fire Pension Plan $ 254,820,139 $ 223,123,331 $ 196,904,858

CITY OF WARWICK, RHODE ISLAND NOTES TO FINANCIAL STATEMENTS JUNE 30, 2018
63
Pension Expense and Deferred Outflows of Resources and Deferred Inflows of Resources Related to Pensions
For the year ended June 30, 2018, the Police I and Fire Pension Plan recognized pension expense of $20,677,257. As of June 30, 2018, the City reported deferred outflows of resources and deferred inflows of resources related to pensions from the following sources:
Deferred Outflows of Resources
Deferred Inflows of Resources
Net difference between projected and actual earning on pension plan investments $ 3,210,269 $ 3,693,753
Total $ 3,210,269 $ 3,693,753
Amounts reported as deferred outflows of resources and deferred inflows of resources related to pensions will be recognized in future pension expense as follows:
Net DeferredOutflows (Inflows)
Year Ended June 30, Resources
2019 $ 836,037 2020 57,544 2021 (1,158,341) 2022 (218,724) 2023
Thereafter
$ (483,484)
C. Police Pension II Plan
Summary of Significant Accounting Policies
Basis of Accounting
The Police II Pension Trust Fund’s financial statements are prepared using the accrual basis of accounting. For the purposes of measuring the net pension liability, deferred outflows of resources and deferred inflows of resources related to pensions, and pension expense, information about the fiduciary net position of the Police II Pension Plan and additions to and deductions from the Plan’s net position have been determined on the same basis as they are reported by the Plan. Plan member contributions are recognized in the period in which the contributions are due. Employer contributions are recognized when due and when the employer has made a formal commitment to provide the contributions. Benefits and refunds are recognized when due and payable in accordance with the terms of the plan. Investments are reported at fair value. Securities traded on a national or international exchange are valued at the last reported sales price at current exchange rates.

CITY OF WARWICK, RHODE ISLAND NOTES TO FINANCIAL STATEMENTS JUNE 30, 2018
64
Plan Description
The City of Warwick, Rhode Island’s Police II Pension Plan covers all City Police Officers that were appointed after February 1, 1971. The Police Pension II Plan is a single-employer defined benefit pension plan that was established in 1971. There is no separate financial report issued for the pension plan. The pension plan is reported as a Pension Trust Fund in the City’s financial statements.
The City does not issue a separate publicly available financial report that includes financial statements and required supplementary information (RSI) for the Police II Pension Plan.
As of July 1, 2017 employee membership data related to the pension plan was as follows:
Active Plan Members 158 Inactive Plan Members or Beneficiaries Currently Receiving Benefits 184 Inactive Plan Members Entitled to, but not Yet Receiving Benefits 4 346
The following benefit provisions and contribution requirements were established and may be amended by City Ordinance.
Benefit Provisions
Members in the plan who have completed 20 years of service may retire. The normal annual retirement benefit is equal to 50% of annual salary at retirement plus incremental increases of 2% per year between the 20th and 25th years, and annual increases of 3% between the 26th and 30th years. For pension purposes, annual salary includes regular, longevity and holiday pay.
Effective for new hires after July 1, 2012, the eligibility requirement increases to 25 years of service. Additionally, the retirement benefit will now be calculated at a rate of 50% of the average salary from the last three years of service, plus an additional 2% for every year of service from year 10 to retirement. The maximum pension benefit decreases from 75% after 30 years to 70% after 30 years.
A member who is unable to perform active as a result of disability, which the Board of Public Safety finds to be permanently incapacitating, is eligible to receive disability retirement benefits. The service-related disability retirement benefit is 66 2/3% of the highest annual salary, reduced for each dollar of earned income in excess of the salary the member would earn as an active employee, to a minimum of 50% of annual salary. The nonservice-related benefit is 50% of annual salary.
A member who leaves employment prior to completing ten years of service will receive a lump-sum payment of accumulated contributions without interest. For termination after the completion of 10 years of service, but prior to eligibility for retirement, the employee is eligible for a deferred benefit equal to 2 1/2% of annual salary at termination, multiplied by the number of full years of service, payable on the 20th anniversary of employment.
The Plan provides death benefits to a participant’s spouse and dependents if the participant dies while actively employed. Per City Ordinance, the service related death benefit is 50% of the deceased member’s average salary, payable to the surviving spouse until death or earlier remarriage. However, it must be noted that Rhode Island State Law, Chapter 45-21-4, raises the percentage to 67.5%. For nonservice-related death, the annual benefit is 30% of the deceased member’s highest annual salary,
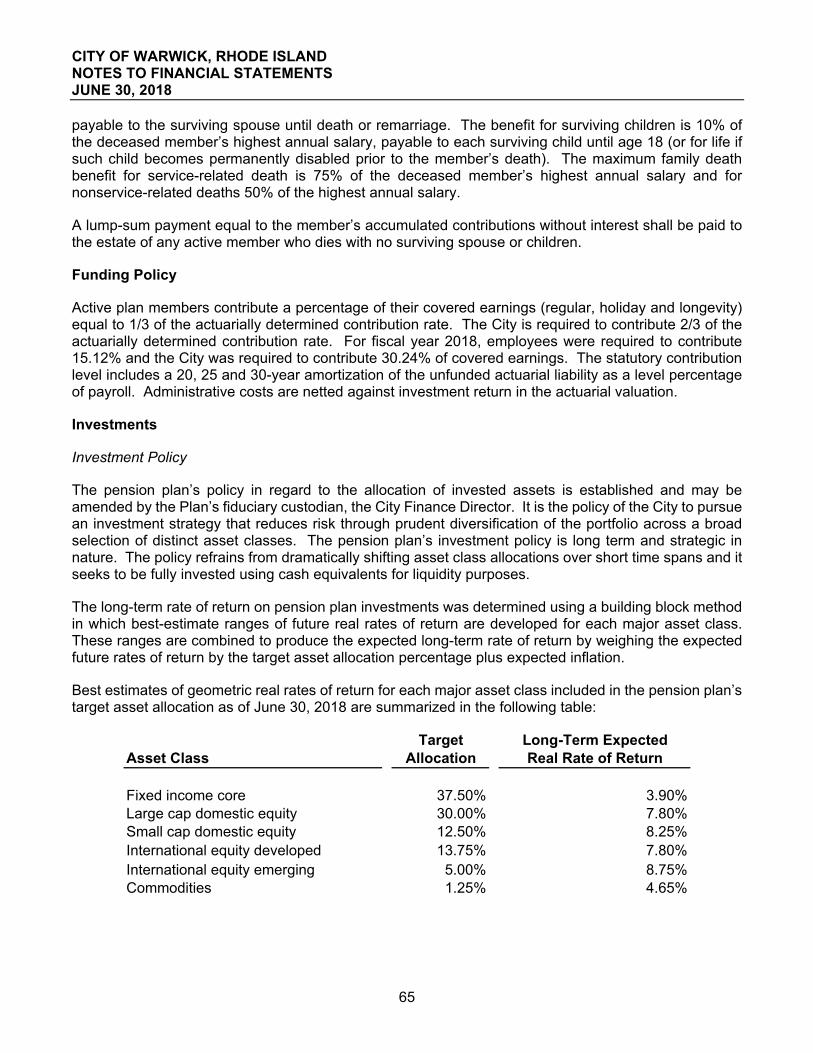
CITY OF WARWICK, RHODE ISLAND NOTES TO FINANCIAL STATEMENTS JUNE 30, 2018
65
payable to the surviving spouse until death or remarriage. The benefit for surviving children is 10% of the deceased member’s highest annual salary, payable to each surviving child until age 18 (or for life if such child becomes permanently disabled prior to the member’s death). The maximum family death benefit for service-related death is 75% of the deceased member’s highest annual salary and for nonservice-related deaths 50% of the highest annual salary.
A lump-sum payment equal to the member’s accumulated contributions without interest shall be paid to the estate of any active member who dies with no surviving spouse or children.
Funding Policy
Active plan members contribute a percentage of their covered earnings (regular, holiday and longevity) equal to 1/3 of the actuarially determined contribution rate. The City is required to contribute 2/3 of the actuarially determined contribution rate. For fiscal year 2018, employees were required to contribute 15.12% and the City was required to contribute 30.24% of covered earnings. The statutory contribution level includes a 20, 25 and 30-year amortization of the unfunded actuarial liability as a level percentage of payroll. Administrative costs are netted against investment return in the actuarial valuation.
Investments
Investment Policy
The pension plan’s policy in regard to the allocation of invested assets is established and may be amended by the Plan’s fiduciary custodian, the City Finance Director. It is the policy of the City to pursue an investment strategy that reduces risk through prudent diversification of the portfolio across a broad selection of distinct asset classes. The pension plan’s investment policy is long term and strategic in nature. The policy refrains from dramatically shifting asset class allocations over short time spans and it seeks to be fully invested using cash equivalents for liquidity purposes.
The long-term rate of return on pension plan investments was determined using a building block method in which best-estimate ranges of future real rates of return are developed for each major asset class. These ranges are combined to produce the expected long-term rate of return by weighing the expected future rates of return by the target asset allocation percentage plus expected inflation.
Best estimates of geometric real rates of return for each major asset class included in the pension plan’s target asset allocation as of June 30, 2018 are summarized in the following table:
Target Long-Term ExpectedAsset Class Allocation Real Rate of Return
Fixed income core 37.50% 3.90%Large cap domestic equity 30.00% 7.80%Small cap domestic equity 12.50% 8.25%International equity developed 13.75% 7.80%International equity emerging 5.00% 8.75%Commodities 1.25% 4.65%

CITY OF WARWICK, RHODE ISLAND NOTES TO FINANCIAL STATEMENTS JUNE 30, 2018
66
Rate of Return
For the year ended June 30, 2018, the annual money-weighted rate of return on pension plan investments, net of pension plan investment expense, was 8.55%. The money-weighted rate of return expresses investment performance, net of investment expense, adjusted for the changing amounts actually invested.
Net Pension Liability
The components of the net pension liability of the City at June 30, 2018 were as follows:
Total pension liability $ 243,261,152 Plan fiduciary net position 206,142,558
City’s Net Position Liability $ 37,118,594
Plan fiduciary net position as a percentage of the total pension liability 84.74%
Actuarial Assumptions
The following actuarial assumptions, used in the valuation dated July 1, 2017, and rolled forward to the measurement date of June 30, 2018.
Actuarial cost method Entry Age Normal Actuarial Cost Method Inflation 2.25% Salary increases 3.50% to 13.50% including inflation Investment rate of return 6.90% Mortality rates Based upon the RP-2000 Healthy Annuitant Mortality
Tables for Males and Females, as appropriate, projected with Scale AA from 2000
Measurement of the Net Pension Liability
Discount Rate
The net pension liability is measured as the total pension liability, less the amount of the pension plan’s fiduciary net position. In actuarial terms, this will be the accrued liability less the market value of assets (not the smoothed actuarial value of assets that is often encountered in actuarial valuations performed to determine the employer’s contribution requirement).

CITY OF WARWICK, RHODE ISLAND NOTES TO FINANCIAL STATEMENTS JUNE 30, 2018
67
A single discount rate of 6.90% was used to measure the total pension liability. This single discount rate was based on the expected rate of return on pension plan investments of 6.90%. The projection of cash flows used to determine this single discount rate assumed that plan member contributions will be made at the current contribution rate and that employer contributions will be made at rates equal to the difference between actuarially determined contribution rates and the member rate. Based on these assumptions, the pension plan’s fiduciary net position was projected to be available to make all projected future benefit payments of current plan members. Therefore, the long-term expected rate of return on pension plan investments was applied to all periods of projected benefit payments to determine the total pension liability.
Increase (Decrease)Total Pension Plan Fiduciary Net Pension
Liability (a) Net Position (b) Liability (a)-(b)
Balances as of July 1, 2017 $ 234,308,479 $ 193,183,186 $ 41,125,293
Changes for the year: Service cost 4,693,492 4,693,492 Interest 15,998,841 15,998,841 Differences between expected and actual experience (2,080,926) (2,080,926)Assumption changes - Contributions - employer 4,179,364 (4,179,364)Contributions - employee 2,089,682 (2,089,682)Net investment income 16,368,484 (16,368,484)Benefit payments, including refunds of contributions (9,658,734) (9,658,734) - Administrative expense (19,924) 19,924 Other charges 500 (500)
Net changes 8,952,673 12,959,372 (4,006,699)
Balances as of June 30, 2018 $ 243,261,152 $ 206,142,558 $ 37,118,594
Sensitivity of the Net Pension Liability to Changes in the Discount Rate
Below is a table providing the sensitivity of the net pension liability to changes in the discount rate. In particular, the table presents the plan’s net pension liability if it was calculated using a single discount rate that is 1 percentage point lower (5.90%) or 1 percentage point higher (7.90%) than the single discount rate:
Current1% Decrease Discount Rate 1% Increase
(5.90%) (6.90%) (7.90%)
Police Pension Plan II $ 73,067,151 $ 37,118,594 $ 8,056,981

CITY OF WARWICK, RHODE ISLAND NOTES TO FINANCIAL STATEMENTS JUNE 30, 2018
68
Pension Expense and Deferred Outflows of Resources and Deferred Inflows of Resources Related to Pensions
For the year ended June 30, 2018, the Police II Pension Plan recognized pension expense of $10,553,096. As of June 30, 2018, the City reported deferred outflows of resources and deferred inflows of resources related to pensions from the following sources:
Deferred Outflows of Resources
Deferred Inflows of Resources
Difference between expected and actual experience $ 325,317 $ 1,645,047 Changes of assumptions 6,332,574 Net difference between projected and actual
earning on pension plan investments 8,146,870 9,016,798
Total $ 14,804,761 $ 10,661,845
Amounts reported as deferred outflows of resources and deferred inflows of resources related to pensions will be recognized in future pension expense as follows:
Net DeferredOutflows (Inflows)
Year Ended June 30, Resources
2019 $ 5,145,004 2020 3,197,397 2021 (3,231,178) 2022 (968,307)
Thereafter
$ 4,142,916

CITY OF WARWICK, RHODE ISLAND NOTES TO FINANCIAL STATEMENTS JUNE 30, 2018
69
D. Fire II Pension Plan
Summary of Significant Accounting Policies
Basis of Accounting
The Fire II Pension Trust Fund’s financial statements are prepared using the accrual basis of accounting. For the purposes of measuring the net pension liability, deferred outflows of resources and deferred inflows of resources related to pensions, and pension expense, information about the fiduciary net position of the Fire II Pension Plan and additions to and deductions from the Plan’s net position have been determined on the same basis as they are reported by the Plan. Plan member contributions are recognized in the period in which the contributions are due. Employer contributions are recognized when due and when the employer has made a formal commitment to provide the contributions. Benefits and refunds are recognized when due and payable in accordance with the terms of the plan. Investments are reported at fair value. Securities traded on a national or international exchange are valued at the last reported sales price at current exchange rates.
Plan Description
The City of Warwick’s Fire Pension II Plan covers all City firefighters who were appointed after May 29, 1992. The Fire Pension II Plan is a single employer defined benefit pension plan that was established in 1992. The pension plan is reported as a Pension Trust Fund in the City’s financial statements. The City does not issue a separate, publicly available report that includes financial statements and required supplementary information (RSI) for the Fire II Pension Plan.
As of July 1, 2017, employee membership data related to the pension plan was as follows:
Active Plan Members 195 Inactive Plan Members or Beneficiaries Currently Receiving Benefits 17 Inactive Plan Members Entitled to, but not Yet Receiving Benefits - 212
The following benefit provisions and contribution requirements were established and may be amended by City Ordinance.
Benefit Provisions
A member who has completed 20 years of service may retire. Such member shall receive an annual benefit equal to 50% of their last year’s salary, plus 2% of their average salary for each of service from 20-25, plus 3% for each year of service from 25-30. For pension purposes, annual salary includes regular, holiday and longevity pay.
Effective for new hires after July 1, 2012, the eligibility requirement increases to 25 years of service. Additionally, the retirement benefit will now be calculated at a rate of 50% of the average salary from the last three years of service, plus an additional 2% for every year of service from year 10 to retirement. The maximum pension benefit decreases from 75% after 30 years to 70% after 30 years. Currently, this new benefit provision is being contested by the Local 2748 International Association of Firefighters AFL-CIO.

CITY OF WARWICK, RHODE ISLAND NOTES TO FINANCIAL STATEMENTS JUNE 30, 2018
70
A member who is unable to perform active duty as a result of disability, which the Board of Public Safety finds to be permanently incapacitating, is eligible to receive disability retirement benefits. The annual benefit for a service-related disability involving any heart, lung, cancer or other social security disability is 66-2/3% of the member’s average salary, reduced for each dollar of earned income in excess of the salary the member would earn as an active employee, to a minimum of 50% of salary. The benefit for other service-related and nonservice-related disabilities is 50% of the member’s average salary.
The Plan provides death benefits to a participant’s spouse and dependents if the participant dies while actively employed. Per City Ordinance, the service-related death benefit is 50% of the deceased member’s average salary, payable to the surviving spouse until death or earlier remarriage. However, it must be noted that Rhode Island State Law, Chapter 45-21-4, raises the percentage to 67.5%. For nonservice related death, the annual benefit is 30% of the deceased member’s highest annual salary, payable to the surviving spouse until death or remarriage. The benefit for surviving children is 10% of the deceased member’s highest annual salary, payable to each surviving child until age 18 (or for life if such child becomes permanently disabled prior to the member’s death). The maximum family death benefit for service-related death is 75% of the deceased member’s highest annual salary and for nonservice related deaths 50% of the highest annual salary.
A lump-sum payment equal to the member’s accumulated contributions without interest shall be paid to the estate of any active member who dies with no surviving spouse or children.
Any member who terminates employment with 10 years or more of creditable service, but less than 20 years of creditable service, shall receive an annual benefit commencing at normal retirement age equal to 2.5% of average salary multiplied by full years of service at termination.
Any member who terminates employment prior to the completion of ten years of creditable service will receive a lump-sum payment of his or her accumulated contributions without interest.
Funding Policy
Active plan members contribute a percentage of their covered earnings (regular, holiday and longevity) equal to 1/3 of the actuarially determined contribution rate. The City is required to contribute 2/3 of the actuarially determined contribution rate. Administrative costs are netted against investment return in the actuarial valuation. For fiscal year 2017, employees were required to contribute 10.72% and the City was required to contribute 21.43% of covered earnings.
Investments
Investment Policy
The pension plan’s policy in regard to the allocation of invested assets is established and may be amended by the Plan’s fiduciary custodian, the City Treasurer. It is the policy of the City to pursue an investment strategy that reduces risk through prudent diversification of the portfolio across a broad selection of distinct asset classes. The pension plan’s investment policy is long term and strategic in nature. The policy refrains from dramatically shifting asset class allocations over short time spans, and it seeks to be fully invested using cash equivalents for liquidity purposes.
The long-term rate of return on pension plan investments was determined using a building block method in which best-estimate ranges of future rates of return are developed for each major asset class. These ranges are combined to produce the expected long-term rate of return by weighing the expected future rates of return by the target asset allocation percentage plus expected inflation.

CITY OF WARWICK, RHODE ISLAND NOTES TO FINANCIAL STATEMENTS JUNE 30, 2018
71
Best estimates of geometric real rates of return for each major asset class included in the pension plan’s target asset allocation as of June 30, 2018 are summarized in the following table:
Target Long-Term ExpectedAsset Class Allocation Real Rate of Return
Fixed income core 37.50% 3.90%Large cap domestic equity 30.00% 7.80%Small cap domestic equity 12.50% 8.25%International equity developed 13.75% 7.80%International equity emerging 5.00% 8.75%Commodities 1.25% 4.65%
Rate of Return
For the year ended June 30, 2018, the annual money-weighted rate of return on pension plan investments, net of pension plan investment expense, was 6.80%. The money-weighted rate of return expresses investment performance, net of investment expense, adjusted for the changing amounts actually invested.
Net Pension Liability
The components of the net pension liability of the City at June 30, 2018 were as follows:
Total pension liability $ 85,565,712 Plan fiduciary net position 73,583,027
City's Net Position Liability $ 11,982,685
Plan fiduciary net position as a percentage of the total pension liability 86.00%
Actuarial Assumptions
The following actuarial assumptions were used in the actuarial valuation dated July 1, 2017 and rolled forward to the measurement date of June 30, 2018.
Actuarial cost method Entry Age Normal Actuarial Cost Method Inflation 2.25% Salary increases 3.50% to 13.50% including inflation Investment rate of return 6.90% Mortality rates Based upon the RP-2000 Healthy Annuitant Mortality
Tables for Males and Females, as appropriate, projected with Scale AA from 2000

CITY OF WARWICK, RHODE ISLAND NOTES TO FINANCIAL STATEMENTS JUNE 30, 2018
72
Measurement of the Net Pension Liability
Discount Rate
The net pension liability is measured as the total pension liability, less the amount of the pension plan’s fiduciary net position. In actuarial terms, this will be the accrued liability less the market value of assets (not the smoothed actuarial value of assets that is often encountered in actuarial valuations performed to determine the employer’s contribution requirement).
A single discount rate of 6.90% was used to measure the total pension liability. This single discount rate was based on the expected rate of return on pension plan investments of 6.90%. The projection of cash flows used to determine this single discount rate assumed that plan member contributions will be made at the current contribution rate and that employer contributions will be made at rates equal to the difference between actuarially determined contribution rates and the member rate. Based on these assumptions, the pension plan’s fiduciary net position was projected to be available to make all projected future benefit payments of current plan members. Therefore, the long-term expected rate of return on pension plan investments was applied to all periods of projected benefit payments to determine the total pension liability.
Increase (Decrease)Total Pension Plan Fiduciary Net Pension
Liability (a) Net Position (b) Liability (a)-(b)
Balances as of July 1, 2017 $ 74,128,449 $ 64,558,640 $ 9,569,809
Changes for the year: Service cost 4,844,310 4,844,310 Interest 5,250,580 5,250,580 Benefit changes 2,321,185 2,321,185 Differences between expected and actual experience (135,069) (135,069)Contributions - employer 3,561,858 (3,561,858)Contributions - employee 1,780,929 (1,780,929)Net investment income 4,543,343 (4,543,343)Benefit payments, including refunds of contributions (843,743) (843,743) - Administrative expense (18,000) 18,000
Net changes 11,437,263 9,024,387 2,412,876
Balances as of June 30, 2018 $ 85,565,712 $ 73,583,027 $ 11,982,685
Sensitivity of the Net Pension Liability to Changes in the Discount Rate
Below is a table providing the sensitivity of the net pension liability to changes in the discount rate. In particular, the table presents the plan’s net pension liability (asset) if it was calculated using a single discount rate that is 1 percentage point lower (5.90%) or 1 percentage point higher (7.90%) than the single discount rate:
Current
1% Decrease Discount Rate 1% Increase(5.90%) (6.90%) (7.90%)
Fire II Pension Plan $ 25,904,202 $ 11,982,685 $ (3,111,672)

CITY OF WARWICK, RHODE ISLAND NOTES TO FINANCIAL STATEMENTS JUNE 30, 2018
73
Pension Expense and Deferred Outflows of Resources and Deferred Inflows of Resources Related to Pensions
For the year ended June 30, 2018, the Fire II Pension Plan recognized pension expense of $7,142,434. As of June 30, 2018, the City reported deferred outflows of resources and deferred inflows of resources related to pensions from the following sources:
Deferred Outflows of Resources
Deferred Inflows of Resources
Difference between expected and actual experience $ 331,846 $ 566,371 Changes of assumptions 3,980,001 Net difference between projected and actual
earning on pension plan investments 2,518,991 2,438,894
Total $ 6,830,838 $ 3,005,265
Amounts reported as deferred outflows of resources and deferred inflows of resources related to pensions will be recognized in future pension expense as follows:
Net DeferredOutflows (Inflows)
Year Ended June 30, Resources
2019 $ 1,095,849 2020 549,362 2021 (411,598) 2022 401,360 2023 388,719
Thereafter 1,801,881
$ 3,825,573

CITY OF WARWICK, RHODE ISLAND NOTES TO FINANCIAL STATEMENTS JUNE 30, 2018
74
E. Warwick Public School Employees’ Pension Plan
Summary of Significant Accounting Policies
Basis of Accounting
The Warwick Public School Employees’ Pension Trust Fund’s financial statements are prepared using the accrual basis of accounting. For the purposes of measuring the net pension liability, deferred outflows of resources and deferred inflows of resources related to pensions, and pension expense, information about the fiduciary net position of the Warwick Public School Employees’ Pension Plan and additions to and deductions from the Plan’s net position have been determined on the same basis as they are reported by the Plan. Plan member contributions are recognized in the period in which the contributions are due. Employer contributions are recognized when due and when the employer has made a formal commitment to provide the contributions. Benefits and refunds are recognized when due and payable in accordance with the terms of the plan. Investments are reported at fair value. Securities traded on a national or international exchange are valued at the last reported sales price at current exchange rates.
Plan Description
The Warwick Public School Employees’ Pension Plan, a single-employer defined benefit public employee pension plan. There is no separate financial report issued for this plan, however it is audited as part of the City of Warwick’s Pension Trust Funds and is reported within the City’s Annual Financial Report. All eligible Warwick Public School employees other than teachers are eligible to participate on the first of the month after completing three months of service. A person is eligible if they are (a) employed 20 hours or more per week and covered under the collective bargaining agreement, or (b) employed 20 hours or more per week in a noncertified management position, or (c) an elected School Committee member. There are two committees that oversee the administration of this plan. The Executive Administration Board is comprised of the School’s Chief Budget Officer, the Director of Human Resources and the Warwick Independent Employees’ Union President. The Executive Administration Board delegates investment responsibilities to the Pension Investment Administration Committee, which is comprised of (2) Warwick Public School Administrative Employees, the Chief Budget Officer, the Controller, and (2) Warwick Independent Employees’ Union Representatives, who are appointed by the Union leadership.
As of July 1, 2017, employee membership data related to the pension plan was as follows:
Active Plan Members 336 Inactive Plan Members or Beneficiaries Currently Receiving Benefits 146 Inactive Plan Members Entitled to, But not Yet Receiving Benefits 25 507
Benefit Provisions
Participants are eligible for normal retirement at the later of age 62 or 10 years of plan participation or at any age upon completion of 32 years of service with 10 years of plan participation. The normal retirement benefit is 1.67% of average monthly earnings times years of participation, plus .33% times the average monthly earnings times years of participation exceeding 20 years. The normal form of benefit is a life annuity. Average monthly earnings are the monthly average of total compensation for the 3 consecutive years of highest compensation over the last 10 years.

CITY OF WARWICK, RHODE ISLAND NOTES TO FINANCIAL STATEMENTS JUNE 30, 2018
75
The yearly annuity amount for a School Committee member who becomes a retired member is $1,000 plus 4.8% times the salary amount for each plan year in which one made mandatory employee contributions.
The plan also provides death and disability benefits.
The following table summarizes the plan’s requirements and benefits:
Plan Provisions Effective Date: July 1, 1965 Plan Year Beginning: July 1, 2018 Requirements Minimum Age: 0 Minimum months of service: 3
Eligible Class An elected school committee member or a member covered by the collective bargaining agreement.
Entry Dates 1st day of the month coinciding with or next following the date the plan requirements are met.
Employee Contributions 5% of earnings Normal Retirement Date
First day of the month coinciding with or next following attainment of age 62, or if later, the 10th anniversary of plan entry, or 32 years of service with 10 years of plan participation.
Normal Retirement Benefit
1.67% of the member’s average monthly earnings multiplied by years of participation, plus .33% times average monthly earnings times years of participation greater than 20.
Average Monthly Earnings
Monthly average of total compensation for the 3 consecutive years of highest compensation of the previous 10 years.
Maximum Annual Benefit
$215,000 as adjusted per IRC Sec 415 for retirement age other than social security retirement age and annuity form.
Normal Form of Benefit Life Annuity Accrued Benefit
Normal Retirement Benefit based on earnings and participation to date.
Early Retirement Benefit Minimum Age: 52 Minimum Service: 10 years
Benefit Amount: Accrued benefit, reduced by 7% for each year by which early retirement precedes normal retirement.
Pre-Retirement Death Benefit
Member contributions with interest, plus a $5,000 lump-sum benefit.
Disability Benefit
Determined in the same manner as the normal retirement benefit.
Vest Termination Benefit
Upon termination after 10 years of service, 100% of the accrued benefit, deferred until the normal retirement date. A school committee member is vested after six years of plan participation.

CITY OF WARWICK, RHODE ISLAND NOTES TO FINANCIAL STATEMENTS JUNE 30, 2018
76
Contributions
Plan members contribute 5% of earnings during the year. The School Department contributes based upon an annual actuarial valuation. During fiscal 2018, the School Department’s contribution totaled $1,152,310. Administrative costs are included in the actuarial valuation as part of the normal cost and financed through contributions.
Investments
Investment information has been provided by USI Advisors.
Investment Policy
The pension plan’s policy in regard to the allocation of invested assets is established and may be amended by the Warwick School Committee by a majority vote of its members. It is the policy of the Board to pursue an investment strategy that reduces risk through the prudent diversification of the portfolio across a broad selection of distinct asset classes. The pension plan’s investment policy discourages the use of cash equivalents, except for liquidity purposes, and aims to refrain from dramatically shifting asset class allocations over short time spans.
This is an ongoing plan with a perpetual time horizon. For this reason, long-term capital market assumptions (20+ years) are applicable to approximate future real rate of return expectations. A modified building blocks methodology was used because being able to identify historical return premiums of asset classes in the context of varying market environments provides a reasonable basis to estimate the performance of asset classes going forward.
Best estimates of real rates of return for each major asset class included in the pension plan’s target asset allocation as of June 30, 2018 are summarized in the following table:
Target Long-Term ExpectedAsset Class Allocation Real Rate of Return
US Equity-Large Cap 25.00% 6.52%US Equity-Small/Mid Cap 15.00% 7.70%Non-US Equity - Developed 10.00% 6.81%Non-US Equity - Emerging 5.00% 9.17%US Corporate Bonds - Core 15.00% 2.10%US Corporate Bonds - High Yield 5.00% 4.26%Non-US Debt - Emerging 4.00% 4.41%US Treasuries (cash equivalents) 12.00% 0.79%TIPS (Inflation Protected) 4.00% 1.74%Real Estate 5.00% 5.25%
Rate of Return
For the year ended June 30, 2018, the annual money-weighted rate of return on pension plan investments, net of pension plan investment expense, was 9.74%. The money-weighted rate of return expresses investment performance, net of investment expense, adjusted for the changing amounts actually invested.

CITY OF WARWICK, RHODE ISLAND NOTES TO FINANCIAL STATEMENTS JUNE 30, 2018
77
Net Pension Liability
The City’s net pension liability was measured as of June 30, 2018. The components of the net pension liability of the City at June 30, 2018 were as follows:
Total pension liability $ 57,021,715 Plan fiduciary net position 53,002,896
City's Net Position Liability $ 4,018,819
Plan fiduciary net position as a percentage of the total pension liability 92.95%
Actuarial Assumptions
The following actuarial assumptions were used in the June 30, 2018 actuarial valuation:
Actuarial cost method Individual Entry Age Normal Actuarial Cost Method Amortization method Level Amortization Salary increases 3.00% Investment rate of return 7.00% Mortality rates Prescribed IRS Static Mortality Tables for the Year of the
Valuation Measurement of the Net Pension Liability
Discount Rate
The net pension liability is measured as the total pension liability, less the amount of the pension plan’s fiduciary net position. In actuarial terms, this will be the accrued liability less the market value of assets (not the smoothed actuarial value of assets that is often encountered in actuarial valuations performed to determine the employer’s contribution requirement).
A single discount rate of 7.0% was used to measure the total pension liability. This single discount rate was based on the expected rate of return on pension plan investments of 7.0%. The projection of cash flows used to determine this single discount rate assumed that plan member contributions will be made at the current contribution rate and that employer contributions will be made at rates equal to the difference between actuarially determined contribution rates and the member rate. Based on these assumptions, the pension plan’s fiduciary net position was projected to be available to make all projected future benefit payments of current plan members. Therefore, the long-term expected rate of return on pension plan investments was applied to all periods of projected benefit payments to determine the total pension liability.

CITY OF WARWICK, RHODE ISLAND NOTES TO FINANCIAL STATEMENTS JUNE 30, 2018
78
Changes in the Net Pension Liability
Increase (Decrease)Total Pension Plan Fiduciary Net Pension
Liability (a) Net Position (b) Liability (a)-(b)
Balances as of July 1, 2017 $ 53,267,565 $ 48,797,539 $ 4,470,026
Changes for the year: Service cost 1,101,378 1,101,378 Interest 3,727,866 3,727,866 Differences between expected and actual experience 1,105,363 1,105,363 Assumption changes 85,298 85,298 Contributions - Employer 1,152,310 (1,152,310)Contributions - Employee 721,712 (721,712)Net investment income 4,797,201 (4,797,201)Benefit payments, including refunds of contributions (2,265,755) (2,265,755) - Administrative expense (200,111) 200,111
Net changes 3,754,150 4,205,357 (451,207)
Balances as of June 30, 2018 $ 57,021,715 $ 53,002,896 $ 4,018,819
Sensitivity of the Net Pension Liability to Changes in the Discount Rate
Below is a table providing the sensitivity of the net pension liability to changes in the discount rate. In particular, the table presents the plan’s net pension liability (asset) if it was calculated using a single discount rate that is 1 percentage point lower (6.0%) or 1 percentage point higher (8.0%) than the single discount rate:
Current1% Decrease Discount Rate 1% Increase
(6.0%) (7.0%) (8.0%)
Warwick School Employees $ 10,529,138 $ 4,018,819 $ (1,540,012)

CITY OF WARWICK, RHODE ISLAND NOTES TO FINANCIAL STATEMENTS JUNE 30, 2018
79
Pension Expense and Deferred Outflows of Resources and Deferred Inflows of Resources Related to Pensions
For the year ended June 30, 2018, the Warwick Public School Employees Pension Plan recognized pension expense of $1,403,504. As of June 30, 2018, the City reported deferred outflows of resources and deferred inflows of resources related to pensions from the following sources:
Deferred Outflows of Resources
Deferred Inflows of Resources
Difference between expected and actual experience $ 2,424,373 $ 188,129 Changes of assumptions 182,638 Net difference between projected and actual
earning on pension plan investments 996,504 2,563,530
Total $ 3,603,515 $ 2,751,659
Amounts reported as deferred outflows of resources and deferred inflows of resources related to pensions will be recognized in future pension expense as follows:
Net DeferredOutflows (Inflows)
Year Ended June 30, Resources
2019 $ 441,647 2020 209,577 2021 (190,642) 2022 209,648
Thereafter
$ 851,856
F. Warwick Public School Teachers’ Pension Plan
Summary of Significant Accounting Policies
Basis of Accounting
For the purposes of measuring the net pension liability, deferred outflows of resources and deferred inflows of resources related to pensions, and pension expense, information about the fiduciary net position of the Employees' Retirement System Plan (ERS) and the additions to and deductions from ERS’ fiduciary net position have been determined on the same basis as they are reported by ERS. For this purpose, benefit payments (including refunds of employee contributions) are recognized when due and payable in accordance with the benefit terms. Investments are reported at fair value.

CITY OF WARWICK, RHODE ISLAND NOTES TO FINANCIAL STATEMENTS JUNE 30, 2018
80
Plan Description
Certain employees of the Warwick Public School system participate in a cost-sharing multiple-employer defined benefit pension plan - the Employees’ Retirement System plan - administered by the Employees’ Retirement System of the State of Rhode Island (System). Under a cost-sharing plan, pension obligations for employees of all employers are pooled and plan assets are available to pay the benefits of the employees of any participating employer providing pension benefits through the plan, regardless of the status of the employers’ payment of its pension obligation to the plan. The plan provides retirement and disability benefits and death benefits to plan members and beneficiaries.
The System issues a publicly available financial report that includes financial statements and required supplementary information for the plans. The report may be obtained at http://www.ersri.org.
Benefit Provisions
The level of benefits provided to participants is established by Chapter 36-10 of the General Laws, which is subject to amendment by the General Assembly. Member benefit provisions vary based on service credits accumulated at dates specified in various amendments to the General Laws outlining minimum retirement age, benefit accrual rates and maximum benefit provisions. In general, members accumulate service credits for each year of service subject to maximum benefit accruals of 80% or 75%. For those hired after June 30, 2012, the benefit accrual rate is 1% per year with a maximum benefit accrual of 40%. Members eligible to retire at September 30, 2009 may retire with 10 years of service at age 60 or after 28 years of service at any age. The retirement eligibility age increases proportionately for other members reflecting years of service and other factors until it aligns with the Social Security Normal Retirement Age, which applies to any member with less than five years of service as of July 1, 2012. Members are vested after five years of service.
The plan provides for survivor’s benefits for service-connected death and certain lump-sum death benefits. Joint and survivor benefit provision options are available to members.
Cost of living adjustments are provided but are currently suspended until the collective plans administered by ERSRI reach a funded status of 80%. Until the plans reach an 80% funded status, interim cost of living adjustments are provided at four-year intervals commencing with the plan year ending June 30, 2016.
The plan also provides nonservice-connected disability benefits after five years of service and service-connected disability benefits with no minimum service requirement.
Funding Policy
The funding policy, as set forth in the General Laws, Section 16-16-22, provides for actuarially determined periodic contributions to the plan. For fiscal 2018, Warwick Public School System Teachers were required to contribute 3.75% of their annual covered salary, except for teachers with twenty or more years of service as of June 30, 2012 who must contribute 11% of their annual covered salary. The State and Warwick Public Schools are required to contribute at an actuarially determined rate, 40% of which is to be paid by the State and the remaining 60% is to be paid by Warwick Public Schools; the rates were 9.95% and 13.18% of annual covered payroll for the fiscal year ended June 30, 2018 for the State and Warwick Public Schools, respectively. Warwick Public Schools contributed $10,176,528, $10,619,358 and $10,888,514 for the fiscal years ended June 30, 2018, 2017 and 2016, respectively, equal to 100% of the required contributions for each year.

CITY OF WARWICK, RHODE ISLAND NOTES TO FINANCIAL STATEMENTS JUNE 30, 2018
81
Pension Liabilities, Pension Expense and Deferred Outflows of Resources and Deferred Inflows of Resources
At June 30, 2018, Warwick Public Schools reported a liability of $140,460,773 for its proportionate share of the net pension liability that reflected a reduction for contributions made by the state. The amount recognized by Warwick Public Schools as its proportionate share of the net pension liability, the related state support and the total portion of the net pension liability that was associated with Warwick Public Schools were as follows:
Warwick Public School’s proportionate share of the Net Pension Liability $ 134,499,571
State of Rhode Island’s proportionate share of the Net Pension Liability 101,649,361
Total Net Pension Liability $ 236,148,932
The net pension liability was measured as of June 30, 2016, the measurement date, and the total pension liability used to calculate the net pension liability was determined by an actuarial valuation as of June 30, 2015 rolled forward to June 30, 2016. Warwick Public School’s proportion of the net pension liability was based on a projection of Warwick Public School’s long-term share of contributions to the pension plan relative to the projected contributions of all participating employers and the state, actuarially determined. At June 30, 2017, Warwick Public School’s proportion was 4.26%.
For the year ended June 30, 2018, Warwick Public Schools recognized gross pension expense of $17,047,415 and revenue of $7,913,091 for support provided by the State. At June 30, 2018, Warwick Public Schools reported deferred outflows of resources and deferred inflows of resources related to pensions from the following sources:
Deferred Outflows of Resources
Deferred Inflows of Resources
Difference between expected and actual experience $ $ 3,188,667 Changes of assumptions 11,746,600 2,119,503 Net difference between projected and actual
earning on pension plan investments 10,406,876 7,009,327 Changes in proportion and differences
between employer contributions and proportionate share of contributions 15,896,049
Contributions subsequent to the measurement date 10,176,528
Total $ 32,330,004 $ 28,213,546

CITY OF WARWICK, RHODE ISLAND NOTES TO FINANCIAL STATEMENTS JUNE 30, 2018
82
$10,176,528 reported as deferred outflows of resources related to pensions resulting from Warwick Public School’s contributions in fiscal year 2018 subsequent to the measurement date will be recognized as a reduction of the net pension liability for the year ended June 30, 2019. Other amounts reported as deferred outflows of resources and deferred inflows of resources related to pensions will be recognized in pension expense as follows:
Net DeferredOutflows (Inflows)
Year Ended June 30, Resources
2019 $ (1,458,810) 2020 780,434 2021 (876,811) 2022 (3,240,939) 2023 (1,180,798)
Thereafter (83,146)
$ (6,060,070)
Actuarial Assumptions
The total pension liability was determined using the following actuarial assumptions, applied to all periods included in the measurement:
Inflation 2.75% Salary increases 3.50% to 13.50% Investment rate of return 7.50%
Mortality - male and female teachers: 97% and 92%, respectively of rates in a GRS table based on male and female teacher experience, projected with Scale AA from 2000.
The actuarial assumptions used in the June 30, 2015 valuation rolled forward to June 30, 2016 and the calculation of the total pension liability at June 30, 2016 were consistent with the results of an actuarial experience study performed as of June 30, 2013.

CITY OF WARWICK, RHODE ISLAND NOTES TO FINANCIAL STATEMENTS JUNE 30, 2018
83
Investments
The long-term expected rate of return best-estimate on pension plan investments was determined by the actuary using a building-block method. The actuary started by calculating best-estimate future expected real rates of return (expected returns net of pension plan investment expense and inflation) for each major asset class, based on a collective summary of capital market expectations from 23 sources. The June 30, 2015 expected arithmetic returns over the long-term (20 years) by asset class are summarized in the following table:
Target Long-Term ExpectedAsset Class Allocation Real Rate of Return
Global Equity: 38.00%U.S. Equity 6.98%International Developed 7.26%International Emerging Markets 9.57%
Equity Hedge Funds 8.00% 4.10%Private Equity 7.00% 10.15%Core Fixed Income 15.00% 2.37%Absolute Return Hedge Funds 7.00% 4.10%Infrastructure 3.00% 5.58%Real Estate 8.00% 5.33%Other Real Return Assets: 11.00%
Master Limited Partnerships 4.97%Credit 4.97%Inflation Linked Bonds 1.76%
Cash Overlay, Money Market 3.00% 0.82%
100.00%
These return assumptions are then weighted by the target asset allocation percentage, factoring in correlation effects, to develop the overall long-term expected rate of return best-estimate on an arithmetic basis.
Measurement of the Net Pension Liability
Discount Rate
The discount rate used to measure the total pension liability was 7.5%. The projection of cash flows used to determine the discount rate assumed that contributions from plan members will be made at the current contribution rate and that contributions from the employers will be made at statutorily required rates, actuarially determined. Based on those assumptions, the pension plan’s fiduciary net position was projected to be available to make all projected future benefit payments of current plan members. Therefore, the long-term expected rate of return on pension plan investments was applied to all periods of projected benefit payments to determine the total pension liability.

CITY OF WARWICK, RHODE ISLAND NOTES TO FINANCIAL STATEMENTS JUNE 30, 2018
84
Sensitivity of the Net Pension Liability to Changes in the Discount Rate
Below is a table providing the sensitivity of the net pension liability to changes in the discount rate. In particular, the table presents the plan’s net pension liability if it was calculated using a single discount rate that is 1 percentage point lower (6.5%) or 1 percentage point higher (8.5%) than the single discount rate (7.5%):
Current1% Decrease Discount Rate 1% Increase
(6.5%) (7.5%) (8.5%)
School Teacher’s Pension Plan $ 169,033,825 $ 134,499,571 $ 108,777,047
Pension plan fiduciary net position - detailed information about the pension plan's fiduciary net position is available in the separately issued ERSRI financial report.
G. Combining Schedule of Net Position - Pension Trust Funds
Other SchoolPolice Pension I Police Fire City Employees Departmentand Fire Pension Pension II Pension II Pension Employees Total
Assets: Cash $ 2,127,247 $ 1,820,713 $ 973,069 $ 1,485,924 $ 336,249 $ 6,743,202
Investments, at fair value:Mutual funds 40,726,414 114,713,828 40,330,279 74,234,140 48,390,650 318,395,311 Equity investments 12,040,931 35,246,167 12,407,200 22,969,796 82,664,094 Index funds 10,248,044 30,915,896 10,862,553 20,190,417 72,216,910 Fixed income securities 8,647,911 23,581,183 9,054,821 15,260,864 56,544,779 Group annuity contracts 4,275,997 4,275,997
Accrued interest receivable 2,948 2,667 1,340 2,614 9,569 Total assets 73,793,495 206,280,454 73,629,262 134,143,755 53,002,896 540,849,862
Liabilities: Accounts payable and accrued expenses 55,105 137,896 46,235 88,357 327,593
Total liabilities 55,105 137,896 46,235 88,357 - 327,593
Net Position:Held in Trust for Pension Benefits $ 73,738,390 $ 206,142,558 $ 73,583,027 $ 134,055,398 $ 53,002,896 $ 540,522,269

CITY OF WARWICK, RHODE ISLAND NOTES TO FINANCIAL STATEMENTS JUNE 30, 2018
85
H. Combining Schedule of Changes in Net Position – Pension Trust Funds
Other SchoolPolice Pension I Police Fire City Employees Departmentand Fire Pension Pension II Pension II Pension Employees Total
Additions: Contributions
Employer $ 17,934,399 $ 4,179,864 $ 3,561,857 $ 6,194,245 $ 1,152,310 $ 33,022,675 Plan members 175,440 2,089,682 1,780,929 1,888,875 721,712 6,656,638
Total contributions 18,109,839 6,269,546 5,342,786 8,083,120 1,874,022 39,679,313
Investment income:Investment earnings 6,163,870 17,057,670 4,769,988 11,681,716 4,797,201 44,470,445 Less investment expense (252,363) (689,186) (226,645) (434,153) (1,602,347)
Net investment income 5,911,507 16,368,484 4,543,343 11,247,563 4,797,201 42,868,098
Total additions 24,021,346 22,638,030 9,886,129 19,330,683 6,671,223 82,547,411
Deductions: Benefits 22,027,916 9,658,734 843,743 10,198,712 2,265,755 44,994,860 Administrative and other expense 11,392 19,924 17,999 10,822 200,111 260,248
Total deductions 22,039,308 9,678,658 861,742 10,209,534 2,465,866 45,255,108
Change in Net Position 1,982,038 12,959,372 9,024,387 9,121,149 4,205,357 37,292,303
Net Position at Beginning of Year 71,756,352 193,183,186 64,558,640 124,934,249 48,797,539 503,229,966
Net Position at End of Year $ 73,738,390 $ 206,142,558 $ 73,583,027 $ 134,055,398 $ 53,002,896 $ 540,522,269
14. DEFINED CONTRIBUTION PLAN
Defined Contribution Plan Description
Employees participating in the defined benefit plan with less than 20 years of service as of June 30, 2012, as described above, also participate in a defined contribution plan authorized by General Law Chapter 36-10.3. The defined contribution plan is established under IRS section 401(a) and is administered by TIAA-CREF. Employees may choose among various investment options available to plan participants. Employees contribute 5% of their annual covered salary and employers contribute between 1% and 1.5% of annual covered salary depending on the employee’s total years of service as of June 30, 2012. Employee contributions are immediately vested while employer contributions and any investment earnings thereon are vested after three years of contributory service. Benefit terms and contributions required under the plan by both the employee and employer are established by the General Laws, which are subject to amendment by the General Assembly.
Amounts in the defined contribution plan are available to participants in accordance with Internal Revenue Service guidelines for such plans.
Warwick Public Schools recognized pension expense of $497,979 for the fiscal year ended June 30, 2018.
The System issues a publicly available financial report that includes financial statements and required supplementary information for plans administered by the system. The report may be obtained at http://www.ersri.org.

CITY OF WARWICK, RHODE ISLAND NOTES TO FINANCIAL STATEMENTS JUNE 30, 2018
86
15. OTHER POST-EMPLOYMENT BENEFITS
A. Other Post-Employment Benefits - City
Plan Description
The City administers a single-employer defined benefit healthcare plan. The plan provides medical/drug and dental (police officers only) benefits for eligible retirees and their dependents through the City group health and dental insurance plans, which cover both active and retired members. Benefit provisions are established and amended by union contract, through negotiations between the City and respective unions. The plan does not issue a publicly available financial report.
Funding Policy
Contribution requirements are negotiated between the City and the respective unions. The City is required to contribute the cost of medical/drug and dental benefits, less the amount of any applicable co-payments in effect at the time or retirement. For the year ended June 30, 2018, the plan operated on a pay-as-you-go basis and no provision has been made to fund future benefits to be provided to plan members. For the fiscal year ended June 30, 2018, the City contributed $11,482,709 to the plan.
At June 30, 2018, membership consisted of:
City, Police, Fire
Active employees 711 Retired 938
Total 1,649
Total OPEB Liability
The City’s total OPEB liability of $352,383,048 was measured as of June 30, 2018 and was determined by an actuarial valuation as of July 1, 2017.
Actuarial Assumptions and Other Inputs
The total OPEB liability in the June 30, 2018 actuarial valuation was determined using the following actuarial assumptions and other inputs, applied to all periods included in the measurement unless otherwise specified:
Inflation
3.00% Salary increases
3.00%
Discount rate
2.98% Healthcare cost trend rates
8.0% for 2018, decreasing 0.5% per year to an ultimate rate of 5.0% for 2024 and later years
Mortality
RP-2014 mortality table, MP-2016 projection The discount rate was based on the S & P Municipal Bond 20-year High Grade Rate Index as of June 30, 2018.

CITY OF WARWICK, RHODE ISLAND NOTES TO FINANCIAL STATEMENTS JUNE 30, 2018
87
Changes in Total OPEB Liability
Total OPEBLiability
Balances as of July 1, 2017 $ 356,880,279
Changes for the year:Service cost 10,631,235 Interest 10,463,940 Difference between expected and actual experience (14,109,697) Benefit payments (11,482,709)
Net change in total OPEB liability (4,497,231)
Balances as of June 30, 2018 $ 352,383,048
Sensitivity of the Total OPEB Liability to Changes in the Discount Rate
The following presents the total OPEB liability of the City, as well as what the City’s total OPEB liability would be if it were calculated using a discount rate that is 1 percentage point lower (1.98%) or 1 percentage point higher (3.98%) than the current discount rate:
Current1% Decrease Discount Rate 1% Increase
(1.98%) (2.98%) (3.98%)
Total OPEB Liability $ 382,709,935 $ 352,383,048 $ 322,056,160
Sensitivity of the Total OPEB Liability to Changes in the Healthcare Cost Trend Rates
The following presents the total OPEB liability of the City, as well as what the City’s total OPEB liability would be if it were calculated using healthcare cost trend rates that are 1 percentage point lower (7.0% decreasing to 4.0%) or 1 percentage point higher (9.0% decreasing to 6.0%) than the current healthcare cost trend rates:
Current1% Decrease Discount Rate 1% Increase
Total OPEB Liability $ 306,180,959 $ 352,383,048 $ 406,389,475

CITY OF WARWICK, RHODE ISLAND NOTES TO FINANCIAL STATEMENTS JUNE 30, 2018
88
OPEB Expense and Deferred Outflows of Resources and Deferred Inflows of Resources Related to OPEB
For the year ended June 30, 2018, the City recognized OPEB expense of $19,331,463. At June 30, 2018, the City reported deferred inflows of resources related to OPEB from the following sources:
Deferred Outflows of Resources
Deferred Inflows of Resources
Difference between expected and actual experience $ $ 12,345,985
Amounts reported as deferred outflows of resources related to OPEB will be recognized in OPEB expense as follows:
Year Ended June 30,
2019 $ 1,763,712 2020 1,763,712 2021 1,763,712 2022 1,763,712 2023 1,763,712
Thereafter 3,527,425
$ 12,345,985
B. Other Post-Employment Benefits - School
Plan Description
The Warwick School Department administers a single-employer defined benefit healthcare plan. The plan provides medical/drug benefits for eligible retirees and their dependents through the City’s group health and dental insurance plans, which cover both active and retired members. Benefit provisions are established and amended by union contract, through negotiations between the City and respective unions. The plan does not issue a publicly available financial report. All benefits terminate at age 65.
Teaching Employees are eligible for benefits after serving the district for 20 to 30 years depending on their date of hire. Other district employees are required to reach age 62 and have 25 years of service. Teaching employees contribute 20 to 60% for coverage depending on their date of hire. Other employees will contribute 20% for coverage. Spouses of teaching employees are not covered by the plan. Spouses of other district employees will contribute 20% for coverage. Surviving beneficiaries continue to receive access to the district’s medical coverage through COBRA after the death of the retired employee. Survivors are required to pay the full cost of benefits.

CITY OF WARWICK, RHODE ISLAND NOTES TO FINANCIAL STATEMENTS JUNE 30, 2018
89
Funding Policy
Contribution requirements are negotiated between the Warwick School Department and the respective unions. The Warwick School Department is required to contribute the cost of medical/drug and dental benefits, less the amount of any applicable co-payments in effect at the time of retirement. For the year ended June 30, 2018, the plan operated on a pay-as-you-go basis, and no provision has been made to fund future benefits to be provided to plan members. For the fiscal year ended June 30, 2018, the Warwick School Department contributed $812,604 for its employees.
At June 30, 2018, membership consisted of:
School
Active employees 1,295 Retired 62
Total 1,357
Total OPEB Liability
The Warwick School Department’s total OPEB liability of $53,466,538 was measured as of June 30, 2018 and was determined by an actuarial valuation as of July 1, 2017.
Actuarial Assumptions and Other Inputs
The total OPEB liability in the June 30, 2018 actuarial valuation was determined using the following actuarial assumptions and other inputs, applied to all periods included in the measurement unless otherwise specified:
Inflation
3.00% Salary increases
3.00%
Discount rate
2.98% Healthcare cost trend rates
8.0% for 2018, decreasing 0.5% per year to an ultimate rate of 5.0% for 2024 and later years
Mortality
RP-2014 mortality table, MP-2016 projection The discount rate was based on the S & P Municipal Bond 20-year High Grade Rate Index as of June 30, 2018.

CITY OF WARWICK, RHODE ISLAND NOTES TO FINANCIAL STATEMENTS JUNE 30, 2018
90
Changes in Total OPEB Liability
Total OPEBLiability
Balances as of July 1, 2017 $ 53,197,522
Changes for the year:Service cost 2,069,696 Interest 1,573,178 Difference between expected and actual experience (2,581,254) Benefit payments (812,604)
Net change in total OPEB liability 249,016
Balances as of June 30, 2018 $ 53,446,538
Sensitivity of the Total OPEB Liability to Changes in the Discount Rate
The following presents the total OPEB liability of the Warwick School Department, as well as what the Warwick School Department’s total OPEB liability would be if it were calculated using a discount rate that is 1 percentage point lower (1.98%) or 1 percentage point higher (3.98%) than the current discount rate:
Current1% Decrease Discount Rate 1% Increase
(1.98%) (2.98%) (3.98%)
Total OPEB Liability $ 59,317,614 $ 53,446,538 $ 47,575,463
Sensitivity of the Total OPEB Liability to Changes in the Healthcare Cost Trend Rates
The following presents the total OPEB liability of the Warwick School Department, as well as what the Warwick School Department’s total OPEB liability would be if it were calculated using healthcare cost trend rates that are 1 percentage point lower (7.0% decreasing to 4.0%) or 1 percentage point higher (9.0% decreasing to 6.0%) than the current healthcare cost trend rates:
Current1% Decrease Discount Rate 1% Increase
Total OPEB Liability $ 44,581,657 $ 53,446,538 $ 64,154,894

CITY OF WARWICK, RHODE ISLAND NOTES TO FINANCIAL STATEMENTS JUNE 30, 2018
91
OPEB Expense and Deferred Outflows of Resources and Deferred Inflows of Resources Related to OPEB
For the year ended June 30, 2018, the Warwick School Department recognized OPEB expense of $3,320,217. At June 30, 2018, the Warwick School Department reported deferred inflows of resources related to OPEB from the following sources:
Deferred Outflows of Resources
Deferred inflows of Resources
Difference between expected and actual experience $ $ 2,258,597
Amounts reported as deferred outflows of resources related to OPEB will be recognized in OPEB expense as follows:
Net DeferredOutflows (Inflows)
Year Ended June 30, Resources
2019 $ 322,657 2020 322,657 2021 322,657 2022 322,657 2023 322,657
Thereafter 645,312
$ 2,258,597
16. SUMMARY DISCLOSURE OF SIGNIFICANT CONTINGENCIES
Litigation
Liabilities for legal cases and other claims against governmental funds are recorded in the governmental funds when the ultimate liability can be estimated and such cases are expected to be settled with available expendable financial resources.
At June 30, 2018, the City had several lawsuits pending. The total maximum damages being sought from the City to these cases are not known. In the opinion of the City officials and the City’s legal counsel, the City’s ultimate liability with respects to these cases, if any, will be immaterial.

CITY OF WARWICK, RHODE ISLAND NOTES TO FINANCIAL STATEMENTS JUNE 30, 2018
92
Commitments
The City had several outstanding construction projects as of June 30, 2018. These projects are evidenced by contractual commitments with contractors and include:
Spent to RemainingContract Date Commitment Funding Source(s)
Bayside $ 1,605,758 $ 764,319 SRF Capital ContractsNW Gorton's Pond 256,256 111,041 SRF Capital ContractsGovernor Francis III 765,143 4,830,399 SRF Capital ContractsAWT II Phopserus Removal/Upgrade 15,001,286 303,984 SRF Capital ContractsEast Natick III 39,097 122,043 SRF Capital ContractsPrimary Clarifier 149,715 78,130 SRF Capital Contracts
Fire Code Compliance Program 120,780 17,920 GO BondFire Code Compliance Program 221,310 73,490 GO Bond
$ 18,159,345 $ 6,301,326
Grants
The City has received federal and state grants for specific purposes that are subject to audit by the grantors or their representatives. Such audits could lead to requests for reimbursement to the grantor agency for expenditures disallowed under terms of the grant. City officials believe such allowances, if any, would be immaterial.
17. RISK MANAGEMENT
The City is exposed to various risks of loss related to torts; theft of, damage to, and destruction of assets; errors or omissions; and natural disasters. As a result, the City participates in a nonprofit, public entity risk pool (Rhode Island Interlocal Risk Management Trust, Inc.), which provides coverage for property/liability claims. Upon joining the Trust, the City signed a participation agreement which outlines the rights and responsibilities of both the Trust and the City. The agreement states that for premiums paid by the City, the Trust will assume financial responsibility for the City’s losses up to the maximum amount of insurance purchased, minus the City’s deductible amounts. The Trust provides this insurance coverage through a pooled, self-insurance mechanism which includes reinsurance purchased by the Trust to protect against large, catastrophic claims above the losses the Trust retains internally for payment from the pooled contributions of its Members.
There have been no significant reductions in insurance coverage during the year ended June 30, 2018 as compared to the previous year. The claims incurred did not exceed insurance coverage this year.

CITY OF WARWICK, RHODE ISLAND NOTES TO FINANCIAL STATEMENTS JUNE 30, 2018
93
The changes in workers’ compensation claims liability are as follows:
Current YearBeginning Claims and BalanceFiscal Year Changes in Claim Fiscal
Liability Estimate Payments Year End
2016-2017 $ 218,950 $ 388,607 $ 443,556 $ 164,001 2017-2018 164,001 413,764 436,022 141,743
For its employer health insurance coverage, the School Department has chosen to participate in the Health Benefit Project provided by the WB Community Health, an independent, nonprofit organization. The School Department is also self-insured for the dental insurance coverage through WB Community Health. Deposits made to the Collaborative are treated as expenditures when it is probable that a claim has been incurred, and include estimates amounts for claims that have been incurred but not reported (IBNR). Claim liabilities are calculated considering the effects of inflation, recent claim and health care trends, and other economic and social factors.
The City is fully insured for its employee health plan through the Rhode Island Interlocal Risk Management Trust, Inc., effective July 1, 2013. The City’s employee dental plan is provided by Blue Cross on a fully insured basis. Prior to July 1, 2013, the City was self-insured with participation in WB Community Health.
An analysis of claims activity is presented below:
Claims andLiability Changes in Claims LiabilityJuly 1, Estimates Payments June 30,
School $ 1,220,675 $ 22,289,468 $ 22,123,499 $ 1,386,644 City 20,851,583 20,851,583 -
2016-2017 $ 1,220,675 $ 43,141,051 $ 42,975,082 $ 1,386,644
School $ 1,386,644 $ 22,995,755 $ 23,150,143 $ 1,232,256 City 22,039,117 22,039,117 -
2017-2018 $ 1,386,644 $ 45,034,872 $ 45,189,260 $ 1,232,256
18. ABATEMENTS
The City has two tax agreements in place in conjunction with the City’s tax stabilization ordinance for Warwick Intermodal and Historic Districts. The tax relief relative to these agreements does not begin until fiscal year 2019.

CITY OF WARWICK, RHODE ISLAND NOTES TO FINANCIAL STATEMENTS JUNE 30, 2018
94
19. ON-BEHALF PAYMENTS
The amount recognized in the School Unrestricted Fund revenues and education expenditures for contributions made by the state on behalf of the City’s teachers to the State Employees’ Retirement System of Rhode Island was $7,409,776.
20. PRIOR PERIOD ADJUSTMENT AND RESTATEMENT
The following restatements were recorded to the beginning of net position of the governmental activities as a result of implementation of GASB Statement No. 75, Accounting and Financial Reporting for Postemployment Benefits Other than Pensions:
Governmental Business-Type Sewer WaterActivities Activities Fund Fund
Net position as previously reported at June 30, 2017 $ (470,530,654) $ 123,348,039 $ 102,463,344 $ 9,534,899
Eliminate Net OPEB Obligation reported per GASB No. 45 158,701,793 5,066,988 2,741,157 2,325,831
Record beginning total OPEB liability per GASB No. 75 (395,744,541) (14,333,260) (7,166,630) (7,166,630)
Net Position as Restated at July 1, 2017 $ (707,573,402) $ 114,081,767 $ 98,037,871 $ 4,694,100
21. SUBSEQUENT EVENTS
During fiscal year 2019, the City of Warwick received a partial summary judgment in favor of the plaintiffs, ruling that they are entitled to receive a COLA that includes a component based on the holiday pay of active firefighters. The Court has not ruled on the amount of damages owed to retirees dating back to the holiday pay increase of 2015 or entered a final judgment. The City has calculated an amount owed to be estimated at $591,600.
The Warwick School Department is projecting an un-audited year-end deficit for Fiscal Year 2019 in the amount of $3,148,800. This amount assumes the School Department will not be funding its portion of 2006 school bond principal and interest payments or receiving the subsequent school housing aid from these payments, which amounts to a net amount of $1,492,262.

Required Supplementary
Information

RSI-1CITY OF WARWICK, RHODE ISLANDSCHEDULE OF REVENUES AND EXPENDITURES (NON-GAAP BUDGETARY BASIS) BUDGETARY COMPARISON SCHEDULE - GENERAL FUND FOR THE YEAR ENDED JUNE 30, 2018
Actual Original Final Amounts
Budgeted Budgeted (BudgetaryRevenues Revenues Basis) Variance
General Property Taxes $ 230,264,242 $ 230,264,242 $ 227,930,585 $ (2,333,657)
Intergovernmental:Telephone tax 1,056,511 1,056,511 1,033,439 (23,072) Aid to school buildings 856,689 856,689 885,176 28,487 Tax in lieu 1,690,561 1,690,561 1,687,863 (2,698) Motor vehicle tax phase-out 964,536 964,536 3,093,847 2,129,311 Departmental grant income 1,757,092 1,757,092 1,804,267 47,175 State municipal incentive aid - -
Total intergovernmental 6,325,389 6,325,389 8,504,592 2,179,203
Licenses and fees:Licenses - police/miscellaneous 346,485 346,485 334,020 (12,465) Municipal fees 2,040,000 2,040,000 2,446,530 406,530 Building permits 882,000 882,000 1,032,512 150,512 Advertising and zoning fees 26,000 26,000 25,886 (114) Recreational fees 850,000 850,000 904,783 54,783 Parking violation and fines 195,000 195,000 231,730 36,730 Department processing/program fees 533,000 533,000 379,361 (153,639)
Total licenses and fees 4,872,485 4,872,485 5,354,822 482,337
Other revenue:Tax titles 50,000 50,000 35,073 (14,927) Interest on taxes 1,950,000 1,950,000 2,087,162 137,162 Interest on investments/capital projects 1,400 1,400 331,164 329,764 Housing authority 138,000 138,000 149,245 11,245 Airport parking tax 500,000 500,000 500,000 - Airport miscellaneous income 800,000 800,000 957,119 157,119 Airport surcharge 1,000,000 1,000,000 1,430,037 430,037 Airport EDC 778,000 778,000 784,239 6,239 Municipal court 250,000 250,000 168,255 (81,745) Hotel tax 1,874,214 1,874,214 2,034,329 160,115 Meal tax 2,850,000 2,850,000 3,188,368 338,368 Pilot Program - Johnson & Wales 40,000 40,000 - (40,000) School back charge - lease purchase/tipping fee 17,000 17,000 17,295 295 School RIHEBC Debit reimbursement 1,330,949 1,330,949 1,531,414 200,465 Enterprise fund back charges 2,662,871 2,662,871 2,837,940 175,069 Other 3,115,938 3,115,938 3,343,570 227,632
Total other revenue 17,358,372 17,358,372 19,395,210 2,036,838
Total revenues 258,820,488 258,820,488 261,185,209 2,364,721
Other financing sources: School re-appropriated surplus 1,218,671 1,218,671 - Fund balance drawdown 1,295,271 4,295,271 4,295,271 - Rescue service fees 2,400,000 2,400,000 2,748,435 348,435 Transfers - in from school 42,755,978 42,755,978 42,923,775 167,797
Total other financing sources 46,451,249 50,669,920 51,186,152 516,232
Total Revenues and Other Financing Sources $ 305,271,737 $ 309,490,408 $ 312,371,361 $ 2,880,953
(Continued on next page)
95

RSI-1CITY OF WARWICK, RHODE ISLANDSCHEDULE OF REVENUES AND EXPENDITURES (NON-GAAP BUDGETARY BASIS) BUDGETARY COMPARISON SCHEDULE - GENERAL FUND (CONTINUED) FOR THE YEAR ENDED JUNE 30, 2018
Actual Original Final Amounts
Budgeted Budgeted (BudgetaryExpenditure Expenditure Basis) Variance
Executive and administrative:Executive department $ 409,889 $ 409,889 $ 386,282 $ 23,607 Legal department 453,350 453,350 370,977 82,373 City clerk 418,352 418,352 234,589 183,763 Probate court 117,762 117,762 131,107 (13,345) Municipal court 109,304 109,304 88,115 21,189 Personnel department 344,920 344,920 333,241 11,679
1,853,577 1,853,577 1,544,311 309,266
Legislative and citizens representation:Legislative department 307,279 307,279 212,623 94,656 Board of canvassers 178,910 178,910 175,702 3,208
486,189 486,189 388,325 97,864
Financial management:Finance administration 441,987 441,987 467,694 (25,707) Treasury 418,393 418,393 382,731 35,662 Management information services 1,372,942 1,372,942 1,261,006 111,936 Purchasing 234,581 234,581 232,200 2,381 City tax collection 870,336 870,336 596,158 274,178 City assessment 863,684 863,684 708,551 155,133 Board of assessment review 15,150 15,150 4,533 10,617
4,217,073 4,217,073 3,652,873 564,200
Total executive and administrative 6,556,839 6,556,839 5,585,509 971,330
Public safety department:Animal shelter 219,011 219,011 207,777 11,234 Police department 20,354,737 20,354,737 19,913,285 441,452 Fire department 22,200,483 22,200,483 23,813,489 (1,613,006) Organized crime/drug enforcement task force 21,500 21,500 24,388 (2,888) Alcohol and highway safety enforcement 90,000 90,000 118,621 (28,621) Police grants 76,646 76,646 3,464 73,182 Emergency management 217,242 217,242 68,158 149,084 Building inspection and minimum housing 953,574 953,574 771,672 181,902 Board of public safety 56,729 56,729 56,667 62
Total public safety 44,189,922 44,189,922 44,977,521 (787,599)
(Continued on next page)
96

RSI-1CITY OF WARWICK, RHODE ISLANDSCHEDULE OF REVENUES AND EXPENDITURES (NON-GAAP BUDGETARY BASIS) BUDGETARY COMPARISON SCHEDULE - GENERAL FUND (CONTINUED) FOR THE YEAR ENDED JUNE 30, 2018
Actual Original Final Amounts
Budgeted Budgeted (BudgetaryExpenditure Expenditure Basis) Variance
Recreation:Parks and recreation $ 529,292 $ 529,292 $ 429,910 $ 99,382 William Thayer memorial ice rink 992,607 992,607 936,973 55,634 McDermott swimming pool 514,417 514,417 494,421 19,996
2,036,316 2,036,316 1,861,304 175,012
Public library 2,950,955 2,950,955 2,924,841 26,114
Social services:Human services administration 438,729 438,729 416,072 22,657 Senior center 520,088 520,088 498,923 21,165 Senior transportation 275,411 275,411 274,404 1,007
1,234,228 1,234,228 1,189,399 44,829
Planning department 807,484 807,484 734,478 73,006
Community development 309,595 309,595 243,243 66,352
Tourism, culture and development 748,420 748,420 645,373 103,047
Public works department:Administrative division 221,075 221,075 228,804 (7,729) Highway division 5,059,374 5,059,374 4,684,742 374,632 Sanitation division 2,283,226 2,283,226 2,420,487 (137,261) Automotive Division 2,458,799 2,458,799 2,168,954 289,845 City building maintenance division 1,431,608 1,431,608 1,234,579 197,029 Engineering division 1,902,598 1,902,598 1,894,686 7,912 Recycling 74,500 74,500 57,651 16,849 Field maintenance 823,228 823,228 738,707 84,521
14,254,408 14,254,408 13,428,610 825,798
Sewer review board 2,000 2,000 1,600 400
Employee benefits, special and capital:Employee benefits 27,251,568 27,251,568 27,337,719 (86,151) Insurance 1,835,397 1,835,397 2,028,611 (193,214) City council claims 20,000 20,000 17,970 2,030 Postage 74,550 74,550 89,879 (15,329) Fixed costs 365,000 365,000 409,157 (44,157) Pension 31,716,877 31,716,877 31,869,866 (152,989)
61,263,392 61,263,392 61,753,202 (489,810)
Total expenditures 134,353,559 134,353,559 133,345,080 1,008,479
Other financing uses:Operating transfer to debt service fund 8,679,736 8,679,736 8,516,470 163,266 Operating transfer to school unrestricted fund 162,238,442 166,457,113 166,467,463 (10,350)
Total other financing uses 170,918,178 175,136,849 174,983,933 152,916
Total Expenditures and Other Financing Uses $ 305,271,737 $ 309,490,408 $ 308,329,013 $ 1,161,395
97

RSI-2CITY OF WARWICK, RHODE ISLANDBUDGETARY COMPARISON SCHEDULE - SCHOOL GENERAL FUNDSCHEDULE OF REVENUES AND EXPENDITURES (NON-GAAP BUDGETARY BASIS) FOR THE YEAR ENDED JUNE 30, 2018
ActualAmounts
Original Final (BudgetaryBudget Budget Basis) Variance
Revenues: State and Federal School Aid $ 40,899,478 $ 40,899,478 $ 40,021,671 $ (877,807) Other school miscellaneous revenue 1,856,500 1,856,500 2,901,710 1,045,210 Appropriation from the City 119,482,464 122,482,464 120,951,080 (1,531,384) Re-appropriation of fund balance - transfer from City 1,218,671 1,218,671 -
Total revenues 162,238,442 166,457,113 165,093,132 (1,363,981)
Expenditures: Education 162,238,442 166,457,113 164,935,655 (1,521,458)
Excess of Revenue over Expenditures $ - $ - $ 157,477 $ 157,477
98

RSI-3CITY OF WARWICK, RHODE ISLANDNOTES TO REQUIRED SUPPLEMENTARY INFORMATIONBUDGETARY DATA AND BUDGETARY COMPLIANCE (CONTINUED)FOR THE YEAR ENDED JUNE 30, 2018
B. Budgetary to GAAP Basis Reconciliation
The following reconciliation summarizes the difference for the City's General Fund and the School Unrestricted Fund between budgetary and GAAP basis accounting principles for the year ended June 30, 2018:
SchoolGeneral Unrestricted
Fund Fund
Revenues and Other Financing Sources:Actual amounts (budgetary basis) $ 312,371,361 $ 165,093,132 Difference - budget to GAAP The appropriated fund balance is a budgetary revenue but is not a current year revenue for financial reporting purposes (157,477) The appropriated fund balance drawdown is a budgetary revenue but is not a current year revenue for financial reporting purposes (4,295,271) The appropriated fund balance from Reserve for Education is a budgetary revenue but is not a current year revenue for financial reporting purposes (1,218,671) Transfer from other funds is a budgetary revenue, but is reported net of the related transfer to other funds for financial reporting purposes (44,455,189) Rescue Service Fund revenue net of transfer to General Fund reported as revenue for GAAP purposes not included in Budget Basis revenues. 786,674 The pension contributions made to the Employees Retirement System by the State of Rhode Island on behalf of the City of Warwick is not reported as budgetary revenue, but is a current year revenue for financial reporting purposes 7,409,776
Total Revenues and Other Financing Sources as Reported in the Statement of Revenues, Expenditures and Changes in Fund Balance - Governmental Funds $ 263,188,904 $ 172,345,431
99

RSI-3CITY OF WARWICK, RHODE ISLANDNOTES TO REQUIRED SUPPLEMENTARY INFORMATIONBUDGETARY DATA AND BUDGETARY COMPLIANCE (CONTINUED)FOR THE YEAR ENDED JUNE 30, 2018
B. Budgetary to GAAP Basis Reconciliation (Continued)
SchoolGeneral Unrestricted
Fund Fund
Expenditures and Other Financing Sources:Actual amounts (budgetary basis) $ 308,329,013 $ 164,935,655 Difference - budget to GAAP Encumbrances for supplies and equipment ordered but not received are reported in the year the order is placed for budgetary purposes, but in the year supplies are received for financial reporting purposes. 112,349 Transfer to School Department is reported at gross amount for budget purposes but is reported net of School revenue for GAAP. (1,531,414) Transfer from other funds is a budgetary revenue, but is reported net of the related transfer to other funds for financial reporting purposes. (42,923,775) Rescue Service Fund revenue net of transfer to General Fund reported as revenue for GAAP purposes not part of the budgetary basis expenditures. 786,674 The pension contributions made to the Employees Retirement System by the State of Rhode Island on behalf of the City of Warwick is not reported as budgetary revenue, but is a current year revenue for financial reporting purposes. 7,409,776
Total Expenditures and Other Financing Sources as Reported in the Statement of Revenues, Expenditures and Changes in Fund Balance - Governmental Funds $ 264,772,847 $ 172,345,431
100

RSI-4CITY OF WARWICK, RHODE ISLANDSCHEDULE OF CHANGES IN EMPLOYERS’ NET PENSION LIABILITY AND RELATED RATIOSCITY EMPLOYEES’ PENSION PLANLAST FIVE FISCAL YEARS
2018 2017 2016 2015 2014
Total pension liability: Service cost $ 3,470,808 $ 3,265,824 $ 2,604,452 $ 2,361,164 $ 1,368,801 Interest 11,508,757 11,177,444 11,143,830 10,681,187 9,817,470 Difference between actual and expected experience 1,973,093 (552,930) 1,619,642 8,308,519 Assumption changes 8,912,895 (354,818) Benefit payments (10,198,712) (9,301,086) (8,862,354) (8,367,787) (7,872,056)
Net change in total pension liability 6,753,946 5,142,182 13,245,893 6,294,206 11,267,916 Total pension liability - beginning 170,101,420 164,959,238 151,713,345 145,419,139 134,151,223
Total pension liability - ending (a) 176,855,366 170,101,420 164,959,238 151,713,345 145,419,139
Plan fiduciary net position: Contributions - employer 6,194,245 5,764,819 5,505,376 5,640,498 5,436,625 Contributions - employee 1,888,875 1,765,310 1,620,427 1,579,755 1,572,702 Net investment income (loss) 11,247,563 14,263,989 (1,578,910) 2,695,082 15,609,969 Benefit payments (10,198,712) (9,301,086) (8,862,354) (8,367,787) (7,872,056) Administrative expense (21,413) (34,671) (33,370) (34,244) (28,582) Other 10,591
Net change in plan fiduciary net position 9,121,149 12,458,361 (3,348,831) 1,513,304 14,718,658 Plan fiduciary net position beginning 124,934,249 112,475,888 115,824,719 114,311,415 99,592,757
Plan fiduciary net position - ending (b) 134,055,398 124,934,249 112,475,888 115,824,719 114,311,415
Net Pension Liability (a-b) $ 42,799,968 $ 45,167,171 $ 52,483,350 $ 35,888,626 $ 31,107,724
Plan fiduciary net position as a percentage of the total pension liability 75.8% 73.4% 68.2% 76.3% 78.6%
Covered payroll $ 23,610,939 $ 22,066,375 $ 20,255,338 $ 20,072,947 18,391,191
Net pension liability as a percentage of covered payroll 181.3% 204.7% 259.1% 178.8% 169.1%
Note: The schedule is intended to show information for 10 years - additional years will be displayed as they become available
101

RSI-5CITY OF WARWICK, RHODE ISLANDSCHEDULE OF CHANGES IN EMPLOYERS’ NET PENSION LIABILITY AND RELATED RATIOSPOLICE I AND FIRE PENSION PLANLAST FIVE FISCAL YEARS
2018 2017 2016 2015 2014
Total pension liability:Service cost $ 653,640 $ 810,009 $ 936,610 $ 1,005,457 $ 1,276,922 Interest 19,565,475 19,645,595 20,076,965 20,085,394 22,543,132 Difference between actual and expected experience 4,604,032 1,862 (1,195,853) (10,108,652) Assumption changes 16,534,846 (26,630,682) Benefit payments (22,027,916) (21,067,877) (20,192,173) (19,753,740) (19,675,904)
Net change in total pension liability 2,795,231 (612,273) 17,358,110 141,258 (32,595,184) Total pension liability - beginning 294,066,490 294,678,763 277,320,653 277,179,395 309,774,579
Total pension liability - ending (a) 296,861,721 294,066,490 294,678,763 277,320,653 277,179,395 Plan fiduciary net position:
Contributions - employer 17,934,399 17,465,464 17,378,897 16,039,998 15,206,485 Contributions - member 175,440 219,770 266,831 284,810 321,061 Net investment income (loss) 5,911,507 9,138,696 (929,819) 1,380,201 9,803,078 Benefit payments (22,027,916) (21,067,877) (20,192,173) (19,753,740) (19,675,904) Administrative expense (22,453) (38,823) (29,322) (29,576) (24,335) Other 11,061 670
Net change in plan fiduciary net position 1,982,038 5,717,900 (3,505,586) (2,078,307) 5,630,385 Plan fiduciary net position - beginning 71,756,352 66,038,452 69,544,038 71,622,345 65,991,960
Plan fiduciary net position - ending (b) 73,738,390 71,756,352 66,038,452 69,544,038 71,622,345 Net Pension Liability (a-b) $ 223,123,331 $ 222,310,138 $ 228,640,311 $ 207,776,615 $ 205,557,050
Plan fiduciary net position as a percentage of the total pension liability 24.8% 24.4% 22.4% 25.1% 25.8%
Covered payroll $ 2,506,287 $ 3,139,571 $ 3,811,871 $ 4,068,714 $ 4,154,657
Net pension liability as a percentage of covered payroll 8902.5% 7080.9% 5998.1% 5106.7% 4947.6%
Note: The schedule is intended to show information for 10 years - additional years will be displayed as they become available
102

RSI-6CITY OF WARWICK, RHODE ISLANDSCHEDULE OF CHANGES IN EMPLOYERS’ NET PENSION LIABILITY AND RELATED RATIOSPOLICE II PENSION PLANLAST FIVE FISCAL YEARS
2018 2017 2016 2015 2014
Total pension liability:Service cost $ 4,693,492 $ 4,744,240 $ 3,884,441 $ 3,770,366 $ 3,762,837 Interest 15,998,841 15,258,836 14,589,705 13,811,883 13,520,113 Difference between actual and expected experience (2,080,926) 329,603 738,684 (1,806,121) Assumption changes 15,898,398 (3,961,813) Benefit payments (9,658,734) (8,861,372) (8,245,091) (7,768,947) (7,488,066)
Net change in total pension liability 8,952,673 11,141,704 26,457,056 10,551,986 4,026,950 Total pension liability - beginning 234,308,479 223,166,775 196,709,719 186,157,733 182,130,783
Total pension liability - ending (a) 243,261,152 234,308,479 223,166,775 196,709,719 186,157,733 Plan fiduciary net position:
Contributions - employer 4,179,364 3,938,725 3,853,855 3,828,534 3,322,236 Contributions - member 2,089,682 2,008,027 1,931,974 1,914,267 1,661,118 Net investment income (loss) 16,368,484 22,689,311 (2,481,497) 4,075,102 24,147,499 Benefit payments (9,658,734) (8,861,372) (8,245,091) (7,768,947) (7,488,066) Administrative expense (19,924) (28,474) (37,409) (39,395) (24,100) Other 500
Net change in plan fiduciary net position 12,959,372 19,746,217 (4,978,168) 2,009,561 21,618,687 Plan fiduciary net position - beginning 193,183,186 173,436,969 178,415,137 176,405,576 154,786,889
Plan fiduciary net position - ending (b) 206,142,558 193,183,186 173,436,969 178,415,137 176,405,576 Net Pension Liability (a-b) $ 37,118,594 $ 41,125,293 $ 49,729,806 $ 18,294,582 $ 9,752,157
Plan fiduciary net position as a percentage of the total pension liability 84.7% 82.4% 77.7% 90.7% 94.8%
Covered payroll $ 13,820,649 $ 13,791,394 $ 13,269,052 $ 12,781,663 $ 12,494,306
Net pension liability as a percentage of covered payroll 268.6% 298.2% 374.8% 143.1% 78.1%
Note: The schedule is intended to show information for 10 years - additional years will be displayed as they become available
103

RSI-7CITY OF WARWICK, RHODE ISLANDSCHEDULE OF CHANGES IN EMPLOYERS’ NET PENSION LIABILITY AND RELATED RATIOSFIRE II PENSION PLAN LAST FIVE FISCAL YEARS
2018 2017 2016 2015 2014
Total pension liability:Service cost $ 4,844,310 $ 4,563,165 $ 3,946,558 $ 3,534,726 $ 3,435,947 Interest 5,250,580 4,654,274 4,125,110 3,572,193 3,205,452 Benefit Changes 2,321,185 Difference between actual and expected experience (135,069) (577,982) 482,842 (62,953) Assumption changes 5,201,487 (1,341,914) Benefit payments (843,743) (587,618) (449,467) (397,441) (394,626)
Net change in total pension liability 11,437,263 8,629,821 12,245,706 7,192,320 4,841,906 Total pension liability - beginning 74,128,449 65,498,628 53,252,922 46,060,602 41,218,696
Total pension liability - ending (a) 85,565,712 74,128,449 65,498,628 53,252,922 46,060,602 Plan fiduciary net position:
Contributions - employer 3,561,858 3,149,947 2,973,277 2,943,088 2,903,462 Contributions - member 1,780,929 1,574,973 1,486,639 1,471,544 1,451,731 Net investment income (loss) 4,543,343 7,834,412 (930,262) 782,789 5,483,041 Benefit payments (843,743) (587,618) (449,467) (397,441) (394,626) Administrative expense (18,000) (20,875) (8,926) (8,697) (4,315)
Net change in plan fiduciary net position 9,024,387 11,950,839 3,071,261 4,791,283 9,439,293 Plan fiduciary net position - beginning 64,558,640 52,607,801 49,536,540 44,745,257 35,305,964
Plan fiduciary net position - ending (b) 73,583,027 64,558,640 52,607,801 49,536,540 44,745,257 Net Pension Liability (a-b) $ 11,982,685 $ 9,569,809 $ 12,890,827 $ 3,716,382 $ 1,315,345
Plan fiduciary net position as a percentage of the total pension liability 86.0% 87.1% 80.3% 93.0% 97.1%
Covered payroll $ 15,267,285 $ 14,188,946 $ 13,393,144 $ 12,602,432 $ 11,769,201
Net pension liability as a percentage of covered payroll 78.5% 67.4% 96.2% 29.5% 11.2%
Note: The schedule is intended to show information for 10 years - additional years will be displayed as they become available
104

RSI-8CITY OF WARWICK, RHODE ISLANDSCHEDULE OF CHANGES IN EMPLOYERS’ NET PENSION LIABILITY AND RELATED RATIOSWARWICK PUBLIC SCHOOLS EMPLOYEES’ PENSION PLANLAST FIVE FISCAL YEARS
2018 2017 2016 2015 2014
Total pension liability: Service cost $ 1,101,378 $ 1,085,156 $ 1,182,332 $ 1,153,661 $ 1,233,904 Interest 3,727,866 3,405,815 3,239,682 3,013,821 2,683,152 Difference between actual and expected experience 1,105,363 2,093,032 (363,953) 342,058 664,117 Assumption changes 85,298 81,200 113,452 67,700 Benefit payments (2,265,755) (1,901,797) (1,506,891) (1,122,881) (1,035,956)
Net change in total pension liability 3,754,150 4,763,406 2,664,622 3,386,659 3,612,917 Total pension liability - beginning 53,267,565 48,504,159 45,839,537 42,452,878 38,839,961
Total pension liability - ending (a) 57,021,715 53,267,565 48,504,159 45,839,537 42,452,878
Plan fiduciary net position: Contributions - employer 1,152,310 2,044,880 1,968,941 1,752,679 2,160,500 Contributions - employee 721,712 803,054 732,245 766,137 743,492 Net investment income 4,797,201 5,414,063 936,885 1,487,522 3,977,291 Benefit payments (2,265,755) (1,901,797) (1,506,891) (1,122,881) (1,035,956) Administrative expense (200,111) (205,899) (173,084) (95,056) (83,496)
Net change in plan fiduciary net position 4,205,357 6,154,301 1,958,096 2,788,401 5,761,831 Plan fiduciary net position beginning 48,797,539 42,643,238 40,685,142 37,896,741 32,134,910
Plan fiduciary net position - ending (b) 53,002,896 48,797,539 42,643,238 40,685,142 37,896,741
Net Pension Liability (a-b) $ 4,018,819 $ 4,470,026 $ 5,860,921 $ 5,154,395 $ 4,556,137
Plan fiduciary net position as a percentage of the total pension liability 93.0% 91.6% 87.9% 88.8% 89.3%
Covered payroll $ 13,435,984 $ 12,914,407 $ 12,567,847 $ 13,918,915 13,335,646
Net pension liability as a percentage of covered payroll 29.9% 34.6% 46.6% 37.0% 34.2%
Note: The schedule is intended to show information for 10 years - additional years will be displayed as they become available
105

RSI-9CITY OF WARWICK, RHODE ISLANDSCHEDULE OF CITY CONTRIBUTIONSCITY EMPLOYEES’ PENSION PLANLAST FIVE FISCAL YEARS
2018 2017 2016 2015 2014
Actuarially determined contribution $ 6,194,245 $ 5,764,819 $ 5,505,376 $ 5,640,498 $ 5,436,625
Actual contribution made in relation to the actuarially determined contribution 6,194,245 5,764,819 5,505,376 5,640,498 5,436,625
Contribution deficiency (excess) $ - $ - $ - $ - $ -
Covered payroll $ 23,610,939 $ 23,610,939 $ 20,255,338 $ 20,072,947 $ 18,391,191
Contributions as a percentage of covered payroll 26.2% 24.4% 27.2% 28.1% 29.6%
Valuation date July 1, 2017Notes
Actuarial cost methodSingle Equivalent Amortization Period 10 Years ClosedAmortization Period for New Gains/Losses 20 years ClosedAsset Valuation Method 5-Year Smoothed MarketInflation 2.25%Salary Increases 3.00% to 7.00% including inflationInvestment rate of return 6.90%Retirement age
Other Information:Notes There were no benefit changes during the year.
The schedule is intended to show information for 10 years - additional years will be displayed as they become available
Notes to Schedule of Contributions
Methods and Assumptions Used to Determine Contribution Rates:
Mortality
(Female) 95% of RP-2000 Combined Healthy for Females with White Collar adjustments, projected with Scale AA from 2000.
(Male) 115% of RP-2000 Combined Healthy for Males with White Collar adjustments, projected with Scale AA from 2000.
Actuarially determined contribution rates are calculated as of June 30, effective for the fiscal year that begins 12 months after the valuation date.
Experienced-based table of rates that are specific to the type of eligibility condition.
For funding purposes, the Entry Age Normal Actuarial Cost Method is used.
106

RSI-10CITY OF WARWICK, RHODE ISLANDSCHEDULE OF CITY CONTRIBUTIONSPOLICE I AND FIRE PENSION PLANLAST FIVE FISCAL YEARS
2018 2017 2016 2015 2014
Actuarially determined contribution $ 17,934,399 $ 17,465,464 $ 17,378,897 $ 16,039,998 $ 15,206,485
Actual contribution made in relation to the actuarially determined contribution 17,934,399 17,465,464 17,378,897 16,039,998 15,206,485
Contribution deficiency (excess) $ - $ - $ - $ - $ -
Covered payroll $ 2,506,287 $ 3,139,571 $ 3,811,871 $ 4,068,714 $ 4,154,657
Contributions as a percentage of covered payroll 715.6% 556.3% 455.9% 394.2% 366.0%
Valuation date July 1, 2017Notes
Actuarial cost methodSingle Equivalent Amortization Period 19 Years ClosedAmortization Period for New Gains/Losses 20 years ClosedAsset Valuation Method 5-Year Smoothed MarketInflation 2.25%Salary Increases 3.50% to 13.50% including inflationInvestment rate of return 6.90%Retirement age
Other Information:Notes There were no benefit changes during the year.
The schedule is intended to show information for 10 years - additional years will be displayed as they become available
Notes to Schedule of Contributions
Mortality
Methods and Assumptions Used to Determine Contribution Rates:
(Female) 95% of RP-2000 Combined Healthy for Females with White Collar adjustments, projected with Scale AA from 2000.(Male) 115% of RP-2000 Combined Healthy for Males with White Collar adjustments, projected with Scale AA from 2000.Experienced-based table of rates that are specific to the type of eligibility condition.
For funding purposes, the Entry Age Normal Actuarial Cost Method is used.
Actuarially determined contribution rates are calculated as of June 30, effective for the fiscal year that begins 12 months after the valuation date.
107

RSI-11CITY OF WARWICK, RHODE ISLANDSCHEDULE OF CITY CONTRIBUTIONSPOLICE II PENSION PLANLAST FIVE FISCAL YEARS
2018 2017 2016 2015 2014
Actuarially determined contribution $ 4,179,364 $ 3,938,725 $ 3,853,855 $ 3,828,534 $ 3,322,236
Actual contribution made in relation to the actuarially determined contribution 4,179,364 3,938,725 3,853,855 3,828,534 3,322,236
Contribution deficiency (excess) $ - $ - $ - $ - $ -
Covered payroll $ 13,820,649 $ 13,791,394 $ 13,269,052 $ 12,781,663 $ 12,494,306
Contributions as a percentage of covered payroll 30.2% 28.6% 29.0% 30.0% 26.6%
Valuation date July 1, 2017Notes
Actuarial cost methodSingle Equivalent Amortization Period 23 Years ClosedAmortization Period for New Gains/Losses 30 years ClosedAsset Valuation Method 5-Year Smoothed MarketInflation 2.25%Salary Increases 3.50% to 13.50% including inflationInvestment rate of return 6.90%
Retirement ageExperienced-based table of rates that are specific to the type of eligibility condition.
Other Information:Notes There were no benefit changes during the year.
The schedule is intended to show information for 10 years - additional years will be displayed as they become available
Notes to Schedule of Contributions
Methods and Assumptions Used to Determine Contribution Rates:
Mortality
Actuarially determined contribution rates are calculated as of June 30, effective for the fiscal year that begins 12 months after the valuation date.
For funding purposes, the Entry Age Normal Actuarial Cost Method is used.
(Male) 115% of RP-2000 Combined Healthy for Males with White Collar adjustments, projected with Scale AA from 2000.(Female) 95% of RP-2000 Combined Healthy for Females with White Collar adjustments, projected with Scale AA from 2000.
108

RSI-12CITY OF WARWICK, RHODE ISLANDSCHEDULE OF CITY CONTRIBUTIONSFIRE II PENSION PLANLAST FIVE FISCAL YEARS
2017 2017 2016 2015 2014
Actuarially determined contribution $ 3,561,858 $ 3,149,947 $ 2,973,277 $ 2,943,088 $ 2,903,462
Actual contribution made in relation to the actuarially determined contribution 3,561,858 3,149,947 2,973,277 2,943,088 2,903,462
Contribution deficiency (excess) $ - $ - $ - $ - $ -
Covered payroll $ 15,267,285 $ 14,188,946 $ 13,393,144 $ 12,602,432 $ 11,769,201
Contributions as a percentage of covered payroll 23.3% 22.2% 22.2% 23.4% 24.7%
Valuation date July 1, 2017Notes
Actuarial cost methodSingle Equivalent Amortization Period 15 Years ClosedAmortization Period for New Gains/Losses 20 years ClosedAsset Valuation Method 5-Year Smoothed MarketInflation 2.25%Salary Increases 3.50% to 13.50% including inflationInvestment rate of return 6.90%Retirement age
Other Information:Notes There were no benefit changes during the year.
The schedule is intended to show information for 10 years - additional years will be displayed as they become available
Notes to Schedule of Contributions
Methods and Assumptions Used to Determine Contribution Rates:
Mortality(Female) 95% of RP-2000 Combined Healthy for Females with White Collar adjustments, projected with Scale AA from 2000.(Male) 115% of RP-2000 Combined Healthy for Males with White Collar adjustments, projected with Scale AA from 2000.Experienced-based table of rates that are specific to the type of eligibility condition.
For funding purposes, the Entry Age Normal Actuarial Cost Method is used.
Actuarially determined contribution rates are calculated as of June 30, effective for the fiscal year that begins 12 months after the valuation date.
109

RSI-13CITY OF WARWICK, RHODE ISLANDSCHEDULE OF CITY CONTRIBUTIONSWARWICK PUBLIC SCHOOL EMPLOYEES’ PENSION PLAN LAST FOUR FISCAL YEARS
2018 2017 2016 2015 2014
Actuarially determined contribution $ 1,109,882 $ 1,156,709 $ 1,161,346 $ 1,092,021 $ 1,236,062
Actual contribution made in relation to the actuarially determined contribution 1,152,310 2,044,880 1,968,941 1,752,679 2,160,500
Contribution deficiency (excess) $ (42,428) $ (888,171) $ (807,595) $ (660,658) $ (924,438)
Covered payroll $ 13,435,984 $ 12,914,407 $ 12,567,847 $ 13,918,915 $ 13,335,646
Contributions as a percentage of covered payroll 8.6% 15.8% 15.7% 12.6% 16.2%
Valuation date July 1, 2018Notes
Actuarial cost methodAmortization Method Level percentage of payrollRemaining Amortization Period 30 yearsAsset Valuation Method Fair Market ValueSalary Increases 3.00% per annumInvestment rate of return 7.00%Retirement ageMortalityOther Information:Notes There were no benefit changes during the year.
The schedule is intended to show information for 10 years - additional years will be displayed as they become available
Notes to Schedule of Contributions
Methods and Assumptions Used to Determine Contribution Rates:
Prescribed IRS Static Mortality Table for the year of the valuation15% per year for ages 62 to 64, 100% at age 65
For funding purposes, the Entry Age Normal Actuarial Cost Method is used.
Actuarially determined contribution rates are calculated as of the beginning of the fiscal year - July 1st.
110

RSI-14CITY OF WARWICK, RHODE ISLANDSCHEDULE OF INVESTMENT RETURNS CITY PENSION PLANSLAST FOUR FISCAL YEARS
2018 2017 2016 2015 2014
Annual money-weighted rate of return, net of investment expense
Police I and Fire Pension Plan 8.47% 14.23% -1.94% 0.51% 15.35%Police II Pension Plan 8.55% 13.17% -1.40% 2.25% 15.70%Fire II Pension Plan 6.80% 14.40% -1.81% 1.31% 14.80%City Employees Pension Plan 9.08% 12.78% -1.37% 2.11% 15.73%Warwick Public School Employees’ Pension Plan 9.74% 12.61% 2.30% 1.97% 17.24%
Note:The schedule is intended to show information for 10 years - additional years will be displayed as they become available
111

RSI-15CITY OF WARWICK, RHODE ISLANDSCHEDULE OF CITY CONTRIBUTIONSEMPLOYEES’ RETIREMENT SYSTEM - TEACHERSLAST FOUR FISCAL YEARS
2018 2017 2016 2015
Actuarially determined contribution $ 10,176,528 $ 10,619,358 $ 10,888,514 $ 10,546,876
Actual contribution made in relation to the actuarially determined contribution 10,176,528 10,619,358 10,888,514 10,546,876
Contribution deficiency (excess) $ - $ - $ - $ -
Covered payroll $ 76,861,994 $ 80,571,760 $ 79,304,545 $ 78,649,336
Contributions as a percentage of covered payroll 13.2% 13.2% 13.7% 13.4%
Notes:1) Employers participating in the State Employees’ Retirement System are required by RI General Laws, Section 36-10-2, to contribute an actuarially determined rate each year2) The schedule is intended to show information for 10 years - additional years will be displayed as they become available
112

RSI-16CITY OF WARWICK, RHODE ISLANDSCHEDULE OF CITY’S PROPORTIONATE SHARE OF THE NET PENSION LIABILITY EMPLOYEES’ RETIREMENT SYSTEM - TEACHERSLAST FOUR FISCAL YEARS
2018 2017 2016 2015
Employer’s Proportion of the Net Pension Liability 4.264% 4.708% 4.840% 5.003%
Employer’s Proportionate Share of the Net Pension Liability $ 134,499,571 $ 140,460,773 $ 133,250,179 $ 121,776,253
State’s Proportionate Share of the Net Pension Liability 101,649,361 96,195,004 91,032,340 83,507,586
Total Net Pension Liability $ 236,148,932 $ 236,655,777 $ 224,282,519 $ 205,283,839
Employer’s Covered Payroll $ 76,861,994 $ 80,571,760 $ 79,304,545 $ 78,649,336
Employer’s Proportionate Share of the Net Pension Liability as a Percentage of its Covered Payroll 174.99% 174.33% 168.02% 154.83%
Plan Fiduciary Net Position as a Percentage of the Total Pension Liability 54.00% 54.10% 57.60% 61.40%
Notes:1) The amounts presented for each fiscal year were determined as of 6/30 measurement date prior to the fiscal year-end2) The schedule is intended to show information for 10 years - additional years will be displayed as they become available
113

RSI-17CITY OF WARWICK, RHODE ISLANDSCHEDULE OF CHANGES IN TOTAL OPEB LIABILITY AND RELATED RATIOS LAST FISCAL YEAR
2018
City Plan
Total OPEB liability: Service cost $ 10,631,235 Interest 10,463,940 Changes of benefit terms Differences between expected and actual experience (14,109,697) Changes of assumptions and other inputs Benefit payments (11,482,709)
Net change in total OPEB liability (4,497,231) Total OPEB liability - beginning 356,880,279
Total OPEB Liability - Ending $ 352,383,048 School Plan
Total OPEB liability: Service cost $ 2,069,696 Interest 1,573,178 Changes of benefit terms Differences between expected and actual experience (2,581,254) Changes of assumptions and other inputs Benefit payments (812,604)
Net change in total OPEB liability 249,016 Total OPEB liability - beginning 53,197,522
Total OPEB Liability - Ending $ 53,446,538
Note:The schedule is intended to show information for 10 years - additional years will be displayed as they become available
114

Supplemental, Combining and
Individual Fund Statements
and Schedules

Nonmajor Governmental Funds
NONMAJOR GOVERNMENTAL FUNDS
SPECIAL REVENUE FUNDS: Special Revenue Restricted City Funds- These funds are used to account for revenues from specific taxes or other earmarked revenue sources which by law are designated to finance particular functions or activities of government, and which therefore cannot be diverted to other uses. The following is a list of special revenue funds in this section:
Special Detail Fund - Established to account for the rescue service fees and any related expenditures.
City Clerk Restricted Fund - Established to account for fees and expenditures related to the enhancement of the vital statistic and land evidence systems.
Emergency Operations City - Established to account for the revenues and expenditures associated with the March 2010 Flood Disaster.
Warwick Public Library Restricted Fund - Established to account for receipt and disbursements of grants/donations and related expenditures for library operations.
Open Space Land Dedication Fund - Established to account for residential subdivision fees and related expenditures for public recreation land acquisitions in districts containing these subdivisions.
Sewer Connection Grant - Established to account for the receipt and disbursement of funds relating to a grant program which assists residents with the cost of new sewer connections.
Excess Hotel Tax Fund - Established to reserve economic development portion of state hotel tax exceeding current year tourism related expenditures.
Mooring Fee Reserve Fund - Established to account for waterfront safety fees and related expenditures.
Senior Center Gift Shop - Established to account for receipts and expenditures related to the operation of Pilgrim Senior Center.
JAG Grant - Established to account for grant proceeds received from the U.S. Department of Justice for the purpose of enhancing law enforcement operations and public safety.
Drug Seizure Fund - Established to account for proceeds from drug related property seizures and related anti-drug expenditures.
State Asset Forfeiture - Established to account for proceeds from drug related property seizures and related anti-drug expenditures.

NONMAJOR GOVERNMENTAL FUNDS
SPECIAL REVENUE FUNDS (CONTINUED):
Community Development Block Grant - Established to account for the annual Entitlement Community program of the U.S. Department of Housing and Urban Development and related expenditures addressing housing and community development needs throughout Warwick. It provides assistance to the low and moderate income population of the City of Warwick.
Lead Reduction Program - Established to account for a grant received from the U.S. Department of Housing and Urban Development. Expenses relate to oversight and monitoring of lead reduction programs for low and moderate income residents of the City of Warwick.
Disaster Recovery Program - Established to account for a grant received from the U.S. Department of Housing and Urban Development. Expenses relate to assisting individuals and businesses affected by the March 2010 flood, with regard to repairing and rehabilitating housing units and public facilities.
School Restricted Funds - Funds established to account for federal, state, and private grant monies used for the benefit of the Warwick School Department. The following is a list of the School funds included in this section:
• IDEA • IDEA Pre-School • Title I • Title II • E2T2 Training Consortium Title III • Perkins Voc Even Year/Perkins Voc Odd Year • Homeless Even Year/Homeless Odd Year • Fresh Fruit/Veg Program • Skills USA • Big Yellow Bus • Scott Tech Donations • Esther Chester Donations • Mary Maini Memorial Fund • City/Town Contributions Sports • Walmart • Full Day Kindergarten • Injury Fund • Emergency Repairs-Tech • Feinstein • Rhode Island Foundation • Dorothy Rich Association • Holliman Yearbook • Cedar Library Books
• PTO Donations • Education Development Center • School Food Service Fund • Champlin Aldrich Gorton • Champlin Audio/Video • Art Talks Sherman • C.A.S.I.T Italian Program • United Way • Wireless Classroom Initiative • CTE • Stop & Shop • Carol Gray Memorial Fund • Champlin Winman • CS4RI Teals Innovation Office Grant • Target • Shapiro Fund for Warwick • Generation Youth Foundation • English Learner Categorical • IGT Charitable Contribution • Patricia St. Amant Afterschool • Technology Self lnsurance • Leadership Minigrant • Staples Foundation

NONMAJOR GOVERNMENTAL FUNDS
CAPITAL PROJECT FUNDS: The Capital Project Funds account for all resources used for the acquisition and/or construction of capital facilities by the City, except those financed by the Enterprise Funds.
2000 Open Space Bond Fund -to acquire and preserve open space within the City.
2006 Fire Station Bond Fund - to account for capital improvements related to the fire station.
2006 School Bond Fund -to account for capital improvements related to schools.
2002 Drainage Bond Fund - to account for various improvements to the drainage system of the City.
2006 City Buildings Bond Fund - to account for capital improvements related to municipal facilities.
Capital Leases Fund - to account for expenditures relating to the City's lease purchase program for the acquisition of capital equipment and vehicles.
Road Bridge Fund - to account for expenditures relating to road and bridge work.
DEBT SERVICE FUND: • The Debt Service Fund is used to account for the payment of interest and principal on all general
long-term debt other than that payable from the Enterprise Funds.

CITY OF WARWICK, RHODE ISLAND COMBINING BALANCE SHEET NONMAJOR GOVERNMENTAL FUNDS JUNE 30, 2018
EXHIBIT A-1
Special Revenue Special Revenue Capital DebtRestricted Restricted Projects Service
City School Funds Fund TotalASSETS
Cash and cash equivalents $ 1,480,382 $ 1,530 $ 2,315,675 $ $ 3,797,587 Restricted cash and cash equivalents 3,552,500 3,552,500 Due from federal and state governments 2,448,037 4,944,439 459,300 7,851,776 Accounts receivable 3,102,909 26 7,000 3,109,935 Due from other funds 1,226,027 1,062,897 7,524 2,296,448 Other assets 178,300 178,300
Total Assets $ 8,257,355 $ 6,187,192 $ 2,789,499 $ 3,552,500 $ 20,786,546
LIABILITIES AND FUND BALANCES
Liabilities: Accounts payable and accrued expenditures $ 172,268 $ 723,457 $ 360,547 $ $ 1,256,272 Due to federal and state governments 35 35 Due to other funds 135,107 4,415,274 59,280 4,609,661 Other liabilities 3,543 3,543
Total liabilities 310,953 5,138,731 419,827 - 5,869,511
Deferred Inflows of Resources:Unavailable revenues - other 5,434,836 5,434,836
Fund Balances: Restricted 2,511,566 1,073,797 2,369,672 3,552,500 9,507,535 Unassigned (25,336) (25,336)
Total fund balances 2,511,566 1,048,461 2,369,672 3,552,500 9,482,199
Total Liabilities, Deferred Inflows of Resources and Fund Balances $ 8,257,355 $ 6,187,192 $ 2,789,499 $ 3,552,500 $ 20,786,546
115

CITY OF WARWICK, RHODE ISLAND COMBINING STATEMENT OF REVENUES, EXPENDITURES AND CHANGES IN FUND BALANCES NONMAJOR GOVERNMENTAL FUNDS FOR THE YEAR ENDED JUNE 30, 2018
EXHIBIT A-2
Special Revenue Special Revenue Capital DebtRestricted Restricted Projects Service
City School Funds Fund Total
Revenues: Intergovernmental revenues $ 1,194,561 $ 7,171,311 $ $ $ 8,365,872 Charges for services 3,016,780 1,126,073 4,142,853 Investment income 2,038 2,038 Contributions and private grants 32,623 160,741 193,364 Other revenue 344,852 60,000 404,852
Total revenues 4,590,854 8,518,125 - - 13,108,979 Expenditures:
Executive and administration 132,402 132,402 Public safety 2,666,885 70,837 2,737,722 Public libraries 130,384 130,384 Social services 23,471 23,471 Planning and economic development 1,348,119 13,687 1,361,806 Public works 685,384 685,384 Education 10,260,489 7,592,809 17,853,298
Debt service:Principal 6,648,671 6,648,671 Interest and other costs 82,651 1,360,299 1,442,950
Total expenditures 4,301,261 10,260,489 8,445,368 8,008,970 31,016,088
Excess (Deficiency) of Revenues over Expenditures 289,593 (1,742,364) (8,445,368) (8,008,970) (17,907,109)
Other Financing Sources (Uses): Proceeds from capital lease 321,207 321,207 Premium on revenue bonds issued 429,773 429,773 Proceeds of revenue bonds 4,460,000 4,460,000 Transfers in 481,744 484,519 8,516,470 9,482,733 Transfers out (1,046,170) (1,046,170)
Total other financing sources (uses) (564,426) 484,519 5,210,980 8,516,470 13,647,543
Net Change in Fund Balances (274,833) (1,257,845) (3,234,388) 507,500 (4,259,566)
Fund Balances at Beginning of Year 2,786,399 2,306,306 5,604,060 3,045,000 13,741,765
Fund Balances at End of Year $ 2,511,566 $ 1,048,461 $ 2,369,672 $ 3,552,500 $ 9,482,199
116

CITY OF WARWICK, RHODE ISLAND COMBINING BALANCE SHEET SPECIAL REVENUE RESTRICTED CITY JUNE 30, 2018
EXHIBIT A-3
City Warwick Open Excess MooringSpecial Clerk Emergency Public Library Space Sewer Hotel FeeDetail Restricted Operations Restricted Land Connection Tax ReserveFund Fund City Fund Dedication Grant Fund Fund
ASSETS
Cash and cash equivalents $ $ $ $ 201,648 $ 296,473 $ 34,159 $ 147,139 $ 231,682 Accounts receivable 512,329 Due from federal and state governmentsDue from other funds 99,147 954,141 128,657 32,623 8,011
Total Assets $ 611,476 $ 954,141 $ 128,657 $ 201,648 $ 329,096 $ 34,159 $ 147,139 $ 239,693
LIABILITIES AND FUND BALANCES
Liabilities: Accounts payable and accrued expenditures $ 67,737 $ 4,020 $ $ 20,036 $ $ 1,000 $ $Due to federal and state governments Due to other funds 57,781 4,713 Other liabilities
Total liabilities 67,737 4,020 - 77,817 - 5,713 - -
Deferred Inflows of Resources:Unavailable revenues - other 512,329
Fund Balances: Restricted 31,410 950,121 128,657 123,831 329,096 28,446 147,139 239,693
Total Liabilities, Deferred Inflows of Resources and Fund Balances $ 611,476 $ 954,141 $ 128,657 $ 201,648 $ 329,096 $ 34,159 $ 147,139 $ 239,693
(Continued on next page)
117

CITY OF WARWICK, RHODE ISLAND COMBINING BALANCE SHEET (CONTINUED) SPECIAL REVENUE RESTRICTED CITY JUNE 30, 2018
EXHIBIT A-3
ASSETS
Cash and cash equivalents Accounts receivableDue from federal and state governmentsDue from other funds
Total Assets
LIABILITIES AND FUND BALANCES
Liabilities: Accounts payable and accrued expendituresDue to federal and state governments Due to other funds Other liabilities
Total liabilities
Deferred Inflows of Resources:Unavailable revenues - other
Fund Balances: Restricted
Total Liabilities, Deferred Inflows of Resources and Fund Balances
Senior Federal State Community Home Lead HUDCenter Police Asset Asset Development Improvement Hazard Disaster
Gift JAG Forfeiture Forfeiture Block Loan Escrow Reduction RecoveryShop Grant Fund Fund Grant Account Program Grant Total
$ 26,201 $ $ 84,995 $ 59,360 $ 320,275 $ 78,450 $ $ $ 1,480,382 2,590,580 3,102,909
771,319 1,676,718 2,448,037 3,448 1,226,027
$ 29,649 $ - $ 84,995 $ 59,360 $ 3,682,174 $ 78,450 $ - $ 1,676,718 $ 8,257,355
$ 1,951 $ $ 17,964 $ $ 53,195 $ 1,260 $ $ 5,105 $ 172,268 35 35
5,975 8,827 57,811 135,107 3,543 3,543
1,951 - 23,939 12,370 111,041 1,260 - 5,105 310,953
3,250,894 1,671,613 5,434,836
27,698 61,056 46,990 320,239 77,190 2,511,566
$ 29,649 $ - $ 84,995 $ 59,360 $ 3,682,174 $ 78,450 $ - $ 1,676,718 $ 8,257,355
118

CITY OF WARWICK, RHODE ISLAND COMBINING STATEMENT OF REVENUES, EXPENDITURES AND CHANGES IN FUND BALANCES SPECIAL REVENUE RESTRICTED CITY FOR THE YEAR ENDED JUNE 30, 2018
EXHIBIT A-4
City Warwick Open Excess MooringSpecial Clerk Emergency Public Library Space Sewer Hotel FeeDetail Restricted Operations Restricted Land Connection Tax ReserveFund Fund City Fund Dedication Grant Fund Fund
Revenues: Intergovernmental revenues $ $ $ $ 152,119 $ $ $ $Charges for services 2,990,378 8,011 Investment income 270 600 79 297 455 Contributions and private grants 32,623 Other revenue 102,350
Total revenues 2,990,378 102,350 - 152,389 33,223 79 297 8,466 Expenditures:
Executive and administration 132,402 Public safety 2,526,637 39,756 Public libraries 130,384 Social servicesPlanning and economic development 8,000
Total expenditures 2,526,637 132,402 39,756 130,384 - 8,000 - -
Excess (Deficiency) of Revenues over Expenditures 463,741 (30,052) (39,756) 22,005 33,223 (7,921) 297 8,466
Other Financing Sources (Uses): Transfers in Transfers out (564,426)
Total other financing sources (uses) (564,426) - - - - - - -
Net Change in Fund Balances (100,685) (30,052) (39,756) 22,005 33,223 (7,921) 297 8,466
Fund Balances at Beginning of Year 132,095 980,173 168,413 101,826 295,873 36,367 146,842 231,227
Fund Balances at End of Year $ 31,410 $ 950,121 $ 128,657 $ 123,831 $ 329,096 $ 28,446 $ 147,139 $ 239,693
(Continued on next page)
119

CITY OF WARWICK, RHODE ISLAND COMBINING STATEMENT OF REVENUES, EXPENDITURES AND CHANGES IN FUND BALANCES (CONTINUED) SPECIAL REVENUE RESTRICTED CITY FOR THE YEAR ENDED JUNE 30, 2018
EXHIBIT A-4
Revenues: Intergovernmental revenues Charges for services Investment income Contributions and private grants Other revenue
Total revenues Expenditures:
Executive and administrationPublic safety Public librariesSocial servicesPlanning and economic development
Total expenditures
Excess (Deficiency) of Revenues over Expenditures
Other Financing Sources (Uses): Transfers in Transfers out
Total other financing sources (uses)
Net Change in Fund Balances
Fund Balances at Beginning of Year
Fund Balances at End of Year
Senior Federal State Community Home Lead HUDCenter Police Asset Asset Development Improvement Hazard Disaster
Gift JAG Forfeiture Forfeiture Block Loan Escrow Reduction RecoveryShop Grant Fund Fund Grant Account Program Grant Total
$ $ 19,707 $ 3,343 $ 21,167 $ 900,178 $ $ $ 98,047 $ 1,194,561 18,391 3,016,780
54 202 81 2,038 32,623
5,861 8,629 228,012 344,852 24,306 19,707 12,174 21,248 1,128,190 - - 98,047 4,590,854
132,402 19,707 71,241 9,544 2,666,885
130,384 23,471 23,471
824,178 417,894 98,047 1,348,119 23,471 19,707 71,241 9,544 824,178 417,894 - 98,047 4,301,261
835 - (59,067) 11,704 304,012 (417,894) - - 289,593
481,744 481,744 (481,744) (1,046,170)
- - - - (481,744) 481,744 - - (564,426)
835 - (59,067) 11,704 (177,732) 63,850 - - (274,833)
26,863 - 120,123 35,286 497,971 13,340 - - 2,786,399
$ 27,698 $ - $ 61,056 $ 46,990 $ 320,239 $ 77,190 $ - $ - $ 2,511,566
120

CITY OF WARWICK, RHODE ISLAND COMBINING BALANCE SHEET SPECIAL REVENUE RESTRICTED SCHOOL FUNDS JUNE 30, 2018
EXHIBIT A-5
Homeless Homeless FreshIDEA Perkins Voc Child/Youth Child/Youth Fruit/Veg
IDEA Preschool Title I Title II Title III Ed Even Year Odd Year Program
ASSETS
Cash and cash equivalents $ $ $ $ $ $ $ $ $ Accounts receivable Due from federal and state governments 2,638,547 96,082 1,353,055 376,808 4,593 302,308 18,733 33,583 Due from other funds Other assets
Total Assets $ 2,638,547 $ 96,082 $ 1,353,055 $ 376,808 $ 4,593 $ 302,308 $ 18,733 $ - $ 33,583
LIABILITIES AND FUND BALANCES
Liabilities: Accounts payable and accrued expenditures $ 176,225 $ 10,704 $ 99,123 $ 65,060 $ 262 $ 71,622 $ 5,996 $ $ 5,365 Due to other funds 2,462,322 85,378 1,253,932 311,748 4,331 230,686 18,383 32,215
Total liabilities 2,638,547 96,082 1,353,055 376,808 4,593 302,308 24,379 - 37,580
Fund Balances: Restricted Unrestricted (5,646) (3,997) Total fund balances - - - - - - (5,646) - (3,997)
Total Liabilities and Fund Balances $ 2,638,547 $ 96,082 $ 1,353,055 $ 376,808 $ 4,593 $ 302,308 $ 18,733 $ - $ 33,583
(Continued on next page)
121

CITY OF WARWICK, RHODE ISLAND COMBINING BALANCE SHEET (CONTINUED) SPECIAL REVENUE RESTRICTED SCHOOL FUNDS JUNE 30, 2018
EXHIBIT A-5
ASSETS
Cash and cash equivalents Accounts receivableDue from federal and state governments Due from other funds Other assets
Total Assets
LIABILITIES AND FUND BALANCES
Liabilities: Accounts payable and accrued expenditures Due to other funds
Total liabilities
Fund Balances: RestrictedUnrestrictedTotal fund balances
Total Liabilities and Fund Balances
School Gen-Assembly RI Arts Emergency Career CTE CTE CTE CTELunch Skills Big Yellow Repairs- and Tech Categorical Categorical Reserve Reserve
Equipment USA Bus Tech Repairs Odd Year Even Year Odd Year Even Year
$ $ $ $ $ $ $ $ $ 3,500 1,970 354,526 104,406 43,066 206,349 57 10,909
$ - $ 3,500 $ 1,970 $ 354,526 $ 104,406 $ 43,066 $ 206,349 $ 57 $ 10,909
$ $ 3,500 $ $ $ $ $ 1,559 $ $ 8,474 - 3,500 - - - - 1,559 - 8,474
1,970 354,526 104,406 43,066 204,790 57 2,435
- - 1,970 354,526 104,406 43,066 204,790 57 2,435
$ - $ 3,500 $ 1,970 $ 354,526 $ 104,406 $ 43,066 $ 206,349 $ 57 $ 10,909
(Continued on next page)
122

CITY OF WARWICK, RHODE ISLAND COMBINING BALANCE SHEET (CONTINUED) SPECIAL REVENUE RESTRICTED SCHOOL FUNDS JUNE 30, 2018
EXHIBIT A-5
ASSETS
Cash and cash equivalents Accounts receivableDue from federal and state governments Due from other funds Other assets
Total Assets
LIABILITIES AND FUND BALANCES
Liabilities: Accounts payable and accrued expenditures Due to other funds
Total liabilities
Fund Balances: RestrictedUnrestrictedTotal fund balances
Total Liabilities and Fund Balances
English CS4RI Teals ChamplinCTE Full Day Learner Leadership Innovation Champlin Champlin AldrichTrust Kindergarten Categorical Champions Office Grant Audio/Video Winman Gorton Feinstein
$ $ $ $ $ $ $ $ $ 8,785
19,260 880 20 179 61 3,306 95,785
$ 19,260 $ 880 $ - $ - $ 8,805 $ 179 $ 61 $ 3,306 $ 95,785
$ 5,000 $ $ $ $ 4,390 $ $ $ $ 3,439 1,076
5,000 - - 1,076 4,390 - - - 3,439
14,260 880 4,415 179 61 3,306 92,346 (1,076)
14,260 880 - (1,076) 4,415 179 61 3,306 92,346
$ 19,260 $ 880 $ - $ - $ 8,805 $ 179 $ 61 $ 3,306 $ 95,785
(Continued on next page)
123

CITY OF WARWICK, RHODE ISLAND COMBINING BALANCE SHEET (CONTINUED) SPECIAL REVENUE RESTRICTED SCHOOL FUNDS JUNE 30, 2018
EXHIBIT A-5
ASSETS
Cash and cash equivalents Accounts receivableDue from federal and state governments Due from other funds Other assets
Total Assets
LIABILITIES AND FUND BALANCES
Liabilities: Accounts payable and accrued expenditures Due to other funds
Total liabilities
Fund Balances: RestrictedUnrestrictedTotal fund balances
Total Liabilities and Fund Balances
Feinstein Rhode Toshiba Gen Youth ShapiroScott-Comm Island United Grant Foundation Staples Fund For Kula
Fund Foundation Way Science Oak Beach Foundation Warwick Foundation Target
$ $ $ $ $ $ $ $ $
2,281 1,960 589 10,000 221 541 2,363 6 1,241
$ 2,281 $ 1,960 $ 589 $ 10,000 $ 221 $ 541 $ 2,363 $ 6 $ 1,241
$ $ $ $ 7,546 $ $ $ 50 $ $ - - - 7,546 - - 50 - -
2,281 1,960 589 2,454 221 541 2,313 6 1,241
2,281 1,960 589 2,454 221 541 2,313 6 1,241
$ 2,281 $ 1,960 $ 589 $ 10,000 $ 221 $ 541 $ 2,363 $ 6 $ 1,241
(Continued on next page)
124

CITY OF WARWICK, RHODE ISLAND COMBINING BALANCE SHEET (CONTINUED) SPECIAL REVENUE RESTRICTED SCHOOL FUNDS JUNE 30, 2018
EXHIBIT A-5
ASSETS
Cash and cash equivalents Accounts receivableDue from federal and state governments Due from other funds Other assets
Total Assets
LIABILITIES AND FUND BALANCES
Liabilities: Accounts payable and accrued expenditures Due to other funds
Total liabilities
Fund Balances: RestrictedUnrestrictedTotal fund balances
Total Liabilities and Fund Balances
Education Dorothy RI IGT Carter Family Cedar HillDevelopment Rich Interlocal Stop & Charitable Spark Library PTO
Center Association Trust Shop Contributions Grant Books Donations
$ $ $ $ $ $ $ $
1,444 314 133 2,913 2,131 10 42 3,912
$ 1,444 $ 314 $ 133 $ 2,913 $ 2,131 $ 10 $ 42 $ 3,912
$ $ $ $ $ 119 $ $ $ - - - - 119 - - -
1,444 314 133 2,913 2,012 10 42 3,912
1,444 314 133 2,913 2,012 10 42 3,912
$ 1,444 $ 314 $ 133 $ 2,913 $ 2,131 $ 10 $ 42 $ 3,912
(Continued on next page)
125

CITY OF WARWICK, RHODE ISLAND COMBINING BALANCE SHEET (CONTINUED) SPECIAL REVENUE RESTRICTED SCHOOL FUNDS JUNE 30, 2018
EXHIBIT A-5
ASSETS
Cash and cash equivalents Accounts receivableDue from federal and state governments Due from other funds Other assets
Total Assets
LIABILITIES AND FUND BALANCES
Liabilities: Accounts payable and accrued expenditures Due to other funds
Total liabilities
Fund Balances: RestrictedUnrestrictedTotal fund balances
Total Liabilities and Fund Balances
C.A.S.I.T James Esther Mary Mani Carol Gray Patricia St. Day OneItalian Manson Scott Tech Chester Memorial Memorial Amant Your Voice
Program Memorial Donations Donation Fund Fund Afterschool Your Data
$ $ $ $ $ $ $ $
4,715 5,000 2,824 50 23 5,472 1,000 178,300
$ 4,715 $ 5,000 $ 2,824 $ 178,300 $ 50 $ 23 $ 5,472 $ 1,000
$ $ $ $ $ $ $ $ 1,597 - - - 1,597 - - - -
4,715 5,000 2,824 176,703 50 23 5,472 1,000
4,715 5,000 2,824 176,703 50 23 5,472 1,000
$ 4,715 $ 5,000 $ 2,824 $ 178,300 $ 50 $ 23 $ 5,472 $ 1,000
(Continued on next page)
126

CITY OF WARWICK, RHODE ISLAND COMBINING BALANCE SHEET (CONTINUED) SPECIAL REVENUE RESTRICTED SCHOOL FUNDS JUNE 30, 2018
EXHIBIT A-5
ASSETS
Cash and cash equivalents Accounts receivableDue from federal and state governments Due from other funds Other assets
Total Assets
LIABILITIES AND FUND BALANCES
Liabilities: Accounts payable and accrued expenditures Due to other funds
Total liabilities
Fund Balances: RestrictedUnrestrictedTotal fund balances
Total Liabilities and Fund Balances
City/Town Donations Donations Technology SchoolContribution Injury Performing Instructional Holliman Self Food Service
Sports Fund Arts Supplies Yearbook Insurance Fund Total
$ $ $ $ $ $ $ 1,530 $ 1,530 26 26 111,945 4,944,439
8,425 202 3,600 14,884 1,790 140,537 1,062,897 178,300
$ 8,425 $ 228 $ 3,600 $ 14,884 $ 1,790 $ - $ 254,012 $ 6,187,192
$ $ $ $ $ $ 1,011 $ 254,012 $ 723,457 13,606 4,415,274 - - - - - 14,617 254,012 5,138,731
8,425 228 3,600 14,884 1,790 1,073,797 (14,617) (25,336)
8,425 228 3,600 14,884 1,790 (14,617) - 1,048,461
$ 8,425 $ 228 $ 3,600 $ 14,884 $ 1,790 $ - $ 254,012 $ 6,187,192
127

CITY OF WARWICK, RHODE ISLAND COMBINING STATEMENT OF REVENUES, EXPENDITURES AND CHANGES IN FUND BALANCES SPECIAL REVENUE RESTRICTED SCHOOL FUNDS FOR THE YEAR ENDED JUNE 30, 2018
EXHIBIT A-6
Homeless Homeless FreshIDEA Perkins Voc Child/Youth Child/Youth Fruit/Veg
IDEA Preschool Title I Title II Title III Ed Even Year Odd Year ProgramRevenues:
Intergovernmental revenues $ 2,986,588 $ 107,121 $ 1,525,739 $ 397,993 $ 5,772 $ 284,650 $ 18,733 $ $ 87,799 Charges for services Contributions and private grants Other revenue
Total revenues 2,986,588 107,121 1,525,739 397,993 5,772 284,650 18,733 - 87,799 Expenditures:
Salaries 1,986,193 67,986 1,014,419 197,229 1,824 167,048 11,700 1,500 Employee benefits 865,062 35,213 436,138 72,053 258 71,309 9,895 115 Purchased services 25,997 12,188 109,914 3,254 20,330 1,150 3,210 Other purchased services 100 188 371 91,796 Supplies and materials 7,038 4,227 37 1,634 Capital equipment and property 15,171 Indirect costs 109,336 3,922 55,856 14,570 211 10,421 188 Miscellaneous
Total expenditures 2,986,588 107,121 1,525,739 397,993 5,772 284,650 24,379 5,013 91,796
Excess (Deficiency) of Revenues over Expenditures - - - - - - (5,646) (5,013) (3,997)
Other Financing Sources: Transfers from other funds
Net Change in Fund Balances - - - - - - (5,646) (5,013) (3,997)
Fund Balances at Beginning of Year - - - - - - - 5,013 -
Fund Balances at End of Year $ - $ - $ - $ - $ - $ - $ (5,646) $ - $ (3,997)
(Continued on next page)
128

CITY OF WARWICK, RHODE ISLAND COMBINING STATEMENT OF REVENUES, EXPENDITURES AND CHANGES IN FUND BALANCES (CONTINUED) SPECIAL REVENUE RESTRICTED SCHOOL FUNDS FOR THE YEAR ENDED JUNE 30, 2018
EXHIBIT A-6
Revenues: Intergovernmental revenues Charges for services Contributions and private grants Other revenue
Total revenues Expenditures:
SalariesEmployee benefitsPurchased servicesOther purchased servicesSupplies and materialsCapital equipment and propertyIndirect costsMiscellaneous
Total expenditures
Excess (Deficiency) of Revenues over Expenditures
Other Financing Sources: Transfers from other funds
Net Change in Fund Balances
Fund Balances at Beginning of Year
Fund Balances at End of Year
School Gen-Assembly RI Arts Emergency Career CTE CTE CTE CTELunch Skills BigYellow Repairs- and Tech Categorical Categorical Reserve Reserve
Equipment USA Bus Tech Repairs Odd Year Even Year Odd Year Even Year
$ $ 3,500 $ $ $ $ $ 150,000 $ $
4,239
4,239 3,500 - - - - 150,000 - -
122 1,728 9,677 3,500 1,951 23,851
4,239 1,043,942 7,813 92,042 6,117 11,100
4,239 3,500 - - 1,055,042 11,492 125,692 6,117 -
- - - - (1,055,042) (11,492) 24,308 (6,117) -
- - - - (1,055,042) (11,492) 24,308 (6,117) -
- - 1,970 354,526 1,159,448 54,558 180,482 6,174 2,435
$ - $ - $ 1,970 $ 354,526 $ 104,406 $ 43,066 $ 204,790 $ 57 $ 2,435
(Continued on next page)
129

CITY OF WARWICK, RHODE ISLAND COMBINING STATEMENT OF REVENUES, EXPENDITURES AND CHANGES IN FUND BALANCES (CONTINUED) SPECIAL REVENUE RESTRICTED SCHOOL FUNDS FOR THE YEAR ENDED JUNE 30, 2018
EXHIBIT A-6
Revenues: Intergovernmental revenues Charges for services Contributions and private grants Other revenue
Total revenues Expenditures:
SalariesEmployee benefitsPurchased servicesOther purchased servicesSupplies and materialsCapital equipment and propertyIndirect costsMiscellaneous
Total expenditures
Excess (Deficiency) of Revenues over Expenditures
Other Financing Sources: Transfers from other funds
Net Change in Fund Balances
Fund Balances at Beginning of Year
Fund Balances at End of Year
English CS4RI Teals ChamplinCTE Full Day Learner Leadership Innovation Champlin Champlin AldrichTrust Kindergarten Categorical Champions Office Grant Audio/Video Winman Gorton Feinstein
$ $ $ 9,110 $ $ 8,785 $ $ $ $
50,000 538 31,042
50,000 - 9,110 538 8,785 - - - 31,042
1,500 246 114
8,280 4,390 19,958 3,023
8,474 9,110 20,511 18,740 61,145 39,493
350
35,740 - 9,110 1,614 4,390 - 61,145 - 83,335
14,260 - - (1,076) 4,395 - (61,145) - (52,293)
14,260 - - (1,076) 4,395 - (61,145) - (52,293)
- 880 - - 20 179 61,206 3,306 144,639
$ 14,260 $ 880 $ - $ (1,076) $ 4,415 $ 179 $ 61 $ 3,306 $ 92,346
(Continued on next page)
130

CITY OF WARWICK, RHODE ISLAND COMBINING STATEMENT OF REVENUES, EXPENDITURES AND CHANGES IN FUND BALANCES (CONTINUED) SPECIAL REVENUE RESTRICTED SCHOOL FUNDS FOR THE YEAR ENDED JUNE 30, 2018
EXHIBIT A-6
Revenues: Intergovernmental revenues Charges for services Contributions and private grants Other revenue
Total revenues Expenditures:
SalariesEmployee benefitsPurchased servicesOther purchased servicesSupplies and materialsCapital equipment and propertyIndirect costsMiscellaneous
Total expenditures
Excess (Deficiency) of Revenues over Expenditures
Other Financing Sources: Transfers from other funds
Net Change in Fund Balances
Fund Balances at Beginning of Year
Fund Balances at End of Year
Feinstein Rhode Toshiba Gen Youth ShapiroScott-Comm Island United Grant Foundation Staples Fund For Kula
Fund Foundation Way Science Oak Beach Foundation Warwick Foundation Target
$ $ $ $ $ $ $ $ $ (7,717) 10,000 3,000 6 - (7,717) - 10,000 - - 3,000 6 -
16,799 1,257
340 10,005 1,200
144 1,587 7,546 911 637 1,946
484 29,648 - 7,546 911 1,946 1,837 - -
(484) (37,365) - 2,454 (911) (1,946) 1,163 6 -
(484) (37,365) - 2,454 (911) (1,946) 1,163 6 -
2,765 39,325 589 - 1,132 2,487 1,150 - 1,241
$ 2,281 $ 1,960 $ 589 $ 2,454 $ 221 $ 541 $ 2,313 $ 6 $ 1,241
(Continued on next page)
131

CITY OF WARWICK, RHODE ISLAND COMBINING STATEMENT OF REVENUES, EXPENDITURES AND CHANGES IN FUND BALANCES (CONTINUED) SPECIAL REVENUE RESTRICTED SCHOOL FUNDS FOR THE YEAR ENDED JUNE 30, 2018
EXHIBIT A-6
Revenues: Intergovernmental revenues Charges for services Contributions and private grants Other revenue
Total revenues Expenditures:
SalariesEmployee benefitsPurchased servicesOther purchased servicesSupplies and materialsCapital equipment and propertyIndirect costsMiscellaneous
Total expenditures
Excess (Deficiency) of Revenues over Expenditures
Other Financing Sources: Transfers from other funds
Net Change in Fund Balances
Fund Balances at Beginning of Year
Fund Balances at End of Year
Education Dorothy RI IGT Carter Family Cedar HillDevelopment Rich Interlocal Stop & Charitable Spark Library PTO
Center Association Trust Shop Contributions Grant Books Donations
$ $ $ $ $ $ $ $ 768 2,667 997 5,248 - - - 768 2,667 997 - 5,248
453 987
1,599 905 5,200 (133)
1,599 - (133) 453 905 987 - 5,200
(1,599) - 133 315 1,762 10 - 48
(1,599) - 133 315 1,762 10 - 48
3,043 314 - 2,598 250 - 42 3,864
$ 1,444 $ 314 $ 133 $ 2,913 $ 2,012 $ 10 $ 42 $ 3,912
(Continued on next page)
132

CITY OF WARWICK, RHODE ISLAND COMBINING STATEMENT OF REVENUES, EXPENDITURES AND CHANGES IN FUND BALANCES (CONTINUED) SPECIAL REVENUE RESTRICTED SCHOOL FUNDS FOR THE YEAR ENDED JUNE 30, 2018
EXHIBIT A-6
Revenues: Intergovernmental revenues Charges for services Contributions and private grants Other revenue
Total revenues Expenditures:
SalariesEmployee benefitsPurchased servicesOther purchased servicesSupplies and materialsCapital equipment and propertyIndirect costsMiscellaneous
Total expenditures
Excess (Deficiency) of Revenues over Expenditures
Other Financing Sources: Transfers from other funds
Net Change in Fund Balances
Fund Balances at Beginning of Year
Fund Balances at End of Year
C.A.S.I.T James Esther Mary Mani Carol Gray Patricia St. Day OneItalian Manson Scott Tech Chester Memorial Memorial Amant Your Voice
Program Memorial Donations Donation Fund Fund Afterschool Your Data
$ $ $ $ $ $ $ $
2,000 5,000 12,000 1,000
2,000 5,000 - - - - 12,000 1,000
98 3,030 203 592 6,252 - - 592 - - - 9,583 -
2,000 5,000 (592) - - - 2,417 1,000
2,000 5,000 (592) - - - 2,417 1,000
2,715 - 3,416 176,703 50 23 3,055 -
$ 4,715 $ 5,000 $ 2,824 $ 176,703 $ 50 $ 23 $ 5,472 $ 1,000
(Continued on next page)
133

CITY OF WARWICK, RHODE ISLAND COMBINING STATEMENT OF REVENUES, EXPENDITURES AND CHANGES IN FUND BALANCES (CONTINUED) SPECIAL REVENUE RESTRICTED SCHOOL FUNDS FOR THE YEAR ENDED JUNE 30, 2018
EXHIBIT A-6
Revenues: Intergovernmental revenues Charges for services Contributions and private grants Other revenue
Total revenues Expenditures:
SalariesEmployee benefitsPurchased servicesOther purchased servicesSupplies and materialsCapital equipment and propertyIndirect costsMiscellaneous
Total expenditures
Excess (Deficiency) of Revenues over Expenditures
Other Financing Sources: Transfers from other funds
Net Change in Fund Balances
Fund Balances at Beginning of Year
Fund Balances at End of Year
City/Town Donations Donations Technology SchoolContribution Injury Performing Instructional Holliman Self Food Service
Sports Fund Arts Supplies Yearbook Insurance Fund Total
$ $ $ $ $ $ $ 1,585,521 $ 7,171,311 1,126,073 1,126,073
3,735 3,560 7,200 846 2,380 22,232 160,741 60,000 60,000
3,735 3,560 7,200 846 2,380 82,232 2,711,594 8,518,125
58,280 405,707 3,930,185 14,216 46,463 1,552,559 1,070 2,788 2,654,858 2,893,367 18,923 117,901
300 1,447 91,048 3,600 88,537 68,715 1,466,048 194,504 3,560 14,877
300 3,560 3,600 1,070 2,788 161,033 3,196,113 10,260,489
3,435 - 3,600 (224) (408) (78,801) (484,519) (1,742,364)
484,519 484,519
3,435 - 3,600 (224) (408) (78,801) - (1,257,845)
4,990 228 - 15,108 2,198 64,184 - 2,306,306
$ 8,425 $ 228 $ 3,600 $ 14,884 $ 1,790 $ (14,617) $ - $ 1,048,461
134

CITY OF WARWICK, RHODE ISLAND COMBINING BALANCE SHEET CAPITAL PROJECT FUNDS JUNE 30, 2018
EXHIBIT A-7
2000 2006 2006 2002 2006Open Space Fire Station School Drainage City Road and
Bond Bond Bond Bond Buildings Capital BridgeFund Fund Fund Fund Bond Fund Leases Fund Total
ASSETS
Cash and cash equivalents $ 336,189 $ 101,662 $ 796,617 $ $ 1,081,207 $ $ $ 2,315,675 Due from federal and state governments 459,300 459,300 Due from other funds 7,524 7,524 Other receivables 7,000 7,000
Total Assets $ 336,189 $ 101,662 $ 796,617 $ 7,000 $ 1,081,207 $ 7,524 $ 459,300 $ 2,789,499
LIABILITIES AND FUND BALANCES
Liabilities: Accounts payable and accrued expenditures $ $ $ 125,335 $ $ 91,959 $ $ 143,253 $ 360,547 Due to other funds 176 23,191 7,000 28,913 59,280
Total liabilities 176 - 148,526 7,000 120,872 - 143,253 419,827
Fund Balances: Restricted 336,013 101,662 648,091 960,335 7,524 316,047 2,369,672
Total Liabilities and Fund Balances $ 336,189 $ 101,662 $ 796,617 $ 7,000 $ 1,081,207 $ 7,524 $ 459,300 $ 2,789,499
135
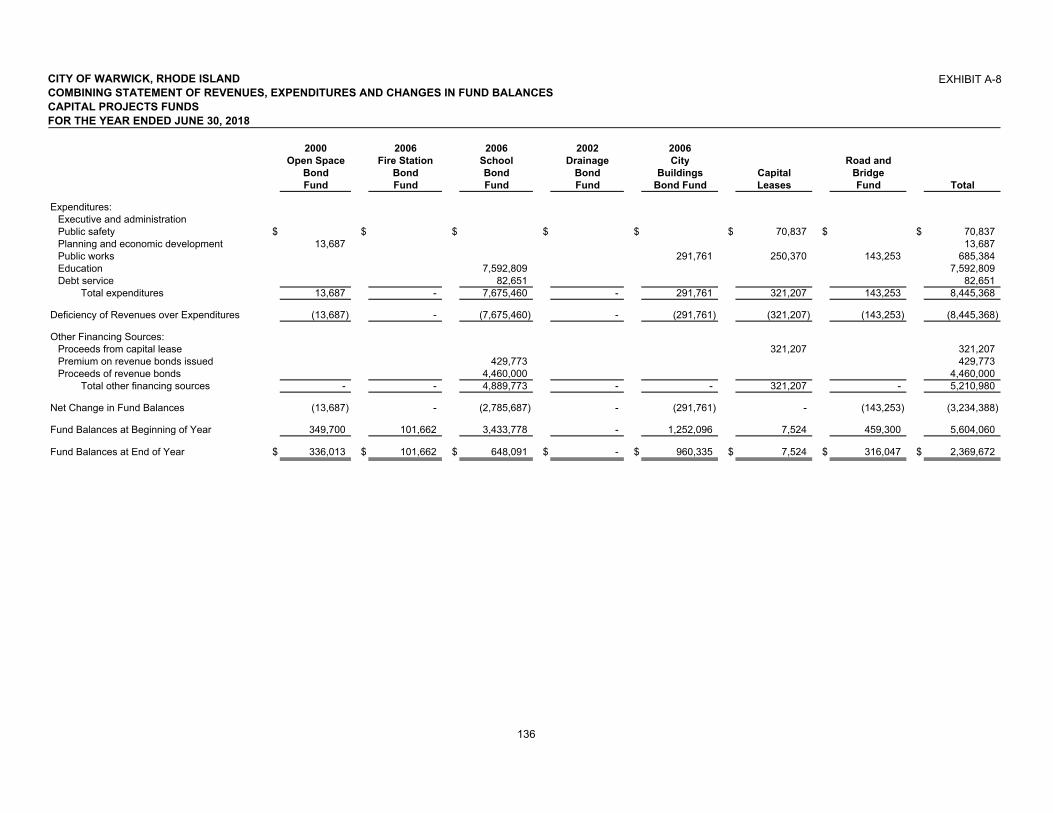
CITY OF WARWICK, RHODE ISLAND COMBINING STATEMENT OF REVENUES, EXPENDITURES AND CHANGES IN FUND BALANCES CAPITAL PROJECTS FUNDS FOR THE YEAR ENDED JUNE 30, 2018
EXHIBIT A-8
2000 2006 2006 2002 2006Open Space Fire Station School Drainage City Road and
Bond Bond Bond Bond Buildings Capital BridgeFund Fund Fund Fund Bond Fund Leases Fund Total
Expenditures:
Executive and administrationPublic safety $ $ $ $ $ $ 70,837 $ $ 70,837 Planning and economic development 13,687 13,687 Public works 291,761 250,370 143,253 685,384 Education 7,592,809 7,592,809 Debt service 82,651 82,651
Total expenditures 13,687 - 7,675,460 - 291,761 321,207 143,253 8,445,368
Deficiency of Revenues over Expenditures (13,687) - (7,675,460) - (291,761) (321,207) (143,253) (8,445,368)
Other Financing Sources: Proceeds from capital lease 321,207 321,207 Premium on revenue bonds issued 429,773 429,773 Proceeds of revenue bonds 4,460,000 4,460,000
Total other financing sources - - 4,889,773 - - 321,207 - 5,210,980
Net Change in Fund Balances (13,687) - (2,785,687) - (291,761) - (143,253) (3,234,388)
Fund Balances at Beginning of Year 349,700 101,662 3,433,778 - 1,252,096 7,524 459,300 5,604,060
Fund Balances at End of Year $ 336,013 $ 101,662 $ 648,091 $ - $ 960,335 $ 7,524 $ 316,047 $ 2,369,672
136

Nonmajor Enterprise Funds

NONMAJOR ENTERPRISE FUNDS The Enterprise Funds are used to account for operations that are financed and operated in a manner similar to private business enterprise or where the City has decided that periodic determination of net income is appropriate for capital maintenance, management control, accountability, public policy or other purposes.
The following is a list of Nonmajor enterprise funds in this section:
Emergency Operations Enterprise Fund - Accounts for the revenue and expenditures associated with the 2010 flood.
On-Site Revolving Loan Fund - Established to account for the receipt and disbursement of funds relating to a loan/grant program for residents who need to replace their existing septic systems.
Sewer Infrastructure Replacement Fund - Established to provide a funding source for scheduled sewer infrastructure repairs or expansion.
Sewer Renewal & Replacement Fund - Established to provide a funding source for the replacement of sewer equipment and vehicles.
Water Renewal & Replacement Fund - Established to provide a funding source for the replacement of water equipment and vehicles.
Water Restricted Emergency Fund - Established to provide a funding source for emergency water infrastructure repairs.
Water Infrastructure Replacement Fund - Established to provide a funding source for scheduled water infrastructure repairs or expansion.

CITY OF WARWICK, RHODE ISLAND COMBINING STATEMENT OF NET POSITION NONMAJOR PROPRIETARY FUNDS JUNE 30, 2018
EXHIBIT B-1
Emergency On-Site Sewer Sewer Water Water WaterOperations Revolving Infrastructure Renewal & Renewal & Restricted InfrastructureEnterprise Loan Replacement Replacement Replacement Emergency Replacement
Fund Fund Fund Fund Fund Fund Fund Total
ASSETS
Current assets:Cash and cash equivalents $ $ $ 57,430 $ 1,093,659 $ 116 $ 198 $ 31,344 $ 1,182,747 Accounts receivable, net
Other receivables 6,455 6,455 Due from federal and state government 4,575,607 4,575,607
Due from other funds 357,580 3,713 2,414,413 750,000 250,000 2,000,000 5,775,706 Total current assets 4,933,187 10,168 57,430 3,508,072 750,116 250,198 2,031,344 11,540,515
Noncurrent assets:Construction in process 48,501 48,501
Total Assets $ 4,933,187 $ 10,168 $ 105,931 $ 3,508,072 $ 750,116 $ 250,198 $ 2,031,344 $ 11,589,016
LIABILITIES AND FUND BALANCES
Current Liabilities:Accounts payable and accrued expenditures $ 15,000 $ $ $ 68,500 $ $ $ $ 83,500 Due to other funds 4,902,136 3,829 385,000 5,290,965
Total current liabilities 4,917,136 - 3,829 453,500 - - - 5,374,465
Net Position: Net investment in capital assets 48,501 48,501 Unrestricted 16,051 10,168 53,601 3,054,572 750,116 250,198 2,031,344 6,166,050
Total net position 16,051 10,168 102,102 3,054,572 750,116 250,198 2,031,344 6,214,551
Total Liabilities and Fund Balances $ 4,933,187 $ 10,168 $ 105,931 $ 3,508,072 $ 750,116 $ 250,198 $ 2,031,344 $ 11,589,016
137

CITY OF WARWICK, RHODE ISLAND COMBINING STATEMENT OF REVENUES, EXPENSES AND CHANGES IN NET POSITIONNONMAJOR PROPRIETARY FUNDS FOR THE YEAR ENDED JUNE 30, 2018
EXHIBIT B-2
Emergency On-Site Sewer Sewer Water Water WaterOperations Revolving Infrastructure Renewal & Renewal & Restricted InfrastructureEnterprise Loan Replacement Replacement Replacement Emergency Replacement
Fund Fund Fund Fund Fund Fund Fund Total
Operating Revenues:Assessments and user fees $ $ $ $ 719,402 $ $ $ $ 719,402 Other revenue 16,051 24,903 40,954
Total operating revenues 16,051 - 24,903 719,402 - - - 760,356 Operating Expenses:
Materials and supplies 5,800 22,347 28,147 Operations 803 803
Total operating expenses - - 6,603 22,347 - - - 28,950
Operating Income (Loss) 16,051 - 18,300 697,055 - - - 731,406
Nonoperating Revenues:Interest income 59 1,447 64 1,570
Income (Loss) Before Transfers 16,051 - 18,359 698,502 - - 64 732,976
Transfers:Operating transfers in - Operating transfers out (504,639) (504,639)
Total transfers - - - (504,639) - - - (504,639)
Net Change in Fund Balances 16,051 - 18,359 193,863 - - 64 228,337
Fund Balances at Beginning of Year - 10,168 83,743 2,860,709 750,116 250,198 2,031,280 5,986,214
Fund Balances at End of Year $ 16,051 $ 10,168 $ 102,102 $ 3,054,572 $ 750,116 $ 250,198 $ 2,031,344 $ 6,214,551
138

EXHIBIT B-3CITY OF WARWICK, RHODE ISLANDSTATEMENT OF CASH FLOWS - NONMAJOR PROPRIETARY FUNDS FOR THE YEAR ENDED JUNE 30, 2018
Emergency On-Site Sewer Sewer Water Water WaterOperations Revolving Infrastructure Renewal & Renewal & Restricted InfrastructureEnterprise Loan Replacement Replacement Replacement Emergency Replacement
Fund Fund Fund Fund Fund Fund Fund Total
Cash Flows from Operating Activities: Receipts from customers and users $ $ $ $ 719,402 $ $ $ $ 719,402 Receipts from other operating services 16,051 24,903 40,954 Payments to suppliers (538,280) (6,603) 46,153 (498,730)
Net cash provided by (used in) operating activities (522,229) - 18,300 765,555 - - - 261,626
Cash Flows from Noncapital Financing Activities: Interfund borrowings 522,229 22,705 458,364 1,003,298 Transfers in from other funds - Transfers to other funds (504,639) (504,639)
Net cash provided by (used in) noncapital financing activities 522,229 - 22,705 (46,275) - - - 498,659
Cash Flows from Capital and Related Financing Activities: Additions to property, plant and equipment - Capital grants -
Net cash provided by (used in) capital and related financing activities - - - - - - - -
Cash Flows from Investing Activities: Interest on investments 59 1,447 64 1,570
Net cash provided by (used in) investing activities - - 59 1,447 - - 64 1,570
Net Increase (Decrease) in Cash and Cash Equivalents - - 41,064 720,727 - - 64 761,855
Cash and Cash Equivalents at Beginning of Year - - 16,366 372,932 116 198 31,280 420,892
Cash and Cash Equivalents at End of Year $ - $ - $ 57,430 $ 1,093,659 $ 116 $ 198 $ 31,344 $ 1,182,747
Reconciliation of Operating Income (Loss) to Net Cash Provided by (Used in) Operating Activities: Operating income (loss) $ 16,051 $ $ 18,300 $ 697,055 $ $ $ $ 731,406 Adjustments to reconcile operating income (loss) to net cash provided by (used in) operating activities:
Depreciation and amortization Change in assets and liabilities:
(Increase) decrease in due from other funds - Increase (decrease) in accounts payable and accrued items (538,280) - 68,500 (469,780) Increase (decrease) in due to other funds -
Total adjustments (538,280) - - 68,500 - - - (469,780)
Net Cash Provided by (Used in) Operating Activities $ (522,229) $ - $ 18,300 $ 765,555 $ - $ - $ - $ 261,626
139

Pension Trust Funds And Private Purpose
Trust Funds

TRUST FUNDS
PENSION TRUST FUNDS:
Four trust funds held for the City employees and one school department fund held for the school employees.
PRIVATE PURPOSE TRUST FUNDS:
Private Purpose Trust Funds are all trust arrangements under which principal and income benefit individuals, private organizations, or other governments. The following is a list of Private Purpose Trust Funds:
Employee Benefit Trust Fund - To account for money held for various municipal union employee benefits.
Neighbors Helping Neighbors - To account for charitable donations and expenses related to local community programs.
Jeanette Cram Scholarship Fund - Established to assist student majoring in various fields.

CITY OF WARWICK, RHODE ISLAND COMBINING STATEMENT OF NET POSITION PRIVATE PURPOSE TRUST FUNDS JUNE 30, 2018
EXHIBIT C-1
Employee JeanetteBenefit Neighbors CramTrust Helping ScholarshipFund Neighbors Fund Total
ASSETS
Cash and cash equivalents $ 86,791 $ 7,108 $ 23,569 $ 117,468 Accounts receivable 30,859 7,678 38,537
Total Assets $ 117,650 $ 14,786 $ 23,569 $ 156,005
LIABILITIES
Accounts payable $ $ $ $
Total Liabilities - - - -
NET POSITION
Held in Trust for Other Purpose 117,650 14,786 23,569 156,005
Total Liabilities and Net Position $ 117,650 $ 14,786 $ 23,569 $ 156,005
140

CITY OF WARWICK, RHODE ISLAND COMBINING STATEMENT OF CHANGES IN NET POSITION PRIVATE PURPOSE TRUST FUNDS FOR THE YEAR ENDED JUNE 30, 2018
EXHIBIT C-2
Employee JeanetteBenefit Neighbors CramTrust Helping ScholarshipFund Neighbors Fund Total
Additions: Payroll deductions $ 30,954 $ 7,298 $ $ 38,252 Investment income 181 21 25 227 Other income 7,098 9,631 16,729
Total additions 38,233 16,950 25 55,208
Deductions 21,565 19,000 1,001 41,566
Change in Net Position 16,668 (2,050) (976) 13,642
Net Position at Beginning of Year 100,982 16,836 24,545 142,363
Net Position at End of Year $ 117,650 $ 14,786 $ 23,569 $ 156,005
141

Agency Funds

AGENCY FUNDS
Agency Funds were established to function as clearing mechanisms for cash resources which are collected and disbursed to authorized recipients. The following is a list of Agency Funds included in this section:
Treasurers Agent - Established to account for money held in trust for various parties.
Funds in Registry of Probate Court - Established to account for funds held for various estates.
Sewer Line Agency - Established to account for monies held for private parties in connection with various sewer construction projects.
Realty Tax Fund - Established to account for tax revenues generated from sale of realty.
Student Activity Funds - To account for monies received and expended for various student activities and groups.

EXHIBIT D CITY OF WARWICK, RHODE ISLANDAGENCY FUNDS COMBINING STATEMENT OF CHANGES IN ASSETS AND LIABILITIES FOR THE YEAR ENDED JUNE 30, 2018
July 1, 2017 Additions Deductions June 30, 2018
Treasurer's Agent
Assets:Cash and cash equivalents $ 298,294 $ 246,603 $ 73,940 $ 470,957 Due from other funds 11,373 328,625 283,985 56,013
Total Assets $ 309,667 $ 575,228 $ 357,925 $ 526,970
Liabilities:Accounts payable and accrued expenditures $ 6,496 $ 73,348 $ 52,915 $ 26,929 Deposits Held in Custody 303,171 351,208 154,338 500,041
Total Liabilities $ 309,667 $ 424,556 $ 207,253 $ 526,970
Funds in Registry of Probate Court
Assets:Cash and cash equivalents $ 63,701 $ 15,897 $ 53,743 $ 25,855
Liabilities:Deposits held in custody for others $ 63,701 $ 15,897 $ 53,743 $ 25,855
Sewer Line Agency
Assets:Cash and cash equivalents $ 224,415 $ 24,733 $ 61,681 $ 187,467 Accounts receivable 24,270 77,995 102,265 -
Total Assets $ 248,685 $ 102,728 $ 163,946 $ 187,467
Liabilities:Accounts payable and accrued expenditures 6,916 78,457 77,994 7,379 Deposits held in custody for others 241,769 73,522 135,203 180,088
Total Liabilities $ 248,685 $ 151,979 $ 213,197 $ 187,467
(Continued on next page)
142

EXHIBIT D CITY OF WARWICK, RHODE ISLANDAGENCY FUNDS COMBINING STATEMENT OF CHANGES IN ASSETS AND LIABILITIES (CONTINUED) FOR THE YEAR ENDED JUNE 30, 2018
Balance BalanceJuly 1, 2017 Additions Deductions June 30, 2018
Realty Tax Fund
Assets:Cash and cash equivalents $ 252,343 $ 2,794,971 $ 2,829,230 $ 218,084
Liabilities:Due to federal and state government $ 131,647 $ 1,457,788 $ 1,492,127 $ 97,308 Accounts payable 120,696 1,337,183 1,337,103 120,776
Total Liabilities $ 252,343 $ 2,794,971 $ 2,829,230 $ 218,084
Student Activity
Assets:Cash and cash equivalents $ 443,854 $ 788,555 $ 752,718 $ 479,691
Liabilities:Deposits held in custody for others $ 443,854 $ 788,555 $ 752,718 $ 479,691
Total All Agency Funds
Assets:Cash $ 1,282,607 $ 3,870,759 $ 3,771,312 $ 1,382,054 Accounts receivable 35,643 406,620 386,250 56,013
Total Assets $ 1,318,250 $ 3,870,759 $ 3,771,312 $ 1,438,067
Liabilities:Accounts payable $ 134,108 $ 1,488,988 $ 1,468,012 $ 155,084 Due to federal and state government 131,647 1,457,788 1,492,127 97,308 Deposits held in custody for others 1,052,495 1,229,182 1,096,002 1,185,675
Total Liabilities $ 1,318,250 $ 4,175,958 $ 4,056,141 $ 1,438,067
143

Combining Schedules

EXHIBIT E-1CITY OF WARWICK, RHODE ISLANDCOMBINING BALANCE SHEET - FUNDS WHICH COMPRISE THE CITY’S GENERAL FUND JUNE 30, 2018
TotalGeneral Rescue General
Fund Service FundCity Fees Fund City
ASSETS
Cash and cash equivalents $ 18,758,828 $ 505,765 $ 19,264,593 Property taxes receivable 6,292,557 6,292,557 Due from federal and state governments 4,249,059 4,249,059 Other receivables 84,759 1,764,667 1,849,426 Due from other funds 26,092,360 (998,364) 25,093,996 Prepaid items 258,318 258,318 Other assets 4,611,943 4,611,943
Total Assets $ 60,347,824 $ 1,272,068 $ 61,619,892
LIABILITIES, DEFERRED INFLOWS OF RESOURCES AND FUND BALANCES
Liabilities: Accounts payable and accrued expenditures $ 2,927,070 $ 7,124 $ 2,934,194 Due to federal and state governments 172,795 172,795 Due to other funds 20,402,115 20,402,115 Other liabilities 4,785,091 4,785,091
Total liabilities 28,287,071 7,124 28,294,195
Deferred Inflows of Resources:Unavailable revenues - taxes 4,572,172 4,572,172 Unavailable revenues - other 1,264,944 1,264,944 Advance tax collections 51,905 51,905
Total deferred inflows of resources 4,624,077 1,264,944 5,889,021
Fund Balances: Nonspendable 258,318 258,318 Committed for education 157,447 157,447 Assigned 4,349,465 4,349,465 Unassigned 22,671,446 22,671,446
Total fund balances 27,436,676 - 27,436,676
Total Liabilities, Deferred Inflows of Resources and Fund Balances $ 60,347,824 $ 1,272,068 $ 61,619,892
144

CITY OF WARWICK, RHODE ISLAND COMBINING STATEMENT OF REVENUES, EXPENDITURES AND CHANGES IN FUND BALANCES FUNDS WHICH COMPRISE THE CITY’S GENERAL FUND FOR THE YEAR ENDED JUNE 30, 2018
EXHIBIT E-2
Rescue TotalGeneral Service General
Fund Fees FundCity Fund City
Revenues: General property taxes $ 227,930,585 $ $ 227,930,585 Interest on taxes 2,087,162 2,087,162 Intergovernmental revenues 8,504,592 8,504,592 Charges for services 5,354,822 3,535,109 8,889,931 Investment income 331,164 - 331,164 Other revenue 14,881,044 - 14,881,044
Total revenues 259,089,369 3,535,109 262,624,478 Expenditures:
Executive and administration 5,589,908 5,589,908 Public safety 45,079,155 786,674 45,865,829 Recreation 1,872,055 1,872,055 Public libraries 2,924,841 2,924,841 Social services 1,196,571 1,196,571 Planning and economic development 1,699,767 1,699,767 Public works 13,357,754 13,357,754 Employee benefits, fixed costs and capital 61,737,378 61,737,378
Total expenditures 133,457,429 786,674 134,244,103
Excess of Revenues over Expenditures 125,631,940 2,748,435 128,380,375
Other Financing Sources (Uses): Transfers in 3,312,861 (2,748,435) 564,426 Transfers out (130,528,744) (130,528,744)
Total other financing uses (127,215,883) (2,748,435) (129,964,318)
Net Change in Fund Balances (1,583,943) - (1,583,943)
Fund Balances at Beginning of Year 29,020,619 - 29,020,619
Fund Balances at End of Year $ 27,436,676 $ - $ 27,436,676
145

EXHIBIT F-1CITY OF WARWICK, RHODE ISLANDCOMBINING STATEMENT OF NET POSITION INTERNAL SERVICE FUNDS JUNE 30, 2018
HealthcareWorkers’ Management Healthcare
Compensation School ManagementFund Department City Total
Assets: Current assets:
Cash and cash equivalents $ 641,364 $ $ $ 641,364 Accounts receivable 30,000 1,252,686 1,282,686 Due from other funds 1,088,443 1,088,443 Deposit with agent 1,444,200 1,444,200
Total current assets 671,364 2,696,886 1,088,443 4,456,693
Liabilities: Current liabilities:
Claims payable 141,743 1,232,256 1,373,999
Net Position: Unrestricted 529,621 1,464,630 1,088,443 3,082,694
Total Net Position $ 529,621 $ 1,464,630 $ 1,088,443 $ 3,082,694
146

EXHIBIT F-2CITY OF WARWICK, RHODE ISLANDCOMBINING STATEMENT OF REVENUES, EXPENSES AND CHANGES IN NET POSITION - INTERNAL SERVICE FUNDS FOR THE YEAR ENDED JUNE 30, 2018
HealthcareWorkers’ Management Healthcare
Compensation School ManagementFund Department City Total
Operating Revenues: Proceeds from reinsurance $ $ 22,468,907 $ $ 22,468,907 Workers’ compensation 436,022 436,022 Healthcare insurance premiums 22,324,881 22,324,881 Total operating revenues 436,022 22,468,907 22,324,881 45,229,810
Operating Expenses: Claims - Healthcare 22,995,755 22,039,117 45,034,872 Workers’ compensation claims 413,764 413,764
Total operating expenses 413,764 22,995,755 22,039,117 45,448,636
Operating Income (Loss) 22,258 (526,848) 285,764 (218,826)
Nonoperating Revenue:Interest Income 1,298 1,298
Change in Net Position 23,556 (526,848) 285,764 (217,528)
Net Position at Beginning of Year 506,065 1,991,478 802,679 3,300,222
Net Position at End of Year $ 529,621 $ 1,464,630 $ 1,088,443 $ 3,082,694
147

EXHIBIT F-3CITY OF WARWICK, RHODE ISLAND COMBINING STATEMENT OF CASH FLOWS - INTERNAL SERVICE FUNDS FOR THE YEAR ENDED JUNE 30, 2018
HealthcareWorkers’ Management Healthcare
Compensation School ManagementFund Department City Total
Cash Flows from Operating Activities: Receipts from insurance charges $ $ 23,150,143 $ 22,507,940 $ 45,658,083 Receipts from other operating services 436,022 436,022 Payments for claims (436,022) (23,150,143) (22,039,117) (45,625,282)
Net cash provided by (used in) operating activities - - 468,823 468,823
Cash Flows from Noncapital Financing ActivitiesInterfund borrowings (468,823) (468,823)
Cash Flows from Investing Activities:Interest on investments 1,298 1,298
Net Increase (Decrease) in Cash and Cash Equivalents 1,298 - - 1,298
Cash and Cash Equivalents at Beginning of Year 640,066 - - 640,066
Cash and Cash Equivalents at End of Year $ 641,364 $ - $ - $ 641,364
Reconciliation of Operating Income (Loss) to Net Cash Provided by Operating Activities: Operating income (loss) $ 22,258 $ (526,848) $ 285,764 $ (218,826) Adjustments to reconcile operating income (loss) to net cash provided by operating activities:
Change in assets and liabilities: (Increase) decrease in accounts receivable 691,136 183,059 874,195 (Increase) decrease in deposits with agen (9,900) (9,900) Increase (decrease) in claims payable (22,258) (154,388) (176,646)
Total adjustments (22,258) 526,848 183,059 687,649
Net Cash Provided by (Used in) Operating Activities $ - $ - $ 468,823 $ 468,823
148

EXHIBIT G-1CITY OF WARWICK, RHODE ISLANDCOMBINING STATEMENT OF NET POSITION - PROPRIETARY FUNDS SEWERJUNE 30, 2018
Sewer Funds
SewerRevenue 1994 Sewer Sewer SRF
Fund Bond Fund Bond Fund Total
Assets: Current assets:
Cash and cash equivalents $ 14,072,672 $ $ $ 14,072,672 Restricted cash and cash equivalents 35,979 5,480,067 5,516,046 Accounts receivable, net:
Sewer use fees 5,250,767 5,250,767 Due from federal and state government 11,936,334 11,936,334
Due from other funds 7,676,618 642,128 8,318,746 Total current assets 27,000,057 35,979 18,058,529 45,094,565
Noncurrent assets: Construction in progress 2,962,797 2,962,797 Depreciable capital assets, net 33,018,452 8,485,569 130,799,592 172,303,613
Total noncurrent assets 33,018,452 8,485,569 133,762,389 175,266,410
Total assets 60,018,509 8,521,548 151,820,918 220,360,975
Deferred Outflows of Resources: Deferred charge on refunding 89,885 89,885 Deferred outflows - net pension liability amortizations 642,246 642,246
Total deferred outflows or resources 732,131 - - 732,131
Liabilities: Current Liabilities:
Accounts payable and accrued expenses 459,572 378 265,495 725,445 Accrued interest payable 761,444 761,444 Due to other funds 15,729,834 357,580 16,087,414 Current portion of long-term debt 1,285,743 9,839,149 11,124,892
Total current liabilities 18,236,593 378 10,462,224 28,699,195
Noncurrent Liabilities: Unearned revenue 107,565 107,565 Accrued compensated absences 195,772 195,772 Total other post-employment benefits liability 6,997,368 6,997,368 Net pension liability 2,813,544 2,813,544 Bonds and loans payable 7,556,363 69,563,619 77,119,982
Total noncurrent liabilities 17,563,047 - 69,671,184 87,234,231
Total liabilities 35,799,640 378 80,133,408 115,933,426
Deferred Inflows of Resources: Deferred inflows - related to OPEB 242,169 242,169 Deferred inflows - related to pensions 412,415 412,415
Total deferred inflows of resources 654,584 - - 654,584
Net Position: Net investment in capital assets 24,266,231 8,521,170 66,295,955 99,083,356 Restricted for debt service payments 35,979 5,480,067 5,516,046 Unrestricted 30,185 (35,979) (88,512) (94,306)
Total Net Position $ 24,296,416 $ 8,521,170 $ 71,687,510 $ 104,505,096
149

EXHIBIT G-2CITY OF WARWICK, RHODE ISLANDCOMBINING STATEMENT OF REVENUES, EXPENSES AND CHANGES IN NET POSITION - PROPRIETARY FUNDS SEWER FOR THE YEAR ENDED JUNE 30, 2018
Sewer Funds
SewerRevenue 1994 Sewer Sewer SRF
Fund Bond Fund Bond Fund Total
Operating Revenues: Assessments and user fees $ 15,710,104 $ $ $ 15,710,104 Other revenues 574,631 574,631 Total operating revenues 16,284,735 - - 16,284,735
Operating Expenses: Contract services 298,074 298,074 Salaries and benefits 3,801,182 3,801,182 Materials and supplies 884,977 884,977 Depreciation and amortization 1,773,448 345,631 4,052,013 6,171,092 Operations 2,783,226 25 2,783,251
Total operating expenses 9,540,907 345,631 4,052,038 13,938,576
Operating Income (Loss) 6,743,828 (345,631) (4,052,038) 2,346,159
Nonoperating Revenues (Expenses): Interest income 23,096 73 45,381 68,550 Interest expense (2,209,745) (2,209,745) Capital contributions 8,880 8,880 Loan issuance costs (2,500) (2,500)
Total nonoperating revenues (expenses) (2,186,649) 73 51,761 (2,134,815)
Income (Loss) Before Transfers 4,557,179 (345,558) (4,000,277) 211,344
Transfers:Transfers in 6,255,881 9,473,887 15,729,768 Transfers out (9,473,887) (9,473,887)
Total transfers (3,218,006) - 9,473,887 6,255,881
Change in Net Position 1,339,173 (345,558) 5,473,610 6,467,225
Net Position at Beginning of Year, as Restated 22,957,243 8,866,728 66,213,900 98,037,871
Net Position at End of Year $ 24,296,416 $ 8,521,170 $ 71,687,510 $ 104,505,096
150

EXHIBIT G-3CITY OF WARWICK, RHODE ISLANDCOMBINING STATEMENT OF CASH FLOWS - PROPRIETARY FUNDS SEWER FOR THE YEAR ENDED JUNE 30, 2018
Sewer Funds
Sewer SewerRevenue 1994 Sewer Sewer SRF
Fund Bond Fund Bond Fund Total
Cash Flows from Operating Activities: Receipts from customers and users $ 16,617,860 $ $ $ 16,617,860 Payments to suppliers (4,296,951) 1 (180,411) (4,477,361) Payments to employees (3,325,623) (3,325,623) Receipts from other operating services 574,631 574,631
Net cash provided by (used in) operating activities 9,569,917 1 (180,411) 9,389,507
Cash Flows from Noncapital Financing Activities: Interfund borrowings (43,994) (43,994) Transfers in from other funds 6,255,881 9,473,887 15,729,768 Transfers to other funds (9,473,887) (9,473,887)
Net cash provided by (used in) noncapital financing activities (3,218,006) - 9,429,893 6,211,887
Cash Flows from Capital and Related Financing Activities: Additions to property, plant and equipment (792,221) (1) (1,724,170) (2,516,392) Capital contributions 8,880 8,880 Principal paid on bonds, loans and leases (1,540,865) (9,473,885) (11,014,750) Loan issuance costs (2,500) (2,500) Interest paid on bonds, loans and leases (2,237,124) (2,237,124) Other nonoperating 1,938,883 1,938,883
Net cash provided by (used in) capital and related financing activities (4,570,210) (1) (9,252,792) (13,823,003)
Cash Flows from Investing Activities: Interest on investments 23,096 73 46,431 69,600
Net Increase (Decrease) in Cash and Cash Equivalents 1,804,797 73 43,121 1,847,991
Cash and Cash Equivalents at Beginning of Year 12,267,875 35,906 5,436,946 17,740,727
Cash and Cash Equivalents at End of Year $ 14,072,672 $ 35,979 $ 5,480,067 $ 19,588,718
Reconciliation of Operating Income (Loss) to Net Cash Provided by (Used in) Operating Activities: Operating income (loss) $ 6,743,828 $ (345,631) $ (4,052,038) $ 2,346,159 Adjustments to reconcile operating income (loss) to net cash provided by (used in) operating activities:
Depreciation and amortization 1,773,448 345,631 4,052,013 6,171,092 Change in assets and liabilities:
(Increase) decrease in accounts receivable 907,756 907,756 (Increase) decrease in due from other funds (2,760,977) (2,760,977) (Increase) decrease in deferred outflows - related to pensions 398,623 398,623 Increase (decrease) in accounts payable and accrued expenses (15,922) 1 (180,386) (196,307) Increase (decrease) in due to other funds 2,446,225 2,446,225 Increase (decrease) in accrued compensated absences 17,249 17,249 Increase (decrease) in net other post - employment benefits obligation (169,262) (169,262) Increase (decrease) in net pension liability (9,343) (9,343) Increase (decrease) in deferred inflows - related to pension and OPEB 238,292 238,292
Total adjustments 2,826,089 345,632 3,871,627 7,043,348
Net Cash Provided by (Used in) Operating Activities $ 9,569,917 $ 1 $ (180,411) $ 9,389,507
151

EXHIBIT H-1CITY OF WARWICK, RHODE ISLANDCOMBINING STATEMENT OF NET POSITION - PROPRIETARY FUNDS WATER JUNE 30, 2018
Water Funds
WaterRevenue 2000 Water 1994 Water
Fund Bond Fund Bond Fund Total
Assets: Current assets:
Cash and cash equivalents $ 10,322,118 $ $ $ 10,322,118 Accounts receivable, net:
Water use fees 3,275,269 3,275,269 Due from other funds 117,163 23,344 140,507 Inventory 99,229 99,229
Total current assets 13,813,779 23,344 - 13,837,123
Noncurrent assets: Depreciable capital assets, net 8,816,561 827,204 1,064,248 10,708,013
Total noncurrent assets 8,816,561 827,204 1,064,248 10,708,013
Total assets 22,630,340 850,548 1,064,248 24,545,136
Deferred Outflows of Resources:Deferred charge on refunding 2,915 2,915 Deferred outflows - related to pensions 642,246 642,246
Total deferred outflows or resources 642,246 2,915 - 645,161
Liabilities: Current liabilities:
Accounts payable and accrued expenses 1,134,173 1,134,173 Accrued interest payable 3,650 3,650 Due to other funds 7,372,139 7,372,139 Current portion of long-term debt 26,062 26,062
Total current liabilities 8,509,962 26,062 - 8,536,024
Noncurrent liabilities: Accrued compensated absences 205,597 205,597 Bonds and loans payable 48,343 48,343 Total other post-employment benefits liability 6,997,368 6,997,368 Net pension liability 2,813,544 2,813,544
Total noncurrent liabilities 10,016,509 48,343 - 10,064,852
Total liabilities 18,526,471 74,405 - 18,600,876
Deferred Inflows of Resources:Deferred inflows - related to OPEB 242,169 242,169 Deferred inflows - related to pensions 412,415 412,415
Total deferred inflows of resources 654,584 - - 654,584
Net Position: Net investment in capital assets 8,816,561 755,714 1,064,248 10,636,523 Unrestricted (4,725,030) 23,344 (4,701,686)
Total Net Position $ 4,091,531 $ 779,058 $ 1,064,248 $ 5,934,837
152

EXHIBIT H-2CITY OF WARWICK, RHODE ISLANDCOMBINING STATEMENT OF REVENUES, EXPENSES AND CHANGES IN NET POSITION - PROPRIETARY FUNDS WATER FOR THE YEAR ENDED JUNE 30, 2018
Water Funds
WaterRevenue 2000 Water 1994 Water
Fund Bond Fund Bond Fund Total
Operating Revenues: Assessments and user fees $ 10,701,227 $ $ $ 10,701,227 Other revenues 387,877 1,925 80 389,882 Total operating revenues 11,089,104 1,925 80 11,091,109
Operating Expenses: Contract services 254,968 254,968 Salaries and benefits 3,062,596 3,062,596 Materials and supplies 13,732 13,732 Depreciation and amortization 587,372 68,698 19,888 675,958 Operations 5,850,918 5,850,918
Total operating expenses 9,769,586 68,698 19,888 9,858,172
Operating Income (Loss) 1,319,518 (66,773) (19,808) 1,232,937
Nonoperating Revenues (Expenses): Interest income 15,735 15,735 Interest expense (7,014) (833) (88) (7,935)
Total nonoperating revenues (expenses) 8,721 (833) (88) 7,800
Income (Loss) Before Transfers 1,328,239 (67,606) (19,896) 1,240,737
Transfers:Transfers In 35,938 35,938 Transfers Out (35,938) (35,938)
Total transfers (35,938) 35,938 - -
Change in Net Position 1,292,301 (31,668) (19,896) 1,240,737
Net Position at Beginning of Year, as Restated 2,799,230 810,726 1,084,144 4,694,100
Net Position at End of Year $ 4,091,531 $ 779,058 $ 1,064,248 $ 5,934,837
153

EXHIBIT H-3CITY OF WARWICK, RHODE ISLANDCOMBINING STATEMENT OF CASH FLOWS - PROPRIETARY FUNDS WATER FOR THE YEAR ENDED JUNE 30, 2018
Water Funds
WaterRevenue 2000 Water 1994 Water
Fund Bond Fund Bond Fund Total
Cash Flows from Operating Activities: Receipts from customers and users $ 11,163,542 $ $ 11,163,542Payments to suppliers (5,987,135) (5,987,135) Payments to employees (3,280,379) (3,280,379) Receipts from other operating services 387,877 1,925 80 389,882
Net cash provided by (used in) operating activities 2,283,905 1,925 80 2,285,910
Cash Flows from Noncapital Financing Activities: Interfund borrowings (11,672) (11,672) Transfers in from other funds 35,938 35,938 Transfers to other funds (35,938) (35,938)
Net cash provided by (used in) noncapital financing activities (35,938) 24,266 - (11,672)
Cash Flows from Capital and Related Financing Activities: Additions to property, plant and equipment (88,459) (88,459) Principal paid on bonds, loans and leases (26,191) (80) (26,271) Interest paid on bonds, loans and leases (7,014) (7,014)
Net cash provided by (used in) capital and related financing activities (95,473) (26,191) (80) (121,744)
Cash Flows from Investing Activities: Interest on investments 15,735 15,735
Net Increase (Decrease) in Cash and Cash Equivalents 2,168,229 - - 2,168,229
Cash and Cash Equivalents at Beginning of Year 8,153,889 - - 8,153,889
Cash and Cash Equivalents at End of Year $ 10,322,118 $ - - $ 10,322,118
Reconciliation of Operating Income (Loss) to Net Cash Provided by (Used in) Operating Activities: Operating income (loss) $ 1,319,518 $ (66,773) (19,808) $ 1,232,937 Adjustments to reconcile operating income (loss) to net cash provided by (used in) operating activities:
Depreciation and amortization 587,372 68,698 19,888 675,958 Change in assets and liabilities:
(Increase) decrease in accounts receivable 462,315 462,315 (Increase) decrease in due from other funds 63,659 63,659 (Increase) decrease in inventory (12,798) (12,798) (Increase) decrease in deferred outflows - related to pensions 460,042 460,042 Increase (decrease) in accounts payable and accrued expenses 154,880 154,880 Increase (decrease) in due to other funds (73,258) (73,258) Increase (decrease) in accrued compensated absences (24,900) (24,900) Increase (decrease) in net OPEB liability (169,262) (169,262) Increase (decrease) in net pension liability (697,391) (697,391) Increase (decrease) in deferred inflows - related to pension and OPEB 213,728 213,728
Total adjustments 964,387 68,698 19,888 1,052,973
Net Cash Provided by (Used in) Operating Activities $ 2,283,905 $ 1,925 80 $ 2,285,910
154

Other Schedules

EXHIBIT I-1CITY OF WARWICK, RHODE ISLANDSCHEDULE OF TAX COLLECTIONSFOR THE YEAR ENDED JUNE 30, 2018
Amount Current Balance Current Year Additions & Amounts to be Year Balance
Assessment of July 1, 2017 Assessment Adjustments Abatements Written Off Collected Collections June 30, 2018
2017 $ $ 230,002,820 $ 235,206 $ 859,444 $ $ 229,378,582 $ 223,414,873 $ 5,963,709 2016 4,586,240 27 45,381 4,540,886 2,905,041 1,635,845 2015 2,029,267 13,555 2,015,712 698,229 1,317,483 2014 1,068,783 43,783 1,025,000 216,980 808,020 2013 698,168 13,356 684,812 103,267 581,545 2012 903,965 576 903,389 93,514 809,875 2011 841,175 32 841,143 43,036 798,107 2010 398,967 398,967 14,553 384,414 2009 184,982 (1,193) 186,175 (35,111) 221,286 2008 220,689 220,689 (48,396) 269,085 2007 376,366 376,366 2,264 374,102 2006 321,737 321,737 (4,681) 326,418 2005 307,318 307,318 (2,827) 310,145 2004 301,495 301,495 450 301,045 2003 244,432 244,432 1,116 243,316 2002 243,452 243,452 710 242,742 2001 276,151 276,151 368 275,783 2000 332,669 134 332,535 91 332,444 1999 1,388,737 1,388,737 1,388,737 1998 1,395,178 1,395,178 1,395,178 1997 395,948 395,948 395,948 1996 433,608 433,608 433,608
$ 16,949,327 $ 230,002,820 $ 235,233 $ 975,068 $ - $ 246,212,312 $ 227,403,477 18,808,835
Allowance for doubtful accounts (12,516,278)
Net property tax receivable $ 6,292,557
Schedule of Most Recent Net Assessed Property Value by Category
Description of Property Valuation LevyReal property $ 8,315,177,024 $ 186,806,921 Current year collections $ 227,403,477 Motor vehicles 812,081,178 22,152,407 Adjustment/refunds in transit (22,351) Tangible personal property 519,849,116 21,043,492 Revenue received 60 days subsequent Total 9,647,107,318 230,002,820 to fiscal year ended June 30, 2018 1,720,385 Exemptions 365,182,189 229,101,511 Net Assessed Value $ 9,281,925,129 $ 230,002,820
Prior year revenue received 60 days subsequent to fiscal year ended June 30, 2017 (1,170,926)
Current year property tax revenue $ 227,930,585
155

EXHIBIT I-2CITY OF WARWICK, RHODE ISLANDANALYSIS OF PRIOR YEAR TAX COLLECTIONSFOR THE YEAR ENDED JUNE 30, 2018
Less AdjustmentsLess Prior Refunds and Plus Current
Collections Year 60 Redemptions Year 60 BalanceTax Years (Refunds Netted) Day Collections in Transit Day Collections June 30, 2018
2017 $ 223,414,873 $ $ (2,661) $ 1,522,856 $ 224,935,068 2016 2,905,041 (1,011,699) (18,242) 113,715 1,988,815 2015 698,229 (77,988) (180) 52,952 673,013 2014 216,980 (37,756) 16,492 195,716 2013 103,267 (18,432) 8,258 93,093 2012 93,514 (14,705) (1,251) 2,792 80,350 2011 43,036 (13,513) 2,469 31,992 2010 14,553 (1,252) (2,121) 11,180 2009 (35,111) (742) 999 (34,854) 2008 (48,396) (1,243) 16 (49,623) $ 2,995,517 2007 2,264 (583) 97 1,778 Prior Year Collections2006 (4,681) 4,772 279 370 2005 (2,827) 2,490 (17) 887 533 2004 450 (42) 568 976 2003 1,116 (85) 1,031 2002 710 (26) 684 2001 368 (50) 39 357 2000 91 (72) 87 106
$ 227,403,477 $ (1,170,926) $ (22,351) $ 1,720,385 $ 227,930,585
156

Annual Supplemental Transparency Report

City of Warwick
Annual Supplemental Transparency Report (MTP2)
Fiscal Year Ended June 30, 2018
Education
REVENUE Municipal Department
Current Year Levy Tax Collection 223,414,873$ -$
Last Year's Levy Tax Collection 2,905,041 -
Prior Years Property Tax Collection 1,610,671 -
Interest & Penalty 2,087,162 -
PILOT & Tax Treaty (excluded from levy) Collection - -
Other Local Property Taxes - -
Licenses and Permits 1,292,886 -
Fines and Forfeitures 149,196 -
Investment Income 333,869 -
Departmental 4,179,111 -
Rescue Run Revenue 2,748,435 -
Police & Fire Detail 637,134 -
Other Local Non-Property Tax Revenues - -
Tuition - 1,195,166
Impact Aid - -
Medicaid - 1,574,189
Federal Stabilization Funds - -
Federal Food Service Reimbursement - 1,549,678
CDBG 269,461 -
COPS Grants 216,145 -
SAFER Grants - -
Other Federal Aid Funds 276,352 5,414,396
MV Excise Tax Reimbursement & Phase-out 3,093,847 -
State PILOT Program 1,687,863 -
Distressed Community Relief Fund - -
Library Resource Aid 722,188 -
Library Construction Aid 126,341 -
Public Service Corporation Tax 1,033,439 -
Meals & Beverage Tax / Hotel Tax 5,222,697 -
LEA Aid - 39,146,992
Group Home - -
Housing Aid Capital Projects - -
Housing Aid Bonded Debt 885,176 689,286
State Food Service Revenue - 35,843
Incentive Aid - -
Property Revaluation Reimbursement - -
Other State Revenue 362,172 162,285
Other Revenue 9,370,421 1,673,689
Local Appropriation for Education - 122,482,464
Regional Appropriation for Education - -
Supplemental Appropriation for Education - -
Regional Supplemental Appropriation for Education - -
Other Education Appropriation - -
Rounding - -
Total Revenue 262,624,479$ 173,923,989$
Financing Sources: Transfer from Capital Funds -$ -$
Financing Sources: Transfer from Other Funds 2,253,287 1,218,671
Financing Sources: Debt Proceeds - -
Financing Sources: Other - -
Rounding - -
Total Other Financing Sources 2,253,287$ 1,218,671$
Exhibit J-1
157

City of Warwick
Annual Supplemental Transparency Report (MTP2)
Fiscal Year Ended June 30, 2018
General Social Centralized Public Parks and Police
EXPENDITURES Government Finance Services IT Planning Libraries Works Rec Department
Compensation- Group A 1,262,765$ 2,111,487$ 784,144$ 338,670$ 1,673,851$ 1,958,864$ 6,701,541$ 924,491$ 14,646,819$
Compensation - Group B - - - - - - - - 1,512,556
Compensation - Group C - - - - - - - - -
Compensation -Volunteer - - - - - - - - -
Overtime- Group A 17,657 15,051 77 317 4,011 16,198 507,369 38,857 1,439,846
Overtime - Group B - - - - - - - - 1,314,117
Overtime - Group C - - - - - - - - -
Police & Fire Detail - - - - - - - - -
Active Medical Insurance - Group A 524,790 685,142 247,817 102,042 459,191 422,747 1,720,145 524,790 3,161,088
Active Medical Insurance- Group B - - - - - - - - 1,078,735
Active Medical Insurance- Group C - - - - - - - - -
Active Dental insurance- Group A 34,320 44,807 16,207 6,673 30,030 27,647 112,493 34,320 176,227
Active Dental Insurance- Group B - - - - - - - - 70,546
Active Dental Insurance- Group C - - - - - - - - -
Payroll Taxes 179,198 233,953 84,621 34,844 156,798 144,354 587,372 179,198 1,239,537
Life Insurance 1,779 2,323 840 346 1,557 1,433 5,833 1,779 9,082
State Defined Contribution- Group A - - - - - - - - -
State Defined Contribution - Group B - - - - - - - - -
State Defined Contribution - Group C - - - - - - - - -
Other Benefits- Group A - - - - - - - - -
Other Benefits- Group B - - - - - - - - -
Other Benefits- Group C - - - - - - - - -
Local Defined Benefit Pension- Group A 540,589 705,769 255,278 105,114 473,015 435,474 1,771,929 540,589 6,740,699
Local Defined Benefit Pension - Group B - - - - - - - - 1,111,210
Local Defined Benefit Pension - Group C - - - - - - - - -
State Defined Benefit Pension- Group A - - - - - - - - -
State Defined Benefit Pension - Group B - - - - - - - - -
State Defined Benefit Pension - Group C - - - - - - - - -
Other Defined Benefit / Contribution - - - - - - - - -
Purchased Services 390,066 428,231 364,084 125,250 755,357 329,802 418,484 117,326 203,173
Materials/Supplies 57,083 58,374 17,191 88,464 28,047 404,076 215,797 58,502 290,633
Software Licenses - - - 393,858 - - - - -
Capital Outlays - - - - - - - - -
Insurance 2,028,610 - - - - - - - -
Maintenance - - - - - 86,436 1,678,741 95,361 45,733
Vehicle Operations - 562 23,938 1,455 5,666 - 839,698 3,276 393,282
Utilities - - 65,344 366,839 4,459 191,584 369,640 688,870 211,843
Contingency - - - - - - - - -
Street Lighting - - - - - - 1,430,623 - -
Revaluation - - - - - - - - -
Snow Removal-Raw Material & External Contracts - - - - - - 191,706 - -
Trash Removal & Recycling - - - - - - - - -
Claims & Settlements 427,128 - - - - - - - -
Community Support - - - - - - - - -
Other Operation Expenditures 80,000 136,914 - 31,530 24,255 3,260 1,140,214 - 67,136
Local Appropriation for Education - - - - - - - - -
Regional Appropriation for Education - - - - - - - - -
Supplemental Appropriation for Education - - - - - - - - -
Regional Supplemental Appropriation for Education - - - - - - - - -
Other Education Appropriation - - - - - - - - -
Municipal Debt- Principal - - - - - - - - -
Municipal Debt- Interest - - - - - - - - -
School Debt- Principal - - - - - - - - -
School Debt- Interest - - - - - - - - -
Retiree Medical Insurance- Total - - - - - - - - -
Retiree Dental Insurance- Total - - - - - - - - -
OPEB Contribution- Total - - - - - - - - -
Non-Qualified OPEB Trust Contribution - - - - - - - - -
Rounding - - - - - - - - -
Total Expenditures 5,543,985$ 4,422,613$ 1,859,543$ 1,595,403$ 3,616,237$ 4,021,876$ 17,691,586$ 3,207,360$ 33,712,261$
Exhibit J-1
158

City of Warwick
Annual Supplemental Transparency Report (MTP2)
Fiscal Year Ended June 30, 2018
EXPENDITURES
Compensation- Group A
Compensation - Group B
Compensation - Group C
Compensation -Volunteer
Overtime- Group A
Overtime - Group B
Overtime - Group C
Police & Fire Detail
Active Medical Insurance - Group A
Active Medical Insurance- Group B
Active Medical Insurance- Group C
Active Dental insurance- Group A
Active Dental Insurance- Group B
Active Dental Insurance- Group C
Payroll Taxes
Life Insurance
State Defined Contribution- Group A
State Defined Contribution - Group B
State Defined Contribution - Group C
Other Benefits- Group A
Other Benefits- Group B
Other Benefits- Group C
Local Defined Benefit Pension- Group A
Local Defined Benefit Pension - Group B
Local Defined Benefit Pension - Group C
State Defined Benefit Pension- Group A
State Defined Benefit Pension - Group B
State Defined Benefit Pension - Group C
Other Defined Benefit / Contribution
Purchased Services
Materials/Supplies
Software Licenses
Capital Outlays
Insurance
Maintenance
Vehicle Operations
Utilities
Contingency
Street Lighting
Revaluation
Snow Removal-Raw Material & External Contracts
Trash Removal & Recycling
Claims & Settlements
Community Support
Other Operation Expenditures
Local Appropriation for Education
Regional Appropriation for Education
Supplemental Appropriation for Education
Regional Supplemental Appropriation for Education
Other Education Appropriation
Municipal Debt- Principal
Municipal Debt- Interest
School Debt- Principal
School Debt- Interest
Retiree Medical Insurance- Total
Retiree Dental Insurance- Total
OPEB Contribution- Total
Non-Qualified OPEB Trust Contribution
Rounding
Total Expenditures
Fire Centralized Public Safety Education Total Education
Department Dispatch Other Appropriation Debt OPEB Municipal Department
19,842,953$ -$ 177,532$ -$ -$ -$ 50,423,117$ 75,614,622$
614,502 - - - - - 2,127,058 7,322,546
- - - - - - - 18,184,940
- - - - - - - -
1,760,520 - 2,651 - - - 3,802,555 -
228,384 - - - - - 1,542,501 -
- - - - - - - 534,004
- - - - - - - -
4,013,093 - 72,887 - - - 11,933,735 11,707,909
174,930 - - - - - 1,253,665 933,662
- - - - - - - 4,224,460
211,063 - 4,767 - - - 698,553 570,417
11,440 - - - - - 81,986 46,125
- - - - - - - 230,532
1,020,434 - 24,889 - - - 3,885,200 7,530,167
15,047 - 247 - - - 40,267 -
- - - - - - - 447,012
- - - - - - - 33,282
- - - - - - - -
- - - - - - - 1,150,376
- - - - - - - -
- - - - - - - 23,664
18,934,921 - 75,082 - - - 30,578,459 87
180,196 - - - - - 1,291,406 82,395
- - - - - - - 1,694,868
- - - - - - - 9,971,216
- - - - - - - 878,307
- - - - - - - -
- - - - - - - -
931,690 - 81,828 - - - 4,145,292 21,814,900
245,919 - 15,783 - - - 1,479,870 1,662,025
- - - - - - 393,858 868,822
- - 43,166 - - - 43,166 3,903,631
- - - - - - 2,028,610 493,305
35,180 - - - - - 1,941,451 319,932
354,825 - - - - - 1,622,703 524,124
311,291 - 20,352 - - - 2,230,222 2,964,875
- - - - - - - -
- - - - - - 1,430,623 -
- - - - - - - -
- - - - - - 191,706 -
- - - - - - - -
- - - - - - 427,128 6,170
- - - - - - - -
352,627 - - - - - 1,835,935 247,927
- - - 122,482,464 - - 122,482,464 -
- - - - - - - -
- - - - - - - -
- - - - - - - -
- - - - - - - -
- - - - 3,770,340 - 3,770,340 -
- - - - 481,593 - 481,593 -
- - - - 2,878,331 - 2,878,331 -
- - - - 878,705 - 878,705 -
- - - - - 8,665,430 8,665,430 526,690
- - - - - 149,610 149,610 4,725
- - - - - - - -
- - - - - - - -
- - - - - - - -
49,239,018$ -$ 519,182$ 122,482,464$ 8,008,969$ 8,815,040$ 264,735,537$ 174,517,716$
Financing Uses: Transfer to Capital Funds -$ -$
Financing Uses: Transfer to Other Funds 1,218,671 1,688,861
Financing Uses: Payment to Bond Escrow Agent - -
Financing Uses: Other - -
Total Other Financing Uses 1,218,671$ 1,688,861$
Net Change in Fund Balance1(1,076,442) (1,063,917)
Fund Balance1- beginning of year $32,065,619 $2,306,306
Funds removed from Reportable Government Services (RGS) - -
Funds added to Reportable Government Services (RGS) - -
Prior period adjustments - -
Misc. Adjustment - -
Fund Balance1 - beginning of year adjusted 32,065,619 2,306,306
Rounding
Fund Balance1 - end of year 30,989,177$ 1,242,389$
1 and Net Position if Enterprise Fund activity is included in the transparency portal report.
Exhibit J-1
159

City of Warwick
Combining Schedule of
Reportable Government Services with
Reconciliation to MTP2
Municipal
Fiscal Year Ended June 30, 2018
Total Other Total Other Net Change Beginning Fund Restated Beginning EndingPer Audited Fund Financial Statements Total Financing Total Financing in Fund Fund Balance1
Prior Period Fund Balance1 Fund Balance1
Fund Description Revenue Sources Expenditures Uses Balance1 (Deficit) Adjustment (Deficit) (Deficit)
General Fund 262,624,478$ 564,426$ 134,244,103$ 130,528,744$ (1,583,943)$ 29,020,619$ -$ 29,020,619$ 27,436,676$
Debt Service Fund - 8,516,470 8,008,970 - 507,500 3,045,000 - 3,045,000 3,552,500
Totals per audited financial statements 262,624,478$ 9,080,896$ 142,253,073$ 130,528,744$ (1,076,443)$ 32,065,619$ -$ 32,065,619$ 30,989,176$
Reconciliation from financial statements to MTP2
Reclassify portion transfer of municipal appropriation to Education Department as expenditure on MTP2 -$ -$ 122,012,274$ (122,012,274)$ -$ -$ -$ -$ -$
Elimination of transfer between debt service and general fund - (8,516,470) - (8,516,470) - - - - -
Portion of Municipal Appropriation for Education reported net on financial statements but expense on
MTP2 - - 470,190 - (470,190) - - - (470,190)
Remaining committed for education transferred by school back to city and reflected as committed for
education as a fund balance for the city but for school purposes to end FY18 - 157,447 - - 157,447 - - - 157,447
Debt service Transfer to city reported as net in audit and reflected as a source for MTP2 - 1,531,414 - - 1,531,414 - - - 1,531,414
Re-appropriated fund balance transferred from city to school and reported net on audit and as use on
MTP2 - - - 1,218,671 (1,218,671) - - - (1,218,671)
Rounding 1 - - - 1 - - - 1
Totals Per MTP2 262,624,479$ 2,253,287$ 264,735,537$ 1,218,671$ (1,076,442)$ 32,065,619$ -$ 32,065,619$ 30,989,177$
1 and Net Position if Enterprise Fund activity is included in the transparency portal report.
Exhibit J-2
160

City of Warwick
Combining Schedule of
Reportable Government Services with
Reconciliation to MTP2
Education Department
Fiscal Year Ended June 30, 2018
Total Other Total Other Net Change Beginning Fund Restated Beginning Ending
Per Audited Fund Financial Statements Total Financing Total Financing in Fund Fund Balance1
Prior Period Fund Balance1
Fund Balance1
Fund Description Revenue Sources Expenditures Uses Balance1
(Deficit) Adjustment (Deficit) (Deficit)
School Unrestricted Fund 50,333,157$ 122,012,274$ 171,860,912$ 484,519$ -$ -$ -$ -$ -$
School Special Revenue Funds 8,518,125 484,519 10,260,489 - (1,257,845) 2,306,306 - 2,306,306 1,048,461
Totals per audited financial statements 58,851,282$ 122,496,793$ 182,121,401$ 484,519$ (1,257,845)$ 2,306,306$ -$ 2,306,306$ 1,048,461$
Reconciliation from financial statements to MTP2
Remaining committed for education transferred back to City and reflected as committed for education
as a fund balance for the city but for school purposes to end FY18 -$ -$ -$ 157,447$ (157,447)$ -$ -$ -$ (157,447)$
Municipal Appropriation for Education reported as a transfer on financial statements but revenue on
MTP2 122,012,274 (122,012,274) - - - - - - -
Portion of Municipal Appropriation for Education reported net on financial statements but revenue on
MTP2 470,190 - - - 470,190 - - - 470,190
State contributions on behalf of pension are reported as revenues and expenditures on financial
statements only (7,409,776) - (7,409,776) - - - - - -
Debt service transfer to city reported as net in audit and reflected as a source for MTP2 - - - 1,531,414 (1,531,414) - - - (1,531,414)
Re-appropriated fund balance transferred from city to school and reported net on Audit and as source
on MTP2 - 1,218,671 - - 1,218,671 - - - 1,218,671
Transfer (of 484k from School Unrestricted to the Lunch Fund) is reported as an Other Financing
Sources and Use for GAAP while it is not reported in UCOA. - (484,519) - (484,519) - - - - -
For financial statements, indirect cost charges and recovery are reported in federal grant funds and
also actual expenditures & reimbursement reported in School Unrestricted Fund. Reported as
unrestricted revenue but not expense in restricted funds. - - (194,503) - 194,503 - - - 194,503
Rounding 19 - 594 - (575) - - - (575)
Totals Per MTP2 173,923,989$ 1,218,671$ 174,517,716$ 1,688,861$ (1,063,917)$ 2,306,306$ -$ 2,306,306$ 1,242,389$
Reconciliation from MTP2 to UCOA
Committed for Education fund balance available from FY 17 reflected as Revenue for UCOA 1,218,671$ (1,218,671)$ -$ -$
Debt Service transfer reflected as expense for UCOA and use for MTP2 - - 1,531,411 (1,531,411)
Remaining fund balance transferred back to city and reported net in UCOA (157,447) - - (157,447)
Rounding 3,708 - 400 (3)
Totals per UCOA Validated Totals Report 174,988,921$ -$ 176,049,527$ -$
1 and Net Position if Enterprise Fund activity is included in the transparency portal report.
Exhibit J-3
161

CITY OF WARWICK, RHODE ISLAND NOTES TO SUPPLEMENTARY INFORMATION ANNUAL SUPPLEMENTAL TRANSPARENCY REPORT (MTP2) JUNE 30, 2018
162
1. BASIS OF PRESENTATION
The Annual Supplemental Transparency Report (MTP2) is a supplemental schedule required by the State of Rhode Island General Laws 45-12-22.2 and 44-35-10. This supplementary schedule included within the audit report is part of a broader project to create a municipal transparency portal (MTP) website to host municipal financial information in a centralized location.
The format of the Annual Supplemental Transparency Report (MTP2) was prescribed by the State Department of Revenue (Division of Municipal Finance), Office of the Auditor General, and the Department of Education.
2. REPORTABLE GOVERNMENT SERVICES
Data consistency and comparability are among the key objectives of the State‘s Municipal Transparency portal. Consistent with that goal, the State has defined “reportable government services”, RGS, to include those operational revenues, expenditures, and transfers related to activities which are essential to the achievement of municipal operations. The determination of RGS may be different from the activities included within the legally adopted budget of the municipality. In practice, some communities report certain RGS in separate funds (e.g., special revenue funds, enterprise funds) rather than the municipality’s general fund. The Annual Supplemental Transparency Report (MTP2) includes a reconciliation to the fund level statements.
3. ALLOCATIONS
The State reporting requires expenditures to be reported by departments, as defined by the State. Some of the departmental groupings are not consistent with the departments reflected in the City’s budget and accounting system. To report these costs, the City made allocations of costs to the State’s departmental groupings based on a reasonable basis.
4. EMPLOYEE GROUPS - COMPENSATION AND BENEFIT COSTS
Compensation includes salaries, longevity, stipends, clothing allowance/maintenance, shift differential, out-of-rank, holiday pay and bonuses.
For Public Safety departments (i.e., police, fire, and centralized dispatch) and the Education Department, compensation and most benefits costs are reported in the following employee groupings:
Group A: This group consists of employees who serve the primary function of the department. Police Department - police officers (e.g., uniform personnel - including, leadership
positions) Fire Department - fire fighters (e.g., uniform personnel - including, leadership
positions) Centralized Dispatch Department - civilian dispatchers only Education Department - professional staff providing direct services to students For the remaining departments - all employees’ compensation and benefits are
reported under Group A

163
Group B: For Police and Fire Departments, compensation and benefits paid to its administrative employees and civilian dispatch employees are reported under Group B. The Education Department reports compensation and benefits paid to executive/mid-level educational administration employees under Group B.
Group C: This group is only used for the Education Department and it includes administrative and support staff.
Other post-employment benefits (OPEB) are not reported by employee groups on the MTP2. They are reported in total as either (1) contributions to a qualified OPEB trust or (2) the amount paid for medical and dental insurance for retirees when an OPEB trust fund has not been established. The detail employee group information for the Education Department can be found on the State’s Municipal Transparency portal website.
5. EDUCATION REVENUE AND EXPENDITURES
The revenues and expenditures presented on the MTP2 under the Education Department is consistent with existing Uniform Chart of Accounts (UCOA) guidelines. Each MTP account code has been mapped to the corresponding UCOA code or group of UCOA codes to facilitate the preparation of the MTP reporting.
Additional guidance and definitions regarding the State’s Municipal Transparency Portal can be found on the State Division of Municipal Finance website: http://www.municipalfinance.ri.gov/.

Statistical Section
Statistical Section Information
The objectives of statistical section information are to provide financial statement users with additional historical perspective, context and detail to assist in using the information in the financial statements, notes to financial statements and required supplementary information to understand and assess economic condition.
Statistical section information is presented in the following categories:
Financial trends information is intended to assist users in understanding and assessing how financial position has changed over time.
Revenue capacity information is intended to assist users in understanding and assessing the factors affecting the ability to generate own-source revenues (property taxes, charges for services, etc.).
Debt capacity information is intended to assist users in understanding and assessing debt burden and the ability to issue additional debt.
Demographic and economic information is intended 1) to assist users in understanding the socioeconomic environment and 2) to provide information that facilitates comparisons of financial statement information over time and among governments.
Operating information is intended to provide contextual information about operations and resources to assist readers in using financial statement information to understand and assess economic condition.
The accompanying tables are presented in the above order. Refer to the Table of Contents for applicable page number locations.
Sources: Unless otherwise noted, the information in the tables is derived from the comprehensive annual financial reports for the relevant year.

TABLE 1CITY OF WARWICK, RHODE ISLAND NET POSITION BY COMPONENT LAST TEN FISCAL YEARS (Accrual Basis of Accounting)
FISCAL YEAR
2009 2010 2011 2012 2013 2014 2015 2016 2017 2018
Governmental activities: Net investment in capital assets $ 64,184,519 $ 64,258,323 $ 62,802,492 $ 61,079,076 $ 61,133,149 $ 65,104,705 $ 69,871,522 $ 71,704,906 $ 72,636,198 $ 75,011,932 Restricted 1,947,766 1,433,298 1,331,626 2,159,153 2,736,581 3,382,875 4,120,308 6,278,740 6,998,200 3,552,500 Unrestricted (45,907,021) (62,378,508) (82,266,981) (96,854,156) (110,905,795) (133,284,704) (475,399,557) (523,284,812) (787,207,800) (808,951,853)Total governmental activities net position 20,225,264 3,313,113 (18,132,863) (33,615,927) (47,036,065) (64,797,124) (401,407,727) (445,301,166) (707,573,402) (730,387,421)
Business-type activities: Net investment in capital assets 63,148,905 67,391,392 72,213,574 79,287,133 81,963,905 85,294,240 90,353,683 95,748,013 104,730,106 109,768,380 Restricted 3,010,672 3,094,095 3,094,452 3,194,281 3,194,302 3,672,082 3,910,099 5,204,470 5,473,902 5,516,046 Unrestricted 4,542,008 5,450,484 4,268,908 4,415,400 8,790,829 10,773,438 880,173 10,450,451 3,877,759 5,803,608 Total business-type activities net position 70,701,585 75,935,971 79,576,934 86,896,814 93,949,036 99,739,760 95,143,955 111,402,934 114,081,767 121,088,034
Total: Net investment in capital assets 127,333,424 131,649,715 135,016,066 140,366,209 143,097,054 150,398,945 160,225,205 167,452,919 177,366,304 184,780,312 Restricted 4,958,438 4,527,393 4,426,078 5,353,434 5,930,883 7,054,957 8,030,407 11,483,210 12,472,102 9,068,546 Unrestricted (41,365,013) (56,928,024) (77,998,073) (92,438,756) (102,114,966) (122,511,266) (474,519,384) (512,834,361) (783,330,041) (803,148,245)
Total Net Position $ 90,926,849 $ 79,249,084 $ 61,444,071 $ 53,280,887 $ 46,912,971 $ 34,942,636 $ (306,263,772) $ (333,898,232) $ (593,491,635) $ (609,299,387)
Source: City of Warwick Comprehensive Annual Financial Report
164

TABLE 2CITY OF WARWICK, RHODE ISLAND CHANGES IN NET POSITION LAST TEN FISCAL YEARS (Accrual Basis of Accounting)
FISCAL YEAR
2009 2010 2011 2012 2013 2014 2015 2016 2017 2018Expenses:
Governmental activities: Executive and administration $ 8,069,697 $ 9,031,312 $ 8,068,528 $ 7,189,863 $ 8,163,964 $ 7,898,442 $ 8,389,533 $ 10,576,119 $ 9,171,861 $ 9,940,222 Public safety 89,041,058 89,614,158 94,727,477 96,094,909 99,913,493 104,020,192 101,268,696 131,390,376 116,575,178 115,089,539 Recreation 3,330,999 3,353,999 3,593,994 3,627,775 3,185,691 2,549,088 3,044,788 3,188,917 3,402,704 3,041,448 Public libraries 4,420,849 4,333,950 4,906,998 4,958,759 4,843,416 5,116,596 4,829,752 5,692,619 5,872,625 5,948,080 Social services 2,875,875 2,658,015 2,290,428 2,254,293 2,103,904 2,160,896 2,021,311 2,399,689 2,189,915 2,406,427 Planning and E/D 3,405,639 3,856,439 2,790,778 2,777,531 3,139,802 3,114,804 2,880,454 2,843,733 3,152,144 3,746,698 Public works 21,994,345 21,609,069 20,766,889 22,147,778 21,788,643 21,842,422 21,946,560 21,396,595 22,454,206 21,010,874 Education 174,286,188 171,897,294 175,633,555 170,207,856 170,690,028 173,500,902 173,887,234 185,531,670 183,235,365 179,337,008 Cafeteria operations 3,005,016 2,647,559 Interest on long-term debt 2,360,516 2,347,813 1,906,529 2,296,097 1,800,222 1,586,055 1,706,620 1,439,426 1,305,527 1,393,616
Total governmental activities expenses 312,790,182 311,349,608 314,685,176 311,554,861 315,629,163 321,789,397 319,974,948 364,459,144 347,359,525 341,913,912
Business-type activities: Sewer 15,215,618 15,759,558 24,390,931 14,704,964 14,824,243 14,807,198 15,082,034 14,654,521 15,723,730 16,179,771
Water 9,646,628 9,427,381 10,522,632 10,118,651 10,153,770 10,096,249 10,905,708 11,353,471 10,273,789 9,866,107 Total business-type activities expenses 24,862,246 25,186,939 34,913,563 24,823,615 24,978,013 24,903,447 25,987,742 26,007,992 25,997,519 26,045,878
Total Primary Government Expenses: $ 337,652,428 $ 336,536,547 $ 349,598,739 $ 336,378,476 $ 340,607,176 $ 346,692,844 $ 345,962,690 $ 390,467,136 $ 373,357,044 $ 367,959,790
Program Revenues:Governmental Activities:
Charges for Services: Executive and administration $ 2,209,444 $ 2,246,025 $ 2,123,034 $ 2,110,147 $ 2,316,005 $ 2,221,129 $ 2,309,876 $ 2,587,832 $ 2,510,646 $ 2,675,160 Public safety 6,970,909 7,371,438 6,906,078 7,122,121 6,482,419 7,193,150 7,676,780 8,911,292 8,089,932 8,190,826 Recreation 900,225 894,380 957,604 962,086 932,052 960,133 979,791 1,022,252 947,484 959,641 Public libraries 40,736 37,070 32,495 33,369 33,597 30,420 39,297 41,583 46,608 40,720 Social services 126,658 139,649 135,116 137,727 113,106 117,136 105,514 113,126 99,415 92,073 Planning and E/D 1,681,609 2,081,026 1,573,526 1,995,266 1,727,813 1,918,114 1,837,993 2,003,280 2,046,514 2,057,016 Public works 332,001 364,942 356,417 325,721 211,458 223,442 252,276 188,936 218,387 241,015 Education 3,497,123 3,776,975 4,522,161 1,970,205 1,860,301 1,186,216 2,093,869 2,337,922 2,337,585 2,421,502 Cafeteria operations 1,368,341 1,045,893
Operating grants and contributions 51,258,003 53,474,747 51,863,051 53,699,759 55,546,646 59,427,759 57,836,909 62,997,136 57,561,506 51,833,022 Capital grants and contributions 1,066,557 152,292 1,409,223 524,461 125,710 209,781 198,900 -
Total governmental activities program revenues 68,385,049 71,432,145 69,536,039 68,508,693 70,632,620 73,801,960 73,258,015 80,413,140 74,056,977 68,510,975
Business-type Activities: Charges for Services: Sewer 12,352,153 16,494,263 14,058,609 13,320,223 16,314,418 16,099,887 17,903,575 17,204,995 17,669,726 17,045,091 Sewer assessment 5,646,954 5,414,375 5,193,582 5,962,350 6,660,728 5,222,858 5,316,633 5,188,394 5,005,799 4,818,049
Water 8,767,956 7,918,224 10,482,771 9,771,177 10,138,836 9,067,023 10,746,621 11,026,490 12,455,351 11,091,109 Operating grants and contributions 42,183 Capital grants and contributions 1,238,170 541,403 2,694,761 3,073,848 349,939 841,929 2,775,948 8,880
Total governmental activities program revenues 28,005,233 30,368,265 32,429,723 32,127,598 33,506,104 30,389,768 33,966,829 34,261,808 37,906,824 32,963,129
Total Primary Government Program Revenues $ 96,390,282 $ 101,800,410 $ 101,965,762 $ 100,636,291 $ 104,138,724 $ 104,191,728 $ 107,224,844 $ 114,674,948 $ 111,963,801 $ 101,474,104
(Continued on next page)
165

TABLE 2CITY OF WARWICK, RHODE ISLAND CHANGES IN NET POSITION, LAST TEN FISCAL YEARS (CONTINUED) GOVERNMENTAL ACTIVITIES (Accrual Basis of Accounting)
FISCAL YEAR2009 2010 2011 2012 2013 2014 2015 2016 2017 2018
Net (Expense) Revenue:Governmental activities $ (244,405,133) $ (239,917,463) $ (245,149,137) $ (243,046,168) $ (244,996,543) $ (247,987,437) $ (246,716,933) $ (284,046,004) $ (273,302,548) $ (273,402,937) Business-type activities 3,142,987 5,181,326 (2,483,840) 7,303,983 8,528,091 5,486,321 7,979,087 8,253,816 11,909,305 6,917,251
Total Primary Government Net Expense $ (241,262,146) $ (234,736,137) $ (247,632,977) $ (235,742,185) $ (236,468,452) $ (242,501,116) $ (238,737,846) $ (275,792,188) $ (261,393,243) $ (266,485,686)
General Revenues and Other Changes in Net Position:Governmental Activities:
Property taxes $ 195,204,676 $ 201,516,576 $ 205,826,048 $ 213,334,334 $ 216,802,269 $ 214,125,691 $ 217,134,855 $ 223,200,281 $ 231,060,821 $ 228,372,805 Interest on property taxes 1,728,716 (1,273,017) 1,571,198 1,737,961 1,562,589 2,146,222 2,206,502 2,096,950 2,093,896 2,087,162 State aid & in lieu of tax 21,121,217 17,352,666 6,817,475 6,896,729 7,120,046 7,861,860 7,693,925 8,187,664 7,667,081 10,015,034 Investment earnings 156,876 59,581 2,319 (21,741) (32,851) 5,652 5,925 18,346 73,582 335,537 Tax titles 20,334 155,168 97,308 78,373 258,929 217,160 55,085 25,427 15,628 35,073 Insurance proceeds 496,997 39,914 96,463 133,052 427,898 170,101 169,230 157,875 Miscellaneous 4,470,760 5,194,338 5,016,367 5,479,807 6,449,112 6,034,137 7,098,886 7,001,236 6,992,822 9,585,432 Transfers 100,000 17,727 (42,522) (297,396) 15,000
Total governmental activities 222,802,579 223,005,312 219,827,712 227,563,104 232,214,035 230,226,378 234,638,076 240,700,005 248,073,060 250,588,918
Business-type Activities: Investment earnings 180,981 34,442 20,424 8,917 19,175 7,007 6,547 5,459 35,800 89,016 Insurance proceeds 6,104,379 Transfers (100,000) (17,727) 42,522 297,396 (15,000)
Total Business-type Activities 80,981 34,442 6,124,803 (8,810) 61,697 304,403 (8,453) 5,459 35,800 89,016
Total Primary Government: $ 222,883,560 $ 223,039,754 $ 225,952,515 $ 227,554,294 $ 232,275,732 $ 230,530,781 $ 234,629,623 $ 240,705,464 $ 248,108,860 $ 250,677,934
Change in Net Position:Governmental activities $ (21,602,554) $ (16,912,151) $ (25,321,425) $ (15,483,064) $ (12,782,508) $ (17,761,059) $ (12,078,857) $ (43,345,999) $ (25,229,488) $ (22,814,019) Business-type activities 3,223,968 5,215,768 3,640,963 7,295,173 8,589,788 5,790,724 7,970,634 8,259,275 11,945,105 7,006,267
Total Primary Government $ (18,378,586) $ (11,696,383) $ (21,680,462) $ (8,187,891) $ (4,192,720) $ (11,970,335) $ (4,108,223) $ (35,086,724) $ (13,284,383) $ (15,807,752)
166

TABLE 3CITY OF WARWICK, RHODE ISLAND FUND BALANCES, GOVERNMENTAL FUNDS, LAST TEN FISCAL YEARS (MODIFIED ACCRUAL BASIS OF ACCOUNTING)
FISCAL YEAR2009 2010 2011 2012 2013 2014 2015 2016 2017 2018
General Fund: Reserved $ 3,225,420 $ 7,945,894 $ $ $ $ $ $ $ $ Nonspendable 216,869 217,244 214,650 211,476 210,507 280,583 249,434 258,318 Restricted 3,600,000 3,000,000 1,295,271 Committed 2,401,774 3,322,613 4,689,278 4,560,680 4,339,212 3,425,023 4,908,957 157,447 Assigned 4,349,465 Unreserved/Unassigned 5,916,723 6,862,566 5,981,718 8,253,978 11,852,791 10,803,865 8,151,517 18,486,180 22,566,957 22,671,446
Total General Fund $ 9,142,143 $ 14,808,460 $ 8,600,361 $ 11,793,835 $ 16,756,719 $ 19,176,021 $ 15,701,236 $ 22,191,786 $ 29,020,619 $ 27,436,676
All Other Governmental Funds:Reserved $ 1,749,289 $ 1,471,318 $ $ $ $ $ $ $ $ Restricted 9,587,064 7,754,049 8,803,655 6,858,453 10,888,224 12,759,365 13,741,765 9,507,535 Committed Assigned 46,950 40,656 35,685 Unreserved/Unassigned in:
School unrestricted fund (26,136) Special revenue funds 653,589 2,565,535 (13) (25,336) Capital project funds 383,425 2,420,408 (888,044) (628,477) (1,425,201) (2,787,894) (5,676,144) (852,908)
Total All Other Governmental Funds $ 2,786,303 $ 6,457,261 $ 8,745,957 $ 7,166,228 $ 7,414,139 $ 4,070,559 $ 5,212,080 $ 11,880,321 $ 13,741,765 $ 9,482,199
Total All Governmental Funds $ 11,928,446 $ 21,265,721 $ 17,346,318 $ 18,960,063 $ 24,170,858 $ 23,246,580 $ 20,913,316 $ 34,072,107 $ 42,762,384 $ 36,918,875
167

TABLE 4CITY OF WARWICK, RHODE ISLAND CHANGES IN FUND BALANCES, GOVERNMENTAL FUNDS, LAST TEN FISCAL YEARS (MODIFIED ACCRUAL BASIS OF ACCOUNTING)
2009 2010 2011 2012 2013 2014 2015 2016 2017 2018
Revenues:General property taxes $ 194,214,398 $ 202,494,106 $ 204,577,041 $ 212,007,763 $ 216,054,096 $ 214,148,180 $ 213,689,646 $ 227,581,622 $ 231,148,289 $ 227,930,585 Interest on taxes 1,376,875 1,228,767 1,357,578 1,392,844 1,682,473 2,494,254 2,221,716 2,403,234 2,206,364 2,087,162 Intergovernmental revenues 63,643,865 62,224,022 53,821,511 52,037,242 54,946,587 57,042,872 55,935,932 57,470,500 55,113,851 58,466,324 State Contribution to pension plan 6,319,011 5,928,125 5,747,000 6,251,800 6,223,212 6,342,485 6,968,124 11,053,803 7,250,385 7,409,776 Charges for services 12,531,573 12,844,595 11,657,310 11,606,395 11,709,095 12,560,899 11,751,428 14,940,665 15,602,935 14,328,213 Investment income 152,401 58,314 2,093 1,474 (35,582) 4,962 5,184 17,653 72,745 334,702 Contributions and private grants 187,375 139,515 106,860 164,652 522,410 306,079 202,245 198,878 229,191 193,364 Other revenue 11,126,985 11,581,585 9,909,777 10,309,384 11,045,445 12,074,905 12,415,989 12,246,157 12,228,003 15,316,488
Total revenue 289,552,483 296,499,029 287,179,170 293,771,554 302,147,736 304,974,636 303,190,264 325,912,512 323,851,763 326,066,614
Expenditures:Executive and administration 4,872,291 5,816,066 4,957,805 4,519,720 4,508,874 4,645,528 5,256,264 6,231,635 5,631,395 5,722,310 Public safety 41,233,284 40,755,519 42,308,559 43,062,869 44,127,815 45,078,068 48,443,800 51,378,290 48,342,109 48,603,551 Recreation 1,812,641 1,780,946 1,895,427 1,576,349 1,516,612 1,491,348 1,609,025 1,671,852 1,775,404 1,872,055 Public libraries 2,588,469 2,571,020 2,631,152 2,580,684 2,627,093 2,664,349 2,649,211 2,777,726 2,973,205 3,055,225 Social services 2,079,240 1,854,240 1,393,507 1,262,235 1,197,505 1,188,989 1,304,766 1,172,435 1,201,714 1,220,042 Planning and economic development 2,716,404 3,242,502 2,578,289 2,169,881 2,593,625 2,461,805 2,032,789 2,069,975 2,346,268 3,061,573 Public works 11,687,121 12,491,980 14,237,550 12,423,819 13,694,798 14,474,028 14,342,186 15,775,825 13,103,634 14,043,138 Employee benefits, fixed costs and capital 40,692,687 41,079,075 43,757,666 46,057,032 50,772,566 51,176,951 54,065,009 55,241,714 56,103,500 61,737,378 Education 165,475,272 163,419,363 169,004,878 165,316,678 167,622,445 169,221,031 169,089,102 168,197,758 174,954,593 182,304,434 Cafeteria operations* 3,005,016 2,647,559 State contribution to pension plan 6,319,011 5,928,125 5,747,000 6,251,800 6,223,212 6,342,485 6,968,124 11,053,803 7,250,385 7,409,776 Debt service-principal 6,444,241 6,920,994 5,965,182 5,226,115 4,570,722 5,082,483 5,962,158 5,650,593 6,679,050 6,648,671 Debt service-interest 2,313,451 2,300,365 2,169,590 1,726,854 1,761,508 1,749,891 1,668,544 1,072,561 1,597,661 1,442,950 Bond issuance costs/paying agent fees 200,420 1,500 30,659 24,561 102,828 185,506 -
Total expenditures 291,239,128 290,807,754 296,847,025 292,175,536 301,247,434 305,601,517 313,493,806 322,479,673 321,958,918 337,121,103
Excess of Revenues Over (Under) Expenditures Before Other Financing Sources (Uses) (1,686,645) 5,691,275 (9,667,855) 1,596,018 900,302 (626,881) (10,303,542) 3,432,839 1,892,845 (11,054,489)
Other Financing Sources (Uses):Transfers from other funds 136,243,765 133,734,780 129,552,412 127,682,960 126,600,068 127,325,885 129,885,749 128,876,427 131,428,314 132,059,433 Transfers to other funds (136,357,020) (133,996,780) (129,552,412) (127,665,233) (126,642,590) (127,623,281) (129,870,749) (128,876,427) (131,428,314) (132,059,433) Proceeds from bonds - 3,908,000 6,047,524 - 4,353,015 - 5,055,278 5,500,000 5,243,469 4,889,773 Proceeds from capital lease - - - - - - 2,900,000 4,252,088 1,527,826 321,207
Total other financing sources (uses) (113,255) 3,646,000 6,047,524 17,727 4,310,493 (297,396) 7,970,278 9,752,088 6,771,295 5,210,980
Net Change in Fund Balances $ (1,799,900) $ 9,337,275 $ (3,620,331) $ 1,613,745 $ 5,210,795 $ (924,277) $ (2,333,264) $ 13,184,927 $ 8,664,140 $ (5,843,509)
Debt Service as a Percentage of Noncapital Expenditures 3.01% 3.20% 2.79% 2.42% 2.16% 2.31% 2.54% 2.14% 2.64% 2.46%
*During fiscal year 2011, Cafeteria Operations were combined with Education.
Source: City of Warwick Comprehensive Annual Financial Report
FISCAL YEAR
168

TABLE 5CITY OF WARWICK, RHODE ISLAND ASSESSED VALUE AND ACTUAL VALUE OF TAXABLE PROPERTY LAST TEN FISCAL YEARS (Unaudited)
LessFiscal Tax-Exempt Total Taxable Estimated Tax RateYear Residential Commercial Property Assessed Value Actual Value Res/Comm
2009 $ 8,082,766,300 $ 3,188,308,100 $ 94,720,900 $ 11,176,353,500 $ 11,176,353,500 $13.411$20.122010 8,097,688,900 3,203,401,900 64,803,000 11,236,287,800 9,135,193,333 $14.14/$21.212011 6,286,650,600 2,808,766,770 64,485,000 9,030,932,370 9,030,932,370 $17.48/ $26.222012 6,261,960,200 2,641,178,770 53,032,287 8,850,106,683 8,850,106,683 $17.69/ $26.532013 6,265,223,524 2,553,709,270 149,903,604 8,669,029,190 8,669,029,190 $18.14/$27.212014 5,774,315,608 2,308,836,275 113,410,569 7,969,741,314 7,969,741,314 $19.79/$29.682015 5,690,034,009 2,243,081,450 177,862,624 7,755,252,835 7,755,252,835 $20.06/ $30.092016 5,705,887,951 2,203,319,107 187,393,314 7,721,813,744 7,721,813,744 $20.75/$31.132017 6,085,854,763 2,239,830,661 188,575,915 8,137,109,509 8,137,109,509 $20.24/$30.362018 6,099,011,724 2,216,165,300 193,343,996 8,121,833,028 8,121,833,028 $20.80/$31.19
Tangible Less Total Tax RateFiscal Personal Tax-Exempt Tangible Taxable Estimated Tangible/Year Property Property Assessed Value Actual Value Inventory
2009 $ 464,491,800 $ 12,000 $ 464,479,800 $ 464,479,800 $26.82/ $0.002010 468,844,000 2,000 468,842,000 468,842,000 $28.28/ $0.002011 449,384,970 12,000 449,372,970 449,372,970 $34.96/ $0.002012 462,434,140 462,434,140 462,434,140 $35.38/$0.002013 503,931,303 503,931,303 503,931,303 $36.28/ $0.002014 525,385,537 525,385,537 525,385,537 $39.58/ $0.002015 533,705,181 533,705,181 533,705,181 $40.12/ $0.002016 550,124,141 550,124,141 550,124,141 $40.12/$0.002017 525,450,291 525,450,291 525,450,291 $40.48/$0.002018 519,849,116 519,849,116 519,849,116 $41.59/$0.00
Notes: Fiscal 2017 reflects the results of a full revaluation.Source: Tax Assessor's Official Tax Certification List
Real Property
TangiblePersonal Property
169

TABLE 5CITY OF WARWICK, RHODE ISLAND ASSESSED VALUE AND ACTUAL VALUE OF TAXABLE PROPERTY (CONTINUED)LAST TEN FISCAL YEARS (Unaudited)
Less Less Total MotorFiscal Motor Tax-Exempt M/V Vehicle Taxable Estimated Tax RateYear Vehicles Property Phaseout Assessed Value Actual Value Motor Vehicles
2009 $ 777,437,990 $ 14,629,711 $ 357,954,774 $ 404,853,505 $ 404,853,505 $34.602010 706,836,093 13,698,497 357,188,715 335,948,881 335,948,881 $34.602011 742,645,169 12,867,015 363,655,976 366,122,178 366,122,178 $34.602012 680,792,673 12,652,167 13,342,221 654,798,285 654,798,285 $34.602013 839,853,603 11,918,651 178,494,733 649,440,219 649,440,219 $34.602014 854,260,308 14,343,446 180,950,469 658,966,393 658,966,393 $34.602015 862,802,922 16,384,579 181,107,718 665,310,625 665,310,625 $34.602016 873,371,912 16,067,882 184,942,595 672,361,435 672,361,435 $34.602017 916,573,616 16,636,180 187,835,342 712,102,094 712,102,094 $34.602018 812,081,178 15,317,856 156,520,338 640,242,984 640,242,984 $34.60
Fiscal Assessed EstimatedYear Value Actual Value Ratio
2009 $ 12,045,686,805 $ 12,045,686,805 100.00%2010 12,041,078,681 9,939,984,214 121.14%2011 9,846,427,518 9,846,427,518 100.00%2012 9,967,339,108 9,967,339,108 100.00%2013 9,822,400,712 9,822,400,712 100.00%2014 9,154,093,244 9,154,093,244 100.00%2015 8,954,268,641 8,954,268,641 100.00%2016 8,944,299,320 8,944,299,320 100.00%2017 9,374,661,894 9,374,661,894 100.00%2018 9,281,925,128 9,281,925,128 100.00%
Notes: Fiscal 2017 reflects the results of a full revaluation.Source: Tax Assessor's Official Tax Certification List
Total All
Personal PropertyMotor Vehicle
170

TABLE 6 CITY OF WARWICK, RHODE ISLAND PROPERTY TAX RATES (PER $1,000 OF ASSESSED VALUE) LAST TEN FISCAL YEARS (Unaudited)
Fiscal Year General Fund Fiscal Year General Fund
2009 Real Estate Residential 13.41 2014 Real Estate Residential 19.79Real Estate Commercial 20.12 Real Estate Commercial 29.68Tangible Personal Property 26.82 Tangible Personal Property 39.58Manufacturers' Machinery Manufacturers' Machinery Motor Vehicles 34.60 Motor Vehicles 34.60
2010 Real Estate Residential 14.14 2015 Real Estate Residential 20.06Real Estate Commercial 21.21 Real Estate Commercial 30.09Tangible Personal Property 28.28 Tangible Personal Property 40.12Manufacturers' Machinery Manufacturers' Machinery Motor Vehicles 34.60 Motor Vehicles 34.60
2011 Real Estate Residential 17.48 2016 Real Estate Residential 20.75Real Estate Commercial 26.22 Real Estate Commercial 31.13Tangible Personal Property 34.96 Tangible Personal Property 41.50Manufacturers' Machinery Manufacturers' Machinery Motor Vehicles 34.60 Motor Vehicles 34.60
2012 Real Estate Residential 17.69 2017 Real Estate Residential 20.24Real Estate Commercial 26.53 Real Estate Commercial 30.36Tangible Personal Property 35.38 Tangible Personal Property 40.48Manufacturers' Machinery Manufacturers' Machinery Motor Vehicles 34.60 Motor Vehicles 34.60
2013 Real Estate Residential 18.14 2018 Real Estate Residential 20.80Real Estate Commercial 27.21 Real Estate Commercial 31.19Tangible Personal Property 36.28 Tangible Personal Property 41.59Manufacturers' Machinery Manufacturers' Machinery Motor Vehicles 34.60 Motor Vehicles 34.60
Source: City of Warwick Tax Assessor - Official Tax Certification List
171

TABLE 7CITY OF WARWICK, RHODE ISLAND DEMOGRAPHIC AND ECONOMIC STATISTICS LAST TEN YEARS (Unaudited)
Median Per CapitaPersonal Family Personal School Unemployment
Fiscal Year Population Income Income Income Enrollment Rate
2009 85,925 $ 2,011,504,250 $ 59,445 $ 23,410 10,525 9.18%2010 84,760 2,597,724,480 75,029 30,648 10,507 11.50%2011 82,672 2,477,762,512 72,337 29,971 10,277 10.30%2012 82,672 2,515,047,584 73,504 30,422 9,977 10.12%2013 82,698 2,662,958,298 76,695 32,201 9,675 8.80%2014 81,971 2,639,548,171 76,695 32,201 9,409 8.00%2015 81,963 2,777,644,107 78,263 33,889 9,277 5.86%2016 81,699 2,872,291,743 82,937 35,157 9,130 4.73%2017 81,576 2,916,423,576 84,421 35,751 8,897 4.02%2018 82,672 3,096,975,792 87,369 37,461 9,124 4.50%
Sources: US Census Bureau, Population Finder and FactFinderUS Census Bureau, 2010-2015 American Community Survey (5 Year Estimates) RI Department of Labor and Training
172

TABLE 8CITY OF WARWICK, RHODE ISLAND PRINCIPAL EMPLOYERS JUNE 30, 2018 (Unaudited)
Percentage ofNumber of Total City
Employer Employees Rank Employment
Met Life 1,000-4,999 1 2.3%-11.3%Kent Hospital / Acute Rehab 1,000-4,999 2 2.3%-11.3%J Arthur Trudeau Memorial 1,000-4,999 3 2.3%-11.3%Kent County Memorial Hospital 1,000-4,999 4 2.3%-11.3%Community College of RI 500-999 5 1.1%-2.3%Bentley Providence 500-999 6 1.1%-2.3%Infiniti of Warwick 500-999 7 1.1%-2.3%Kenney Manufacturing 500-999 8 1.1%-2.3%Interstate Electrical Service Corp 500-999 9 1.1%-2.3%J Arthur Trudeau Memorial Ctr 500-999 10 1.1%-2.3%
Source: Employ RIR.I. Department of Labor and Training-Total Employment Statistics
(Historical data for nine years prior was unavailable)
173

TABLE 9CITY OF WARWICK, RHODE ISLAND FULL-TIME EQUIVALENT CITY GOVERNMENT EMPLOYEES BY FUNCTION/PROGRAM LAST TEN FISCAL YEARS (Unaudited)
2018 2017 2016 2015 2014 2013 2012 2011 2010 2009
Municipal Administration 93 93 92 90 88 87 86 86 87 91
Public SafetyPolice Civilians 79 79 78 78 78 77 75 75 77 77Officers 175 175 172 172 167 163 164 163 163 163Fire Civilians 12 12 12 12 12 12 11 11 11 12Firefighters/Officers 227 227 220 220 221 220 209 209 209 217Municipal 17 17 16 16 15 16 16 16 17 17
22 22 22 22 22 22 22 22 22 23
Library/Recreation 66 66 65 65 67 67 67 67 66 67
Developmental Resources 16 16 15 16 16 16 16 16 17 19
Public WorksAdministration 3 3 3 3 3 3 3 3 3 4Maintenance/Automotive 40 40 40 40 39 38 39 39 39 42Engineering 4 4 4 4 4 4 4 4 4 4Sanitation/Recycling 23 23 23 23 23 23 23 24 24 24Highway 61 61 61 61 61 61 62 61 61 62
Water 33 33 33 33 34 35 35 35 35 35
Sewer 33 33 33 29 30 31 32 32 32 33
Source: City of Warwick Finance Department - Personnel SupplementsNote: This count is based on budgeted positions, not all were filled
174

TABLE 10CITY OF WARWICK, RHODE ISLAND OPERATING INDICATORS BY FUNCTION LAST TEN FISCAL YEARS (Unaudited)
Function 2018 2017 2016 2015 2014 2013 2012 2011 2010 2009
Legislative and ExecutiveNumber of Resolutions 163 161 132 139 124 134 122 158 214 222 Number of Ordinances 18 32 29 19 30 22 21 32 38 47 Number of Meetings 26 28 26 30 27 27 29 22 22 22
Board of Elections Number of Registered Voters 61,603 61,522 59,546 60,189 59,470 62,059 60,315 60,239 61,133 59,928
Purchasing Number of bid contracts 353 338 358 323 364 327 301 329 317 301 Number of purchase orders issued 3,687 3,711 3,985 4,027 3,950 3,673 3,665 3,549 3,374 3,152
Building Department Number of Permits Issued 5,894 5,523 5,966 4,959 4,797 4,553 4,521 4,709 5,210 4,152 Permit Value 106,449,751 102,000,006 85,372,333 57,740,168 54,478,286 52,690,863 63,980,377 59,519,775 53,664,975 47,712,906
Public SafetyCalls for Service 80,224 80,341 84,736 109,587 90,490 90,469 84,669 93,796 90,509 78,136 Arrests 2,561 2,733 2,990 3,057 3,431 3,325 3,325 3,284 3,290 3,559 Accidents 3,844 4,449 4,851 4,795 5,180 4,374 4,374 4,607 4,653 4,929 Parking Violations 141 130 213 6,304 215 12,085 12,085 12,477 10,973 12,455 EMS Responses 13,972 13,031 12,888 11,774 11,833 11,084 9,637 10,932 9,953 10,411
Highway and Sanitation Miles of Streets-Local Paved 396 396 396 396 396 400 400 398 398 398 Miles of Streets-State Paved 69 69 69 69 69 70 70 68 68 68 Miles of Streets-Private Paved 20 20 20 20 20 20 20 19 19 19 Refuse Collected (Annual Tonnage) 25,785 25,367 25,344 24,520 24,855 25,305 23,797 24,747 27,050 25,897 Recyclables Collected (Annual Tonnage) 10,056 10,281 10,152 9,863 10,074 10,476 8,940 8,801 8,939 9,372
Public Skating Admissions-Thayer Arena 5,144 5,144 5,144 6,322 7,233 6,313 6,940 6,578 6,137 6,193 McDermott Pool Daily Passes 4,177 4,177 4,177 6,136 6,217 944 1,119 1,225 1,082 953 McDermott Pool Monthly Passes 770 770 770 626 488 McDermott Pool Seasonal Passes 293 293 293
Library Registered Borrowers 30,897 34,895 35,554 35,120 36,813 38,121 39,336 40,827 45,451 40,169 Print Materials 132,321 140,565 141,369 143,787 148,106 176,576 166,323 180,516 185,293 194,376 Non-Print 20,849 18,000 17,373 16,683 15,384 14,751 13,168 22,827 11,920 15,861 Ebooks and AV Materials 87,743 73,156 55,799 46,024 Circulation 574,553 570,575 573,079 603,897 558,313 523,382 521,543 494,773 445,656 386,078 Programs 1,196 1,022 969 1,302 743 709 574 841 864 894 Program Attendance 28,062 32,883 18,616 13,952 12,342 11,826 11,119 14,942 15,013 13,061
WaterTotal Connections 26,966 26,969 26,896 26,959 26,903 26,967 26,827 26,657 27,132 27,109 New Connections 72 97 57 146 36 188 42 14 25 34 Water Main Breaks 34 30 29 34 26 21 21 47 28 29 Average Daily Consumption (Gallons) 5.712M 5.875M 5.479M 5.477M 4.395M 4.87 6.248M 5.513M 5.554M 6.314M
Wastewater Average Daily Sewer Treatment (Gallons) 4.9M 4.8M 4.5M 4.6M 4.8M 4.8M 4.71M 5.41M 4.82M 5.13MAccounts Billed 22,635 22,405 22,222 21,966 21,728 21,544 20,999 20,532 20,133 19,769
Source: Various City Departments
175

TABLE 11CITY OF WARWICK, RHODE ISLAND CAPITAL ASSET STATISTICS BY FUNCTION LAST TEN FISCAL YEARS (Unaudited)
Function 2018 2017 2016 2015 2014 2013 2012 2011 2010 2009
General GovernmentCity Hall 2 2 2 2 2 2 2 2 2 2Human Services 2 2 8 8 8 8 8 8 8 8Public Works 2 2 2 2 2 2 2 2 2 2
Public SafetyPolice Stations 1 1 1 1 1 1 1 1 1 1Fire Stations 10 10 10 10 9 9 9 9 9 9
HighwayStreets (miles) 490 490 490 490 490 490 490 490 490 490Streetlights 8834 8834 8,834 8834 8834 8834 8834 8834 8834 8834Traffic Lights (City) 27 27 27 27 27 27 27 27 27 27
LibraryMain 1 1 1 1 1 1 1 1 1 1Branches 3 3 3 3 3 3 3 3 3 3
RecreationParks 9 9 9 9 9 9 9 9 9 9Bathing Beaches 6 6 6 6 6 6 6 6 6 6Ice Arenas 2 2 2 2 2 2 2 2 2 2Pools 1 1 1 2 2 2 2 2 2 2
Water/WastewaterFire Hydrants 1996 1996 1,772 1772 1772 1772 1772 1772 1772 1769Max Daily Capacity (Gallons)-Water 13.0M 13.0M 12.0M 13.3M 13.3M 13.3M 13.3M 13.3M 13.3M 13.3MMax Daily Capacity (Gallons)-Sewer 7.7M 7.7M 7.7M 7.7M 7.7M 7.7M 7.7M 7.7M 7.7M 7.7M
EducationElementary Schools 16 16 16 17 17 17 17 17 17 17Middle Schools 2 2 2 3 3 3 3 3 3 3High Schools 2 2 2 3 3 3 3 3 3 3Career/Technical 1 1 1 1 1 1 1 1 1 1
Source: Various City Departments
Source: Various City Departments
176


![City of Warwick, Rhode Island [AV] · PDF fileAverage past service 14.3 13.3 2. ... Excess/(shortfall) ... City of Warwick, Rhode Island Police II Pension Fund Table 3c Actuarial Valuation](https://img.dokumen.tips/doc/110x75/5ab9a9f07f8b9aa6018e2431/city-of-warwick-rhode-island-av-past-service-143-133-2-excessshortfall.jpg)