Embed Size (px)
Citation preview
CITY OF PROVIDENCE, RHODE ISLAND
COMPREHENSIVE ANNUAL FINANCIAL REPORT
Fiscal Year Ended June 30, 2013
City of Providence
Finance Department
25 Dorrance Street, Providence, RI 02903
CITY OF PROVIDENCE RHODE ISLAND
YEAR ENDED JUNE 30, 2013
TABLE OF CONTENTS
INTRODUCTORY SECTION: Letter of Transmittal ...................................................................... ... .............. .. ... ......... .... .... . Organization Chart ............................................................................................................... . List of City Officials .............................................................................................................. . GFOA Certificate of Achievement ................ ............. ...... ............................... ................ .. ... .
FINANCIAL SECTION: Report of Independent Auditors ..... ...... .......... .. ...... ... .. ... .. .... ... .. .... ......... ... ...................... ..... .
Basic Financial Statements and Required Supplementary Information: Management's Discussion and Analysis ............................................................................. .
Basic Financial Statements: Government-wide Financial Statements: Statement of Net Position .... ...... .... ................ ... .. .... ........... .. ... ........... .... .... ........ .. .. ... ... ... ... .. . Statement of Activities ....... .. .. .. ........... .... ..... .. ........... ... ....... .... ......... ...... .............. ..... ... ........ .
Fund Financial Statements: Governmental Funds: Balance Sheet .... .. ... ...... ..... ......... ......... ....... .. ...... ........ .. ... .. ...... ..... ......... ..... ... ... .... ........... .. . . Statement of Revenues, Expenditures, and Changes in Fund Balances ............................ . Reconciliation of the Statement of Revenues, Expenditures, and Changes in Fund Balances of Governmental Funds (B-2) to the Statement of Activities (A-2) ........ ............ ..
Proprietary Funds: Statement of Net Position ................ .... ......... ..... ... ..... .................. ......... .......... .. ... ................ . Statement of Revenues, Expenses and Changes in Net Position .................... .................. .. Statement of Cash Flows ... ...................... ..... ............ ..... ...... ... ..... .................. ............ ......... .
Fiduciary Funds: Statement of Fiduciary Net Position .... ............................ .... ...... .......... ........ ........ .... ........ .... . Statement of Changes in Fiduciary Net Position ...... .... .. ................ .............................. .... .. ..
Notes to Financial Statements ............. .. ........... ..... .... ... .. .. ....................... .... ................... ..
Required Supplementary Information: Budgetary Comparison Schedule for the General Fund .. .......................... ...... .... ................ . Budgetary Comparison Schedule for the School General Fund .......................................... . Notes to Required Supplementary Information ................................ ............ .. ................ .. .. .. Schedule of Funding Progress .................................... ........................................................ .
Other Supplementary Information: Non-major Governmental Funds: Combining Balance Sheet ............. ...... .... .... .. ...... .... ... .. ... ................ ............ .. .... ...... ............ . Combining Statement of Revenues, Expenditures, and Changes in Fund Balances ........ ..
A-1 A-2
B-1 B-2
B-3
C-1 C-2 C-3
D-1 D-2
E-1 E-2 E-3 E-4
F-1 F-2
Page(s)
i-vii viii ix X
1 - 2
3- 11
12 13
14 15
16
17 18
19-20
21 22
23-55
56-60 61 62 63
64 65
(CONTINUED)
School Grant Funds:
CITY DE PROVIDENCE RHODE ISLAND
YEAR ENDED JUNE 30, 2013
TABLE OF CONTENTS
Combining Balance Sheet ................................................................................................... . Combining Statement of Revenues, Expenses and Changes in Fund Balances ................ .
Agency Funds: Statement of Changes in Assets and Liabilities .................................................................. .
Capital assets schedules: Capital Assets Used in the Operation of Governmental Funds ..................... .... ............ ..... .
STATISTICAL SECTION: Net Position by Component ...... ... .......... ............. ...... ... ...... ........ .......................................... . Changes in Net Position ...................................................................................................... . Fund Balances, Governmental Funds ... .... .... .. ............. ....... ... ...... ... ..... ....................... ..... ... . Changes in Fund Balances, Governmental Funds ... .... .... ... ..... .. ..... ...... ........... ................. .. . Tax Revenue by Source ................................ ......... ......... ......... .... .. .... ................ .... .......... ... . Assessed Values and Estimated Actual Values of Taxable Property .... .. ... .... ... ..... ...... ...... . . Principal Property Taxpayers ........... .... ......... ...... ..... ... ... ....... ... ....... .... ...... ........................... . Property Tax Levies and Collections ..... ...... ..... .......... .. ............ ... .... .. .. .. ....... ....................... . Ratios of General Bonded Debt Outstanding ...................................................................... . Direct Governmental Activities Debt .................................................................................... . Legal Debt Margin Information ........... ... ... ............... .. ........... ........ .. ............ ....... .. ........... .. ... . Pledged Revenue Coverage .. ... ....... ...... .............. .... .... ... ................ ..... .... ..... ... ..... .. ...... .. ..... . Demographic and Economic Statistics ................................................................................ . Principal Employers ..... .................. ...................... ..... ...... ...... .... .. ........ ... .... ............... ......... .. . Full-Time Equivalent Employees by Function ... .................................... .. ....................... ...... . Operating Indicators by Function ....... ..... ..... .. ....... ........................ ............. .. ........................ . Capital Assets Statistical by Function .... .... ... ...... ....... ....... .. ............ ....... ... ....... .. ...... ... ....... .. .
G-1 G-2
1-1
J-1
Page(s)
66 67
68
69
Schedule
1 70 2 71-72 3 73 4 74 5 75 6 76 7 77 8 78 9 79 10 80
11-12 81-82 13 83 14 84 15 85 16 86 17 87 18 88
(CONCLUDED)
CITY OF PROVIDENCE Angel Taveras, Mayor
Introductory Section
• Letter of Transmittal • Organizational Chart • List of City Officials • GFOA Certificate of Achievement
December 31, 2013 City Council Providence, Rhode Island
Honorable Members,
CITY OF PROVIDENCE Angel Taveras, Mayor
Rhode Island state law requires that all general purpose, local governments publish a complete set of audited financial statements within six months of the close of each fiscal year. This report fulfills that requirement for the fisca l year (FY) that ended June 30,2013 .
Management assumes full responsibility for the completeness and reliability of the information contained in this report, based upon a comprehensive framework of internal control established for this purpose. Because the cost of internal control should not exceed anticipated benefits, the objective is to provide reasonable, rather than absolute assurance that the financial statements are free of any material misstatements .
Accountants and advisers from Braver PC have issued an unqualified ("clean") opinion on the City of Providence, Rhode Island 's financial statements for the year ended June 30, 2013. A copy of their independent auditor's report is located at the front of the financial section of this report.
Management 's discussion and analysis (MD&A) immediately follows the independent auditor 's report and provides a narrative introduction, overview and analysis ofthe basic financial statements. The MD&A is intended to compliment this letter of transmittal and should be read in conjunction with it.
Profile of the Government
The capital city of Providence was founded in 163 6 and incorporated in 183 I . It occupies a total land area of 18.1 square miles and an additional 1.9 square miles of water; is located at the head ofNarragansett Bay on the Providence River, and is the major population , financial , educational, governmental, and industrial center of Rhode Island . Situated on the Boston-Washington Interstate 95 corridor, with proximity to multi-billion dollar markets and multi-million population centers, residents and businesses have ready access to all major forms of transportation, including AMTRAK, Providence & Worcester Railroad, TF Green International Airport, the Port of Providence and Interstates 95 and 195. Multi-modal transportation has most recently been expanded with the opening of Interlink, increasing commuter rail service connections with the Massachusetts Bay Transit Authority.
Providence has the largest population of Rhode Island 's cities and towns with 178,036 residents (20 I 0 Census), up 2.5 percent from 173 ,618 in 2000 (2000 Census .) The demographic profile for the City is as follows: Caucasians 49.8 percent; Hispanics 38.1 percent; African Americans 16.0 percent; Asians 6.4 percent; and Native Americans 1.4 percent.
The City has a Mayor-Council form of government. A Home Rule Charter was adopted in 1980 and became fully effective on January 3, 1983. The responsibilities of City government include providing a range of services that include: general government, community development, administrative services, public safety, sanitation, public works, planning and development, workforce development, recreation, parks and public education. The City adopts an Annual Budget for the General Fund, which includes the School Department. The legal level of control is by Department.
Providence is Recovering
Upon taking office in January 20 I I, Mayor Angel Taveras signed an Executive Order creating an independent Municipal Finances Review Panel to conduct a full review of the City ' s finances. On March 3, 2011, the Panel delivered a report that identified a $110 million structural deficit in FY2012.
Mayor Taveras took swift and decisive action to address this "Category 5 Fiscal Hurricane." He called on every stakeholder in the city to share in the sacrifices necessary to pull Providence back from the brink. He cut his own pay by I 0 percent and reduced the Mayor's Office budget by 10 percent. The Mayor renegotiated union contracts with City workers, firefighters , police officers and teachers, saving approximately 10 percent of the value of those contracts in FY20 12 and more than $100 million over the next several years.
Mayor Taveras secured contributions from Brown University and the six other major, tax-exempt universities , colleges and hospitals in Providence, totaling nearly $48 million in additional revenue over II years.
In FY20 13, the City reached a landmark agreement with retirees and current employees to reform the City pension and retiree health care system. The agreement saved Providence approximately $18.5 million in FY20 13 and reduces the City ' s unfunded pension liability by approximately $170 million . Details of the agreements:
Pension
• PENSIONS CAPPED: In FY2023 , COLAs will be reinstated only for retirees with pensions less than 150 percent the state median income OR less than the salary of an incumbent employee of the same rank as the retiree at the time of retirement (police and fire retirees only), whichever is lower.
• COLA SUSPENSION: All COLAs suspended for 10 years. (Families of city employees killed in the line of duty will continue to receive annual COLA.) After 10 years, COLAs will only be reinstated for retirees who are under the pension cap, and COLAs will end when the cap is reached.
• ELIMINATION OF HIGH-END COLAS: All 5 and 6 percent compounded COLAs are permanently eliminated .
• FUTURE COLAS LIMITED: Retirees whose COLAs are reinstated in FY2023 will receive annual raises of 3 percent compounded or what is called for in their contract, whichever is less.
• ONE-TIME STIPEND IN FY2017: In FY20 17 (Year 5 of the agreement), retirees collecting pensions of less than $100,000 will receive a stipend of $1 ,500. This one-time payment will not change their future pension calculations.
• CONTINGENT STIPEND IN FY2020: In FY2020 (Year 8 of the agreement), retirees collecting pensions of less than $100,000 may receive a separate one-time stipend of up to $1 ,500 if the city achieves savings through the creation of a self-insured dental plan. The potential payment would not change future pension calculations.
ii
• SUSTAINABLE REFORMS TO PENSION CALCULATIONS: Future pensions will be calculated based on the four highest years of service. The current system calculates pensions based on the highest three years.
• CONTINUED PENSION CONTRIBUTIONS: Employees will be required to contribute to the pension system for as long as they earn credit toward a pension.
• ACCIDENTAL DISABILITY: Accidental disability pension calculations will be based on 66 2/3 of the employee's final salary.
Healthcare (pertains only to police, fire and retiree association)
• MEDICARE SETTLEMENT: Retirees 65 and older will move onto Medicare. • PART B SUPPLEMENT AND MEDICARE PENALTY: The City will provide funding to
cover Medicare 's Part B supplement and any penalties retirees will be required to pay. • PART D PRESCRIPTION DRUG COVERAGE: The City will also provide funding to cover
Medicare Part 0 prescription drug coverage. • UNDER 65 HEALTH COVERAGE UNCHANGED : Health care for retirees under the age of
65 will not be changed.
These reforms saved the City $4 million ofthe $18.5 million noted above in FY2013 and are projected to save the City more than $40 million over the next I 0 years.
Through collaborative efforts and shared sacrifice, the Taveras administration, with the partnership of the Providence City Council and stakeholders across the City, has all but eliminated the City's $110 million structural deficit and ended FY20 13 with a $1.57 million surplus in the general fund.
Creating Jobs and Growing Providence's Economy
Just as bold actions were necessary to weather Providence 's "Category 5 Fiscal Hurricane" and put the city on the path to long-term financial sustainability, equally bold actions are now being taken to lay the groundwork for a sustained recovery.
In April 2013, Mayor Angel Taveras announced a 20-point economic development action plan, Putting Providence Back to Work.
The plan builds on Providence's competitive advantages: a knowledge economy anchored by best-in-class hospitals and universities, vibrant arts and cultural centers, a strong maritime industry, thriving small businesses in local neighborhood economies and a young workforce.
The City is also making long-term investments in basic municipal operations: strong schools, safe neighborhoods, reliable public infrastructure and the timely provision of city services.
1. Freeze Commercial Tax Rates. In its FY2014 budget, the Taveras administration successfully worked with the City Council to freeze Providence's commercial tax rate.
2. Fix the Permitting Process. The City of Providence has established a new departmental subgroup focused solely on small permit application review so that simple, small-dollar projects proceed more quickly. Providence will also soon allow for online permit application submissions.
3. Remove Barriers to Redevelopment. The Providence Redevelopment Agency is aggressively pursuing a range of economic development tools to spur the continued development of key real estate parcels in the city.
iii
4. Develop Surface Lots Citywide. The Taveras administration is preparing a new citywide tax stabilization ordinance designed to incentivize new development on Providence' s surface parking lots .
5. Reinvent Kennedy Plaza. In partnership with a range of stakeholders, Providence is undertaking a fundamental infrastructure reformation of its downtown hub, Kennedy Plaza. The project is designed to make the downtown more attractive for visitors , businesses and residents alike.
6. Invest in Storefront Improvement. The Taveras administration is working to begin a program of reimbursing eligible, main-street small businesses for storefront capital improvements.
7. Provide Targeted Back Office Supports. Providence will begin providing operational support and technical assistance to small businesses and/or eligible start-ups.
8. Reform the City's Zoning Ordinance. Providence is currently undertaking a comprehensive update of the City's existing zoning ordinance to support goals for smart growth, sustainable, cultural , equitable and transit-oriented development.
9. Invest in Historic Preservation. Providence worked with the General Assembly, the Office of the Governor and local advocates to win reinstatement ofthis critical tax credit.
10. Market Available Real Estate. Providence will create and maintain a public database of properties available for development. Beyond being available online, Providence ' s available real estate will be aggressively marketed to site selection consultants nationwide .
11. Raise Participation in State Incentive Programs. Using a range of outreach strategies, the City will execute an outreach campaign to increase the rate of participation.
12. Review Statewide Regulatory Policy. The City proposes a full review of Rhode Island labor, tax and regulatory policy, in cooperation with both business organizations and labor representatives, with the goal of aligning Rhode Island standards with national norms .
13. Raise Student Achievement. Providence is implementing two new, award winning programsProvidence Talks and Providence Reads - to help ensure Providence children enter kindergarten ready to learn and reach grade level reading proficiency by third grade.
14. Expand Apprenticeship Programs. Providence will expand its portfolio of apprenticeship programs, looking first to Providence's working waterfront and creative economy.
15. Support Nursing & Health Sciences. Providence will work to bring a nursing school to the City.
16. Expand Adult Education. Workforce Solutions of Providence/Cranston will seek new partnerships between Rhode Island ' s institutions of public higher education and local community organizations.
17. Make Streetcars a Reality. Providence is aggressively pursuing a sustainable funding strategy to bring this transportation option to fruition .
18. Rehabilitate Foreclosed Properties . Providence will partner with Community Development Corporations to direct the rehabilitation of abandoned and vacant residential properties.
19. Market Providence. In the summer of 20 13 Providence conducted a regional marketing and advertising campaign encouraging visitors to "Come to Providence."
iv
20. Improve the Visitor Experience. Providence will erect new visitor information kiosks, which will double as a centralized ticketing hub for all a1ts related events and activities in Providence.
Infrastructure Improvements
The City is working to improve infrastructure in ways that will impact all residents and businesses for years to come.
• Providence Road Improvement Project: In spring 2013, the City kicked off the Providence Road Improvement Project, its efforts to rebuild and repair approximately 65 miles of roads, or one out of every six roads, in Providence. The road improvement work is funded by a $40 million bond that was overwhelmingly approved by city voters in November 2012.
Improving Public Education
Plans to grow the City's economy can never be divorced from efforts to improve our schools. The City is working to provide every child in Providence with a first-class education.
• Providence Reads - In fall20 12, the City launched Providence Reads- an initiative in partnership with more than a dozen businesses and organizations to increase grade-level reading, promote school readiness, improve school attendance and support summer learning in Providence.
• Providence Talks - In March 2013, the City became the $5 million Grand Prize Winner of Bloomberg Philanthropies ' Mayors Challenge for its innovative proposal to set low-income children on a path toward lifelong achievement by increasing the number of words they hear in their earliest years.
• Children and Youth Cabinet - The City is working closely with the Providence Children and Youth Cabinet (CYC), a diverse team of more than I 00 community leaders helping to guide the future of education in Providence. In October 2012, the CYC released its 'Educate Providence: Action for Change' report, which provides baseline data and II indicators to measure the City's progress in educating children from cradle to career.
• Awards- Providence's efforts to improve public education were recognized and honored. o In July 2012, Providence was named an All-America City by the National Civic League
for its ambitious plan to ensure that more children are reading at grade level by the end of third grade.
o In July 2012, the Casey Foundation chose Providence as the first site for Evidence2Success because of the City's and the State's commitment to investing in children and youth, and for their collaborative efforts to improve outcomes of children in low-income neighborhoods.
o In October 2012, the Mayor 's Children and Youth Cabinet was among the national winners of the Together for Tomorrow School Improvement Grant. Providence received the national recognition for its efforts to turn around low-performing schools and raise student achievement in every public school.
v
o In October 2012, Cities of Service announced that it awarded Providence a $25,000 grant supported by Bloomberg Philanthropies to implement Leyendo, a service-based initiative to boost reading levels for Providence students who are not reading on grade level and speak a language other than Engli sh at home.
Healthy Communities
In August 2012, Mayor Taveras signed an executive order establishing the Healthy Communities Office. The office is charged with improving the health and well ness of Providence residents by improving nutrition and increasing access to healthy foods , promoting physical activity and recreation, and preventing substance abuse among young people, among other efforts. The Healthy Communities Office, along with other City departments, has worked to make Providence a healthier community for all.
• Cyclovia: In 2012, the City held its first Cyclovia on Broad Street. The street was closed to traffic for exclusive use of pedestrians, runners, skaters and bicyclists. Cyclovia is an international phenomenon that reportedly began in Bogota, Colombia and has spread to cities across the globe, including New York City, Chicago, Seattle, San Francisco, Los Angeles, Miami , and Cambridge, Mass. In spring 2013, Mayor Taveras announced that the City will host an expanded schedule of three Cyclovia events over the summer.
• Tobacco Prevention: In early 2012, Mayor Taveras and the Providence City Council passed two ordinances banning the sale of tobacco products and store discounts aimed at children. The tobacco industry sued to prevent the laws from taking effect. In December 2012, the City won an important victory in its fight to protect children from the harmful effects of tobacco, when Rhode Island U.S. District Cou1t Chief Judge Mary Lisi ruled against Big Tobacco's attempt to block City officials from enforcing the new anti-tobacco laws.
Sustainability
The City of Providence is taking vital steps to improve the quality of life for City residents and to ensure that Providence is a sustainable and livable place for residents and visitors.
• Big Green Can Recycling: In October 2012, the City launched a new recycling initiative, making it easier for residents to recycle in Providence. Every Providence household received a new, 65-gallon gray trash barrel and began using the large, 95-gallon ' Big Green Can' for recycling. The larger recycling barrel , coupled with the statewide transition to single-stream recycling, aims to increase recycling rates by making it easier for all residents to recycle.
• Lots of Hope: In 2012, the City of Providence, in partnership with the Southside Community Land Trust and the Rhode Island Foundation, launched Lots of Hope, a new initiative to convert city-owned vacant lots into productive urban farms.
• Earth Day City-wide Clean Up : ln April 2013, Mayor Taveras and the City of Providence hosted the first annual city-wide celebration of Earth Day, drawing I ,800 volunteers who cleaned parks, planted trees and worked on neighborhood beautification efforts.
vi
Debt Administration
Outstanding governmental ~nd business-type activity bonds at June 30,2013 totaled $623,051,000. (Note 7 of this report presents more detailed information about the City's debt position.) The City has the following bond ratings:
Moody's Investor Services Standard and Poors Fitch
Long-Term Financial Planning
Baal BBB BBB
As part of the annual budget process, the Finance and Planning Departments present a five-year Capital Improvement Plan. This plan identifies costs and financing methods for those capital projects the City expects to fund over the next five years. The 20 12 - 20 16 fiscal year Capital Improvement Plan projects needs through FY20 16. The plan provides for the needs of the general government and addresses issues such as infrastructure, major equipment replacement, school facilities, public safety, recreation and public lands and parks.
Acknowledgments
The preparation of this report could not have been accomplished without the dedication and hard work of the Finance, Planning & Development, Policy and Communications professionals who work for the City of Providence. I would like to express my appreciation and gratitude to all of the staff members who assisted and contributed to its preparation. I also appreciate the assistance and dedication of the audit team of Braver·PC. Finally, I would like to thank Mayor Angel Taveras and the Providence City Council for their steady and responsible stewardship of all aspects of City government.
~··~~~ · Lawrence J. ~~~ini
Finance Director
vii
Finance
Information Technology
Public Property/ Purchasing
Board of Canvassers
Parks & Recreation
Water Supply Board
Parks Com iss ion
Mayor
,~,,
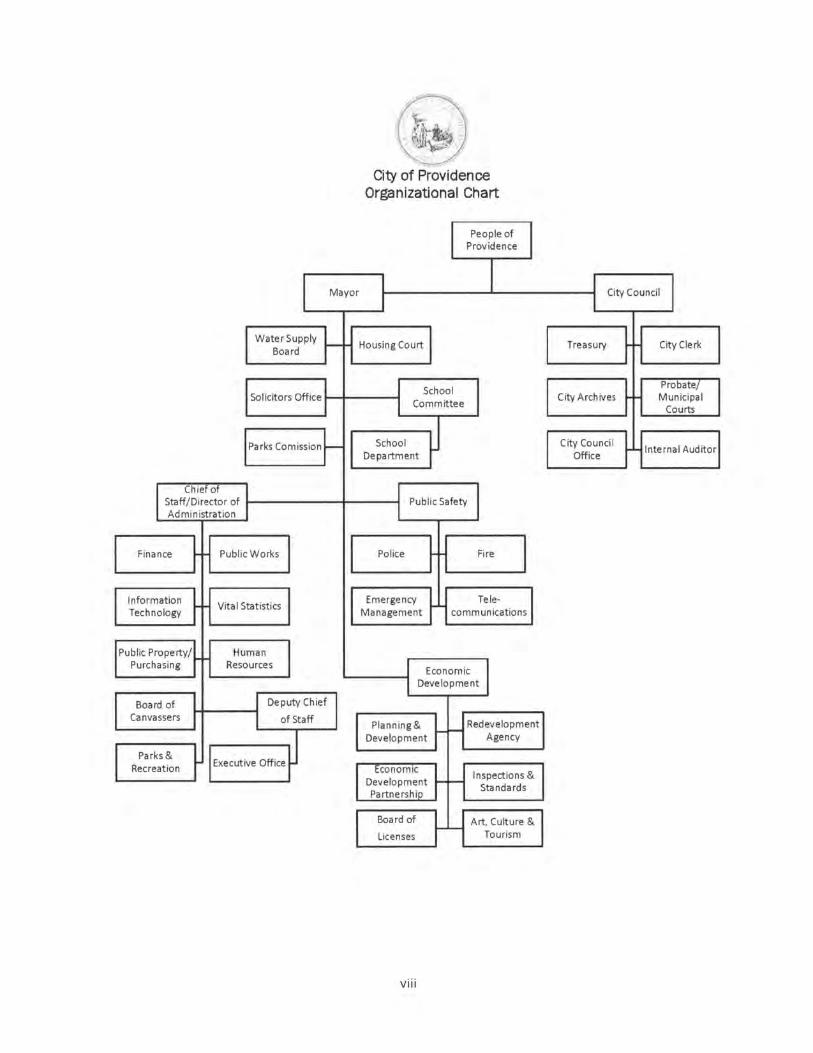
City of Providence Organizational Chart
Police
Emergency Management
Fire
Telecommunications
Economic Development
viii
Redevelopment Agency
Inspections & Standards
Art, Culture & Tourism
City Council
Treasury
City Archives
City Council Office
City Officials As of June 30, 2013
Mayor Angel Taveras
City Council
Ward I -Seth Yurdin Ward 2- Samuel D. Zurier Ward 3- Kevin Jackson
Ward 6- Michael J. Correia Ward 7- John J. Igliozzi
Ward 1 1 - Davian Sanchez Ward 12- Terrence Hassett Ward 13 -Brian Principe Ward 14 - David A. Salvatore Ward 15 - Sabina Matos
Ward 4- Nicholas A. Narducci Ward 5 - Michael A. Solomon
Ward 8 - Wilbur W. Jennings, Jr. Ward 9- Carmen Castillo Ward I 0 - Luis A. Aponte
Department Directors
Chief Engineer/GM of Water Supply Chief of Fire Department Chief of Police Department Chief of Staff City Clerk City Controller City Solicitor City Treasurer Director of Administration Director of Arts, Culture, and Tourism Director of Emergency Management Director of Finance Director oflnformation Technology Director of Inspections and Standards Director of Operations Director of Personnel Director of Planning and Development Director of Public Works Director of Telecommunications Internal Auditor Recorder of Deeds Registrar of Vital Statistics Superintendent of Parks and Recreation Superintendent of Schools Tax Assessor Tax Collector Traffic Engineer
ix
Boyce Spinelli Michael Dillon, Acting Col. Hugh Clements, Jr. Michael D 'Amico, Acting Anna Stetson Michael D ' Antuono Jeffrey Padwa, Esq. James Lombardi, III Michael D'Amico Lynne McCormack Col. Peter Gaynor (ret) Michael Pearis James Silveria Jeff Lykins Alan Sepe Sybil Bailey Ruben Flores-Marzan William Bombard, Acting William Trinque Matthew M . Clarkin, Jr. John Murphy Serena Conley Robert McMahon Dr. Susan Lusi David L. Quinn John Murphy William Bombard
Government Finance Officers Association
Certificate of Achievement for Excellence
in Financial Reporting
Presented to
City of Providence
Rhode Island
For its Comprehensive Annual Financial Report
for the Fiscal Year Ended
June 30,2012
Executive Director/CEO
X
I CITY OF PROVIDENCE I FINANCIAL SECTION
• REPORT OF INDEPENDENT AUDITORS • MANAGEMENT'S DISCUSSION AND ANALYSIS • BASIC FINANCIAL STATEMENTS • SUPPLEMENTARY INFORMATION
& Braver" I Accountants & Advi sors
To the Honorable Mayor and Members of the City Council Providence, Rhode Island
REPORT OF INDEPENDENT AUDITORS
Report on the Financial Statements
We have audited the accompanying financial statements of the governmental activities, the business-type activities, each major fund, and the aggregate remaining fund information of the City of Providence, Rhode Island, as of and for the year ended June 30, 2013, and the related notes to the financial statements which collectively comprise the City' s basic financial statements as listed in the table of contents.
Management's Responsibility for the Financial Statements
Management is responsible for the preparation and fair presentation of these financial statements in accordance with accounting principles generally accepted in the United States of America; this includes the design, implementation, and maintenance of internal control relevant to the preparation and fair presentation of financial statements that are free from material misstatement, whether due to fraud or error.
Auditors' Responsibility
Our responsibility is to express opinions on these financial statements based on our audit. We conducted our audit in accordance with auditing standards generally accepted in the United States of America and the standards applicable to financial audits contained in Government Auditing Standards, issued by the Comptroller General of the United States. Those standards require that we plan and perform the audit to obtain reasonable assurance about whether the financial statements are free from material misstatement.
An audit involves performing procedures to obtain audit evidence about the amounts and disclosures in the financ ial statements. The procedures selected depend on the auditors' judgment, including the assessment of the risks of material misstatement of the financial statements, whether due to fraud or error. In making those risk assessments, the auditor considers internal control relevant to the entity ' s preparation and fair presentation of the financial statements in order to design audit procedures that are appropriate in the circumstances, but not for the purpose of expressing an opinion on the effectiveness of the entity's internal control. Accordingly, we express no such opinion. An audit also includes evaluating the appropriateness of accounting policies used and the reasonableness of significant accounting estimates made by management, as well as evaluating the overall presentation of the financial statements.
We believe that the audit evidence we have obtained is sufficient and appropriate to provide a basis for our audit opinions.
Opinions
In our opinion, the financial statements referred to above present fairly, in all material respects, the respective financial position of the governmental activities, the business-type activities, each major fund, and the aggregate remaining fund information of the City of Providence, Rhode Island, as of June 30, 2013, and the respective changes in financial position, and, where applicable, cash flows thereof for the year then ended in accordance with accounting principles generally accepted in the United States of America.
Needham
Taunton
155 South Main Street, Suite 100, Providence. Rl 02903 T401.421.2710 F401.274.5230 www.thebravergroup.com Providence
Other Matters
Required Supplementary Information
Accounting principles generally accepted in the United States of America require that the Management's Discussion and Analysis, budgetary comparison information, and Schedules of Funding Progress on Pages 3-ll, Pages 56-62 and Page 63, respectively, be presented to supplement the basic financial statements. Such information, although not a part of the basic financial statements, is required by the Governmental Accounting Standards Board, who considers it to be an essential part of financial reporting for placing the basic financial statements in an appropriate operational, economic, or historical context. We have applied certain limited procedures to the required supplementary information in accordance with auditing standards generally accepted in the United States of America, which consisted of inquiries of management about the methods of preparing the information and comparing the information for consistency with management's responses to our inquiries, the basic financial statements, and other knowledge we obtained during our audit of the basic financial statements. We do not express an opinion or provide any assurance on the information because the limited procedures do not provide us with sufficient evidence to express an opinion or provide any assurance.
Other Information
Our audit was conducted for the purpose of forming opinions on the financial statements that collectively comprise the City of Providence, Rhode Island's basic financial statements. The introductory section and the accompanying financial information listed as supplemental schedules in the table of contents are presented for purposes of additional analysis and are not a required part of the basic financial statements.
The combining fund financial statements and capital assets schedules are the responsibility of management and were derived from and relate d irectly to the underlying accounting and other records used to prepare the financial statements. The information has been subjected to the auditing procedures app lied in the audit of the financial statements and certain additional procedures, including comparing and reconciling such information directly to the underlying accounting and other records used to prepare· the financial statements or to the financial statements themselves, and other additional procedures in accordance with auditing standards generally accepted in the United States of America, In our opinion, the information is fairly stated in all material respects in relation to the financial statements taken as a whole. The introductory section and statistical sections have not been subjected to the auditing procedures applied in the audit of the basic financial statements and, accordingly, we express no opinion on them.
Other Reporting Required by Government Auditing Standards
In accordance with Government Auditing Standards, we have also issued our report dated December 31,2013, on our consideration of the City's internal control over financial reporting and on our tests of its compliance with certain provisions of laws, regulations, contracts, grant agreements and other matters. The purpose of that report is to describe the scope of our testing of internal control over financial reporting and compliance and the results of that testing, and not to provide an opinion on the internal control over financial reporting or on compliance. That report is an integral part of an audit performed in accordance with Government Auditing Standards in considering the City of Providence, Rhode Island's internal control over financial reporting and compliance.
Providence, Rhode Island December 31, 20 13
2
CITY OF PROVIDENCE, RHODE ISLAND MANAGEMENT'S DISCUSSION AND ANALYSIS
JUNE 30,2013
This Management's Discussion and Analysis of the City of Providence, Rhode Island 's Basic Financial Statements provides a narrative overview and analysis of the financial activities of the City for the fiscal year ended June 30, 2013.
Financial Highlights- Primary Government
Government- Wide Highlights
Net Position- The liabilities of the City's governmental activities exceeded its assets for the fiscal year ending June 30, 2013 by $146.3 million (presented as "total net position"). Of this amount, a negative of $263.7 million was reported as " unrestricted.' The net investment in capital assets was $117.4 million. The assets of the City 's business-type activities exceed its liabilities by $258.7 million. Of this amount, $217.2 million represents the City's net investment in capital assets.
Change in Net Position- The City's total net position decreased by $5.3 million in fiscal year 2013. Net position of governmental activities decreased by $7.8 million, while net position of business-type activities increased by $13.1 million.
Fund Highlights
Governmental Funds - Fund Balances - As of June 30, 2013, the City's governmental funds reported a combined ending fund balance of$91.4 million, a $38.9 million increase from the prior year. Ofthe total fund balance reported, a negative $9.8 million represents "unassigned fund balance".
Long-Term Obligations
The City's total long-term obligations related to its government activities had a net increase of $42.8 million during the current fiscal year.
The total long-term obligations of the City's proprietary activities increased $.02 million during the current fiscal year.
Overview of the Financial Statements
This discussion and analysis is intended to serve as an introduction to the City of Providence's basic financial statements. The City's basic financials statements include three components: I) government- wide financial statements, 2) fund financial statements, and 3) notes to the financial statements. This report also contains additional supplementary information (budget schedules) and other supplementary information (combining financial statements). These components are described in this next section of this analysis.
Basic Financial Statements
The basic financial statements include two types of statements that present different views of the City's financial information. These statements are the Government-Wide and the Fund Financial statements. These financial statements are accompanied by Notes to the financial Statements, which provide detailed information about financial statement items.
3

CITY OF PROVIDENCE, RHODE ISLAND MANAGEMENT'S DISCUSSION AND ANALYSIS
JUNE 30,2013
Government-Wide Financial Statements
The government-wide financial statements provide a broad view of the city's operations in a manner similar to a business operating in the private sector. The statements provide short-term and long-term information about the City' s financial position, which assists in assessing the City's economic condition at the end of the fiscal year. These are prepared using the flow of economic resources measurement focus and the accrual basis of accounting. This basically means they follow methods that are similar to those used by most businesses. They take into account all revenues and expenses connected with the fiscal year even if cash involved has not been received or paid. The government-wide financial statements include two statements:
• The Statement of Net Positon presents all of the government's assets and liabilities, with the difference between the two reported as " net position." Over time, increases or decreases in the City's net position may serve as a useful indicator of whether the financial position of the City is improving or deteriorating.
• The Statement of Activities presents information showing how the government's net position changed during the fiscal year. All changes in net position are reported, as soon as, the underlying event giving rise to the change occurs, regardless of the timing of related cash flows. Thus, revenues and expense are reported in this statement for some items that will not result in cash flows until future fiscal periods (such as, uncollected taxes and earned, but unused vacation leave). This statement also presents a comparison between direct expenses and program revenues for each function of the City.
Both of the above financial statements have separate sections for two different types of the City's programs or activities . These activities are defined below:
• Governmental Activities - The activities in this section are supported mostly by tax revenues and intergovernmental revenues (federal and state grants). Most services normally associated with City government fall into this category, including the executive, legislative and judicial, financial administration, human resources, public safety, building inspections, public works, recreation, parks, schools, public property, planning, other general government, judgment and claims, retirement costs, debt service, and other employee benefits.
• Business-Type Activities - These functions normally are intended to recover all or a significant portion of their costs through user fees and charges to external users of goods and services. The City's business-type activities include the operations of the Water Supply Board and The Providence Public Building Authority . The City does not have any discretely presented component units .
Fund Financial Statements
A fund is a grouping of related accounts that is used to maintain control over resources that have been segregated for specific activities or objectives. Like other local Governments, the City uses fund accounting to ensure and demonstrate compliance with finance-regu lated legal requirements.
The fund financial statements focus on individual parts of the City government, reporting the City's operations in more detail than the government-wide statements. All of the funds of the City can be divided into three categories. It is important to note that these fund categories use different accounting approaches and should be interpreted differently. The three categories of funds are described below:
4

CITY OF PROVIDENCE, RHODE ISLAND MANAGEMENT'S DISCUSSION AND ANALYSIS
JUNE 30, 2013
1. Governmental Fund Financial Statements - Most of the basic services provided by the City are financed through governmental funds. Governmental funds are used to account for essentially the same functions reported as governmental activities in the government-wide financial statements. However, unlike the government-wide financial statements, the governmental fund financial statements focus on near-term inflows and outflows of spendable recourses. They also focus on the balances of spendable resources available at the end of the fiscal year. Such information may be useful in evaluation the government's near-term financing requirements. This approach is known as using the flow of current financial resources measurement focus and the modified accrual basis of accounting. These statements provide a detailed, short-term view of the City's finances that assists in determining whether there will be adequate financial resources available to meet the current needs of the City.
Because the focus of governmental funds is narrower than that of the government-wide financial statements, it is useful to compare the information presented for governmental funds with similar information presented for governmental activities in the government-side financial statements. By doing so, readers may better understand the long-term impact of the government's near-term financing decisions. Both the governmental fund balance sheet and fund statement of revenues, expenditures and changes in fund balances provide a reconciliation to facilitate this comparison between governmental funds and the governmental activities. These reconciliations are presented on the page immediately following each governmental fund financial statement.
The City has four governmental funds considered to be major funds for financial statement presentation. That is, each major fund is presented in a separate column in the governmental fund balance sheet and governmental fund statement of revenues, expenditures, and changes in fund balances. The City's four major governmental funds are comprised of the following: (I) the General Fund, (2) the School Fund, (3) the School Grant Fund, and ( 4) the Capital Projects Fund. All nonmajor governmental funds are presented in single column. The basic governmental fund financial statements can be found immediately following the government-wide statements.
2. Proprietary Fund Financial Statements - These funds are used to show activities that operate more like those of commercial enterprises. Because these funds charge fees for services provided to outside customer, including local governments, which are known as enterprise funds. Proprietary funds provide that same type of information as the government-wide financial statement, only in more detail. Like the government-wide financial statements, proprietary fund financial statements use the accrual basis of accounting. There is no reconciliation needed between the government-wide financial statements for business-type activities and proprietary fund financial statements. The City has two major enterprise funds: The Water Supply Board and the Providence Public Buildings Authority. Financial statements for the Providence Public Buildings Authority may be obtained from the City of Providence Finance Department.
The Internal Service Fund is maintained to account for the self-insured health claims and potential legal claims of the City.
The basic proprietary fund financial statements can be found immediately following the governmental fund financial statements.
5
CITY OF PROVIDENCE, RHODE ISLAND MANAGEMENT'S DISCUSSION AND ANALYSIS
JUNE 30, 2013
3. Fiduciary Fund Financial Statements - These funds are used to account for resources held for the benefit of parties outside the City government. Fiduciary funds are not reflected in the governmentwide financial statements because the resources of these funds are not available to support the City ' s own programs. The accounting used for fiduciary funds is similar to that used for proprietary funds . They use the accrual basis of accounting.
The City ' s fiduciary funds are the Employee Retirement Fund, various Private-Purpose Trust Funds, and Agency Funds.
The fiduciary financial statements can be found immediately following the proprietary fund financial statements.
Notes to the Financial Statements
The notes provide additional information that is essential to a full understanding of the data provided in the government-wide and the fund basis financial statements. The notes to the financial statements can be found immediately following the fiduciary fund financial statements.
Required Supplementary Information
The basic financial statements are followed by a section of required supplementary information. This section includes budgetary comparison schedules for the general and school funds - the only governmental funds for which legal budgets are adopted annually. In fiscal year 2013 , there were no significant modifications to the budgets originally adopted for each fund .
Other Supplementary Information
Combining Financial Statements and Schedules
Combining financial statements are presented for nonmajor governmental funds and combining schedules are presented by individual grant within the school department. These are presented following the required supplementary information. The total columns of these combining financial statements and schedules are presented in the applicable fund financial statement.
6
CITY OF PROVIDENCE, RHODE ISLAND MANAGEMENT'S DISCUSSION AND ANALYSIS
JUNE 30, 2013
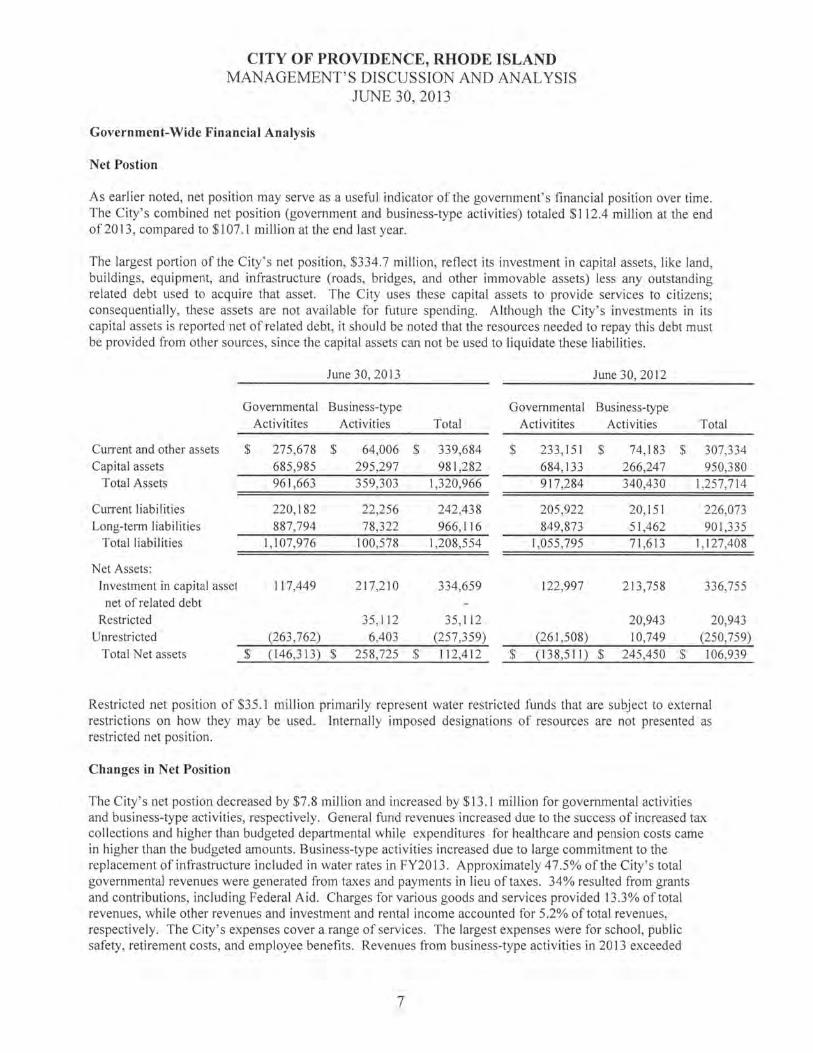
Government-Wide Financial Analysis
Net Postion
As earlier noted, net position may serve as a useful indicator of the government' s financial position over time. The City' s combined net position (government and business-type activities) totaled $112.4 million at the end of2013 , compared to $107.1 million at the end last year.
The largest portion of the City ' s net position, $334.7 million, reflect its investment in capital assets, like land, buildings, equipment, and infrastructure (roads, bridges, and other immovable assets) less any outstanding related debt used to acquire that asset. The City uses these capital assets to provide services to citizens; consequentially, these assets are not available for future spending. Although the City ' s investments in its capital assets is reported net of related debt, it should be noted that the resources needed to repay this debt must be provided from other sources, since the capital assets can not be used to liquidate these liabilities.
Current and other assets Capital assets
Total Assets
Current liabilities Long-term liabilities
Total liabilities
Net Assets: Investment in capital asse1
net of related debt Restricted
Unrestricted Total Net assets
June 30,2013
Governmental Business-type
$
$
Activitites
275,678 $ 685 ,985 961 ,663
220,182 887,794
1,107,976
117,449
(263,762) (146,313) $
Activities
64,006 $ 295,297 359,303
22,256 78,322
100,578
217,210
35,112 6,403
258,725 $
Total
339,684 981 ,282
1,320,966
242,438 966,116
1,208,554
334,659
35 ,112 (257,359) 112,412
June 30, 2012
Governmental Business-type
$
$
Activitites
233,151 684,133 917,284
205,922 849,873
1,055,795
122,997
(261 ,508)
$
(138,511) $
Activities
74,183 $ 266,247 340,430
20,151 51 ,462 71 ,613
213 ,758
20,943 10,749
245 ,450 $
Total
307,334 950,380
1,257,714
226,073 901 ,335
I, 127,408
336,755
20,943 (250,759) 106,939
Restricted net position of $35 .1 million primarily represent water restricted funds that are subject to external restrictions on how they may be used. Internally imposed designations of resources are not presented as restricted net position.
Changes in Net Position
The City's net postion decreased by $7.8 million and increased by $13.1 million for governmental activities and business-type activities, respectively. General fund revenues increased due to the success of increased tax collections and higher than budgeted departmental while expenditures for healthcare and pension costs came in higher than the budgeted amounts. Business-type activities increased due to large commitment to the replacement of infrastructure included in water rates in FY2013 . Approximately 47 .5% ofthe City ' s total governmental revenues were generated from taxes and payments in lieu of taxes . 34% resulted from grants and contributions, including Federal Aid. Charges for various goods and services provided 13.3% of total revenues, while other revenues and investment and rental income accounted for 5.2% of total revenues, respectively. The City ' s expenses cover a range of services. The largest expenses were for school, public safety, retirement costs, and employee benefits. Revenues from business-type activities in 2013 exceeded
7
CITY OF PROVIDENCE, RHODE ISLAND MANAGEMENT'S DISCUSSION AND ANALYSIS
JUNE 30, 2013
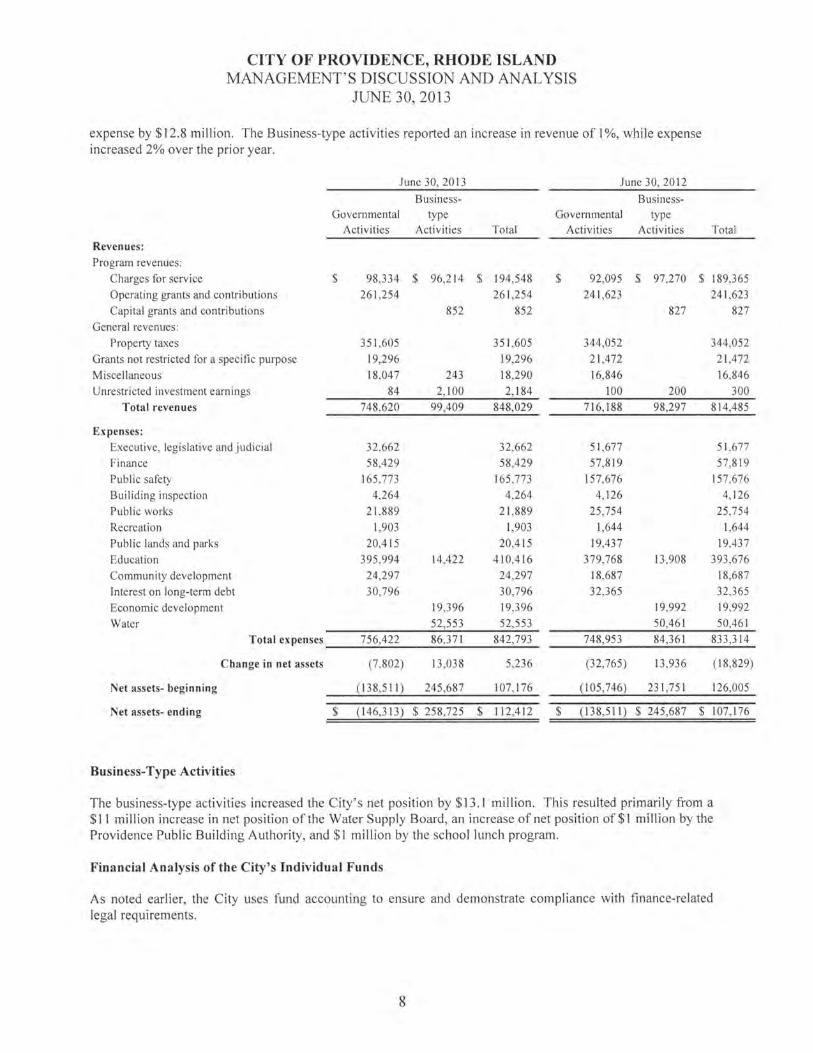
expense by $12.8 million . The Business-type activities reported an increase in revenue of I%, while expense increased 2% over the prior year.
June 30,2013 June 30, 2012
Business- Business-Governmental type Governmental type
Activities Activities Total Activities Activities Total
Revenues:
Program revenues:
Charges for service $ 98,334 $ 96,214 $ 194,548 $ 92,095 $ 97,270 $ 189,365
Operating grants and contributions 261 ,254 261,254 241,623 241,623
Capital grants and contributions 852 852 827 827
General revenues:
Property taxes 351 ,605 351,605 344,052 344,052
Grants not restricted for a speci fie purpose 19,296 19,296 21 ,472 21 ,472
Miscellaneous 18,047 243 18,290 16,846 16,846
Unrestricted investment earnings 84 2, 100 2,184 100 200 300
Total revenues 748,620 99,409 848,029 716,188 98,297 814,485
Expenses:
Executive, legislati ve and judicial 32,662 32,662 51,677 51 ,677
Finance 58,429 58,429 57,819 57,819
Public safety 165 ,773 165,773 I 57,676 157,676
Builiding inspection 4,264 4,264 4,126 4, 126
Public works 21 ,889 21 ,889 25 ,754 25 ,754
Recreation 1,903 1,903 1,644 1,644
Public lands and parks 20,415 20,415 19,437 19,437
Education 395,994 14,422 410,416 379,768 13,908 393,676
Community development 24,297 24,297 18,687 18,687
Interest on long-term debt 30,796 30,796 32,365 32,365
Economic development 19,396 19,396 19,992 19,992
Water 52,553 52,553 50,461 50,461
Total expenses 756,422 86,371 842,793 748,953 84,361 833 ,3 14
Change in net assets (7 ,802) 13 ,038 5,236 (32,765) 13 ,936 ( 18,829)
Net assets- beginning (138,511) 245 ,687 107, 176 (I 05 ,746) 231,75 I 126,005
Net assets- ending $ ( 146,313) $ 258,725 $ 112,412 $ (138,511) $ 245 ,687 $ 107, 176
Business-Type Activities
The business-type activities increased the City's net position by $13 .1 million. This resulted primarily from a $11 million increase in net position of the Water Supply Board, an increase of net position of$! million by the Providence Public Building Authority, and $1 million by the school lunch program.
Financial Analysis of the City's Individual Funds
As noted earlier, the City uses fund accounting to ensure and demonstrate compliance with finance-related legal requirements.
8
Governmental Funds
CITY OF PROVIDENCE, RHODE ISLAND MANAGEMENT'S DISCUSSION AND ANALYSIS
JUNE 30, 2013
The focus of the City's governmental funds is to provide information on near-term inflows, outflows, and balances of spendable resources. Such information is useful in assessing the City ' s financing requirements . In particular, unassigned fund balance may serve as a useful measure of a government's net resources available for spending at the end of the fiscal year.
The general fund is the chief operating fund of the City. At the end of the current fiscal year, unassigned fund balance of the general fund was a negative $9 .8 million, an increase of 1.6 million from 11.4 million the prior year. The increase in fund balance is due to increased tax collections and higher than budgeted departmental revenues. As a measure of the general funds ' liquidity, it may be useful to compare both unassigned fund balance and total fund balance.
School Grants-Fund Balance - The school grant funds account for federal and state grants received and expended by the school system. The fiscal year 2013 school grants fund balance is reported at $1.99 million, a $.2 million decrease from fiscal year 2012. The inclusion of all state aid in fiscal 2013 was included in the School ' s general fund and excluded from the school grants fund.
School Fund - The school fund ended the year with a $0 fund balance in accordance with City charter regulations. The expenditures were $337.9 million as compared to $320.4 million in the prior year. The inclusion of all state aid in fiscal 2013 was included in the School's general fund and excluded in the school grants fund .
Capital Projects Fund-Fund Balance - The capital projects fund accounts for resources to be used for the acquisition or construction of capital assets for housing and community improvement activities in the City, other than those financed by proprietary funds. The fiscal year 2013 capital projects fund balance is $39.6 million. The $38 .63 million increase from fiscal year 2012 is attributable most notably to the $40 Million Road Bond Paving Initiative.
Proprietary Funds
The City ' s proprietary funds provide the same type of information found in the government-wide financial statements, but in more detail. As discussed in the business-type activities above, the City's proprietary net position increased by $13 million as a result of operations in the individual enterprise funds. This resulted primarily from a $11 million increase in net position of the Water Supply Board, an increase of net position of $1 million by the Providence Public Building Authority, and $1 million by the school lunch program.
General Fund Budgetary Highlights
The general fund incurred an uncombined surplus in FY 2013 of $1.9 million. This will increase the cumulative uncombined general fund balance to a negative $17 .9 million. The new GASB 54 requirement for combining funds shows a cumulative general fund balance as a negative $9.8 million. Total general fund revenues and transfers for the fiscal year were $449.8 million and total general fund expenditures and transfers for the fiscal year were $447.9 million.
Further details of favorable and unfavorable variances of revenue and expense items can be found in the Required Supplementary Information on pages 56 to 60 of the Comprehensive Annual Financial Report.
9
CITY OF PROVIDENCE, RHODE ISLAND MANAGEMENT'S DISCUSSION AND ANALYSIS
JUNE 30, 2013
Capital Asset and Debt Administration
Capital Assets (Note 5 to the Basic Financial Statements)
June 30, 2013 Governmental Business-type Governmental
Activitites Activities Total Activitites
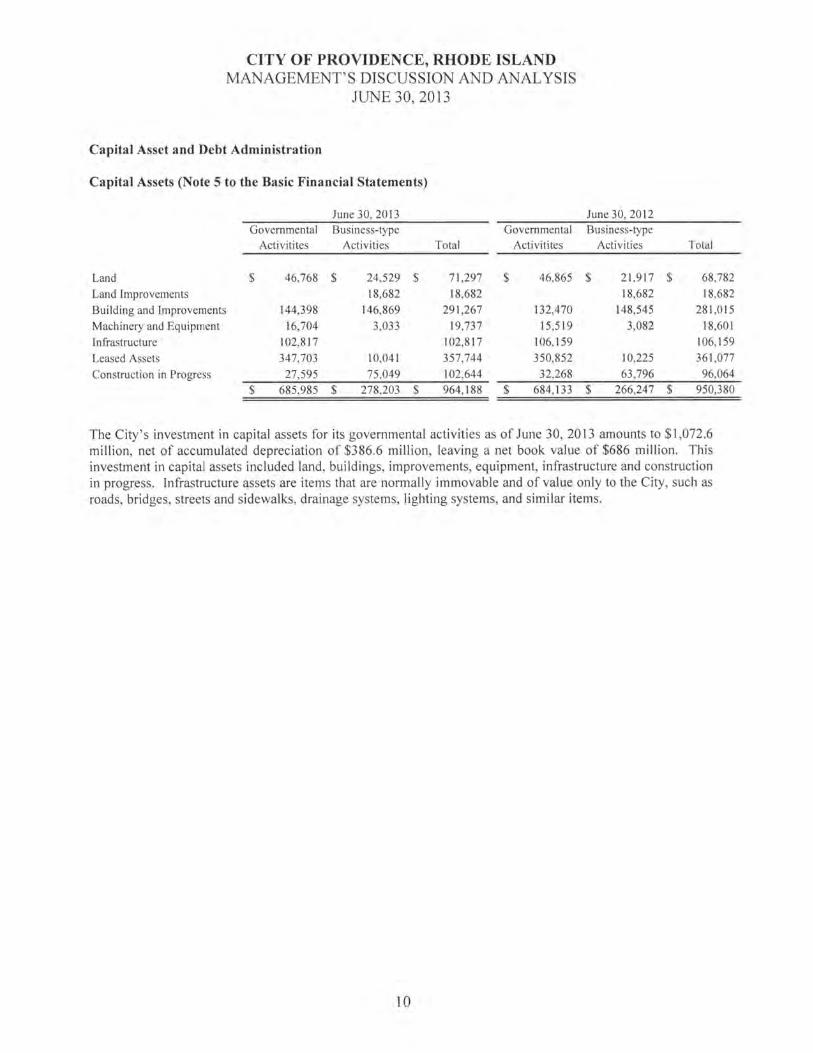
Land $ 46,768 $ 24,529 $ 71 ,297 $ 46,865
Land Improvements 18,682 18,682
Building and Improvements 144,398 146,869 291 ,267 132,470
Machinery and Equipment 16,704 3,033 19,737 15,519
Infrastructure 102,817 102,817 106, 159
Leased Assets 347,703 10,041 357,744 350,852
Construction in Progress 27,595 75 ,049 102,644 32,268
$ 685,985 $ 278,203 $ 964, 188 $ 684, 133
June 30, 2012 Business-type
Activities Total
$ 21 ,917 $ 68,782
18,682 18,682
148,545 281,015
3,082 18,601
106, 159
10,225 361 ,077
63 ,796 96,064
$ 266,247 $ 950,380
The City's investment in capital assets for its governmental activities as of June 30, 2013 amounts to $1,072.6 million, net of accumulated depreciation of $386.6 million, leaving a net book value of $686 million. This investment in capital assets included land, buildings, improvements, equipment, infrastructure and construction in progress. Infrastructure assets are items that are normally immovable and of value only to the City, such as roads, bridges, streets and sidewalks, drainage systems, lighting systems, and similar items.
10
Debt Administration
CITY OF PROVIDENCE, RHODE ISLAND MANAGEMENT'S DISCUSSION AND ANALYSIS
JUNE 30,2013
June 30, 2013
Governmental Business-type Governmental
June 30, 2012
Business-type Activitites Activities Total Activitites Activities Total
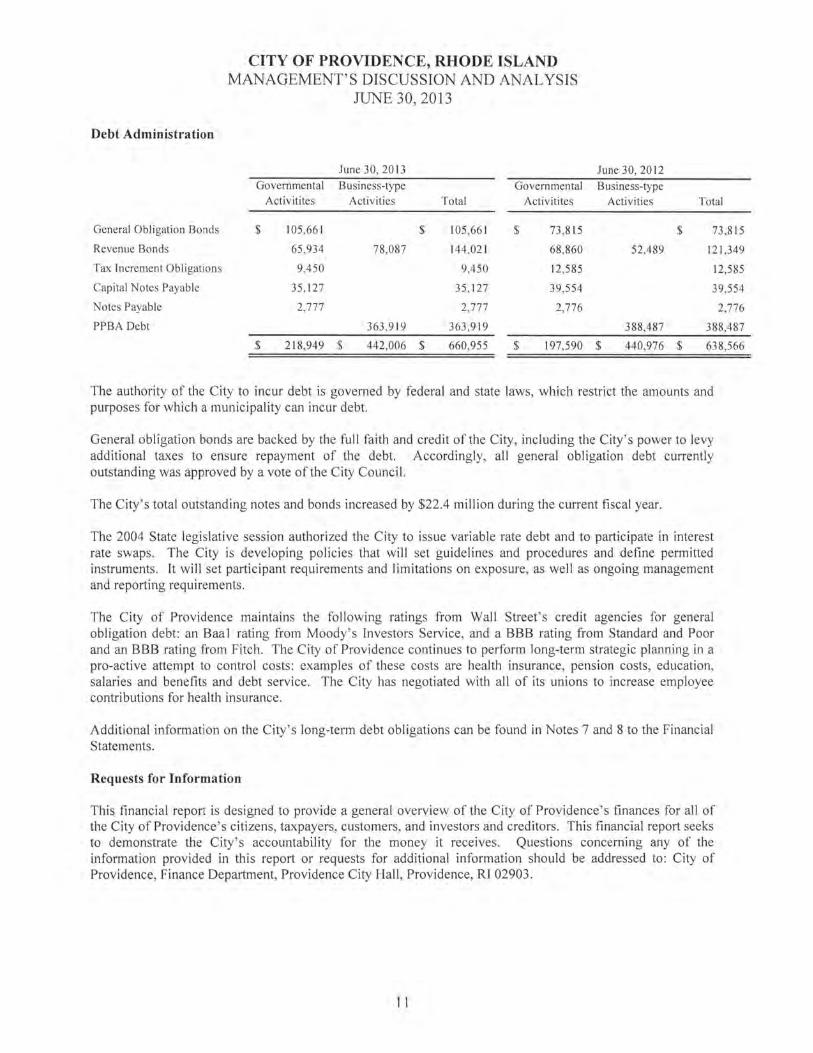
General Obligation Bonds $ 105,66 1 $ 105 ,66 1 $ 73 ,815 $ 73,815
Revenue Bonds 65 ,934 78 ,087 144,021 68 ,860 52,489 121,349
Tax Increment Obligations 9,450 9,450 12,585 12,585
Capital Notes Payable 35, 127 35, 127 39,554 39,554
Notes Payable 2,777 2,777 2,776 2,776
PPBA Debt 363 ,919 363 ,919 388,487 388,487
$ 218,949 $ 442,006 $ 660,955 $ 197,590 $ 440,976 $ 638,566
The authority of the City to incur debt is governed by federal and state laws, which restrict the amounts and purposes for which a municipality can incur debt.
General obligation bonds are backed by the full faith and credit of the City, including the City's power to levy additional taxes to ensure repayment of the debt. Accordingly, all general obligation debt currently outstanding was approved by a vote of the City Council.
The City's total outstanding notes and bonds increased by $22.4 million during the current fiscal year.
The 2004 State legislative session authorized the City to issue variable rate debt and to participate in interest rate swaps. The City is developing policies that will set guidelines and procedures and define permitted instruments. It will set participant requirements and limitations on exposure, as well as ongoing management and reporting requirements.
The City of Providence maintains the following ratings from Wall Street's credit agencies for general obligation debt: an Baal rating from Moody's Investors Service, and a BBB rating from Standard and Poor and an BBB rating from Fitch. The City of Providence continues to perform long-term strategic planning in a pro-active attempt to control costs: examples of these costs are health insurance, pension costs, education, salaries and benefits and debt service. The City has negotiated with all of its unions to increase employee contributions for health insurance.
Additional information on the City's long-term debt obligations can be found in Notes 7 and 8 to the Financial Statements.
Requests for Information
This financial report is designed to provide a general overview of the City of Providence's finances for all of the City of Providence's citizens, taxpayers, customers, and investors and creditors. This financial report seeks to demonstrate the City's accountability for the money it receives. Questions concerning any of the information provided in this report or requests for additional information should be addressed to: City of Providence, Finance Department, Providence City Hall , Providence, RI 02903.
11

I CITY OF PROVIDENCE
I
BASIC FINANCIAL STATEMENTS
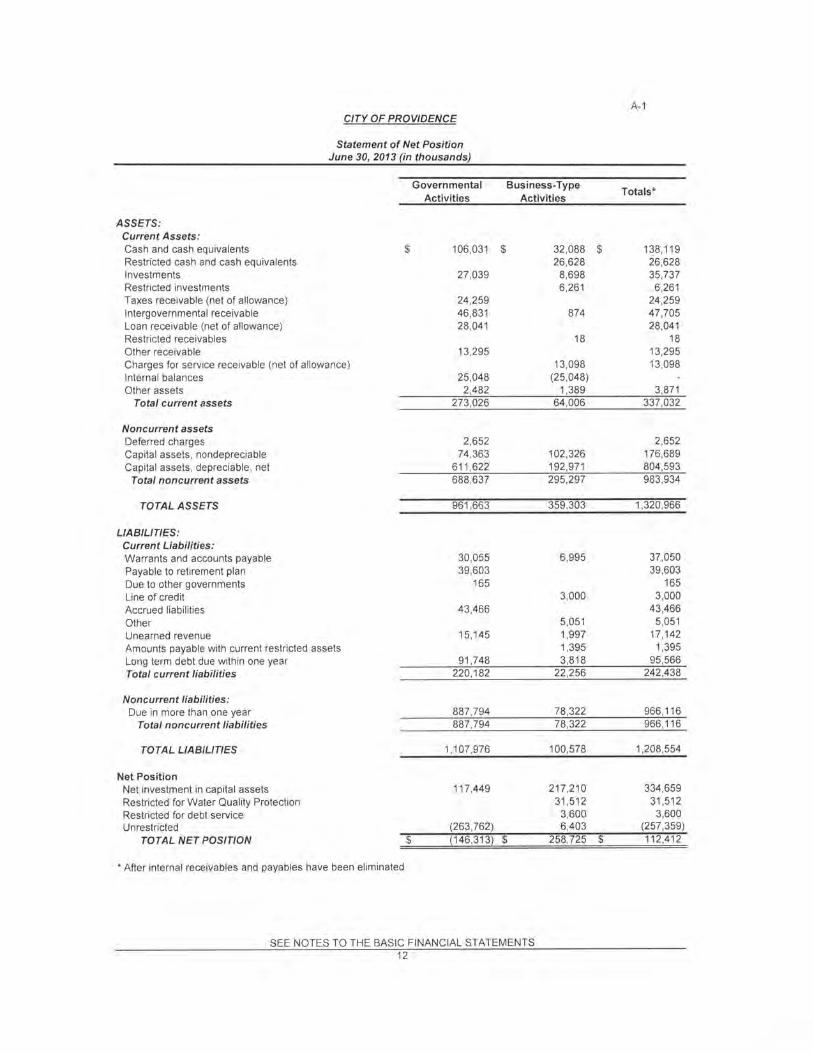
A-1 CITY OF PROVIDENCE
Statement of Net Position June 30, 2013 (in thousands)
Governmental Business-Type Totals*
Activities Activities
ASSETS: Current Assets: Cash and cash equivalents $ 106,031 $ 32,088 $ 138,119 Restricted cash and cash equivalents 26 ,628 26,628 Investments 27 ,039 8,698 35,737 Restricted investments 6,261 6,261 Taxes receivable (net of allowance) 24,259 24,259 Intergovernmental receivable 46,831 874 47,705 Loan receivable (net of allowance) 28,041 28 ,041 Restricted receivables 18 18 Other receivable 13,295 13,295 Charges for service receivable (net of allowance) 13,098 13,098 Internal balances 25 ,048 (25 ,048) Other assets 2,482 1,389 3,871
Total current assets 273,026 64 ,006 337,032
Noncurrent assets Deferred charges 2,652 2,652 Capital assets , nondepreciable 74 ,363 102,326 176,689 Capital assets , depreciable , net 611 ,622 192,971 804,593
Total noncurrent assets 688,637 295,297 983,934
TOTAL ASSETS 961 ,663 359,303 1,320,966
LIABILITIES: Current Liabilities: Warrants and accounts payable 30 ,055 6,995 37 ,050 Payable to retirement plan 39 ,603 39,603 Due to other governments 165 165 Line of credit 3,000 3,000 Accrued liabilities 43,466 43 ,466 Other 5,051 5,051 Unearned revenue 15,145 1,997 17,142 Amounts payable with current restricted assets 1,395 1,395 Long term debt due within one year 91 ,748 3,818 95 ,566 Total current liabilities 220,182 22,256 242,438
Noncurrent liabilities: Due in more than one year 887 ,794 78,322 966,116
Total noncurrent liabilities 887,794 78 ,322 966,116
TOTAL LIABILITIES 1,107,976 100,578 1,208,554
Net Position Net investment in capital assets 117,449 217,210 334,659 Restricted for Water Quality Protection 31 ,512 31 ,512 Restricted for debt service 3,600 3,600 Unrestricted (263 ,762) 6,403 (257,359)
TOTAL NET POSITION $ (146,313) $ 258,725 $ 112,412
*After internal receivables and payables have been eliminated
SEE NOTES TO THE BASIC FINANCIAL STATEMENTS 12
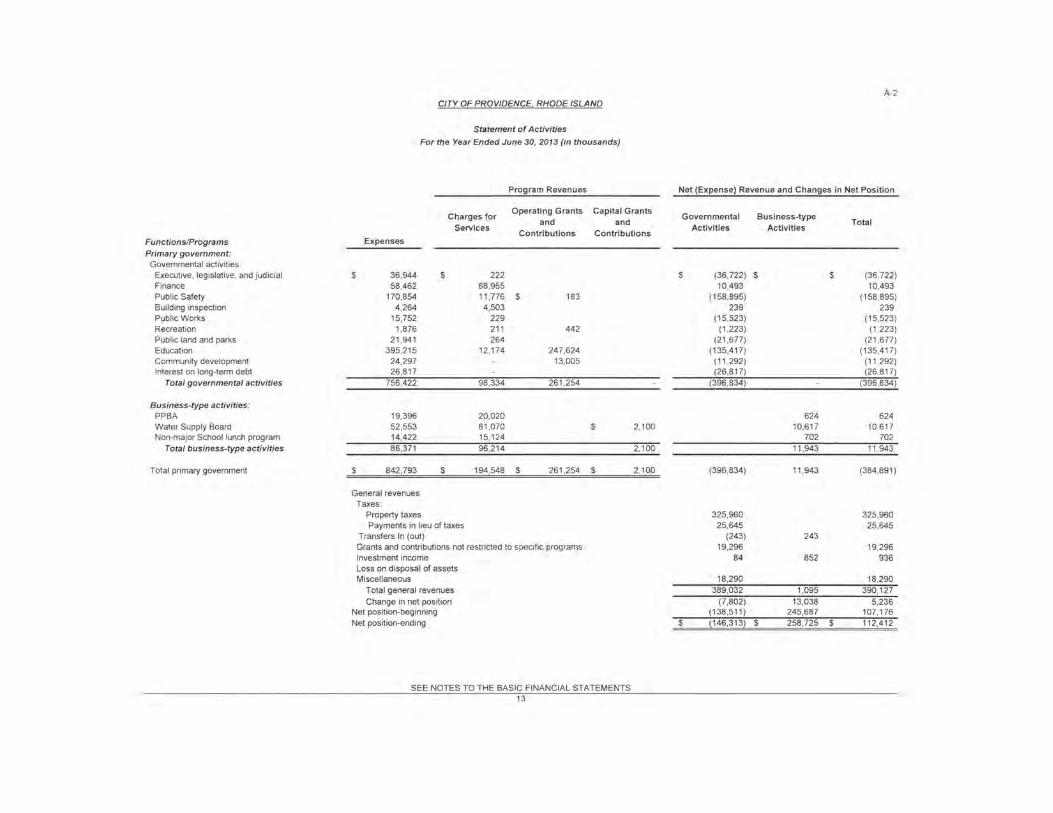
A-2 CITY OF PROVIDENCE, RHODE ISLAND
Statement of Activit ies
For the Year Ended June 30, 201 3 (in thousands)
Program Revenues Net (Expense) Revenue and Changes in Net Position
Charges for Operat ing Grants Capita l Grants
Governmental Business-type and and Total
Services Contributions Contributions
Activ it ies Activ it ies
Functions/Programs Expenses
Primary government: Governmental activities :
Executive, legislative, and judicial $ 36,944 $ 222 $ (36,722) $ $ (36 ,722) Finance 58,462 68,955 10,493 10,493 Public Safety 170,854 11 ,776 $ 183 (158,895) (158,895) Building inspection 4,264 4,503 239 239 Public Works 15,752 229 (15 ,523) (15,523) Recreation 1,876 211 442 (1 ,223) (1 ,223) Public land and parks 21 ,941 264 (21 ,677) (21 ,677) Education 395,215 12,174 247,624 (135,417) (135,417) Community development 24,297 13,005 (11 ,292) (11 ,292) Interest on long-term debt 26,817 (26,817) (26,817)
Total governmental activities 756,422 98,334 261,254 (396,834) (396,834)
Business-type activities: PPBA 19,396 20,020 624 624 Water Supply Board 52,553 61 ,070 $ 2,100 10,617 10,617 Non-major School lunch program 14,422 15,124 702 702
Total business-type activit ies 86,371 96,214 2,100 11 ,943 11 ,943
Total primary government $ 842,793 $ 194,548 $ 261 ,254 $ 2,100 (396,834) 11 ,943 (384,891)
General revenues Taxes :
Property taxes 325,960 325,960 Payments in lieu of taxes 25,645 25,645
Transfers In (out) (243) 243 Grants and contributions not restricted to specific programs 19,296 19,296 Investment income 84 852 936 Loss on disposal of assets Miscellaneous 18,290 18,290
Total general revenues 389,032 1,095 390,127 Change in net position (7 ,802) 13,038 5,236
Net position-beginning (138,511) 245,687 107,176 Net position-ending $ (146,313) $ 258,725 $ 112,412
SEE NOTES TO THE BASIC FINANCIAL STATEMENTS 13
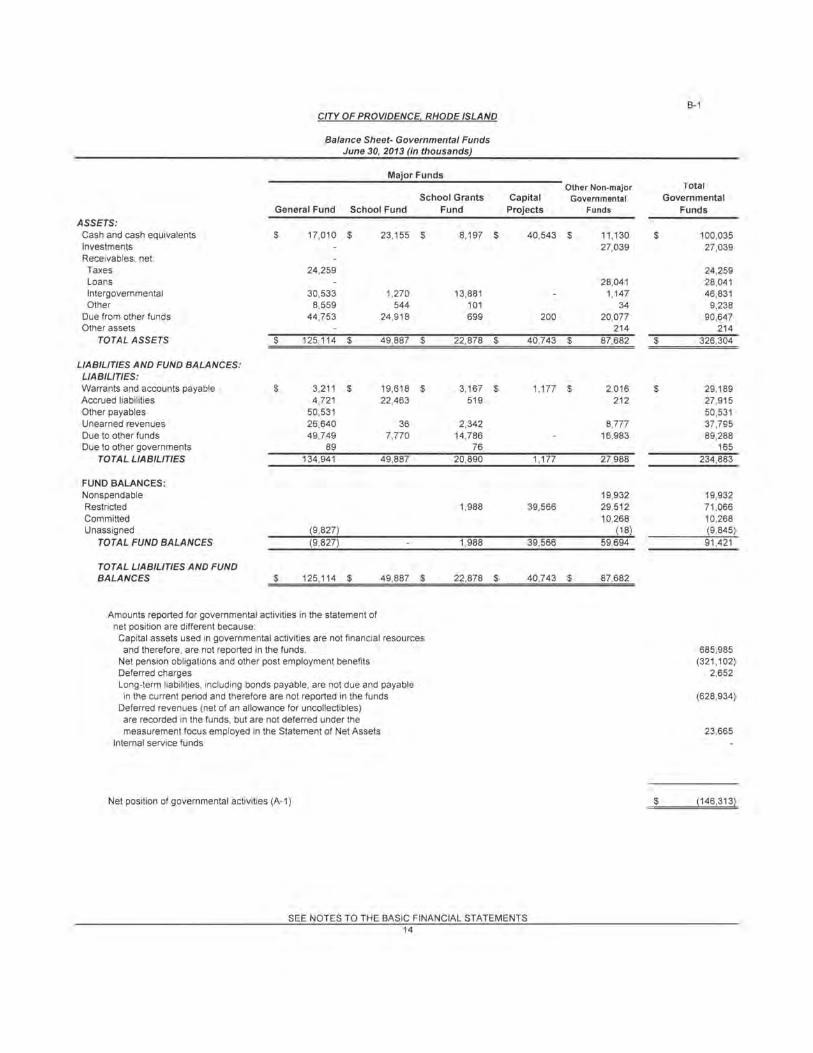
CITY OF PROVIDENCE, RHODE ISLAND
ASSETS: Cash and cash equivalents Investments Receivables, net: Taxes Loans Intergovernmental Other
Due from other funds Other assets
TOTAL ASSETS
LIABILITIES AND FUND BALANCES: LIABILITIES: Warrants and accounts payable Accrued liabilities Other payables Unearned revenues Due to other funds Due to other governments
TOTAL LIABILITIES
FUND BALANCES: Nonspendable Restricted Committed Unassigned
TOTAL FUND BALANCES
Balance Sheet- Governmental Funds June 30, 2013 (in thousands)
Major Funds
School Grants General Fund School Fund Fund
$ 17,010 $ 23,155 $ 8,197 $
24,259
30,533 1,270 13,881 8,559 544 101
44,753 24 ,918 699
$ 125,114 $ 49,887 $ 22,878 $
$ 3,211 $ 19,618 $ 3,167 $ 4,721 22,463 519
50,531 26,640 36 2,342 49,749 7,770 14,786
89 76 134,941 49,887 20,890
1,988
(9,827) (9,827) 1,988
TOTAL LIABILITIES AND FUND BALANCES $ 125,114 $ 49,887 $ 22,878 $
Amounts reported for governmental activities in the statement of net position are different because:
Capital assets used in governmental activities are not financial resources and therefore, are not reported in the funds .
Net pension obligations and other post employment benefits Deferred charges Long-term liabilities, including bonds payable, are not due and payable
in the current period and therefore are not reported in the funds Deferred revenues (net of an allowance for uncollectibles) are recorded in the funds , but are not deferred under the measurement focus employed in the Statement of Net Assets
Internal service funds
Net position of governmental activities (A-1)
Other Non-major Capital Governmenta l
Project s Funds
40,543 $ 11 ,130 27,039
28,041 1,147
34 200 20,077
214 40,743 $ 87,682
1,177 $ 2,016 212
8,777 16,983
1,177 27,988
19,932 39,566 29,512
10,268 (18)
39,566 59,694
40,743 $ 87,682
SEE NOTES TO THE BASIC FINANCIAL STATEMENTS 14
$
$
$
$
B-1
Total Governmental
Funds
100,035 27,039
24,259 28,041 46,831
9,238 90,647
214 326,304
29,189 27,915 50,531 37,795 89,288
165 234 ,883
19,932 71 ,066 10,268 (9,845) 91 ,421
685,985 (321 ,102)
2,652
(628,934)
23,665
(146,313)
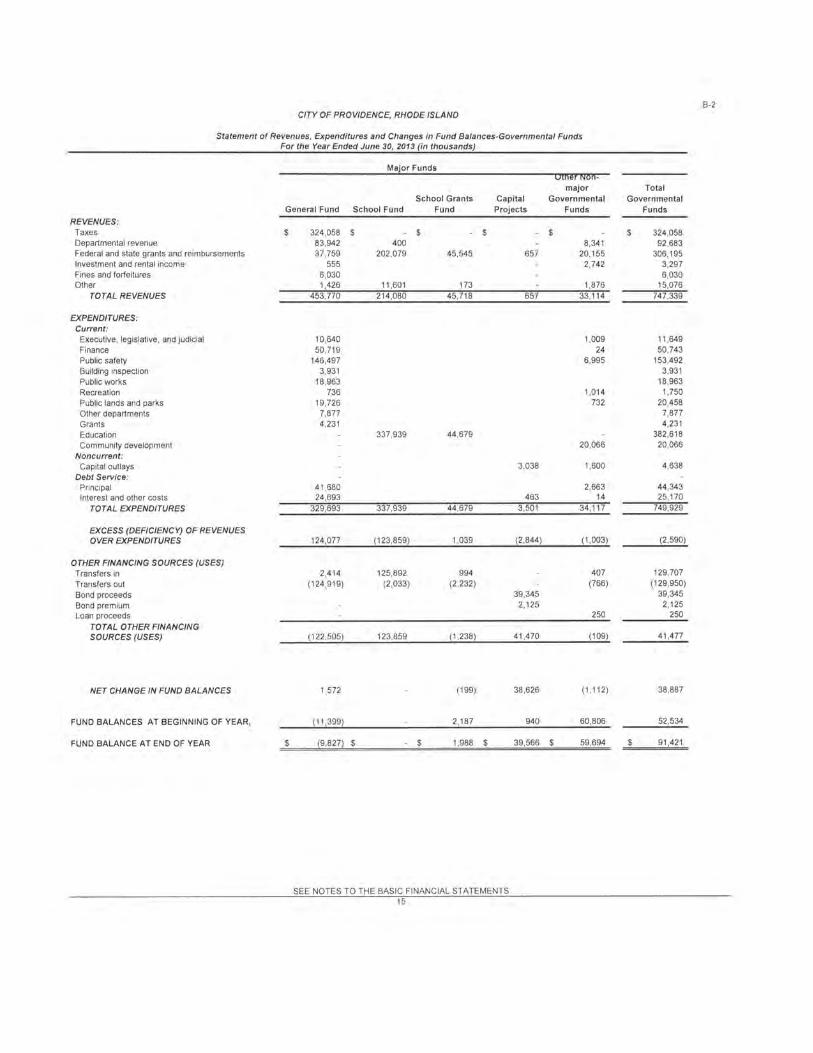
B-2 CITY OF PROVIDENCE, RHODE ISLAND
Statement of Revenues, Expenditures and Changes in Fund Balances-Governmental Funds For the Year Ended June 30, 2013 (in thousands)
Major Funds
major Total School Grants Capital Governmental Governmental
General Fund School Fund Fund Projects Funds Funds
REVENUES: Taxes $ 324,058 $ $ $ $ $ 324,058 Departmental revenue 83,942 400 8,341 92,683 Federal and state grants and reimbursements 37,759 202,079 45,545 657 20,155 306,195 Investment and rental income 555 2,742 3,297 Fines and forfeitures 6,030 6,030 Other 1,426 11 ,601 173 1,876 15,076
TOTAL REVENUES 453,770 214,080 45,718 657 33,114 747,339
EXPENDITURES: Current: Executive, legislative, and judicial 10,640 1,009 11 ,649 Finance 50,719 24 50,743 Public safety 146,497 6,995 153,492 Building inspection 3,931 3,931 Public works 18,963 18,963 Recreation 736 1,014 1,750 Public lands and parks 19,726 732 20,458 Other departments 7,877 7,877 Grants 4,231 4,231 Education 337,939 44,679 382,618 Community development 20,066 20,066
Noncurrent: Capital outlays 3,038 1,600 4,638
Debt Service: Principal 41 ,680 2,663 44 ,343 Interest and other costs 24,693 463 14 25,170
TOTAL EXPENDITURES 329,693 337,939 44,679 3,501 34,117 749,929
EXCESS (DEFICIENCY) OF REVENUES OVER EXPENDITURES 124,077 (123,859) 1,039 (2,844) (1,003) (2,590)
OTHER FINANCING SOURCES (USES) Transfers in 2,414 125,892 994 407 129,707
Transfers out (124,919) (2,033) (2,232) (766) (129,950)
Bond proceeds 39,345 39,345
Bond premium 2,125 2,125 Loan proceeds 250 250
TOTAL OTHER FINANCING SOURCES (USES) (122,505) 123,859 (1,238) 41 ,470 (109) 41,477
NET CHANGE IN FUND BALANCES 1,572 (199) 38,626 (1,112) 38,887
FUND BALANCES AT BEGINNING OF YEAR, (11 ,399) 2,187 940 60,806 52 ,534
FUND BALANCE AT END OF YEAR $ (9,827) $ 1,988 $ 39,566 $ 59,694 91 ,421
SEE NOTES TO THE BASIC FINANCIAL STATEMENTS 15
CITY OF PROVIDENCE, RHODE ISLAND
Reconciliation of the Statement of Revenues, Expenditures and Changes in Fund Balances of Governmental Funds
For the Year Ended June 30, 2013 (in thousands)
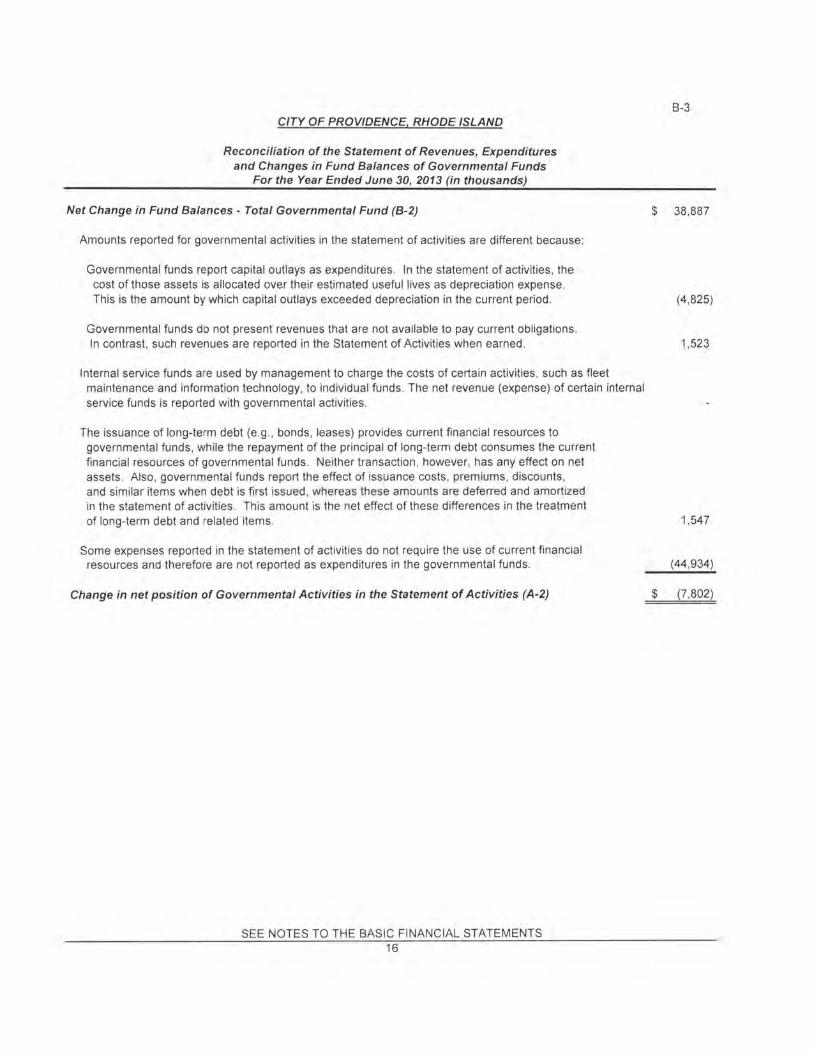
Net Change in Fund Balances - Total Governmental Fund (B-2)
Amounts reported for governmental activities in the statement of activities are different because:
Governmental funds report capital outlays as expenditures . In the statement of activities , the cost of those assets is allocated over their estimated useful lives as depreciation expense. This is the amount by which capital outlays exceeded depreciation in the current period .
Governmental funds do not present revenues that are not available to pay current obligations. In contrast , such revenues are reported in the Statement of Activities when earned .
Internal service funds are used by management to charge the costs of certain activities, such as fleet maintenance and information technology, to individual funds. The net revenue (expense) of certain internal service funds is reported with governmental activities .
The issuance of long-term debt (e.g., bonds, leases) provides current financial resources to governmental funds , while the repayment of the principal of long-term debt consumes the current financial resources of governmental funds . Neither transaction , however, has any effect on net assets. Also, governmental funds report the effect of issuance costs , premiums , discounts , and similar items when debt is first issued, whereas these amounts are deferred and amortized in the statement of activities . This amount is the net effect of these differences in the treatment of long-term debt and related items.
Some expenses reported in the statement of activities do not require the use of current financial resources and therefore are not reported as expenditures in the governmental funds .
Change in net position of Governmental Activities in the Statement of Activities (A-2)
SEE NOTES TO THE BASIC FINANCIAL STATEMENTS 16
B-3
$ 38 ,887
(4 ,825)
1,523
1,547
(44,934)
$ (7 ,802)
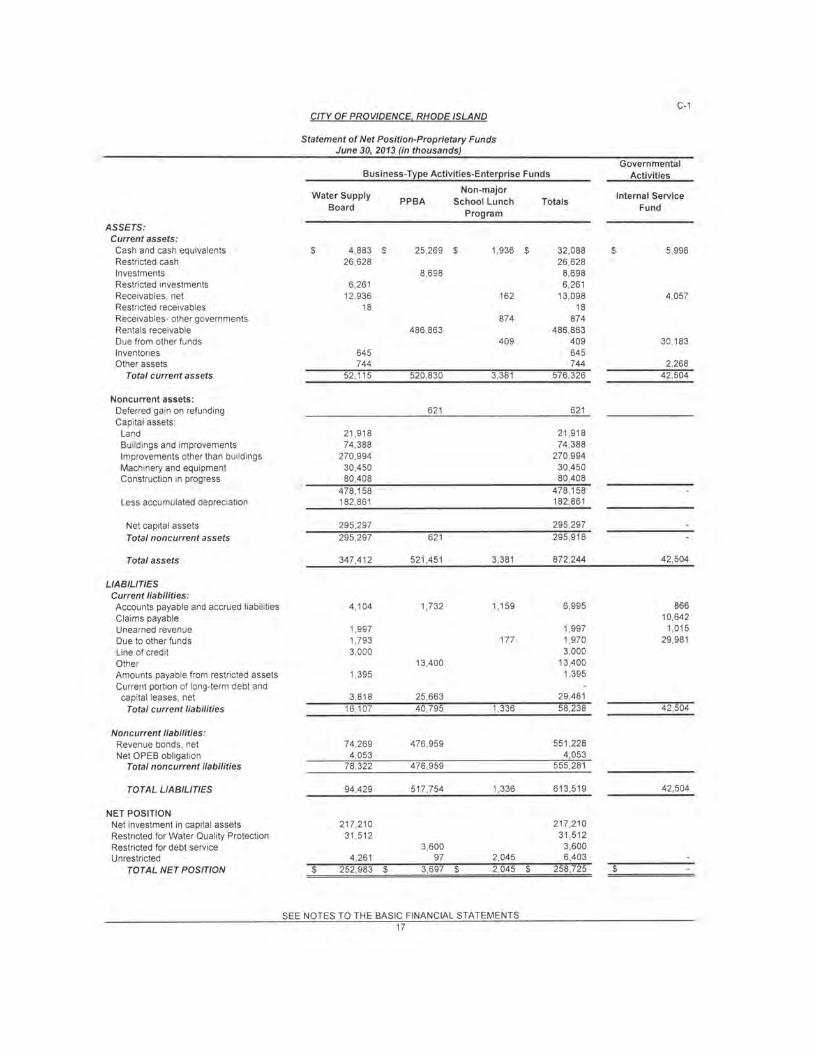
C-1 CITY OF PROVIDENCE, RHODE ISLAND
Statement of Net Position-Proprietary Funds June 30, 2013 (in thousands)
Governmental Business-Type Activities-Enterprise Funds Activities
Water Supply Non-major
Internal Service PPBA School lunch Totals
Board Program
Fund
ASSETS: Current assets:
Cash and cash equivalents $ 4,883 $ 25,269 $ 1,936 $ 32,088 $ 5,996 Restricted cash 26,628 26,628 Investments 8,698 8,698 Restricted investments 6,261 6,261 Receivables , net 12,936 162 13,098 4,057 Restricted receivables 18 18 Receivables- other governments 874 874 Rentals receivable 486,863 486,863 Due from other funds 409 409 30,183 Inventories 645 645 Other assets 744 744 2,268
Total current assets 52,115 520,830 3,381 576,326 42,504
Noncurrent assets : Deferred gain on refunding 621 621 Capital assets:
Land 21 ,918 21 ,918 Buildings and improvements 74,388 74,388 Improvements other than buildings 270,994 270 ,994 Machinery and equipment 30,450 30,450 Construction in progress 80,408 80,408
478 ,158 478 ,158 Less accumulated depreciation 182,861 182,861
Net capital assets 295,297 295,297
Total noncurrent assets 295,297 621 295,918
Total assets 347,412 521 ,451 3,381 872,244 42,504
LIABILITIES Current liabilities: Accounts payable and accrued liabilities 4,104 1,732 1,159 6,995 866
Claims payable 10,642
Unearned revenue 1,997 1,997 1,015 Due to other funds 1,793 177 1,970 29,981
Line of credit 3,000 3,000 Other 13,400 13,400 Amounts payable from restricted assets 1,395 1,395 Current portion of long-term debt and capital leases, net 3,818 25,663 29,481
Total current liabilities 16,107 40,795 1,336 58,238 42,504
Noncurrent liabilities : Revenue bonds, net 74,269 476 ,959 551 ,228 Net OPES obligation 4,053 4,053
Total noncurrent liabilities 78 ,322 476,959 555,281
TOTAL LIABILITIES 94,429 517,754 1,336 613,519 42,504
NET POSITION Net investment in capital assets 217,210 217,210 Restricted for Water Quality Protection 31,512 31 ,512 Restricted for debt service 3,600 3,600 Unrestricted 4,261 97 2,045 6,403
TOTAL NET POSITION $ 252,983 $ 3,697 $ 2,045 $ 258,725 $
SEE NOTES TO THE BASIC FINANCIAL STATEMENTS 17
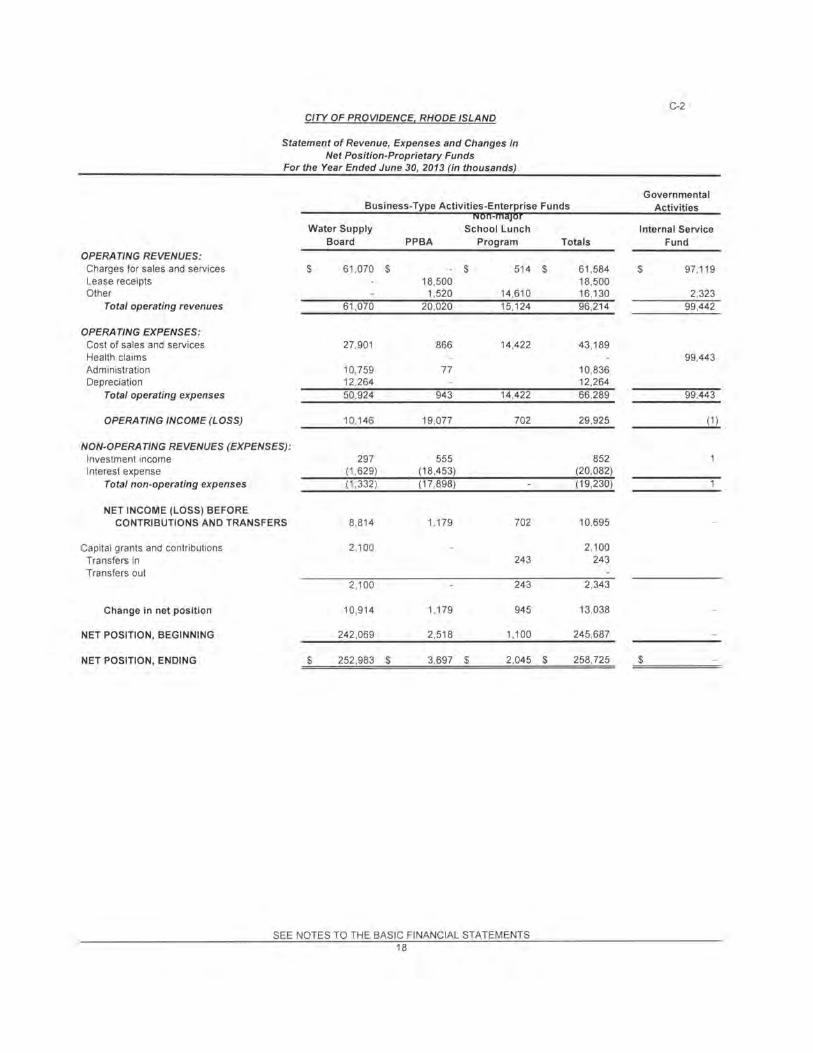
C-2 CITY OF PROVIDENCE, RHODE ISLAND
Statement of Revenue, Expenses and Changes in Net Position-Proprietary Funds
For the Year Ended June 30, 2013 (in thousands)
Governmental Activities
Water Supply School Lunch Internal Service Board PPBA Program Totals Fund
OPERATING REVENUES: Charges for sales and services $ 61 ,070 $ $ 51 4 $ 61,584 $ 97 ,119 Lease receipts 18,500 18,500 Other 1,520 14,610 16,130 2,323
Total operating revenues 61 ,070 20 ,020 15,124 96 ,214 99 ,442
OPERATING EXPENSES: Cost of sales and services 27 ,901 866 14,422 43,189 Health claims 99 ,443 Administration 10,759 77 10,836 Depreciation 12,264 12,264
Total operating expenses 50,924 943 14,422 66 ,289 99 ,443
OPERATING INCOME (LOSS) 10,146 19,077 702 29,925 (1)
NON-OPERATING REVENUES (EXPENSES) : Investment income 297 555 852 Interest expense (1 ,629) (18 ,453) (20,082)
Total non-operating expenses (1 ,332) (17 ,898) (19,230)
NET INCOME (LOSS) BEFORE CONTRIBUTIONS AND TRANSFERS 8,814 1,179 702 10,695
Capital grants and contributions 2,100 2,100 Transfers in 243 243 Transfers out
2,100 243 2,343
Change in net position 10,914 1 '179 945 13,038
NET POSITION, BEGINNING 242,069 2,518 1,100 245 ,687
NET POSITION, ENDING $ 252,983 $ 3,697 $ 2,045 $ 258,725 $
SEE NOTES TO THE BASIC FINANCIAL STATEMENTS 18
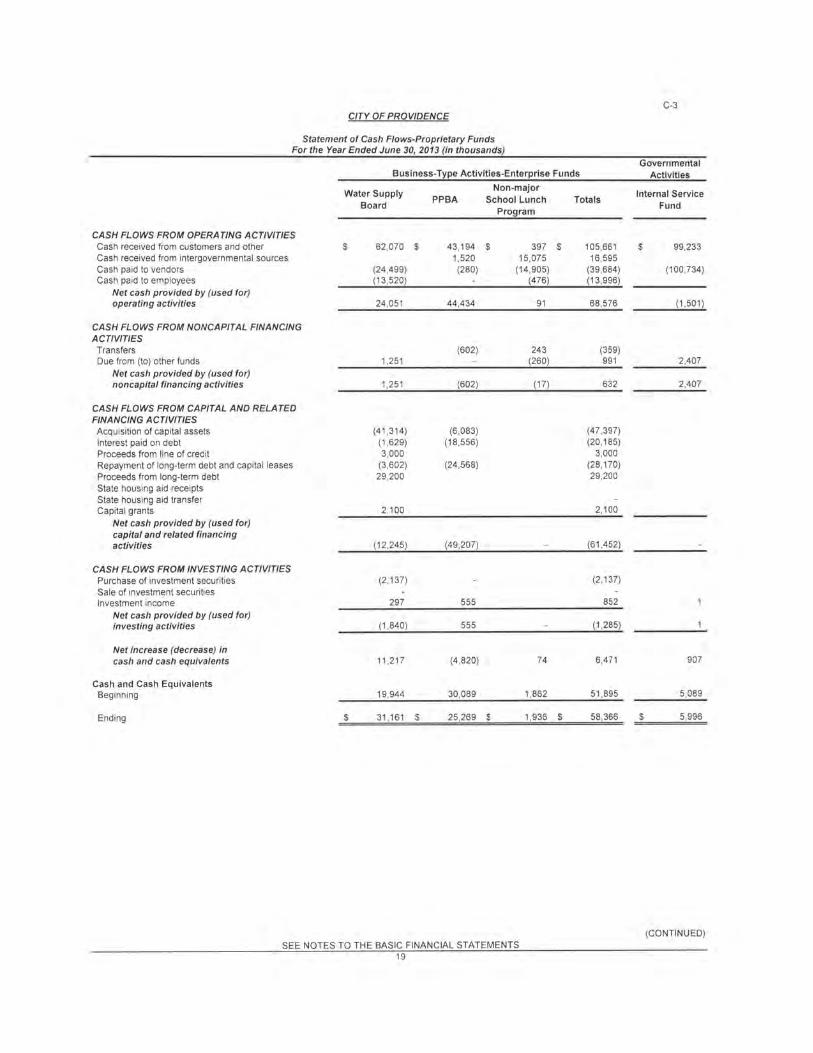
C-3 CITY OF PROVIDENCE
Statement of Cash Flows-Proprietary Funds For the Year Ended June 30, 2013 (in thousands)
Governmental Business-Type Activities-Enterprise Funds Activities
Water Supply Non-major
Internal Service PPBA School lunch Totals
Board Program
Fund
CASH FLOWS FROM OPERATING ACTIVITIES Cash received from customers and other $ 62,070 $ 43,194 $ 397 $ 105,661 $ 99,233 Cash received from intergovernmental sources 1,520 15,075 16,595 Cash paid to vendors (24,499) (280) (14,905) (39,684) (100,734) Cash paid to employees (13,520) (476) (13,996)
Net cash provided by (used for) operating activities 24 ,051 44,434 91 68,576 (1 ,501)
CASH FLOWS FROM NONCAPITAL FINANCING ACTIVITIES
Transfers (602) 243 (359) Due from (to) other funds 1,251 (260) 991 2,407
Net cash provided by (used for) noncapital financing activities 1,251 (602) (17) 632 2,407
CASH FLOWS FROM CAPITAL AND RELATED FINANCING ACTIVITIES Acquisition of capital assets (41 ,314) (6 ,083) (47,397) Interest paid on debt (1 ,629) (18,556) (20,185) Proceeds from line of credit 3,000 3,000 Repayment of long-term debt and capital leases (3,602) (24,568) (28,170) Proceeds from long-term debt 29,200 29,200 State housing aid receipts State housing aid transfer Capital grants 2,100 2,100
Net cash provided by (used for) capital and related financing activities (12 ,245) (49,207) (61 ,452)
CASH FLOWS FROM INVESTING ACTIVITIES Purchase of investment securities (2 ,137) (2 ,137) Sale of investment securities Investment income 297 555 852
Net cash provided by (used for) investing activities (1 ,840) 555 (1 ,285)
Net increase (decrease) in cash and cash equivalents 11 ,217 (4 ,820) 74 6,471 907
Cash and Cash Equivalents Beginning 19,944 30,089 1,862 51 ,895 5,089
Ending $ 31 ,161 $ 25,269 $ 1,936 $ 58 ,366 $ 5,996
(CONTINUED) SEE NOTES TO THE BASIC FINANCIAL STATEMENTS
19
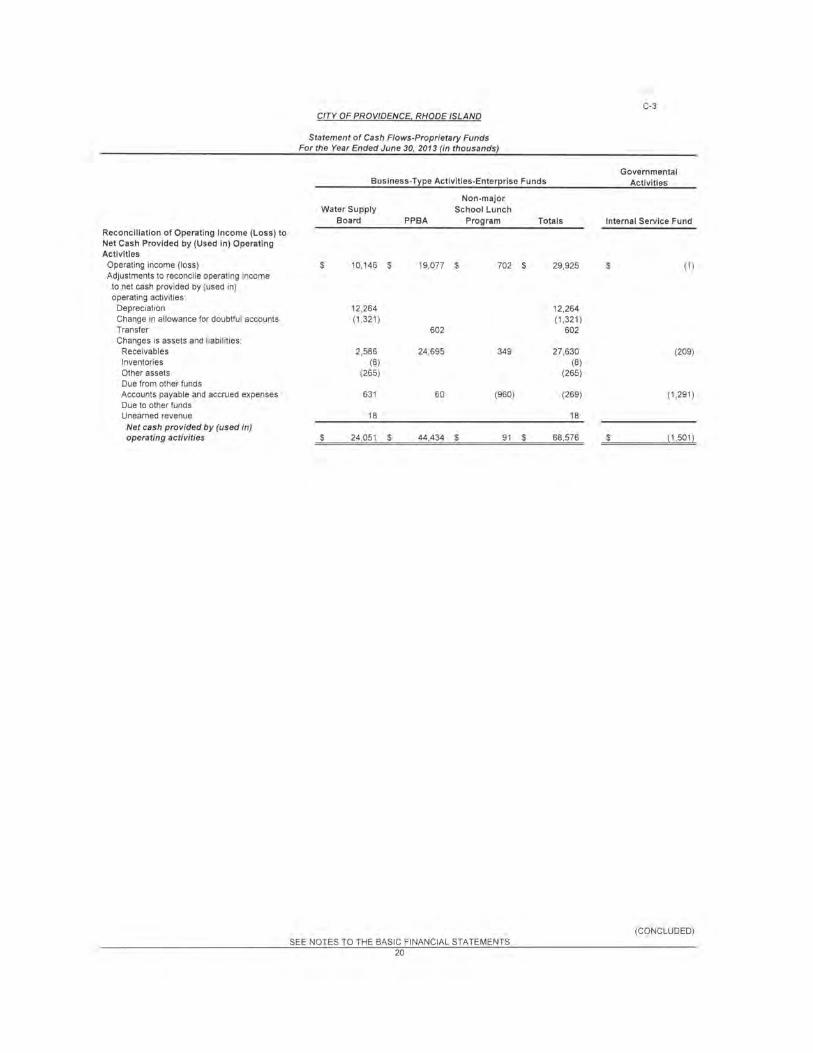
Reconciliation of Operating Income (Loss) to Net Cash Provided by (Used in) Operating Activities
Operating income (loss) Adjustments to reconcile operating income
to net cash provided by (used in) operating activities:
Depreciation Change in allowance for doubtful accounts Transfer Changes is assets and liabilities: Receivables Inventories Other assets Due from other funds Accounts payable and accrued expenses Due to other funds Unearned revenue
Net cash provided by (used in) operating activities
CITY OF PROVIDENCE. RHODE ISLAND
Statement of Cash Flows-Proprietary Funds For the Year Ended June 30, 2013 (in thousands)
Business-Type Activities-Enterprise Funds
Water Supply Board
$ 10,146
12,264 (1,321)
2,586 (8)
(265)
631
18
$ 24,051
$
$
PPBA
19,077
602
24,695
60
44,434
Non-major School lunch
Program
$ 702
349
(960)
$ 91
SEE NOTES TO THE BASIC FINANCIAL STATEMENTS 20
Totals
$ 29,925
12,264 (1,321)
602
27,630 (8)
(265)
(269)
18
$ 68,576
C-3
Governmental Activities
Internal Service Fund
$ (1)
(209)
(1,291)
$ (1,501)
(CONCLUDED)
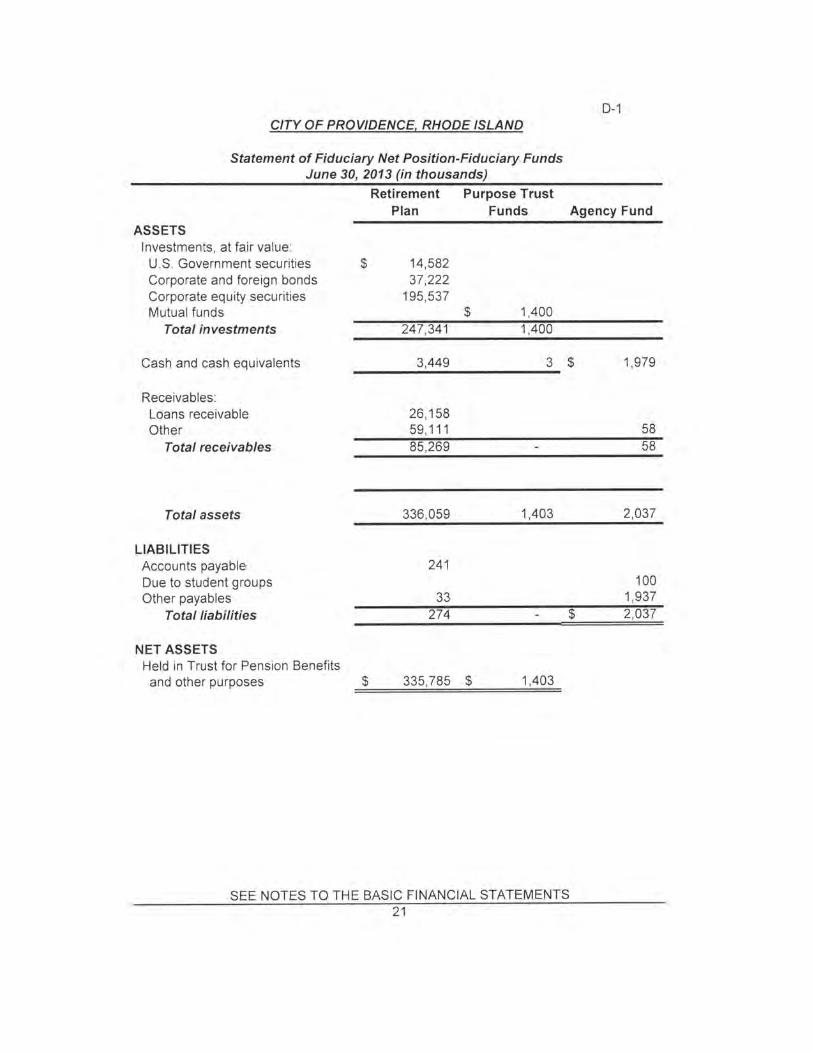
CITY OF PROVIDENCE, RHODE ISLAND
Statement of Fiduciary Net Position-Fiduciary Funds June 30, 2013 (in thousands)
Purpose Trust
D-1
Retirement Plan Funds Agency Fund
ASSETS Investments, at fair value :
U.S Government securities $ 14,582 Corporate and foreign bonds 37,222 Corporate equity securities 195,537 Mutual funds $ 1,400
Total investments 247,341 1,400
Cash and cash equivalents 3,449 3 $ 1,979
Receivables: Loans receivable 26,158 Other 59,111 58
Total receivables 85,269 58
Total assets 336,059 1,403 2,037
LIABILITIES Accounts payable 241 Due to student groups 100 Other payables 33 1,937
Total liabilities 274 $ 2,037
NET ASSETS Held in Trust for Pension Benefits and other purposes $ 335,785 $ 1,403
SEE NOTES TO THE BASIC FINANCIAL STATEMENTS 21
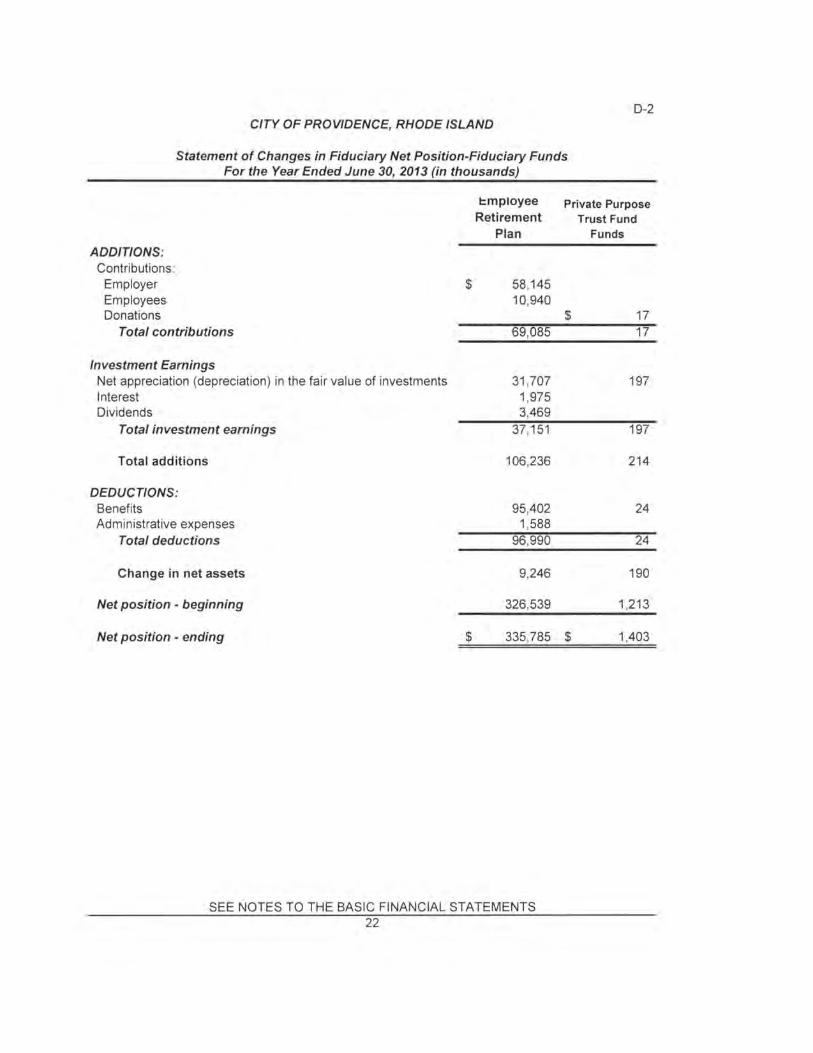
D-2 CITY OF PROVIDENCE, RHODE ISLAND
Statement of Changes in Fiduciary Net Position-Fiduciary Funds For the Year Ended June 30, 2013 (in thousands)
t:mployee Private Purpose Retirement Trust Fund
Plan Funds
ADDITIONS: Contributions:
Employer $ 58,145 Employees 10,940 Donations $ 17
Total contributions 69,085 17
Investment Earnings Net appreciation (depreciation) in the fair value of investments 31 ,707 197 Interest 1,975 Dividends 3,469
Total investment earnings 37,151 197
Total additions 106,236 214
DEDUCTIONS: Benefits 95,402 24 Administrative expenses 1,588
Total deductions 96,990 24
Change in net assets 9,246 190
Net position - beginning 326,539 1,213
Net position - ending $ 335,785 $ 1,403
SEE NOTES TO THE BASIC FINANCIAL STATEMENTS 22
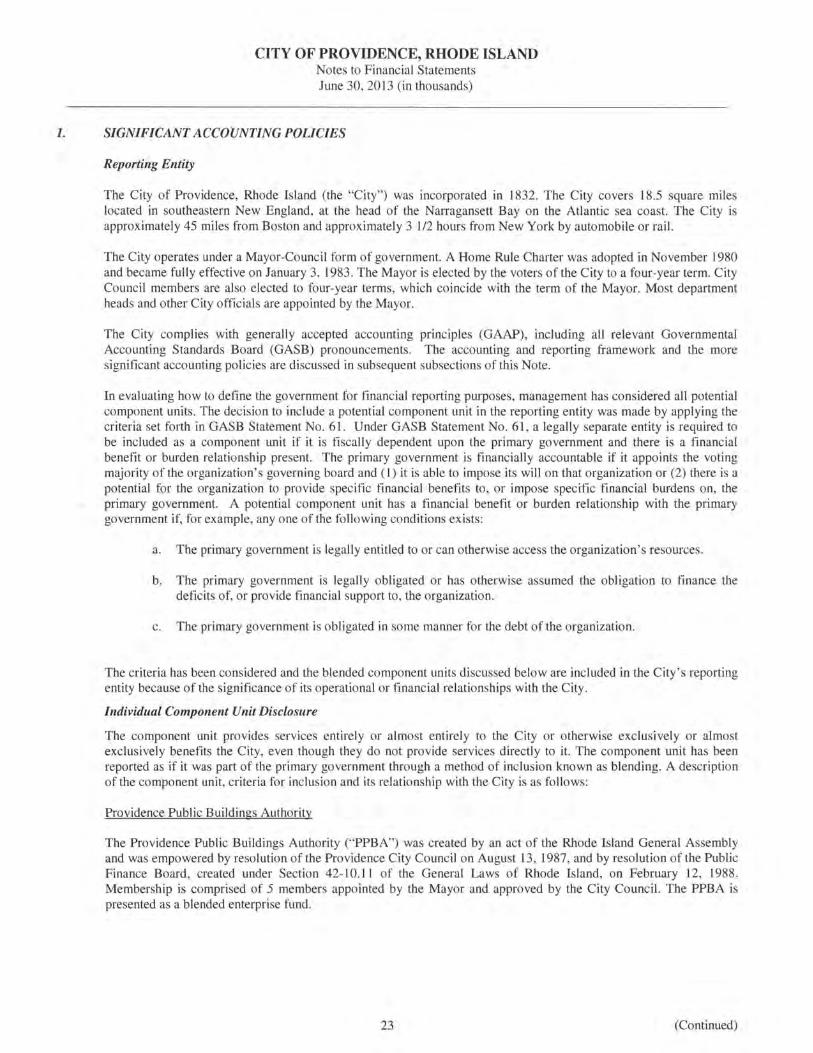
CITY OF PROVIDENCE, RHODE ISLAND Notes to Financial Statements June 30, 2013 (in thousands)
1. SIGNIFICANT ACCOUNTING POliCIES
Reporting Entity
The City of Providence, Rhode Island (the "City") was incorporated in 1832. The City covers 18.5 square miles located in southeastern New England, at the head of the Narragansett Bay on the Atlantic sea coast. The City is approximately 45 miles from Boston and approximately 3 1/2 hours from New York by automobile or rail.
The City operates under a Mayor-Council form of government. A Home Rule Charter was adopted in November 1980 and became fully effective on January 3, 1983. The Mayor is elected by the voters of the City to a four-year term. City Council members are also elected to four-year terms, which coincide with the term of the Mayor. Most department heads and other City officials are appointed by the Mayor.
The City complies with generally accepted accounting principles (GAAP), including all relevant Governmental Accounting Standards Board (GASB) pronouncements. The accounting and reporting framework and the more significant accounting policies are discussed in subsequent subsections of this Note.
In evaluating how to define the government for financial reporting purposes, management has considered all potential component units. The decision to include a potential component unit in the reporting entity was made by applying the criteria set forth in GASB Statement No. 61. Under GASB Statement No. 61, a legally separate entity is required to be included as a component unit if it is fiscally dependent upon the primary government and there is a financial benefit or burden relationship present. The primary government is financially accountable if it appoints the voting majority of the organization' s governing board and (I) it is able to impose its will on that organization or (2) there is a potential for the organization to provide specific financial benefits to, or impose specific financial burdens on, the primary government. A potential component unit has a financial benefit or burden relationship with the primary government if, for example, any one of the following conditions exists:
a. The primary government is legally entitled to or can otherwise access the organization's resources.
b. The primary government is legally obligated or has otherwise assumed the obligation to finance the deficits of, or provide financial support to, the organization.
c. The primary government is obligated in some manner for the debt of the organization.
The criteria has been considered and the blended component units discussed below are included in the City's reporting entity because of the significance of its operational or financial relationships with the City.
Individual Component Unit Disclosure
The component unit provides services entirely or almost entirely to the City or otherwise exclusively or almost exclusively benefits the City, even though they do not provide services directly to it. The component unit has been reported as if it was part of the primary government through a method of inclusion known as blending. A description of the component unit, criteria for inclusion and its relationship with the City is as follows:
Providence Public Buildings Authority
The Providence Public Buildings Authority ("PPBA") was created by an act of the Rhode Island General Assembly and was empowered by resolution of the Providence City Council on August 13, 1987, and by resolution of the Public Finance Board, created under Section 42-10.11 of the General Laws of Rhode Island, on February 12, 1988. Membership is comprised of 5 members appointed by the Mayor and approved by the City Council. The PPBA is presented as a blended enterprise fund .
23 (Continued)

CITY OF PROVIDENCE, RHODE ISLAND Notes to Financial Statements June 30, 2013 (in thousands)
I. SIGNIFICANT ACCOUNTING POLICIES (Continued)
Individual Component Unit Disclosure (Continued)
Providence Public Buildings Authority (Continued)
The purpose of the PPBA is to acquire, construct, maintain, renovate, repair and operate public facilities and public equipment through the use of public financing for lease to the City. These activities allow the PPBA to provide for the conduct of the executive, legislative and judicial functions of the government. The PPBA is obligated to pay the principal and interest on any financing solely from the rents, revenues and receipts derived under the lease agreements with the City or from receipts on the disposition of the assets being financed . The PPBA's administrative expenses are paid on an annual basis by the lessee in the form of additional rent.
Complete financial statements of the PPBA can be obtained through the City of Providence Finance Department, City Hall , Providence, Rhode Island 02903.
The Providence Redevelopment Agency
The Providence Redevelopment Agency ("PRA") was formed on December 20, 1946 pursuant to R.I.G.L. 45-31 (the Act) by a duly enacted resolution of the City Council of the City. Under the Act, the PRA constitutes a body corporate and politic, exercising public and essential government functions, and having a distinct legal existence from the City. As such, the PRA has the authority to acquire, develop as a building site, administer, sell and lease property, has the power of eminent domain, and the power to issue bonds, notes and other evidence of indebtedness. The PRA does not have the power to levy taxes.
The PRA was created to eliminate and prevent blighted and substandard areas and replace such areas through redevelopment of well-planned, integrated stable, safe and healthful neighborhoods.
The Powers of the PRA are vested in eight members, including the Mayor of the City ex officio, five members appointed by the Mayor of the City and two members who are also members of the City Council, appointed by the City Council. All appointed members of the PRA must be resident electors of the City. The PRA is presented as a blended special revenue fund.
Recently Issued Accounting Standards
The City has implemented the following governmental accounting standards during fiscal year ended June 30, 2013:
• GASB Statement No. 60 - Accounting and Financial Reporting for Service Concession Arrangements.
• GASB Statement No. 61 - The Financial Reporting Entity: Omnibus an amendment of GASB Statements No. 14 and No. 34.
• GASB Statement No. 62 -Codification of Accounting and Financial Reporting Guidance Contained in Pre-November 30, 1989 FASB and AICPA Pronouncements.
• GASB Statement No. 63 - Financial Reporting of Deferred Outflows of Resources, Deferred Inflows of Resources, and Net Position.
The City will adopt the following new accounting pronouncements in future years:
• GASB Statement No. 65 - Items Previously Reported as Assets and Liabilities, effective for the Corporation's fiscal year ending June 30, 2014.
• GASB Statement No. 66 -Technical Corrections - an amendment of GASB Statements No. lO and No. 62, effective for the Corporation's fiscal year ending June 30, 2014.
24 (Continued)
CITY OF PROVIDENCE, RHODE ISLAND Notes to Financial Statements June 30, 2013 (in thousands)
1. SIGNIFICANT ACCOUNTING POLICIES (Continued)
Recently Issued Accounting Standards (Continued)
• GASB Statement No. 67 - Financial Reporting of Pension Plans - and amendment of GASB Statement No. 25, effective for the Corporation's fiscal year ending June 30,2014.
• GASB Statement No. 68 - Accounting and Financial Reporting for Pensions - an amendment of GASB Statement No. 27, effective for the Corporation's fiscal year ending June 30,2015.
• GASB Statement No. 69 - Government Combinations and Disposals of Government Operations, effective for the fiscal year ending June 30, 2015 .
• GASB Statement No. 70 - Accounting and Financial Reporting for Nonexchange Financial Guarantees, effective for the fiscal year ending June 30, 2014.
• GASB Statement No. 71 - Pension Transition for Contributions Made Subsequent to the Measurement Date - an amendment of GASB Statement No. 68, effective for the fiscal year ending June 30,2015.
The impact of these pronouncements on the City's financial statements has not been determined.
Government-Wide Fund Financial Statements
The Statement of Net position and Statement of Activities display information about the reporting government as a whole. They include all funds of the reporting entity except for fiduciary funds. For the most part, the effect of interfund activity has been removed from these statements. The statements distinguish between governmental and businesstype activities. Governmental activities generally are financed through taxes, intergovernmental revenues, and other nonexchange revenues. Business-type activities are financed in whole or in part by fees charged to external parties for goods or services.
The statement of activities demonstrates the degree to which the direct expenses of a given function or segment are offset by program revenues. Direct expenses are those that are clearly identifiable with a specific function or segment. Program revenues include 1) charges to customers or applicants who purchase, use, or directly benefit from goods, services or privileges provided by a given function or segment and 2) grants and contributions that are restricted to meeting the operational or capital requirements of a particular function or segment. Taxes and other items not properly included among program revenues are reported instead as general revenues.
Separate fund financial statements are provided for governmental funds, proprietary funds and fiduciary funds, even though the latter are excluded from the government-wide financial statements. Major individual governmental funds and proprietary funds are reported as separate columns in the fund financial statements.
Measurement Focus, Basis of Accounting, and Financial Statement Presentation
The government-wide financial statements, proprietary and fiduciary fund financial statements are reported using the economic resources measurement focus and the accrual basis of accounting. Agency funds are not involved in the measurement of results of operations; therefore, measurement focus is not applicable to them. Revenues are recorded when earned and expenses are recorded when a liability is incurred, regardless of the timing of related cash flows. Property taxes are recognized as revenues in the year when levied for. Grants and similar items are recognized as revenue as soon as all eligibility requirements imposed by the provider have been met.
25 (Continued)
CITY OF PROVIDENCE, RHODE ISLAND Notes to Financial Statements June 30,2013 (in thousands)
1. SIGNIFICANT ACCOUNTING POLICIES (Continued)
Measurement Focus, Basis of Accounting, and Financial Statement Presentation (Continued)
Governmental fund financial statements are reported using the "current financial resources" measurement focus and the modified accrual basis of accounting. Only current financial assets and liabilities are generally included on their balance sheets. Their operating statements present sources and uses of available spendable financial resources during a given period. These funds use fund balance as their measure of available spendable financial resources at the end of the period. Revenues are considered to be available when they are collectible within the current period or soon enough thereafter to pay liabilities of the current period. For this purpose, the City considers revenues to be available if they are collected within 60 days of the end of the current fiscal period. Expenditures are generally recorded when a liability is incurred as under accrual accounting, however, debt service expenditures, as well as expenditures related to compensated absences and claims and judgments, are recorded only when payment is due (matured).
Property taxes when levied for, intergovernmental revenue when eligibility requirements are met, licenses, and interest associated with the current fiscal period are all considered to be susceptible to accrual (measurable) and so have been recognized as revenues of the current fiscal period, if available. All other revenue items, primarily permits and fees, are considered to be measurable only when cash is received by the City.
All proprietary funds utilize an "economic resources" measurement focus. The accounting objectives of this measurement focus are the determination of net income, financial position and cash flows. All assets and liabilities (whether current or noncurrent) associated with their activities are reported. Proprietary fund equity is classified as net position. Proprietary funds distinguish operating revenues and expenses from non-operating items.
Operating revenues and expenses generally result from providing services and producing and delivering goods in connection with a proprietary fund's principal ongoing operations. The principal operating revenues of the enterprise funds and the government's internal service funds are charges to customers for sales and services. Operating expenses for proprietary funds, including both enterprise funds and internal service funds, include the cost of operations, maintenance, sales and service, administrative expenses, and depreciation on capital assets. All revenues and expenses not meeting this definition are reported as non-operating revenues and expenses.
When both restricted and unrestricted resources are available for use, it is the City's policy to use restricted resources first, then unrestricted resources as they are needed.
Revenues from charges for services of the Providence Water Supply Board are recognized on the accrual basis, net of estimated uncollectibles. Depending upon consumption, metered water sale customers are billed monthly, quarterly or annually for water usage. Large commercial customers and other local water suppliers are billed more frequently.
Fund financial statements of the reporting entity are organized into funds each of which is considered to be a separate accounting entity. Each fund is accounted for by providing a separate set of self-balancing accounts which constitute its assets, deferred outflows of resources, liabilities, deferred inflows of resources, fund equity, revenues, and expenditures/expenses. Funds are organized into three major categories: governmental, proprietary, and fiduciary . An emphasis is placed on major funds within the governmental and proprietary categories. A fund is considered major if it is the primary operating fund of the City or meets the following criteria:
a) Total assets and deferred outflow of resources, liabilities and deferred inflow of resources, revenues, or expenditures/expenses of that individual, governmental or enterprise fund are at least lO percent of the corresponding total for all funds of that category or type, and
b) Total assets and deferred outflow of resources, liabilities and deferred inflow of resources, revenues, or expenditures/expenses of the individual, governmental fund or enterprise fund are at least 5 percent of the corresponding total for all governmental and enterprise funds combined.
The City reports the following major governmental funds:
- The General Fund is the City's primary operating fund. It accounts for all financial resources of the general government, except those required to be accounted for in another fund. - The School Fund accounts for operations of the Providence school system. Revenue is derived primarily from State and Federal Aid and transfers from the City.
26 (Continued)
CITY OF PROVIDENCE, RHODE ISLAND Notes to Financial Statements June 30,2013 (in thousands)
1. SIGNIFICANT ACCOUNTING POLICIES (Continued)
Measurement Focus, Basis of Accounting, and Financial Statement Presentation (Continued)
-The School Grants Fund accounts for federal, state, and private grants received and expended by the school system -The Capital Projects Fund accounts for resources to be used for the acquisition or construction of capital assets for the housing and community improvement activities in the City.
The City reports the following major proprietary funds:
-The Water Supply Board accounts for the activities of the Providence Water Supply Board. -The Providence Public Buildings Authority accounts for the activities related to acquisition, construction and leasing of capital assets to the City.
Additionally, the City reports the following fund types:
-The Pension Trust Fund accounts for the activities of the City of Providence Employees Retirement System, which accumulates resources for pension benefit payments to qualified employees. - The Private-Purpose Trust Fund is used to account for resources legally held in trust for the benefit of individuals, organizations or other governments. - The Agency Fund accounts for assets held by the City in a purely custodial capacity. Since agency funds are custodial in nature (i.e. assets equal liabilities), they do not involve the measurement of results of operations. - The Internal Service Fund is used by management to charge the costs of self-insurance and legal claims to individual funds.
Interfund Receivables and Payables
Activity between funds that is representative of lending/borrowing arrangements outstanding at the end of the fiscal year are referred to as either "due to/from other funds." Any residual balances outstanding between the governmental activities and business-type activities are reported in the government-wide financial statements as " internal balances."
Pension Plan Accounting
Employee Retirement Plan The Employee Retirement Plan (Pension Trust Fund) is reported on the accrual basis of accounting. Employee contributions are recognized in the period in which the contributions are due. Employer contributions to the plan are recognized when due and the City has made a formal commitment to provide the contributions. Benefits and refunds are recognized when due and payable in accordance with the terms of each plan. Administrative costs are financed through investment earnings.
Investments are reported at fair value. Short-term investments are reported at cost, which approximates fair value. Securities traded on a national or international exchange are valued at the last reported sales price at current exchange rates. Investments that do not have an established market are reported at estimated fair value, based on value of underlying assets.
The net pension obligation, the cumulative difference between annual pension cost and the City 's contributions to the plan since 1986, is calculated on an actuarial basis consistent with the requirements of Government Accounting Standards Board Statement No. 27. Expenditures are recognized when they are paid or are expected to be paid with current available resources. The net pension obligation is recorded as a non-current liability in the government-wide financial statements.
Funding Policy
The City makes contributions at the discretion of management.
27 (Continued)
CITY OF PROVIDENCE, RHODE ISLAND Notes to Financial Statements June 30,2013 (in thousands)
1. SIGNIFICANT ACCOUNTING POLICIES (Continued)
Accounting Estimates
The preparation of financial statements in conformity with accounting principles generally accepted in the United States of America requires management to make estimates and assumptions that affect the reported amounts of assets and liabilities and disclosure of contingent assets and liabilities at the date of the financial statements and the reported amounts of revenues, expenses and expenditures during the reporting period. Actual results could differ from those estimates.
Property taxes
The City's property tax is levied each year on July I based on the assessed property value, as of the prior December 31, for all real property, tangible property, equipment and motor vehicles located in the City. Assessed values of real property were established by the City Assessor's office at 100% of appraised market value based on 2003 State mandated statistical updated valuations less Homestead exemptions for up to five residential units. Assessed values of tangible property and equipment and motor vehicles are determined annually at 100% of market value, with a State mandated, 10-year phase-out on tangible inventory property and a $6,000 exemption on motor vehicle assessments. Payments on the gross levy are due in equal quarterly installments in July, October, January, and April. Property taxes attach as an enforceable lien on property when levied.
Cash equivalents
For purposes of the cash flow statement, the City considers certificates of deposits and highly liquid short-term investment funds with original maturities of three months or less, when purchased, to be cash equivalents, including amounts reported as restricted.
Investments
Investments and pooled fixed income investments are stated at fair value, based on quoted market prices.
Inventories and prepaid assets
Proprietary fund inventory is stated at the lower of weighted average cost or market using the first-in, first-out method. Inventory consists primarily of materials and supplies. Inventory is not maintained in governmental funds, but is recorded as an expenditure at the time of purchase. Inventory on hand at year-end is not material.
Any material payments to vendors that reflect costs applicable to future accounting periods are recorded as prepaid items in both government-wide and fund financial statements.
Capital Assets
Capital assets, which include property, plant, equipment and infrastructure assets (e.g., roads, bridges, sidewalks, and similar items), are reported in the applicable governmental or business-type activities columns in the government-wide financial statements and in the proprietary fund financial statements. Capital assets are defined by the government as all computer equipment and assets with an initial, individual cost of more than a range of $5 ,000 to $100,000 and an estimated useful life in excess of two years. Such assets are recorded at historical cost or estimated historical cost if purchased or constructed. Donated capital assets are recorded at estimated fair value at the date of donation.
The costs of normal maintenance and repairs that do not add to the value of the asset or materially extend asset lives are not capitalized. Improvements are capitalized and depreciated over the remaining useful lives of the related capital asset, as applicable.
28 (Continued)
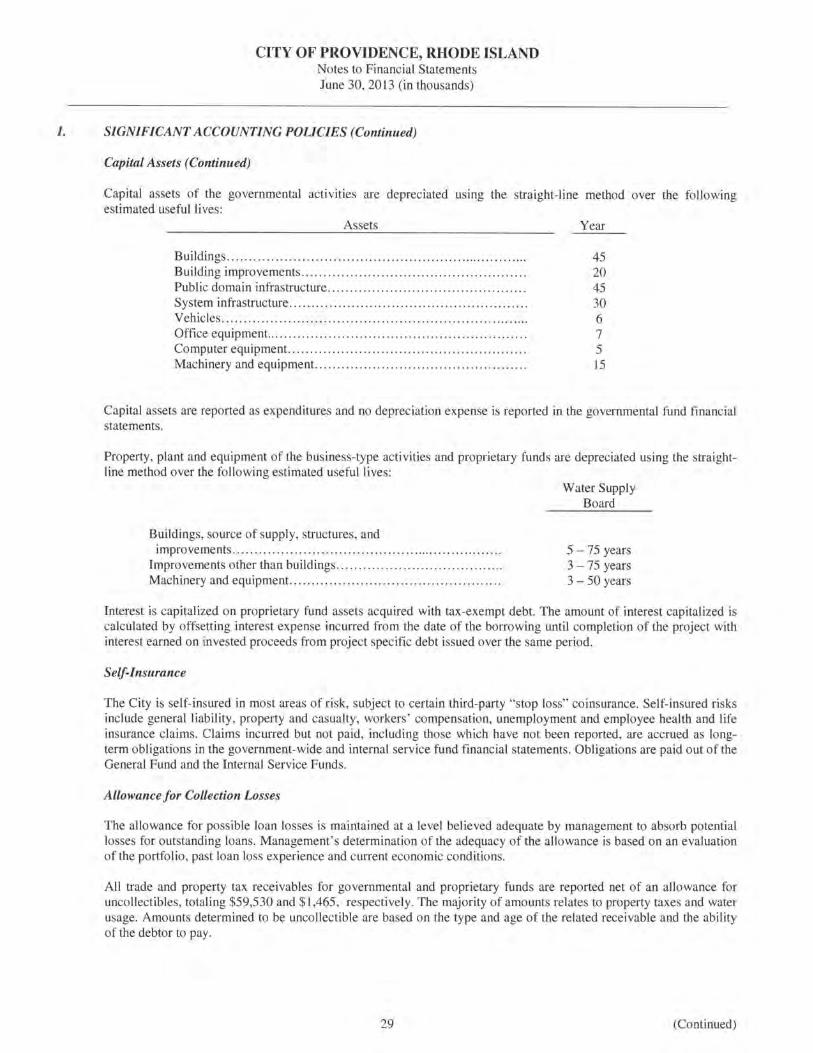
CITY OF PROVIDENCE, RHODE ISLAND Notes to Financial Statements June 30, 2013 (in thousands)
I. SIGNIFICANT ACCOUNTING POLICIES (Continued)
Capital Assets (Continued)
Capital assets of the governmental activities are depreciated using the straight-line method over the following estimated useful lives:
i\ssets )Tear
Buildings. ........... ....... ...................... ..... ..... .................. 45 Building improvements................................................... 20 Public domain infrastructure...... .......... . ....... . ... .. ... ... ......... 45 System infrastructure...................................................... 30 Vehicles...................................................................... 6 Office equipment........................................................... 7 Computer equipment...................................................... 5 Machinery and equipment................................................ 15
Capital assets are reported as expenditures and no depreciation expense is reported in the governmental fund financial statements.
Property, plant and equipment of the business-type activities and proprietary funds are depreciated using the straightline method over the following estimated useful lives:
Buildings, source of supply, structures, and improvements ......... . ........... .. ....... ...... ....... oo ...... . ..... .. . ..
Improvements other than buildings .... .. ..... ......... . ............... 00
Machinery and equipment. .. ............... ........... . ...... ... ... ..... .
Water Supply Board
5- 75 years 3-75 years 3-50 years
Interest is capitalized on proprietary fund assets acquired with tax-exempt debt. The amount of interest capitalized is calculated by offsetting interest expense incurred from the date of the borrowing until completion of the project with interest earned on invested proceeds from project specific debt issued over the same period.
Self-Insurance
The City is self-insured in most areas of risk, subject to certain third-party "stop Joss" coinsurance. Self-insured risks include general liability, property and casualty, workers' compensation, unemployment and employee health and life insurance claims. Claims incurred but not paid, including those which have not been reported, are accrued as longterm obligations in the government-wide and internal service fund financial statements. Obligations are paid out of the General Fund and the Internal Service Funds.
Allowance for Collection Losses
The allowance for possible loan losses is maintained at a level believed adequate by management to absorb potential losses for outstanding loans. Management's determination of the adequacy of the allowance is based on an evaluation of the portfolio, past loan loss experience and current economic conditions.
i\ll trade and property tax receivables for governmental and proprietary funds are reported net of an allowance for uncollectibles, totaling $59,530 and $1,465, respectively. The majority of amounts relates to property taxes and water usage. i\mounts determined to be uncollectible are based on the type and age of the related receivable and the ability of the debtor to pay.
29 (Continued)
CITY OF PROVIDENCE, RHODE ISLAND Notes to Financial Statements June 30,2013 (in thousands)
I. SIGNIFICANT ACCOUNTING POLICIES (Continued)
Compensated Absences
Under the terms of various contracts and policies, employees are granted vacation and sick leave based on length of service. The City's policy is to recognize the cost of vacation and sick leave in governmental funds when paid (matured). The liability for vacation and sick leave is recognized when earned in the government-wide and proprietary fund financial statements. For governmental activities the general fund is used to satisfy this liability as it becomes due, while each enterprise fund accounts for all its settlement of business-type liabilities for compensated absences.
Long-term Obligations
In the government-wide and proprietary fund financial statements, long-term debt and other long-term obligations are reported as liabilities in the applicable statement of net position. Bond premiums and discounts, as well as issuance costs, are deferred and amortized over the life of the bonds using the interest method. Bonds payable are reported net of the applicable bond premium or discount. Bond issuance costs are reported as deferred charges and amortized over the term of the related debt.
In the fund financial statements, governmental fund types recognize bond proceeds, premiums and discounts, as well as bond issuance costs, during the current period. The face amount of debt issued is reported as other financing sources. Premiums received on debt issuances are reported as other financing sources while discounts on debt issuances are reported as other financing uses. Issuance costs, whether or not withheld from the actual debt proceeds received, are reported as debt service expenditures. Payments of bond principal are recognized as expenditures as it comes due.
Fund Equity and Net position
In the government-wide and proprietary fund financial statements, net position is classified m the following categories:
Net investment in capital assets - This category groups all capital assets, including infrastructure, into one component of net position. Accumulated depreciation and the outstanding balances of debt that are attributable to the acquisition, construction or improvement of these assets reduce this category.
Restricted Net position -This category represents the net position of the City, which are restricted by outside parties or enabling legislation.
Unrestricted Net position or Deficits - This category represents the net position of the City, which do not meet the definition of "restricted" or "invested in capital assets, net of related debt". Deficits require future funding.
Governmental fund equity is classified as fund balance. Fund balance is classified into one of the following five categories: nonspendable, restricted, committed, assigned, or unassigned. These categories are defined below.
(a) Nonspendable Fund Balance - includes amounts that cannot be spent because they are either (a) not in spendable form or (b) legally or contractually required to be maintained intact. "Not in spendable form" includes items that are not expected to be converted to cash.
(b) Restricted Fund Balance - includes amounts that are restricted to specific purposes. Fund balance is reported as restricted when constraints placed in the use of resources are either externally imposed by creditors, grantors, contributors, or laws or regulations of other governments, or imposed by law through constitutional provisions or enabling legislation.
30 (Continued)
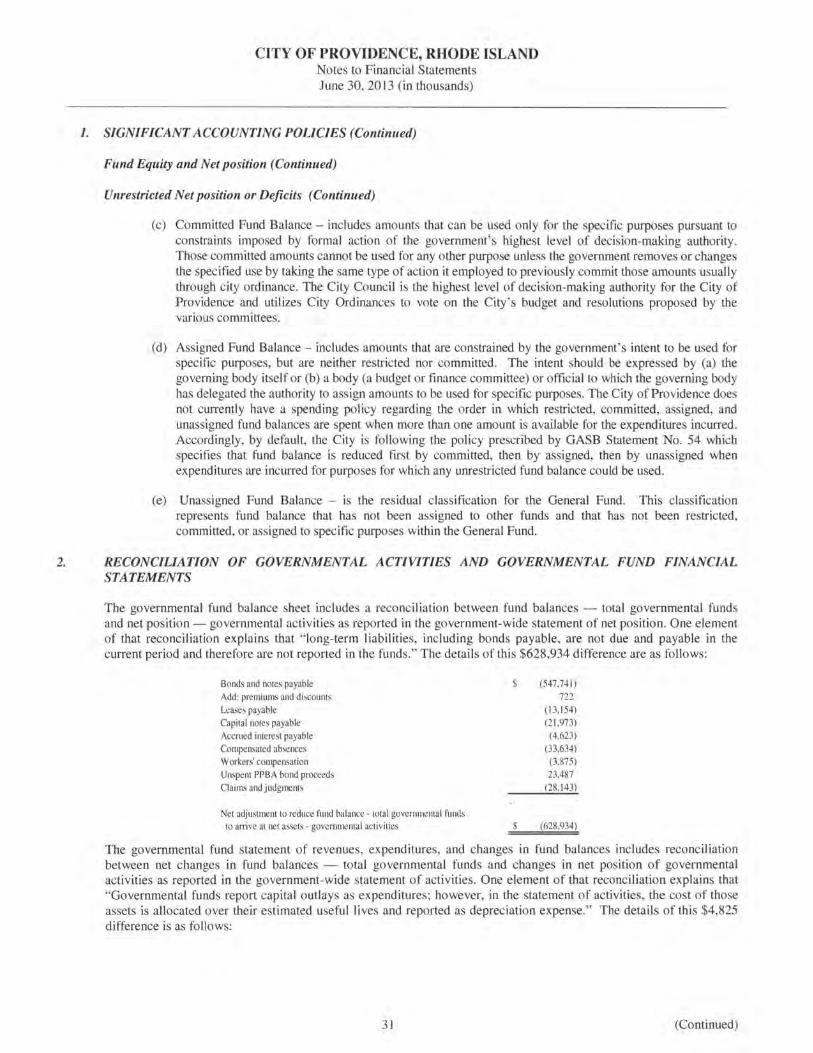
CITY OF PROVIDENCE, RHODE ISLAND Notes to Financial Statements June 30, 2013 (in thousands)
1. SIGNIFICANT ACCOUNTING POUCIES (Continued)
Fund Equity and Net position (Continued)
Unrestricted Net position or Deficits (Continued)
(c) Committed Fund Balance - includes amounts that can be used only for the specific purposes pursuant to constraints imposed by formal action of the government's highest level of decision-making authority. Those committed amounts cannot be used for any other purpose unless the government removes or changes the specified use by taking the same type of action it employed to previously commit those amounts usually through city ordinance. The City Council is the highest level of decision-making authority for the City of Providence and utilizes City Ordinances to vote on the City's budget and resolutions proposed by the various committees.
(d) Assigned Fund Balance- includes amounts that are constrained by the government's intent to be used for specific purposes, but are neither restricted nor committed. The intent should be expressed by (a) the governing body itself or (b) a body (a budget or finance committee) or official to which the governing body has delegated the authority to assign amounts to be used for specific purposes. The City of Providence does not currently have a spending policy regarding the order in which restricted, committed, assigned, and unassigned fund balances are spent when more than one amount is available for the expenditures incurred. Accordingly, by default, the City is following the policy prescribed by GASB Statement No. 54 which specifies that fund balance is reduced frrst by committed, then by assigned, then by unassigned when expenditures are incurred for purposes for which any unrestricted fund balance could be used.
(e) Unassigned Fund Balance - is the residual classification for the General Fund. This classification represents fund balance that has not been assigned to other funds and that has not been restricted, committed, or assigned to specific purposes within the General Fund.
2. RECONCiliATION OF GOVERNMENTAL ACTIVITIES AND GOVERNMENTAL FUND FINANCIAL STATEMENTS
The governmental fund balance sheet includes a reconciliation between fund balances - total governmental funds and net position- governmental activities as reported in the government-wide statement of net position. One element of that reconciliation explains that " long-term liabilities, including bonds payable, are not due and payable in the current period and therefore are not reported in the funds. " The details of this $628,934 difference are as follows:
Bonds and notes payable Add: premiums and discounts Leases payable Capital notes payable Accrued interest payable Compensated absences Workers' compensation Unspent PPBA bond proceeds Claims and judgments
Net adjustment to reduce fund balance- total governmental funds to arrive at net assets -governmental ac tivi ties
$
$
(547,74 1) 722
(13, 154) (2 1,973)
(4,623) (33,634)
(3,875) 23,487
(28, 143)
(628,934)
The governmental fund statement of revenues, expenditures, and changes in fund balances includes reconciliation between net changes in fund balances - total governmental funds and changes in net position of governmental activities as reported in the government-wide statement of activities. One element of that reconciliation explains that "Governmental funds report capital outlays as expenditures; however, in the statement of activities, the cost of those assets is allocated over their estimated useful lives and reported as depreciation expense." The details of this $4,825 difference is as follows:
31 (Continued)
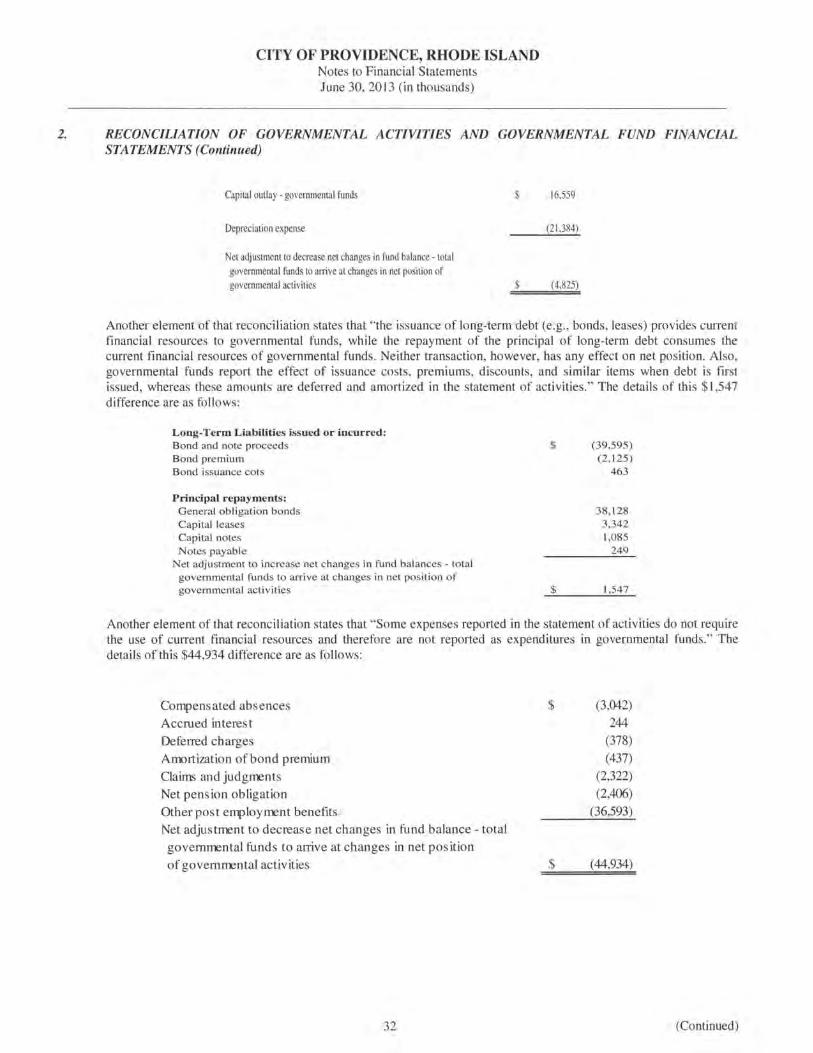
CITY OF PROVIDENCE, RHODE ISLAND Notes to Financial Statements June 30,2013 (in thousands)
2. RECONCILIATION OF GOVERNMENTAL ACTIVITIES AND GOVERNMENTAL FUND FINANCIAL STATEMENTS (Continued)
Capital outlay - governmental funds
Depreciation expense
Net adjustment to decrease net changes in fund balance - total governmental funds to arrive at changes in net position of governmental activities
$
$
16,559
(21,384)
(4,825)
Another element of that reconciliation states that "the issuance of long-term debt (e.g., bonds, leases) provides current financial resources to governmental funds, while the repayment of the principal of long-term debt consumes the current financial resources of governmental funds. Neither transaction, however, has any effect on net position. Also, governmental funds report the effect of issuance costs, premiums, discounts, and similar items when debt is first issued, whereas these amounts are deferred and amortized in the statement of activities." The details of this $1,547 difference are as follows:
Long-Term Liabilities issued or incurred: Bond and note proceeds Bond premium Bond issuance cots
Principal repayments: General obligation bonds Capital leases Capital notes Notes payable
Net adjustment to increase net changes in fund balances - total governmental funds to arrive at changes in net position of governmental activities
$
$
(39,595) (2, 125)
463
38, 128 3,342 1,085
249
1,547
Another element of that reconciliation states that "Some expenses reported in the statement of activities do not require the use of current financial resources and therefore are not reported as expenditures in governmental funds." The details of this $44,934 difference are as follows:
Compensated absences
Accrued interest Deferred charges
Amortization of bond premium Claims and judgments Net pens ion obligation
Other post employment benefits Net adjustment to decrease net changes in fund balance- total
governmental funds to arrive at changes in net position of governmental activities
32
$
$
(3,042)
244 (378) (437)
(2,322) (2,406)
(36,593)
(44,934)
(Continued)
CITY OF PROVIDENCE, RHODE ISLAND Notes to Financial Statements June 30, 2013 (in thousands)
3. CASH, CASH EQUIVALENTS AND INVESTMENTS (continued)
Deposits
The City's custodial credit risk policy is in accordance with RI General Laws, Chapter 35-10.1, depository institutions holding deposits of the State, its agencies or governmental subdivisions of the State, shall at a minimum, insure or pledge eligible collateral equal to 100% of time deposits with maturities greater than sixty days. Any of these institutions which do not meet minimum capital standards prescribed by federal regulators will insure or pledge eligible collateral equal to 100% of deposits, regardless of maturities.
Investments
The City policy for pension investments is under the oversight of the Board of Investment Commissioners. The Board contracts with an investment advisory firm and approves any new investment vehicles presented by the consultant. The Board follows all applicable state statutes and Section 17-189 of the City Ordinance, which states, ' 'The Board of Investment Commissioners is authorized and empowered to execute the disposition and investment of the funds which are within its control in any securities and investments as would be acquired by prudent persons of discretion and intelligence in these matters, who are seeking a reasonable income and the preservation of their capital."
Interest Rate Risk
The City does not have a formal investment policy for its pension funds that limits investment maturities as a means of managing its exposure to fair value losses arising from increasing interest rates. The City's policy is to limit its exposure to fair value losses arising from changes in interest rates by structuring the investment portfolio so that securities mature to meet cash requirements for ongoing operations, thereby avoiding the need to sell securities on the open market prior to maturity, and investing operating funds primarily in shorter-term securities, money market mutual funds, or similar investment pools.
Concentrations
The City 's policy is to maintain a diversified portfolio to minimize the risk of loss resulting from over concentration of assets in a specific issuer.
Custodial Credit Risk
Deposits
This is the risk that, in the event of failure of a depository financial institution, a government will not be able to recover its deposits or will not be able to recover collateral securities that are in the possession of an outside party. As of June 30, 2013 $46,361 of the city's bank balance of $196,324 was uninsured and uncollateralized. (Amounts do not include PPBA, as such amounts cannot be separated.)
Investments
This is the risk that in the event of the failure of the counterparty (e.g., broker-dealer) to a transaction, a government will not be able to recover the value of its investment or collateral securities that are in the possession of another party. The City does not have a custodial credit risk policy.
33 (Continued)
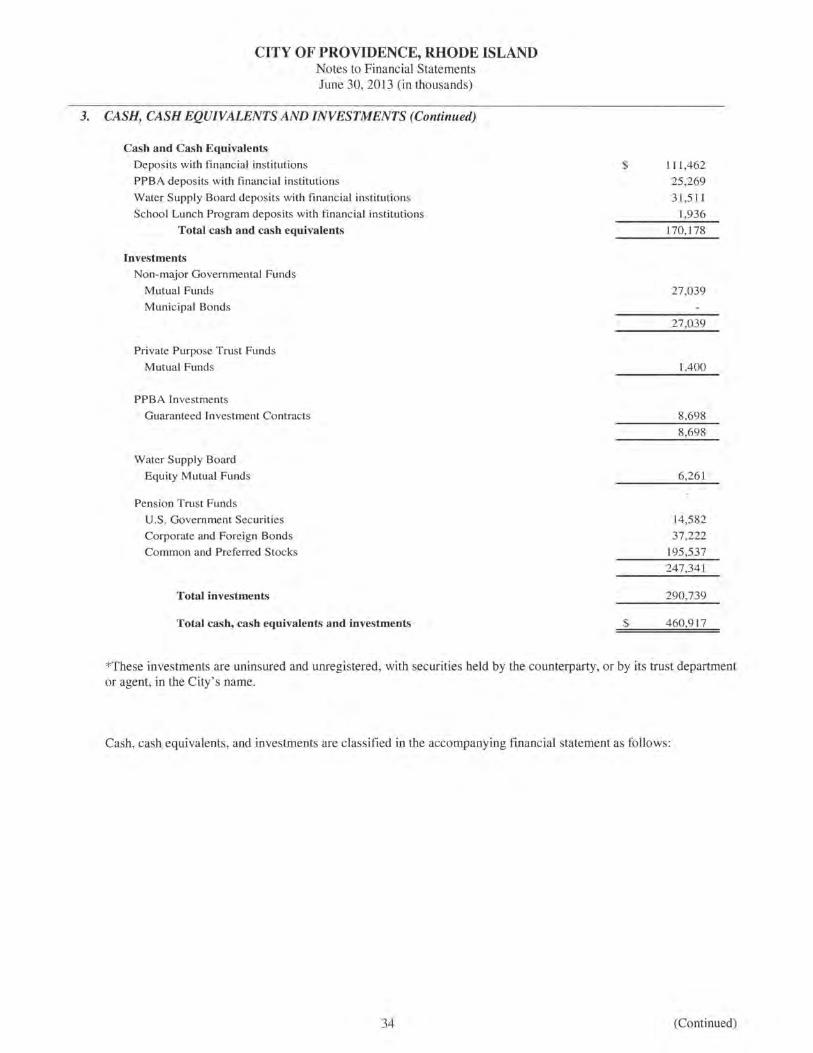
CITY OF PROVIDENCE, RHODE ISLAND Notes to Financial Statements June 30, 2013 (in thousands)
3. CASH, CASH EQUIVALENTS AND INVESTMENTS (Continued)
Cash and Cash Equivalents
Deposits with financial institutions
PPBA deposits with financial institutions
Water Supply Board deposits with financial institutions
School Lunch Program deposits with financial institutions
Total cash and cash equivalents
Investments Non-major Governmental Funds
Mutual Funds
Municipal Bonds
Private Purpose Trust Funds
Mutual Funds
PPBA Investments
Guaranteed Investment Contracts
Water Supply Board
Equity Mutual Funds
Pension Trust Funds
U.S. Government Securities
Corporate and Foreign Bonds
Common and Preferred Stocks
Total investments
Total cash, cash equivalents and investments
$ 111,462
25 ,269
31,511
1,936
170,178
27,039
27,039
1,400
8,698
8,698
6,261
14,582
37,222
195,537
247,341
290,739
$ 460 917
*These investments are uninsured and unregistered, with securities held by the counterparty, or by its trust department or agent, in the City's name.
Cash, cash equivalents, and investments are classified in the accompanying financial statement as follows:
34 (Continued)
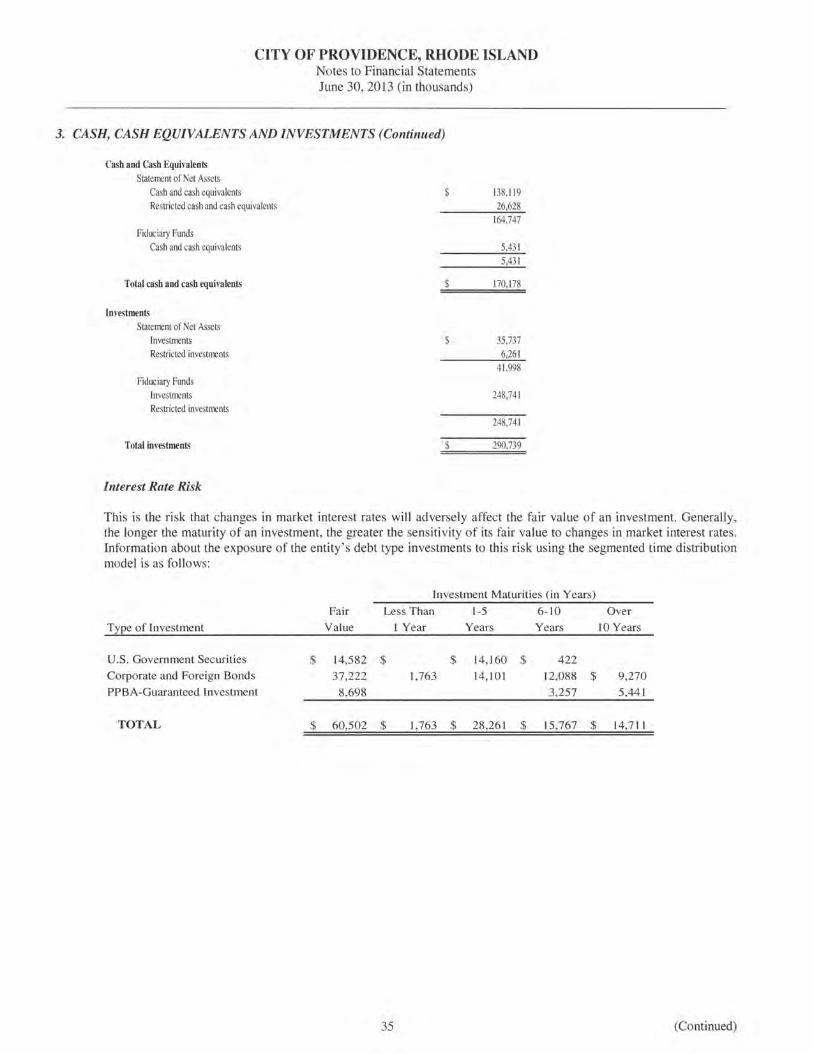
CITY OF PROVIDENCE, RHODE ISLAND Notes to Financial Statements June 30,2013 (in thousands)
3. CASH, CASH EQUIVALENTS AND INVESTMENTS (Continued)
Cash and Cash Equivalents Statement of Net Assets
Cash and cash equivalents Restricted cash and cash equivalents
Fiduciary Funds Cash and cash equivalents
Total cash and cash equivalents
Investments Statement of Net Assets
Investments Restricted investments
Fiduciary Funds Investments Restricted investments
Total investments
Interest Rate Risk
$
$
$
$
138,11 9 26,628
164,747
5,431 5,431
170, 178
35,737 6,261
41,998
248,741
248,741
290,739
This is the risk that changes in market interest rates will adversely affect the fair value of an investment. Generally, the longer the maturity of an investment, the greater the sensitivity of its fair value to changes in market interest rates. Information about the exposure of the entity's debt type investments to this risk using the segmented time distribution model is as follows:
Investment Maturities (in Years)
Fair Less Than 1-5 6-10 Over
Type of Investment Value I Year Years Years 10 Years
U.S . Government Securities $ 14,582 $ $ 14,160 $ 422 Corporate and Foreign Bonds 37,222 1,763 14,101 12,088 $ 9,270 PPBA-Guaranteed Investment 8,698 3,257 5,441
TOTAL $ 60,502 $ 1,763 $ 28,261 $ 15,767 $ 14,711
35 (Continued)
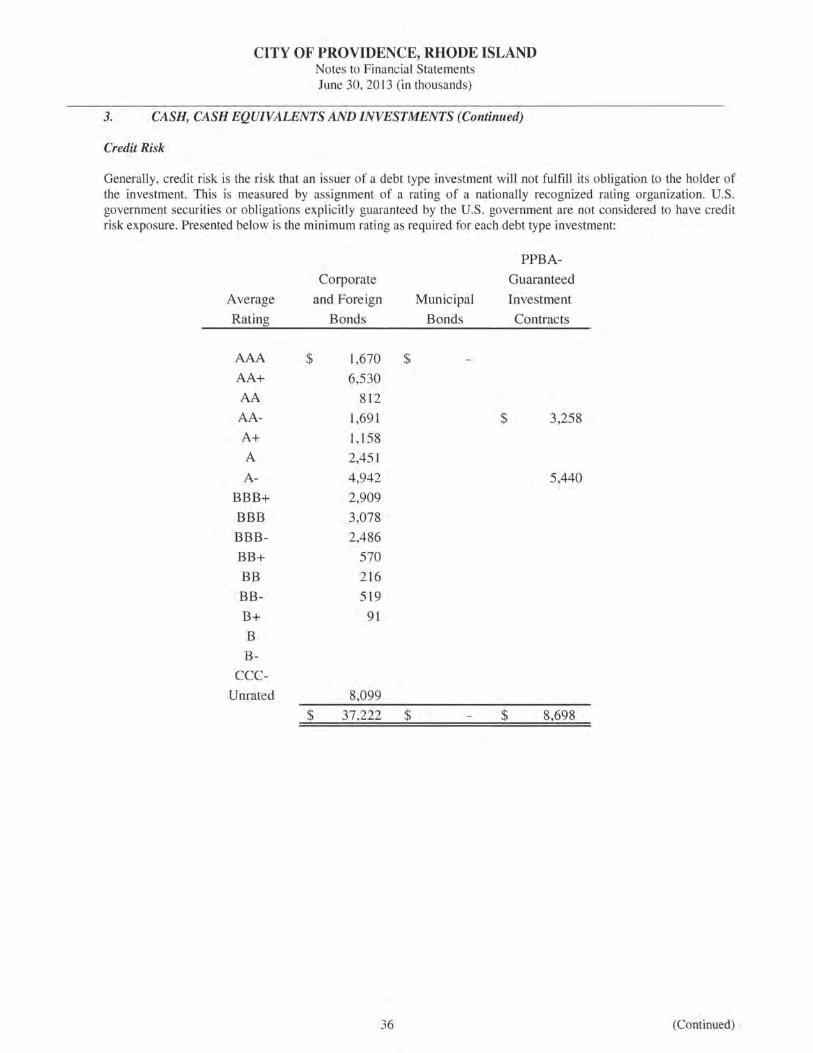
CITY OF PROVIDENCE, RHODE ISLAND Notes to Financial Statements June 30,2013 (in thousands)
3. CASH, CASH EQUIVALENTS AND INVESTMENTS (Continued)
Credit Risk
Generally, credit risk is the risk that an issuer of a debt type investment will not fulfill its obligation to the holder of the investment. This is measured by assignment of a rating of a nationally recognized rating organization. U.S. government securities or obligations explicitly guaranteed by the U.S. government are not considered to have credit risk exposure. Presented below is the minimum rating as required for each debt type investment:
Average
Rating
AAA
AA+
AA
AA
A+
A
A-
BBB+
BBB
BBB
BB+
BB
BB
B+
B B
CCC
Unrated
Corporate
and Foreign
Bonds
$ 1,670 $ 6,530
812
1,691
1,158
2,451
4,942
2,909
3,078
2,486
570
216
519
91
8,099
$ 37,222 $
36
PPBA-
Guaranteed
Municipal Investment
Bonds Contracts
$ 3,258
5,440
$ 8,698
(Continued)
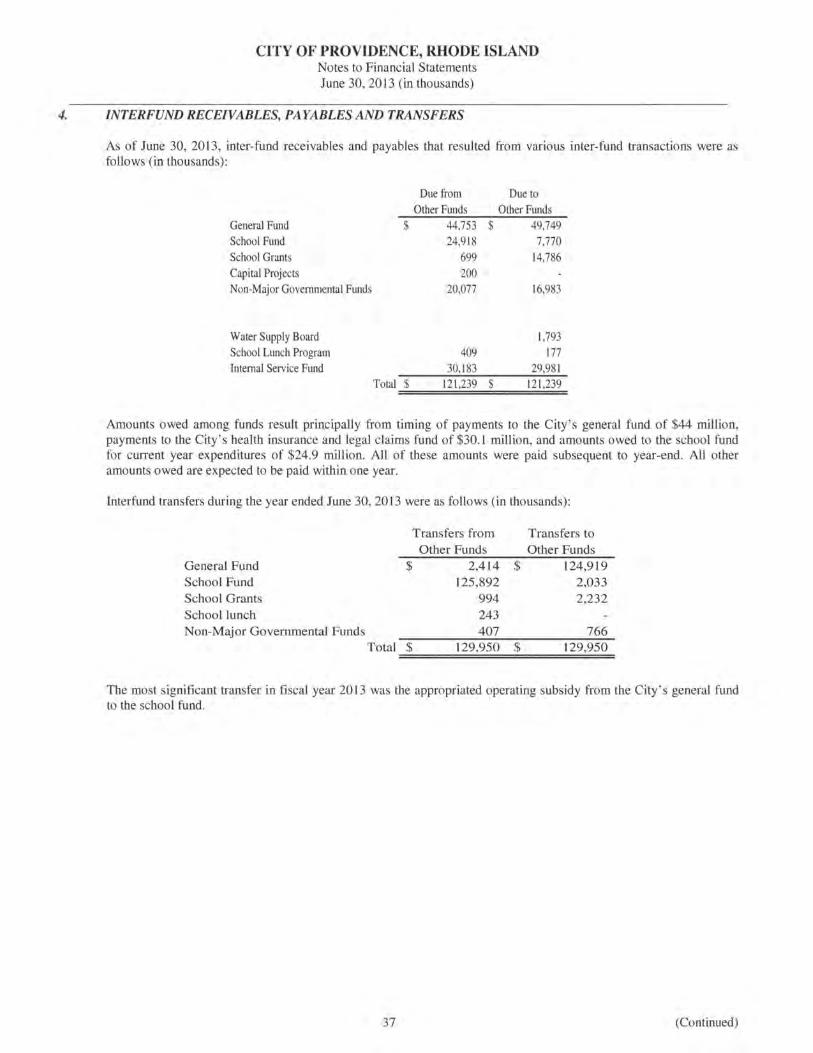
CITY OF PROVIDENCE, RHODE ISLAND Notes to Financial Statements June 30, 2013 (in thousands)
4. INTERFUND RECEIVABLES, PAY ABLES AND TRANSFERS
As of June 30, 2013, inter-fund receivables and payables that resulted from various inter-fund transactions were as follows (in thousands):
Due from Due to Other Funds Other Funds
General Fund $ 44,753 $ 49,749 School Fund 24,918 7,770 School Grants 699 14,786 Capital Projects 200 Non-Major Governmental Funds 20,077 16,983
Water Supply Board 1,793 School Lunch Program 409 177 Internal Service Fund 30,183 29,981
Total $ 121,239 $ 121,239
Amounts owed among funds result principally from timing of payments to the City's general fund of $44 million, payments to the City's health insurance and legal claims fund of $30.1 million, and amounts owed to the school fund for current year expenditures of $24.9 million. All of these amounts were paid subsequent to year-end. All other amounts owed are expected to be paid within one year.
Interfund transfers during the year ended June 30, 2013 were as follows (in thousands):
Transfers from Transfers to Other Funds Other Funds
General Fund $ 2,414 $ 124,919 School Fund 125,892 2,033 School Grants 994 2,232 School lunch 243 Non-Major Governmental Funds 407 766
Total $ 129,950 $ 129,950
The most significant transfer in fiscal year 2013 was the appropriated operating subsidy from the City's general fund to the school fund.
37 (Continued)
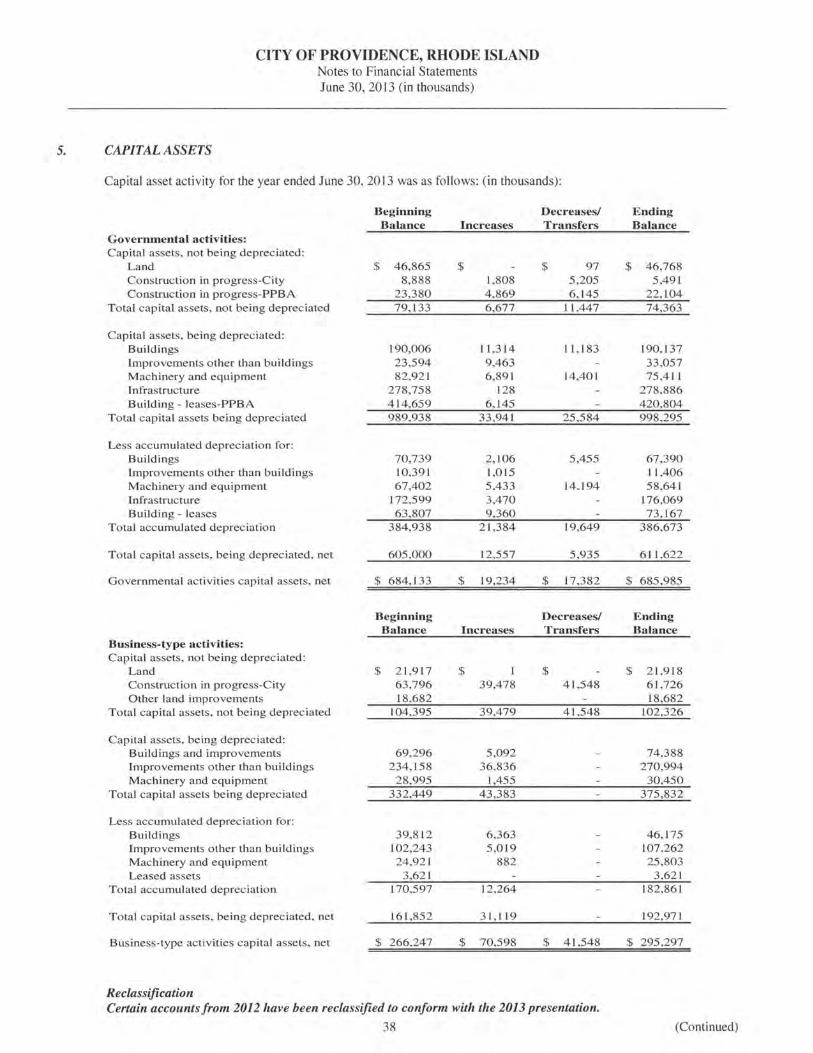
5. CAPITAL ASSETS
CITY OF PROVIDENCE, RHODE ISLAND Notes to Financial Statements June 30, 2013 (in thousands)
Capital asset activity for the year ended June 30, 2013 was as follows: (in thousands):
Beginning Decreases/ Balance Increases Transfers
Governmental activities: Capital assets, not being depreciated:
Land $ 46,865 $ $ 97 Construction in progress-City 8,888 1,808 5,205 Construction in progress-PPBA 23,380 4,869 6,145
Total capital assets, not being depreciated 79,133 6,677 11 ,447
Capital assets, being depreciated: Buildings 190,006 11,314 11 , 183 Improvements other than buildings 23,594 9,463 Machinery and equipment 82,921 6,891 14,401 Infrastructure 278,758 128 Building- leases-PPBA 414,659 6,145
Total capital assets being depreciated 989,938 33,941 25,584
Less accumulated deprecia tion for: Buildings 70,739 2,106 5,455 Improvements other than buildings 10,391 1,015 Machinery and equipment 67,402 5,433 14,194 Infrastructure 172,599 3,470 Building - leases 63,807 9,360
Total accumulated depreciation 384,938 21,384 19,649
Total capital assets, being depreciated, net 605,000 12,557 5,935
Governmental activities capital assets, net $ 684,133 $ 19,234 $ 17,382
Beginning Decreases/ Balance Increases Transfers
Business-type activities: Capital assets, no t being depreciated:
Land $ 21,917 $ $ Construction in progress-City 63,796 39,478 41,548 Other land improvements 18,682
Total capital assets, not being depreciated 104,395 39,479 41,548
Capital assets, being depreciated: Buildings and improvements 69,296 5,092 Improvements other than buildings 234,158 36,836 Machinery and equipment 28,995 1,455
Total capital assets being depreciated 332,449 43,383
Less accumulated depreciation for: Buildings 39,812 6,363 Improvements other than buildings 102,243 5,019 Machinery and equipment 24,921 882 Leased assets 3,621
Total accumulated depreciation 170,597 12,264
Total capital assets, being depreciated, net 161 ,852 31,119
Business-type activities capital assets, net $ 266,247 $ 70,598 $ 41,548
Reclassification Certain accounts from 2012 have been reclassified to conform with the 2013 presentation.
38
Ending Balance
$ 46,768 5,491
22,104 74,363
190,137 33,057 75,411
278,886 420,804 998,295
67,390 11,406 58,641
176,069 73,167
386,673
611,622
$ 685,985
Ending Balance
$ 21,918 61,726 18,682
102,326
74,388 270,994
30,450 375,832
46,175 107,262 25,803
3,621 182,861
192,971
$ 295,297
(Continued)
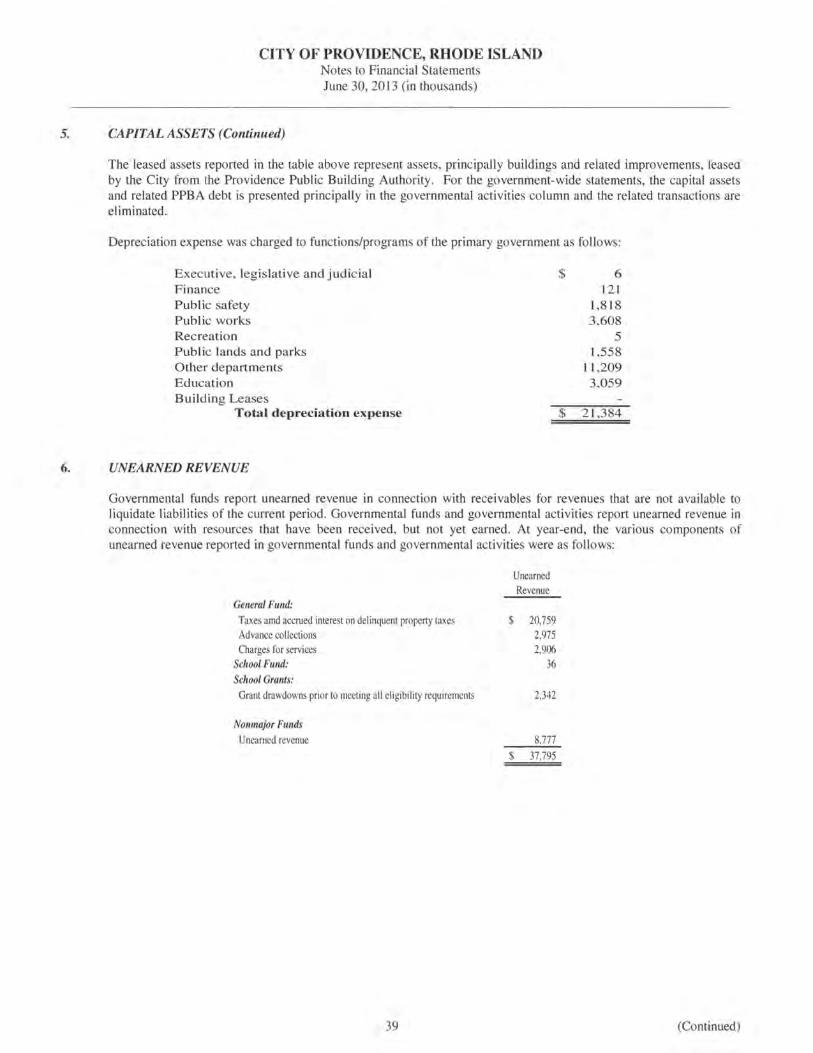
CITY OF PROVIDENCE, RHODE ISLAND Notes to Financial Statements June 30, 2013 (in thousands)
5. CAPITAL ASSETS (Continued)
The leased assets reported in the table above represent assets, principally buildings and related improvements, leased by the City from the Providence Public Building Authority. For the government-wide statements, the capital assets and related PPBA debt is presented principally in the governmental activities column and the related transactions are eliminated.
Depreciation expense was charged to functions/programs of the primary government as follows:
Executive, legislative and judicial $ 6 Finance 121 Public safety 1,818 Public works 3,608 Recreation 5 Public lands and parks 1,558 Other departments 11,209 Education 3,059 Building Leases
Total depreciation expense $ 21,384
6. UNEARNED REVENUE
Governmental funds report unearned revenue in connection with receivables for revenues that are not available to liquidate liabilities of the current period. Governmental funds and governmental activities report unearned revenue in connection with resources that have been received, but not yet earned. At year-end, the various components of unearned revenue reported in governmental funds and governmental activities were as follows:
General Fund: Taxes amd accrued interest on delinquent property taxes Advance collections Charges for services
School Fund: School Grants:
Grant drawdowns prior to meeting all eligibility requirements
Nonmajor Funds Unearned revenue
39
Unearned Revenue
$ 20,759 2,975 2,906
36
2,342
8,777
$ 37,795
(Continued)
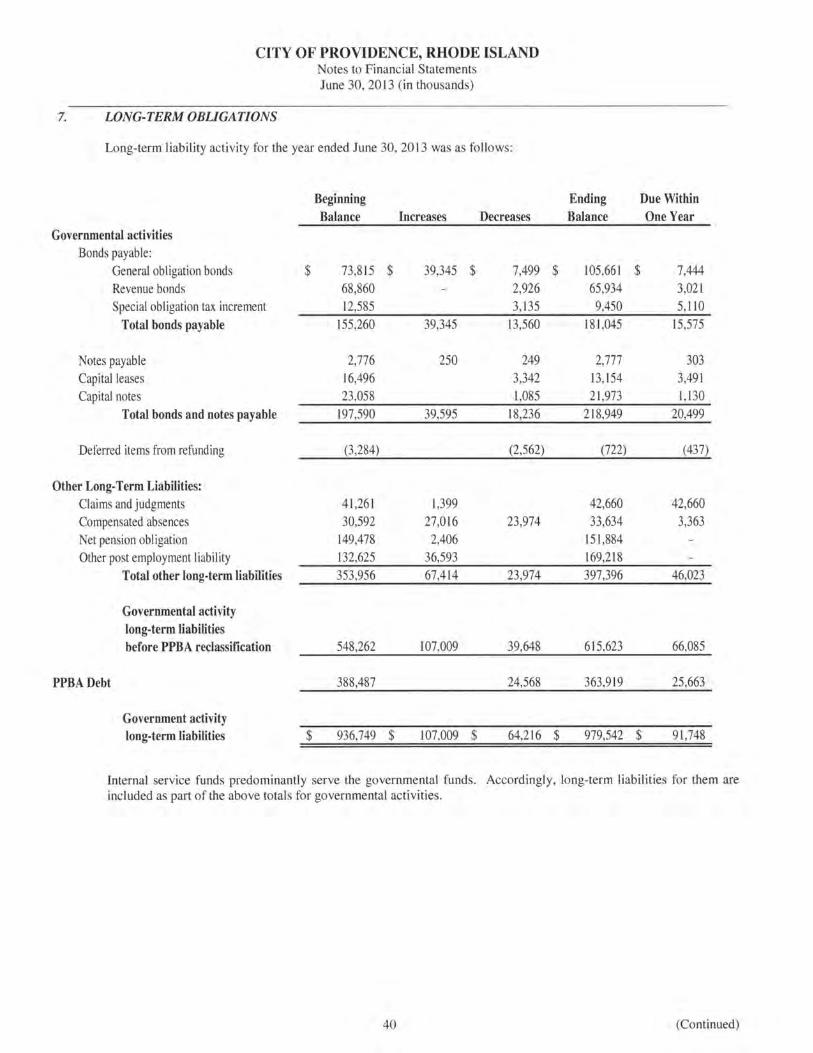
CITY OF PROVIDENCE, RHODE ISLAND Notes to Financial Statements June 30,2013 (in thousands)
7. LONG-TERM OBLIGATIONS
Long-term liability activity for the year ended June 30, 2013 was as follows:
Beginning Ending Due Within Balance Increases Decreases Balance One Year
Governmental activities Bonds payable:
General obligation bonds $ 73,815 $ 39,345 $ 7,499 $ 105,66 1 $ 7,444 Revenue bonds 68,860 2,926 65,934 3,021 Special obligation tax increment 12,585 3,135 9,450 5,110
Total bonds payable 155,260 39,345 13,560 181,045 15,575
Notes payable 2,776 250 249 2,777 303 Capital leases 16,496 3,342 13,154 3,491 Capital notes 23,058 1,085 21,973 1,130
Total bonds and notes payable 197,590 39,595 18,236 218,949 20,499
Deferred items from refunding (3,284) (2,562) (722) (437)
Other Long-Term Liabilities: Claims and judgments 41,261 1,399 42,660 42,660 Compensated absences 30,592 27,016 23,974 33,634 3,363 Net pension obligation 149,478 2,406 151 ,884 Other post employment liability 132,625 36,593 169,2 18
Total other long-term liabilities 353,956 67,414 23,974 397,396 46,023
Governmental activity long-term liabilities before PPBA reclassification 548,262 107,009 39,648 615,623 66,085
PPBADebt 388,487 24,568 363,919 25,663
Government activity long-term liabilities $ 936,749 $ 107,009 $ 64,216 $ 979,542 $ 91,748
Internal service funds predominantly serve the governmental funds. Accordingly, long-term liabilities for them are included as part of the above totals for governmental activities.
40 (Continued)
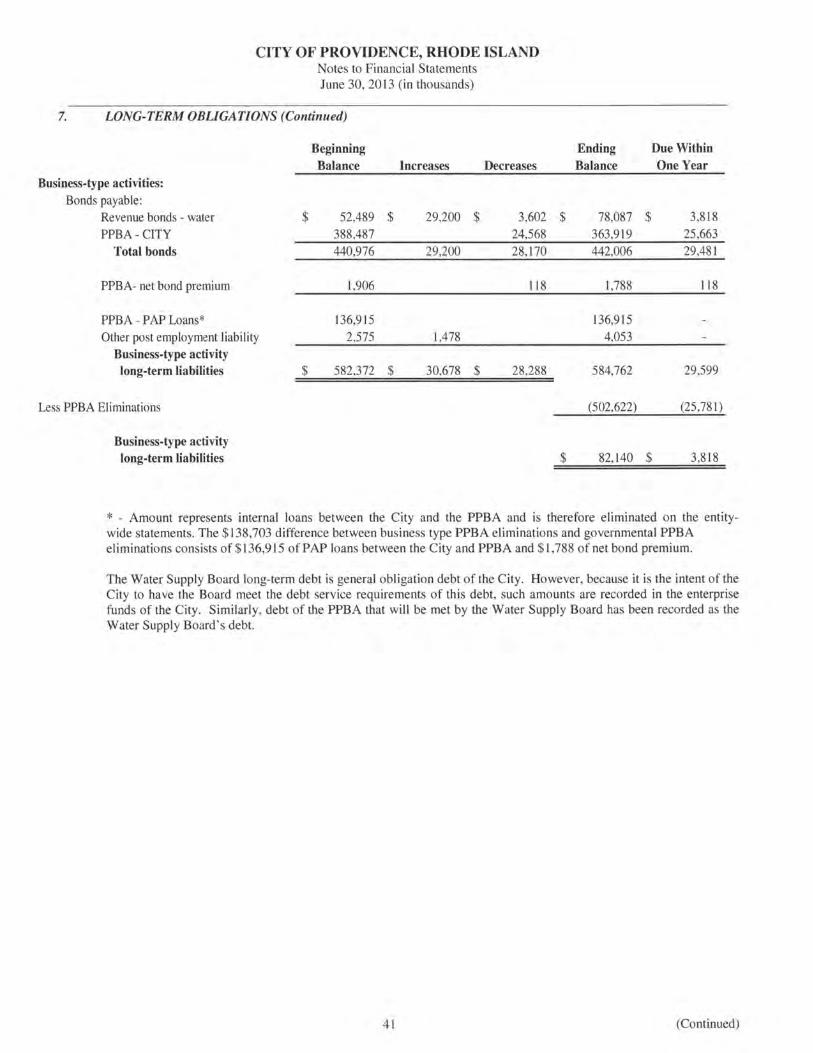
CITY OF PROVIDENCE, RHODE ISLAND Notes to Financial Statements June 30,2013 (in thousands)
7. LONG-TERM OBUGATIONS (Continued)
Beginning Ending Due Within
Balance Increases Decreases Balance One Year
Business-type activities: Bonds payable:
Revenue bonds - water $ 52,489 $ 29,200 $ 3,602 $ 78,087 $ 3,818
PPBA- CITY 388,487 24,568 363,919 25,663
Total bonds 440,976 29,200 28,170 442,006 29,481
PPBA- net bond premium 1,906 118 1,788 118
PPBA- PAP Loans* 136,9 15 136,9 15
Other post employment liability 2,575 1,478 4,053 Business-type activity
long-term liabilities $ 582,372 $ 30,678 $ 28,288 584,762 29,599
Less PPBA Eliminations (502,622) (25,781)
Business-type activity long-term liabilities $ 82,140 $ 3,818
* - Amount represents internal loans between the City and the PPBA and is therefore eliminated on the entitywide statements. The $138,703 difference between business type PPBA eliminations and governmental PPBA eliminations consists of $ 136,9 15 of PAP loans between the City and PPBA and $1 ,788 of net bond premium.
The Water Supply Board long-term debt is general obligation debt of the City. However, because it is the intent of the City to have the Board meet the debt service requirements of this debt, such amounts are recorded in the enterprise funds of the City. Similarly, debt of the PPBA that will be met by the Water Supply Board has been recorded as the Water Supply Board's debt.
41 (Continued)
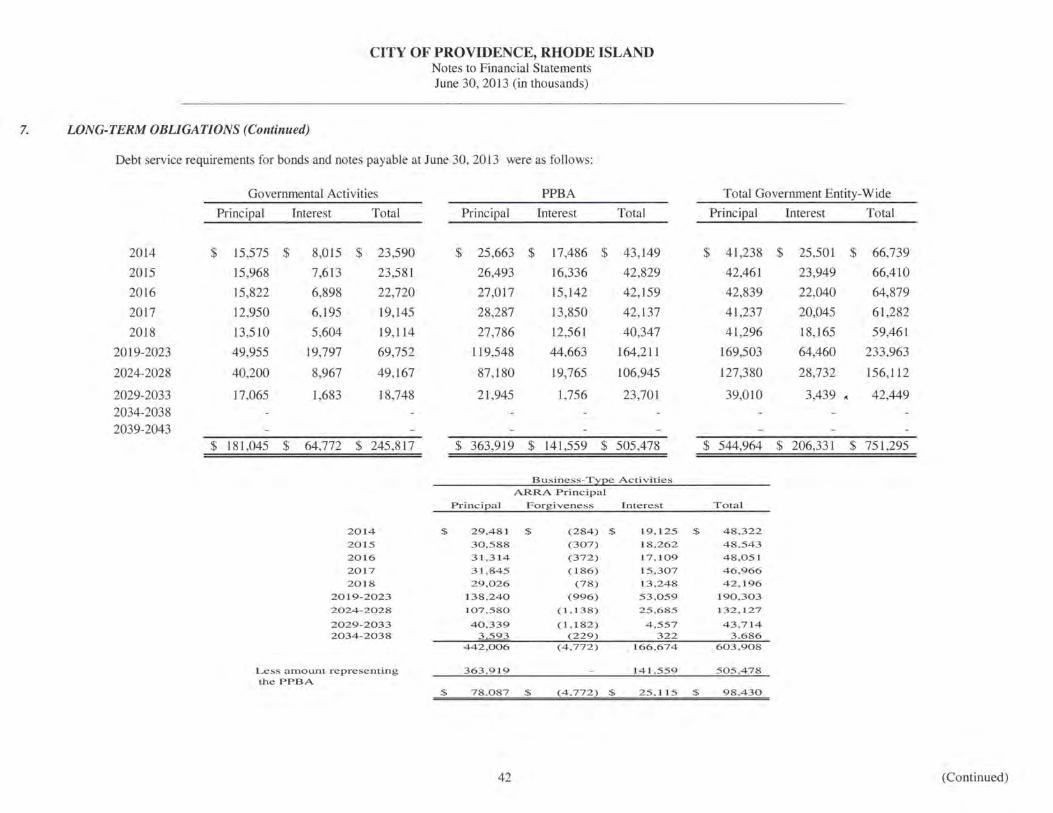
CITY OF PROVIDENCE, RHODE ISLAND Notes to Financial Statements June 30, 2013 (in thousands)
7. LONG-TERM OBUGATIONS (Continued)
Debt service requirements for bonds and notes payable at June 30, 2013 were as follows:
Governmental Activities PPBA Total Government Entity-Wide
Principal Interest Total Principal Interest Total Principal Interest Total
2014 $ 15,575 $ 8,015 $ 23,590 $ 25,663 $ 17,486 $ 43,149 $ 41,238 $ 25,501 $ 66,739
2015 15,968 7,613 23,581 26,493 16,336 42,829 42,461 23,949 66,410
2016 15,822 6,898 22,720 27,017 15,142 42,159 42,839 22,040 64,879
2017 12,950 6,195 19,145 28,287 13,850 42,137 41,237 20,045 61,282
2018 13,510 5,604 19,114 27,786 12,561 40,347 41,296 18,165 59,461
2019-2023 49,955 19,797 69,752 119,548 44,663 164,211 169,503 64,460 233,963
2024-2028 40,200 8,967 49,167 87,180 19,765 106,945 127,380 28,732 156,112
2029-2033 17,065 1,683 18,748 21,945 1,756 23,701 39,010 3,439 • 42,449 2034-2038 2039-2043
$ 181,045 $ 64,772 $ 245,817 $ 363,919 $ 141,559 $ 505,478 $ 544,964 $ 206,331 $ 751,295
Business-T~12e Activities ARRA. Principal
Principal Forgiveness Interest Total
2014 $ 29,481 $ (284) $ 19, 125 $ 48,322
2015 30,588 (307) 18,262 48,543
2016 31,314 (372) 17, 109 48,051
2017 31,845 (186) 15 ,307 46,966
2018 29,026 (78) 13 ,248 42, 196
2019-2023 138,240 (996) 53,059 190,303
2024-2028 107,580 (1,138) 25,685 132, 127
2029-2033 40,339 (1,182) 4 ,557 43,714 2034-2038 3 593 (229) 322 3.686
442,006 (4,772) 166,674 603 ,908
Less amount representing 363,919 141 ,559 505,478 the PPBA
$ 78 ,087 $ (4,772) $ 25,115 $ 98,430
42 (Continued)
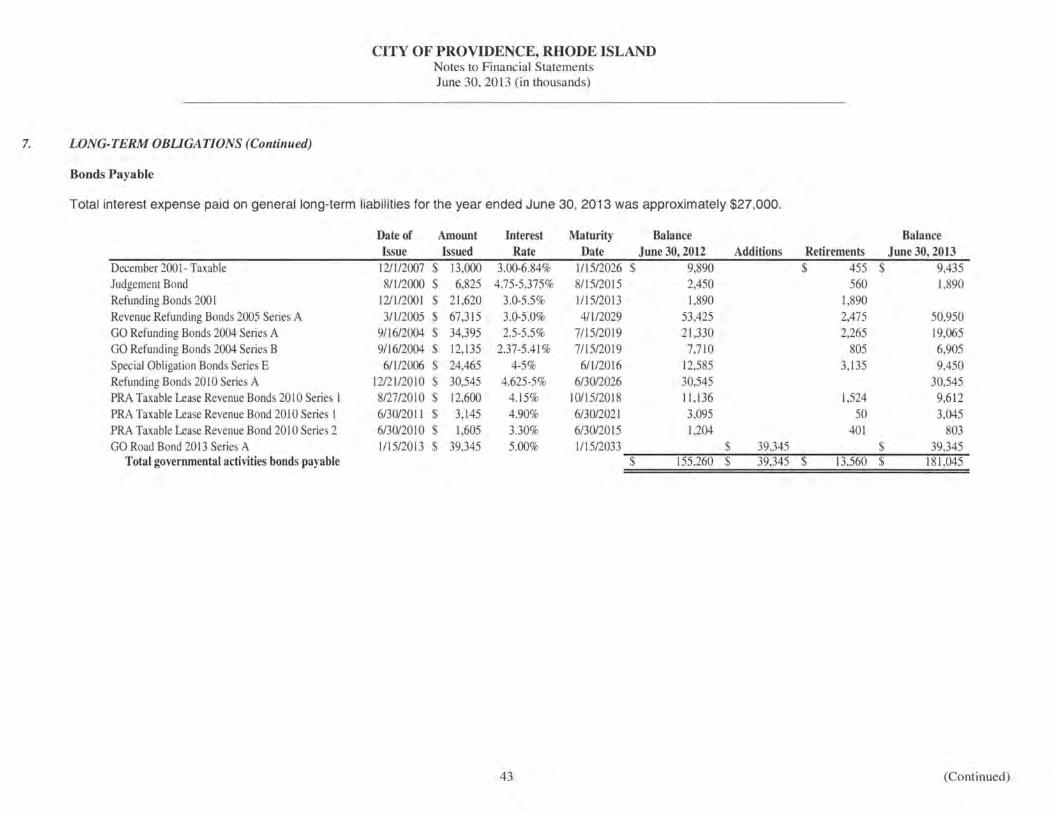
7. LONG-TERM OBUGATIONS (Continued)
Bonds Payable
CITY OF PROVIDENCE, RHODE ISLAND Notes to Financial Statements June 30,2013 (in thousands)
Total interest expense paid on general long-term liabilities for the year ended June 30, 2013 was approximately $27,000.
Date of Amount Interest Maturity Balance Issue Issued Rate Date June 30, 2012 Additions
December 2001- Taxable 12/1/2007 $ 13,000 3.00-6.84% l/15/2026 $ 9,890 Judgement Bond 8/1/2000 $ 6,825 4.75-5.375% 8/15/2015 2,450 Refunding Bonds 2001 12/1/2001 $ 21,620 3.0-5.5% 1/15/2013 1,890 Revenue Refunding Bonds 2005 Series A 3/1/2005 $ 67,315 3.0-5.0% 4/1/2029 53,425 GO Refunding Bonds 2004 Series A 9/16/2004 $ 34,395 2.5-5.5% 7/15/2019 21,330 GO Refunding Bonds 2004 Series B 9/16/2004 $ 12,135 2.37-5.41% 7115/2019 7,710 Special Obligation Bonds Series E 6/1/2006 $ 24,465 4-5% 6/1/2016 12,585 Refunding Bonds 2010 Series A 12/21/2010 $ 30,545 4.625-5% 6/30/2026 30,545 PRA Taxable Lease Revenue Bonds 20 I 0 Series I 8/27/2010 $ 12,600 4.15% 10/15/2018 11,136 PRA Taxable Lease Revenue Bond 2010 Series I 6/30/2011 $ 3,145 4.90% 6/30/2021 3,095 PRA Taxable Lease Revenue Bond 20 I 0 Series 2 6/30/2010 $ 1,605 3.30% 6/30/2015 1,204 GO Road Bond 2013 Series A 1/15/2013 $ 39,345 5.00% 1/15/2033 $ 39,345
Total governmental activities bonds payable $ 155,260 $ 39,345
43
Balance Retirements June 30, 2013
$ 455 $ 9,435 560 1,890
1,890 2,475 50,950 2,265 19,065
805 6,905 3,135 9,450
30,545 1,524 9,612
50 3,045 401 803
$ 39,345 $ 13,560 $ 181,045
(Continued)
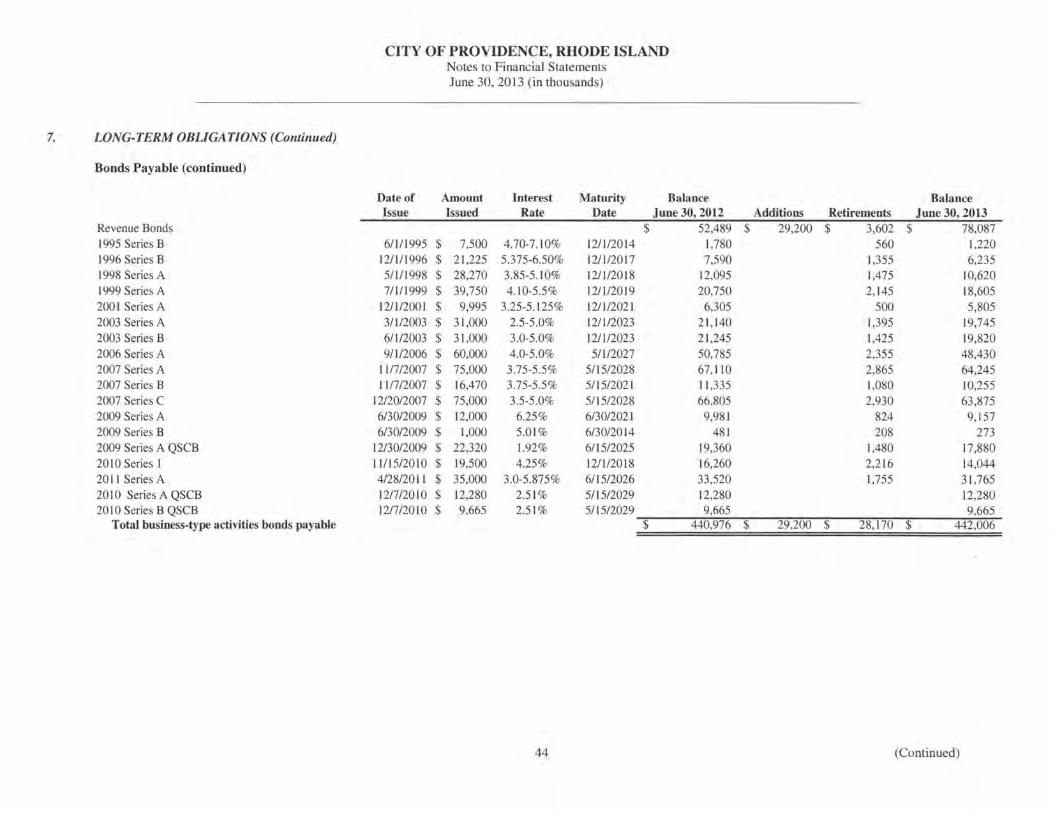
7. LONG-TERM OBUGATIONS (Continued)
Bonds Payable (continued)
Revenue Bonds 1995 Series B 1996 Series B 1998 Series A 1999 Series A 200 I Series A 2003 Series A 2003 Series B 2006 Series A 2007 Series A 2007 Series B 2007 Series C 2009 Series A 2009 Series B 2009 Series A QSCB 20 I 0 Series I 20 II Series A 2010 Series A QSCB 20 I 0 Series B QSCB
Total business-type activities bonds payable
CITY OF PROVIDENCE, RHODE ISLAND Notes to Financial Statements June 30, 2013 (in thousands)
Date of Amount Interest Maturity Balance Issue Issued Rate Date June 30,2012
$ 52,489 6/l/1995 $ 7,500 4.70-7.10% 12/1/2014 1,780
12/l/1996 $ 21,225 5.375-6.50% 12/l/2017 7,590 5/l/1998 $ 28,270 3.85-5.10% 12/l/2018 12,095 7/l/!999 $ 39,750 4.10-5.5% 12/112019 20,750
12/1/2001 $ 9,995 3.25-5.125% 12/l/2021 6,305 3/112003 $ 31,000 2.5-5.0% 12/l/2023 21,140 6/l/2003 $ 31 ,000 3.0-5.0% 12/112023 21,245 9/1/2006 $ 60,000 4.0-5 .0% 5/l/2027 50,785
1117/2007 $ 75,000 3.75-5.5% 5/15/2028 67,110 1117/2007 $ 16,470 3.75-5.5% 5/15/2021 11 ,335
12/20/2007 $ 75,000 3.5-5.0% 5/15/2028 66,805 6/30/2009 $ 12,000 6.25% 6/30/2021 9,981 6/30/2009 $ 1,000 5.01 % 6/30/2014 481
12/30/2009 $ 22,320 1.92% 6/15/2025 19,360 11115/2010 $ 19,500 4.25% 12/112018 16,260 4/28/20 11 $ 35,000 3.0-5.875% 6/15/2026 33,520 1217/2010 $ 12,280 2.51 % 5/15/2029 12,280 1217/2010 $ 9,665 2.51 % 5/15/2029 9,665
$ 440,976
44
Balance Additions Retirements June 30, 2013
$ 29,200 $ 3,602 $ 78,087 560 1,220
1,355 6,235 1,475 10,620 2,145 18,605
500 5,805 1,395 19,745 1,425 19,820 2,355 48,430 2,865 64,245 1,080 10,255 2,930 63,875
824 9,157 208 273
1,480 17,880 2,216 14,044 1,755 31,765
12,280 9,665
$ 29,200 $ 28, 170 $ 442,006
(Continued)
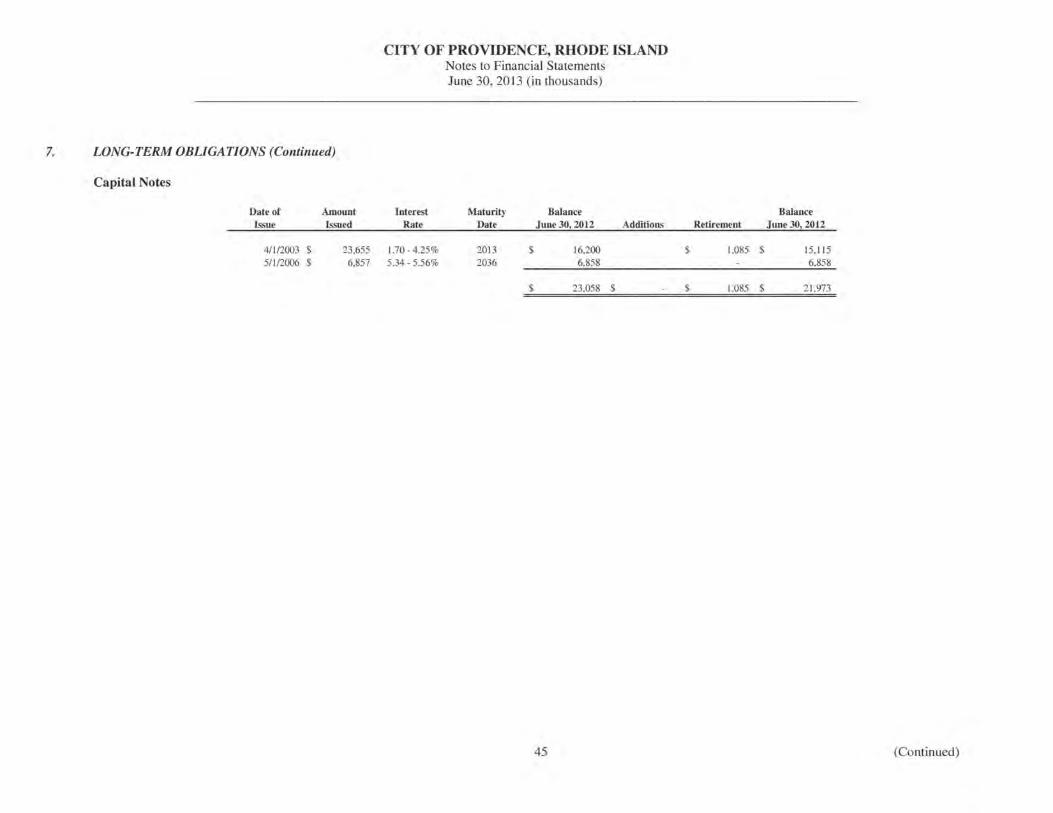
CITY OF PROVIDENCE, RHODE ISLAND Notes to Financial Statements June 30, 2013 (in thousands)
7. LONG-TERM OBUGATIONS (Continued)
Capital Notes
Date of Issue
4/112003 $ 511/2006 $
Amount Issued
Interest Rate
23,655 1.70- 4.25% 6,857 5.34- 5.56%
Maturity Date
2013 2036
$
$
Balance June 30, 2012
45
16,200 6.858
23,058 $
Additions Retirement
$ 1,085 $
$ 1,085 $
Balance June 30,2012
15,115 6,858
21 ,973
(Continued)
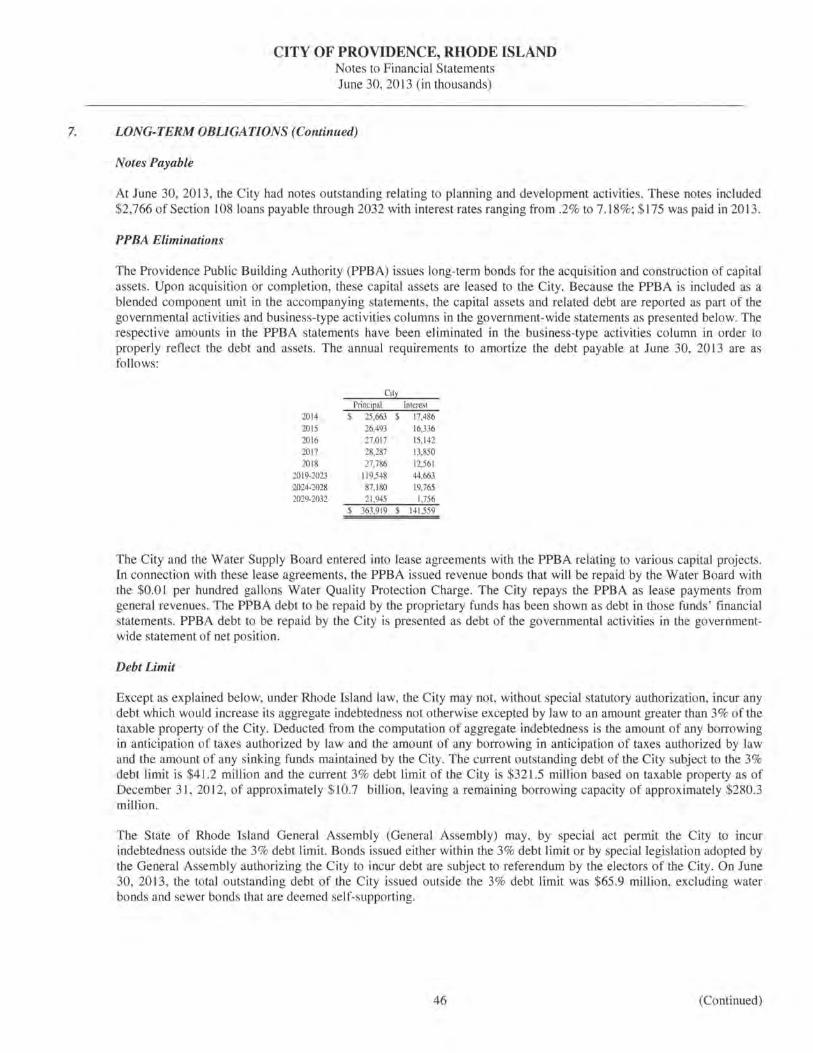
CITY OF PROVIDENCE, RHODE ISLAND Notes to Financial Statements June 30,2013 (in thousands)
7. LONG-TERM OBLIGATIONS (Continued)
Notes Payable
At June 30, 2013, the City had notes outstanding relating to planning and development activities. These notes included $2,766 of Section I 08 loans payable through 2032 with interest rates ranging from .2% to 7.18%; $175 was paid in 2013.
PPBA Eliminations
The Providence Public Building Authority (PPBA) issues long-term bonds for the acquisition and construction of capital assets. Upon acquisition or completion, these capital assets are leased to the City. Because the PPBA is included as a blended component unit in the accompanying statements, the capital assets and related debt are reported as part of the governmental activities and business-type activities columns in the government-wide statements as presented below. The respective amounts in the PPBA statements have been eliminated in the business-type activities column in order to properly reflect the debt and assets. The annual requirements to amortize the debt payable at June 30, 2013 are as follows:
Cit Princi~al Interest
2014 $ 25,663 $ 17,486 2015 26,493 16,336 2016 27,017 15,142 20 17 28,287 13,850 20 18 27,786 12,561
20 19-2023 119,548 44,663 2024-2028 87,180 19,765 2029-2032 21,945 1,756
$ 363,919 141 ,559
The City and the Water Supply Board entered into lease agreements with the PPBA relating to various capital projects. In connection with these lease agreements, the PPBA issued revenue bonds that will be repaid by the Water Board with the $0.01 per hundred gallons Water Quality Protection Charge. The City repays the PPBA as lease payments from general revenues. The PPBA debt to be repaid by the proprietary funds has been shown as debt in those funds' financial statements. PPBA debt to be repaid by the City is presented as debt of the governmental activities in the governmentwide statement of net position.
Debt Limit
Except as explained below, under Rhode Island law, the City may not, without special statutory authorization, incur any debt which would increase its aggregate indebtedness not otherwise excepted by law to an amount greater than 3% of the taxable property of the City. Deducted from the computation of aggregate indebtedness is the amount of any borrowing in anticipation of taxes authorized by law and the amount of any borrowing in anticipation of taxes authorized by law and the amount of any sinking funds maintained by the City. The current outstanding debt of the City subject to the 3% debt limit is $41.2 million and the current 3% debt limit of the City is $321.5 million based on taxable property as of December 31, 2012, of approximately $10.7 billion, leaving a remaining borrowing capacity of approximately $280.3 million.
The State of Rhode Island General Assembly (General Assembly) may, by special act permit the City to incur indebtedness outside the 3% debt limit. Bonds issued either within the 3% debt limit or by special legislation adopted by the General Assembly authorizing the City to incur debt are subject to referendum by the electors of the City. On June 30, 2013, the total outstanding debt of the City issued outside the 3% debt limit was $65.9 million, excluding water bonds and sewer bonds that are deemed self-supporting.
46 (Continued)
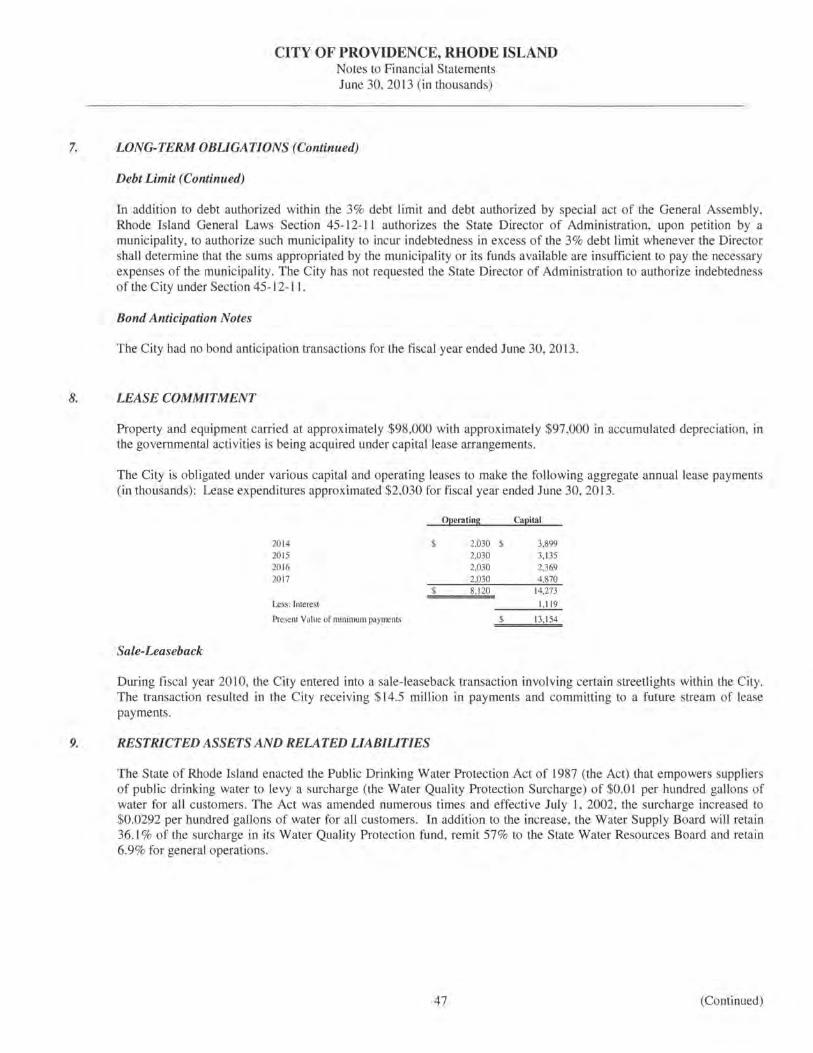
CITY OF PROVIDENCE, RHODE ISLAND Notes to Financial Statements June 30,2013 (in thousands)
7. LONG-TERM OBLIGATIONS (Continued)
Debt Limit (Continued)
In addition to debt authorized within the 3% debt limit and debt authorized by special act of the General Assembly, Rhode Island General Laws Section 45-12- 11 authorizes the State Director of Administration, upon petition by a municipality, to authorize such municipality to incur indebtedness in excess of the 3% debt limit whenever the Director shall determine that the sums appropriated by the municipality or its funds available are insufficient to pay the necessary expenses of the municipality. The City has not requested the State Director of Administration to authorize indebtedness of the City under Section 45-12-11.
Bond Anticipation Notes
The City had no bond anticipation transactions for the fiscal year ended June 30, 2013.
8. LEASE COMMITMENT
Property and equipment carried at approximately $98,000 with approximately $97,000 in accumulated depreciation, in the governmental activities is being acquired under capital lease arrangements.
The City is obligated under various capital and operating leases to make the following aggregate annual lease payments (in thousands): Lease expenditures approximated $2,030 for fiscal year ended June 30, 2013.
Operating Capital
20 14 $ 2,030 $ 3,899 20 15 2,030 3, 135 20 16 2,030 2,369 20 17 2,030 4,870
$ 8, 120 14,273 Less: Interest 1, 11 9
Present Value of minimum payments $ 13, 154
Sale-Leaseback
During fiscal year 20 I 0, the City entered into a sale-leaseback transaction involving certain streetlights within the City. The transaction resulted in the City receiving $14.5 million in payments and committing to a future stream of lease payments.
9. RESTRICTED ASSETS AND RELATED LIABILITIES
The State of Rhode Island enacted the Public Drinking Water Protection Act of 1987 (the Act) that empowers suppliers of public drinking water to levy a surcharge (the Water Quality Protection Surcharge) of $0.01 per hundred gallons of water for all customers. The Act was amended numerous times and effective July I, 2002, the surcharge increased to $0.0292 per hundred gallons of water for all customers. In addition to the increase, the Water Supply Board will retain 36.1 % of the surcharge in its Water Quality Protection fund, remit 57% to the State Water Resources Board and retain 6.9% for general operations.
47 (Continued)
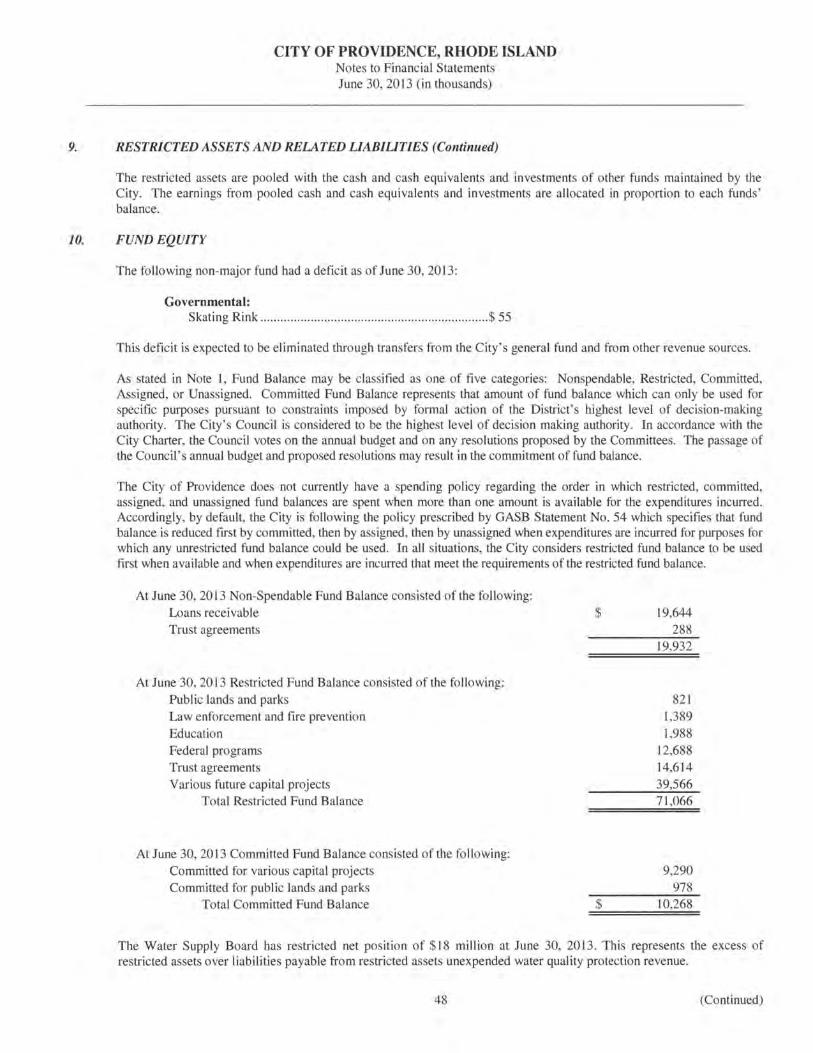
CITY OF PROVIDENCE, RHODE ISLAND Notes to Financial Statements June 30, 2013 (in thousands)
9. RESTRICTED ASSETS AND RELATED LIABILITIES (Continued)
The restricted assets are pooled with the cash and cash equivalents and investments of other funds maintained by the City. The earnings from pooled cash and cash equivalents and investments are allocated in proportion to each funds ' balance.
10. FUND EQUITY
The following non-major fund had a deficit as of June 30, 2013:
Governmental: Skating Rink .............. ...... ........ ........................................ $ 55
This deficit is expected to be eliminated through transfers from the City 's general fund and from other revenue sources.
As stated in Note l , Fund Balance may be classified as one of five categories: Nonspendable, Restricted, Committed, Assigned, or Unassigned. Committed Fund Balance represents that amount of fund balance which can only be used for specific purposes pursuant to constraints imposed by formal action of the District's highest level of decision-making authority. The City's Council is considered to be the highest level of decision making authority. In accordance with the City Charter, the Council votes on the annual budget and on any resolutions proposed by the Committees. The passage of the Council's annual budget and proposed resolutions may result in the commitment of fund balance.
The City of Providence does not currently have a spending policy regarding the order in which restricted, committed, assigned, and unassigned fund balances are spent when more than one amount is available for the expenditures incurred. Accordingly, by default, the City is following the policy prescribed by GASB Statement No. 54 which specifies that fund balance is reduced first by committed, then by assigned, then by unassigned when expenditures are incurred for purposes for which any unrestricted fund balance could be used. In all situations, the City considers restricted fund balance to be used first when available and when expenditures are incurred that meet the requirements of the restricted fund balance.
At June 30, 2013 Non-Spendable Fund Balance consisted of the following: Loans receivable Trust agreements
At June 30, 2013 Restricted Fund Balance consisted of the following: Public lands and parks Law enforcement and fire prevention Education Federal programs Trust agreements Various future capital projects
Total Restricted Fund Balance
At June 30, 2013 Committed Fund Balance consisted of the following: Committed for various capital projects Committed for public lands and parks
Total Committed Fund Balance
$
$
19,644 288
19,932
821 1,389 1,988
12,688 14,614 39,566 71 ,066
9,290 978
10,268
The Water Supply Board has restricted net position of $18 million at June 30, 2013. This represents the excess of restricted assets over liabilities payable from restricted assets unexpended water quality protection revenue.
48 (Continued)
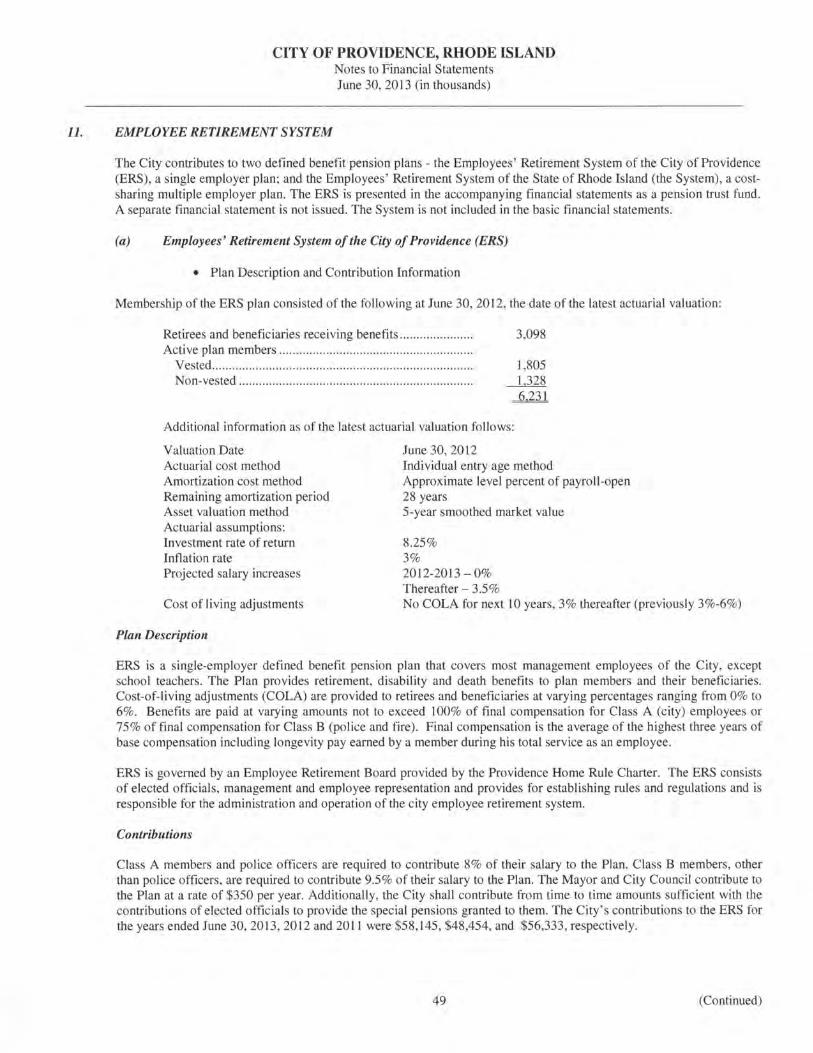
CITY OF PROVIDENCE, RHODE ISLAND Notes to Financial Statements June 30, 2013 (in thousands)
11. EMPLOYEE RETIREMENT SYSTEM
The City contributes to two defined benefit pension plans - the Employees' Retirement System of the City of Providence (ERS), a single employer plan; and the Employees' Retirement System of the State of Rhode Island (the System), a costsharing multiple employer plan. The ERS is presented in the accompanying financial statements as a pension trust fund. A separate financial statement is not issued. The System is not included in the basic financial statements.
(a) Employees' Retirement System of the City of Providence (ERS)
• Plan Description and Contribution Information
Membership of the ERS plan consisted of the following at June 30, 2012, the date of the latest actuarial valuation:
Retirees and beneficiaries receiving benefits .... ..... ... ... ..... .. Active plan members .. .. .... .... ...... .. .... .. .............................. ..
Vested ... ..... .. ... .. .. ...... ...... .. ............... .. ........ ......... ...... ... .. . . Non-vested ............. ....... .............. .......... ....... .... ........ ..... . .
3,098
1,805
~ 6.231
Additional information as of the latest actuarial valuation follows:
Valuation Date Actuarial cost method Amortization cost method Remaining amortization period Asset valuation method Actuarial assumptions: Investment rate of return Inflation rate Projected salary increases
June 30, 2012 Individual entry age method Approximate level percent of payroll-open 28 years 5-year smoothed market value
8.25 % 3% 2012-2013-0% Thereafter- 3.5%
Cost of living adjustments No COLA for next lO years, 3% thereafter (previously 3%-6%)
Plan Description
ERS is a single-employer defined benefit pension plan that covers most management employees of the City, except school teachers . The Plan provides retirement, disability and death benefits to plan members and their beneficiaries. Cost-of-living adjustments (COLA) are provided to retirees and beneficiaries at varying percentages ranging from 0% to 6%. Benefits are paid at varying amounts not to exceed 100% of final compensation for Class A (city) employees or 75% of final compensation for Class B (police and fire) . Final compensation is the average of the highest three years of base compensation including longevity pay earned by a member during his total service as an employee.
ERS is governed by an Employee Retirement Board provided by the Providence Home Rule Charter. The ERS consists of elected officials, management and employee representation and provides for establishing rules and regulations and is responsible for the administration and operation of the city employee retirement system.
Contributions
Class A members and police officers are required to contribute 8% of their salary to the Plan. Class B members, other than police officers, are required to contribute 9.5% of their salary to the Plan. The Mayor and City Council contribute to the Plan at a rate of $350 per year. Additionally, the City shall contribute from time to time amounts sufficient with the contributions of elected officials to provide the special pensions granted to them. The City's contributions to the ERS for the years ended June 30, 2013, 2012 and 2011 were $58,145,$48,454, and $56,333, respectively.
49 (Continued)
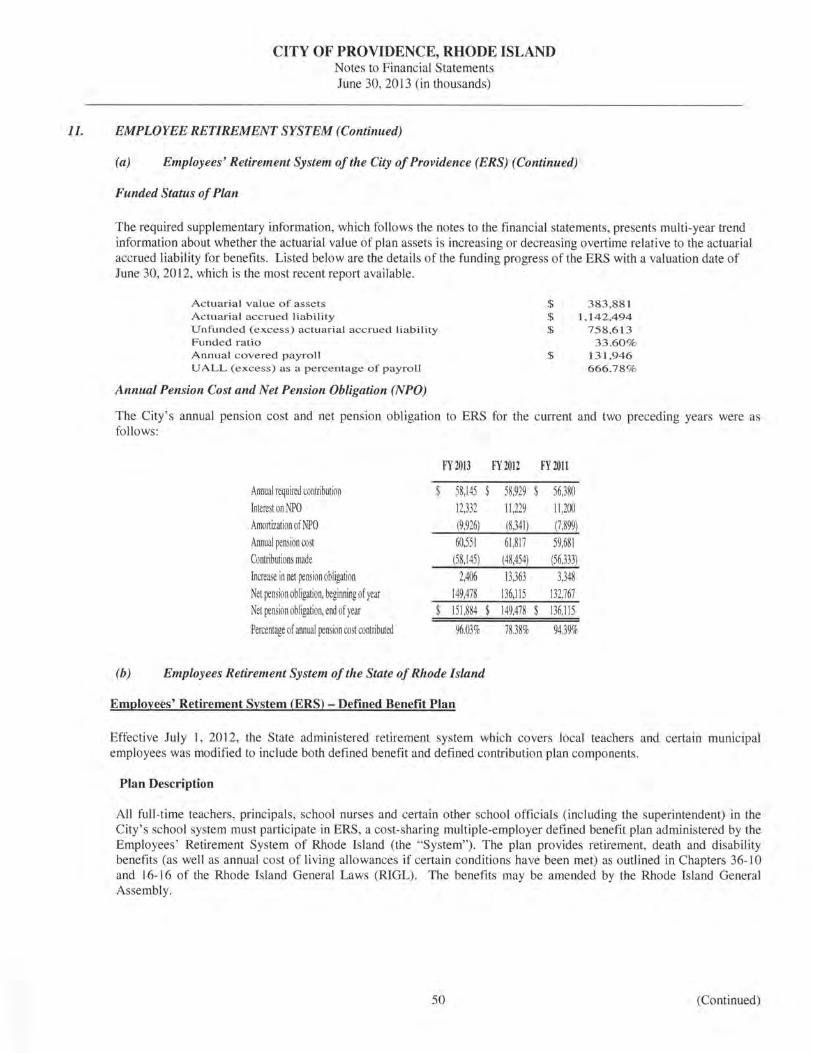
CITY OF PROVIDENCE, RHODE ISLAND Notes to Financial Statements June 30,2013 (in thousands)
11. EMPLOYEE RETIREMENT SYSTEM (Continued)
(a) Employees' Retirement System of the City of Providence (ERS) (Continued)
Funded Status of Plan
The required supplementary information, which follows the notes to the financial statements, presents multi-year trend information about whether the actuarial value of plan assets is increasing or decreasing overtime relative to the actuarial accrued liability for benefits. Listed below are the details of the funding progress of the ERS with a valuation date of June 30, 2012, which is the most recent report available.
Actuarial value of assets Actuarial accrued liability Unfunded (excess) actuarial accrued li ab ility Funded ratio Annual covered payroll UALL (excess) as a percentage of payroll
Annual Pension Cost and Net Pension Obligation (NPO)
$ 383,881 $ I , 142,494 $ 758,613
33.60% $ 131 ,946
666.78%
The City 's annual pension cost and net pension obligation to ERS for the current and two preceding years were as follows:
FY 2013 FY2012 FY 2011
Annual required contribution 58,145 58,929 56,380 Interest on NPO 12,332 II ,229 11,200 Amortization of NPO {9,926) (8,341) (7,899) Annual pension cost 60,551 61,817 59,681 Contributions made (58,145) (48,454) (56,333) Increase in net pension obligation 2,406 13,363 3,348 Net pension ob ligation, beginning of year 149,478 136,115 132,767 Net pension obligation, end of year 151 ,884 149,478 136,115
Percentage of annual pension cost contributed 96.03% 78.38% 94.39%
(b) Employees Retirement System of the State of Rhode Island
Employees' Retirement System (ERS)- Defined Benefit Plan
Effective July 1, 2012, the State administered retirement system which covers local teachers and certain municipal employees was modified to include both defined benefit and defined contribution plan components.
Plan Description
All full-time teachers, principals, school nurses and certain other school officials (including the superintendent) in the City's school system must participate in ERS, a cost-sharing multiple-employer defined benefit plan administered by the Employees' Retirement System of Rhode Island (the "System"). The plan provides retirement, death and disability benefits (as well as annual cost of living allowances if certain conditions have been met) as outlined in Chapters 36-10 and 16-16 of the Rhode Island General Laws (RIGL). The benefits may be amended by the Rhode Island General Assembly.
50 (Continued)

CITY OF PROVIDENCE, RHODE ISLAND Notes to Financial Statements June 30,2013 (in thousands)
11. EMPLOYEE RETIREMENT SYSTEM (Continued)
(b) Employees Retirement System of the State of Rhode Island (Continued)
Funding Policy
The funding policy is outlined in RIGL sections 16-16-22 and 36-10-2 (which can be amended by the Rhode Island General Assembly). Active plan members must contribute 3.75% of his/her compensation. The City and the State are collectively required to contribute at an actuarially determined rate expressed as a percentage of total compensation paid to the active membership. The employer contribution is split and paid 40% by the State and 60% by the City with the exception of teachers who work in federally funded programs where 100% is paid by the City and reimbursed by the federal government. For fiscal 2013, the total employer rate was 19.29% (7 .88% State share and 11.41 % local share). The State share of the employer contribution rate includes the total cost of prior contribution deferrals which was .28% for fiscal 2013.
The City contributed approximately $16.2 million, $17.9 million, and $15.1 million during the fiscal years 2013, 2012 and 2011, respectively, equal to 100% of the actuarially required contributions for those respective years. For financial reporting purposes, the State's share of contributions are reflected as on behalf-payments and are included as both revenue and expenditures in the accompanying financial statements. The on-behalf contributions for the defined benefit plan for the fiscal year ended June 30,2013 amounted to approximately $ll.l million.
The System issues an annual financial report that includes financial statements and required supplementary information for all of the plans it administers. The reports can be obtained at www.ersri .org
Teachers Defined Contribution Pension Plan
Plan Description
Employees participating in the defined benefit plan(s), as described above, also participate in a defined contribution plan of the Employees ' Retirement System as authorized by General Law Chapter 36-10.3. The defined contribution plan is established under IRS section 40 l(a) and is administered by TIAA-CREF and the Employees' Retirement System of Rhode Island (the System). Employees may choose among various investment options available to plan participants.
Employee contributions are immediately vested while employer contributions are vested after three years of contributory service. Contributions required under the plan by both the employee and employer are established by the General Laws, which are subject to amendment by the General Assembly.
Amounts in the defined contribution plan are available to participants in accordance with the Internal Revenue Service guidelines for such plans.
Plan Funding Policy
The funding pol icy is outlined in RIGL chapter 36-1.3 (which can be amended by the Rhode Island General Assembly). Active plan members must contribute 5% of his or her compensation and the City is required to contribute l %. The plan members and the City contributed approximately $7.2 million and $940, respectively, during the fiscal year ended June 30,2013.
The System issues an annual financial report that includes financial statements and required supplementary information for all of the plans it administers. The reports can be obtained at www.ersri.org
51 (Continued)
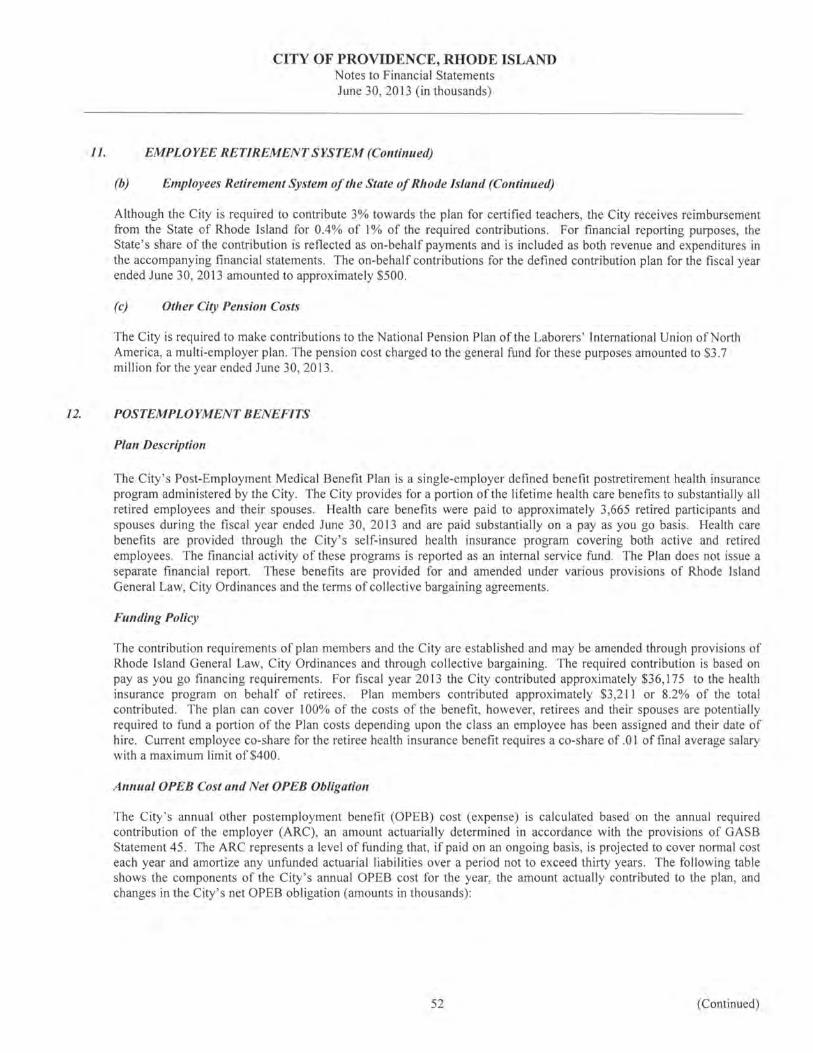
CITY OF PROVIDENCE, RHODE ISLAND Notes to Financial Statements June 30, 2013 (in thousands)
11. EMPLOYEE RETIREMENT SYSTEM (Continued)
(b) Employees Retirement System of the State of Rhode Island (Continued)
Although the City is required to contribute 3% towards the plan for certified teachers, the City receives reimbursement from the State of Rhode Island for 0.4% of I% of the required contributions. For financial reporting purposes, the State ' s share of the contribution is reflected as on-behalf payments and is included as both revenue and expenditures in the accompanying financial statements. The on-behalf contributions for the defined contribution plan for the fiscal year ended June 30, 2013 amounted to approximately $500.
(c) Other City Pension Costs
The City is required to make contributions to the National Pension Plan of the Laborers ' International Union ofNorth America, a multi-employer plan. The pension cost charged to the general fund for these purposes amounted to $3 .7 million for the year ended June 30, 2013.
12. POSTEMPLOYMENT BENEFITS
Plan Description
The City ' s Post-Employment Medical Benefit Plan is a single-employer defined benefit postretirement health insurance program administered by the City. The City provides for a portion of the lifetime health care benefits to substantially all retired employees and their spouses. Health care benefits were paid to approximately 3,665 retired participants and spouses during the fiscal year ended June 30, 2013 and are paid substantially on a pay as you go basis . Health care benefits are provided through the City's self-insured health insurance program covering both active and retired employees. The financial activity of these programs is reported as an internal service fund . The Plan does not issue a separate financial report. These benefits are provided for and amended under various provisions of Rhode Island General Law, City Ordinances and the terms of collective bargaining agreements.
Funding Policy
The contribution requirements of plan members and the City are established and may be amended through provisions of Rhode Island General Law, City Ordinances and through collective bargaining. The required contribution is based on pay as you go financing requirements. For fiscal year 2013 the City contributed approximately $36,175 to the health insurance program on behalf of retirees . Plan members contributed approximately $3 ,211 or 8.2% of the total contributed. The plan can cover I 00% of the costs of the benefit, however, retirees and their spouses are potentially required to fund a portion of the Plan costs depending upon the class an employee has been assigned and their date of hire. Current employee co-share for the retiree health insurance benefit requires a co-share of .0 I of fmal average salary with a maximum limit of $400 .
Annual OPEB Cost and Net OPEB Obligation
The City's annual other postemployment benefit (OPEB) cost (expense) is calculated based on the annual required contribution of the employer (ARC), an amount actuarially determined in accordance with the provisions of GASB Statement 45. The ARC represents a level of funding that, if paid on an ongoing basis, is projected to cover normal cost each year and amortize any unfunded actuarial liabilities over a period not to exceed thirty years . The following table shows the components of the City's annual OPEB cost for the year, the amount actually contributed to the plan, and changes in the City's net OPEB obligation (amounts in thousands) :
52 (Continued)
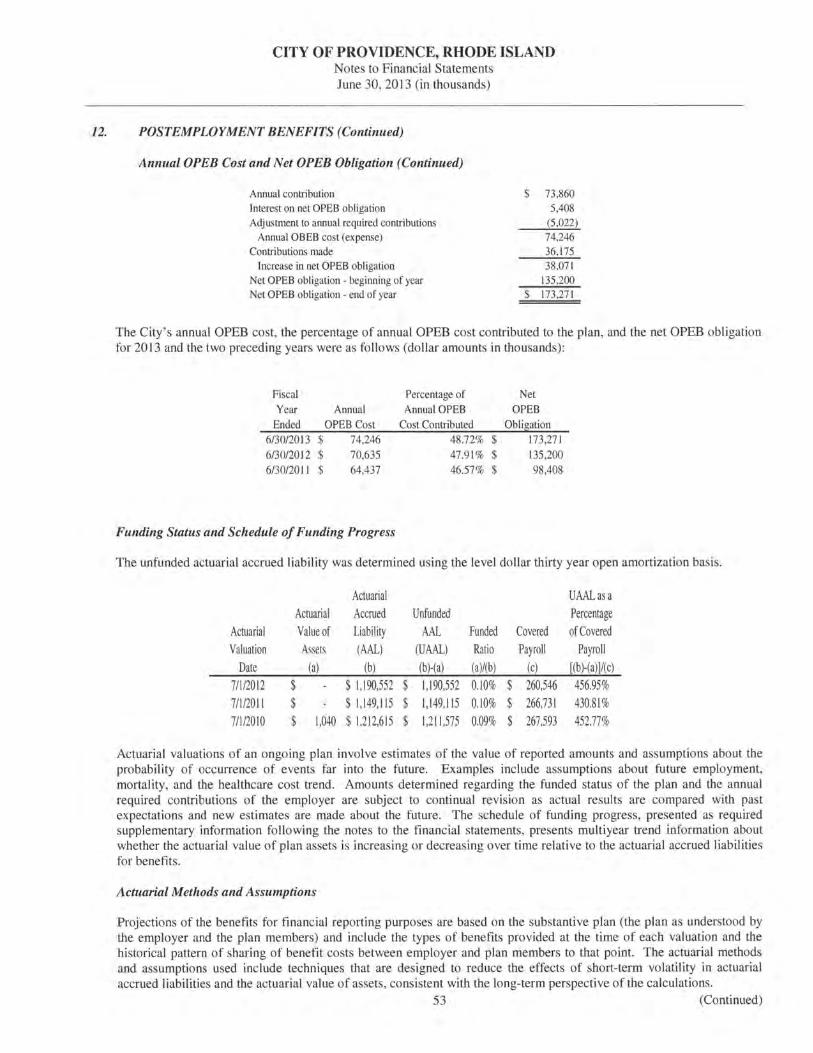
CITY OF PROVIDENCE, RHODE ISLAND Notes to Financial Statements June 30,2013 (in thousands)
12. POSTEMPLOYMENT BENEFITS (Continued)
Annual OPEB Cost and Net OPEB Obligation (Continued)
Annual contribution Interest on net OPEB obligation Adjustment to annual required contributions
Annual OBEB cost (expense) Contributions made
Increase in net OPEB obligation Net OPEB obligation - beginning of year Net OPEB obligation - end of year
$ 73,860 5,408
(5,022) 74,246 36,175 38,071
135,200 $ 173,27 1
The City's annual OPEB cost, the percentage of annual OPEB cost contributed to the plan, and the net OPEB obligation for 2013 and the two preceding years were as follows (dollar amounts in thousands):
Fiscal Percentage of Net Year A1mual Annual OPEB OPEB
Ended OPEB Cost Cost Contributed ObliBation 6/30/2013 $ 74,246 48.72% $ 173,271 6/30/2012 $ 70,635 47.91% $ 135,200 6/30/2011 $ 64,437 46.57% $ 98,408
Funding Status and Schedule of Funding Progress
The unfunded actuarial accrued liability was determined using the level dollar thirty year open amortization basis.
Actuarial UAALas a Actuarial Accrued Unfunded Percentage
Actuarial Value of Liability AAL Funded Covered of Covered Valuation Assets (AAL) (UAAL) Ratio Payroll Payroll
Date (a) (b) (b)-(a) (a)/(b) (c) [(b)-(a)]/(c) 7/1/2012 $ $ 1,190,552 $ 1,190,552 0.10% $ 260,546 456.95% 7/1/2011 $ $ 1,149,115 $ 1,149,115 0.10% $ 266,731 430.81% 7/1/2010 $ 1,040 $ 1,212,615 $ 1,2 11 ,575 0.09% $ 267,593 452.77%
Actuarial valuations of an ongoing plan involve estimates of the value of reported amounts and assumptions about the probability of occurrence of events far into the future. Examples include assumptions about future employment, mortality, and the healthcare cost trend. Amounts determined regarding the funded status of the plan and the annual required contributions of the employer are subject to continual revision as actual results are compared with past expectations and new estimates are made about the future. The schedule of funding progress, presented as required supplementary information following the notes to the financial statements, presents multiyear trend information about whether the actuarial value of plan assets is increasing or decreasing over time relative to the actuarial accrued liabilities for benefits.
Actuarial Methods and Assumptions
Projections of the benefits for financial reporting purposes are based on the substantive plan (the plan as understood by the employer and the plan members) and include the types of benefits provided at the time of each valuation and the historical pattern of sharing of benefit costs between employer and plan members to that point. The actuarial methods and assumptions used include techniques that are designed to reduce the effects of short-term volatility in actuarial accrued liabilities and the actuarial value of assets, consistent with the long-term perspective of the calculations.
53 (Continued)
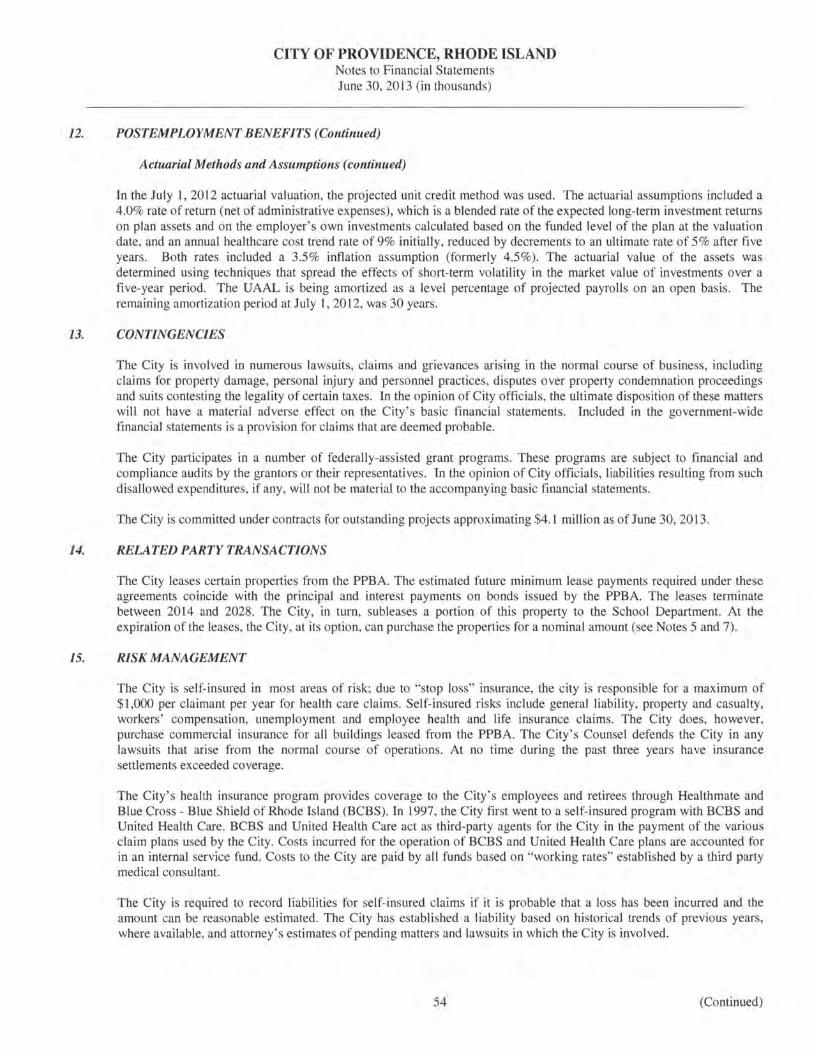
CITY OF PROVIDENCE, RHODE ISLAND Notes to Financial Statements June 30, 2013 (in thousands)
12. POSTEMPLOYMENT BENEFITS (Continued)
Actuarial Methods and Assumptions (continued)
In the July 1, 2012 actuarial valuation, the projected unit credit method was used. The actuarial assumptions included a 4.0% rate of return (net of administrative expenses), which is a blended rate of the expected long-term investment returns on plan assets and on the employer's own investments calculated based on the funded level of the plan at the valuation date, and an annual healthcare cost trend rate of 9% initially, reduced by decrements to an ultimate rate of 5% after five years. Both rates included a 3.5% inflation assumption (formerly 4.5 %). The actuarial value of the assets was determined using techniques that spread the effects of short-term volatility in the market value of investments over a five-year period. The UAAL is being amortized as a level percentage of projected payrolls on an open basis. The remaining amortization period at July I , 20 12, was 30 years.
13. CONTINGENCIES
The City is involved in numerous lawsuits, claims and grievances arising in the normal course of business, including claims for property damage, personal injury and personnel practices, disputes over property condemnation proceedings and suits contesting the legality of certain taxes. In the opinion of City officials, the ultimate disposition of these matters will not have a material adverse effect on the City's basic financial statements. Included in the government-wide financial statements is a provision for claims that are deemed probable.
The City partic ipates in a number of federally-assisted grant programs. These programs are subject to financial and compliance aud its by the grantors or their representatives. In the opinion of City officials, liabilities resulting from such disallowed expenditures, if any, will not be material to the accompanying basic financial statements.
The City is committed under contracts for outstanding projects approximating $4.1 million as of June 30, 2013 .
14. RELATED PARTY TRANSACTIONS
The City leases certain properties from the PPBA. The estimated future minimum lease payments required under these agreements coincide with the principal and interest payments on bonds issued by the PPBA. The leases terminate between 2014 and 2028. The City, in turn, subleases a portion of this property to the School Department. At the expiration of the leases, the City, at its option, can purchase the properties for a nominal amount (see Notes 5 and 7).
15. RISK MANAGEMENT
The City is self-insured in most areas of risk; due to "stop loss" insurance, the city is responsible for a maximum of $1 ,000 per claimant per year for health care claims. Self-insured risks include general liability, property and casualty, workers' compensation, unemployment and employee health and life insurance claims. The City does, however, purchase commercial insurance for all buildings leased from the PPBA. The City ' s Counsel defends the City in any lawsuits that arise from the normal course of operations. At no time during the past three years have insurance settlements exceeded coverage.
The City's health insurance program provides coverage to the City's employees and retirees through Healthmate and Blue Cross- Blue Shield of Rhode Island (BCBS). In 1997, the City first went to a self-insured program with BCBS and United Health Care. BCBS and United Health Care act as third-party agents for the City in the payment of the various claim plans used by the City. Costs incurred for the operation of BCBS and United Health Care plans are accounted for in an internal service fund . Costs to the City are paid by all funds based on "working rates" established by a third party medical consultant.
The City is required to record liabilities for self-insured claims if it is probable that a loss has been incurred and the amount can be reasonable estimated. The City has established a liability based on historical trends of previous years, where available, and attorney's estimates of pending matters and lawsuits in which the City is involved.
54 (Continued)
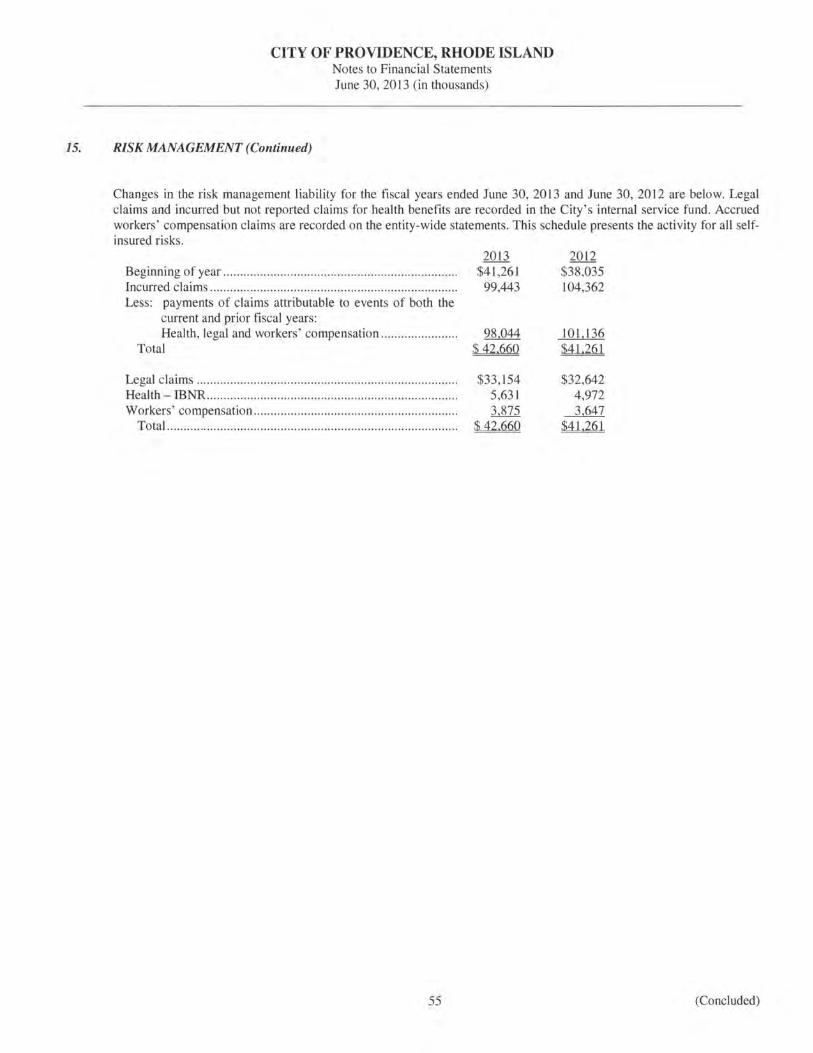
CITY OF PROVIDENCE, RHODE ISLAND Notes to Financial Statements June 30,2013 (in thousands)
15. RISK MANAGEMENT (Continued)
Changes in the risk management liability for the fiscal years ended June 30, 2013 and June 30, 2012 are below. Legal claims and incurred but not reported claims for health benefits are recorded in the City 's internal service fund. Accrued workers ' compensation claims are recorded on the entity-wide statements. This schedule presents the activity for all selfinsured risks.
Beginning of year ..................... ...... .. ........................... .. .......... .. Incurred claims ...... .... ... .............. ..... ..... ..... .. ........ .. ..... .............. . Less: payments of claims attributable to events of both the
current and prior fiscal years: Health, legal and workers' compensation ...................... .
Total
Legal claims ............................ ........ ........ ....... ... ..... .. ......... ..... .. . Health- IBNR ................... ... ... ..... ....................................... .... . . Workers' compensation ..... .. .... .... ..... .... ........ .. ....... ..... ..... ......... .
Total ....... ... ....... ............... ........... .. ...... ...... .. ........ .......... ...... .. . .
55
2013 $4 1,261
99,443
98,044 $42.660
$33, 154 5,631 3,875
$42.660
2012 $38,035 104,362
101,136 $4 1.261
$32,642 4,972 3,647
$41.261
(Concluded)

I CITY OF PROVIDENCE
REQUIRED SUPPLEMENTARY INFORMATION
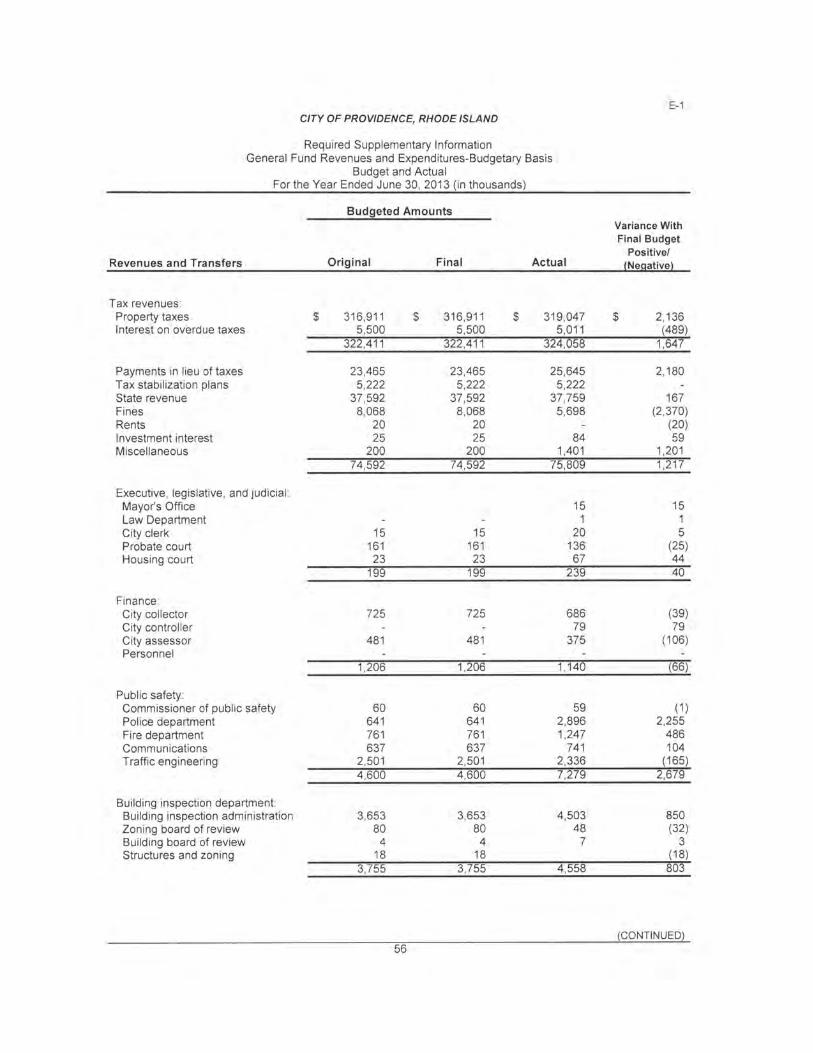
CITY OF PROVIDENCE, RHODE ISLAND
Required Supplementary Information General Fund Revenues and Expenditures-Budgetary Basis
Budget and Actual For the Year Ended June 30, 2013 (in thousands)
Budgeted Amounts
Revenues and Transfers Original Final Actual
Tax revenues : Property taxes $ 316,911 $ 316,911 $ 319,047 Interest on overdue taxes 5,500 5,500 5,011
322,411 322,411 324,058
Payments in lieu of taxes 23,465 23,465 25,645 Tax stabilization plans 5,222 5,222 5,222 State revenue 37,592 37,592 37 ,759 Fines 8,068 8,068 5,698 Rents 20 20 Investment interest 25 25 84 Miscellaneous 200 200 1,401
74,592 74,592 75,809
Executive, legislative, and judicial : Mayor's Office 15 Law Department 1 City clerk 15 15 20 Probate court 161 161 136 Housing court 23 23 67
199 199 239
Finance: City collector 725 725 686 City controller 79 City assessor 481 481 375 Personnel
1,206 1,206 1 '140
Public safety: Commissioner of public safety 60 60 59 Police department 641 641 2,896 Fire department 761 761 1,247 Communications 637 637 741 Traffic engineering 2,501 2,501 2,336
4,600 4,600 7,279
Building inspection department: Building inspection administration 3,653 3,653 4,503 Zoning board of review 80 80 48 Building board of review 4 4 7 Structures and zoning 18 18
3,755 3,755 4,558
56
E-1
Variance With Final Budget
Positive/ (Negative)
$ 2,136 (489)
1,647
2,180
167 (2 ,370)
(20) 59
1,201 1,217
15 1 5
(25) 44 40
(39) 79
(106)
(66)
( 1) 2,255
486 104
(165) 2,679
850 (32)
3 (18) 803
(CONTINUED
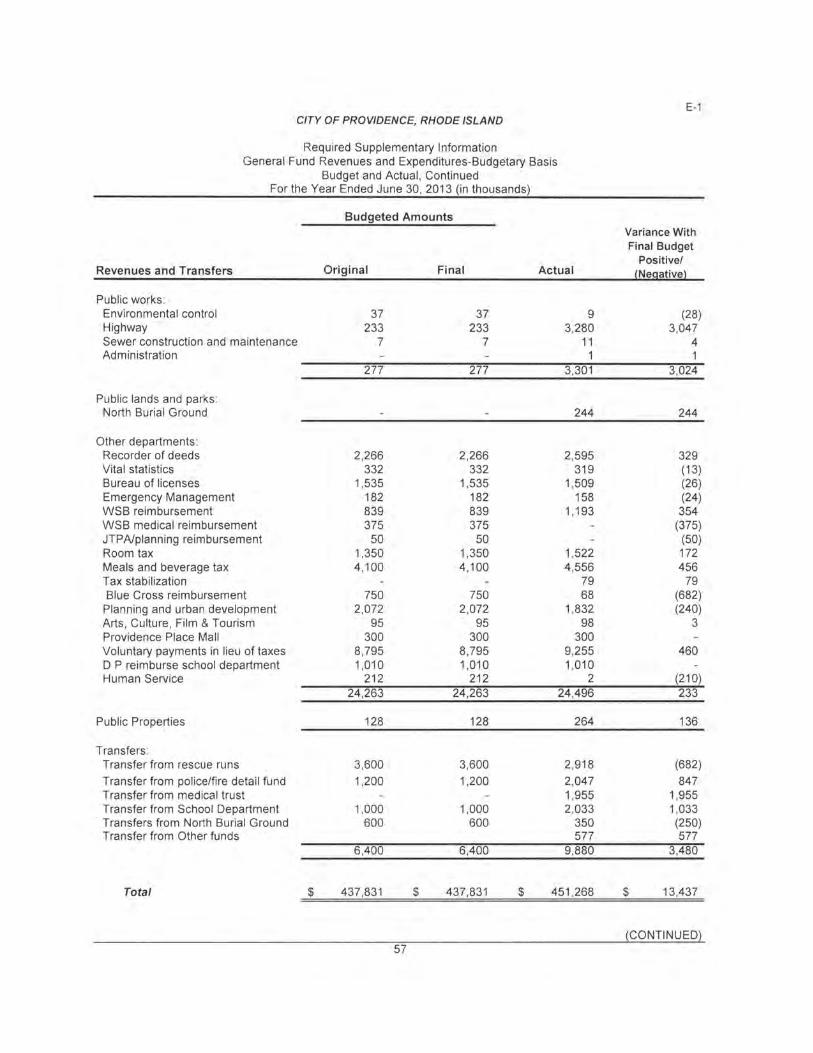
CITY OF PROVIDENCE, RHODE ISLAND
Required Supplementary Information General Fund Revenues and Expenditures-Budgetary Basis
Budget and Actual , Continued For the Year Ended June 30, 2013 (in thousands)
Revenues and Transfers
Public works: Environmental control Highway Sewer construction and maintenance Administration
Public lands and parks North Burial Ground
Other departments: Recorder of deeds Vital statistics Bureau of licenses Emergency Management WSB reimbursement WSB medical reimbursement JTPNplanning reimbursement Room tax Meals and beverage tax Tax stabilization Blue Cross reimbursement
Planning and urban development Arts , Culture , Film & Tourism Providence Place Mall Voluntary payments in lieu of taxes D P reimburse school department Human Service
Public Properties
Transfers : Transfer from rescue runs
Transfer from police/fire detail fund Transfer from medical trust Transfer from School Department Transfers from North Burial Ground Transfer from Other funds
Total $
Budgeted Amounts
Original
37 233
7
277
2,266 332
1,535 182 839 375
50 1,350 4,100
750 2,072
95 300
8,795 1,010
212 24 ,263
128
3,600
1,200
1,000 600
6,400
437 ,831
57
$
Final
37 233
7
277
2,266 332
1,535 182 839 375
50 1,350 4,100
750 2,072
95 300
8,795 1,010
212 24,263
128
3,600
1,200
1,000 600
6,400
437 ,831 $
Actual
9 3,280
11 1
3,301
244
2,595 319
1,509 158
1 '193
1,522 4,556
79 68
1,832 98
300 9,255 1,010
2 24 ,496
264
2,918
2,047 1,955 2,033
350 577
9,880
451,268
E-1
Variance With Final Budget
Positive/ (Negative)
(28) 3,047
4 1
3,024
244
329 (13) (26) (24) 354
(375) (50) 172 456
79 (682) (240)
3
460
(21 0) 233
136
(682)
847 1,955 1,033 (250) 577
3,480
$ 13,437
(CONTINUED)
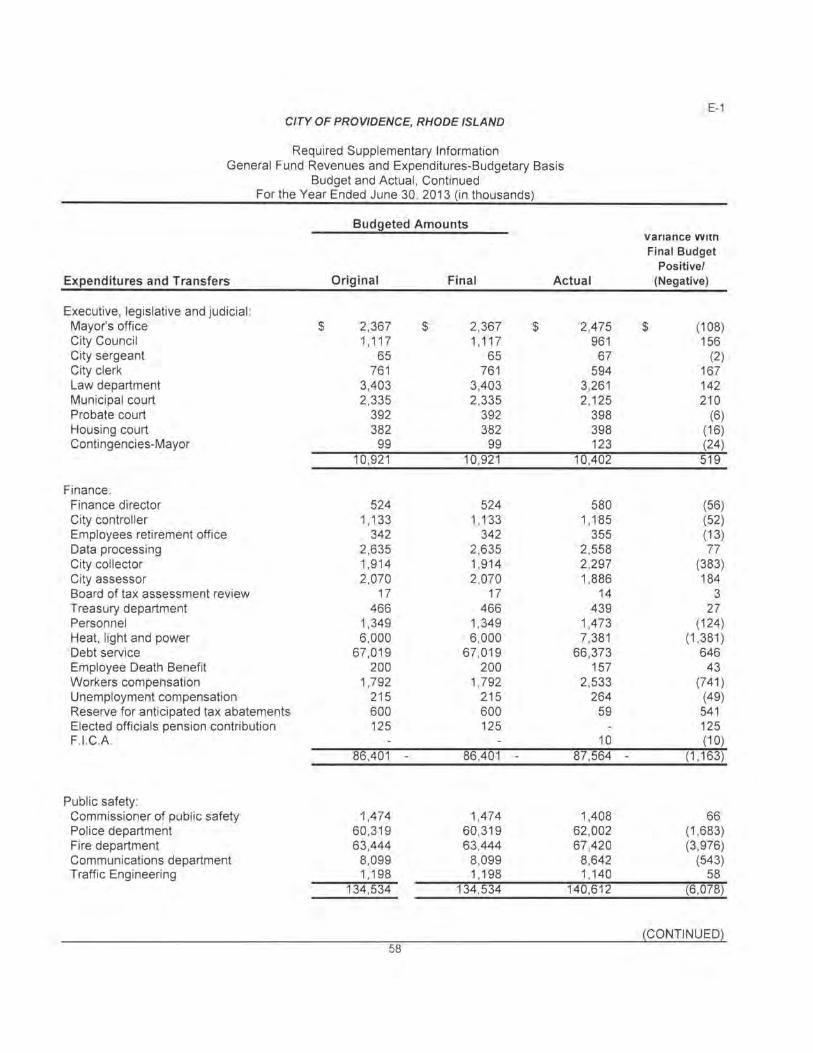
CITY OF PROVIDENCE, RHODE ISLAND
Required Supplementary Information General Fund Revenues and Expenditures-Budgetary Basis
Budget and Actual , Continued For the Year Ended June 30 , 2013 (in thousands)
Budgeted Amounts
Expenditures and Transfers Original Final Actual
Executive , legislative and judicial : Mayor's office $ 2,367 $ 2,367 $ 2,475 City Council 1 '117 1 '117 961 City sergeant 65 65 67 City clerk 761 761 594 Law department 3,403 3,403 3,261 Municipal court 2,335 2,335 2,125 Probate court 392 392 398 Housing court 382 382 398 Contingencies-Mayor 99 99 123
10,921 10,921 10,402
Finance: Finance director 524 524 580 City controller 1 '133 1 '133 1 '185 Employees retirement office 342 342 355 Data processing 2,635 2,635 2,558 City collector 1,914 1,914 2,297 City assessor 2,070 2,070 1,886 Board of tax assessment review 17 17 14 Treasury department 466 466 439 Personnel 1,349 1,349 1,473 Heat, light and power 6,000 6,000 7,381 Debt service 67,019 67,019 66,373 Employee Death Benefit 200 200 157 Workers compensation 1,792 1,792 2,533 Unemployment compensation 215 215 264 Reserve for anticipated tax abatements 600 600 59 Elected officials pension contribution 125 125 F.I.C.A. 10
86,401 - 86,401 - 87,564
Public safety: Commissioner of public safety 1,474 1,474 1,408 Police department 60 ,319 60 ,319 62 ,002 Fire department 63,444 63 ,444 67,420 Communications department 8,099 8,099 8,642 Traffic Engineering 1 '198 1 '198 1 '140
134,534 134,534 140,612
58
E-1
vanance VVItn
Final Budget Positive/
(Negative)
$ (1 08) 156
(2) 167 142 210
(6) (16) (24) 519
(56) (52) (13) 77
(383) 184
3 27
(124) (1 ,381)
646 43
(741) (49) 541 125 (1 0)
- (1 ,163)
66 (1 ,683) (3,976)
(543) 58
(6 ,078)
(CONTINUED~
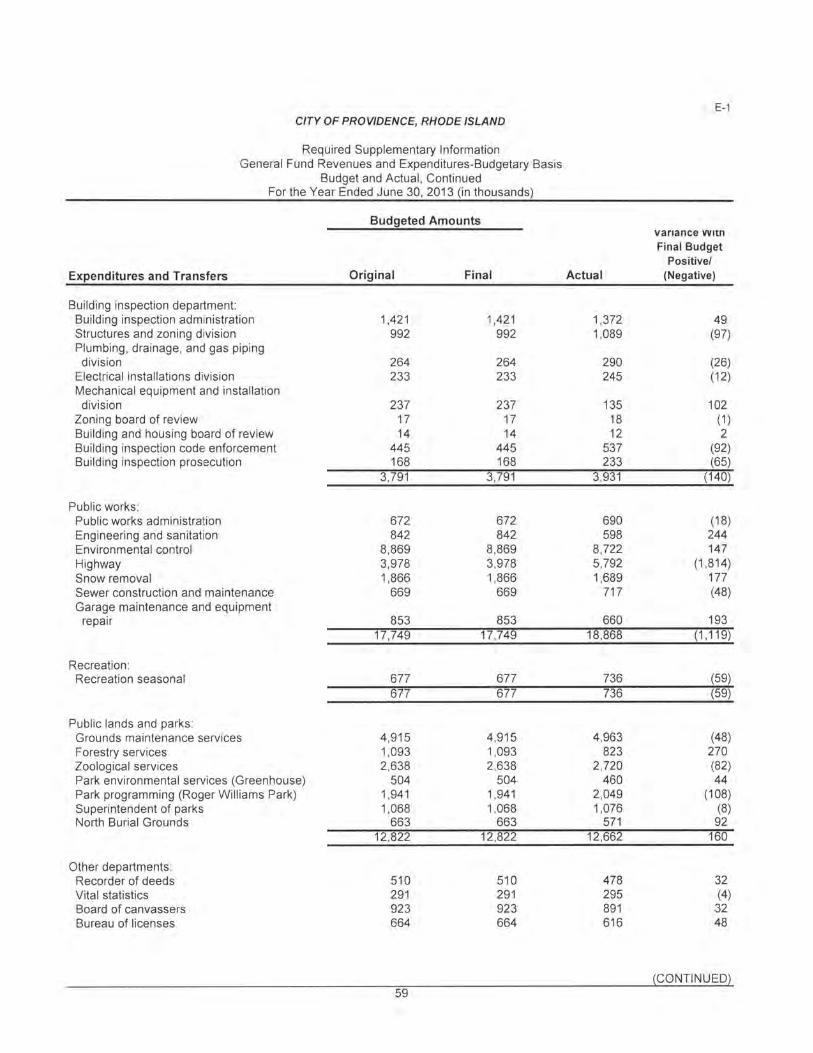
CONTINUED 59
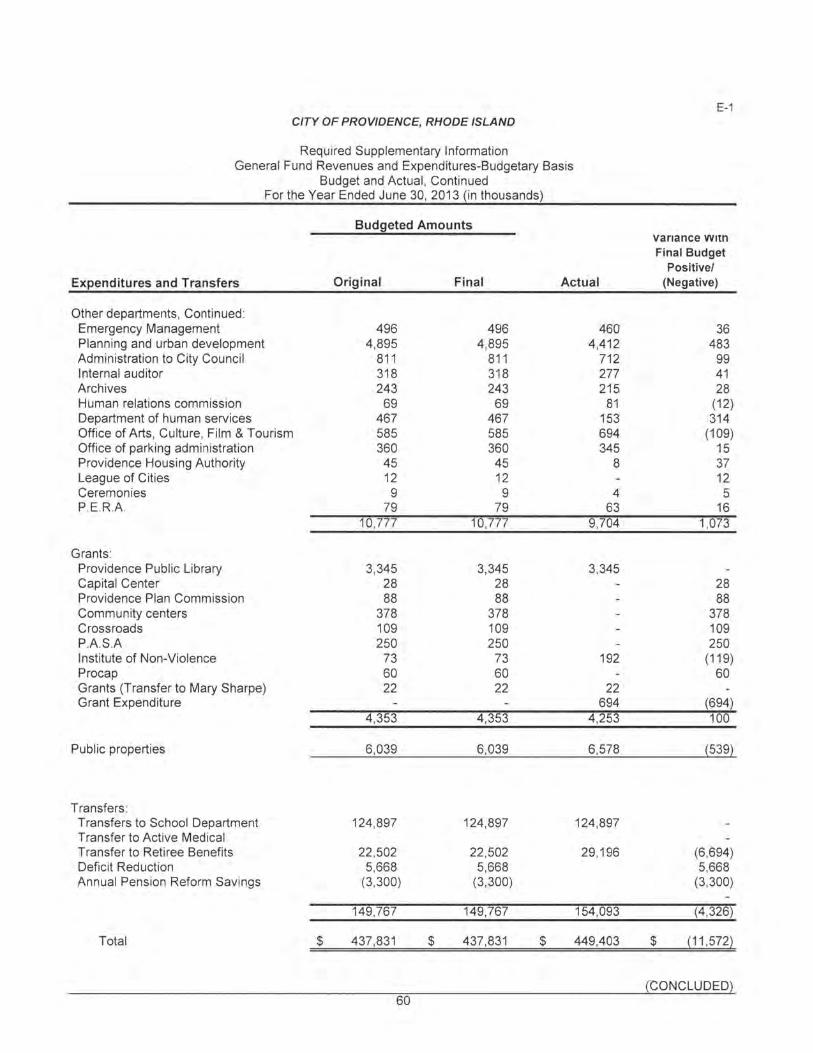
CITY OF PROVIDENCE, RHODE ISLAND
Required Supplementary Information General Fund Revenues and Expenditures-Budgetary Basis
Budget and Actual, Continued For the Year Ended June 30, 2013 (in thousands)
Budgeted Amounts
Expenditures and Transfers Original Final Actual
Other departments, Continued: Emergency Management Planning and urban development Administration to City Council Internal auditor Archives Human relations commission Department of human services Office of Arts, Culture, Film & Tourism Office of parking administration Providence Housing Authority League of Cities Ceremonies P.E.RA
Grants: Providence Public Library Capital Center Providence Plan Commission Community centers Crossroads PAS.A Institute of Non-Violence Procap Grants (Transfer to Mary Sharpe) Grant Expenditure
Public properties
Transfers: Transfers to School Department Transfer to Active Medical Transfer to Retiree Benefits Deficit Reduction Annual Pension Reform Savings
Total
496 4,895
811 318 243 69
467 585 360
45 12 9
79 10,777
3,345 28 88
378 109 250
73 60 22
4,353
6,039
124,897
22,502 5,668
(3 ,300)
149,767
$ 437,831
60
496 460 4,895 4,412
811 712 318 277 243 215
69 81 467 153 585 694 360 345
45 8 12 9 4
79 63 10,777 9,704
3,345 3,345 28 88
378 109 250
73 192 60 22 22
694 4,353 4,253
6,039 6,578
124,897 124,897
22,502 29,196 5,668
(3 ,300)
149,767 154,093
$ 437,831 $ 449,403
E-1
vanance VVItn
Final Budget Positive/
(Negative)
36 483
99 41 28
(12) 314
(109) 15 37 12 5
16 1,073
28 88
378 109 250
(119) 60
(694) 100
{539)
(6,694) 5,668
(3,300)
(4,326)
$ {11 ,572)
{CONCLUDED)
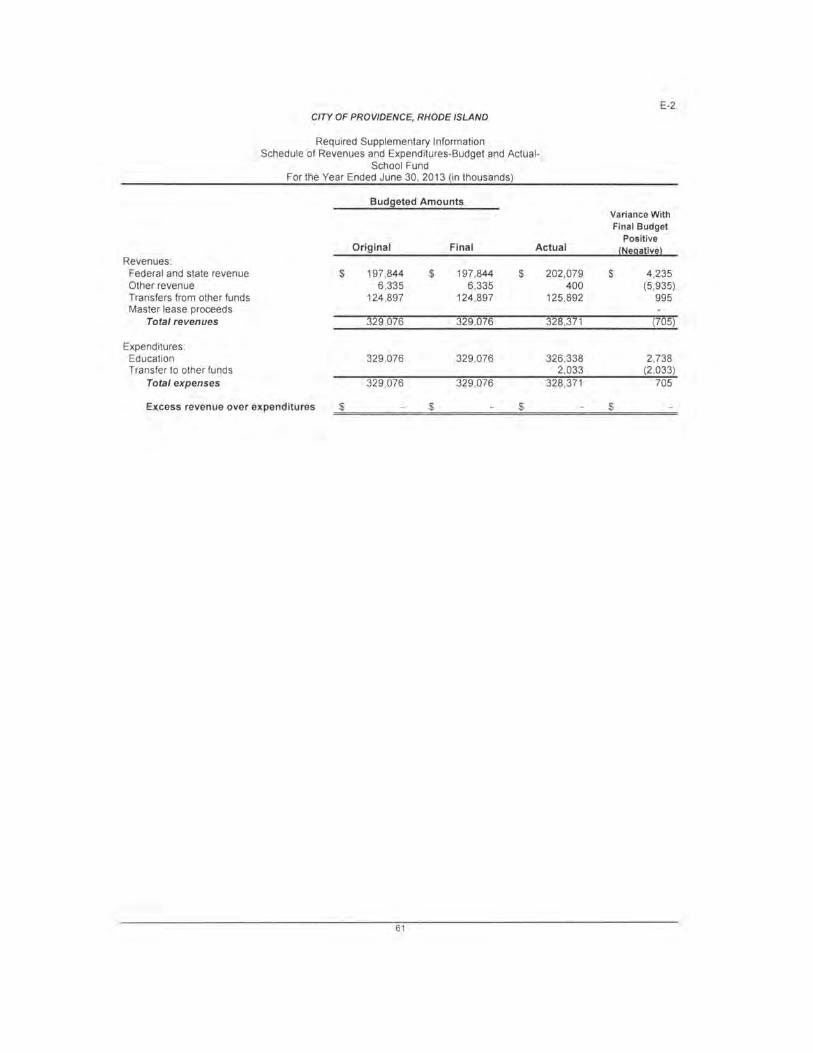
Revenues : Federal and state revenue Other revenue Transfers from other funds Master lease proceeds
Total revenues
Expenditures: Education Transfer to other funds
Total expenses
CITY OF PROVIDENCE, RHODE ISLAND
Required Supplementary Information Schedule of Revenues and Expenditures-Budget and Actual
School Fund For the Year Ended June 30 , 2013 (in thousands)
Budgeted Amounts
Original Final Actual
$ 197,844 $ 197,844 $ 202,079 6,335 6,335 400
124,897 124,897 125,892
329,076 329,076 328,371
329,076 329,076 326,338 2,033
329,076 329,076 328,371
Excess revenue over expenditures $ $ $
61
E-2
Variance With Final Budget
Positive (Negative}
$ 4,235 (5,935)
995
(705)
2,738 (2 ,033)
705
$
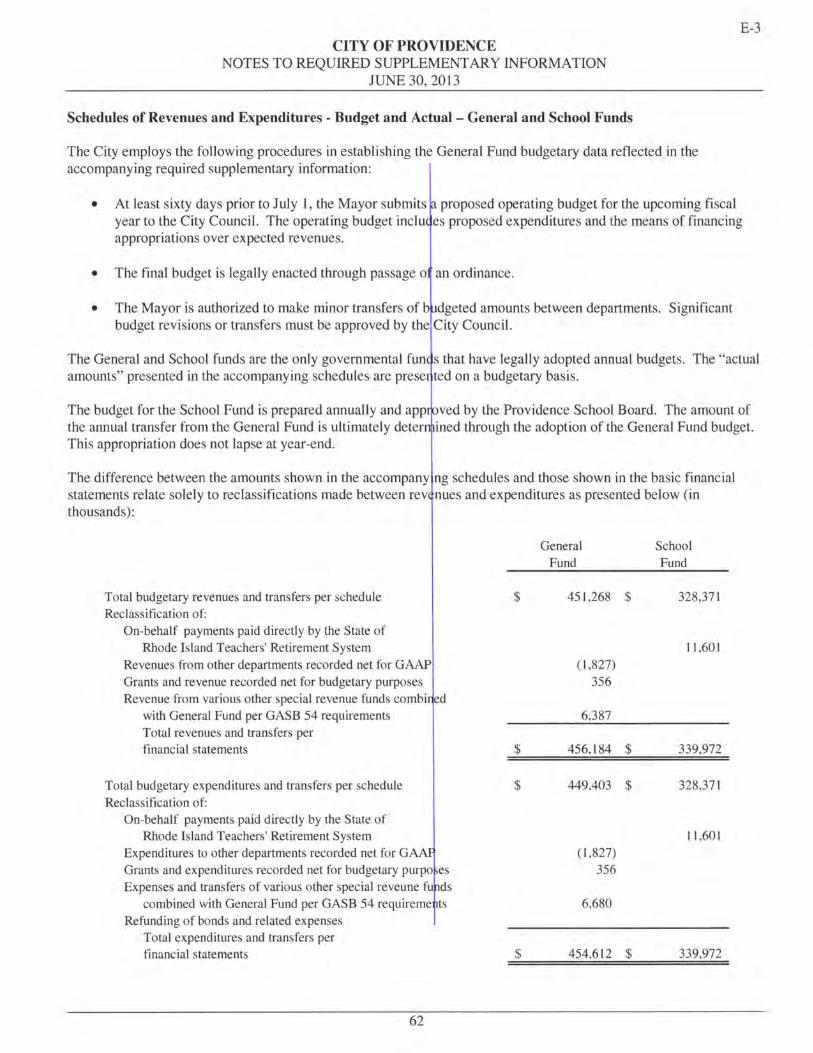
CITY OF PROVIDENCE NOTES TO REQUIRED SUPPLEMENTARY INFORMATION
JUNE 30, 2013
Schedules of Revenues and Expenditures - Budget and Actual - General and School Funds
The City employs the following procedures in establishing the General Fund budgetary data reflected in the accompanying required supplementary information:
E-3
• At least sixty days prior to July 1, the Mayor submits proposed operating budget for the upcoming fiscal year to the City Council. The operating budget inclu es proposed expenditures and the means of financing appropriations over expected revenues.
• The final budget is legally enacted through passage o an ordinance.
• The Mayor is authorized to make minor transfers of b dgeted amounts between departments. Significant budget revisions or transfers must be approved by the City Council.
The General and School funds are the only governmental fun s that have legally adopted annual budgets. The "actual amounts" presented in the accompanying schedules are prese ted on a budgetary basis.
The budget for the School Fund is prepared annually and app ved by the Providence School Board. The amount of the annual transfer from the General Fund is ultimately deter ined through the adoption of the General Fund budget. This appropriation does not lapse at year-end.
The difference between the amounts shown in the accompany ng schedules and those shown in the basic financial statements relate solely to reclassifications made between rev nues and expenditures as presented below (in thousands):
General School Fund Fund
Total budgetary revenues and transfers per schedule $ 451,268 $ 328,371 Reclassification of:
On-behalf payments paid directly by the State of Rhode Island Teachers' Retirement System 11,601
Revenues from other departments recorded net for GAAP ( 1,827) Grants and revenue recorded net for budgetary purposes 356 Revenue from various other special revenue funds combi ed
with General Fund per GASB 54 requirements 6,387 Total revenues and transfers per financial statements $ 456,184 $ 339,972
Total budgetary expenditures and transfers per schedule $ 449,403 $ 328,371 Reclassification of:
On-behalf payments paid directly by the State of Rhode Island Teachers' Retirement System 11,601
Expenditures to other departments recorded net for G ( l ,827) Grants and expenditures recorded net for budgetary purpo es 356 Expenses and transfers of various other special reveune fu ds
combined with General Fund per GASB 54 requireme ts 6,680 Refunding of bonds and related expenses
Total expenditures and transfers per financial statements $ 454,612 $ 339,972
62
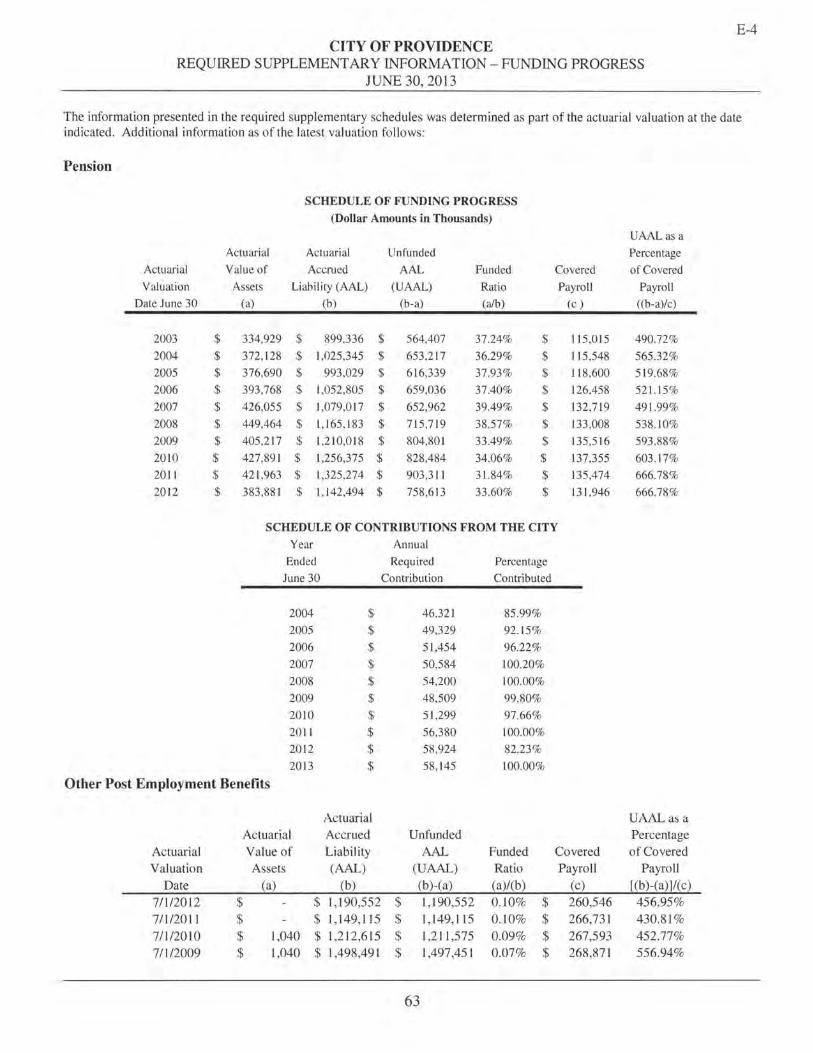
CITY OF PROVIDENCE REQUIRED SUPPLEMENTARY INFORMATION- FUNDING PROGRESS
JUNE 30, 2013
E-4
The information presented in the required supplementary schedules was determined as part of the actuarial valuation at the date indicated. Additional information as of the latest valuation follows:
Pension
SCHEDULE OF FUNDING PROGRESS
(Dollar Amounts in Thousands)
UAALas a
Actuarial Actuarial Unfunded Percentage
Actuarial Value of Accrued AAL Funded Covered of Covered
Valuation Assets Liability (AAL) (VAAL) Ratio Payroll Payroll
Date June 30 (a) (b) (b-a) (alb) (c) ((b-a)/c)
2003 $ 334,929 $ 899,336 $ 564,407 37.24% $ 115 ,015 490.72%
2004 $ 372,128 $ 1,025,345 $ 653,217 36.29% $ 115,548 565.32%
2005 $ 376,690 $ 993,029 $ 616,339 37.93% $ 118,600 519.68%
2006 $ 393,768 $ 1,052,805 $ 659,036 37.40% $ 126,458 521.15%
2007 $ 426,055 $ 1,079,017 $ 652,962 39.49% $ 132,719 491.99%
2008 $ 449,464 $ 1, 165,183 $ 715,719 38.57% $ 133,008 538.10%
2009 $ 405 ,217 $ 1,210,018 $ 804,801 33.49% $ 135,516 593.88%
2010 $ 427,891 $ 1,256,375 $ 828,484 34.06% $ 137,355 603.17%
2011 $ 421 ,963 $ 1,325,274 $ 903,311 31.84% $ 135,474 666.78%
2012 $ 383,881 $ 1, 142,494 $ 758,613 33 .60% $ 131 ,946 666.78%
SCHEDULE OF CONTRffiUTIONS FROM THE CITY
Year Annual
Ended Required Percentage
June 30 Contribution Contributed
2004 $ 46,321 85.99%
2005 $ 49,329 92. 15%
2006 $ 51 ,454 96.22%
2007 $ 50,584 100.20%
2008 $ 54,200 100.00%
2009 $ 48,509 99.80%
2010 $ 51 ,299 97.66%
2011 $ 56,380 100.00%
2012 $ 58,924 82.23%
2013 $ 58,145 100.00%
Other Post Employment Benefits
Actuarial UAALas a Actuarial Accrued Unfunded Percentage
Actuarial Value of Liability AAL Funded Covered of Covered Valuation Assets (AAL) (UAAL) Ratio Payroll Payroll
Date (a) (b) (b)-(a) (a)/(b) (c) [(b)-(a)]/(c)
7/l/2012 $ $ 1,190,552 $ 1,190,552 0.10% $ 260,546 456.95% 7/l/2011 $ $ 1, 149,115 $ 1,149,115 0.10% $ 266,731 430.81 % 7/1/2010 $ 1,040 $ 1,212,615 $ 1,211,575 0.09% $ 267,593 452.77% 7/1/2009 $ 1,040 $ 1,498,491 $ 1,497,451 0.07% $ 268,871 556.94%
63

I CITY OF PROVIDENCE
I
OTHER SUPPLEMENTARY INFORMATION
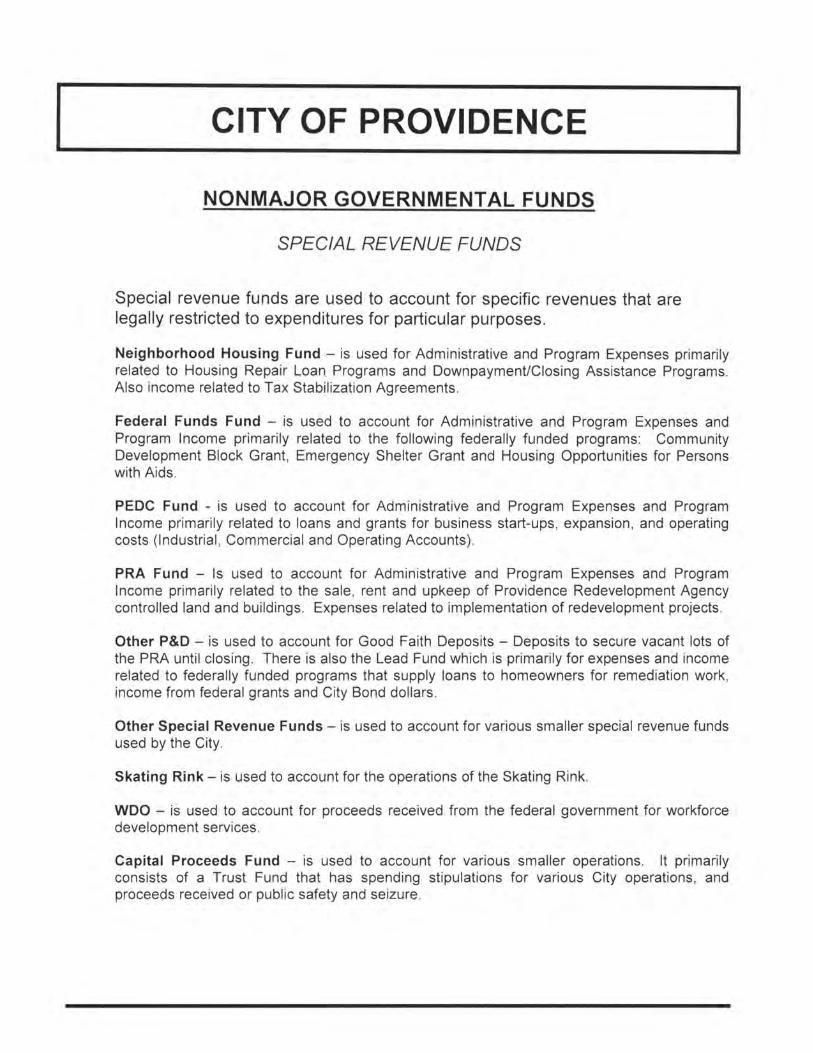
I CITY OF PROVIDENCE
NONMAJOR GOVERNMENTAL FUNDS
SPECIAL REVENUE FUNDS
Special revenue funds are used to account for specific revenues that are legally restricted to expenditures for particular purposes.
Neighborhood Housing Fund - is used for Administrative and Program Expenses primarily related to Housing Repair Loan Programs and Downpayment/Ciosing Assistance Programs. Also income related to Tax Stabilization Agreements.
Federal Funds Fund - is used to account for Administrative and Program Expenses and Program Income primarily related to the following federally funded programs: Community Development Block Grant, Emergency Shelter Grant and Housing Opportunities for Persons with Aids.
PEDC Fund - is used to account for Administrative and Program Expenses and Program Income primarily related to loans and grants for business start-ups, expansion, and operating costs (Industrial , Commercial and Operating Accounts) .
PRA Fund - Is used to account for Administrative and Program Expenses and Program Income primarily related to the sale, rent and upkeep of Providence Redevelopment Agency controlled land and buildings. Expenses related to implementation of redevelopment projects.
Other P&D - is used to account for Good Faith Deposits - Deposits to secure vacant lots of the PRA until closing . There is also the Lead Fund which is primarily for expenses and income related to federally funded programs that supply loans to homeowners for remediation work, income from federal grants and City Bond dollars.
Other Special Revenue Funds- is used to account for various smaller special revenue funds used by the City.
Skating Rink- is used to account for the operations of the Skating Rink.
WOO - is used to account for proceeds received from the federal government for workforce development services.
Capital Proceeds Fund - is used to account for various smaller operations . It primarily consists of a Trust Fund that has spending stipulations for various City operations, and proceeds received or public safety and seizure.
I
I CITY OF PROVIDENCE
NONMAJOR GOVERNMENTAL FUNDS
PERMANENT TRUST FUNDS
Other Nonmajor governmental funds are used to account for permanent trust funds.
I
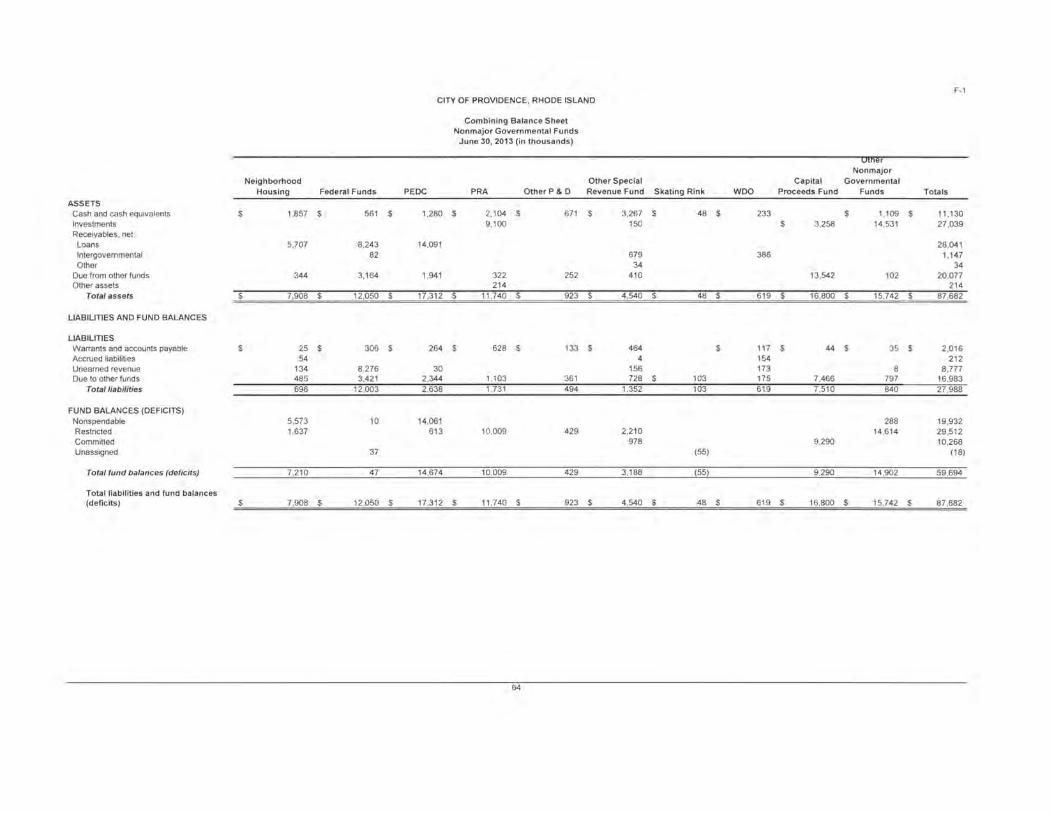
F-1 CITY OF PROVIDENCE, RHODE ISLAND
Combining Balance Sheet Non major Governmental Funds
June 30,2013 (in thousands)
r Non major
Neighborhood Other Special Capital Governmental Housing Federal Funds PEDC PRA Other P & D Revenue Fund Skating Rink WOO Proceeds Fund Funds Totals
ASSETS Cash and cash equivalents $ 1,857 $ 561 $ 1,280 $ 2,104 $ 671 $ 3,267 $ 48 $ 233 $ 1,109 $ 11,130 Investments 9,100 150 $ 3,258 14,531 27 ,039 Receivables. net:
Loans 5,707 8 ,243 14,091 28 ,041 Intergovernmental 82 679 386 1,147 Other 34 34
Due from other funds 344 3,164 1,941 322 252 410 13,542 102 20 ,077 Other assets 214 21 4
Total assets $ 7,908 $ 12,050 $ 17,312 $ 11 ,740 $ 923 $ 4,540 $ 48 $ 619 $ 16,800 $ 15,742 $ 87 ,682
LIABILITIES AND FUND BALANCES
LIABILITIES Warrants and accounts payable $ 25 $ 306 $ 264 $ 628 $ 133 $ 464 $ 117 $ 44 $ 35 $ 2,016 Accrued liabilities 54 4 154 212 Unearned revenue 134 8,276 30 156 173 8 8 ,777 Due to other funds 485 3,42 1 2,344 1,103 361 728 $ 103 175 7,466 797 16,983
Total liabilities 698 12,003 2,638 1,731 494 1,352 103 619 7,510 840 27 ,988
FUND BALANCES (DEFICITS) Nonspendable 5,573 10 14,061 288 19,932 Restricted 1,637 613 10,009 429 2.210 14,614 29,512 Committed 978 9,290 10,268 Unassigned 37 (55) (18)
Total fund balances (deficits) 7,210 47 14,674 10,009 429 3,188 (55) 9,290 14,902 59,694
Total liabilities and fund balances (deficits) $ 7,908 $ 12,050 $ 17 ,312 $ 11 ,740 $ 923 $ 4,540 $ 48 $ 619 $ 16,800 $ 15,742 $ 87,682
64
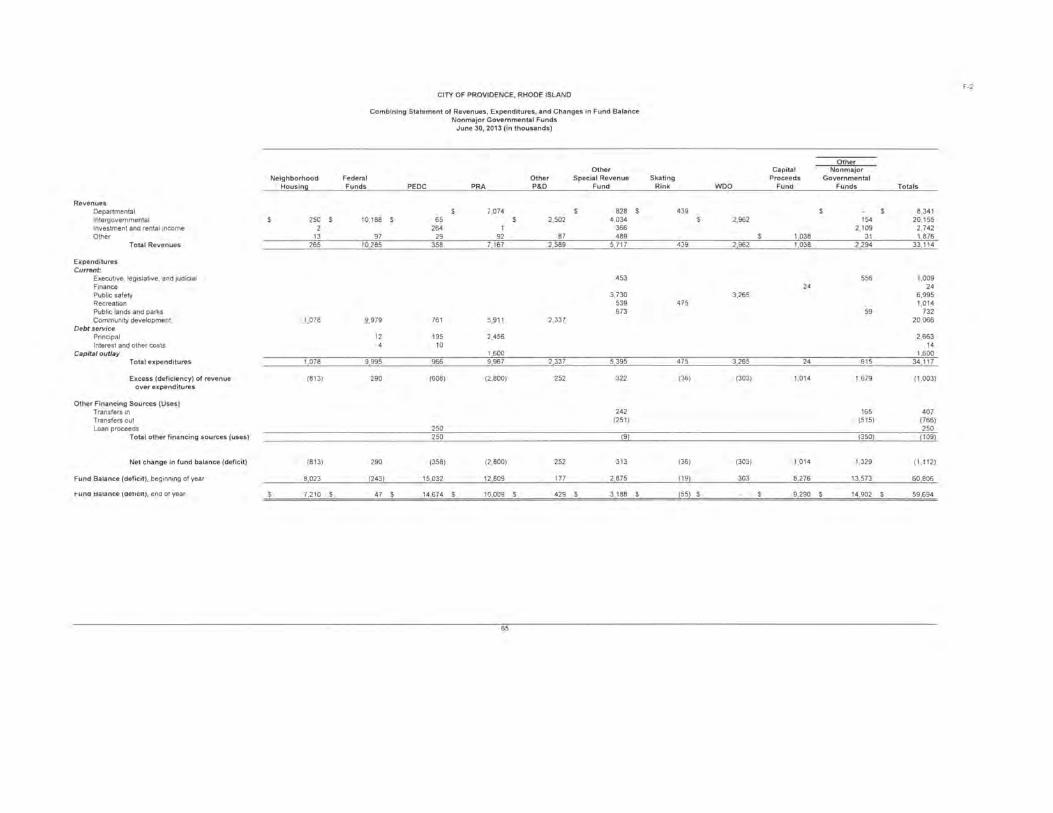
F-2 CITY OF PROVIDENCE, RHODE ISLAND
Combining Statement of Revenues, Expenditures, and Changes in Fund Balance Nonmajor Governmental Funds
June 30, 2013 (in thousands)
Other Other Capital Non major
Neighborhood Federal Other Special Revenue Skating Proceeds Governmental Housing Funds PEDC PRA P&D Fund Rink woo Fund Funds Totals
Revenues Departmental 7,074 828 439 8,341 Intergovernmental 250 10,188 65 2,502 4 ,034 2,962 154 20,155 Investment and rental income 2 264 1 366 2,109 2,742 Other 13 97 29 92 87 489 1 038 31 1 876
Total Revenues 265 10,285 358 7,167 2 589 5 717 439 2 962 1 038 2 294 33,114
Expenditures Current:
Executive, legislative, and judicial 453 556 1,009 Finance 24 24 Public safety 3,730 3,265 6 ,995 Recreation 539 475 1,014 Public lands and parks 673 59 732 Community development 1,078 9,979 761 5,911 2,337 20,066
Debt service Principal 12 195 2,456 2 ,663 Interest and other costs 10 14
Capital outlay 1,600 1,600 Total expenditures 1,078 9,995 966 9,967 2 337 5 395 475 3 265 24 615 34,117
Excess (deficiency} of revenue (813) 290 (608) (2 .800) 252 322 (36) (303) 1,014 1,679 (1 ,003) over expenditures
Other Financing Sources (Uses) Transfers 10 242 165 407 Transfers out (251) (515) (766) Loan proceeds 250 250
Total other financing sources (uses) 250 350 109
Net change in fund balance (deficit) (813) 290 (358) (2 ,800) 252 313 (36) (303) 1,014 1.329 (1 ,112)
Fund Balance (deficit) , beginning of year 8,023 (243) 15,032 12 ,809 177 2,875 (19) 303 8,276 13,573 60,806
t-una t:ialance (aet•c•tJ , ena ot year 7 210 47 14 674 10 009 429 3 188 55 9 290 14 902 59 694
65
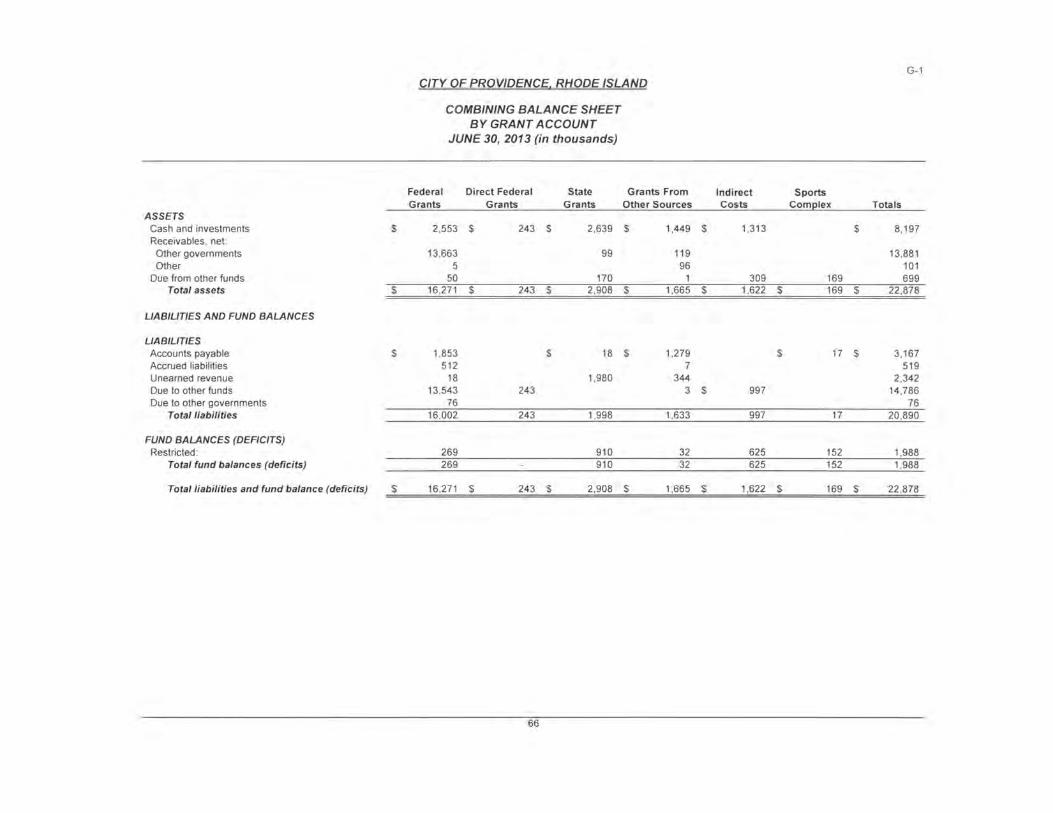
ASSETS Cash and investments $ Receivables, net:
Other governments Other
Due from other funds Total assets $
LIABILITIES AND FUND BALANCES
LIABILITIES Accounts payable $ Accrued liabilities Unearned revenue Due to other funds Due to other governments
Total liabili ties
FUND BALANCES (DEFICITS) Restricted :
Total fund balances (deficits)
Total liabilities and fund balance (deficits) $
CITY OF PROVIDENCE. RHODE ISLAND
COMBINING BALANCE SHEET BY GRANT ACCOUNT
JUNE 30, 2013 (in thousands)
Federal Direct Federal State Grants From Grants Grants Grants Other Sources
2,553 $ 243 $ 2,639 $ 1,449
13,663 99 119 5 96
50 170 1 16,271 $ 243 $ 2,908 $ 1,665
1,853 $ 18 $ 1,279 512 7
18 1,980 344 13,543 243 3
76 16,002 243 1,998 1,633
269 910 32 269 910 32
16,271 $ 243 $ 2,908 $ 1,665
66
G-1
Indi rect Sports Costs Com~ l ex Tota ls
$ 1,313 $ 8,197
13,881 101
309 169 699 $ 1,622 $ 169 $ 22 ,878
$ 17 $ 3,167 519
2,342 $ 997 14,786
76 997 17 20 ,890
625 152 1,988 625 152 1,988
$ 1,622 $ 169 $ 22 ,878
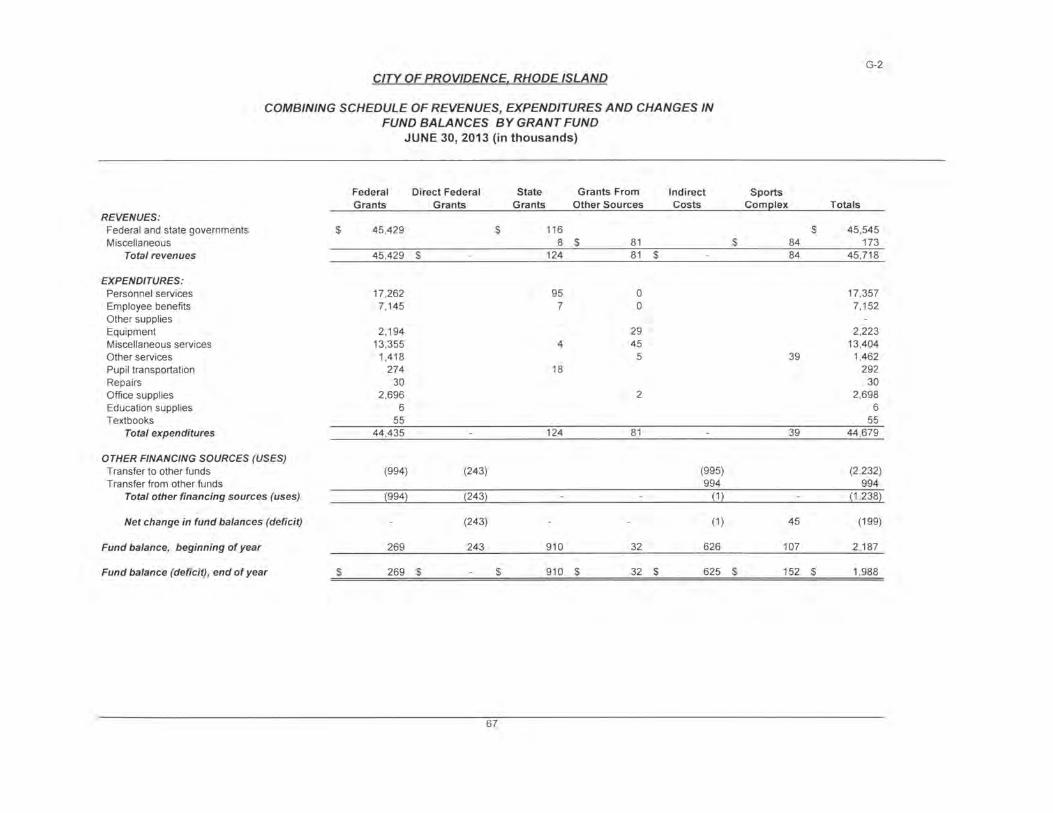
CITY OF PROVIDENCE. RHODE ISLAND
COMBINING SCHEDULE OF REVENUES, EXPENDITURES AND CHANGES IN FUND BALANCES BY GRANT FUND
JUNE 30, 2013 (in thousands)
Federal Direct Federal State Grants From Indirect Grants Grants Grants Other Sources Costs
REVENUES: Federal and state governments $ 45,429 $ 116 Miscellaneous 8 $ 81
Total revenues 45,429 $ 124 81 $
EXPENDITURES: Personnel services 17,262 95 0 Employee benefits 7,145 7 0 Other supplies Equipment 2,194 29 Miscellaneous services 13,355 4 45 Other services 1,418 5 Pupil transportation 274 18 Repairs 30 Office supplies 2,696 2 Education supplies 6 Textbooks 55
Total expenditures 44,435 124 81
OTHER FINANCING SOURCES (USES) Transfer to other funds (994) (243) (995) Transfer from other funds 994
Total other financing sources (uses) (994) (243) (1)
Net change in fund balances (deficit) (243) (1)
Fund balance, beginning of year 269 243 910 32 626
Fund balance (deficit), end of year $ 269 $ $ 910 $ 32 $ 625
67
G-2
Sports ComE lex Totals
$ 45,545 $ 84 173
84 45 ,718
17,357 7,152
2,223 13,404
39 1,462 292
30 2,698
6 55
39 44 ,679
(2,232) 994
(1 ,238)
45 (199)
107 2,187
$ 152 $ 1,988
I CITY OF PROVIDENCE
AGENCY FUNDS
Agency funds are used to account for assets held by the government as an agent for others.
I
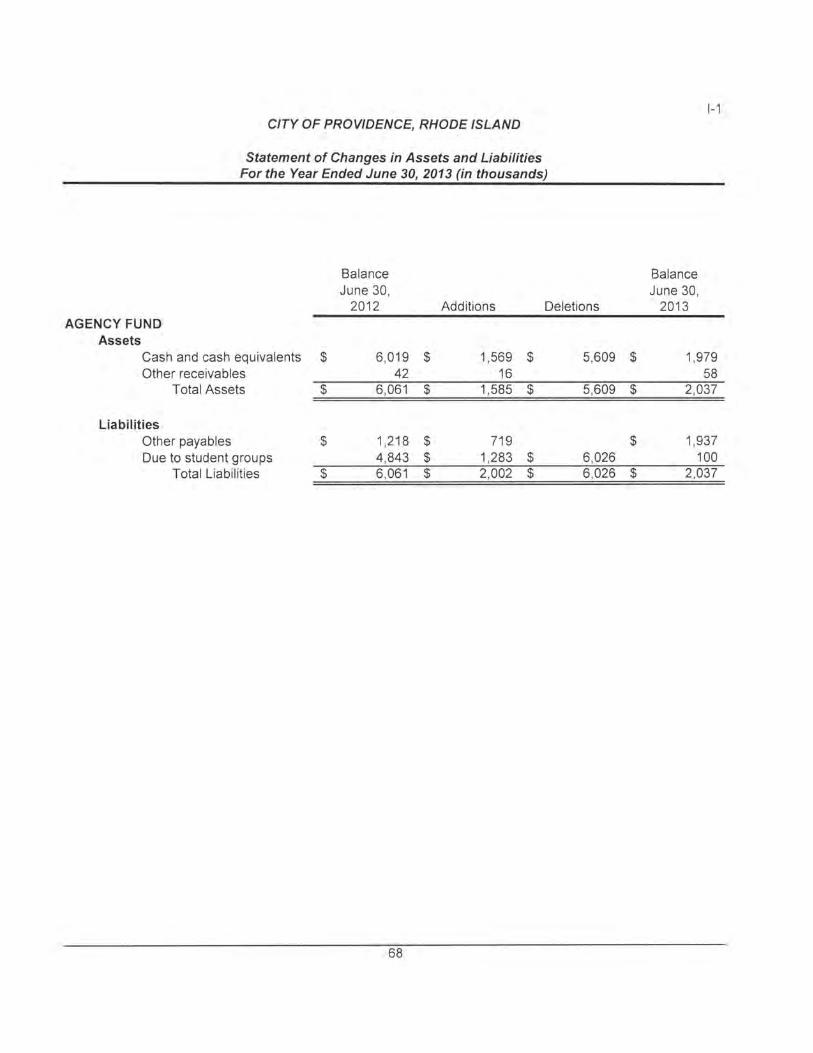
CITY OF PROVIDENCE, RHODE ISLAND
Statement of Changes in Assets and Liabilities For the Year Ended June 30, 2013 (in thousands)
Balance June 30,
2012 Additions Deletions AGENCY FUND
Assets Cash and cash equivalents $ 6,019 $ 1,569 $ 5,609 Other receivables 42 16
Total Assets $ 6,061 $ 1,585 $ 5,609
Liabilities Other payables $ 1,218 $ 719 Due to student groups 4,843 $ 1,283 $ 6,026
Total Liabilities $ 6,061 $ 2,002 $ 6,026
68
1-1
Balance June 30,
2013
$ 1,979 58
$ 2,037
$ 1,937 100
$ 2,037

I CITY OF PROVIDENCE
I
CAPITAL ASSETS
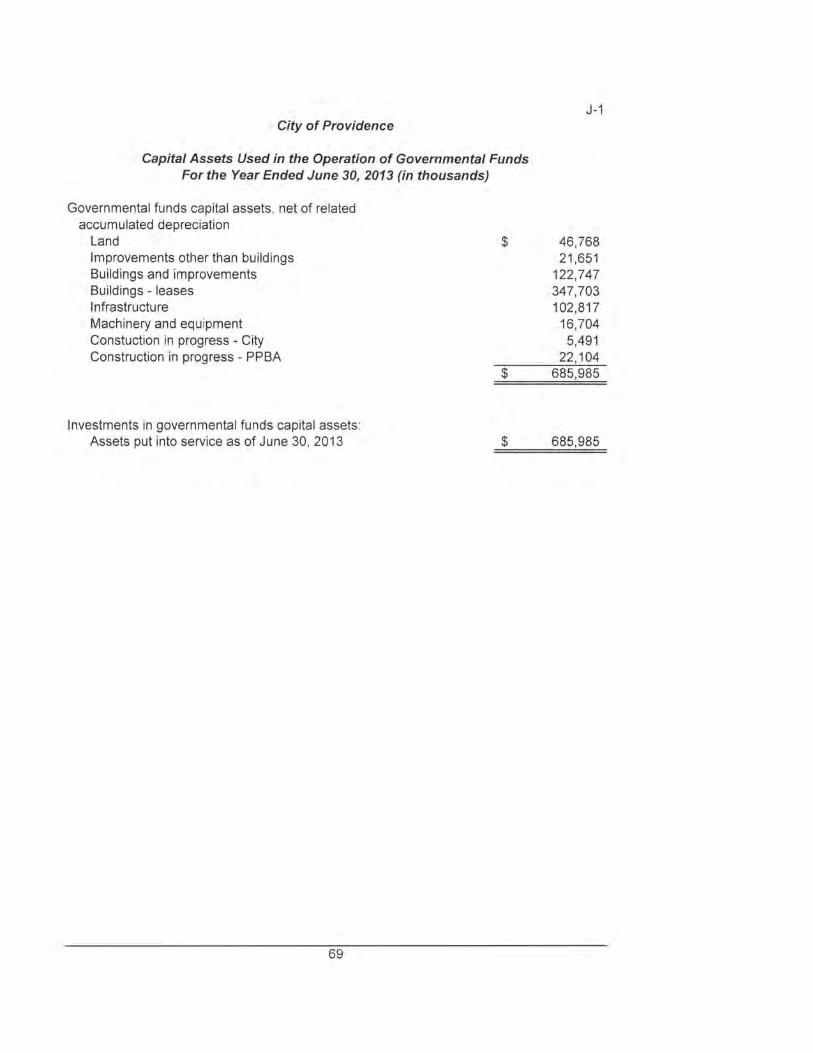
City of Providence
Capital Assets Used in the Operation of Governmental Funds For the Year Ended June 30, 2013 (in thousands)
Governmental funds capital assets, net of related accumulated depreciation
Land Improvements other than buildings Buildings and improvements Buildings - leases Infrastructure Machinery and equipment Constuction in progress - City Construction in progress - PPBA
Investments in governmental funds capital assets: Assets put into service as of June 30, 2013
69
$
$
$
J-1
46,768 21,651
122,747 347,703 102,817
16,704 5,491
22,104 685,985
685,985
I CITY OF PROVIDENCE
STATISTICAL SECTION
This part of the City of Providence, Rhode Island's comprehensive annual financial report presents detailed information as a context for understanding what the information in the financial statements, note disclosures, and required supplementary information says about the government's overall financial health.
Contents:
Financial Trends
These schedules contain trend information to help the reader understand how the government's financial performance and well-being have changed over time.
Revenue Capacity
These schedules contain information to help the reader assess the government's most significant local revenue source, the property tax.
Debt Capacity
These schedules present information to help the reader assess the affordability of the government's current levels of outstanding debt and the government's ability to issue additional debt in the future .
Demographic and Economic Information
These schedules offer demographic and economic indicators to help the reader understand the environment within the government's financial activities take place.
Operating Information
These schedules contain service and infrastructure data to help the reader understand how the information in the government's financial report relates to the services the government provides and the activities it performs.
I
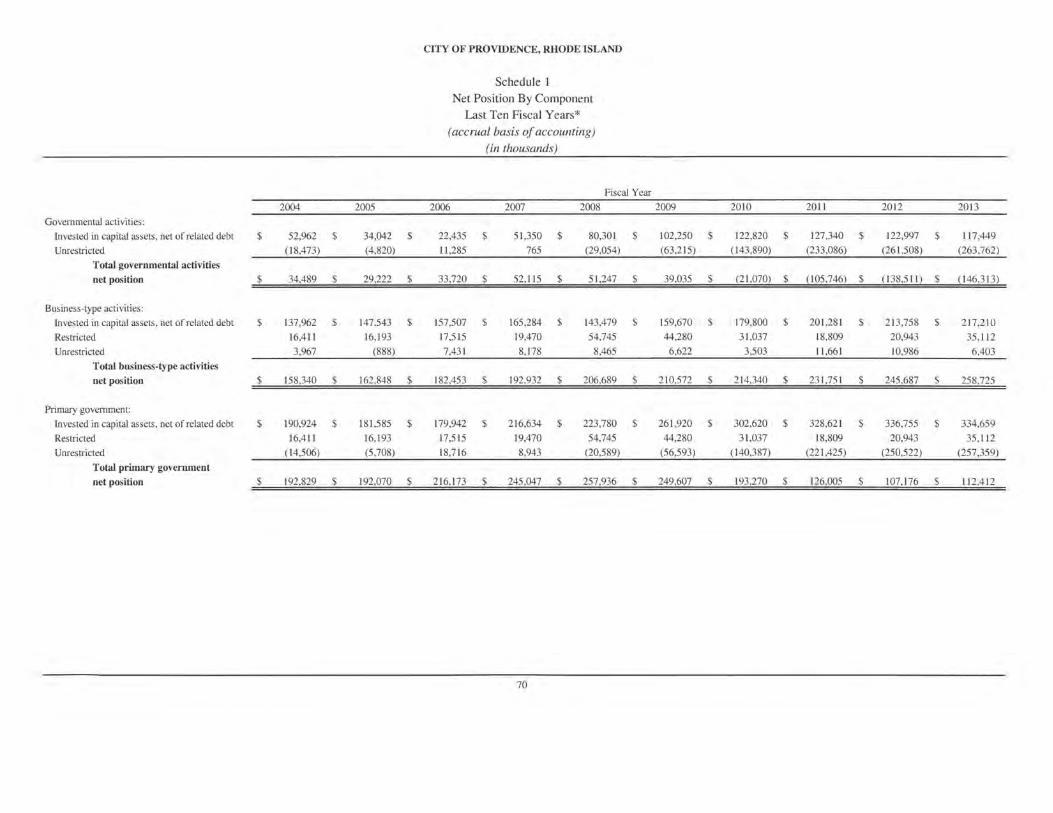
CITY OF PROVIDENCE, RHODE ISLAND
Schedule 1 Net Position By Component
Last Ten Fiscal Years* (accrual basis of accounting)
(in thousands)
Fiscal Year
2004 2005 2006 2007 2008 2009 2010 2011 2012 2013
Governmental activities:
Invested in capital assets, net of related debt $ 52,962 $ 34,042 $ 22,435 $ 51,350 $ 80,301 $ 102,250 $ 122,820 $ 127,340 $ 122,997 $ 117,449
Unrestricted ( 18,473) (4,820) 11 ,285 765 (29,054) (63,215) (143,890) (233,086) (261,508) (263,762)
Total governmental activities
net position $ 34,489 $ 29,222 $ 33,720 $ 52,115 $ 51,247 $ 39,035 $ (21,070) $ (105,746) $ (138,5 11) $ (146,313)
Business-type activities:
Invested in capital assets, net of related debt $ 137,962 $ 147,543 $ 157,507 $ 165,284 $ 143,479 $ 159,670 $ 179,800 $ 201 ,281 $ 213,758 $ 217,210
Restricted 16,411 16,193 17,5 15 19,470 54,745 44,280 31,037 18,809 20,943 35,1 12
Unrestricted 3,967 (888) 7,43 1 8,178 8,465 6,622 3,503 11,661 10,986 6,403
Total business-type activities
net position $ 158,340 $ 162,848 $ 182,453 $ 192,932 $ 206,689 $ 210,572 $ 214,340 $ 231,751 $ 245,687 $ 258,725
Primary government:
Invested in capital assets, net of related debt $ 190,924 $ 181,585 $ 179,942 $ 216,634 $ 223,780 $ 261,920 $ 302,620 $ 328,621 $ 336,755 $ 334,659
Restricted 16,411 16,193 17,515 19,470 54,745 44,280 31,037 18,809 20,943 35,112
Unrestricted (14,506) (5,708) 18,7 16 8,943 (20,589) (56,593) (140,387) (221,425) (250,522) (257,359)
Total primary government
net position $ 192,829 $ 192,070 $ 216,173 $ 245,047 $ 257,936 $ 249,607 $ 193,270 $ 126,005 $ 107,176 $ 112,412
70
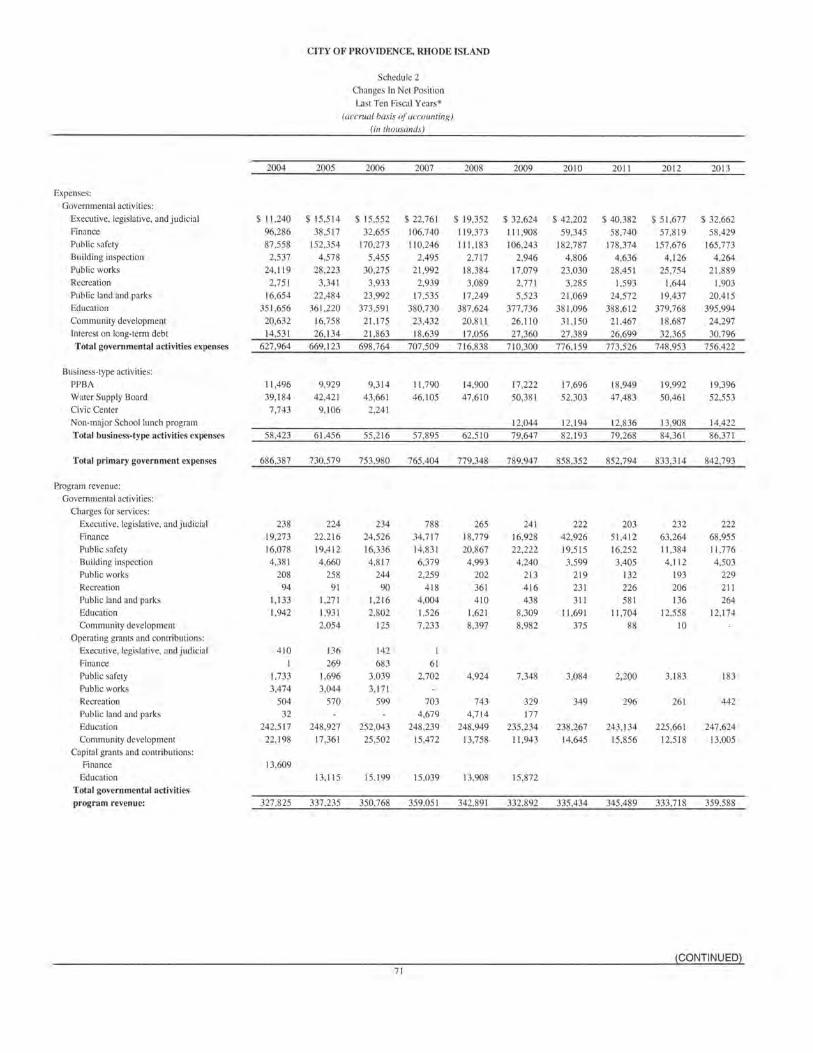
Expenses :
Governmental activities:
Executive, legislative, and judicial
Finance
Public safety
Building inspection
Public works
Recreation
Public land and parks
Education
Community development
Interest on long-term debt
Total governmental activities expenses
Business-type activities:
PPBA
Water Supp ly Board
Civic Center
Non-major School lunch program
Total business-type activities expenses
Total primary government expenses
Program revenue:
Governmenta l activities:
Charges for services:
Executive, legislative, and judicial
Finance
Public safety
Building inspection
Public works
Recreation
Public land and parks
Education
Community development
Operating grants and contributions:
Executive, legislative, and judicial
Finance
Public safety
Public works
Recreation
Public land and parks
Education
Community development
Capital grants and contributions:
Finance
Education
Total governmental activities
program revenue:
2004
$ 11 ,240 96,286 87,558 2,537
24,119 2,751
16,654 351 ,656
20,632 14,531
627 ,964
11 ,496 39,184 7,743
58,423
686,387
238 19,273 16,078 4,38 1
208 94
1,133 1,942
410
1 1,733 3,474
504 32
242,5 17 22,198
13,609
327,825
CITY OF PROVIDENCE, RHODE ISLAND
2005
$ 15,514 38,517
152,354 4,578
28,223 3,34 1
22,484 36 1,220
16,758 26,134
669,123
9,929 42,421
9,106
61,456
730,579
224 22,2 16 19,412 4,660
258 91
1,271 1,931 2,054
136 269
1,696 3,044
570
248,927 17,361
13,11 5
337,235
Schedu le 2
Changes In Net Position
Last Ten Fisca l Years*
(accrual basis of accounting)
(in thousands)
2006
$ 15,552 32,655
170,273
5,455 30,275
3,933 23,992
373,591 21,175 21 ,863
698,764
9,314 43,66 1
2,24 1
55,216
753,980
234 24,526 16,336 4,8 17
244 90
1,216 2,802
125
142
683 3,039 3,171
599
252 ,043 25,502
15,199
350,768
71
2007
$ 22,76 1
106,740 110,246
2,495 21,992
2,939 17,535
380,730 23 ,432 18,639
707,509
11 ,790 46, 105
57,895
765,404
788 34,717
14,83 1 6,379 2,259
418 4,004 1,526 7,233
I
61 2,702
703 4,679
248 ,239 15,472
15,039
359,051
2008
$ 19,352 119,373 111 ,183
2,717 18,384 3,089
17,249 387,624 20,81 1 17,056
716,838
14,900 47,610
62,510
779,348
265 18,779 20,867
4,993
202 361 410
1,621 8,397
4,924
743 4,714
248 ,949 13,758
13,908
342,891
2009
$ 32,624
111 ,908 106,243
2,946 17,079 2,771
5,523 377,736
26,110 27 ,360
710,300
17,222 50,38 1
12,044 79,647
789,947
24 1 16,928 22,222
4,240 213 416 438
8,309 8,982
7,348
329 177
235,234 I 1,943
15,872
332,892
20 10
$ 42,202
59,345 182,787
4,806 23 ,030
3,285 2 1,069
38 1,096 3 1,1 50 27 ,389
776,159
17,696 52,303
12,194 82,193
858,352
222 42,926 19,515 3,599
2 19 231 31 I
I 1,691 375
3,084
349
238,267 14,645
335,434
2011
$ 40,382 58,740
178 ,374 4,636
28,45 1 1,593
24,572 388,612
21 ,467 26,699
773,526
18,949 47,483
12,836 79,268
852,794
203 51 ,412 16,252 3,405
132 226 581
I 1,704
88
2,200
296
243,134 15,856
345,489
2012
$ 51 ,677 57,819
157,676 4,126
25 ,754 1,644
19,437 379,768
18,687 32,365
748,953
19,992 50,461
13,908 84,361
833,314
232 63,264 11 ,384 4,112
193 206 136
12,558 10
3,183
261
225 ,661 12,518
333,718
2013
$ 32,662 58,429
165,773
4,264 21 ,889
1,903 20,415
395,994 24,297 30,796
756,422
19,396 52,553
14,422 86,371
842,793
222 68 ,955 11,776 4,503
229 211 264
12,174
183
442
247 ,624 13,005
359,588
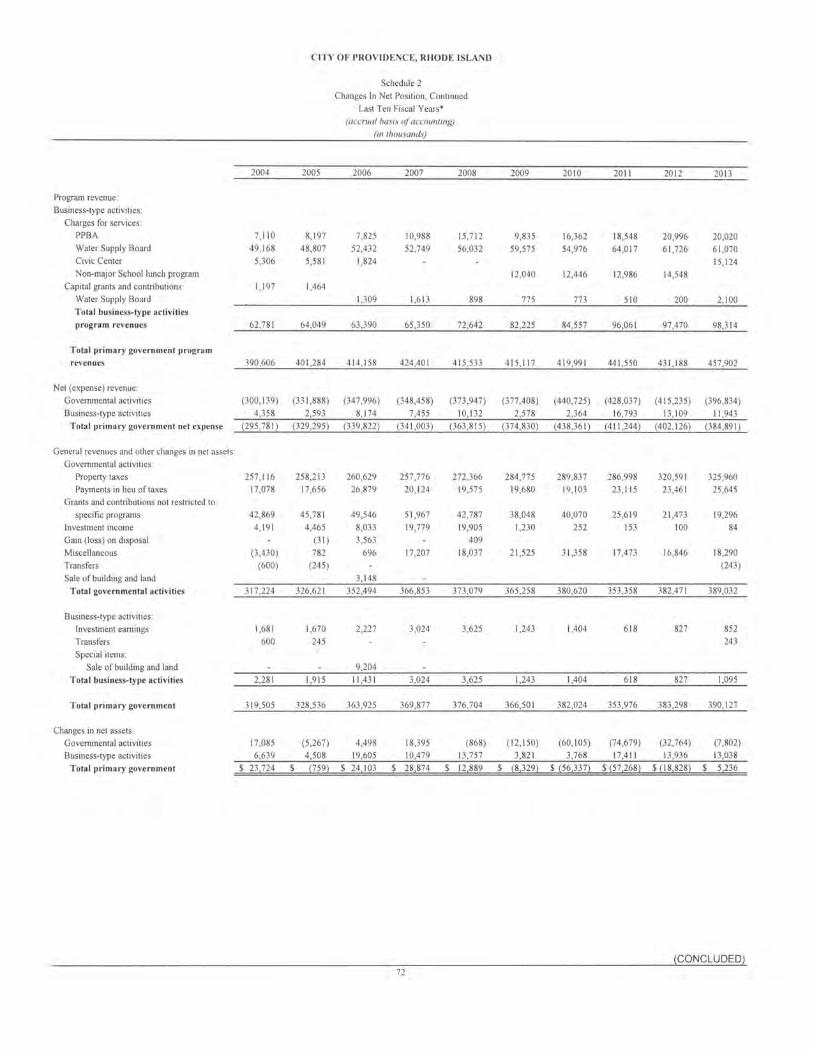
CITY OF PROVIDENCE, RHODE ISLAND
Schedule 2
Changes In Net Position, Continued
Last Ten Fiscal Years•
(accrual basi.1· of accmmtmg)
(m thousands)
2004 2005 2006 2007 2008 2009 2010 2011 2012 2013
PrOb'Tam revenue: Business-type act ivit ies :
Charges for services :
PPBA 7,110 8, 197 7,825 10,988 15,712 9,835 16,362 18,548 20,996 20,020 Water Supply Board 49, 168 48,807 52,432 52 ,749 56,032 59,575 54 ,976 64 ,017 61 ,726 61,070 Civic Center 5,306 5,581 1,824 15,124 Non-major School lunch program 12,040 12,446 12,986 14,548
Capital grants and contributions: 1,197 1,464
Water Supply Board 1,309 1,613 898 775 773 510 200 2,100 Total business-type activities
program revenues 62 ,781 64 ,049 63 ,390 65 ,350 72,642 82 ,225 84 ,557 96,06 1 97,470 98,314
Total primary government program
revenues 390,606 401,284 414 , 158 424 ,401 415 ,533 415 ,117 419,991 441 ,550 431 , 188 457 ,902
Net (expense) revenue:
Governmental activities (300, 139) (331 ,888) (347 ,996) (348,458) (373 ,947) (377 ,408) (440,725) (428,037) (415 ,235) (396,834) Business-type activities 4,358 2,593 8,174 7,455 10, 132 2,578 2,364 16,793 13,109 11 ,943
Total primary government net expense (295 ,78 1) (329 ,295) (339 ,822) (341 ,003) (363 ,8 15) (374 ,830) (438,36 1) (41 1,244) (402 ,126) (384 ,891)
General revenues and other changes in net asset s:
Governmental activities :
Property taxes 257 , 116 258,213 260,629 257 ,776 272 ,366 284,775 289,837 286,998 320,591 325,960
Payments in lieu of taxes 17,078 17,656 26,879 20,124 19,575 19,680 19, 103 23 ,115 23 ,461 25 ,645
Grants and contributions not restricted to
specific prOb'faJns 42,869 45 ,781 49 ,546 51,967 42 ,787 38,048 40,070 25 ,619 21 ,473 19,296
Investment income 4, 191 4,465 8,033 19,779 19,905 1,230 252 153 100 84
Gain (loss) on disposal (31) 3,563 409
Miscellaneous (3 ,430) 782 696 17,207 18,037 21 ,525 31,358 17,473 16,846 18,290
Transfers (600) (245) (243)
Sale of building and land 3, 148
Total governmental activities 317,224 326,621 352,494 366,853 373,079 365,258 380,620 353,358 382,471 389,032
Business-type activities:
Investment earnings 1,68 1 1,670 2,227 3,024 3,625 1,243 1,404 618 827 852
Transfers 600 245 243
Special items:
Sale of building and land 9,204
Total business-type activities 2,28 1 1,915 II ,431 3,024 3,625 1,243 1,404 618 827 1,095
Total primary government 319,505 328,536 363,925 369,877 376,704 366,501 382,024 353,976 383,298 390,127
Changes in net assets :
Governmental activities 17,085 (5 ,267) 4,498 18,395 (868) (12 , 150) (60, 105) (74,679) (32,764) (7 ,802)
Business-type activities 6,639 4,508 19,605 10,479 13,757 3,821 3,768 17,411 13,936 13,038
Total primary government 23,724 $ (759) 24,103 28,874 $ 12,889 $ (8,329) $ (56,337) $ (57,268) $ (18,828) 5,236
72
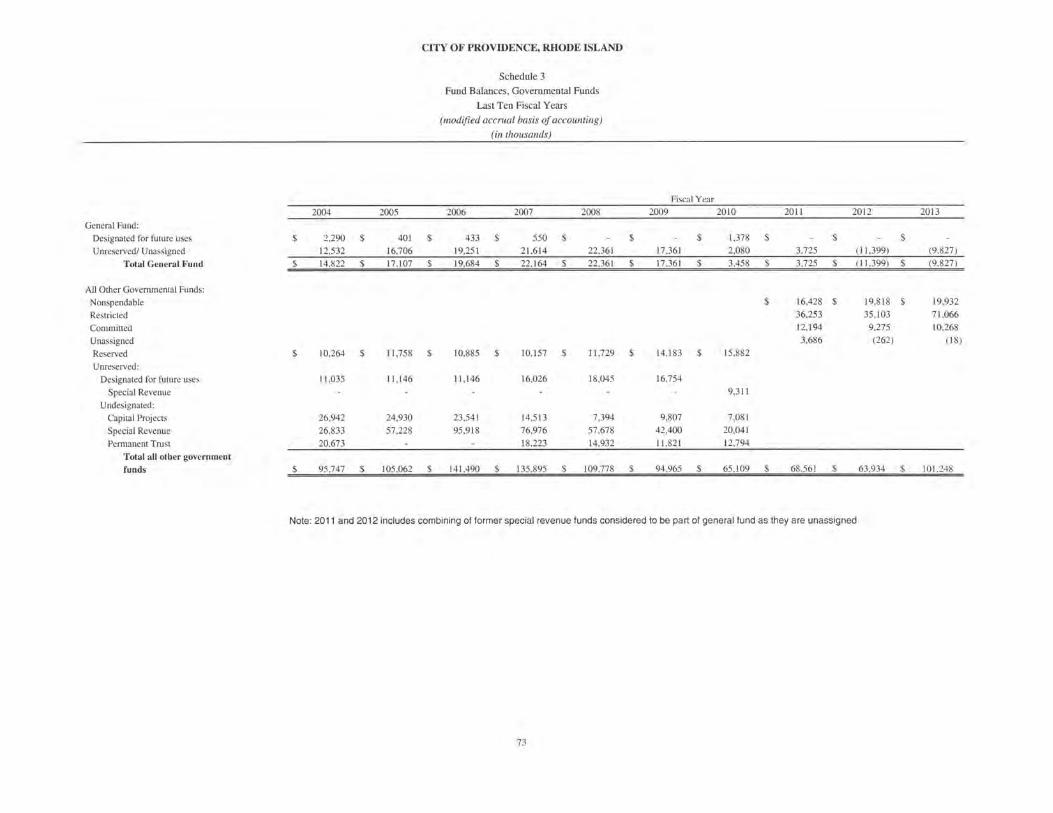
General Fund:
Designated for future uses
Unreserved/ Unassigned
Total General Fund
All Other Governrnemal Funds:
Nonspendable
Restricted
Committed
Unassigned
Reserved
Unreserved:
Designated for future uses
Special Revenue
Undesignated:
Capital Projects
Special Revenue
Permanent Trust
Total all other government
funds
2004 2005
$ 2,290 $ 401
12,532 16,706
$ 14,822 $ 17,107
$ 10,264 $ 11,758
11 ,035 11 ,146
26,942 24,930
26,833 57,228
20,673
$ 95 ,747 $ 105,062
CITY OF PROVIDENCE, RHODE ISLAND
$
$
$
$
Schedule 3
Fund Balances, Governmental Funds
Last Ten Fiscal Years
(modified accrual basis of accounting)
(in thousands)
2006 2007 2008
433 $ 550 $
19,251 21,614 22,361
19,684 $ 22,164 $ 22,361
10,885 $ 10,157 $ 11 ,729
11,146 16,026 18,045
23,541 14,513 7,394
95 ,918 76,976 57,678
18,223 14,932
141,490 $ 135,895 $ 109,778
Fiscal Year
2009 2010 2011 2012
$ $ 1,378 $ $
17,361 2,080 3,725 (11 ,399)
$ 17,361 $ 3,458 $ 3,725 $ ( II ,399)
$ 16,428 $ 19,8 18
36,253 35,103
12,194 9,275
3,686 (262)
$ 14,183 $ 15,882
16,754
9,311
9,807 7,081
42,400 20,041
11,821 12,794
$ 94,965 $ 65,109 $ 68,561 $ 63,934
Note: 2011 and 2012 includes combining of former special revenue funds considered to be part of general fund as they are unassigned
73
2013
$
(9,827)
$ (9,827)
$ 19,932
71 ,066
10,268
( 18)
$ 101 ,248
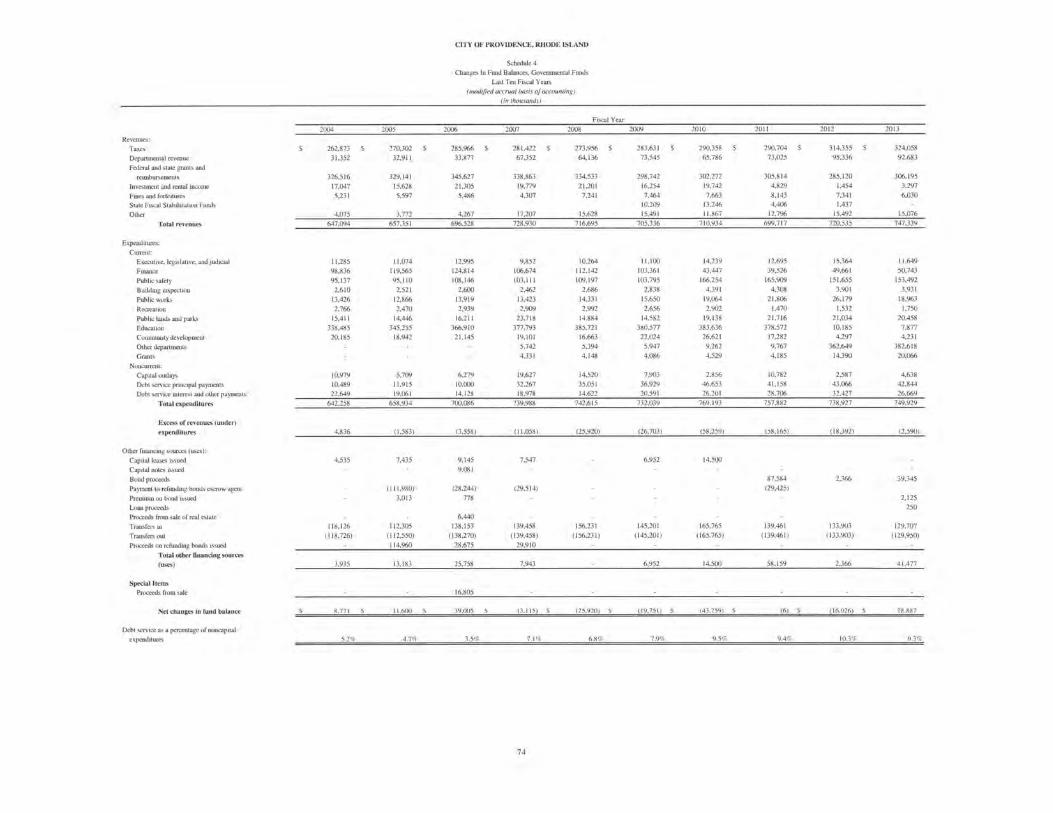
Revenues:
Taxes Departmental revenue
Federal and state grants and rcimbun;emcuts
Investment and rental income
Fines and forfeitures State Fiscal Stabilization Fwuis Other
Total revenues
Expenditures: CWTent:
Execut ive. legislative. and judicial Finance
Public safety Building inspection Public works Recreation Public lands and parks Education Comnumitydevelopmeot Other departments Grants
Noocurrcnt:
Capital out lays Debt service principnl payments Debt service interest and other payments
Total expendilures
Excess of rtvenues (under)
exvenditures
Other fmancing sources (uses):
Capital leases issued Capital notes issued Bond proceeds Payment to refunding bonds escrow agent Premium on bood issued Loan proceeds Proceeds from sale of real estate Transfers in
Transfers out Proceeds on refunding bonds issued
Total other financing sources (uses)
Specialltt!ntS Proceeds from sale
Net changt!S in fund balance
Debt service as a percentage of noucapital
expenditures
2004
262.873 31.352
326.5 16 17.047
5.23 1
4.075 647.094
11.285
98.836 95.137
2.6 10
13.426
2.766 15.411
338.485 20. 185
10.979
10.489 22 .649
642.258
4.836
4.535
11 8. 126 (118.726)
3.935
8.771
5.2%
2005
270.302 32.9 11
329.141
15.628
5.597
3.772 657.35 1
11.074 119.565
95. 110
2.52 1
12.866 2.470
14.446 345.255
18.942
5.709 11.915 19.061
658.934
(1.583)
7.435
(111.980)
3.013
11 2.305 ( 112.550)
11 4.960
13.183
11 .600
4.7<;1-
CITY OF PROVIDENCE, RHODE ISLAND
Schedule 4
Changes In Fund Balances, Governmental Funds Last Ten Fiscal Years
(modified accrual /J(IJis of accounting) (in thousands)
2006
285.966 33.877
345.627
21.305
5.486
4.267
6%.528
12.995 124.814
108.146
2.600 13.919
2.939
16.211 366.9 10
21. 145
6.279
10.000 14.128
700.086
(3.558)
9.145
9.08 1
(28.244) 778
6.440 138.153
(138.270)
28.675
25.758
16.805
39.005
3.5%
2007
28 1.422
67.352
338.863 19.779
4.307
17.207
728.930
9.852 106.674 103.111
2.462
13.423
2.909 23.7 18
377.793 19.101
5.742
4.33 1
19.627
32.267 18.978
739.988
(11.058)
7.547
(29.514)
139.458 (139.458)
29.910
7.943
(3. 11 5)
7. 1%
74
Fiscal Year 2008
273.956 64. 136
334.533 21.20 1
7.24 1
15.628 716.695
10.264 112.142
109, 197
2.686
14.33 1
2.992 14.884
385.72 1 16.663
5.394 4. 148
14.520 35.05 1 14.622
742.615
(25.920}
156.231
(156.23 1)
(25.920) s
6.8%
2009
283.631 73.545
298.742
16,254
7.464 10.209 15.491
705.336
11.100 103.361
103.795
2.838 15.65{)
2.656
14.582
380.577 22.024
5.947
4.086
7.903 36.929 20.59 1
732.039
(26.703)
6.952
145.201 (145.201)
6.952
(19.751) s
7.9%
2010
290.358 65.786
302.272
19.742
7.663 13.246 11.867
710.934
14.239 43.447
166.254
4.39 1
19.064
2.902 19.138
383.636 26.621
9.262
4.529
2.856 46.653 26.201
769.193
(58.259)
14.500
165.765 (165.765)
14.500
(43.759) s
9.5%
20 11
290.704
73.025
305.8 14 4.829
8.143 4,406
12.7%
699.717
12.695 39.526
165.909
4.308 21.806
1.470 21.716
378.572 17.282
9.767
4. 185
10.782 4 1. 158
28.706 757.882
(58. 165)
87.584
(29.425)
139.46 1 (139.461)
58.159
(6) s
9.4%
2012
314.355
95.336
285. 120
1.454 7.34 1 1.437
15.492
720.535
15.364 49.66 1
151.655
3.901 26. 179
1.532 2 1.034
10.185 4.297
362.649 14.390
2.587
43.066 32.427
738.927
(18.392)
2.366
133.903 (133.903)
2.366
( 16.026) s
10.3%
2013
324.058
92.683
306. 195
3.297
6.030
15.076
747.339
11.649
50.743 153.492
3,931
18.%3
1.750
20.458 7.877
4.231 382.6 18
20.066
4.638
42.844 26.669
749.929
(2.590)
.39.345
2.125
250
129.707
(129.950)
4 1.477
38.887
9.3%
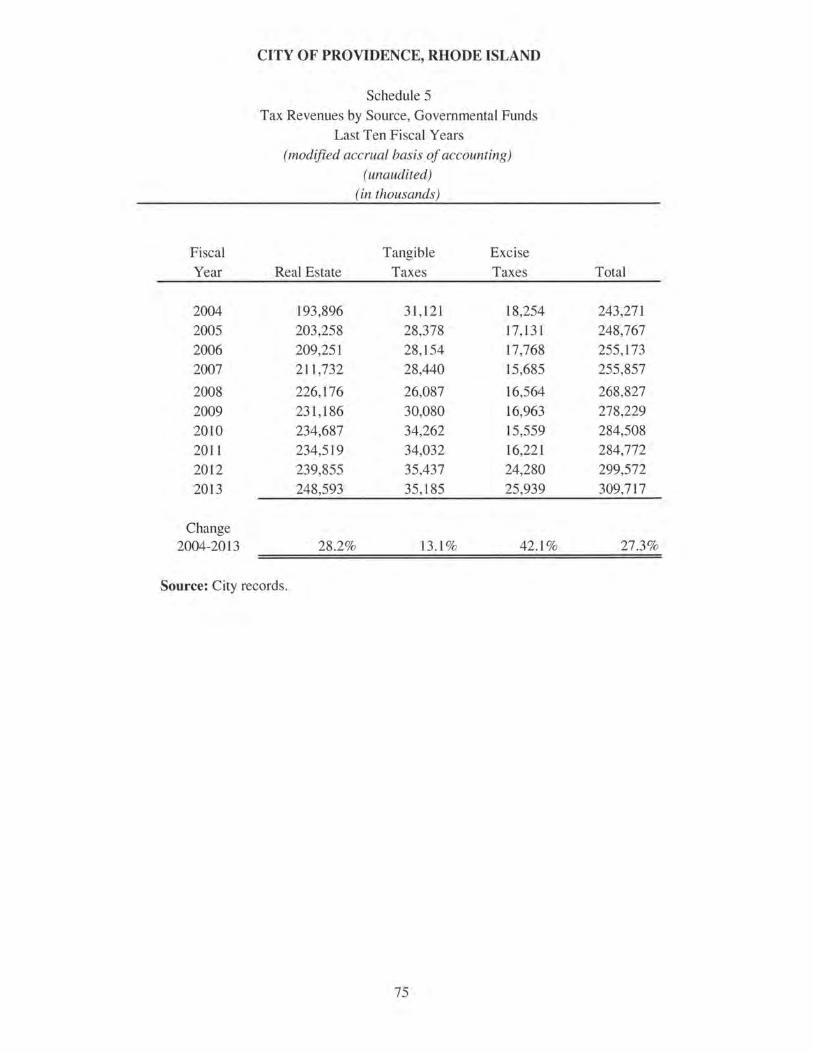
Fiscal
Year
2004 2005 2006 2007
2008 2009 2010 2011 2012 2013
Change 2004-2013
CITY OF PROVIDENCE, RHODE ISLAND
Schedule 5
Tax Revenues by Source, Governmental Funds
Last Ten Fiscal Years
(modified accrual basis of accounting) (unaudited)
(in thousands)
Tangible Excise
Real Estate Taxes Taxes
193,896 31' 121 18,254
203,258 28,378 17,131
209,251 28,154 17,768 211,732 28,440 15,685
226,176 26,087 16,564
231,186 30,080 16,963
234,687 34,262 15,559
234,519 34,032 16,221
239,855 35,437 24,280 248,593 35,185 25,939
28.2% 13.1 % 42.1%
Source: City records.
75
Total
243,271 248,767 255,173 255,857
268,827 278,229 284,508 284,772
299,572 309,717
27.3%
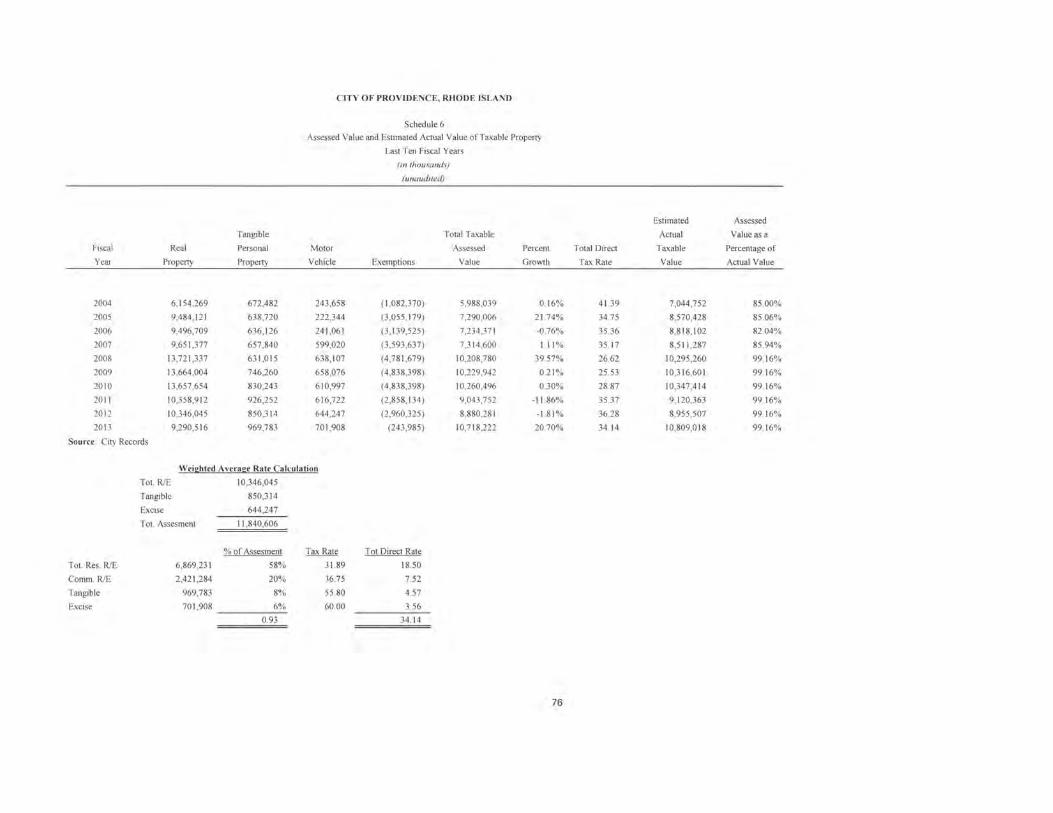
CITY OF PROVIDENCE, RHODE ISLAND
Schedule 6
Assessed Value and Estimated Actual Value of Taxable Property
Last Ten Fiscal Years
{in thousand\)
(unaudited)
Tangible Total Taxable
Fiscal Real Personal Motor Assessed Percent
Year Property Property Vehicle Exemptions Value Growth
2004 6, I 54 ,269 672 ,482 243 ,658 (1,082,370) 5,988,039 0.16%
2005 9,484 ,121 638,720 222 ,344 (3 ,055 , I 79) 7,290,006 21.74%
2006 9,496,709 636,126 241 ,06 1 (3 , I 39,525) 7,234 ,37 I -0.76%
2007 9,651 ,377 657 ,840 599,020 (3 ,593 ,637) 7,314,600 Ill %
2008 13,721 ,337 63 1,0 15 638,107 (4 ,78 I ,679) 10,208,780 39.57%
2009 13,664 ,004 746,260 658,076 (4 ,838,398) 10,229,942 0.2 1%
20 10 13,657 ,654 830,243 6 I 0,997 (4 ,838,398) 10,260,496 0.30%
2011 10,358,912 926,252 616,722 (2 ,858, I 34) 9,043,752 - 11.86%
20 12 10,346,045 850,3 14 644 ,247 (2,960,325) 8,880,28 I -1.81%
20 13 9,290,516 969,783 701 ,908 (243 ,985) 10,7 18,222 20.70%
Source: City Records
Tot. Res. RIE
Comm. RIE
Tangible
Excise
Tot. RIE
Tangible
Excise
Weighted Average Rate Calculation
10,346,045
850,3 14
644 ,247
Tot. Assesment 11 ,840,606
%of Assesment Tax Rate
6,869,23 1 58% 3 1.89
2,42 I ,284 20% 36.75
969,783 8% 55.80
70 1,908 6% 60.00
0.93
Tot. Direct Rate
18.50
7.52
4.57
3.56
34. 14
76
Estimated Assessed
Actual Value as a
Total Direct Taxable Percentage of
Tax Rate Value Actual Value
41.39 7,044 ,752 8500%
34.75 8,570,428 8506%
35.36 8,8 18,102 82.04%
35.17 8,5 I I ,287 85 .94%
26.62 10,295 ,260 99.16%
25 .53 10,316,601 99.16%
28.87 10,347 ,4 14 99.16%
35.37 9,120,363 99.16%
36.28 8,955,507 99.16%
34.14 10,809,018 99.16%
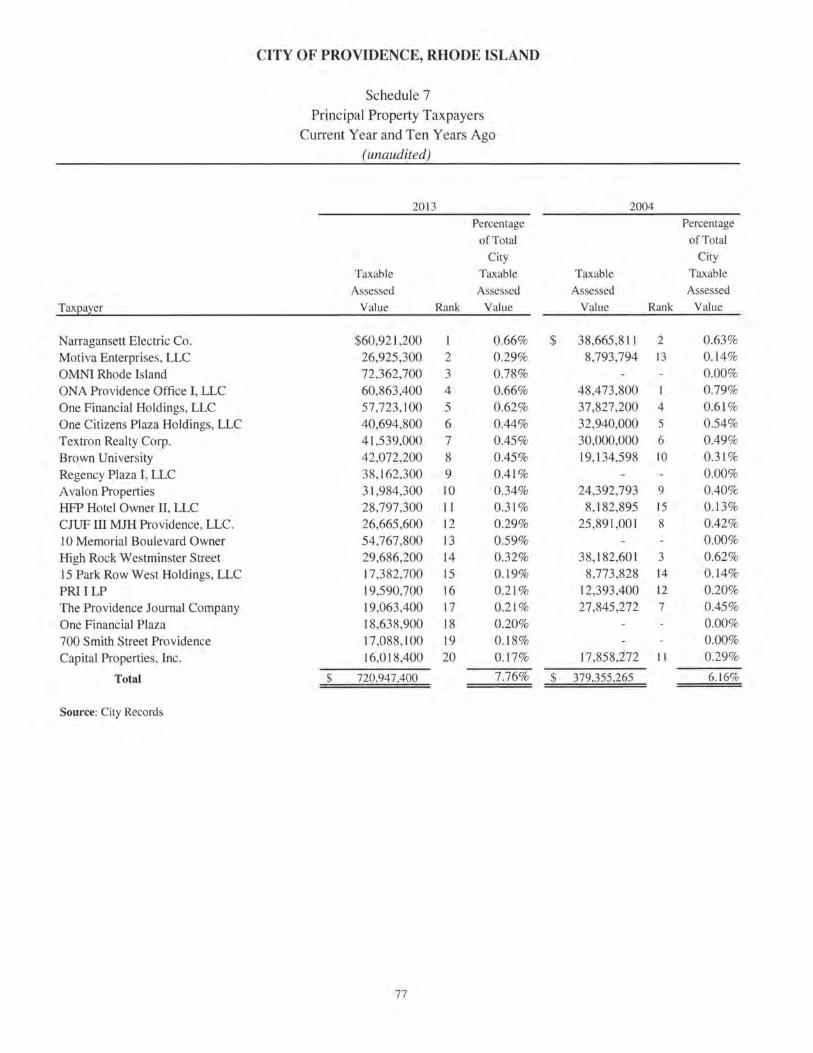
CITY OF PROVIDENCE, RHODE ISLAND
Schedule 7
Principal Property Taxpayers
Current Year and Ten Years Ago (unaudited)
2013 2004
Percentage Percentage of Total of Total
City City Taxable Taxable Taxable Taxable
Assessed Assessed Assessed Assessed Taxpayer Value Rank Value Value Rank Value
Narragansett Electric Co. $60,92 1,200 0.66% $ 38,665,811 2 0.63 % Motiva Enterprises, LLC 26,925,300 2 0.29% 8,793,794 13 0.14% OMNI Rhode Island 72,362,700 3 0.78% 0.00%
ONA Providence Office I, LLC 60,863,400 4 0.66% 48,473,800 0.79% One Financial Holdings, LLC 57,723,100 5 0.62% 37,827,200 4 0.61% One Citizens Plaza Holdings, LLC 40,694,800 6 0.44% 32,940,000 5 0.54%
Textron Realty Corp. 41,539,000 7 0.45% 30,000,000 6 0.49% Brown University 42,072,200 8 0.45% 19,134,598 10 0.31%
Regency Plaza I, LLC 38,162,300 9 0.41% 0.00%
A val on Properties 3 1,984,300 10 0.34% 24,392,793 9 0.40%
HFP Hotel Owner II, LLC 28,797,300 II 0.31% 8,182,895 15 0.13%
CJUF III MJH Providence, LLC. 26,665,600 12 0.29% 25,891,001 8 0.42%
lO Memorial Boulevard Owner 54,767,800 13 0.59% 0.00%
High Rock Westminster Street 29,686,200 14 0.32% 38,182,601 3 0.62% 15 Park Row West Holdings, LLC 17,382,700 15 0.19% 8,773,828 14 0. 14%
PRI ILP 19,590,700 16 0.21% 12,393,400 12 0.20%
The Providence Journal Company 19,063,400 17 0.21% 27,845,272 7 0.45%
One Financial Plaza 18,638,900 18 0.20% 0.00%
700 Smith Street Providence 17,088, 100 19 0.18% 0.00%
Capital Properties, Inc. 16,018,400 20 0.17% 17,858,272 II 0.29%
Total $ 720,947,400 7.76% $ 379,355,265 6. 16%
Source: City Records
77
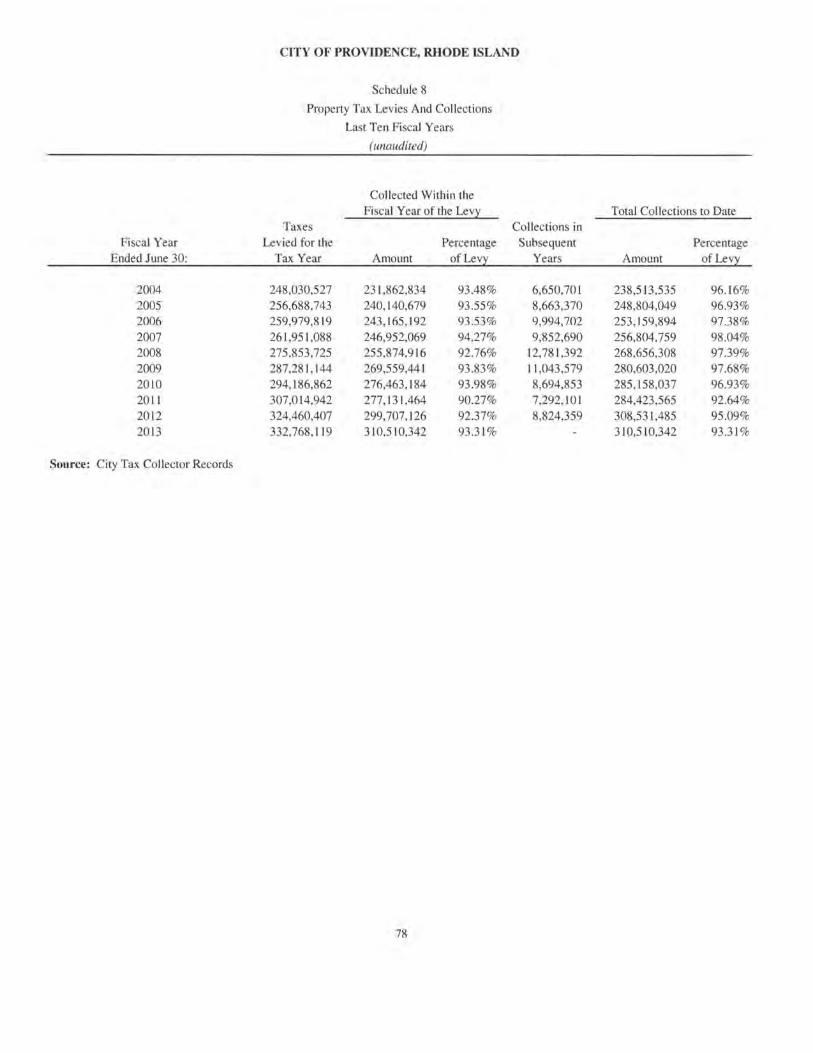
Fiscal Year Ended June 30:
2004 2005 2006 2007 2008 2009 20 10 2011 20 12 2013
Source: City Tax Collector Records
CITY OF PROVIDENCE, RHODE ISLAND
Schedule 8
Property Tax Levies And Collections
Last Ten Fiscal Years
(unaudited)
Collected Within the Fiscal Year of the Lev;r
Taxes Levied for the Percentage
Tax Year Amount of Levy
248,030,527 23 I ,862,834 93.48% 256,688,743 240, 140,679 93.55% 259,979,819 243, 165, 192 93 .53% 26 1,95 1,088 246,952,069 94.27% 275,853,725 255,874,9 16 92.76% 287,281 , 144 269,559,44 1 93.83% 294, 186,862 276,463,184 93.98% 307,014,942 277,13 1,464 90.27% 324,460,407 299,707, 126 92.37% 332,768, 119 3 10,5 10,342 93.3 1%
78
Collections in Subsequent
Years
6,650,70 1 8,663,370 9,994,702 9,852,690
12,78 1,392 11 ,043,579 8,694,853 7,292, 101 8,824,359
Total Collections to Date
Percentage Amount of Levy
238,513,535 96.16% 248,804,049 96.93% 253, 159,894 97.38% 256,804,759 98.04% 268,656,308 97.39% 280,603,020 97.68% 285, 158,037 96.93% 284,423,565 92.64% 308,53 1,485 95.09% 310,5 10,342 93.3 1%
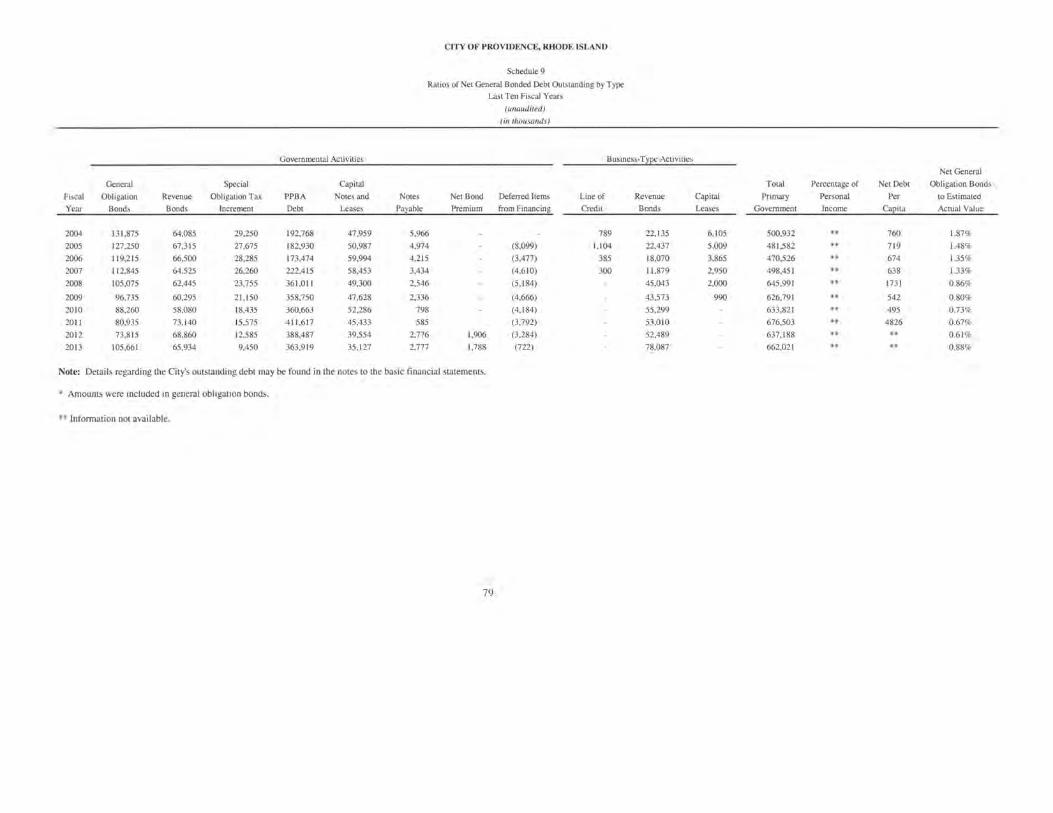
Governmental Activities
General Special Capital
Fiscal Obligation Revenue Obligation Tax PPBA Notes and
Year Bonds Bonds Increment Debt Leases
2004 131 ,875 64,085 29,250 192,768 47,959
2005 127,250 67,315 27,675 182,930 50,987
2006 119,215 66,500 28,285 173,474 59,994
2007 112,845 64,525 26,260 222,415 58,453
2008 105,075 62,445 23,755 361,011 49,300
2009 96,735 60,295 21 ,150 358,750 47,628
2010 88.260 58,080 18,435 360,663 52,286
2011 80,935 73,140 15,575 411,617 45,433
2012 73.815 68,860 12,585 388,487 39,554
2013 105.661 65,934 9.450 363,9 19 35 ,127
CITY OF PROVIDENCE, RHODE ISLAN D
Schedule 9
Ratios of Net General Bonded Debt Outstanding by Type
Last Ten Fiscal Years
(unaudited)
(in thousands)
Business-Type Activities
Notes Net Bond Deferred I terns Line of Revenue
Payable Premium from Financing Credit Bonds
5,966 789 22,135
4,974 (8,099) 1,104 22,437
4,215 (3,477) 385 18,070
3,434 (4,610) 300 11 ,879
2,546 (5,184) 45,043
2,336 (4,666) 43,573
798 (4,184) 55,299
585 (3,792) 53,010
2.776 1,906 (3,284) 52,489
2,777 1,788 (722) 78,087
Note: Details regarding the City's outstanding debt may be found in the notes to the basic financial statements.
• Amounts were mcluded m general obltgauon bonds.
** Information not available.
79
Net General
Total Percentage of Net Debt Obligation Bonds
Capital Primary Personal Per to Estimated
Leases Government Income Capita Actual Value
6,105 500,932 760 1.87%
5,009 481,582 719 1.48%
3.865 470,526 674 1.35%
2,950 498,451 638 1.33%
2,000 645,991 1731 0.86%
990 626,791 542 0.80%
633,821 495 0.73%
676,503 4826 0.67%
637,188 ** 0.61 %
662,021 0.88%
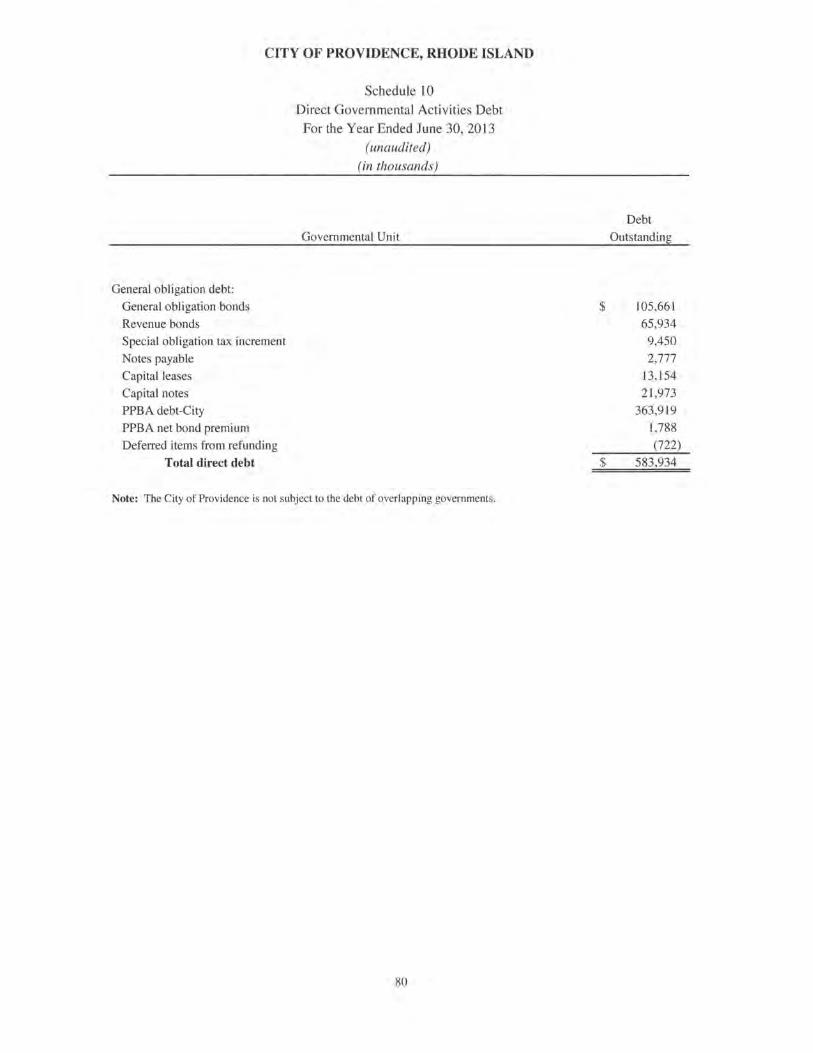
CITY OF PROVIDENCE, RHODE ISLAND
General obligation debt:
General obligation bonds
Revenue bonds
Special obligation tax increment
Notes payable
Capital leases
Capital notes
PPBA debt-City
PPBA net bond premium
Deferred items from refunding
Total direct debt
Schedule 10
Direct Governmental Activities Debt For the Year Ended June 30, 20 13
(unaudited)
(in thousands)
Governmental Unit
Note: The City of Providence is not subject to the debt of overlapping governments.
80
$
$
Debt
Outstanding
105,661
65,934
9,450
2,777
13,154
21,973
363,919
1,788
(722)
583,934
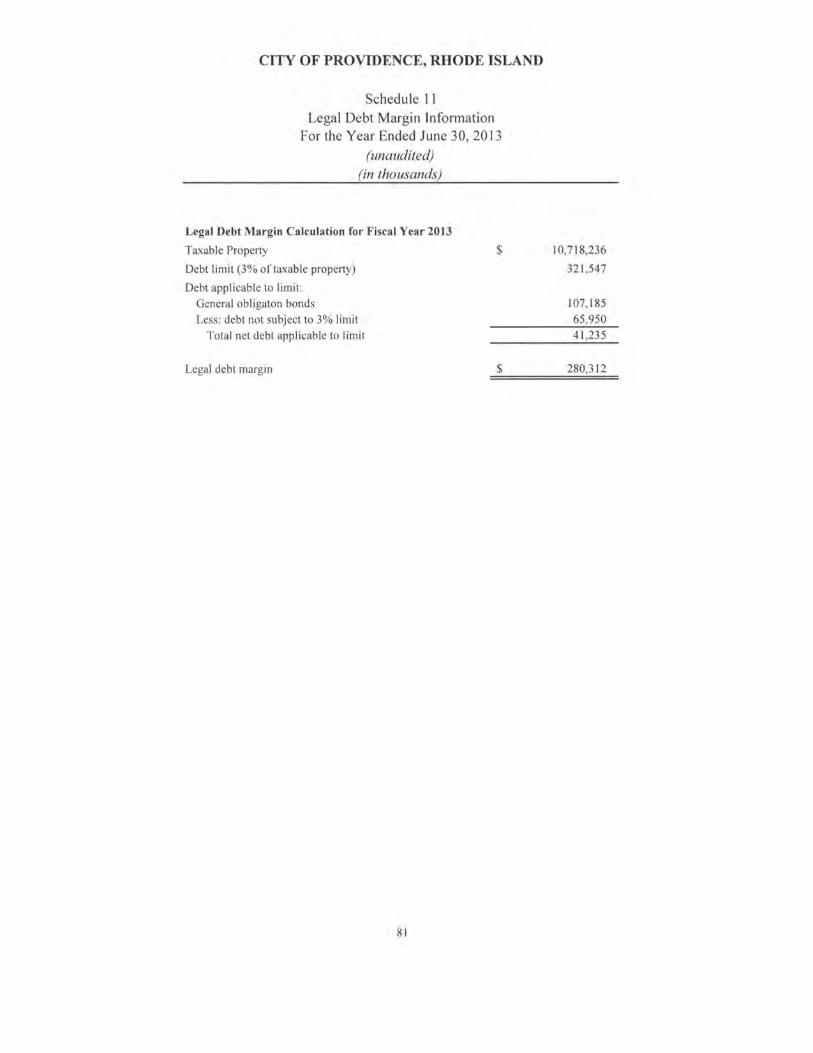
CITY OF PROVIDENCE, RHODE ISLAND
Schedule 11 Legal Debt Margin Information
For the Year Ended June 30,2013
(unaudited) (in thousands)
Legal Debt Margin Calculation for Fiscal Year 2013
Taxable Property $
Debt limit (3% of taxable property)
Debt applicable to limit:
General obligaton bonds
Less: debt not subject to 3% limit
Total net debt applicable to limit
Legal debt margin $
81
10,718,236
321 ,547
107, 185
65 ,950
41 ,235
280,312
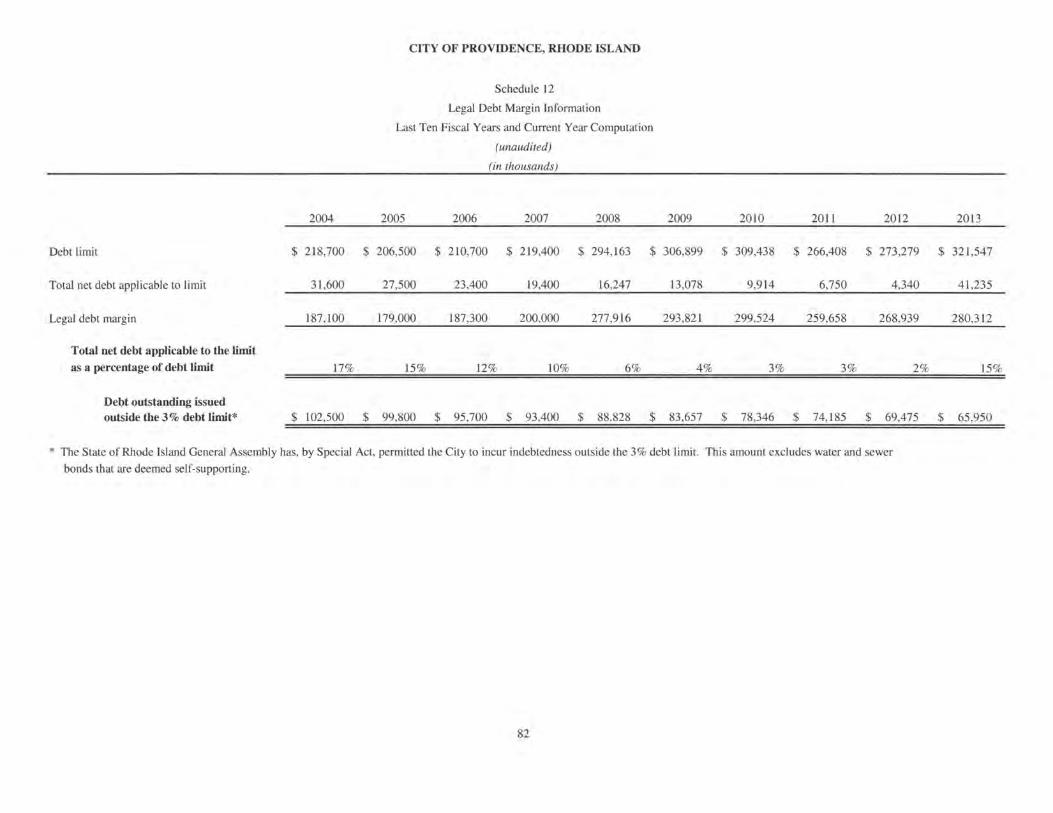
2004
Debt limit $ 218,700 $
Total net debt applicable to limit 31,600
Legal debt margin 187,100
Total net debt applicable to the limit
as a percentage of debt limit 17%
Debt outstanding issued outside the 3% debt limit* $ 102,500 $
CITY OF PROVIDENCE, RHODE ISLAND
Schedule 12
Legal Debt Margin Information
Last Ten Fiscal Years and Current Year Computation
(unaudited)
(in thousands)
2005 2006 2007 2008
206,500 $ 210,700 $ 219,400 $ 294,163 $
27,500 23,400 19,400 16,247
179,000 187,300 200,000 277,916
IS% 12% 10% 6%
99,800 $ 95 ,700 $ 93,400 $ 88,828 $
2009 2010 20ll 20 12
306,899 $ 309,438 $ 266,408 $ 273,279
13,078 9,914 6,750 4,340
293,821 299,524 259,658 268,939
4% 3% 3% 2%
83,657 $ 78,346 $ 74,185 $ 69,475
* The State of Rhode Island General Assembly has, by Special Act, permitted the City to incur indebtedness outside the 3% debt limit. This amount excludes water and sewer
bonds that are deemed self-supporting.
82
2013
$ 321,547
41,235
280,312
15%
$ 65,950
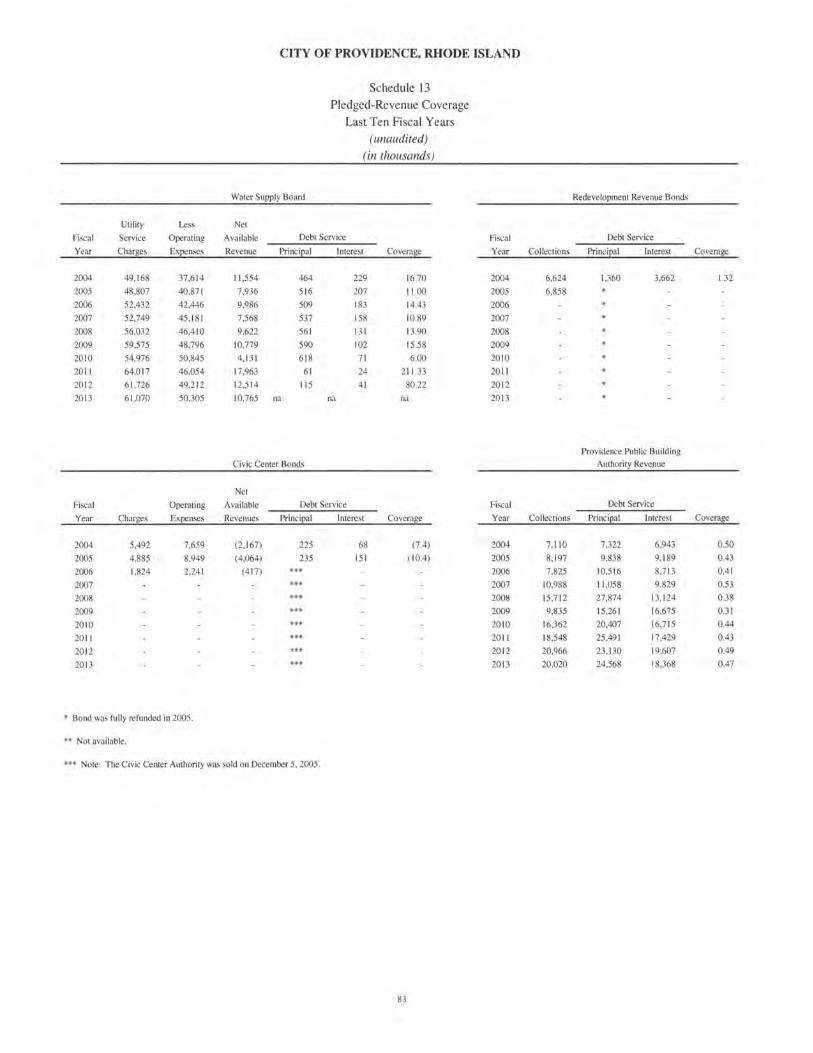
Utility Less
Fiscal Service Operating
Year Charges Expenses
2004 49,168 37,614
2005 48,807 40,871
2006 52,432 42,446
2007 52,749 45 ,181
2008 56,032 46,410
2009 59,575 48,796
2010 54,976 50,845
2011 64,017 46,054
20 12 61,726 49,2 12
2013 61,070 50,305
Fiscal Operating
Year Charges Expenses
2004 5,492 7,659
2005 4,885 8,949
2006 1,824 2,241
2007
2008
2009
2010
2011
2012
2013
• Bond was fully refunded in 2005.
•• No! available.
CITY OF PROVIDENCE, RHODE ISLAND
Water Supply Board
Nel
Schedule 13
Pledged-Revenue Coverage
Last Ten Fiscal Years (unaudited)
(in thousands)
Available Debt Service
Revenue Principal Interest Coverage
II ,554 464 229 16.70
7,936 516 207 11.00
9,986 509 183 14.43
7,568 537 158 10.89
9,622 561 131 13 .90
10,779 590 102 15 .58
4,131 618 71 6.00
17,963 61 24 211.33
12,514 115 41 80.22
10,765 na na na
Civic Center Bonds
Net
Available Deb! Service
Revenues Principal Interest Coverage
(2,167) 225 68 (7.4)
(4,064) 235 151 (10.4)
(4 17) ••• ••• ••• ••• ••• ••• ••• •••
Fiscal
Year
2004
2005
2006
2007
2008
2009
2010
2011
2012
2013
Fiscal
Year
2004
2005
2006
2007
2008
2009
2010
2011
2012
2013
••• Note: The Civic Center Authority was sold on December 5, 2005.
83
Redevelopment Revenue Bonds
Deb! Service
Collections Principal Interest Covera~e
6,624 1,360 3,662 1.32
6,858
Providence Public Building
Authority Revenue
Deb! Service
Collections Principal lnleresl Coverage
7,110 7,322 6,943 0.50
8,197 9,838 9,189 0.43
7,825 10,5 16 8,713 0.41
10,988 11 ,058 9,829 0.53
15,7 12 27,874 13,124 0.38
9,835 15,261 16,675 0.31
16,362 20,407 16,7 15 0.44
18,548 25,491 17,429 0.43
20,966 23,130 19,607 0.49
20,020 24,568 18,368 0.47
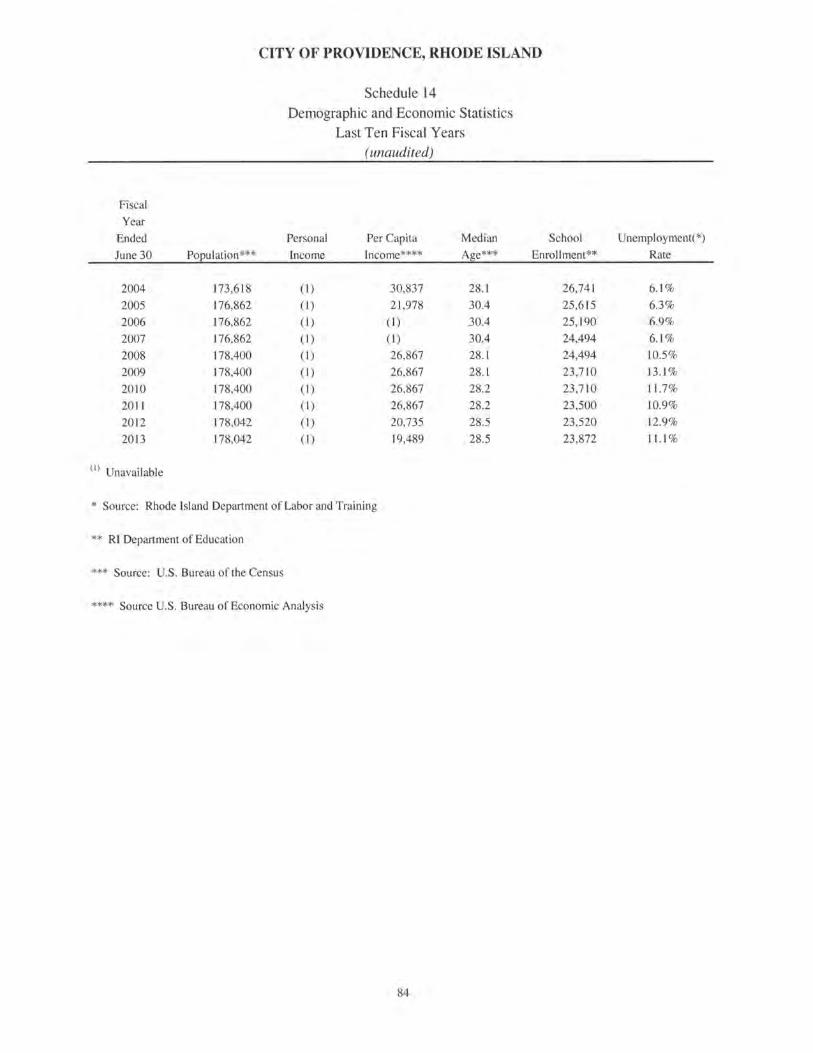
CITY OF PROVIDENCE, RHODE ISLAND
Fiscal
Year
Ended
June 30 Population***
2004 173,618
2005 176,862
2006 176,862
2007 176,862
2008 178,400
2009 178,400
2010 178,400
2011 178,400
2012 178,042
2013 178,042
( I ) Unavailable
Schedule 14
Demographic and Economic Statistics
Last Ten Fiscal Years (unaudited)
Personal
Income
(l)
(I) (l)
(l)
(I) (I) (I) (I) (I) (I)
Per Capita
Income****
30,837
21 ,978
(I) (I) 26,867
26,867
26,867
26,867
20,735
19,489
Median
Age***
28.1
30.4
30.4
30.4
28.1
28.1
28.2
28.2
28.5
28.5
* Source: Rhode Island Department of Labor and Training
** Rl Department of Education
*** Source: U.S. Bureau of the Census
**** Source U.S . Bureau of Economic Analysis
84
School
Enrollment**
26,741
25,615
25 , 190
24,494
24,494
23,710
23,710
23 ,500
23 ,520
23 ,872
Unemployment(*)
Rate
6.1%
6.3%
6.9%
6.1%
10.5%
13.1 %
11.7%
10.9%
12.9%
11.1 %
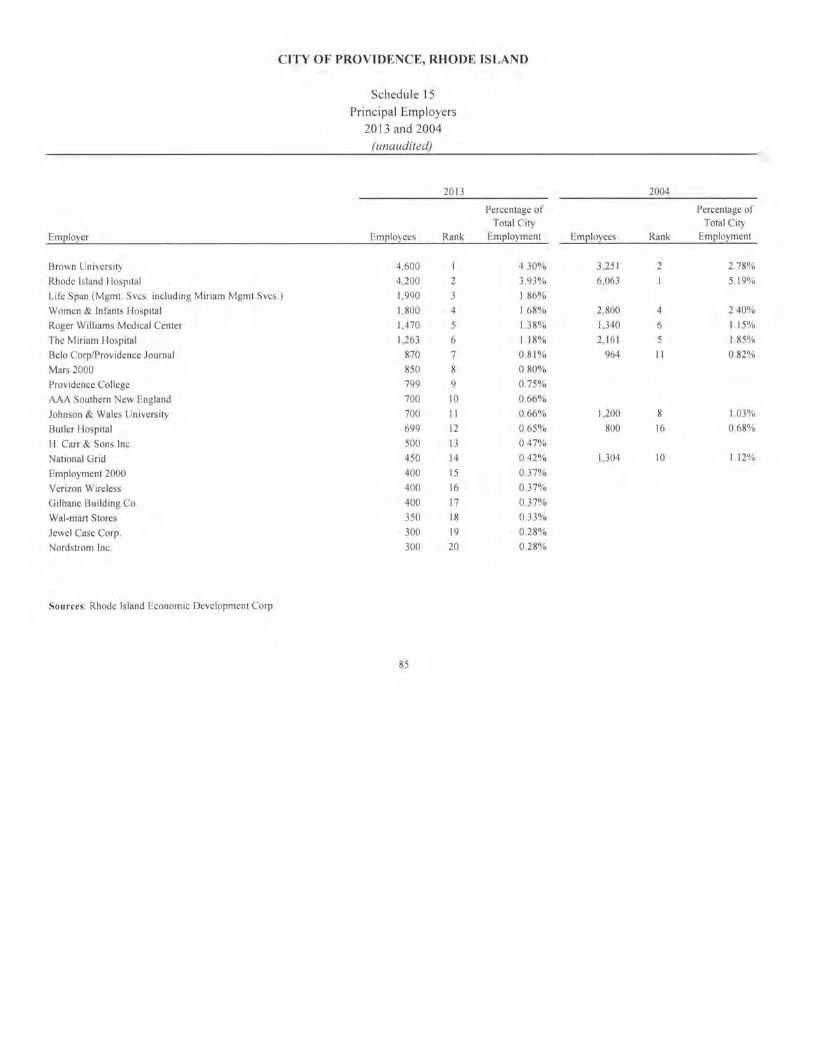
CITY OF PROVIDENCE, RHODE ISLAND
Employer
Brown University
Rhode Island Hospital
Life Span (Mgmt. Svcs. including Miriam Mgmt Svcs.)
Women & Infants Hospital
Roger Williams Medical Center
The Miriam Hospital
Belo Corp/Providence Journal
Mars 2000
Providence College
AAA Southern New England
Johnson & Wales University
Butler Hospital
H. Carr & Sons Inc.
National Grid
Employment 2000
Yerizon Wireless
Gilbane Building Co.
Wal-mart Stores
Jewel Case Corp.
Nordstrom Inc.
Sources : Rhode Island Economic Development Corp.
Schedule 15 Principal Employers
20 13 and 2004 (unaudited)
2013
Employees Rank
4,600 I
4,200 2
1,990 3
1,800 4
1,470 5
1,263 6
870 7
850 8
799 9
700 10
700 II
699 12
500 13
450 14
400 15
400 16
400 17
350 18
300 19
300 20
85
Percentage of Total City
Employment
4.30%
3.93%
1.86%
1.68%
1.38%
1.18%
0.81%
0.80%
0.75%
0.66%
0.66%
0.65%
0.47% 0.42%
0.37%
0.37%
0.37%
0.33%
0.28%
0.28%
Employees
3,251
6,063
2,800
1,340
2,161
964
1,200
800
1,304
2004
Rank
2
4
6
5
II
8 16
10
Percentage of Total City
Employment
2.78% 5.19%
2.40%
1.15%
1.85% 0.82%
1.03%
0.68%
1.12%
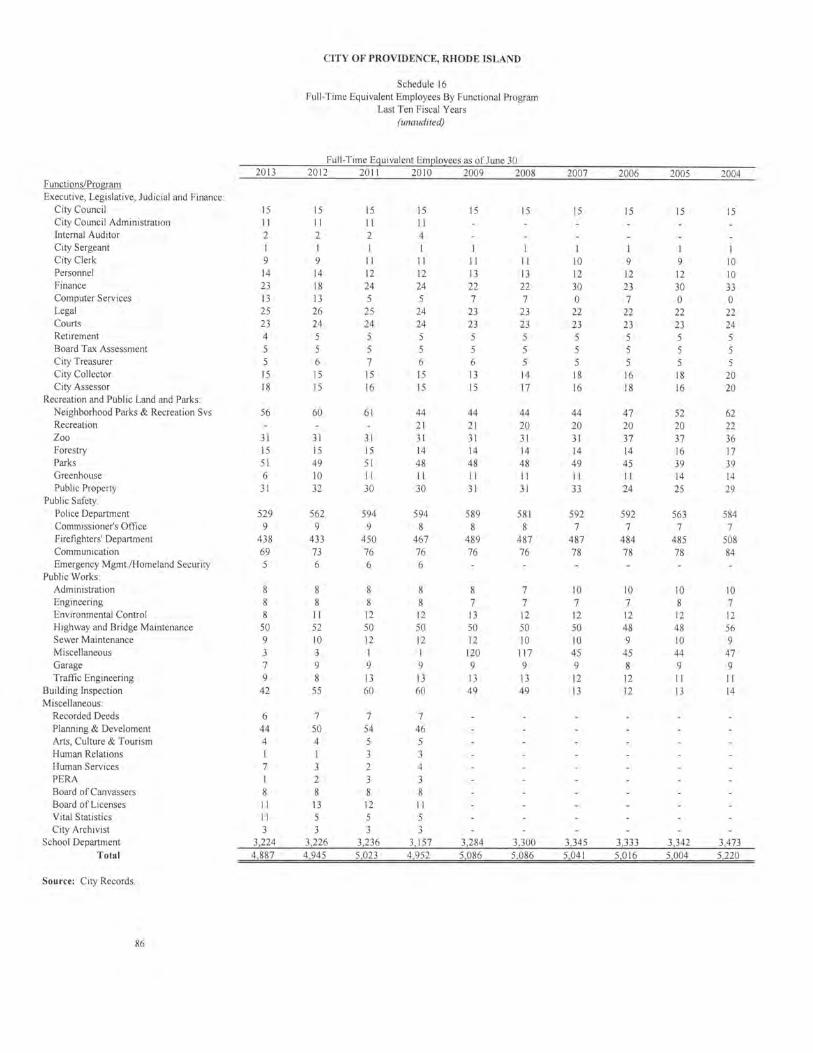
Functions/Program Executive, Legislative, Judicial and Finance:
City Council City Council Administration Internal Auditor City Sergeant City Clerk Personnel Finance Computer Services Legal Courts Retirement Board Tax Assessment City Treasurer City Collector City Assessor
Recreation and Public Land and Parks: Neighborhood Parks & Recreation Svs Recreation Zoo Forestry Parks Greenhouse Public Property
Public Safety: Police Department Commissioner's Office Firefighters' Department Communication Emergency Mgmt./Homeland Security
Public Works Administration Engineering Environmental Control Highway and Bridge Maintenance Sewer Maintenance Miscellaneous Garage Traffic Engineering
Building Inspection Miscellaneous:
Recorded Deeds Planning & Develoment Arts, Culture & Tourism Human Relations Human Services PERA Board of Canvassers Board of Licenses Vital Statistics City Archivist
School Department Total
Source: City Records .
86
2013
15 II 2 I 9 14 23 13 25 23 4 5 5 15 18
56
31 15 51 6
31
529 9
438 69 5
8 8 8
50 9 3 7 9
42
6 44 4 I 7 I 8 II II 3
3 224 4 887
CITY OF PROVIDENCE, RHODE ISLAND
Schedule 16 Full-Time Equivalent Employees By Functional Program
Last Ten Fiscal Years (unaudited)
Full-Time Equivalent Employees as of June 30 2012 2011 2010 2009 2008
15 II 2 I 9 14 18 13 26 24 5 5 6 15 15
60
31 15 49 10 32
562 9
433 73 6
8 8 II 52 10 3 9 8
55
7 50 4 I 3 2 8 13 5 3
3 226 4 945
15 II 2 I II 12 24 5
25 24 5 5 7 15 16
61
31 15 51 II 30
594 9
450 76 6
12 50 12 I 9 13 60
7 54 5
2 3 8 12 5 3
3,236 5 023
15 II 4
II 12 24 5
24 24 5 5 6 15 15
44 21 31 14 48 II 30
594 8
467 76 6
8 8 12 50 12 I 9 13 60
7 46 5 3 4
3 8 II 5 3
3, 157 4 952
15
I II 13 22 7
23 23 5 5 6 13 15
44 21 31 14 48 II 31
589 8
489 76
8 7 13 50 12
120 9 13 49
3,284 5 086
15
II 13 22 7
23 23
5 5 14 17
44 20 31 14 48 II 31
581 8
487 76
7 7 12 50 10
117 9 13 49
3,300 5 086
2007
15
10 12 30 0
22 23 5 5 5 18 16
44 20 31 14 49 II 33
592 7
487 78
10 7 12 50 10 45 9 12 13
3,345 5 041
2006
15
I 9 12 23 7
22 23 5 5 5 16 18
47 20 37 14 45 II 24
592 7
484 78
10 7 12 48 9
45 8 12 12
3,333 5 016
2005
15
I 9 12 30 0
22 23 5 5 5 18 16
52 20 37 16 39 14 25
563 7
485 78
10 8 12 48 10 44 9 II 13
3,342 5 004
2004
15
10 10 33 0
22 24 5 5
20 20
62 22 36 17 39 14 29
584 7
508 84
10 7 12 56 9
47 9 II 14
3 473 5 220
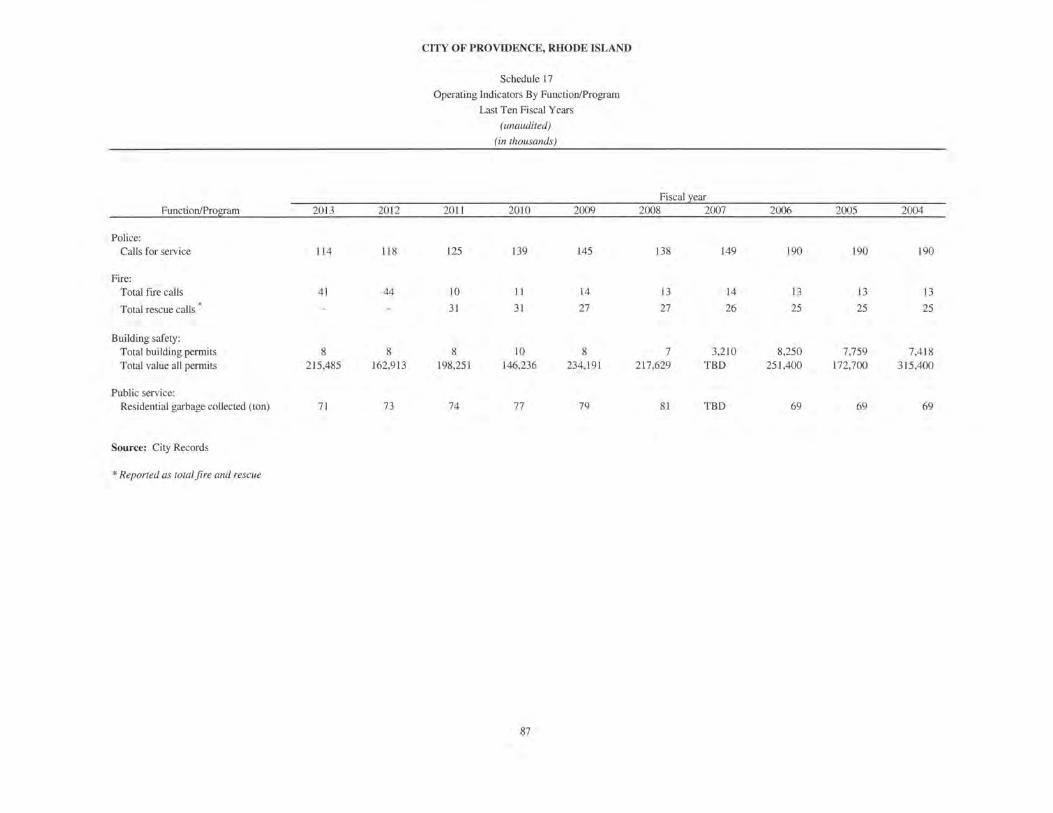
Function/Program 2013 2012
Police: Calls for service 114 118
Fire: Total fire calls 41 44
Total rescue calls
Building safety: Total building permits 8 8 Total value all permits 215,485 162,913
Public service: Residential garbage collected (ton) 71 73
Source: City Records
* Reported as total fire and rescue
CITY OF PROVIDENCE, RHODE ISLAND
Schedule 17
Operating Indicators By Function/Program
Last Ten Fiscal Years
(unaudited)
(in thousands)
2011 2010 2009
125 139 145
10 II 14
31 31 27
8 10 8 198,251 146,236 234,191
74 77 79
87
Fiscal ear 2008 2007 2006 2005 2004
138 149 190 190 190
13 14 13 13 13
27 26 25 25 25
7 3,210 8,250 7,759 7,418 217,629 TBD 251,400 172,700 315,400
81 TBD 69 69 69
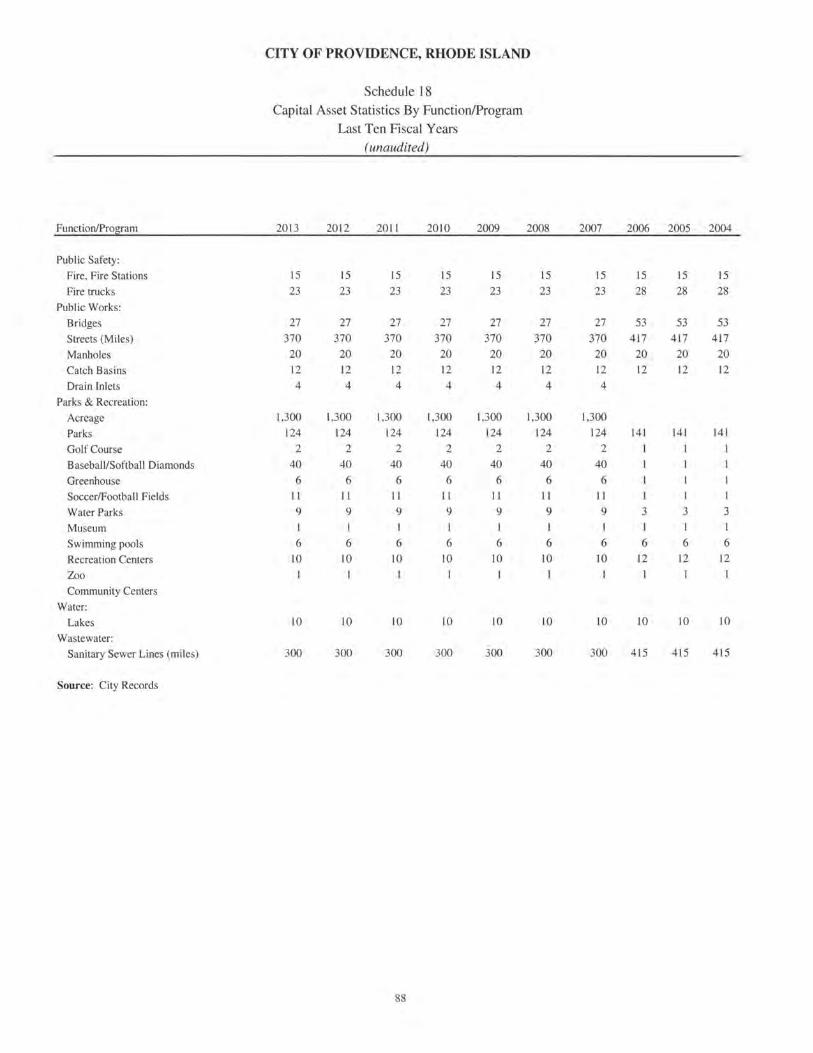
Function/Prmrram
Public Safety:
Fire, Fire Stations
Fire trucks
Public Works:
Bridges
Streets (Miles)
Manholes
Catch Basins
Drain Inlets
Parks & Recreation:
Acreage
Parks
Golf Course
Baseball/Softball Diamonds
Greenhouse
Soccer/Football Fields
Water Parks
Museum
Swimming pools
Recreation Centers
Zoo
Community Centers
Water:
Lakes
Wastewater:
Sanitary Sewer Lines (miles)
Source: City Records
CITY OF PROVIDENCE, RHODE ISLAND
Schedule 18
Capital Asset Statistics By Function/Program
Last Ten Fiscal Years
(unaudited)
20 13 20 12 20 11 20 10 2009
15 15 15 15 15 23 23 23 23 23
27 27 27 27 27 370 370 370 370 370 20 20 20 20 20 12 12 12 12 12 4 4 4 4 4
1,300 1,300 1,300 1,300 1,300 124 124 124 124 124
2 2 2 2 2 40 40 40 40 40 6 6 6 6 6
II II II II II
9 9 9 9 9 I I I I I
6 6 6 6 6 10 10 10 10 10
10 10 10 10 10
300 300 300 300 300
88
2008
15 23
27 370 20 12 4
1,300 124
2 40 6
II
9 I
6 10
10
300
2007 2006 2005 2004
15 15 15 15 23 28 28 28
27 53 53 53 370 417 417 417 20 20 20 20 12 12 12 12 4
1,300 124 141 141 141
2 1
40 6
II I I I
9 3 3 3 I I I I
6 6 6 6 10 12 12 12
10 10 10 10
300 415 415 415