Embed Size (px)
Citation preview

JOHN C. LIU COMPTROLLER
June 4, 2013
CITY OF NEW YORK OFFICE OF THE COMPTROLLER
CLAIMS REPORT FISCAL YEAR 2012

June 4, 2013 TO THE PEOPLE OF THE CITY OF NEW YORK:
I am pleased to present you with the New York City Comptroller’s Office Claims Report for Fiscal
Year 2012. Under the New York City Charter, the Comptroller is responsible for settling and
adjusting claims for and against the City.
In FY 2012, the City paid out 12 percent less in personal injury and property-damage tort
settlements and judgments. However, despite a reduction in claim payouts, the cost of these
claims to the City still hovers at nearly a half billion dollars annually.
In this report we identify trends and recommend ways the city can reduce the number of new
claims and the amounts awarded.
It is my hope that this report will serve as a catalyst to at least begin the discussion on how City
agencies can reduce the amount the City will pay out in the years to come.
Sincerely,
John C. Liu New York City Comptroller

2
Claims Report Table of Contents
I. EXECUTIVE SUMMARY .................................................................... 3 II. OVERVIEW OF COMPTROLLER’S INITIATIVES TO
MANAGE RISK AND IMPLEMENT BEST PRACTICES ......................... 11
III. TORT CLAIM TRENDS (FY’s 2011 - 2012) ......................................... 15
• PERSONAL INJURY CLAIMS.................................................. 16
1. Medical Malpractice Claims ............................................ 21
2. Motor Vehicle Claims ...................................................... 26
3. Civil Rights Claims ........................................................... 28
4. Police Action Claims ....................................................... 30
5. Defective Sidewalk Claims .............................................. 32
• PROPERTY DAMAGE CLAIMS .............................................. 34
IV. TORT CLAIM TRENDS BY AGENCY ................................................... 36 V. TORT CLAIM TRENDS BY BOROUGH ............................................... 53 VI. LAW CLAIMS (NON-TORT) .............................................................. 58 APPENDICES A: Description of Claim Types ............................................................. 62
B: Legal Background ............................................................................ 74
C: Top Ten Tort Claims Adjudicated in Fiscal Year 2012 ..................... 77
D: FY 2012 Chart Index ........................................................................ 79
E: Detailed Tables................................................................................ 80

3
I. EXECUTIVE SUMMARY
Under the New York City Charter, the Comptroller is responsible for settling and adjusting
claims for and against the City of New York (the “City”).1 This task is carried out by the Bureau
of Law and Adjustment (“BLA”), which is comprised of a dedicated team of attorneys, claims
professionals, and administrative staff.
For Fiscal Year (“FY”) 2012, the City paid out $485.9 million in personal injury and property
damage tort settlements and judgments; 12 percent less than the $553.7 million paid out in FY
2011.2 The City spent $59 for each resident to fund the cost of tort claims in FY 2012. These
tort claims ranged from slip and falls to medical malpractice, police actions, and motor vehicle
property damage claims.
In addition to tort claims, the City paid out $250.7 million in non-tort claims in FY 2012, an
increase from the $135.9 million paid in FY 2011. These claims consist primarily of contract
disputes between City agencies and their contractors, as well as alternative dispute-resolution
claims, equitable claims, employment-related claims, Department of Education (“DOE”) tuition-
reimbursement claims and sidewalk-assessment claims.
1 See City Charter Chapter 5 § 93(i). 2 New York City’s tort claims costs are paid from the judgment and claims account established annually in the City’s General Fund on a “pay as you go basis.”

4
The Comptroller’s Office is committed to the fair and early settlement of meritorious claims in
which an individual was injured or their property was damaged as a result of the City’s
negligence. Early settlement of meritorious claims allows injured parties to be compensated
relatively quickly when compared to litigation. In addition, our analysis has shown that early
settlement reduces payout amounts as well as administrative and litigation costs. By settling
claims early, we estimate that in FY 2012, the City saved more than $24 million in future
payouts.
This report examines claims data from FY 2012 and reports on recent claim trends. Despite the
reduction in claim payouts, the cost to the City still hovers at nearly half a billion dollars
annually. The Comptroller’s Office continues to explore and adopt new strategies to settle
meritorious claims earlier in an effort to reduce overall costs. Issuing this report on a yearly
basis rather than biennially serves several purposes: 1) to provide stakeholders with critical
information regarding claims and associated costs closer in time to identified trends; 2) to
facilitate the reduction in costs via recommendations; and 3) to serve as a city-wide risk
management tool.

5
(A) Claim Trends
The Police Department (“NYPD”) , the New York City Health and Hospitals Corporation (“HHC”),
and the Department of Transportation (“DOT”) are consistently responsible for the highest total
dollar amounts paid by the City, accounting for approximately 58 percent of total tort claims
filed and 68 percent paid in FY 2012.
At least for FY 2012, the amount paid out for the NYPD and HHC decreased from the previous
year. However, in the case of the NYPD, this year’s lower settlement costs may not accurately
reflect a new trend.
As discussed in previous reports, an area of concern is the growing number of tort claims filed
against the NYPD, with an historical high of 9,570 claims filed in FY 2012.3 The NYPD has seen
the number of claims rise 52 percent over the last five years. In FY 2012, the City paid $152
million in claims involving the NYPD, a decrease of 18 percent over the $186.3 million paid in FY
2011.
3 In FY 2011 and FY 2010 there were 8,941 and 8,148 claims filed respectively against the NYPD.

6
(B) Prior Recommendations
(1) We reiterate that the City must carefully examine the trend of more claims being filed
against the NYPD. Although there are no easy ways to reverse the trend, clearly more must be
done.
(2) We again call for the creation of a task force of representatives from the NYPD,
prosecutorial offices, the Corporation Counsel, the Civilian Complaint Review Board and the
Comptroller’s Office. The task force would identify areas that are high-risk in terms of claim
activity and create an action plan to better control those risks. A multi-disciplinary task force
could then monitor the implementation of cost effective recommendations across agency lines
to reduce claim costs.
(3) In the FY 2011 Claim Report, we recommended that tracking trends of claim type filed by
precinct could also be a valuable tool in determining whether certain management practices
are successful in limiting the City’s liability exposure while insuring that law enforcement meets
its goals. This strategy is similar to NYPD’s CompStat4 crime prevention methods. The
Comptroller’s Office is well aware that a claim represents only an allegation. Nonetheless, the
NYPD should explore a unified method to track individual officers named as defendants and the
4 NYPD’s abbreviation for their Computer Statistics program wherein commanding officers meet with NYPD executives to discuss crime rates by type and the allocation of resources to contain and/or prevent crime in their precincts.

7
payouts, including the nature of the payouts (i.e., a settlement or a judgment) that are
associated with those officers.
(4) Other avenues that could be explored include: on-going training regarding police vehicle
chases that balances both law enforcement goals and liability concerns and for the NYPD and
other agencies to establish early response protocols to requests for documentation in order to
settle meritorious claims before litigation, thereby mitigating costs.
(5) The Comptroller’s Office continues to strongly urge the City to replicate in other agencies
the kinds of risk management tools implemented at HHC. Given HHC’s impressive results in
controlling claim costs, the Comptroller’s Office again recommends that the City implement a
process whereby agencies bear some financial accountability for claim activity.
(C) New Recommendations
The City should attempt to reduce claim costs in the area of motor vehicle accidents. In FY
2012, the City paid out over $75 million in settlements related to injuries and damages as a
result of motor vehicle accidents involving City vehicles. This represents 16 percent of the total
tort payout. While significant, these claim costs represent only part of the true cost of motor
vehicle accidents to the City. Collateral expenses include, but are not limited to, Workers’
Compensation; sick leave for injured employees; settlements with Police officers, Firefighters

8
and Sanitation workers5 who are injured in motor vehicle accidents; and the cost of repair or
replacement of the motor vehicle.
The following map indicates the locations by and volume of motor vehicle accidents by the
community district in which they occurred in fiscal year 2012. (Due to inaccuracies or
incomplete street addresses reported on notices of claim by claimants, only 67 percent of the
claims in the motor vehicle categories could be mapped for fiscal FY 2012).
5 Police officers, firefighters and sanitation workers are not covered by Workers’ Compensation and in certain instances can sue the City for their injuries. New York State General Municipal Law §205-a and §205-e.

9
(1) We therefore recommend that the City implement a City-wide program to reduce motor
vehicle claims. While the Comptroller’s Office recognizes that many agencies have risk
issues particular to their own motor vehicle operations, an analysis of motor vehicle
claims data may reveal areas that could prevent injuries to City employees, the public
and property. Reviewing areas where large numbers of accidents occur may reveal
underlying problems that could be addressed. For example, possible defective roadway
10
designs; potholes; defective or needed traffic control devices, etc. could be identified
and corrected.
(2) The City could also do more to insure that all drivers and passengers in City vehicles
(even those in emergency vehicles) use seat belts which will prevent serious injuries
and/or death. (The National Highway Safety Administration reported that 42 percent of
police officers killed in vehicular accidents were not wearing seat belts).
(3) Another step that the City should consider to specifically make intersections safer for
emergency response vehicles is to use public service announcements to remind the
driving public of their responsibility to yield to emergency vehicles that may be
approaching intersections. Creating innovative public interest campaigns regarding this
issue will raise the public’s awareness of intersection dangers and hopefully save lives
and prevent serious injury.
11
II. OVERVIEW OF THE COMPTROLLER’S INITIATIVES TO MANAGE RISK AND
IMPLEMENT BEST PRACTICES
Pre-Litigation Settlements
In FY 2012, BLA settled 1,941 personal injury claims pre-litigation as compared to 1,685 pre-
litigation settlements in FY 2011; a 15 percent increase. This effort saved the City approximately
$24.8 million in settlement costs in FY 2012 and $22.2 million in FY 2011.
In FY 2012, the average pre-litigation settlement was $13,608, while the average settlement for
similar claims once litigation commenced was $24,170. In FY 2011, the average pre-litigation
personal injury settlement was $13,213 while the average settlement for similar personal injury
claims once litigation commenced was $24,507.

12
CChar Chart 1
Recovery Program
In FY 2012 and FY 2011 the Comptroller’s Office collected $9.2 million and $9.3 million
respectively, from claimants with outstanding obligations to the City and from individuals with
child support orders in arrears. By partnering with other agencies—particularly with the
Human Resources Administration ― BLA collected reimbursements for public assistance and
Medicaid benefits, as well as child support obligations from claimants who received settlements
from the City.
0
500
1,000
1,500
2,000
FY 2011 FY 2012
1,685Cases
1,941Cases
Chart 1 Pre-Litigation Personal Injury Settlements

13
Property Damage Affirmative Claim Expansion Efforts (Pre-litigation)
The Comptroller’s Office continues to expand its efforts to collect monies from individuals who
have damaged City property. Most of these claims involve damage to the City’s motor vehicles
and infrastructure. As a result of the BLA’s efforts, a record $1,978,971 in affirmative claims
was collected in FY 2012. This represents an increase of 112 percent in collections since FY
2001 when $934,079 in affirmative claims was collected. In FY 2011, $1,471,299 in affirmative
claims was collected.
Son of Sam Law (New York State Executive Law § 632-a) The BLA also collaborates with the New York State Office of Victims Services (“Victims
Services”) and the New York State Attorney General’s Office (“AG’s Office”) to identify
settlements made with convicted persons from whom victims can recover money. New York
State’s “Son of Sam” law requires that before a settlement of more than $10,000 is paid to a
convicted person, the City or the Comptroller’s Office must report the unpaid settlement to
Victims Services. Identification of those claims that need to be reported is accomplished using
an automated process.
The settlement funds are held for 30 days by the Comptroller’s Office while Victims Services
and the AG’s Office investigate whether there is a victim of a crime who can sue the
perpetrator in Civil Court.

14
As of May 2013, the Comptroller is holding $510,000, pending the outcome of crime victims’
civil actions against the convicted persons’ settlements.
Re-negotiation of NYS General Municipal Law 50(h) Hearing Contract Fees
The original 50(h) contracts for this term were executed under the previous Comptroller. BLA
successfully re-negotiated the contract fees to benefit from lower costs before renewing them
on July 1, 2012. As a result of BLA’s negotiations and the cooperation of our contractors, the
City will save at least $1 million in expenses through June 30, 2013.
FDNY Ambulance Services Collections The FDNY is responsible for collecting payments for ambulance services it provides. The
Comptroller’s Office continues to facilitate the collection of these payments, resulting in
collections of $430,126 since January 2012.

15
III. TORT CLAIM TRENDS (FYs 2011 - 2012)
In FY 2012, 26,268 new personal injury and property damage claims were filed; an 11 percent
decrease from the 29,460 filed in FY 2011.6
The overall cost to the City for personal injury and property damage claim payouts was $485.9
million in FY 2012. This represents a 12 percent decrease from the cost of tort claims in FY
2011 ($553.7 million).
Chart 2 Number of Tort Claims Filed by Category
Fiscal Year 2012
6 See appendix for a description of claim types.
0
2,000
4,000
6,000
8,000
10,000
12,000
14,000
16,000
18,000
20,000
Personal Injury Property Damage
18,074
8,194
16
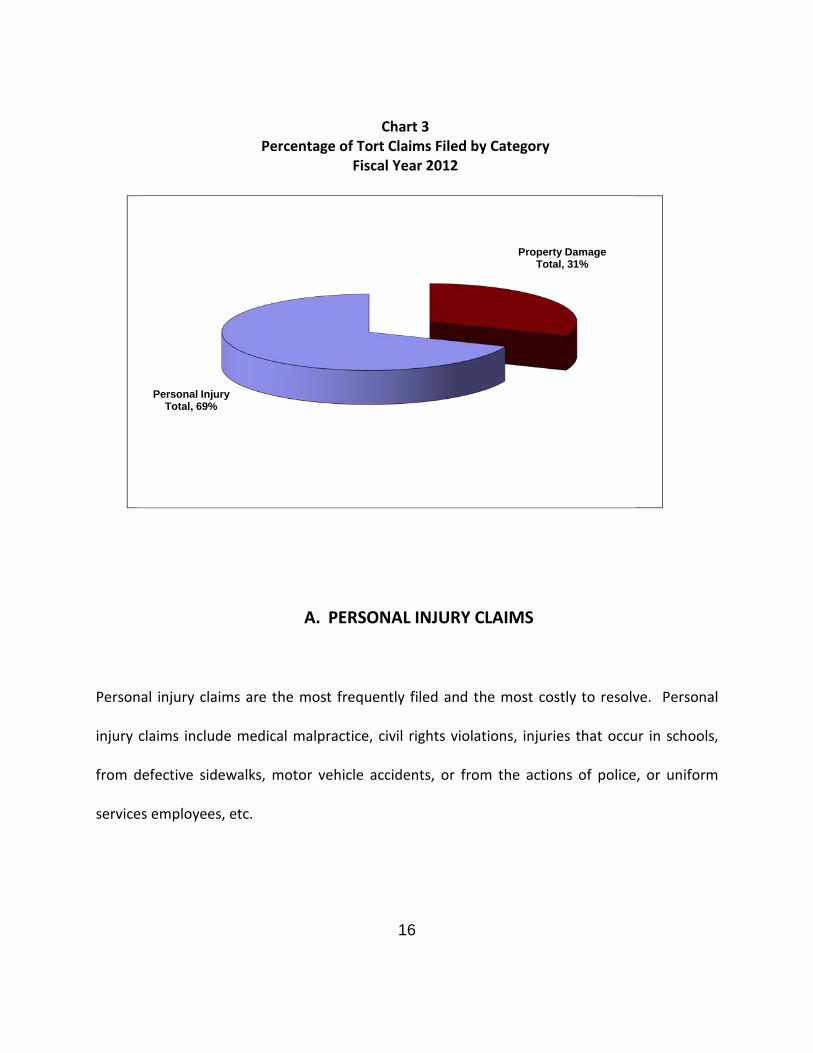
Chart 3
Percentage of Tort Claims Filed by Category Fiscal Year 2012
A. PERSONAL INJURY CLAIMS
Personal injury claims are the most frequently filed and the most costly to resolve. Personal
injury claims include medical malpractice, civil rights violations, injuries that occur in schools,
from defective sidewalks, motor vehicle accidents, or from the actions of police, or uniform
services employees, etc.
Property Damage Total, 31%
Personal Injury Total, 69%

17
• Personal injury claims accounted for $474.3 million, or 98 percent of the $485.9 million
paid for tort claims in FY 2012. During FY 2011, personal injury claims accounted for
$538.5 million, or 97 percent of the $553.7 million paid for tort claims.
• There were 79 personal injury payouts for $1 million or more in FY 2012. For those 79
cases, a total of $168 million was paid out. This amounted to 35 percent of the total
personal injury claim payout for FY 2012.
• In FY 2012, the costliest personal injury claims category was medical malpractice, which
cost the City $109.9 million. The second costliest category was motor vehicle claims, at
$69.9 million. Civil rights claim settlements and judgments were the third costliest, at
$67.9 million. The fourth costliest category was police action claims, at $64.4 million.
• The average settlement/judgment for all personal injury cases in FY 2012 was $63,880;
13 percent lower than the $73,393 average paid in FY 2011.

18
Chart 4 Percentage of Total Personal Injury Expenditures Recorded by Claim Type
FY 2012
Medical Malpractice24.9%
Civil Rights15.1%
Motor Vehicle12.4%
Police Action10.8%
Employee Uniformed Services
7.9%
School6.8%
Defective Sidewalk6.7%
Defective Roadway5.2%
City Property2.7%
Traffic Control Device2.3%
Admiralty1.7% Recreation
1.5%
Correction1.0%
Health Facility
1.0%

19
Chart 5 Percentage of Total Personal injury Expenditures Recorded by Claim Type
FY2011
Medical Malpractice23.0%
Civil Rights8.5%
Motor Vehicle14.3%
Police Action8.9%
Employee Uniformed Services
5.4%
School9.8%
Defective Sidewalk7.2%
Defective Roadway4.5%
City Property5.8%
Traffic Control Device0.6%
Admiralty8.8%
Recreation1.0%
Correction1.1% Health Facility
1.1%

20
Chart 6 Number of Claims Filed by Major Claim Type
FYs 2008 - 2012
0
1,000
2,000
3,000
4,000
5,000
6,000
2008 2009 2010 2011 2012Medical Malpractice 705 692 661 613 622Motor Vehicle 1,492 1,336 1,407 1,346 1,431Civil Rights 1,774 1,990 2,694 3,080 2,780Police Action 2,883 3,421 4,015 4,584 5,601Defective Sidewalk 2,392 2,578 2,301 2,533 2,033

21
1. MEDICAL MALPRACTICE CLAIMS
Medical malpractice claims are claims filed against the City or an HHC facility that allege
malpractice during treatment. Unlike all other City agencies, HHC assumes financial
responsibility for medical malpractice liabilities, up to a “capped limit” set by the Office of
Management and Budget.
• Although medical malpractice claims comprise a comparatively small percentage of
personal injury claims filed, they were the costliest type of personal injury claim during
each of the past 10 fiscal years. Medical malpractice claims accounted for 23 percent of
the total $474.3 million paid out for personal injury claims in FY 2012. In FY 2011,
medical malpractice claims were 24 percent of the total $538.5 million paid for personal
injury claims. It should be noted that medical malpractice claims often take between
five to ten years to resolve because of their complexity. As a result, the number of
claims filed is a better indicator of how HHC has addressed current hospital claim
activity than the dollar amount paid out in any one year.
• The number of new medical malpractice claims filed in FY 2012 was 622, one percent
higher than in FY 2011 when 613 claims were filed.

22
• Medical malpractice cases cost HHC $109.9 million in settlements/judgments for 258
cases in FY 2012. In FY 2011, they cost $131.8 million for 266 cases.
Chart 7 Medical Malpractice
FYs 2008 – 2012 Number of Claims Filed & Settlements (In Millions)
2008 2009 2010 2011 2012Claims Filed 705 692 661 613 622Settlements in Millions $152.7 $127.3 $130.9 $131.8 $109.9
$0.0
$20.0
$40.0
$60.0
$80.0
$100.0
$120.0
$140.0
$160.0
$180.0
560
580
600
620
640
660
680
700
720

23
• In FY 2012, 79 tort cases were each resolved for $1 million or more. Medical
malpractice settlements/judgments accounted for 34 of the 79 tort cases that settled
for $1 million or more.
• In FY 2012, the five HHC acute care hospitals for which the City paid the highest total
amount for medical malpractice claims were: Elmhurst Hospital ($15.6 million); Kings
County ($13.3 million); Jacobi Medical Center ($13.2 million); Queens Hospital Center
($12 million) and Lincoln Hospital ($10.6 million). (See Table 1).
• From FY 2011 to FY 2012, six hospitals saw an increase in the number of claims filed
against them, and five hospitals saw a decrease. (See Table 2). The six hospitals which
saw an increase in the number of medical malpractice claim filings were: Coney Island;
Elmhurst; Jacobi/Bronx Municipal; Kings County; Lincoln and Metropolitan. The five
hospitals that experienced a decrease in filings were: Bellevue; Harlem; North Central
Bronx; Queens Hospital and Woodhull.
• Overall, the number of medical malpractice claims filed against HHC’s acute care
hospitals increased by eight claims from FY 2011 to FY 2012. (See Table 2).

24
TABLE 1 HHC MEDICAL MALPRACTICE SETTLEMENT ACTIVITY BY ACUTE CARE HOSPITALS
Hospital
Number Resolved FY 2011
Amount Paid FY 2011 (millions)
Average Amount Per Claim FY 2011
Number Resolved FY 2012
Amount Paid FY 2012 (millions)
Average Amount Per Claim FY 2012
Bellevue 25 $5.8 $232,000 23 $ 8.0 $348,000
Coney Island 23 $9.4 $409,000 23 $ 8.0 $348,000
Elmhurst 28 $13.4 $479,000 28 $15.6 $557,000
Harlem 11 $5.7 $518,000 20 $6.1 $305,000
Jacobi / Bronx Municipal
30 $18.4 $613,000 32 $13.2 $413,000
Kings County 38 $23.2 $611,000 33 $13.3 $403,000
Lincoln 34 $24.9 $732,000 25 $10.6 $424,000
Metropolitan 8 $5.6 $700,000 8 $2.1 $263,000
North Central Bronx
10 $5.3 $530,000 10 $6.0 $600,000
Queens Hospital Center
19 $5.1 $268,000 14 $12.0 $857,000
Woodhull 25 $4.8 $192,000 23 $6.0 $261,000
Total 251 $121.6 Overall Average
$484,000 239 $100.9
Overall Average $422,000

25
TABLE 2 HHC MEDICAL MALPRACTICE CLAIM FILING ACTIVITY BY ACUTE CARE HOSPITALS
Hospital Claims Filed FY 2011 Claims Filed FY 2012 Increase/
(Decrease)
Bellevue 74 56 (18)
Coney Island 26 50 +24
Elmhurst 49 50 +1
Harlem 43 38 (5)
Jacobi / Bronx Municipal 61 75 +14
Kings County 76 79 +3
Lincoln 62 69 +7
Metropolitan 16 30 +14
North Central Bronx 28 16 (12)
Queens 42 31 (11)
Woodhull 52 43 (9)
Total 529 537 8

26
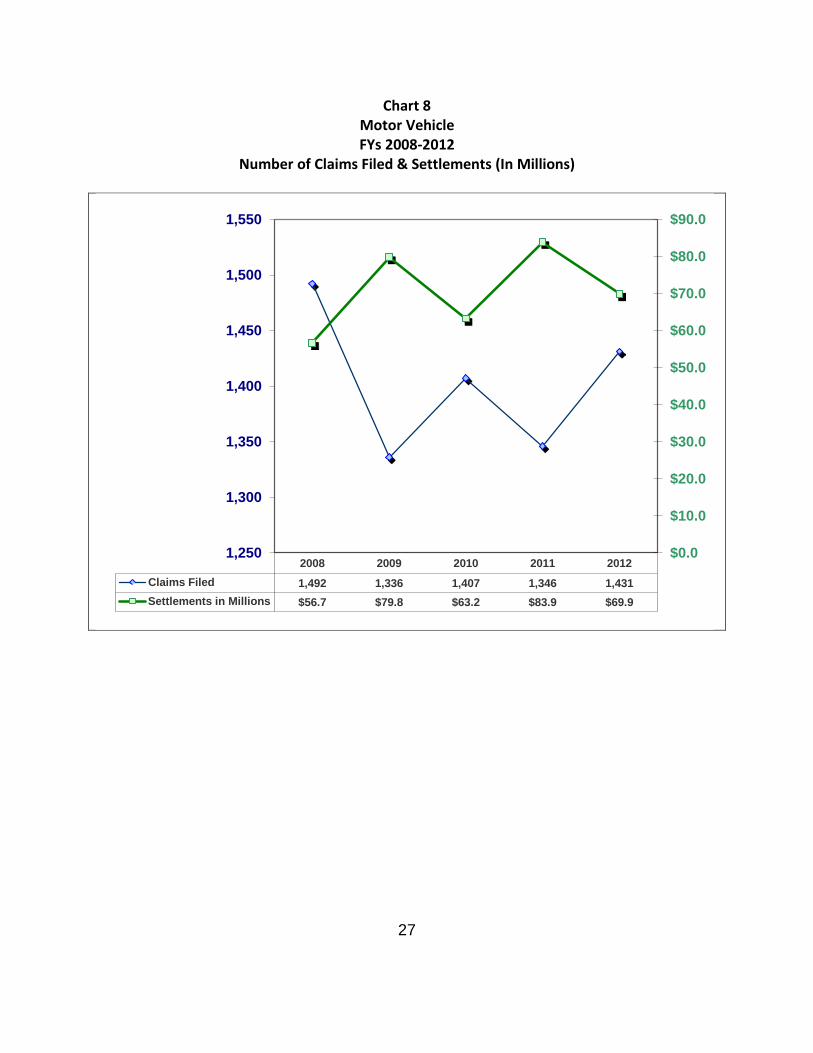
2. MOTOR VEHICLE ACCIDENT CLAIMS
Personal injury motor vehicle accident claims consist of accidents involving City owned vehicles.
• There were 1,431 new personal injury motor vehicle accident claims filed in FY
2012; six percent more than FY 2011, when 1,346 were filed.
• Personal injury motor vehicle accidents cost $69.9 million in FY 2012; a 17 percent
decrease from FY 2011, when the City paid $84.0 million in settlement/judgment
costs for this type of claim. Even so, motor vehicle accidents accounted for the
second highest claim type payout in FY 2012.
• Motor vehicle accident personal injury claims were the fifth most frequently filed
personal injury claim.
27
Chart 8 Motor Vehicle FYs 2008-2012
Number of Claims Filed & Settlements (In Millions)
2008 2009 2010 2011 2012Claims Filed 1,492 1,336 1,407 1,346 1,431Settlements in Millions $56.7 $79.8 $63.2 $83.9 $69.9
$0.0
$10.0
$20.0
$30.0
$40.0
$50.0
$60.0
$70.0
$80.0
$90.0
1,250
1,300
1,350
1,400
1,450
1,500
1,550

28
3. CIVIL RIGHTS CLAIMS
Civil rights claims generally arise from alleged statutory or constitutional violations such as
discrimination based on sex, race, religion, disability, sexual preference, or age. Claims in
this category also include alleged violations of civil rights by law enforcement. • There were 2,780 civil rights claims filed in FY2012. This is an 10 percent decrease
from FY 2011, when 3,080 claims were filed.
• The cost of civil rights claims was $67.9 million in FY 2012; a decrease of 19
percent from the $84.0 million paid out in FY 2011.
• Civil rights claims were the third most expensive and second most frequently filed
personal injury claim.

29
Chart 9 Civil Rights
FYs 2008 - 2012 Number of Claims Filed & Settlements (In Millions)
2008 2009 2010 2011 2012Claims Filed 1,774 1,990 2,694 3,080 2,780Settlements in Millions $42.2 $47.1 $78.7 $84.0 $67.9
$0.0
$10.0
$20.0
$30.0
$40.0
$50.0
$60.0
$70.0
$80.0
$90.0
0
500
1,000
1,500
2,000
2,500
3,000
3,500
30
4. POLICE ACTION CLAIMS
Police action claims result from alleged improper police conduct, such as false arrest or
imprisonment, shooting of a suspect, excessive force, assault, or failure to provide police
protection.
• There were 5,601 new police action claims filed in FY 2012. This represents an
increase of 22 percent from the 4,584 claims filed in FY 2011. This is the largest
number of new police action filings during the last five fiscal years.
• The cost of police action claims was $ 64.4 million in FY 2012; an increase of
seven percent from FY 2011, when we paid $ 60.2 million.
• Police action claims were the most frequent type of personal injury claim filed in
FY 2012 and accounted for the fourth highest claim payout in FY 2012.

31
Chart 10 Police Action
FYs 2008 - 2012 Number of Claims Filed & Settlements (In Millions)
2008 2009 2010 2011 2012Claims Filed 2,883 3,421 4,015 4,584 5,601Settlements in Millions $34.6 $48.4 $56.8 $60.2 $64.4
$0.0
$10.0
$20.0
$30.0
$40.0
$50.0
$60.0
$70.0
0
1,000
2,000
3,000
4,000
5,000
6,000

32
5. DEFECTIVE SIDEWALK CLAIMS
Sidewalk claims arise from alleged defects, such as cracked or uneven surfaces on public sidewalks. This
type of claim includes personal injuries for “trip, slip and fall” accidents resulting from such alleged
defects, as well as incidents on snow and ice-covered sidewalks. Legislation enacted in 2003 has limited
the City’s liability for injuries due to sidewalk defects. Local law 49 (NYC Administrative Code section 7-
210) generally limits the City’s liability to sidewalks adjoining City owned property or to owner-occupied
residential property having no more than three units.
• In FY 2012, there were 2,033 sidewalk claims filed against the City. This represents a 20
percent decrease from FY 2011, when 2,533 sidewalk claims were filed.
• The total cost of sidewalk claims in FY 2012 was $39.0 million, which is almost equal to
the $38.4 million paid in FY 2011.
• Defective sidewalk claims were the third most frequently filed personal injury claim and
fifth most expensive.

33
Chart 11 Sidewalk
FYs 2008 - 2012 Number of Claims Filed & Settlements (In Millions)
2008 2009 2010 2011 2012Claims Filed 2,392 2,578 2,301 2,533 2,033Settlements in Millions $54.9 $39.8 $35.0 $38.4 $39.0
$0.0
$10.0
$20.0
$30.0
$40.0
$50.0
$60.0
0
500
1,000
1,500
2,000
2,500
3,000

34
B. PROPERTY DAMAGE CLAIMS
Property damage claims consist of alleged damage to personal property or loss as a result of
the City’s negligence, including motor vehicle accidents, defective roadway claims, water main
breaks and sewer back-ups.
• The number of property damage claims filed in FY 2012 was 8,194; a 27 percent
decrease from the 11,245 filed in FY 2011.
• Property damage claims cost $ 11.6 million in FY2012; a 24 percent decrease from the
$15.2 million paid in FY 2011.
• Property damage claims comprised two percent of the total tort claims payout in FY
2012.
One property damage claim settled for $2 million in FY 2012. That claim involved alleged
damage to Con Edison underground steam, electric and gas facilities as a result of a water main
break on Fifth Avenue between 18th and 19th streets in 1990.

35
Chart 12 Property Damage
FYs 2008-2012 Number of Claims Filed & Settlements (In Millions)
2008 2009 2010 2011 2012Claims Filed 10,023 7,979 9,646 11,245 8,194Settlements in Millions $14.3 $9.6 $10.1 $15.2 $11.6
$0.0
$2.0
$4.0
$6.0
$8.0
$10.0
$12.0
$14.0
$16.0
0
2,000
4,000
6,000
8,000
10,000
12,000

36
IV. TORT CLAIM TRENDS BY AGENCY • The NYPD and DOT accounted for the highest number of tort claims filed in each of the
last five fiscal years. These two agencies, along with HHC, accounted for the highest cost
of claims in each of the last five fiscal years.
• In FY 2012, the agencies that experienced the highest number of claims filed were: the
NYPD, DOT, Department of Correction (“DOC”), DOE and DEP. Of these top five
agencies, both the DOT and the DOE saw a decrease in the number of claims filed:
6,422 in FY 2011 versus 4,716 in FY 2012 for the DOT; and 1,654 in FY 2011 versus 1,623
in FY 2012 for the DOE.
• NYPD experienced the highest increase in the number of filings: 8,941 in FY 2011 versus
9,570 in FY 2012.
• The NYPD, HHC and DOT accounted for the highest cost of settlements and judgments in
FY 2012.

37
Chart 13 New Claims Filed by Agencies with Highest Claim Costs in FY 2012
FYs 2008 – 2012
0
2,000
4,000
6,000
8,000
10,000
12,000
2008 2009 2010 2011 2012
Police Department 6,289 6,816 8,148 8,941 9,570Health And Hospitals Corp. 1,008 944 926 876 852Dept of Transportation 5,468 5,210 6,072 6,422 4,716Dept of Sanitation 1,691 1,815 2,205 3,552 1,352Dept. of Education 1,748 1,699 1,889 1,654 1,623

38
Chart 14 Dollar Value of Settlements by Agencies with Highest Claim Costs in FY 2012
FYs 2008-2012 (In Millions)
$0.0
$20.0
$40.0
$60.0
$80.0
$100.0
$120.0
$140.0
$160.0
$180.0
$200.0
2008 2009 2010 2011 2012
Police Department $105.0 $134.5 $135.3 $186.3 $151.9Health And Hospitals Corp. $153.3 $134.9 $135.2 $133.6 $109.6Dept of Transportation $107.8 $115.2 $75.7 $68.6 $68.9Dept of Sanitation $27.2 $32.9 $38.0 $28.9 $37.3Dept. of Education $53.2 $55.9 $37.0 $53.1 $28.2
39
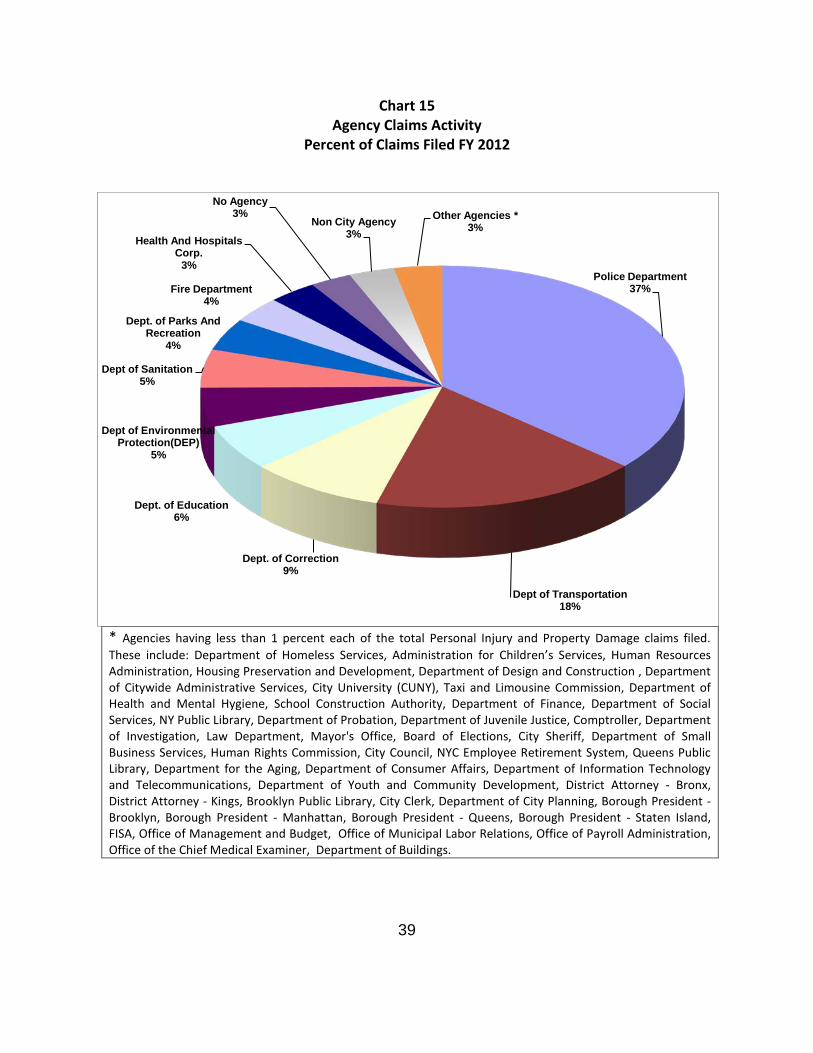
Chart 15 Agency Claims Activity
Percent of Claims Filed FY 2012
* Agencies having less than 1 percent each of the total Personal Injury and Property Damage claims filed. These include: Department of Homeless Services, Administration for Children’s Services, Human Resources Administration, Housing Preservation and Development, Department of Design and Construction , Department of Citywide Administrative Services, City University (CUNY), Taxi and Limousine Commission, Department of Health and Mental Hygiene, School Construction Authority, Department of Finance, Department of Social Services, NY Public Library, Department of Probation, Department of Juvenile Justice, Comptroller, Department of Investigation, Law Department, Mayor's Office, Board of Elections, City Sheriff, Department of Small Business Services, Human Rights Commission, City Council, NYC Employee Retirement System, Queens Public Library, Department for the Aging, Department of Consumer Affairs, Department of Information Technology and Telecommunications, Department of Youth and Community Development, District Attorney - Bronx, District Attorney - Kings, Brooklyn Public Library, City Clerk, Department of City Planning, Borough President - Brooklyn, Borough President - Manhattan, Borough President - Queens, Borough President - Staten Island, FISA, Office of Management and Budget, Office of Municipal Labor Relations, Office of Payroll Administration, Office of the Chief Medical Examiner, Department of Buildings.
Police Department37%
Dept of Transportation18%
Dept. of Correction9%
Dept. of Education6%
Dept of Environmental Protection(DEP)
5%
Dept of Sanitation5%
Dept. of Parks And Recreation
4%
Fire Department4%
Health And Hospitals Corp.
3%
No Agency 3%
Non City Agency3%
Other Agencies *3%

40
Three of the nine agencies accounting for the most tort claims filed in FY 2012 showed
increases in the number of personal injury and property damage claims filed: NYPD (seven
percent); DEP (79 percent); and the DOC (30 percent ).
Six of the nine agencies accounting for the most tort claims filed in FY 2012 showed
decreases in the number of personal injury and property damage claims filed: DOE (two
percent); DOT (27 percent); DSNY (62 percent); Parks (22 percent); FDNY (14 percent); and HHC
(three percent).

41
Chart 16 Agencies with Increase in Claim Filings
0
2,000
4,000
6,000
8,000
10,000
12,000
DEP DOC NYPD
FY 2011 FY 2012

42
Chart 17 Agencies with Decrease in Claim Filings
0
1,000
2,000
3,000
4,000
5,000
6,000
7,000
Dept. of Education
Fire Department Dept. of Parks And Recreation
Dept of Transportation
Dept of Sanitation
Health and Hospitals Corp.
FY 2011 FY 2012

43
A. THE FIVE AGENCIES WITH THE MOST COSTLY CLAIMS
The five agencies with the highest tort claim costs in FY 2012 were the NYPD, HHC, DOT, DSNY
and DOE.
1. NYPD
Tort claims against the NYPD include, but are not limited to, allegations of police misconduct,
civil rights violations, and personal injury and/or property damage arising out of motor vehicle
accidents involving police vehicles. In FY2012, there was an increase to 9,570 new claims filed,
compared with 8,941 filed in FY 2011. This represents the highest number of claims filed
against any agency in FY 2012. Claims filed against the NYPD constituted 36 percent of total
tort claim filings in FY 2012.
Cases against the NYPD cost the City $ 186.3 million in FY 2011. In FY 2012, they cost the City
$151.9 million; an 18 percent decrease. The NYPD accounted for 31 percent of total FY 2012
personal injury and property damage claims expenditures. Nonetheless, for both FY 2011 and
FY 2012, the NYPD’s tort claim annual expenditure was the highest of any agency.
An analysis of these numbers and the circumstances giving rise to them may provide a key as to
why some precincts seem to have less civil litigation related to their operation as opposed to
others that have a greater incidence of litigation as compared to crime activity.

44
Chart 18 Police Department
FYs 2008-2012 Number of Claims Filed & Settlements (In Millions)
2008 2009 2010 2011 2012Claims Filed 6,289 6,816 8,148 8,941 9,570Settlements in Millions $105.0 $134.5 $135.3 $186.3 $151.9
$0.0$20.0$40.0$60.0$80.0$100.0$120.0$140.0$160.0$180.0$200.0
0
2,000
4,000
6,000
8,000
10,000
12,000

45
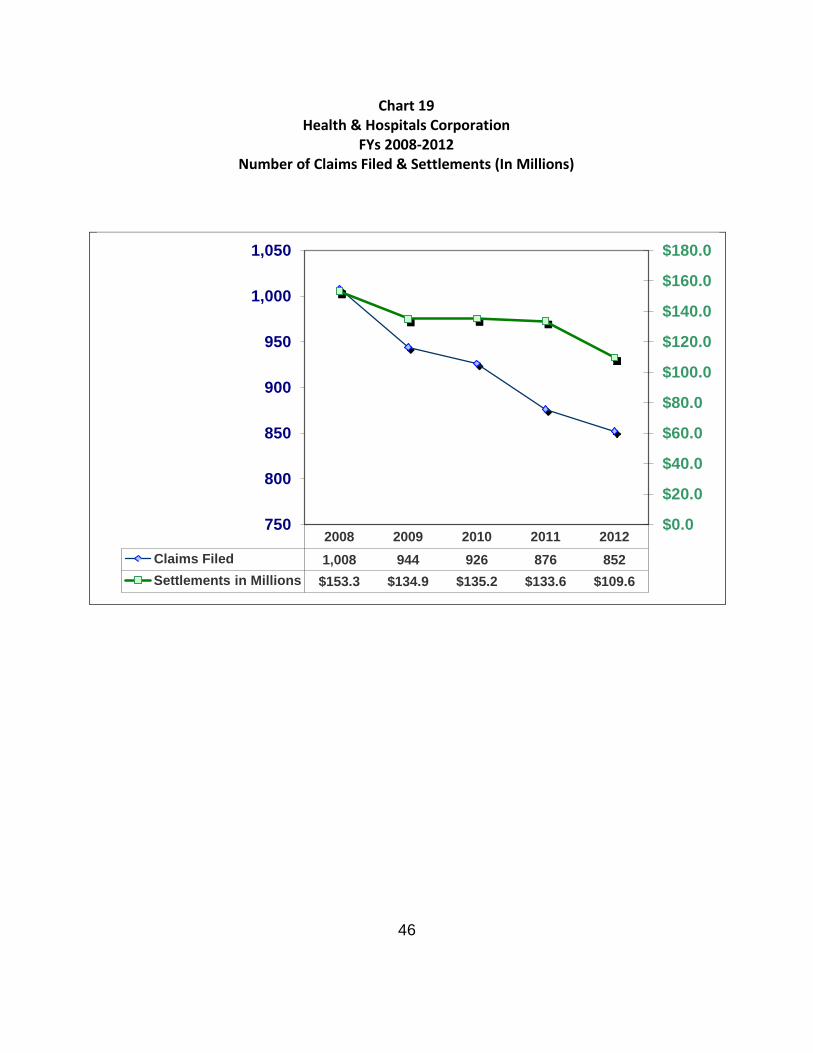
2. Health and Hospitals Corporation
Claims against HHC include claims for medical malpractice as well as claims for personal
injuries, or property damage sustained on hospital property.
• In FY 2012, 852 claims were filed against HHC, approximately 69 percent of which (592
claims) were for medical malpractice. In FY 2011 medical malpractice cases accounted
for 67 percent (588 claims) of the 876 claims filed against HHC.
• As noted earlier in this report, many medical malpractice claims are typically not
resolved for five to ten years from the date of filing due to their complex nature. Thus,
the number of claims filed is a better indicator of current hospital activity than the
amount paid out in any one year.
HHC cases constituted three percent of the total number of tort claims resolved in FY 2012, but
accounted for the second highest expenditure or 23 percent of the total amount paid for tort
claims in FY 2012.
46
Chart 19 Health & Hospitals Corporation
FYs 2008-2012 Number of Claims Filed & Settlements (In Millions)
2008 2009 2010 2011 2012Claims Filed 1,008 944 926 876 852Settlements in Millions $153.3 $134.9 $135.2 $133.6 $109.6
$0.0
$20.0
$40.0
$60.0
$80.0
$100.0
$120.0
$140.0
$160.0
$180.0
750
800
850
900
950
1,000
1,050

47
3. Department of Transportation
Claims against DOT consist primarily of personal injury claims due to sidewalk “trip and fall”
accidents; or personal injury or property damage due to defective roadways, defective traffic
signals, or motor vehicle accidents involving DOT vehicles. In FY 2012 the 4,716 claims filed
against DOT accounted for 18 percent of all new tort claims filed, representing a 27% percent
decrease from the 6,422 claims filed against DOT in FY 2011. The number of tort cases against
DOT that were resolved by settlement/judgment decreased from 1,973 in FY 2011 to 1,710 in
FY 2012.
In FY 2012, the total dollar amount paid for DOT cases was $68.9 million; less than a percent
increase from the $ 68.6 million paid in FY 2011. DOT cases accounted for 14 percent of the
total expenditure for personal injury and property damage claims in FY 2012.

48
Chart 20 Department of Transportation
FYs 2008 - 2012 Number of Claims Filed & Settlements (In Millions)
2008 2009 2010 2011 2012Claims Filed 5,468 5,210 6,072 6,422 4,716Settlements in Millions $107.8 $115.2 $75.7 $68.6 $68.9
$0.0
$20.0
$40.0
$60.0
$80.0
$100.0
$120.0
$140.0
0
1,000
2,000
3,000
4,000
5,000
6,000
7,000

49
4. Department of Sanitation (“DSNY”)
Claims filed against the DSNY are primarily comprised of alleged personal injury and property
damage caused by DSNY vehicles. The number of new claims filed against the DSNY decreased
from 3,552 in FY 2011 to 1,352 in FY 2012, a decrease of 62 percent. The large number of claim
filings in FY 2011 could be attributed to severe winter weather. New claim filings against the
DSNY constituted 14 percent of total personal injury and property damage claim filings in FY
2012.
In FY 2012, there were 1,302 DSNY tort claims resolved for $37.3 million. DSNY claims
accounted for eight percent of the total tort claims expenditure. In FY 2011, 2,103 cases were
resolved for $ 28.9 million.

50
Chart 21
Sanitation Department FYs 2008 – 2012
Number of Claims Filed & Settlements (In Millions)
2008 2009 2010 2011 2012Claims Filed 1,691 1,815 2,205 3,552 1,352Settlements in Millions $27.2 $32.9 $38.0 $28.9 $37.3
$0.0
$5.0
$10.0
$15.0
$20.0
$25.0
$30.0
$35.0
$40.0
0
500
1,000
1,500
2,000
2,500
3,000
3,500
4,000

51
5. Department of Education
Claims against the DOE include personal injury claims involving alleged lack of supervision,
defective maintenance, and motor vehicle accidents involving DOE vehicles.
• The number of new personal injury and property damage claims filed against the DOE
decreased by one percent from 1,654 in FY 2011 to 1,623 in FY 2012. Tort claim filings
against the DOE accounted for six percent of the total tort claims filed in FY 2012.
• The total tort expenditure for DOE cases decreased by 47 percent from $ 53.1 million in
FY 2011 to $ 28.2 million in FY 2012.
• DOE claims accounted for six percent of the total claim expenditure for personal injury
and property damage claims in FY 2012.

52
Chart 22 Department of Education
FYs 2008 – 2012 Number of Claims Filed & Settlements (In Millions)
2008 2009 2010 2011 2012 Claims Filed 1,748 1,699 1,889 1,654 1,623Settlements in Millions $53.2 $55.9 $37.0 $53.1 $28.2
$0.0
$10.0
$20.0
$30.0
$40.0
$50.0
$60.0
1,450
1,500
1,550
1,600
1,650
1,700
1,750
1,800
1,850
1,900
1,950

53
V. TORT CLAIM TRENDS BY BOROUGH 7 For FY 2012, the borough with the largest number of personal injury claims was the Bronx
(5,648). The borough with the largest number of property damage claims was Brooklyn (1,979).
Number of Claims Filed By Borough Fiscal Year 2012
Borough
Personal Injury (PI) Claims
Property Damage (PD) Claims
Brooklyn
4,608 1,979
Bronx
5,648 1,368
Manhattan 3,452 1,381
Queens
2,396 1,951
Staten Island
732 739
7 Personal injury (PI) and property damage (PD) claim patterns were analyzed by borough, based on the location of each incident. Claim-resolved information must be carefully considered because Staten Island has no City hospitals and thus no relatively expensive medical malpractice claim payouts.

54
Number of Claims Resolved and Amounts Paid by Borough Fiscal Year 2012
As the following chart illustrates, the Bronx had the most personal injury claims filed per
100,000 residents with 408. Queens had the least (107). Staten Island had the highest ratio of
property damage claims filed (158), Brooklyn had the least (79).8
8 According to the United States Census Bureau, as of July 1, 2010, the total population for New York City was 8,175,133 residents. In order of population the boroughs are: Brooklyn ( 2,504,700 or 30.6% of the total population); Queens ( 2,230,722 or 27.3% of the total population); Manhattan ( 1,585,873 or 19.4% of the total population); Bronx ( 1,385,108 or 17% of the total population); and, Staten Island (468,730 or 5.7% of the total population). Statistics do not take into account commuters and tourists.
Borough
Number of PI Claims
Resolved
Amount Paid for PI Claims (millions)
Number of PD Claims Resolved
Amount Paid for PD Claims (millions)
Total PI and PD Claims Resolved
Total PI and PD Claim Payouts (millions)
Brooklyn 2,213
$115.0
811
$2.6
3,024
$117.6
Bronx
2,145
$129.8
391
$1.0
2,536
$130.8
Manhattan
1,405
$116.2
598
$4.1
2,003
$120.3
Queens
1,002
$67.9
796
$2.3
1,798
$70.2
Staten Island 410
$19.1
282
$728K
692
$19.8

55
Chart 23 Claims Filed by Borough Per 100,000 Residents
0
50
100
150
200
250
300
350
400
450
Manhattan Bronx Brooklyn Staten Island Queens
218
408
184156
10787 99
79
158
87
Personal Injury Property Damage

56
In FY 2012, the total highest aggregate personal injury and property damage claim costs were
paid for claims that occurred in the Bronx.
• Claim settlements and judgments for personal injury and property damage cost each
City resident approximately $59 in FY 2012.
• In FY 2012, the borough with claims representing the highest claim expenses per
resident was the Bronx. The borough with the lowest claim expenses per resident was
Staten Island.

57
Chart 24 Total 2012 Claims Expenses for both Personal
Injury and Property Damage by Borough Per Resident
$-
$20.00
$40.00
$60.00
$80.00
$100.00
Bronx Manhattan Brooklyn Staten Island
Queens
$94.43$75.86
$46.95 $42.24$31.47

58
VI. LAW CLAIMS (Non-Tort)
Law claims arise primarily from disputes concerning contracts between City agencies and their
contractors. Law claims include, among others, breach of contract claims, alternative dispute
resolution claims, equitable claims, refund claims, employee salary claims, claims involving DOE
Special Education matters, sidewalk assessment claims and New York City Department of
Health and Mental Hygiene property cleanup claims.
Chart 25 Law
FYs 2008 – 2012 Number of Claims Filed & Settlements (In Millions)
2008 2009 2010 2011 2012Claims Filed 2,171 1,965 2,160 2,926 3,785 Settlements in Millions $248.9 $94.5 $165.1 $135.9 $250.7
$0.0
$50.0
$100.0
$150.0
$200.0
$250.0
$300.0
0500
1,0001,5002,0002,5003,0003,5004,000

59
The increase in FY 2008 payments was primarily due to a $160 million settlement of a lawsuit
brought by the United Federation of Teachers regarding the way in which certain teachers’
pension benefits were calculated.
A. Overall Law Claim Trends
• For FY 2012, there was a 29.35 percent increase in the overall number of Law claims
filed as compared to FY 2011.
In FY 2012, 3,785 Law claims were processed as compared to 2,926 in FY 2011. The
increase is primarily due to payment of a class action brought by street vendors whose
Environmental Control Board (“ECB”) fines were improperly calculated by ECB. In
addition, there was a 15 percent increase in Special Education related claims filed, or
referred, by the DOE. In FY 2012, there were 2,438 Special Education related claims as
compared to 2,120 claims in FY 2011.
• For FY 2012, there was an 84.5 percent increase in Law claim settlements and/or
judgments as compared to FY 2011.
For FY 2012, the total amount of settlements and judgments paid was $250,679,649 as
compared to $135,888,872 in FY 2011. The primary reasons for the increase is
attributed to a $70 million payment to the Federal government for allegedly improper

60
Medicaid billings made by HRA for personal care services, an 18 percent increase in
Special Education related payments and a 143.5 percent increase in Contract claim
payments.
Law Claims Paid
FY 2011 and FY 2012
• Excluding the Special Education related payments, which were made by the DOE, and
the $70 million paid to the Federal government (see “OTHER” claim type), total Law
claim payments increased 79 percent from $33,506,234 in FY 2011 to $59,997,441 in FY
2012.
0
20,000,000
40,000,000
60,000,000
80,000,000
100,000,000
120,000,000
140,000,000
FY 2011
FY 2012
61
• Contract Disputes are separate from Breach of Contract claims because the disputes
typically involve issues, such as, the amounts to be paid for extra work, quality of the
vendor’s work and the scope of the contract documents. Six of the 39 FY 2012 Contract
Dispute settlements involved an interpretation of the contract documents in favor of
the contractor. The amounts of the subsequent costs involved are not reflected as claim
payments.
• There were 28 Breach of Contract claims settled for $21.8 million. Of that amount, $14.7
million is attributable to the settlement of contract delay claims, $4.3 million was paid in
the settlement of lease disputes and the balance involved a variety of smaller contract
actions.

62
APPENDICES
APPENDIX A Description of Claim Types
Claims that are filed against the City are classified into categories to facilitate analysis by the
Comptroller's Office and other interested parties.
Under the present classification structure, claims are categorized initially by the City agency
involved and by general category of claim: personal injury, property damage, and law. Each
general category has subtypes, and it is at this level that claims are analyzed. For example,
personal injury claims may include "slip and fall" accidents on sidewalks (sidewalk claims), or
injuries that occurred in school (school claims), or in a City park (DPR claims).
Claim classifications have also been designed to ensure that descriptive information about a
claim can be captured. Thus, four additional sub-classifications are used for every claim so that,
by reviewing the codes, one can obtain a clearer picture of the specifics of the claim. These
four additional sub-classifications are:
1. Claimant. Describes the claimant and, if appropriate, the activity the claimant was involved
in, for example: "bicyclist," "jogger," "pedestrian," "driver of vehicle," "passenger," "vendor,"
etc.

63
2. Location. Describes the location of an accident, for example: "boardwalk,” "sidewalk,”
"driveway,” "swimming pool,” "hospital,” "school,” etc.
3. Accident Agent. Describes the catalyst for the accident, for example: "building
construction,” "debris/glass,” "improper lighting,” "City vehicle,” "defective maintenance,”
"improper supervision,” etc.
4. Interaction. Describes the physical action that the claimant experienced, for example:
"collision/struck by,” "slip/fall,” "assault,” etc.
A typical personal injury claim involving a "slip and fall" accident on a cracked defective
sidewalk would be classified as follows:
Claim type: Defective Sidewalk
Claimant: Pedestrian
Location: Sidewalk
Accident Agent: Crack
Interaction: Slip/fall

64
The present coding system classifies claim types as follows:
I. Personal Injury Claims A. Admiralty Admiralty claims include claims by passengers or other persons injured on the water, either on
City vessels or ferries, gangplanks, or piers.
B. Defective Roadway
Defective Roadway claims include pedestrians, motorists, or others injured as a result of
defects in a street or roadway, such as potholes, cracked, wet or snow-covered roadways,
sewer gratings, raised, missing or exploding manhole covers, or roadways under repair.
C. Defective Sidewalk
Defective Sidewalk claims include pedestrians or others injured because of a defective sidewalk
such as, broken or uneven sidewalks, broken curbstones, protruding bolts, grates, or parking
meter or traffic sign stubs, defective boardwalks, and snow and ice claims.
D. Traffic Control Device
Traffic control device claims are filed by pedestrians or motorists injured in accidents because
of malfunctioning traffic signals, defective or missing traffic devices, or downed or missing
traffic signs.

65
E. Police Action
Police action claims result from alleged improper police action, such as false arrest or
imprisonment, shooting of a suspect, excessive force or assault, or failure to provide police
protection.
F. School
School claims are those filed against the DOE by students, teachers, other staff, and parents or
other visitors to DOE facilities.
G. Medical Malpractice
This category of claim derives from medical malpractice in the diagnosis, treatment, or care at a
City or HHC facility or EMS treatment.
H. Health Facility/Non-Medical Incidents
These claims involve non-medical acts involving a City or HHC facility or employee, such as
injuries sustained by visitors due to wet floors, assaults of patients or visitors, or abuse or
assaults of senior citizens by home care workers.

66
I. Motor Vehicle Accident
Motor vehicle accident claims involve accidents with City vehicles. Included in this category are
cases of pedestrians, motorists, or passengers of other vehicles being struck by a City vehicle,
and operators or passengers of City vehicles involved in a collision.
J. Employee Uniformed Services
Included in this category of claims are those filed by City employees of the uniformed services,
such as NYPD, FDNY, DOE teachers, or DSNY employees who are not subject to Workers'
Compensation laws and may sue the City for on-the-job personal injuries.
K. Recreation
Recreation claims include claims by persons allegedly injured because of defective equipment
or negligent maintenance of property under the jurisdiction of the Department of Parks and
Recreation. This includes incidents that occur in Parks Department buildings or on playground
equipment and grounds, and incidents involving falling trees or limbs, whether on a street,
sidewalk, or in a park.
L. City Property
This category of claims includes those by tenants or others injured by a defect in or the
negligent maintenance of City owned land or a City-owned or City administered building or
facility.

67
M. Catastrophe
This claim type includes claims filed as a result of natural disasters, such as floods or
earthquakes, environmental accidents, such as leaking gas tanks, power failures, such as
blackouts, and civil disturbances, such as riots.
N. Civil Rights
Civil rights claims involve alleged Federal, State or City statutory or constitutional violations,
such as discrimination based on sex, race, religion, disability, sexual preference, or age.
O. Correction Facility
Corrections claims involve claims by inmates or employees of City correction institutions or
facilities who were allegedly injured by the actions of City employees or inmates.

68
II. Property Damage Claims
A. Admiralty
These claims include property damaged on the water, either on City vessels, ferries,
gangplanks, or piers.
B. Sewer Overflow
Sewer overflow claims include flooding or water damage to real or personal property caused by
inadequate sewer repairs or clogged/obstructed City sewers.
C. Water Main Break
Water main break claims include water damage to real or personal property as a result of
leaking or broken water mains or fire hydrants.
D. Defective Roadway
This claim type includes claims for vehicles that are damaged by defective roadways, or from
objects that have fallen from bridges or overpasses. Also included are claims made by
pedestrians who sustained damage to personal property as a result of a fall on a defective
roadway.

69
E. Defective Sidewalk
Defective sidewalk claims are made by individuals who sustain damage to personal property as
a result of defective sidewalks.
F. Traffic Device
This claim type includes vehicles or other personal property damaged in accidents allegedly
caused by defective, obstructed, or missing traffic lights or stop signs.
G. Police Action
Police action claims relate to vehicles or other personal property that is stolen, damaged, sold,
or destroyed while in police custody.
H. School
School claims include lost, stolen, or damaged personal property that belongs to students,
teachers, or DOE staff while on DOE property.
I. Health Facility
These claims include the personal property of patients or others that has been lost, stolen, or
damaged while on hospital property.

70
J. Motor Vehicle Accidents
Motor vehicle accident claims include vehicles or other personal property that is damaged in
accidents with City vehicles. Included are parked cars hit by City vehicles and vehicles damaged
while being towed.
K. Uniformed Services/City Employees
This claim type includes claims for personal property that is lost, damaged, or stolen from City
employees while at work.
L. Recreation
Claims in this category include personal property that is lost, stolen, or damaged in the City's
parks. Damage occurs from vandalism, poor maintenance, or unmarked fresh paint, and from
accidents involving grounds and equipment.
M. Public Buildings and Property
This claim type includes claims for personal property damaged or stolen as a result of a defect
or negligence in maintaining City owned land or a City owned building or facility.

71
N. Catastrophe
These claims include property damage caused by the City's response to a natural disaster (such
as a flood or earthquake), an environmental accident (such as a leaking gas tank), power
failures (blackouts), or civil disturbances (such as riots).
O. Damage City Action/Personnel
These claims include property damaged by City vehicles or equipment, such as a City vehicle
damaging a homeowner's fence or other property, or damage caused by a traffic light falling
onto a vehicle.
P. Correction Facility
Correction facility claims include claims by prisoners, inmates, or detainees whose personal
property is lost, stolen, or damaged while in a correction institution.
72
III. Law Claims
A. Contract/Lease
Claims in this category arise from disputes between the City and private contractors
(construction or non-construction) and in instances where the City is a lessee or lessor of
property.
B. Alternative Dispute Resolution
Contracts between the City and vendors solicited after September 1990 have included an
Alternative Dispute Resolution (ADR) provision designed to provide a speedy alternative to
litigation. When the disputes arise, contractors may attempt to resolve them directly with the
agency involved. If no agreement is reached, a claim can then be filed with the Comptroller's
Office. If the claim is denied, the contractor may appeal to the Contract Dispute Resolution
Board.
C. Illegal but Equitable
These claims typically allege that work was performed at the direction of the City and/or the
City accepted services, but the appropriate contract and other approval were not obtained.
These claims, though invalid at law, may be recognized as equitable and proper if it can be
determined that the City received a benefit and that the public interest would be served by
payment or compromise.

73
D. Employment
Employment claims are those by prospective, current, or former City employees alleging
employment related disputes. These disputes include claims for discrimination, out-of-title
work, pay differential, annual leave, and suspension.
E. Refund
Refund claims include claims by private individuals seeking refunds for alleged overpayments
and unjust fines.
F. Change of Grade
These claims are made by commercial or residential property owners or lessees. The claims
arise from changes in grade to a sidewalk that impair access to property and drainage. Claims
typically are made for loss of business due to walkway or driveway repairs.

74
APPENDIX B Legal Background
I. Municipal Liability
The decision of the New York Court of Appeals in Bernadine v. New York City, issued in 1945,
exposed the City for the first time to liability for torts committed by the City's officers, agents,
and employees.9
In Bernadine, the Court held that "the civil divisions of the State are answerable equally with
individuals and private corporations for wrongs of officers and employees -- even if no separate
statute sanctions that enlarged liability in a given instance.10 The Court, in effect, abolished the
doctrine of sovereign immunity for municipalities, but did not provide municipalities any of the
protections accorded to the State by the Court of Claims Act.11 In particular, claimants seeking
to recover from municipalities for their agents' negligent and wrongful acts are entitled to a
jury trial.
Municipal liability is also governed by local law. Under their home rule authority, municipalities
can limit liability to some extent through limitations on the right to sue. An example is New
9 Bernadine v. City of New York, 294 N.Y. 361 (1945) 10 Id. p. 365. 11 Court of Claims Act of 1920, L. 1920, ch. 922, and L. 1929, ch. 467, § 1.

75
York City's prior notice law, enacted in 1979 in an effort to limit the City's liability in "slip and
fall" cases on City sidewalks and streets.
II. Claims Process
To commence an action against the City, a claimant typically must first notify the City by filing a
Notice of Claim with the Office of the Comptroller.12 In some instances, however, the claim
must be filed with the agency involved. In most instances, the notice of a personal injury or
property damage claim must be filed within 90 days of an alleged injury or wrong.13 The City
Charter grants the Comptroller the power to settle and adjust all claims in favor of or against
the City.14
The Comptroller has the power to investigate claims, evaluate liability and damages, and reach
a settlement prior to litigation.15 If the Comptroller denies liability or is unable to arrive at a
settlement with a claimant, the claimant may commence suit. Actions regarding tort claims
must generally be filed within a year and 90 days after the loss.16 The City's Law Department,
12 General Municipal Law, Article § 50-e. Effective September 2010 claimants can file personal injury and property damage claims electronically through the Comptroller’s website (http://www.comptroller.nyc.gov/bureaus/bla/). 13 General Municipal Law, Article 4, § 50-e. One notable exception is a claim under 42 U.S.C. § 1983, the Federal Civil Rights Act; a § 1983 action can be filed directly in court without filing a notice of claim.
14 City Charter, Chapter 5, Section 93 (i)
15 The Comptroller's Bureau of Law and Adjustment (“BLA”) investigates claims filed against the City; obtains and evaluates accident reports and other documents provided by agencies; conducts field visits, interviews witnesses, and conducts hearings; evaluates liability and damages; and attempts to settle appropriate cases. The Office’s Bureau of Engineering investigates construction contract claims and negotiates claim settlements, together with BLA and, if litigation is pending, the Law Department. 16 General Municipal Law, Article 4, § 50-i. A significant exception to this requirement is in the area of medical malpractice, in particular, claims for injuries to newborn infants.

76
under the direction of the Corporation Counsel, defends the City in most actions. No litigation
can be settled without the approval of the Comptroller.17
17 City Charter, Chapter 17, Section 394 (c).

77
APPENDIX C Top Ten Tort Claims Adjudicated in FY 2012
1. A class action alleging that approximately 20,000 people were arrested for loitering. The
arrests were unconstitutional. Settlement: $15 million.
2. In 2008, claimant, a 32 year old woman alleged that the Emergency Medical Service
failed to evaluate her medical condition properly resulting in the amputation of both
arms below the elbow and both legs below the knees. Settlement: $8.5 million.
3. In 1993, claimant alleged false arrest and wrongful incarceration for 20 years as a result
of the actions of a detective. Settlement: $7.5 million.
4. In 2008, claimant was driving a tractor trailer when he was involved in a motor vehicle
accident with a fire truck that was on an emergency run. Claimant sustained severe
injuries requiring constant care and supervision. Settlement: $5 million.
5. In 2009, claimant, 42 years old, alleged the failure to diagnose and treat a brain
aneurysm/blood clot resulted in brain damage and coma. Settlement: $4.9 million.
6. In 2007, claimant was struck by a large tree limb while sitting on a bench at Stuyvesant
Park. She sustained severe multiple injuries. Settlement: $4 million.

78
7. In 2008, claimant, a motorcyclist was struck by a private vehicle that made an illegal left
turn in front of him. Claimant alleged that a defect in the design of the roadway as well
as missing signage contributed to the accident. He sustained numerous fractures, facial
injuries, cervical problems resulting in a flaccid arm and other severe injuries.
Settlement: $4 million.
8. In 2005, claimant fell off his bicycle allegedly due to a defective pathway in Riverside
Park. He sustained cervical injuries resulting in quadriplegia. He is confined to a
wheelchair. Settlement: $3 million.
9. In 2009, claimant, a 39 year old sanitation worker sustained a crush injury to his foot
after a collection truck ran over it. He underwent numerous surgeries. Claimant also
sustained injury to his lumbar spine. Settlement: $3 million.
10. In 2010, claimant, a 9 year old, was struck by an FDNY vehicle. She sustained a degloving
injury and multiple traumatic injuries which resulted in numerous surgeries, a leg length
discrepancy, permanent disfiguring scars and life-long orthopedic disability. Settlement:
$3 million.

79
APPENDIX D FY 2012 Chart Index
CHART TITLE PAGE 1 Pre-Litigation Personal injury Settlements 12 2 Number of Tort Claims Filed by Category Fiscal Year 2012 15 3 Percentage of Tort Claims Filed By Category Fiscal Year 2012 16 4 Percentage of Total PI Expenditures Recorded by Claim Type 2012 18 5 Percentage of Total PI Expenditures Recorded by Claim Type 2011 19 6 Number of Claims Filed by Major Claim Type FYs 2008 - 2012 20
7 Medical Malpractice FYs 2008– 2012 Number of Claims Filed & Settlements (In Millions) 22
8 Motor Vehicle FYs 2008 – 2012 Number of Claims Filed & Settlements (In Millions) 27
9 Civil Rights FYs 2008 – 2012 Number of Claims Filed & Settlement (In Millions) 29
10 Police Action FYs 2008 – 2012 Number of Claims Filed & Settlements (In Millions) 31
11 Sidewalk Claims FYs 2008 – 2012 Number of Claims Filed & Settlements (In Millions) 33
12 Property Damage FYs 2008 – 2012 Number of Claims Filed & Settlements (In Millions) 35
13 New Claims Filed By Agencies with Highest Claim Costs in FY 2012 37
14 Dollar Value of Settlements by Agencies with Highest Claim Costs in FY 2012 FYs 2008 - 2012 (In Millions) 38
15 Agency Claims Activity Percent of Claims Filed FY 2012 39 16 Agencies with Increase in Claims Filings 41 17 Agencies with Decrease in Claims Filings 42
18 Police Department FYs 2008 – 2012 Number of Claims Filed & Settlements (In Millions) 44
19 Health & Hospitals Corporation FYs 2008 – 2012 Number of Claims Filed & Settlements (In Millions) 46
20 Department of Transportation FYs 2008 - 2012 Number of Claims Filed & Settlements (In Millions) 48
21 Sanitation Department FYs 2008 – 2012 Number of Claims Filed & Settlements (In Millions) 50
22 Department of Education FYs 2008 – 2012 Number of Claims Filed & Settlements (in Millions) 52
23 Claims Filed by Borough Per 100,000 Residents 55 24 Total 2012 Claims Expenses for both PI & PD by Borough Per Resident 57 25 Law FYs 2008 – 2012 Number of Claims Filed & Settlements (In Millions) 58

80
APPENDIX E Detailed Tables
1. Table 1 – Number of Tort Claims Filed by Claim Type Fiscal Years 2008 - 2012 2. Table 2 – Number of Tort Claims Filed by Agency Fiscal Years 2008 - 2012 3. Table 3 – Dollar Amount of Tort Settlements & Judgments by Claim Type 4. Table 4 - Dollar Amount of Agency Tort Settlements & Judgments by Agency Fiscal Years
2008 - 2012 5. Table 5 – Number of Tort Settlements & Judgments by Claim Type Fiscal Years 2008 -
2012 6. Table 6 - Number of Tort Settlements & Judgments by Agency Fiscal Years 2008 - 2012

81
Table 1 Number of Claims Filed by Claim Type
Fiscal Years 2008-2012
Personal Injury 2008 2009 2010 2011 2012 Admiralty 29 28 55 47 25 Catastrophe 69 0 0 0 0 City Property 839 643 9,524 1,134 573 Civil Rights 1,774 1,990 2,694 3,080 2,780 Correction Facility 1,078 1,055 1,218 1,213 1,622 Defective Roadway 1,125 1,170 1,075 1,157 967 Defective Sidewalk 2,392 2,578 2,301 2,533 2,033 Health Facility 97 119 104 121 108 Medical Malpractice 705 692 661 613 622 Motor Vehicle 1,492 1,336 1,407 1,346 1,431 Recreation 239 265 228 277 290 Police Action 2,883 3,421 4,015 4,584 5,601 School 1,209 1,193 1,064 1,115 1,103 Traffic Control Device 119 106 117 74 109 Employee Uniformed Services 167 146 165 166 153 Unknown Claim Type 541 607 591 755 657
Total 14,758 15,349 25,219 18,215 18,074
Property Damage
Admiralty 2 2 2 0 2 Catastrophe 298 17 0 4 0 City Property 241 153 136 138 95 Correction Facility 275 299 446 319 401 Damage by City Personnel 1,185 1,196 1,326 1,753 1,355 Defective Roadway 1,524 1,284 2,345 2,827 1,222 Defective Sidewalk 14 20 19 14 22 Health Facility 161 132 129 108 97 Motor Vehicle 3,839 3,735 4,124 4,873 3,305 Police Action 396 311 318 387 387 Recreation 15 11 6 5 8 School 202 194 183 191 149 Sewer Overflow 1,514 197 193 214 680 Traffic Control Device 96 72 73 40 50 Employee Uniformed Services 0 66 2 0 0 Unknown Claim Type 94 131 144 216 180 Water Main 167 159 200 156 241
Total 10,023 7,979 9,646 11,245 8,194
Grand Total 24,781 23,328 34,865 29,460 26,268

82
Table 2 Number of Claims Filed by Agency
Fiscal Years 2008-2012
Agency 2008 2009 2010 2011 2012 Administration for Children's Services 114 136 116 94 127 Board of Elections 2 3 2 5 4 Brooklyn Public Library 1 4 1 0 1 Boro President-Brooklyn 1 1 0 1 0 Boro President-Manhattan 1 1 0 0 0 Boro President-Queens 0 1 0 0 0 Boro President-Staten Island 0 0 0 3 0 City Clerk 0 0 2 0 1 City Council 3 0 1 1 3 City Planning Commission 0 1 0 1 1 City Register 0 1 0 0 0 City Sheriff 5 6 8 5 4 City University (CUNY) 33 38 26 24 35 Comptroller 1 - 1 1 6 Department for the Aging 2 5 3 4 2 Department of Buildings 232 152 964 75 83 Department of Citywide Admin. Svcs. 41 50 90 48 49 Department of Consumer Affairs 2 6 12 1 2 Department of Correction 1,634 1,616 1,984 1,830 2,374 Department of Cultural Affairs 5 5 5 2 0 Department of Design and Construction 29 31 22 33 60 Department of Education 1,748 1,699 1,889 1,654 1,623 Department of Environmental Protection 2,335 749 723 769 1,374 Department of Finance 30 6 5 6 14 Department of Health 21 33 30 30 24 Department of Homeless Services 103 120 142 176 153 Department of Info. Technology and Telecom. 3 3 5 5 2 Department of Investigations 1 2 4 3 6 Department Juvenile Justice 12 18 15 14 10 Department Parks and Recreation 1,037 1,033 1,124 1,416 1,111 Department of Probation 13 13 14 11 11 Department of Sanitation 1,691 1,815 2,205 3,552 1,352 Department of Small Business Services 22 16 20 0 4 Department of Social Services 8 10 13 5 12 Department of Transportation 5,468 5,210 6,072 6,422 4,716 Department of Youth and Comm Development 5 2 3 1 2 District Attorney - Bronx 4 6 5 6 2 District Attorney - Kings 16 7 7 9 2 District Attorney - New York 13 5 7 9 0 District Attorney - Queens 10 4 8 16 0 District Attorney - Staten Island 1 0 1 1 0 Fire Department 974 1,013 940 1,064 914 FISA 1 0 0 0 0 Health and Hospitals Corporation 1,008 944 926 876 852 Housing Preservation and Development 84 77 87 73 70 Human Resources Administration 54 52 59 64 76 Human Rights Commission 0 0 0 0 4 Law Department 4 5 7 4 5
83
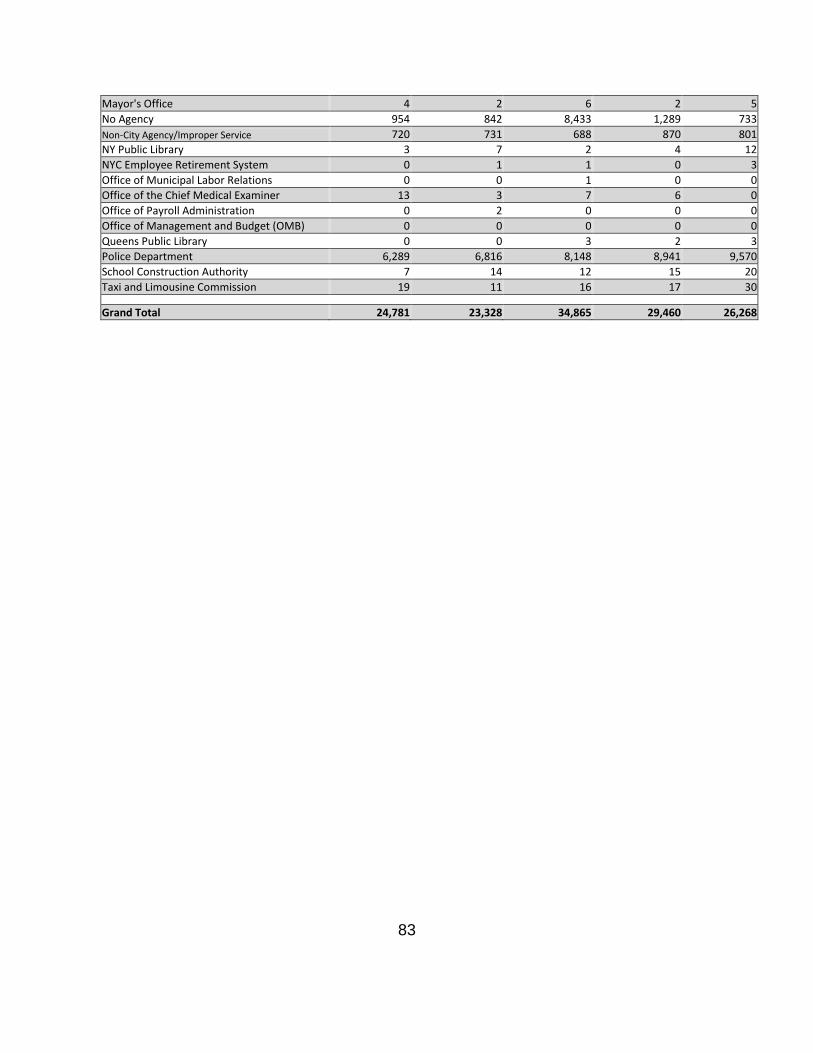
Mayor's Office 4 2 6 2 5 No Agency 954 842 8,433 1,289 733 Non-City Agency/Improper Service 720 731 688 870 801 NY Public Library 3 7 2 4 12 NYC Employee Retirement System 0 1 1 0 3 Office of Municipal Labor Relations 0 0 1 0 0 Office of the Chief Medical Examiner 13 3 7 6 0 Office of Payroll Administration 0 2 0 0 0 Office of Management and Budget (OMB) 0 0 0 0 0 Queens Public Library 0 0 3 2 3 Police Department 6,289 6,816 8,148 8,941 9,570 School Construction Authority 7 14 12 15 20 Taxi and Limousine Commission 19 11 16 17 30
Grand Total 24,781 23,328 34,865 29,460 26,268

84
Table 3 Dollar Amount of Settlements & Judgments by Claim Type
Fiscal Years 2008-2012
Personal Injury 2008 2009 2010 2011 2012 Admiralty $12,154,678 $48,945,386 $8,918,593 $7,058,960 $9,848,645 City Property $26,011,521 $30,444,952 $14,176,063 $18,827,699 $8,395,091 Civil Rights $42,242,687 $47,062,984 $78,673,455 $84,038,422 $67,882,852 Correction Facility $8,199,183 $5,938,403 $5,025,429 $8,504,000 $7,413,193 Defective Roadway $36,164,033 $24,621,449 $27,760,088 $19,453,578 $25,548,347 Defective Sidewalk $54,870,423 $39,762,727 $34,951,912 $38,413,598 $38,962,306 Employee Uniformed Services $38,389,850 $30,096,000 $41,971,283 $31,039,500 $20,408,000 Health Facility $3,747,700 $4,720,058 $2,056,377 $2,169,435 $11,826,000 Medical Malpractice $152,664,578 $127,288,634 $130,866,188 $131,827,358 $109,864,134 Motor Vehicle $56,735,117 $79,743,416 $63,238,038 $83,896,291 $69,877,442 Police Action $34,616,512 $48,422,383 $56,788,953 $60,187,774 $64,418,625 Recreation $7,881,426 $5,714,315 $7,965,906 $7,075,106 $12,053,375 School $53,600,665 $54,348,099 $35,084,262 $43,086,246 $25,415,479 Traffic Control Device $3,319,500 $1,120,750 $2,883,300 $2,906,350 $2,396,000 Total $530,597,873 $548,229,556 $510,359,847 $538,484,317 $474,309,489
Property Damage Admiralty $0 $10,289 $0 $75,000 $0
City Property $515,162 $15,863 $8,569 $2,815,834 $176,095 Correction Facility $1,919 $14,960 $1,551 $18,195 $18,225 Damage by City Personnel $3,298,638 $585,368 $873,332 $1,170,985 $959,758 Defect Traf/Light/Stop Sign $41,430 $55,727 $7,699 $22,679 $9,019 Defective Roadway $820,666 $271,099 $295,277 $424,290 $215,726 Defective Sidewalk $0 $2,125,285 $3,335 $122 $3,099 Employee Uniformed Services $0 $0 $2,785 $0 $0 Health Facility $21,559 $18,071 $19,648 $13,037 $13,191 Motor Vehicle $5,691,702 $5,464,346 $5,871,047 $8,180,319 $6,021,287 Recreation $575 $1,578 $0 $25 $0 Police Action $160,451 $120,028 $513,676 $135,899 $170,059 School $7,604 $11,627 $24,157 $12,454 $10,063 Sewer Overflow $1,915,311 $272,679 $383,619 $792,808 $775,242 Water Main $1,823,962 $664,588 $2,142,514 $1,577,070 $3,183,273
Total $14,298,979 $9,631,508 $10,147,209 $15,238,717 $11,555,037
Grand Total $544,896,852 $557,861,064 $520,507,056 $553,723,034 $485,864,526
85
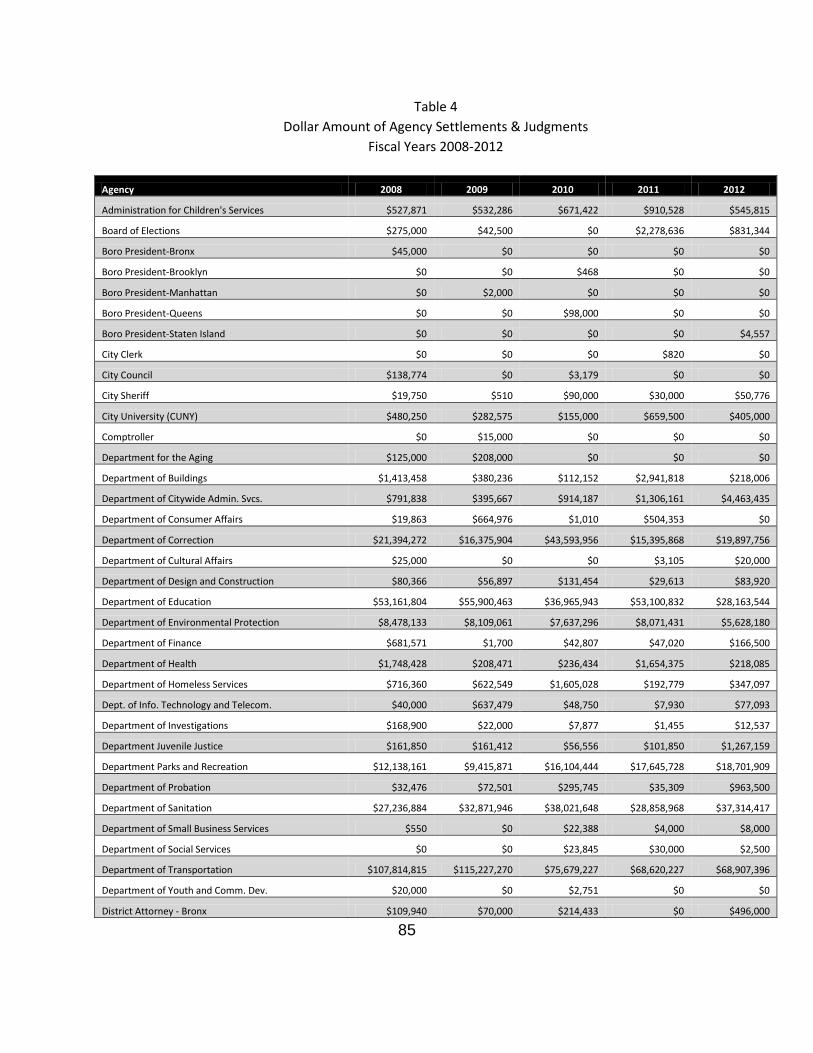
Table 4 Dollar Amount of Agency Settlements & Judgments
Fiscal Years 2008-2012
Agency 2008 2009 2010 2011 2012
Administration for Children's Services $527,871 $532,286 $671,422 $910,528 $545,815
Board of Elections $275,000 $42,500 $0 $2,278,636 $831,344
Boro President-Bronx $45,000 $0 $0 $0 $0
Boro President-Brooklyn $0 $0 $468 $0 $0
Boro President-Manhattan $0 $2,000 $0 $0 $0
Boro President-Queens $0 $0 $98,000 $0 $0
Boro President-Staten Island $0 $0 $0 $0 $4,557
City Clerk $0 $0 $0 $820 $0
City Council $138,774 $0 $3,179 $0 $0
City Sheriff $19,750 $510 $90,000 $30,000 $50,776
City University (CUNY) $480,250 $282,575 $155,000 $659,500 $405,000
Comptroller $0 $15,000 $0 $0 $0
Department for the Aging $125,000 $208,000 $0 $0 $0
Department of Buildings $1,413,458 $380,236 $112,152 $2,941,818 $218,006
Department of Citywide Admin. Svcs. $791,838 $395,667 $914,187 $1,306,161 $4,463,435
Department of Consumer Affairs $19,863 $664,976 $1,010 $504,353 $0
Department of Correction $21,394,272 $16,375,904 $43,593,956 $15,395,868 $19,897,756
Department of Cultural Affairs $25,000 $0 $0 $3,105 $20,000
Department of Design and Construction $80,366 $56,897 $131,454 $29,613 $83,920
Department of Education $53,161,804 $55,900,463 $36,965,943 $53,100,832 $28,163,544
Department of Environmental Protection $8,478,133 $8,109,061 $7,637,296 $8,071,431 $5,628,180
Department of Finance $681,571 $1,700 $42,807 $47,020 $166,500
Department of Health $1,748,428 $208,471 $236,434 $1,654,375 $218,085
Department of Homeless Services $716,360 $622,549 $1,605,028 $192,779 $347,097
Dept. of Info. Technology and Telecom. $40,000 $637,479 $48,750 $7,930 $77,093
Department of Investigations $168,900 $22,000 $7,877 $1,455 $12,537
Department Juvenile Justice $161,850 $161,412 $56,556 $101,850 $1,267,159
Department Parks and Recreation $12,138,161 $9,415,871 $16,104,444 $17,645,728 $18,701,909
Department of Probation $32,476 $72,501 $295,745 $35,309 $963,500
Department of Sanitation $27,236,884 $32,871,946 $38,021,648 $28,858,968 $37,314,417
Department of Small Business Services $550 $0 $22,388 $4,000 $8,000
Department of Social Services $0 $0 $23,845 $30,000 $2,500
Department of Transportation $107,814,815 $115,227,270 $75,679,227 $68,620,227 $68,907,396
Department of Youth and Comm. Dev. $20,000 $0 $2,751 $0 $0
District Attorney - Bronx $109,940 $70,000 $214,433 $0 $496,000

86
District Attorney - Kings $23,444 $91,234 $128,800 $3,193 $16,600
District Attorney - New York $10,411 $250,705 $3,000 $120,000 $37,608
District Attorney - Queens $41,500 $3,640,000 $79,044 $82,809 $25,205
Fire Department $18,602,877 $16,310,705 $20,007,262 $16,226,360 $27,994,774
Health and Hospitals Corporation $153,306,559 $134,946,576 $135,218,151 $133,626,810 $109,560,500
Housing Preservation and Development $21,783,261 $15,727,510 $5,126,366 $5,057,356 $1,779,067
Human Resources Administration $866,534 $1,482,725 $387,636 $1,278,134 $1,580,241
Law Department $45,000 $0 $6,679 $17,636 $25,000
Mayor's Office $1,352 $1,198 $21,200 $0 $1,205
No Agency $6,393,490 $8,146,827 $1,281,075 $8,332,433 $3,873,037
Office of the Chief Medical Examiner $2,178 $265,000 $160,000 $271,864 $97,453
Office of Payroll Administration $0 $0 $482 $0 $0
Office of Management and Budget (OMB) $40,000 $0 $0 $0 $0
Police Department $104,902,319 $134,458,022 $135,299,753 $186,259,133 $151,897,932
Taxi and Limousine Commission $1,031,613 $263,288 $51,608 $15,000 $181,378
Grand Total $544,896,852 $557,861,064 $520,507,056 $553,723,034 $485,864,526

87
Table 5 Number of Settlements & Judgments by Claim Type
Fiscal Years 2008-2012
Personal Injury 2008 2009 2010 2011 2012
Admiralty 33 56 49 47 47 City Property 170 138 107 113 93 Civil Rights 938 1,141 1,281 1,657 1,681 Correction Facility 159 227 195 266 308 Defective Roadway 749 558 513 547 511 Defective Sidewalk 1,317 1,041 925 865 855 Health Facility 43 53 36 32 33 Medical Malpractice 310 292 314 266 258 Motor Vehicle 1,043 908 896 824 831 Recreation 188 153 137 154 176 Police Action 980 1,145 1,300 1,538 1,757 School 1,068 846 823 913 740 Traffic Control Device 73 55 38 31 28 Employee Uniformed Services 123 90 117 84 107
Total 7,194 6,703 6,731 7,337 7,425
Property Damage
Admiralty 0 1 0 1 0 City Property 17 10 10 16 21 Correction Facility 9 6 5 21 11 Damage by City Personnel 331 264 352 328 373 Defective Roadway 300 275 307 438 208 Defective Sidewalk 0 3 2 1 2 Health Facility 44 36 33 25 23 Motor Vehicle 2,513 2,340 2,494 3,216 2,251 Police Action 52 61 45 44 48 Recreation 5 2 0 1 0 School 42 39 83 55 47 Sewer Overflow 55 60 50 88 60 Traffic Control Device 13 8 6 5 5 Employee Uniformed Services 0 0 8 0 0 Water Main 97 88 77 94 62
Total 3,478 3,193 3,472 4,333 3,111
Grand Total 10,672 9,896 10,203 11,670 10,536

88
Table 6
Number of Settlements and Judgments by Agency
Fiscal Years 2008-2012
Agency 2008 2009 2010 2011 2012
Administration for Children's Services 26 23 18 10 14
Board of Elections 2 1 0 4 3
Boro President-Bronx 1 0 0 0 0
Boro President-Brooklyn 0 0 1 0 0
Boro President-Manhattan 0 1 0 0 0
Boro President-Queens 0 0 1 0 0
Boro President-Staten Island 0 0 0 0 1
City Clerk 0 0 0 1 0
City Council 1 0 1 0 0
City Sheriff 2 1 2 1 5
City University (CUNY) 13 5 5 8 4
Comptroller 0 1 0 0 0
Department for the Aging 1 3 0 0 0
Department of Buildings 25 13 16 20 25
Department of Citywide Admin. Svcs. 25 23 29 23 34
Department of Consumer Affairs 3 1 1 3 0
Department of Correction 315 393 366 441 464
Department of Cultural Affairs 1 0 0 1 2
Department of Design and Construction 10 7 7 6 4
Department of Education 1,137 941 962 1,006 824
Department of Environmental Protection 333 303 284 373 282
Department of Finance 4 1 5 3 2
Department of Health 26 10 14 15 14
Department of Homeless Services 28 35 20 14 24
Department of Info. Technology and Telecom. 1 4 3 2 2
Department of Investigations 7 3 1 1 3
Department of Juvenile Justice 6 10 10 7 9
Department of Parks and Recreation 436 355 375 390 429
Department of Probation 2 2 13 7 3
Department of Sanitation 1,311 1,253 1,377 2,103 1,302
Department of Small Business Services 1 0 3 2 1
Department of Social Services 0 0 3 1 1
Department of Transportation 2,552 2,064 1,945 1,973 1,710

89
Department of Youth and Comm. Dev. 1 0 1 0 0
District Attorney - Bronx 1 2 5 0 2
District Attorney - Kings 5 10 3 1 3
District Attorney - New York 3 2 1 1 4
District Attorney - Queens 2 3 4 6 3
Fire Department 652 623 642 596 508
Health and Hospitals Corporation 432 413 417 346 334
Housing Preservation and Development 93 55 30 35 25
Human Resources Administration 31 17 21 13 19
Law Department 1 0 4 3 1
Mayor's Office 1 1 3 0 2
No Agency 169 150 35 132 104
Office of the Chief Medical Examiner 2 2 1 6 4
Office of Payroll Administration 0 0 1 0 0
Office of Management and Budget (OMB) 1 0 0 0 0
Police Department 2,958 3,155 3,571 4,115 4,358
Taxi and Limousine Commission 51 10 2 1 7
Grand Total 10,672 9,896 10,203 11,670 10,536