Embed Size (px)
Citation preview

City of Missoula Survey
Produced by:
Sara Rinfret, Ph.D.
Director, Master of Public Administration Program Co-Director, Social Science Research Laboratory
University of Montana 32 Campus Drive
Missoula, MT 59812 Email: [email protected]
Phone: 406-243-4702
&
Chuck Harris, Social Science Research Laboratory System Administrator Shane St. Onge, Masters of Public Administration Graduate Student Samuel Scott, Masters of Public Administration Graduate Student
P a g e | 1
Table of Contents Overview & Methodology .............................................................................................................. 2
Section I: Demographic Data .......................................................................................................... 3
Section II: Findings ......................................................................................................................... 4
Quality of Life Findings…………………………………………………………………...5
Quality of Life Factors…………………………………………………………………….6
Importance, Satisfaction, and Tax Increases………………………………………………7
Tourist-Orientated Tax…………………………………………………………………...10
Tourist-Orientated Tax and Reduction in Property Taxes……………………………….13
Priority for Budgeting……………………………………………………………………13
Section III: Aggregate Level Survey Data per Question .............................................................. 15
P a g e | 2
Overview & Methodology Spring 2018 the City of Missoula requested that a research team from the University of Montana’s Social Science Research Laboratory (SSRL) conduct a telephone survey of active registered voters within city-limits. The purpose of the survey was to examine perceptions regarding citizen satisfaction with municipal services more broadly. The University of Montana’s SSRL created a 14-question telephone survey. Dr. Sara Rinfret led a team of Master of Public Administration student researchers in the creation of the survey instrument. To provide high quality results, trained interviewers from WestGroup Research of Phoenix, Arizona conducted the phone survey. The University of Montana research team was responsible for the analysis of the data collected. The survey was conducted March 1-20, 2018 with 606 randomly selected City of Missoula registered voters. Survey results are valid with a margin of error (MOE) of +/- 4 at a 95 percent confidence level.1 The statistical analysis of the survey data was conducted with the Statistical Package for the Social Sciences (SPSS). ArcGIS was used to provide a geographic context for the data. Tableau and NVivo software provided data visualizations. Although the telephone calls were randomly selected from zip codes within the city limits of Missoula, respondents were asked pre-screening questions to ensure the accuracy of the results. Respondents were asked: do you live in the City of Missoula; what are the two streets that intersect in your neighborhood? The data from the pre-screening questions where evaluated within a spatial context to ensure the sample was indeed within city limits. Twelve respondents listed intersections that were further than one half mile outside of city-limits and removed from the dataset, leaving a final survey population of 594.
Even though telephone surveys are scientifically rigorous, there are limitations. For instance, only voters listing a phone number when registering to vote in Montana were in the population sampled for the survey. The telephone survey was also conducted in English, which would limit the participation of non-English speaking active voters in Montana. We do not believe that these limitations overshadow the quality of information provided in this report.
The following report provides an overview of demographic data and results from each survey questions. Specifically, this report documents:
23.5 percent of respondents believe housing is the most pressing issue for Missoula 79.8 percent of individuals classify their quality of life in Missoula as excellent or good Missoula fire services received the strongest level of satisfaction from respondents 54 percent of participants strongly support/support the adoption of a three percent tourist-
orientated tax
1If we ran the survey 100 times with the same procedure, and selected a different random sample each time the +/- 4% interval around the survey response should, in 95 of those 100 surveys, contain the same answer from asking everyone in the population.
P a g e | 3
Section I: Overview of Demographic Data
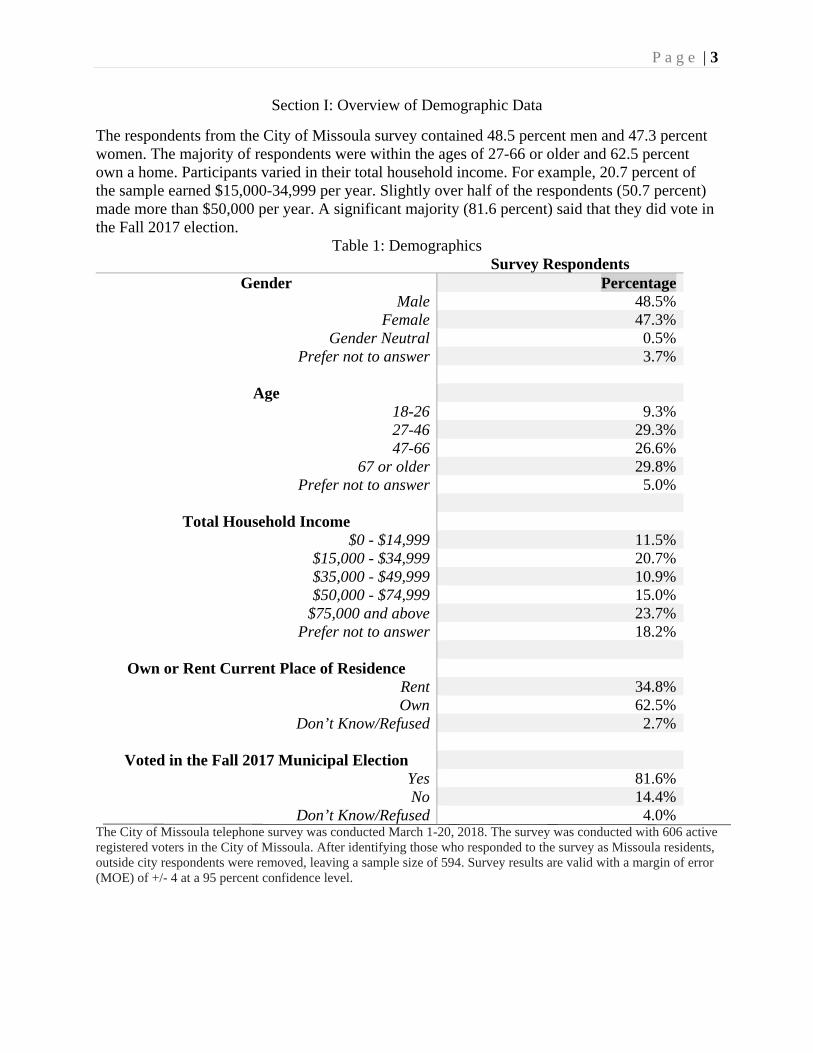
The respondents from the City of Missoula survey contained 48.5 percent men and 47.3 percent women. The majority of respondents were within the ages of 27-66 or older and 62.5 percent own a home. Participants varied in their total household income. For example, 20.7 percent of the sample earned $15,000-34,999 per year. Slightly over half of the respondents (50.7 percent) made more than $50,000 per year. A significant majority (81.6 percent) said that they did vote in the Fall 2017 election.
Table 1: Demographics Survey Respondents
Gender PercentageMale 48.5%
Female 47.3%Gender Neutral 0.5%
Prefer not to answer 3.7%
Age 18-26 9.3%27-46 29.3%47-66 26.6%
67 or older 29.8%Prefer not to answer 5.0%
Total Household Income $0 - $14,999 11.5%
$15,000 - $34,999 20.7%$35,000 - $49,999 10.9%$50,000 - $74,999 15.0%
$75,000 and above 23.7%Prefer not to answer 18.2%
Own or Rent Current Place of Residence Rent 34.8%Own 62.5%
Don’t Know/Refused 2.7%
Voted in the Fall 2017 Municipal Election Yes 81.6%No 14.4%
Don’t Know/Refused 4.0%The City of Missoula telephone survey was conducted March 1-20, 2018. The survey was conducted with 606 active registered voters in the City of Missoula. After identifying those who responded to the survey as Missoula residents, outside city respondents were removed, leaving a sample size of 594. Survey results are valid with a margin of error (MOE) of +/- 4 at a 95 percent confidence level.

P a g e | 4
Section II: Findings In this section, we use data visualization to illuminate and report the findings from survey responses. Table 2 illustrates the most pressing problems expressed by respondents. The three most frequently stated problems reported by respondents included housing (23.5 percent), taxes (e.g. too high) (11.5 percent), and infrastructure (e.g. road conditions) (9.4 percent).
Table 2: Most Pressing Problems
Issue Percentage % Housing 23.5% Taxes (too high) 11.5% Infrastructure 9.4% Other2 6.9% Traffic 6.2% Low Wages 5.6% Jobs/Job creation 5.2% Homelessness3 5.1% Public Safety (includes crime) 4.5% Managing growth and development 2.4% Drug Use and Addiction 2.2% City Leadership 2.1% Social service issues 1.9% Cost of Living4 1.8% Environment5 1.8% City Government Spending 2.0% Education 1.5% Health Care 1.3% City/Street Services6 1.1% Public Transportation 1.1% Poverty 0.5% Economy 0.4% Lack of Morals 0.4% Parking 0.4% Mental Health (includes suicide) 0.4% Taxes (too low) 0.3% Forest management (includes fires) 0.2% Drought/Lack of rain/snow 0.2% Total 100%
2 "Other" includes unique or vague responses that could not classified. 3 “Homelessness” includes seeing homeless individuals in the city, downtown was the most prevalent location 4 “Cost of living” was a general statement used by respondents to express living expenses other than housing 5 “Environment” includes responses regarding preserving public lands, sustainability, and climate change 6 “City/Street Services” were responses that stressed the importance of keeping roads clear of trash and snow removal
Question: In your opinion, what are the most pressing problems facing people in the City of Missoula today?
P a g e | 5
Quality of Life Findings
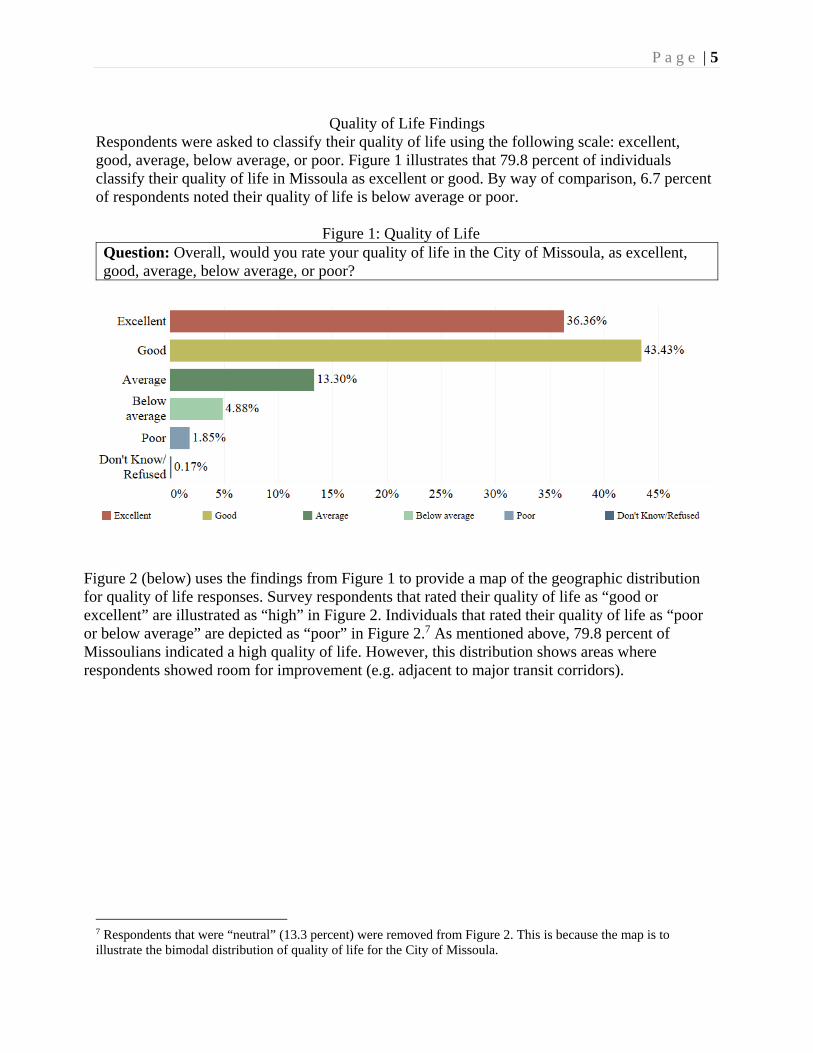
Respondents were asked to classify their quality of life using the following scale: excellent, good, average, below average, or poor. Figure 1 illustrates that 79.8 percent of individuals classify their quality of life in Missoula as excellent or good. By way of comparison, 6.7 percent of respondents noted their quality of life is below average or poor.
Figure 1: Quality of Life
Question: Overall, would you rate your quality of life in the City of Missoula, as excellent, good, average, below average, or poor?
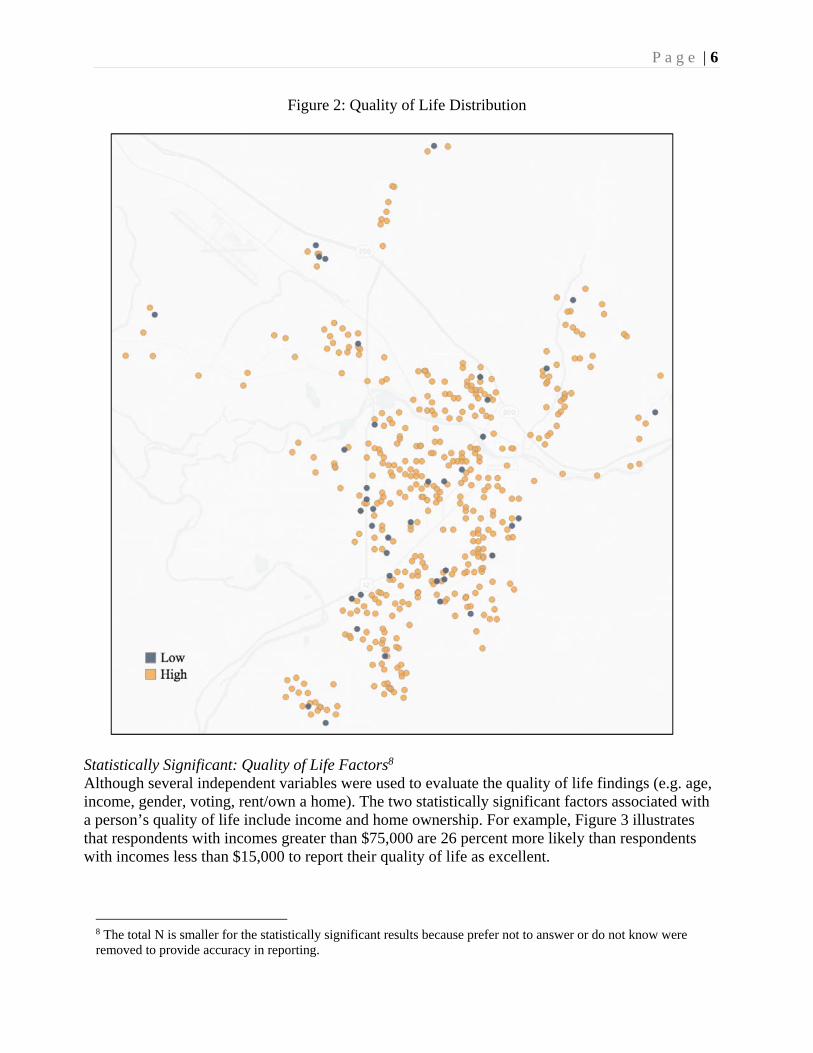
Figure 2 (below) uses the findings from Figure 1 to provide a map of the geographic distribution for quality of life responses. Survey respondents that rated their quality of life as “good or excellent” are illustrated as “high” in Figure 2. Individuals that rated their quality of life as “poor or below average” are depicted as “poor” in Figure 2.7 As mentioned above, 79.8 percent of Missoulians indicated a high quality of life. However, this distribution shows areas where respondents showed room for improvement (e.g. adjacent to major transit corridors).
7 Respondents that were “neutral” (13.3 percent) were removed from Figure 2. This is because the map is to illustrate the bimodal distribution of quality of life for the City of Missoula.
P a g e | 6
Figure 2: Quality of Life Distribution
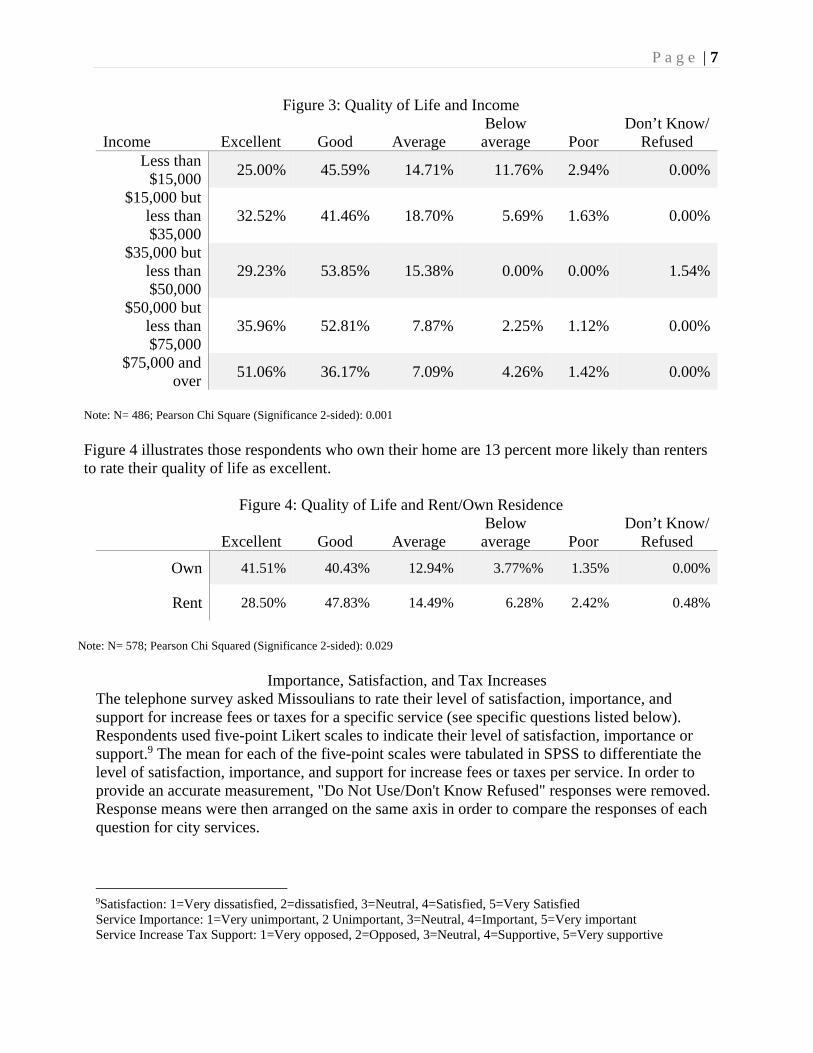
Statistically Significant: Quality of Life Factors8 Although several independent variables were used to evaluate the quality of life findings (e.g. age, income, gender, voting, rent/own a home). The two statistically significant factors associated with a person’s quality of life include income and home ownership. For example, Figure 3 illustrates that respondents with incomes greater than $75,000 are 26 percent more likely than respondents with incomes less than $15,000 to report their quality of life as excellent.
8 The total N is smaller for the statistically significant results because prefer not to answer or do not know were removed to provide accuracy in reporting.
P a g e | 7
Figure 3: Quality of Life and Income
Income Excellent Good Average Below average Poor
Don’t Know/ Refused
Less than $15,000
25.00% 45.59% 14.71% 11.76% 2.94% 0.00%
$15,000 but less than $35,000
32.52% 41.46% 18.70% 5.69% 1.63% 0.00%
$35,000 but less than $50,000
29.23% 53.85% 15.38% 0.00% 0.00% 1.54%
$50,000 but less than $75,000
35.96% 52.81% 7.87% 2.25% 1.12% 0.00%
$75,000 and over
51.06% 36.17% 7.09% 4.26% 1.42% 0.00%
Note: N= 486; Pearson Chi Square (Significance 2-sided): 0.001
Figure 4 illustrates those respondents who own their home are 13 percent more likely than renters to rate their quality of life as excellent.
Figure 4: Quality of Life and Rent/Own Residence
Excellent Good Average Below average Poor
Don’t Know/ Refused
Own 41.51% 40.43% 12.94% 3.77%% 1.35% 0.00%
Rent 28.50% 47.83% 14.49% 6.28% 2.42% 0.48%
Note: N= 578; Pearson Chi Squared (Significance 2-sided): 0.029
Importance, Satisfaction, and Tax Increases
The telephone survey asked Missoulians to rate their level of satisfaction, importance, and support for increase fees or taxes for a specific service (see specific questions listed below). Respondents used five-point Likert scales to indicate their level of satisfaction, importance or support.9 The mean for each of the five-point scales were tabulated in SPSS to differentiate the level of satisfaction, importance, and support for increase fees or taxes per service. In order to provide an accurate measurement, "Do Not Use/Don't Know Refused" responses were removed. Response means were then arranged on the same axis in order to compare the responses of each question for city services.
9Satisfaction: 1=Very dissatisfied, 2=dissatisfied, 3=Neutral, 4=Satisfied, 5=Very Satisfied Service Importance: 1=Very unimportant, 2 Unimportant, 3=Neutral, 4=Important, 5=Very important Service Increase Tax Support: 1=Very opposed, 2=Opposed, 3=Neutral, 4=Supportive, 5=Very supportive

P a g e | 8
Question: How satisfied are you with the following services provided by the City of Missoula (Very Dissatisfied, Somewhat Dissatisfied, Neutral, Somewhat Satisfied, Very Satisfied)
Question: How would you rate the following services provided by the City of Missoula? (Very Important, Important, Neutral, Unimportant, Very unimportant)
Question: How supportive would you be of increasing fees or taxes for the following services? (Very Supportive, Supportive, Neutral, Opposed, Very Opposed)
Figure 5 reports that respondents have the strongest level of satisfaction and importance for fire services. However, respondents most strongly support increasing taxes and fees to focus on street repair and maintenance. By way of comparison, the lowest level of satisfaction for respondents in this research surrounds affordable housing. Although with a neutral average (3.8), permitting, licensing, and access to walking and biking amenities in the city limits received the lowest level of importance. Permitting and licensing additionally received lowest level of support to increase fees and taxes.
Figure 5: Importance, Satisfaction, and Support of Tax Increase

P a g e | 9
The findings from Figure 5 was used to create geographic distributions of responses to the three measures for each city service. The majority of distributions showed little or no variance based on geography. More specifically, where someone lived did not appear to influence their level of satisfaction with or importance placed on fire services or housing affordability, for example. Figure 6 (below), however, illustrates that while respondents within city limits overall have high rates of satisfaction with walking and biking amenities, increased dissatisfaction appears near Southwest Higgins and South 39th Street.
Figure 6: Access to Walking and Biking Amenities
P a g e | 10
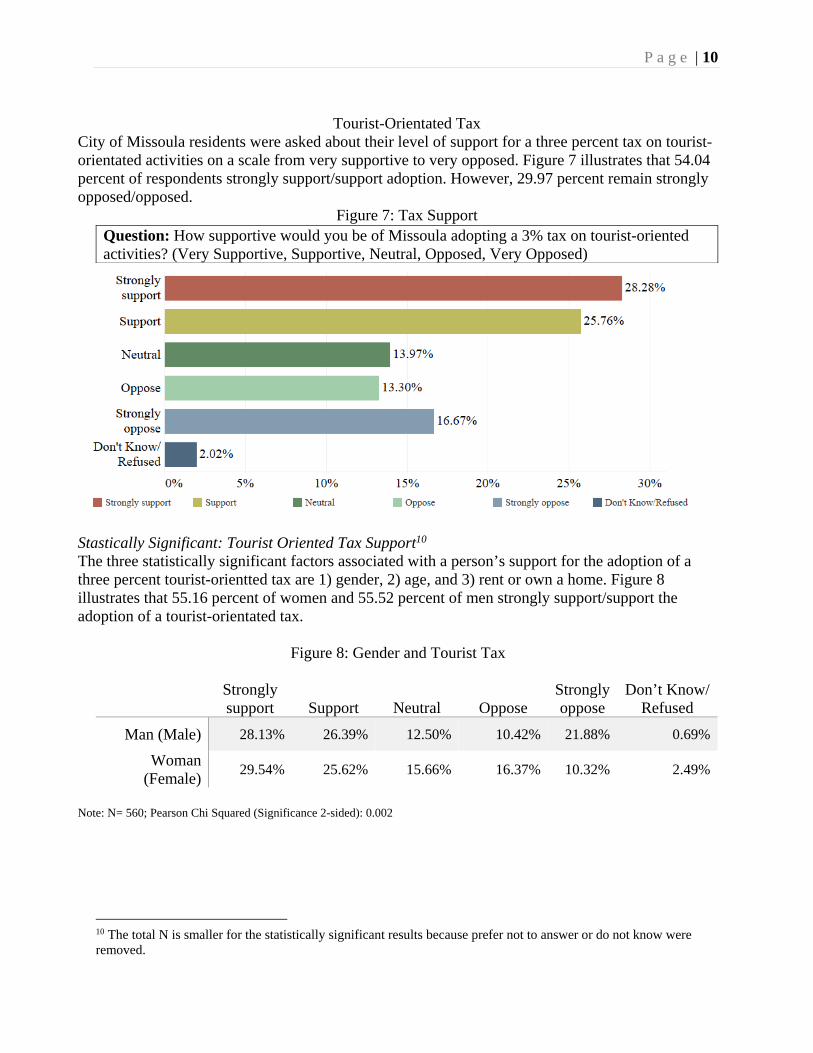
Tourist-Orientated Tax
City of Missoula residents were asked about their level of support for a three percent tax on tourist-orientated activities on a scale from very supportive to very opposed. Figure 7 illustrates that 54.04 percent of respondents strongly support/support adoption. However, 29.97 percent remain strongly opposed/opposed.
Figure 7: Tax Support Question: How supportive would you be of Missoula adopting a 3% tax on tourist-oriented activities? (Very Supportive, Supportive, Neutral, Opposed, Very Opposed)
Stastically Significant: Tourist Oriented Tax Support10 The three statistically significant factors associated with a person’s support for the adoption of a three percent tourist-orientted tax are 1) gender, 2) age, and 3) rent or own a home. Figure 8 illustrates that 55.16 percent of women and 55.52 percent of men strongly support/support the adoption of a tourist-orientated tax.
Figure 8: Gender and Tourist Tax
Strongly support Support Neutral Oppose
Strongly oppose
Don’t Know/ Refused
Man (Male) 28.13% 26.39% 12.50% 10.42% 21.88% 0.69%
Woman (Female)
29.54% 25.62% 15.66% 16.37% 10.32% 2.49%
Note: N= 560; Pearson Chi Squared (Significance 2-sided): 0.002
10 The total N is smaller for the statistically significant results because prefer not to answer or do not know were removed.

P a g e | 11
Figure 9 suggests 60 percent of 18-26 year olds, 59.8 percent of 27-26 years olds, 56.3 percent of 47-66 year olds, and 47.5 percent of 67 or older strongly support/support the adoption of a tourist-orientated tax.
Figure 9: Age and Tourist Tax
Strongly support Support Neutral Oppose
Strongly oppose
Don’t Know/ Refused
18 to 26 23.64% 36.36% 14.55% 10.91% 14.55% 0.00%
27 to 46) 29.89% 29.89% 13.79% 11.49% 14.94% 0.00%
47 to 66 36.71% 19.26% 12.66% 11.39% 17.09% 2.53%
67 or Older 23.16% 24.29% 15.25% 18.64% 15.82% 2.82%
Note: N=560; Pearson Chi Squared (Significance 2-sided): 0.004
Figure 10 depicts 51.8 percent of individuals that own a home strongly support/support the adoption of a three percent tourist-related tax. By way of comparison, 60.3 percent of respondents that rent a home strongly support/support the adoption.
Figure 10: Rent/Own and Tourist Tax
Strongly support Support Neutral Oppose
Strongly oppose
Don’t Know/ Refused
Own 29.92% 21.83% 14.29% 14.56% 18.06 1.35%
Rent 27.05% 33.33% 14.01% 10.63% 13.04% 1.93%
Note: N= 569; Pearson Chi Squared (Significance 2-sided): 0.029
Support for an adoption of a three percent tax on tourist activities varies throughout city limits. The Linda Vista and Rose Park neighborhoods appear to show stronger support for the adoption of a tourist-related tax, while Franklin to the Fort and the Old Sawmill District show much more parity. The map below (Figure 11) combined “strongly support/support” and “strongly oppose/oppose” to map the distribution.11
11 Neutral responses were removed to represent the bimodal distribution

P a g e | 12
Figure 11: Distribution of Support/Opposition to 3% Tax on Tourist Activities
P a g e | 13
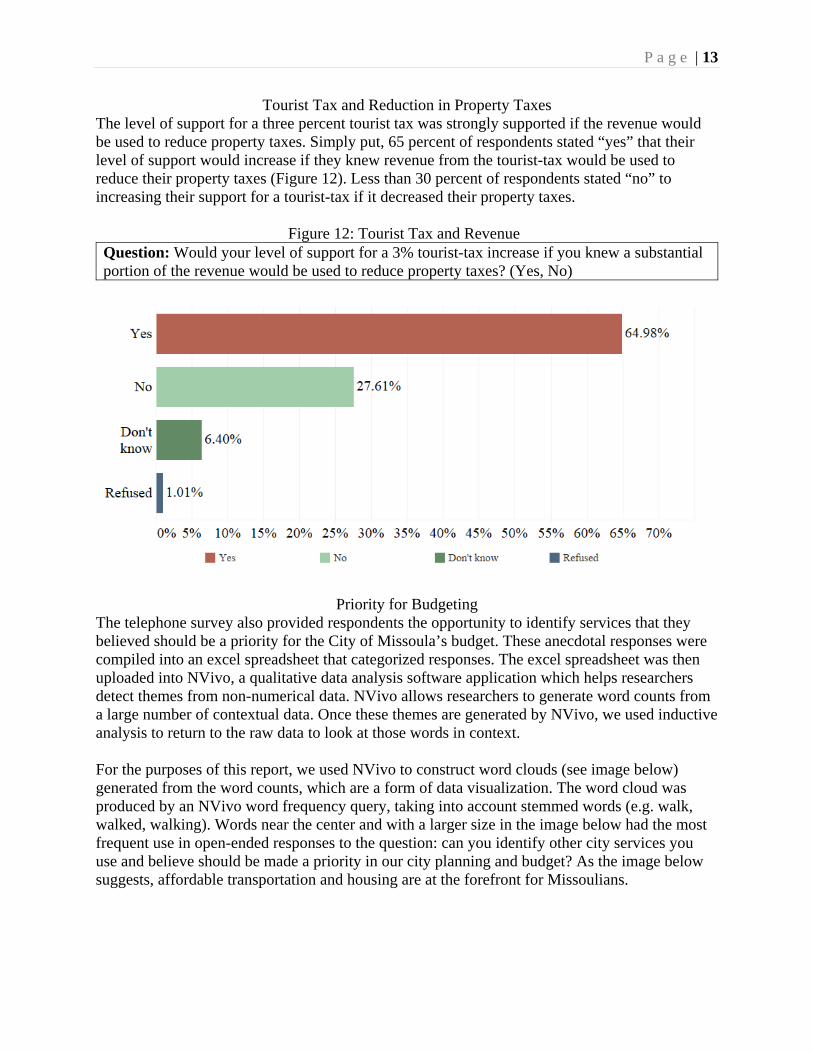
Tourist Tax and Reduction in Property Taxes The level of support for a three percent tourist tax was strongly supported if the revenue would be used to reduce property taxes. Simply put, 65 percent of respondents stated “yes” that their level of support would increase if they knew revenue from the tourist-tax would be used to reduce their property taxes (Figure 12). Less than 30 percent of respondents stated “no” to increasing their support for a tourist-tax if it decreased their property taxes.
Figure 12: Tourist Tax and Revenue Question: Would your level of support for a 3% tourist-tax increase if you knew a substantial portion of the revenue would be used to reduce property taxes? (Yes, No)
Priority for Budgeting The telephone survey also provided respondents the opportunity to identify services that they believed should be a priority for the City of Missoula’s budget. These anecdotal responses were compiled into an excel spreadsheet that categorized responses. The excel spreadsheet was then uploaded into NVivo, a qualitative data analysis software application which helps researchers detect themes from non-numerical data. NVivo allows researchers to generate word counts from a large number of contextual data. Once these themes are generated by NVivo, we used inductive analysis to return to the raw data to look at those words in context. For the purposes of this report, we used NVivo to construct word clouds (see image below) generated from the word counts, which are a form of data visualization. The word cloud was produced by an NVivo word frequency query, taking into account stemmed words (e.g. walk, walked, walking). Words near the center and with a larger size in the image below had the most frequent use in open-ended responses to the question: can you identify other city services you use and believe should be made a priority in our city planning and budget? As the image below suggests, affordable transportation and housing are at the forefront for Missoulians.

P a g e | 14
Question: Can you identify other city services that you use and believe should be made a priority in our city planning and budget? (open ended)

P a g e | 15
Section III: Aggregate Level Survey Data per Question The final section of this report serves as an appendix. It provides an aggregate breakdown of telephone responses per question.
Section 1: Satisfaction and Concerns In your opinion, what are the most pressing problems facing people in the city of Missoula today? [See results above] Overall, would you rate your quality of life in the City of Missoula, as excellent, good, average, below average or poor?
N=594, MD=0 Scale Percentage (%) Excellent 36.4Good 43.4Average 13.3Below Average 4.9Poor 1.9Don’t know/Refused .1
Using the scale very satisfied, satisfied, neutral, dissatisfied, or very dissatisfied, how satisfied are you with the following services provided by the City of Missoula? Police services
N=594, MD=0 Scale Percentage (%) Very Satisfied 27.8Satisfied 55.4Neutral 10.9Dissatisfied 2.9Very Dissatisfied 1.0Do Not Use .8Don’t Know/Refused
1.2
Fire services
N=594, MD=0 Scale Percentage (%) Very Satisfied 41.9Satisfied 48.1Neutral 5.9Dissatisfied .2Very Dissatisfied .2Do Not Use 1.5

P a g e | 16
Don’t Know/Refused
2.2
Municipal court services
N=594, MD=0 Scale Percentage (%) Very Satisfied 10.8Satisfied 43.9Neutral 20.9Dissatisfied 4.4Very Dissatisfied 2.0Do Not Use 7.7Don’t Know/Refused
10.3
Planning and managing for growth in the city
N=594, MD=0 Scale Percentage (%) Very Satisfied 7.1Satisfied 27.9Neutral 21.2Dissatisfied 27.3Very Dissatisfied 12.5Do Not Use 1.3Don’t Know/Refused
2.7
Permitting and licensing services N=594, MD=0 Scale Percentage (%) Very Satisfied 6.2Satisfied 35.5Neutral 27.8Dissatisfied 14.1Very Dissatisfied 6.4Do Not Use 3.0Don’t Know/Refused
6.9
P a g e | 17
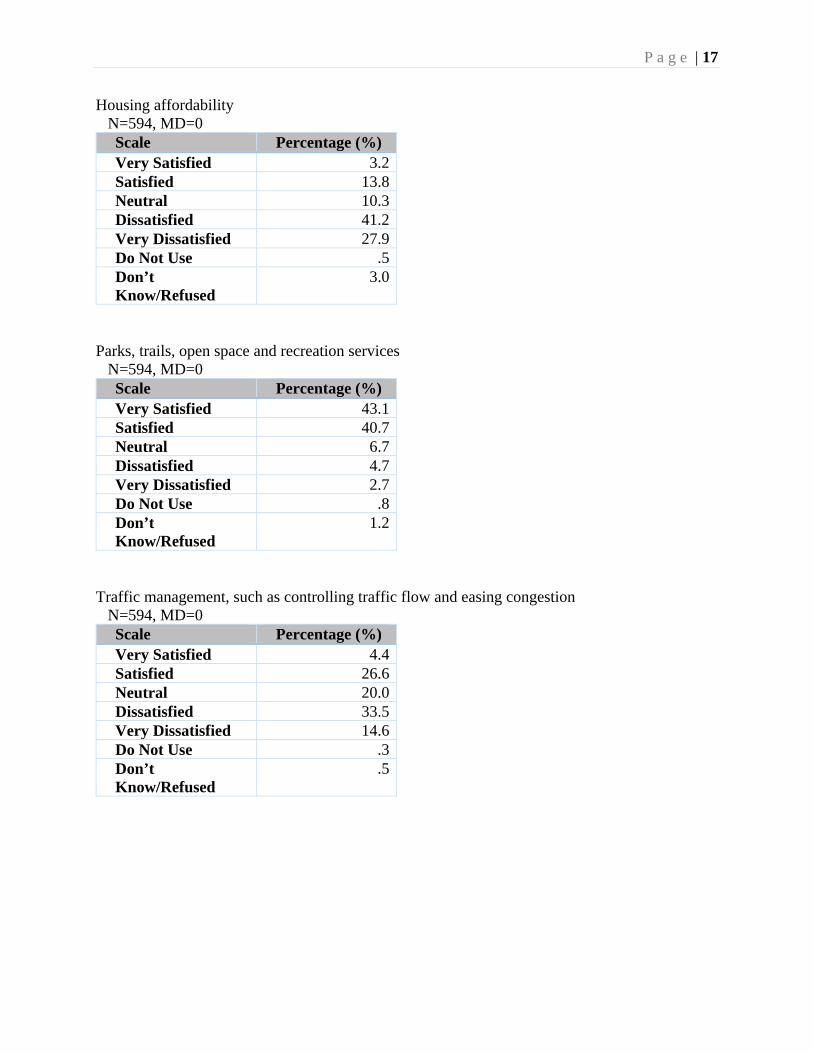
Housing affordability N=594, MD=0 Scale Percentage (%) Very Satisfied 3.2Satisfied 13.8Neutral 10.3Dissatisfied 41.2Very Dissatisfied 27.9Do Not Use .5Don’t Know/Refused
3.0
Parks, trails, open space and recreation services N=594, MD=0 Scale Percentage (%) Very Satisfied 43.1Satisfied 40.7Neutral 6.7Dissatisfied 4.7Very Dissatisfied 2.7Do Not Use .8Don’t Know/Refused
1.2
Traffic management, such as controlling traffic flow and easing congestion N=594, MD=0 Scale Percentage (%) Very Satisfied 4.4Satisfied 26.6Neutral 20.0Dissatisfied 33.5Very Dissatisfied 14.6Do Not Use .3Don’t Know/Refused
.5

P a g e | 18
Street repair and maintenance, including street cleaning and snow removal N=594, MD=0 Scale Percentage (%) Very Satisfied 4.2Satisfied 24.4Neutral 12.8Dissatisfied 34.0Very Dissatisfied 23.7Do Not Use .2Don’t Know/Refused
.7
Access to walking and biking amenities in the city limits
N=594, MD=0 Scale Percentage (%) Very Satisfied 35.4Satisfied 47.1Neutral 8.8Dissatisfied 4.4Very Dissatisfied 1.9Do Not Use .8Don’t Know/Refused
1.7
Using the scale very important, important, neutral, unimportant, or very unimportant, how important are the following services provided by the City of Missoula?
Police services
N=594, MD=0 Scale Percentage (%) Very Important 57.9Important 33.5Neutral 6.9Unimportant .7Very Unimportant .2Do Not Use .3Don’t Know/Refused
.5

P a g e | 19
Fire services N=594, MD=0 Scale Percentage (%) Very Important 66.7Important 27.8Neutral 4.5Unimportant -Very Unimportant -Do Not Use .3Don’t Know/Refused
.7
Municipal court services
N=594, MD=0 Scale Percentage (%) Very Important 32.0Important 42.8Neutral 19.7Unimportant 1.5Very Unimportant .3Do Not Use 1.3Don’t Know/Refused
2.4
Planning and managing for growth in the city
N=594, MD=0 Scale Percentage (%) Very Important 47.1Important 36.0Neutral 10.4Unimportant 4.0Very Unimportant .8Do Not Use .5Don’t Know/Refused
1.0
P a g e | 20
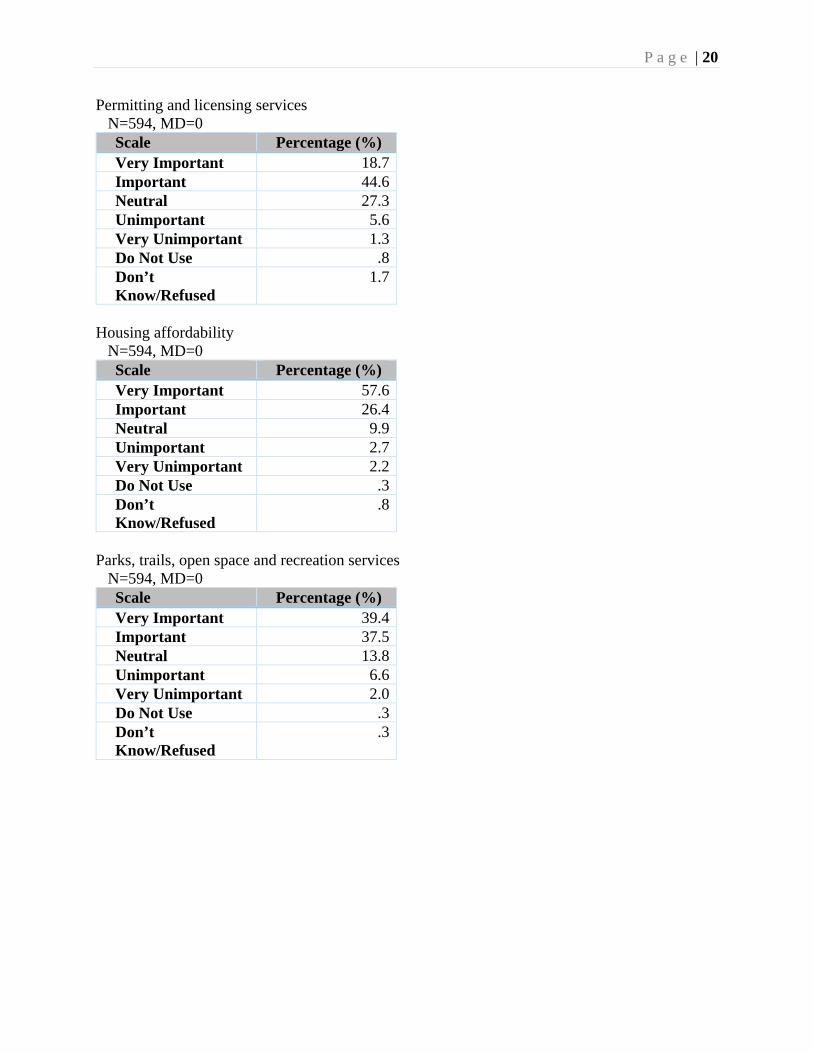
Permitting and licensing services N=594, MD=0 Scale Percentage (%) Very Important 18.7Important 44.6Neutral 27.3Unimportant 5.6Very Unimportant 1.3Do Not Use .8Don’t Know/Refused
1.7
Housing affordability
N=594, MD=0 Scale Percentage (%) Very Important 57.6Important 26.4Neutral 9.9Unimportant 2.7Very Unimportant 2.2Do Not Use .3Don’t Know/Refused
.8
Parks, trails, open space and recreation services
N=594, MD=0 Scale Percentage (%) Very Important 39.4Important 37.5Neutral 13.8Unimportant 6.6Very Unimportant 2.0Do Not Use .3Don’t Know/Refused
.3

P a g e | 21
Traffic management, such as controlling traffic flow and easing congestion N=594, MD=0 Scale Percentage (%) Very Important 43.9Important 43.6Neutral 9.6Unimportant 1.9Very Unimportant .2Do Not Use .3Don’t Know/Refused
.5
Street repair and maintenance, including street cleaning and snow removal
N=594, MD=0 Scale Percentage (%) Very Important 53.2Important 40.6Neutral 4.4Unimportant 1.0Very Unimportant .7Do Not Use -Don’t Know/Refused
.2
Access to walking and biking amenities in the city limits
N=594, MD=0 Scale Percentage (%) Very Important 26.3Important 43.4Neutral 18.0Unimportant 8.4Very Unimportant 2.9Do Not Use .3Don’t Know/Refused
.7
P a g e | 22
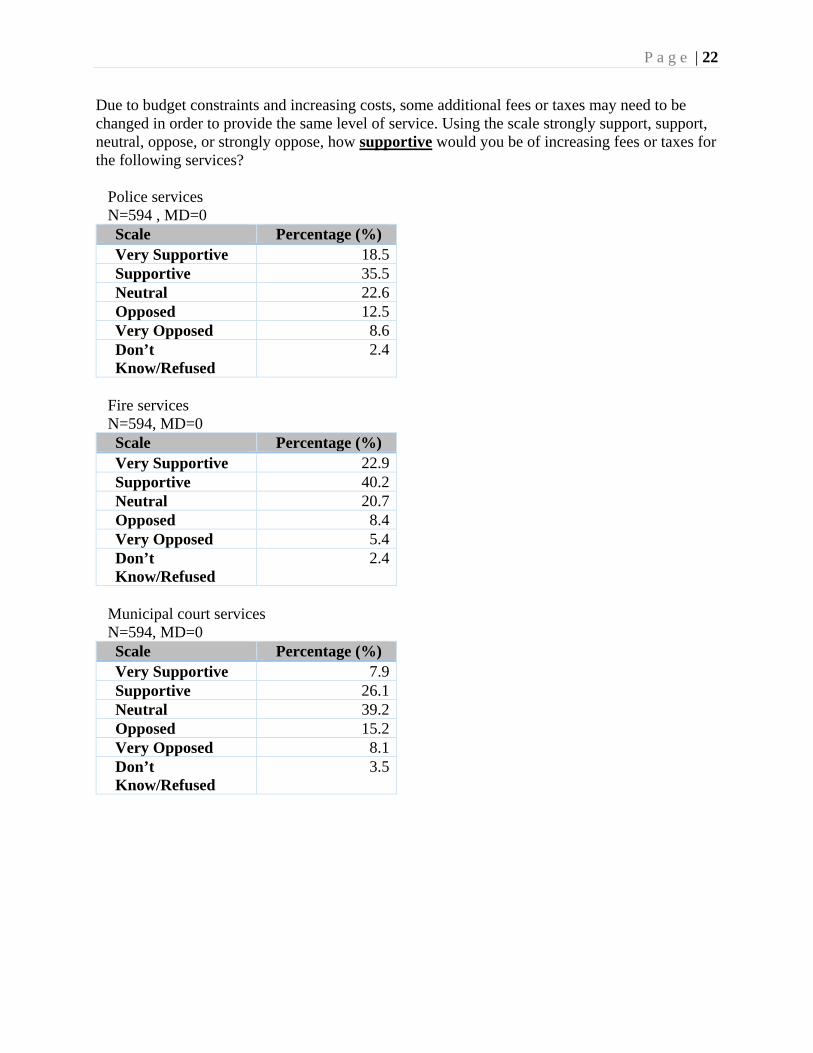
Due to budget constraints and increasing costs, some additional fees or taxes may need to be changed in order to provide the same level of service. Using the scale strongly support, support, neutral, oppose, or strongly oppose, how supportive would you be of increasing fees or taxes for the following services?
Police services N=594 , MD=0 Scale Percentage (%) Very Supportive 18.5Supportive 35.5Neutral 22.6Opposed 12.5Very Opposed 8.6Don’t Know/Refused
2.4
Fire services N=594, MD=0 Scale Percentage (%) Very Supportive 22.9Supportive 40.2Neutral 20.7Opposed 8.4Very Opposed 5.4Don’t Know/Refused
2.4
Municipal court services N=594, MD=0 Scale Percentage (%) Very Supportive 7.9Supportive 26.1Neutral 39.2Opposed 15.2Very Opposed 8.1Don’t Know/Refused
3.5
P a g e | 23
Planning and managing for growth in the city N=594, MD=0 Scale Percentage (%) Very Supportive 12.8Supportive 33.0Neutral 27.3Opposed 16.3Very Opposed 8.9Don’t Know/Refused
1.7
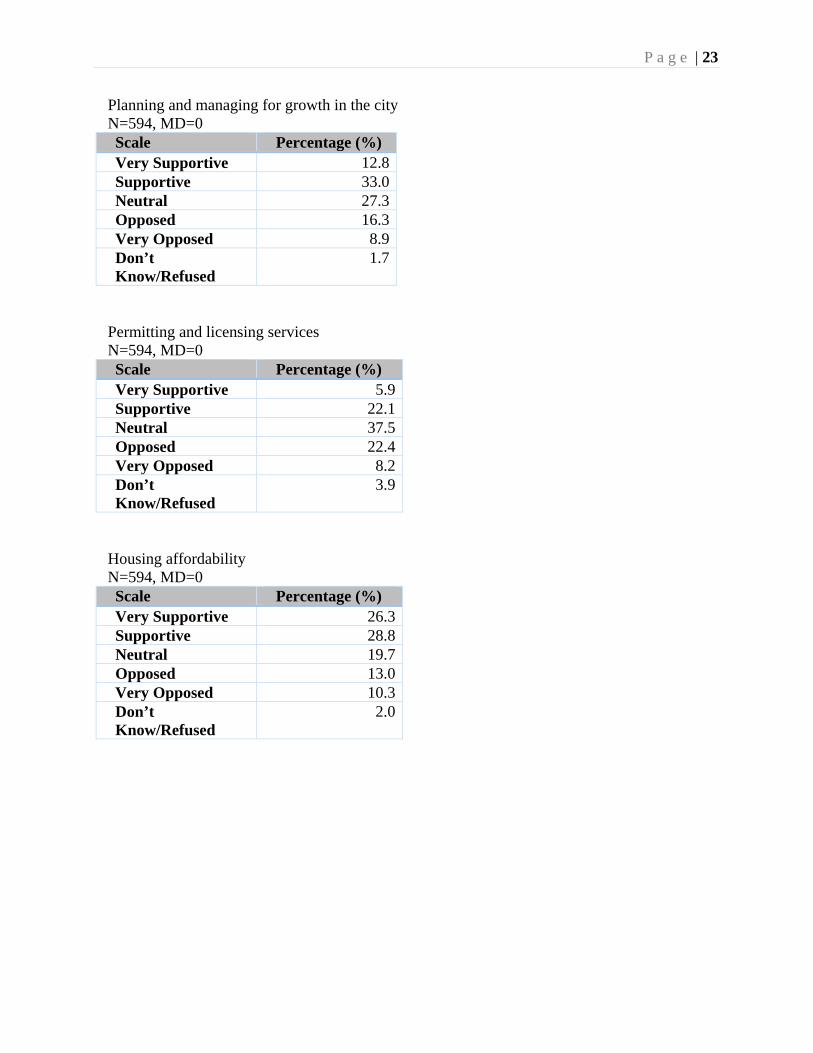
Permitting and licensing services N=594, MD=0 Scale Percentage (%) Very Supportive 5.9Supportive 22.1Neutral 37.5Opposed 22.4Very Opposed 8.2Don’t Know/Refused
3.9
Housing affordability N=594, MD=0 Scale Percentage (%) Very Supportive 26.3Supportive 28.8Neutral 19.7Opposed 13.0Very Opposed 10.3Don’t Know/Refused
2.0

P a g e | 24
Parks, trails, open space and recreation services N=594, MD=0 Scale Percentage (%) Very Supportive 19.4Supportive 33.3Neutral 20.7Opposed 15.5Very Opposed 9.4Don’t Know/Refused
1.7
Traffic management, such as controlling traffic flow and easing congestion N=594, MD=0 Scale Percentage (%) Very Supportive 18.4Supportive 38.7Neutral 22.6Opposed 13.5Very Opposed 5.6Don’t Know/Refused
1.3
Street repair and maintenance, including street cleaning and snow removal N=594, MD=0 Scale Percentage (%) Very Supportive 24.7Supportive 43.6Neutral 15.5Opposed 9.4Very Opposed 5.1Don’t Know/Refused
1.7
Access to walking and biking amenities in the city limits
N=594, MD=0 Scale Percentage (%) Very Supportive 14.8Supportive 31.8Neutral 25.3Opposed 17.3Very Opposed 8.9Don’t Know/Refused
1.9
P a g e | 25
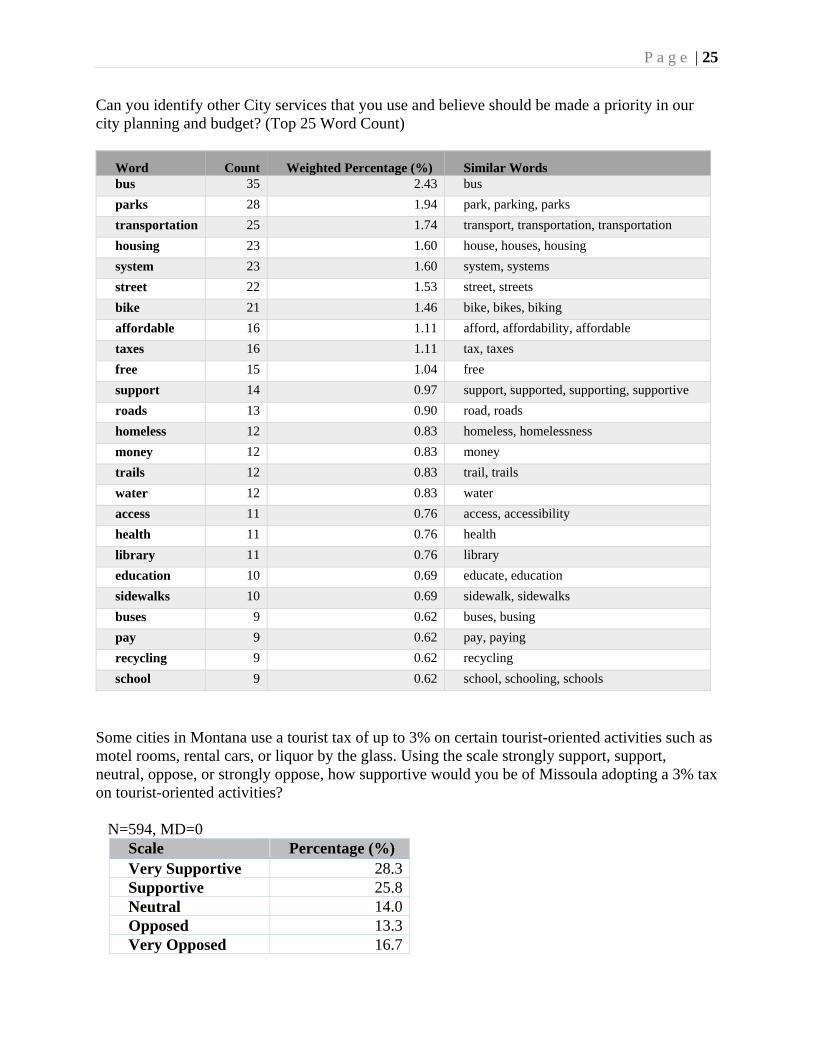
Can you identify other City services that you use and believe should be made a priority in our city planning and budget? (Top 25 Word Count)
Word Count Weighted Percentage (%) Similar Words bus 35 2.43 bus
parks 28 1.94 park, parking, parks
transportation 25 1.74 transport, transportation, transportation
housing 23 1.60 house, houses, housing
system 23 1.60 system, systems
street 22 1.53 street, streets
bike 21 1.46 bike, bikes, biking
affordable 16 1.11 afford, affordability, affordable
taxes 16 1.11 tax, taxes
free 15 1.04 free
support 14 0.97 support, supported, supporting, supportive
roads 13 0.90 road, roads
homeless 12 0.83 homeless, homelessness
money 12 0.83 money
trails 12 0.83 trail, trails
water 12 0.83 water
access 11 0.76 access, accessibility
health 11 0.76 health
library 11 0.76 library
education 10 0.69 educate, education
sidewalks 10 0.69 sidewalk, sidewalks
buses 9 0.62 buses, busing
pay 9 0.62 pay, paying
recycling 9 0.62 recycling
school 9 0.62 school, schooling, schools
Some cities in Montana use a tourist tax of up to 3% on certain tourist-oriented activities such as motel rooms, rental cars, or liquor by the glass. Using the scale strongly support, support, neutral, oppose, or strongly oppose, how supportive would you be of Missoula adopting a 3% tax on tourist-oriented activities?
N=594, MD=0
Scale Percentage (%) Very Supportive 28.3Supportive 25.8Neutral 14.0Opposed 13.3Very Opposed 16.7
P a g e | 26
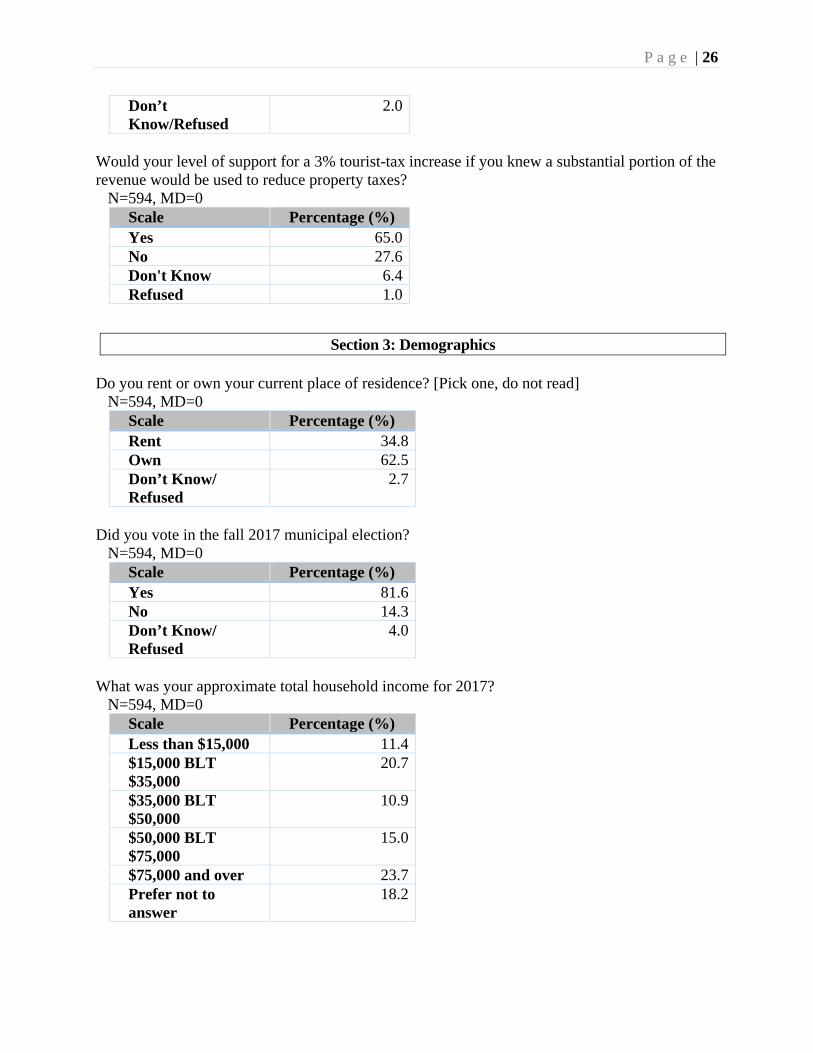
Don’t Know/Refused
2.0
Would your level of support for a 3% tourist-tax increase if you knew a substantial portion of the revenue would be used to reduce property taxes?
N=594, MD=0 Scale Percentage (%) Yes 65.0No 27.6Don't Know 6.4Refused 1.0
Section 3: Demographics Do you rent or own your current place of residence? [Pick one, do not read]
N=594, MD=0 Scale Percentage (%) Rent 34.8Own 62.5Don’t Know/ Refused
2.7
Did you vote in the fall 2017 municipal election?
N=594, MD=0 Scale Percentage (%) Yes 81.6No 14.3Don’t Know/ Refused
4.0
What was your approximate total household income for 2017?
N=594, MD=0 Scale Percentage (%) Less than $15,000 11.4$15,000 BLT $35,000
20.7
$35,000 BLT $50,000
10.9
$50,000 BLT $75,000
15.0
$75,000 and over 23.7Prefer not to answer
18.2

P a g e | 27
What is your current age? N=594, MD=0
Scale Percentage (%) 18 to 26 9.327 to 46 29.347 to 66 26.667 or Older 29.8Prefer not to answer
5.1
Which gender do you identify as? N=594, MD=0
Scale Percentage (%) Woman (Female) 47.3Man (Male) 48.5Gender Neutral .5Prefer not to answer
3.7