Embed Size (px)
Citation preview

UNAUDITED
ANNUAL FINANCIAL STATEMENTS
FOR THE YEAR ENDED 30 JUNE 2012
Auditor-General: 31 August 2012

City of Cape Town Auditor-General: 31 August 2012
Reporting Entity’s Mandate
1
Annual financial statements 2012
The City of Cape Town is a local authority established in terms of section 151 of the Constitution of the Republic
of South Africa (Act 108 of 1996).
The principal activities of the City are to:
provide democratic and accountable government to the local communities;
ensure sustainable service delivery to communities;
promote social and economic development;
promote a safe and healthy environment; and
encourage the involvement of communities and community organisations in the matters of local
government.
The City’s operations are governed by the Local Government: Municipal Finance Management Act (Act 56 of
2003), the Municipal Structures Act (Act 117 of 1998), the Municipal systems Act (Act 32 of 2000) and various
other acts and regulations.
Glossary of abbreviations
AG Auditor-General
ASB Accounting Standards Board
CBD Central Business District
CIDs City Improvement District
CMTF Cape Metropolitan Transport Fund
COID Compensation for Occupational Injuries and Diseases
CPI Consumer Price Index
CRR Capital Replacement Reserve
CTICC Cape Town International Convention Centre (Pty) Ltd
DB Defined Benefit
DBSA Development Bank of South Africa
DC Defined Contributions
DMTN Domestic Medium Term Note
DoRA Division of Revenue Act
DWA Department of Water Affairs
EFF External Finance Fund
FBE Free Basic Electricity
GRAP Generally Recognised Accounting Practice
IDP Integrated Development Plan
IFRS International Financial Reporting Standards
IRT Integrated Rapid Transport
JSE JSE Limited
MAYCO Mayoral Committee
MFMA Municipal Finance Management Act
MIG Municipal Infrastructure Grant
MOA Memorandum of Agreement
MPAC Municipal Public Accounts Committee
PAYE Pay As You Earn
PGWC Provincial Government Western Cape
PPE Property, Plant and Equipment
SALGA South African Local Government Association
SARS South African Revenue Service
SCM Supply Chain Management
SCMB Standard Corporate and Merchant Bank
UIF Unemployment Insurance Fund
VAT Value-added Tax

City of Cape Town Auditor-General: 31 August 2012
Contents and Approval of financial statements
2
Annual financial statements 2012
Report by the Auditor-General
General information
Report by the Chief Financial Officer
Financial statements and policy
Statement of financial position
Statement of financial performance
Statement of changes in net assets
Cash flow statement
Statement of comparison of budget and actual amounts
Accounting policies
Notes to the annual financial statements
Appendices
A Schedule of external loans
B Analysis of property, plant and equipment
C Segmental statement of financial performance
D Disclosure of grants and subsidies
n/a
4
n/a
12
13
14
15
16
17
25
65
66
67
68
Approval of financial statements
I am responsible for the preparation of these annual financial statements for the year ended 30 June 2012, as
set out on pages 12 to 72 in terms of section 126(1) of the Municipal Finance Management Act, and have
accordingly signed the statements on behalf of the City.
I certify that the salaries, allowances and benefits of councillors as disclosed in Note 30 to these annual
financial statements are within the upper limits of the framework envisaged in section 219 of the Constitution,
read with the Remuneration of Public Office Bearers Act (Act 20 of 1998) and the Minister of Provincial and
Local Government’s determination in accordance with this Act.
Achmat Ebrahim
City Manager Date: August 2012

City of Cape Town Auditor-General: 31 August 2012
General information
4
Annual financial statements 2012
Members of the Mayoral Committee
Alderman I.D. Neilson - Finance
Alderman J.P. Smith - Safety and Security Services
Alderman D.L. Qually - Corporate Services
Alderman V.M. Walker - Economic, Environment and Spatial planning
Councillor B.A. Cortje-Alcock - Social and Early Childhood Development
Councillor L.V. James - Health
Councillor T. Gqada - Community Services
Councillor B.N. Herron - Transport, Roads and Stormwater
Councillor G.I. Pascoe - Tourism, Events and Marketing
Councillor S. Sims - Utility Services
Councillor E.J. Sonnenberg - Housing
Members of the Audit Committee
Z. Manjra Chairperson
M.Y. Kajee Member
K. Moloko Member
M. Roos Member
M. Burton Member (term expired 31 March 2012)
Auditors
The Auditor-General
Business Connexion Building Private Bag X1
Ring Road, Century Boulevard Chempet
Century City 7442
7441
Registered office
12 Hertzog Boulevard PO Box 655
Cape Town Cape Town
8001 8000
Bankers
ABSA Bank
1st floor, Tijgerpark IV PO Box 4453
Willie van Schoor Drive Tyger Valley
Tyger Valley 7536
7530
City Manager Chief Financial Officer
Achmat Ebrahim Kevin Jacoby
Speaker
Alderman J.D. Smit
Chief Whip
Alderman A.M. Serritslev
Executive Mayor Alderman P de Lille
Executive Deputy Mayor Alderman I.D. Neilson

City of Cape Town Auditor-General: 31 August 2012
General information
5
Annual financial statements 2012
Council members of the City of Cape Town Councillor/Alderman
Abrahams, A.N. Green, A.M. Mamkeli, S. Purchase, F.
Abrahams, A. Griesel, A.J. Mangali, T. Qoba, Z.L.
Abrahams, F.L. Gwangxu, X. March, G.W. Qually, D.L.
Abrahams, M.M. Gympies, S.C. Marman, P.I. Rass, B.
Adams, A. Hadebe, B. Matanzima, V. Rau, R.
Adams, Y. Hansen, B. Matha, M.S. Raymond, F.H.L
America, D. Hassiem, W. Maxheke, J.J. Rossouw, S.J.
Amira, D. Haywood, M. Maxiti, P. Sakathi, T.
Andrews, E.P. Hebe, L.A. Mbandezi, S. Schäfer, B.A.
Andrews, J.A. Hendricks, M.G.E. Mbonde, M.E. Scheepers, C.J.
Anstey, E. Herron, B.N. McCarthy, J. Serritslev, A.M.
Arendse, M.T. Heuvel, J.A. Mfusi, V.N. Sikhakhane, N.
Arendse, R. Heynes, P.C. Mhlanga, C. Siljeur, G.R.
Arendse, S.W.P. Hinana, E.N. Middleton, J.H. Simons, R.S.
August, S.N. Honono, T.T. Mkutswana, M.A. Sims, S.
Badela, D.E. Hoosain, J. Mngxunyeni, P.M. Sitonga, M.C.
Bazier, R. Ipser, C.W. Mofoko, N.M. Slabbert, J.D.
Beneke, R. Isaacs, L.I. Morkel, K.H. Smit, J.D.
Bent, N.L. Isaacs, V.R. Moses, A.C. Smith, J.
Bew, C.B. Iversen, I. Moses, R.M. Sonnenberg, E.J.
Bloor, G.M. Jackson, I.R. Moshani, N.A. Sono, N.P.
Brady, W.E. Jacobs, B.M. Mphila, D. Sopaqa, M.M.
Bredenhand, J.C. Jacobs, J. Msindwana, M.E. Sotashe, X.
Brenner, H.I. Jaffer, L. Mxolose, W.S. Taylor, M.J.
Britz, M.T. Jaftha, W.D. Mzalisi, M.N. Thomas, C.R.
Brunette, E.N. James, L.V. Ndamase, T. Thomas, G.H.J.
Bryant, D.W. Janse van Rensburg, C. Ndongeni, A.X. Thompson, T.B.
Brynard, C.A. Jansen van Vuuren, M.I. Ndzulwana, N. Thuynsma, J.
Burger, J.H.H. Jefferies, I.K. Neilson, I.D. Timm, G.
Cavanagh, G.V. Jordaan, C. Nenzani, S.M. Toko, M.S.
Chapple, P.H. Jordaan, L.D. Ngqame, Y.A. Twigg, G.G.
Christians, D.J. Justus, C.R. Ngqose, N.S. Uys, T.A.
Christians, F.C. Kannenberg, A.C.K. Ngqu, P. Van Dalen, B.
Claasen, C.P.V. Kearns, F. Nguzo, M. Van der Merwe, B.
Clayton, C.C. Kempthorne, M.L. Nieuwoudt, M.J. Van der Merwe, C.G.
Cortje-Alcock, B.A. Khatshwa, D.M. Nikelo, M. Van der Merwe, J.F.H.
Cottee, D.G. Kleinsmith, M.E. Nkohla, L. Van der Rheede, A.
Crous, A.C. Komeni, A.L. Nkunzana, F.M. Van der Walt, M.L.
D’Alton, D.J. Kopman, N.F. Nonkeyizana, S. Van Minnen, B.M.
Davids, M.M. Krynauw, J. Notana, E. Van Wyk, C.H.S.
De Lille, P. Landingwe, N.J. Nqavashe, M.L. Velem, M.
Diamond, S.P. Lategan, K.H. Nqulwana, M. Venter, J.D.
Dudley, D.K. Le Roux, B. Ntotoviyane, C. Viljoen, R.
Dyantyi, V.D. Leputhing, C.N. Nyakatya, N.C. Visser, J.
East, P.A. Liell-Cock, S.P. O’Connell, R.A. Vos, J.
Ehrenreich, A.J. Lili, A. Oliver, M.J. Vuba, S.T.
Elese, D. Limberg, X.T. Pakela-Mapasa, X.B. Walker, V.M.
Esau, C.J. Little, S.A. Pascoe, G.I. Watkyns, B.R.W.
Fourie, A. Mabandla, M. Peter, X.G. Weavers, M.
Fourie, G.D. Maci, L. Petersen, M.J. Williams, A.
Francke, P. Mack, C.J. Philander, S. Yalezo, S.
Gabier, A. Makanda, M.N. Pienaar, S. Yozi, S.K.
Gabriel, P.J. Makasi, N. Pietersen, M.P. Zondani, L.G.
Gabuza, A. Makeleni, K. Pretorius, I.J.
Gqada, T. Makeleni, L.C. Pringle, S.B.
Gqola, T.L. Mamba, K.C. Pupa, T.

City of Cape Town Auditor-General: 31 August 2012
as at 30 June 2012 Statement of Financial Position
12
Annual financial statements 2012
2012
R'000
2011
R'000
Note Restated ¹
ASSETS
Non-current assets 24 772 497 21 882 359
Property, plant and equipment 1 24 217 257 21 474 791
Heritage assets 2 12 742 11 914
Investment property 3 192 478 84 999
Intangible assets 4 100 432 44 884
Investments 6 150 260 150 245
Long-term receivables 7 99 328 115 526
Current assets 10 767 076 9 455 791
Assets classified as held-for-sale 5 43 126
Inventory 8 253 008 235 249
Receivables 9 3 979 256 3 709 111
Receivables from exchange transactions 2 756 953 2 454 401
Receivables from non-exchange transactions 1 222 303 1 254 710
Other receivables 10 303 792 194 259
Other receivables from exchange transactions 145 955 86 804
Other receivables from non-exchange transactions 157 837 107 455
Investments 6 2 883 387 2 146 596
Current portion of long-term receivables 7 19 758 19 193
Cash and cash equivalents 11 3 327 832 3 151 257
TOTAL ASSETS 35 539 573 31 338 150
LIABILITIES
Non-current liabilities 9 252 622 8 856 173
Borrowings 12 5 176 421 5 343 836
Provisions 13 4 076 201 3 512 337
Current liabilities 7 101 568 5 794 481
Deposits 14 274 944 233 492
Provisions 15 1 025 777 767 671
Payables from exchange transactions 16 3 783 153 3 321 917
Unspent conditional grants and receipts 17 1 665 752 1 108 680
Value added tax 18 57 756 57 368
Current portion of borrowings 12 294 186 305 353
Total liabilities 16 354 190 14 650 654
NET ASSETS
Total net assets 19 185 383 16 687 496
Housing development fund 19 521 463 539 070
Reserves 20 1 770 255 1 771 534
Accumulated surplus 21 16 893 665 14 376 892
TOTAL NET ASSETS AND LIABILITIES 35 539 573 31 338 150
1. See note 45 for more details.

City of Cape Town Auditor-General: 31 August 2012
for the year ended 30 June 2012 Statement of Financial Performance
13
Annual financial statements 2012
Actual
2012
R'000
2011
R'000
2012
R'000
2011
R'000
Restated Note Restated ¹
REVENUE
13 196 756 11 888 638 Exchange revenue 13 280 174 11 471 709
12 081 851 10 599 456 Service charges 22 11 986 765 10 359 727
263 608 250 087 Rental of letting stock and facilities 23 287 579 250 316
410 761 421 260 Finance income 24 561 761 522 070
30 046 28 764 Licences and permits 41 471 37 645
115 993 115 993 Agency services 123 651 115 991
209 497 179 111 Other income 25 234 803 165 380
85 000 293 967 Gains on disposal of property, plant and equipment 44 144 20 580
10 691 041 9 366 185 Non-exchange revenue 10 404 464 9 004 966
89 508 81 411 City Improvement Districts (CIDs) 25 89 508 81 409
4 697 744 4 286 860 Property rates 26 4 712 098 4 529 932
1 637 276 1 510 960 Fuel levy 1 637 276 1 510 960
172 963 174 769 Fines 144 394 166 476
4 009 151 3 223 901 Government grants and subsidies 27 3 757 835 2 636 469
84 399 88 284 Public contributions 28 63 353 79 720
23 887 797 21 254 823 Total revenue 23 684 638 20 476 675
EXPENDITURE
7 003 138 6 315 573 Employee-related costs 29 6 887 104 6 120 233
108 786 92 296 Remuneration of councillors 30 97 772 88 621
1 056 384 1 003 873 Impairment costs 31 845 842 783 092
170 729 188 693 Collection costs 166 380 174 755
1 360 823 1 227 258 Depreciation and amortisation expense 32 1 372 096 1 262 100
766 367 780 723 Finance costs 33 681 533 717 475
5 697 676 4 656 592 Bulk purchases 34 5 705 263 4 620 165
2 289 083 1 922 816 Contracted services 2 193 662 2 010 269
106 248 96 240 Grants and subsidies paid 35 103 492 93 382
3 109 268 3 187 502 General expenses 36 3 131 883 2 771 349
- - Losses on disposal of property, plant and equipment 1 724 3 529
21 668 502 19 471 566 Total expenditure ² 21 186 751 18 644 970
2 219 295 1 783 257 Surplus from operations 2 497 887 1 831 705
2 219 295 1 783 257 SURPLUS FOR THE YEAR 2 497 887 1 831 705
1. See note 45 for more details.
Budget
2. Includes the repair and maintenance amount of R1,89 billon (2011: R1,71 billion).

City of Cape Town Auditor-General: 31 August 2012
for the year ended 30 June 2012 Statement of Changes in Net Assets
14
Annual financial statements 2012
Housing
development
fund
Capital
replacement
reserve
Self-
insurance
reserve
Accumulated
surplus Total
R'000 R'000 R'000 R'000 R'000
2011
Balance at 30 June 2010 531 472 1 180 916 658 175 12 485 228 14 855 791
Restated surplus at 1 July 2010 ¹ 1 831 705 1 831 705
Surplus at 30 June 2011 - previously reported - - - 1 732 182 -
Correction of errors - - - 99 523 -
Transfer to/(from) 30 453 570 495 (73 012) (527 936) -
Property, plant and equipment purchased (22 855) (565 040) - 587 895 -
Balance at 30 June 2011 539 070 1 186 371 585 163 14 376 892 16 687 496
2012
Surplus for the year - - - 2 497 887 2 497 887
Transfer to/(from) (9 088) 818 572 (88 981) (720 503) -
Property, plant and equipment purchased (8 519) (730 870) - 739 389 -
Balance at 30 June 2012 521 463 1 274 073 496 182 16 893 665 19 185 383
1. See note 45 for more details.

City of Cape Town Auditor-General: 31 August 2012
for the year ended 30 June 2012 Cash Flow Statement
15
Annual financial statements 2012
2012 2011
R'000 R'000
Note Restated ¹
CASH FLOW FROM OPERATING ACTIVITIES
Cash receipts from ratepayers, government and other 22 435 565 19 018 393
Cash paid to suppliers and employees (17 019 721) (15 160 258)
Cash generated from operations 37 5 415 844 3 858 135
Finance income 563 873 503 857
Finance costs (661 761) (709 193)
NET CASH FROM OPERATING ACTIVITIES 5 317 956 3 652 799
CASH FLOW FROM INVESTING ACTIVITIES
Additions to property, plant and equipment (4 309 372) (2 857 761)
Proceeds on disposal of property, plant and equipment and intangible assets 45 983 63 278
Decrease/(Increase) in assets held-for-sale 83 (60)
Decrease in non-current receivables 15 633 1 819
(Increase) in investments (736 806) (1 962 720)
NET CASH FROM INVESTING ACTIVITIES (4 984 479) (4 755 444)
CASH FLOW FROM FINANCING ACTIVITIES
New loans raised - -
Loans repaid (198 354) (261 609)
Increase in deposits 41 452 4 332
NET CASH FROM FINANCING ACTIVITIES (156 902) ( 257 277)
NET INCREASE/(DECREASE) IN CASH AND CASH EQUIVALENTS 38 176 575 (1 359 922)
Cash and cash equivalents at the beginning of the year 3 151 257 4 511 179
Cash and cash equivalents at the end of the year 3 327 832 3 151 257
1. See note 45 for more details.

City of Cape Town Auditor-General: 31 August 2012
for the year ended 30 June 2012 Statement of comparison of budget and actual amounts
16
Annual financial statements 2012
Note Actual
Approved
budget Final budget
Variance:
Final budget and
actual amounts Variance
R'000 R'000 R'000 R'000 %
STATEMENT OF FINANCIAL POSITION 40.2.1
Total non-current assets 24 772 497 27 199 565 25 328 852 556 355 2,20
Total current assets i 10 767 076 7 664 200 6 916 319 (3 850 757) (55,68)
Total Assets 35 539 573 34 863 765 32 245 171 (3 294 402) (10,22)
Total non-current liabilities 9 252 622 10 488 998 9 085 680 (166 942) (1,84)
Total current liabilities ii 7 101 568 5 282 869 4 248 021 (2 853 547) (67,17)
Total Liabilities 16 354 190 15 771 867 13 333 701 (3 020 489) (22,65)
Total net assets 19 185 383 19 091 898 18 911 470 (273 913) (1,45)
Total net assets and liabilities 35 539 573 34 863 765 32 245 171 (3 294 402) (10,22)
STATEMENT OF FINANCIAL PERFORMANCE 40.2.2
Service charges 11 986 765 12 390 658 12 081 851 95 086 0,79
Rental of letting stock and facilities i 287 579 264 043 263 608 (23 971) (9,09)
Finance income ii 561 761 410 761 410 761 (151 000) (36,76)
Licences and permits iii 41 471 30 046 30 046 (11 425) (38,03)
Agency services iv 123 651 115 993 115 993 (7 658) (6,60)
Other income v 324 311 275 006 299 005 (25 306) (8,46)
Property rates 4 712 098 4 667 744 4 697 744 (14 354) (0,31)
Fuel levy 1 637 276 1 637 276 1 637 276 - -
Fines vi 144 394 186 892 172 963 28 569 16,52
Government grants and subsidies vii 3 757 835 4 539 536 4 009 151 251 316 6,27
Public contributions viii 63 353 73 639 84 399 21 046 24,94
Gains on disposal of property, plant and equipment ix 44 144 105 000 85 000 40 856 48,07
Total revenue 23 684 638 24 696 594 23 887 797 203 159 0,85
#DIV/0!Employee-related costs 6 887 104 7 091 648 7 003 138 116 034 1,66
Remuneration of councillors i 97 772 108 786 108 786 11 014 10,12
Impairment costs ii 845 842 1 071 970 1 056 384 210 542 19,93
Collection costs 166 380 201 229 170 729 4 349 2,55
Depreciation and amortisation expense 1 372 096 1 360 823 1 360 823 (11 273) (0,83)
Finance costs iii 681 533 766 367 766 367 84 834 11,07
Bulk purchases 5 705 263 5 785 576 5 697 676 (7 587) (0,13)
Contracted services 2 193 662 2 320 168 2 289 083 95 421 4,17
Grants and subsidies paid 103 492 96 419 106 248 2 756 2,59
General expenses 3 131 883 3 338 889 3 109 268 (22 615) (0,73)
Losses on disposal of property, plant and equipment 1 724 - - (1 724) -
Total expenditure 21 186 751 22 141 875 21 668 502 481 751 2,22
#DIV/0!Net surplus for the year 2 497 887 2 554 719 2 219 295 (278 592) (12,55)
CASH FLOW STATEMENT 40.2.3
Net cash from (used) operating i 5 317 956 4 187 458 2 211 783 (3 106 173) (140,44)
Net cash from (used) investing ii (4 984 479) (5 171 557) (2 646 102) 2 338 377 (88,37)
Net cash from (used) financing iii (156 902) 1 325 535 (180 184) (23 282) 12,92
Net (Decrease)/Increase in cash and cash equivalents 176 575 341 436 (614 503) (791 078) 128,73
CAPITAL EXPENDITURE 40.2.4
City Health 22 801 24 848 22 972 171 0,74
City Manager i 122 422 142 20 14,08
Community Services 162 772 136 857 168 893 6 121 3,62
Corporate Services 204 771 205 871 211 269 6 498 3,08
Deputy City Manager ii 13 962 24 419 16 945 2 983 17,60
Economic, Environment and Spatial Planning iii 36 727 52 694 42 841 6 114 14,27
Finance 119 902 155 232 120 821 919 0,76
Safety and Security 67 079 41 101 68 175 1 096 1,61
Social and Early Childhood Development iv 9 446 11 350 12 330 2 884 23,39
Tourism, Events and Marketing v 62 875 54 779 72 695 9 820 13,51
Transport, Roads and Stormwater vi 1 280 796 1 824 558 1 430 884 150 088 10,49
Human Settlements vii 490 725 751 081 553 787 63 062 11,39
Waste Management 229 903 284 271 230 653 750 0,33
Water and wastewater management viii 605 156 691 214 643 257 38 101 5,92
Electricity 926 208 831 170 965 548 39 340 4,07
TOTAL ¹ 4 233 245 5 089 867 4 561 212 327 967 7,19
1. The Actual amount does not include the contributed assets amount of R76,13 million. See Appendix B.

City of Cape Town Auditor-General: 31 August 2012
for the year ended 30 June 2012 Notes to the financial statements
17
Annual financial statements 2012
ACCOUNTING POLICIES
GENERAL INFORMATION
The address of the City of Cape Town’s registered office and
principal place of business is disclosed under “General
information” while the Entity’s principal activities are
described in the introduction to the annual financial
statements.
SUMMARY OF SIGNIFICANT ACCOUNTING POLICIES
The City of Cape Town’s principal accounting policies, which
are in all material respects consistent with those applied in the
previous year, except as stated in note 45 are set out below.
The historical cost convention has been used, except where
indicated otherwise. Management has used assessments and
estimates in preparing the annual financial statements – these
are based on the best information available at the time of
preparation. The financial statements have been prepared
on a going-concern basis.
Basis of presentation
The financial statements have been prepared in accordance
with the standards of generally recognised sccounting
practice (GRAP), issued by the Accounting Standards Board
(ASB) and approved by the Minister of Finance as effective.
The ASB has issued a directive that sets out the principles for
the application of the GRAP 3 guidelines in determining the
GRAP Reporting Framework hierarchy, as set out in the
“Standard of GRAP 3 on Accounting Policies, Changes in
Accounting Estimates and Errors”.
In the process of applying the City’s accounting policies,
management has made the following significant accounting
judgements, estimates and assumptions, which have the most
significant effect on the amounts recognised in the financial
statements:
Operating lease commitments – City as lessor
Leases where risks and rewards of ownership are not
transferred to the lessee are classified as operating leases.
Payments received under operating leases are recognised in
the statement of financial performance on a straight-line basis
over the period of the lease.
Pension and other post-employment benefits
The cost of defined-benefit pension plans and other
employment medical benefits is determined using actuarial
valuations. The actuarial valuation involves making
assumptions about discount rates, expected rates of return on
assets, future salary increases, mortality rates and future
pension increases. Due to the long-term nature of these plans,
such estimates are subject to significant uncertainty.
Impairment of receivables
The calculation in respect of the impairment of debtors is
based on an assessment of the extent to which debtors have
defaulted on payments already due, and an assessment of
their ability to make payments. This was performed per
service-identifiable categories across all debtor classes.
Impairment of property, plant and equipment
The calculation in respect of the impairment of property,
plant and equipment is based on an assessment of the extent
to which the recoverable amount of the asset has declined
below the carrying amount. This was performed across all
classes of property, plant and equipment.
Provisions and contingent liabilities
Management’s judgement is required when recognising and
measuring provisions, and when measuring contingent
liabilities, as set out in note 13 and 47.2 respectively. Provisions
are discounted where the effect of discounting is material,
using actuarial valuations.
Useful lives of property, plant and equipment
The useful lives of assets are based on management’s
estimates. Management considers the impact of technology,
service requirements, and required return on assets to
determine the optimum useful-life expectation, where
appropriate. The estimate of residual values of assets is also
based on management’s judgement on whether the assets
will be sold or used to the end of their useful lives, and what
their condition will be at that time.
Budget information
Deviations between budget and actual amounts are
regarded as material differences when a 5% deviation exists.
All material differences are explained in the notes to the
annual financial statements.
Adoption of new and revised standards
In the current year, the City has adopted all new and revised
standards and interpretations issued by the ASB that are
relevant to its operations, and are effective. The adoption of
these new and revised standards and interpretations has
resulted in changes to the accounting policies.
The City has not adopted any GRAP standard that is not yet
effective, but has based its accounting policies on such
standards. Effective dates have been given for some of the
standards while for others, no effective dates have yet been
determined. At the date of submission of these financial
statements for the year ended 30 June 2012, the following
standards had been issued but were not yet effective:
• Annual periods commencing on or after 1 April 2012:
GRAP 21 - Impairment of non-cash-generating assets
GRAP 23 - Revenue from non-exchange transactions
(taxes and transfers)
GRAP 24 - Presentation of budget information
GRAP 26 - Impairment of cash-generating assets
GRAP 103 - Heritage assets
GRAP 104 - Financial instruments
• Annual periods commencing on or after 1 April 2013:
GRAP 25 - Employee benefits
• No effective dates provided yet:
GRAP 18 - Segment reporting
GRAP 20 - Related party disclosures (revised)
GRAP 105 - Transfers of functions between entities
under common control
GRAP 106 - Transfers of functions between entities not
under common control
GRAP 107 - Mergers
All the above standards, where applicable, will be complied
with in the financial statements once the standards take
effect. Preliminary investigations indicated that the impact of
the standards on the financial statements will be minimal.

City of Cape Town Auditor-General: 31 August 2012
for the year ended 30 June 2012 Notes to the financial statements
18
Annual financial statements 2012
HOUSING FUNDS
The Housing Development Fund was established in terms of
the Housing Act (Act 107 of 1997).
Housing Development Fund
Sections 15(5) and 16 of the Housing Act, which came into
effect on 1 April 1998, required the City to maintain a
separate housing operating account. This legislated separate
operating account is known as the Housing Development
Fund and is fully cash-backed.
The Housing Act also requires in terms of section
14(4)(d)(ii)(aa), read with inter alia section 16(2), the Housing
Act that the net proceeds of any letting, sale or alienation of
property, previously financed from government housing funds,
be paid into a separate operating account, and be utilised
by the City for housing development in accordance with the
National Housing Policy.
Unrealised housing proceeds
In order to comply with section 14(4)(d)(i) and (ii) of the
Housing Act, in terms of which all net proceeds need to be
paid into the Housing Development Fund, it was necessary to
create a holding account that represents the unrealised funds
due by long-term housing selling developments and
sponsored loan debtors. This account is reduced when
debtors are billed for their current loan repayments.
RESERVES
The City creates and maintains reserves in terms of specific
requirements.
Capital replacement reserve (CRR)
In order to finance the provision of infrastructure and other
property, plant and equipment from internal sources,
amounts are transferred from the accumulated surplus to the
CRR.
The following provisions are set for the creation and utilisation
of the CRR:
The cash funds that back up the CRR are invested until
utilised.
The CRR may only be utilised for the purpose of
purchasing items of property, plant and equipment, and
may not be used for the maintenance of these items.
Whenever an asset is purchased out of the CRR, an
amount equal to the cost price of the asset is transferred
from the CRR, and the accumulated surplus is credited by
a corresponding amount.
Insurance reserve
• Self-insurance reserve
A general insurance reserve has been established and,
subject to reinsurance where deemed necessary, it covers
claims that may occur. Premiums are charged to the
respective services, taking into account claims history and
replacement value of the insured assets.
Reinsurance premiums paid to external reinsurers are
regarded as an expense, and are shown as such in the
statement of financial performance. The net surplus/deficit
on the insurance operating account is transferred to or from
the insurance reserve via the statement of changes in net
assets.
An actuarial valuation is obtained each year to assess the
adequacy of the insurance reserve at year-end.
• Compensation for occupational injuries and diseases
(COID) reserve
The City has been exempted from making contributions to the
Compensation Commissioner for occupational injuries and
diseases in terms of Section 84 of the COID Act (Act 130 of
1993).
The certificate of exemption issued by the Commissioner, and
as prescribed by the COID, requires the City to deposit cash
and/or securities with the Commissioner, the market values of
which in aggregate shall not be less than the capitalised
value of the continuing liability of the City as at 31 December
of each year.
The continuing liability is that of annual pensions, the
capitalised value of which is determined on the basis of an
actuarial determination prescribed by the Commissioner. A
COID reserve has been established to equate to the value of
the continuing liability. The market value of the securities is
determined annually by the Commissioner, and the City is
required to meet any shortfall in the aggregate value of the
securities as at 31 December. Monthly pensions are funded by
transferring funds from the reserve to the expense account in
the statement of financial performance.
PROPERTY, PLANT AND EQUIPMENT
Property, plant and equipment are stated at cost less
accumulated depreciation and accumulated impairment
losses. Where property, plant and equipment are acquired
through non-exchange transactions, its cost is deemed to be
its fair value on the date of acquisition.
Subsequent expenditure relating to property, plant and
equipment is capitalised if it is probable that future economic
benefits or potential service delivery of the assets are
enhanced in excess of the originally assessed standard of
performance. If expenditure only restores the originally
assessed standard of performance, it is regarded as repairs
and maintenance, and is expensed.
The City maintains and acquires assets to provide a social
service to the community, with no intention of disposing of the
assets for any economic gain, and thus no residual values are
determined other than for vehicles.
The gain or loss arising from the disposal or retirement of an
item of property, plant and equipment is determined as the
difference between the sales proceeds and the carrying
value, and is recognised in the statement of financial
performance.

City of Cape Town Auditor-General: 31 August 2012
for the year ended 30 June 2012 Notes to the financial statements
19
Annual financial statements 2012
Depreciation rates
Depreciation is calculated at cost, using the straight-line
method over the estimated useful lives of the assets. The
residual value, depreciation method and useful life, if not
insignificant, are reassessed annually, with the effect of any
changes in estimate accounted for on a prospective basis.
The depreciation rates are based on the following estimated
useful lives:
Years Years
Infrastructure Other
Roads and paving 10-50 Buildings 20-50
Electricity 20-30 Specialise vehicles 8-20
Water 15-30 Other vehicles 5-10
Sewerage 15-20 Office equipment 4-10
Housing 30 Furniture and fittings 10
Watercraft 5
Community Bins and containers 5
Recreational
facilities 20-30 Plant and equipment 5
Security 5-10 Landfill sites 30
Central processing
units 4
Library books 1
Assets under construction are carried at cost. Depreciation of
an asset commences when the asset is ready for its use as
intended by management. Freehold land is not depreciable
as it has an indefinite useful life. Assets held under finance
leases are depreciated over their expected useful lives on the
same basis as owned assets, or, where appropriate, the term
of the relevant lease, and are recognised in the statement of
financial performance.
HERITAGE ASSETS
A heritage asset is defined as an asset that has a cultural,
environmental, historical, natural, scientific, technological or
artistic significance and is held and preserved indefinitely for
the benefit of present and future generations.
A heritage asset that qualifies for recognition as an asset shall
be measured at its cost. Where a heritage asset is acquired
through a non-exchange transaction, its cost is deemed to be
its fair value as at the date of acquisition.
Heritage assets are not depreciated, since their long
economic life and high residual value mean that any
depreciation would be immaterial.
INVESTMENT PROPERTIES
Investment properties are held to earn rental income, and/or
for capital appreciation, and are stated at cost less
accumulated depreciation and accumulated impairment
losses. Investment property excludes owner-occupied
property that is used in the production or supply of goods or
services, or for administrative purposes, or property held to
provide a social service.
Investment property other than vacant land is depreciated
on the straight-line basis over the useful lives of the assets,
estimated at 20 to 50 years.
An investment property is derecognised upon disposal, or
when it is permanently withdrawn from use and no future
economic benefits or service potential are expected from its
disposal. Any gain or loss arising from the retirement or
disposal of investment property is included surplus or deficit in
the period of the retirement or disposal.
INTANGIBLE ASSETS
An intangible asset is defined as an identifiable non-monetary
asset without physical substance, held for use in the
production or supply of goods or services, for rental to others,
or for administrative purposes.
The City recognises computer development software costs as
intangible assets if the costs are clearly associated with an
identifiable and unique system controlled by the City, and
have a probable benefit exceeding one year. Direct costs
include software development employee costs and an
appropriate portion of relevant overheads.
Direct computer software development costs recognised as
assets are amortised on the straight-line basis over the useful
lives of the assets, estimated at three to five years.
NON-CURRENT ASSETS HELD-FOR-SALE
Non-current assets and disposal groups are classified as held-
for-sale if their carrying amount will be recovered principally
through a sale transaction rather than through continuing use.
This condition is regarded as met only when the sale is highly
probable, and the asset (or disposal group) is available for
immediate sale in its present condition. Management must
be committed to a plan to sell the asset, and the sale should
be expected to qualify for recognition as a complete sale
within one year from the date of classification.
An entity that is committed to a sales plan involving the loss of
control in a controlled entity shall classify all the assets and
liabilities of that controlled entity as held for sale when the
criteria described above are met.
Non-current assets and disposal groups classified as held for
sale will ceased to be classified as such when the recognition
criteria is no longer met.
Assets classified as held-for-sale are measured at the lower of
the asset’s carrying amount or fair value less cost to sell.
IMPAIRMENT OF CASH AND NON-CASH-GENERATING ASSETS
The entity classifies all assets held with the primary objective of
generating a commercial return as cash-generating assets.
All other assets are classified as non-cash-generating assets.
At the end of each reporting period, carrying amounts of
cash-generating and non-cash-generating assets are
reviewed to determine whether there is any indication of
impairment. If any such indication exists, the recoverable
amount or recoverable service amount of the asset is
estimated in order to determine the extent of the impairment
loss (if any).
Where it is not possible to estimate the recoverable amount of
an individual cash-generating asset, the Entity estimates the
recoverable amount of the cash-generating unit to which the
asset belongs. Cash-generating units shall be identified
consistently from period to period for the same asset or types
of assets, unless a change is justified.

City of Cape Town Auditor-General: 31 August 2012
for the year ended 30 June 2012 Notes to the financial statements
20
Annual financial statements 2012
Intangible assets with indefinite useful lives as well as
intangible assets not yet available for use are tested for
impairment annually, at the same time every year as well as
whenever there is an indication that the asset may be
impaired.
The recoverable amount of a cash-generating asset is the
higher of fair value less costs to sell and value in use. The
value in use is the present value of the estimated future cash
flows expected to be derived from the continuing use of an
asset and from its disposal at the end of its useful life.
The recoverable service amount of a non-cash-generating
asset is the higher of fair value less costs to sell and value in
use. The value in use is the present value of the remaining
service potential of the asset, and is determined using the
most appropriate of the depreciated replacement cost,
restoration cost or service units approach.
The discount rate used reflects current market assessments of
the time value of money and the risks specific to the asset for
which the estimates of future cash flows have not been
adjusted.
If the recoverable amount or recoverable service amount of
an asset is estimated to be less than its carrying amount, the
carrying amount of the asset is reduced to its recoverable
amount or recoverable service amount. An impairment loss is
recognised immediately in surplus or deficit.
Where an impairment loss subsequently reverses, the carrying
amount of the asset is increased to the revised estimate of its
recoverable amount or recoverable service amount, but so
that the increased carrying amount does not exceed the
carrying amount that would have been determined had no
impairment loss been recognised for the asset in prior years. A
reversal of an impairment loss is recognised immediately in
profit or loss.
CASH AND CASH EQUIVALENTS
Cash includes cash on hand, cash with banks, and call
deposits. Cash equivalents are short-term bank deposits with
a maturity of three months or less from inception, readily
convertible to cash without significant change in value.
For the purposes of the cash flow statement, cash and cash
equivalents consist of cash and cash equivalents as defined
above, net of any bank overdrafts.
INVENTORIES
Inventories consist of raw materials, work in progress,
consumables and finished goods that are valued at the lower
of cost (determined on the weighted-average basis) and net
realisable value, except for plants and compost, which are
valued at the tariffs charged. Where they are held for
distribution or consumption at no charge or for a nominal
amount, inventories are valued at the lower of cost and
current replacement value.
Cost of inventories comprises all costs of purchase, costs of
conversion, and other costs incurred in bringing the
inventories to their present location and condition.
Redundant and slow-moving inventories are identified and
written down to their estimated net realisable values, and are
recognised as an expense in the period in which the write-
down or loss occurs. Consumables are written down
according to their age, condition and utility.
VALUE-ADDED TAX
The City accounts for value-added tax on the payment basis.
GRANTS AND RECEIPTS
Income received from conditional grants, donations and
subsidies is recognised in so far as the City has complied with
any of the criteria, conditions or obligations embodied in the
applicable agreement. In so far as the criteria, conditions or
obligations have not been met, a liability is recognised and
should the funds committed for future use, that such funds be
repaid.
Interest earned on the investment is treated in accordance
with grant conditions.
Unconditional grants are immediately recognised as revenue.
Grants and receipts of a revenue nature
Income is transferred to the statement of financial
performance as revenue to the extent that the criteria,
conditions or obligations have been met.
Grants and receipts of a capital nature
Income is transferred to the statement of financial
performance to the extent that the criteria, conditions or
obligations have been met.
PROVISIONS
A provision is recognised when the City has a present legal or
constructive obligation as a result of a past event, and it is
probable that an outflow of resources embodying economic
benefits or service potential will be required to settle the
obligation, and can be reliably estimated the amount of the
obligation.
When the effect of discounting is material, provisions are
determined by discounting the expected future cash flows
that reflect current market assessments of the time value of
money.
ENVIRONMENTAL REHABILITATION PROVISIONS
Estimated long-term environmental provisions, comprising
rehabilitation and landfill site closure, are based on the City’s
policy, taking into account current technological,
environmental and regulatory requirements.
The provision for rehabilitation is recognised as and when the
environmental liability arises. In so far as the obligations relate
to the asset, they are capitalised as part of the cost of those
assets. Any unwinding of discount is charged to the
statement of financial performance. The discount rate has
not been risk adjusted.
EMPLOYEE BENEFITS
Retirement benefit plans
The City provides retirement benefits for its employees and
councillors. Defined-contribution plans are post-employment
benefit plans, under which an entity pays fixed contributions
into a separate entity (a fund), and will have no legal or
constructive obligation to pay further contributions if the fund
does not hold sufficient assets to pay all employee benefits
relating to employee service in the current and prior periods.
The contributions to fund obligations for the payment of
retirement benefits are charged against income in the year in
which they become payable.

City of Cape Town Auditor-General: 31 August 2012
for the year ended 30 June 2012 Notes to the financial statements
21
Annual financial statements 2012
Defined-benefit plans are post-employment benefit plans
other than defined contribution plans. The defined-benefit
funds are actuarially valued tri-annually on the projected unit
credit method basis. Deficits identified are recovered through
lump sum payments or increased future contributions on a
proportional basis to all participating municipalities. The
contributions and lump sum payments are charged against
income in the year in which they become payable.
Post-retirement pension funds
Pension contributions in respect of employees who were not
members of a pension fund are recognised as an expense
when incurred. Staff provident funds are maintained to
accommodate personnel who, due to age, cannot join or be
part of the various pension funds. The City contributes
monthly to the funds.
These contributions are charged to the operating account
when employees have rendered the service entitling them to
the contributions. Actuarial valuation of the liability is
performed on an annual basis. The projected unit credit
method has been used to value the obligations.
The liability in respect of current pensioners is regarded as fully
accrued, and is therefore not split between a past (or
accrued) and future in-service element. The liability is
recognised at the fair value of the obligation, together with
adjustments for the actuarial gains and losses, and past
service costs.
Actuarial gains or losses are fully accounted for in the
statement of financial performance in the year they occur.
Medical aid: Continued members
The City provides post-retirement benefits by subsidising the
medical aid contributions of certain retired staff. According
to the rules of the medical aid funds with which the City is
associated, a member on retirement is entitled to remain a
continued member of such medical aid fund, and the City will
continue to subsidise medical contributions in accordance
with the provisions of the employee’s employment contract
and the City’s decision on protected rights. Post-retirement
medical contributions paid by the City, and depending on
the employee’s contract, could be 60%, 70% or a subsidy
indicated on a sliding-scale. In each case, the employee is
responsible for the balance of post-retirement medical
contributions. External appointments after December 2000
do not qualify for a post-retirement medical aid subsidy
These contributions are charged to the operating account
when employees have rendered the service entitling them to
the contribution.
The liability in respect of current pensioners is regarded as fully
accrued, and is therefore not split between a past (or
accrued) and future in-service element. The liability is
recognised at the fair value of the obligation, together with
adjustments for the actuarial gains and losses, and past
service costs.
Actuarial gains or losses are fully accounted for in the
statement of financial statements in full in the year they occur.
The projected unit credit method has been used to value the
obligation.
Short-term and long-term employee benefits
The cost of all short-term employee benefits, such as leave
pay, is recognised during the period in which the employee
renders the related service. The City recognises the expected
cost of performance bonuses only when the City has a
present legal or constructive obligation to make such
payment, and a reliable estimate can be made.
The City provides long-term incentives to eligible employees,
payable on completion of years of employment. The City’s
liability is based on an actuarial valuation. The projected unit
credit method has been used to value the obligation.
Actuarial gains and losses on the long-term incentives are fully
accounted for in the statement of financial performance.
REVENUE RECOGNITION
Revenue is recognised net of indirect taxes, rebates and
trade discounts, and consists primarily of rates, grants from
National and Provincial Government, service charges, rentals,
interest received and other services rendered. Revenue is
recognised when it is probable that future economic benefits
or services potential will flow to the City, and these benefits
can be reliably measured. Revenue arising from the
application of the approved tariff charges is recognised when
the relevant service is rendered by applying the relevant
authorised tariff. This includes the issuing of licences and
permits.
Revenue from exchange transactions
Service charges relating to solid waste, sanitation and
sewerage are levied in terms of the approved tariffs.
Service charges relating to electricity and water are
based on consumption. Meters are read on a periodic
basis, and revenue is recognised providing that the
benefits can be measured reliably. Estimates of
consumption are made every other month based on
consumption history. Such estimated consumption is
recognised as income when invoiced, and adjusted every
following month that the meter is read. An accrual on the
basis of a determined consumption factor is made for
consumption not measured as at the end of the financial
year.
Services provided on a prepayment basis are recognised
at the point of sale. An adjustment for an unutilised
portion is made at year-end, based on the average
consumption history.
Income in respect of housing rental and instalment sale
agreements is accrued monthly.
Interest earned on investments is recognised in the
statement of financial performance on a time
proportionate basis, which takes into account the
effective yield on the investment. Interest may be
transferred from the accumulated surplus to the Housing
Development Fund or the insurance reserve.
Interest earned on the following investments is not
recognised in the statement of financial performance:
Interest earned on trust funds is allocated directly to
the fund.
Interest earned on unutilised conditional grants is
allocated directly to the creditor: “Unutilised
conditional grants” if the grant conditions indicate
that interest is payable to the funder.
Dividends are recognised when the City’s right to receive
payment is established.

City of Cape Town Auditor-General: 31 August 2012
for the year ended 30 June 2012 Notes to the financial statements
22
Annual financial statements 2012
Income for agency services is recognised on a monthly
basis once the income collected on behalf of agents is
earned. The income is recognised in terms of the agency
agreement.
Revenue from the sale of goods is recognised when all the
following conditions have been satisfied:
The City has transferred to the buyer the significant
risks and rewards of ownership of the goods.
The City retains neither continuing managerial
involvement to the degree usually associated with
ownership, nor effective control over the goods sold.
The amount of revenue can be reliably measured.
The costs incurred or to be incurred in respect of the
transaction can be reliably measured.
Prepaid electricity sold is only recognised as income
once the related units are consumed.
Revenue from non-exchange transactions
Revenue from rates is recognised when the legal
entitlement to this revenue arises and ratepayers have
been dually notified. Collection charges are recognised
when such amounts are legally enforceable. Interest on
unpaid rates is recognised on a time proportionate basis
with reference to the principal amount receivable and
effective interest rate applicable.
A composite rating system, charging different rate tariffs, is
used. Rebates are granted to certain categories of
ratepayers, and are deducted from revenue.
Fines constitute both spot fines and summonses. Revenue
from spot fines and summonses is recognised when
payment is received, together with management’s best
estimate of the probable inflows from the amounts not yet
collected.
Donations are recognised on a cash receipt basis, or at
fair value or, where the donation is in the form of property,
plant and equipment, when the risks or rewards of
ownership have transferred to the City.
Income from the recovery of unauthorised, irregular,
fruitless and wasteful expenditure is based on legislated
procedures, including those set out in the Municipal
Finance Management Act (Act 56 of 2003), and is
recognised when the recovery thereof from the
responsible councillors or officials is probable.
LEASES
The City as lessee
Leases are classified as finance leases where substantially
all the risks and rewards associated with ownership of an
asset are transferred to the City.
Assets subject to finance lease agreements are
capitalised at their cash cost equivalent, and the
corresponding liabilities are raised. The cost of the assets is
depreciated at appropriate rates on the straight-line basis
over the estimated useful lives of the assets. Lease
payments are allocated between the lease finance cost
and the capital repayment, using the effective interest
rate method. Lease finance costs are expensed when
incurred.
Operating leases are those leases that do not fall within
the scope of the above definition. Payments made under
operating leases are charged to the statement of
financial performance on a straight-line basis over the
period of the lease.
The City as lessor
Rental income from operating leases is recognised on a
straight-line basis over the term of the relevant lease.
GRANTS-IN-AID
The City transfers money to individuals, organisations and
other sectors of government from time to time. When making
these transfers, the City does not:
receive any goods or services directly in return, as would
be expected in a purchase or sale transaction;
expect to be repaid in future; or
expect a financial return, as would be expected from an
investment.
These transfers are recognised in the statement of financial
performance as expenses in the period in which the events
giving rise to the transfer occurred.
FINANCIAL INSTRUMENTS
Financial instruments are recognised when the City becomes
a party to the contractual provisions of the instrument, and
are initially measured at fair value. In the case of a financial
instrument not measured at fair value through the statement
of financial performance, transaction costs that are directly
attributable to the acquisition or issue of the instrument are
added or deducted from the fair value as appropriate on
initial recognition.
Financial assets
The classification of financial assets depends on their nature
and purpose and is determined at the time of initial
recognition.
Investments at fair value
Non-derivative investments held without the positive intent or
ability to hold to maturity. Subsequent to initial recognition all
changes to fair value are recognised through the statement
of financial performance.
Investments at amortised cost
Non-derivative investments with fixed or determinable
payments and fixed maturity dates, which the City has the
positive intent and ability to hold to maturity. Subsequent to
initial recognition such investments are measured at
amortised cost using the effective interest method less any
impairment.
Investments at cost
Residual interests that do not have a quoted market price in
an active market and the fair value of which cannot be
reliably measured. Subsequent to initial recognition such
investments are measured at cost less any impairment.
Financial assets, other than those at fair value, are assessed
for indicators of impairment at the end of each reporting
period. Impairment is considered when there is objective
evidence that, as a result of one or more events that
occurred after the initial recognition of the financial asset, the
estimated future cash flows of the investment have been
affected.
Financial assets are derecognised when the rights to receive
cash flows from the assets have expired or have been
transferred, and the City has transferred substantially all risks
and rewards of ownership, or when the enterprise loses
control of contractual rights that comprise the assets.

City of Cape Town Auditor-General: 31 August 2012
for the year ended 30 June 2012 Notes to the financial statements
23
Annual financial statements 2012
Financial liabilities
After initial recognition, the City measures all financial
liabilities, including payables, at amortised cost, using the
effective interest rate method. Financial liabilities include
borrowings, other non-current liabilities (excluding provisions)
and payables (excluding provisions). Interest-bearing external
loans and bank overdrafts are recorded net of direct issue
costs. Finance charges, including premiums payable, are
accounted for on an accrual basis.
Financial liabilities are derecognised when the obligation
specified in the contract is discharged, cancelled or expires.
PAYABLES
Payables are initially measured at fair value, and are
subsequently measured at amortised cost, using the effective
interest rate method.
RECEIVABLES
Receivables are recognised initially at fair value, which
approximates amortised cost less provision for impairment. An
estimate is made for doubtful debt based on past default
experience of all outstanding amounts at year-end. Bad
debts are written off in the year in which they are identified as
irrecoverable, subject to the approval by the appropriate
delegated authority. Amounts receivable within 12 months
from the date of reporting are classified as current.
A provision for impairment of receivables is established when
there is objective evidence that the City will not be able to
collect all amounts due according to the original terms of
receivables. The amount of the provision is the difference
between the asset’s carrying amount and the present value
of estimated future cash flows, discounted at the effective
interest rate. Interest is charged on overdue amounts.
UNAUTHORISED EXPENDITURE
Unauthorised expenditure is expenditure that has not been
budgeted for, expenditure that is not in terms of the
conditions of an allocation received from another sphere of
government, municipality or organ of state, and expenditure
in the form of a grant that is not permitted in terms of the
Municipal Finance Management Act. Unauthorised
expenditure is accounted for as an expense in the statement
of financial performance, and where recovered, is
subsequently accounted for as revenue in the same
statement.
IRREGULAR EXPENDITURE
Irregular expenditure is expenditure that is contrary to the
Municipal Finance Management Act (Act 56 of 2003), the
Municipal Systems Act (Act 32 of 2000), and the Public Office
Bearers Act, or is in contravention of the municipality’s supply
chain management policy. Irregular expenditure excludes
unauthorised expenditure. Irregular expenditure is accounted
for as expenditure in the statement of financial performance,
and, where recovered, is subsequently accounted for as
revenue in the same statement.
SERVICES IN-KIND
The city does not recognise services in-kind as revenue or as
an asset, but separately discloses the nature and type of
major classes of services in-kind as a note to the financial
statements.
FRUITLESS AND WASTEFUL EXPENDITURE
Fruitless and wasteful expenditure is expenditure that was
made in vain, and would have been avoided had
reasonable care been exercised. Fruitless and wasteful
expenditure is accounted for as expenditure in the statement
of financial performance, and, where recovered, is
subsequently accounted for as revenue in the same
statement.
FOREIGN- CURRENCY TRANSACTIONS
Transactions in foreign currencies are initially accounted for at
the ruling rate of exchange on the date of the transaction.
Trade creditors denominated in foreign currency are reported
at the statement of financial position date by applying the
exchange rate on that date. Exchange differences arising
from the settlement of creditors, or from reporting of creditors
at rates different from those at which they were initially
recorded during the period, are recognised as income or
expenses in the period in which they arise.
BORROWING COSTS
Borrowing costs are capitalised against qualifying assets as
part of property, plant and equipment.
Such borrowing costs are capitalised over the period during
which the asset is being acquired or constructed and
borrowings have been incurred. Capitalisation ceases when
construction of the asset is complete. Further borrowing costs
are charged to the statement of financial performance.
RELATED PARTIES
The City regards a related party as a person or an entity with
the ability to control individually or jointly, or exercise
significant influence over the City, or vice versa.
Management is regarded as a related party and comprises of
the Executive Mayor, Mayoral Committee members, City
Manager, Deputy City Manager and Executive Directors.
CONSTRUCTION CONTRACTS
When the outcome of a construction contract can be
estimated reliably, contract revenue and contract costs
associated with that construction contract are recognised as
revenue and expenses, respectively, by reference to the
stage of completion of the contract activity at the reporting
date.
The stage of completion is based on the proportion of
contract costs incurred to date relative to the estimated total
costs.
When the outcome of a construction contract cannot be
reliably measured, revenue is recognised only to the extent
that contract costs incurred are likely to be recovered.
Contract costs are recognised as expenses in the period
which they are incurred.
In some cases, certain construction activity and technical
supervision have been subcontracted to private sector
contractors for a fixed “completion of contract” fee. Where
this has occurred, the subcontracted costs are recognised as
on the percentage of completion method for each
subcontract.
Amounts received before the related work is performed are
included in the statement of financial position, as a liability, as
unspent conditional grants and receipts.

City of Cape Town Auditor-General: 31 August 2012
for the year ended 30 June 2012 Notes to the financial statements
24
Annual financial statements 2012
BUDGET INFORMATION
The annual budget figures have been prepared in
accordance with the GRAP standards, and are consistent
with the accounting policies adopted by the Council for the
preparation of these financial statements. The amounts are
scheduled as a separate additional financial statement,
called the statement of comparison of budget and actual
amounts. Explanatory comments are provided in the notes to
the annual financial statements, firstly stating reasons for
overall growth or decline in the budget and secondly,
motivating overspending or underspending on line items.
The annual budget figures included in the financial
statements are for the Municipality and do not include
budget information relating to subsidiaries or associates.
These figures are those approved by the Council at the
beginning and during the year following a period of
consultation with the public as part of the Integrated
Development Plan (IDP).
OFFSETTING
Financial assets and liabilities are offset and the net amount
reported in the statement of financial position when there is a
legally enforceable right to offset the recognised amount,
and there is an intention to settle on a net basis, or to realise
the asset and settle the liability simultaneously.
COMPARATIVE INFORMATION
Comparative figures are reclassified or restated as necessary
to afford a proper and more meaningful comparison of
results, as set out in the affected notes to the financial
statements.

City of Cape Town Auditor-General: 31 August 2012
for the year ended 30 June 2012 Notes to the financial statements
25
Annual financial statements 2012
1. PROPERTY, PLANT AND EQUIPMENT
Opening Transfers/
Additions Disposals Depreciation Impairment
Carrying
balance adjustments value
R'000 R'000 R'000 R'000 R'000 R'000 R'000
As at 30 June 2012
Land and buildings 1 898 806 (1 022 333) 69 758 672 786 (67 202) (20 327) 1 532 488
Infrastructure 11 578 408 (129 469) 2 645 556 (74 531) (590 791) (234) 13 428 939
Community 5 072 370 1 114 437 232 914 (523 168) (220 508) - 5 676 045
Leased assets 65 592 (65 592) - - - - -
Other 2 248 069 (166 724) 1 069 569 (22 755) (448 717) (6 831) 2 672 611
Housing rental stock 611 546 227 101 152 690 (55 956) (28 207) - 907 174
TOTAL 21 474 791 (41 580) 4 170 487 (3 624) (1 355 425) (27 392) 24 217 257
(See Appendix B for more detail)
As at 30 June 2011
Land and buildings 1 675 651 201 077 110 386 (241) (78 201) (9 866) 1 898 806
Infrastructure 10 259 317 (37 920) 1 832 881 (1) (475 869) - 11 578 408
Community 5 042 870 45 817 216 014 - (232 331) - 5 072 370
Leased assets 113 735 (34 955) - - (13 188) - 65 592
Other 2 235 219 (197 327) 676 535 (43 314) (423 044) - 2 248 069
Housing rental stock 621 457 7 732 11 621 (2 602) (26 662) - 611 546
TOTAL 19 948 249 (15 576) 2 847 437 (46 158) (1 249 295) (9 866) 21 474 791
Provision has been made for the estimated cost of rehabilitation of waste sites, included in other assets, as described in
note 13.
The City is required to measure the residual value of all items of property, plant and equipment. Management has
determined that none of its infrastructural assets have any active market value, and the value of the amount at the end of
their lives would therefore be nil or insignificant. During the current financial year, the City reviewed the estimated useful
lives and residual values of property, plant and equipment, where appropriate.
Fully depreciated assets at an original cost of R1,24 billion (2011: R1,91 billion) are still in use.
2. HERITAGE ASSETS
Opening Transfers/
Additions Disposals
Carrying
balance adjustments value
R'000 R'000 R'000 R'000 R'000
As at 30 June 2012
Assets under construction
3 552 (268) 350 - 3 634
Paintings and art galleries
8 362 750 - (4) 9 108
TOTAL
11 914 482 350 (4) 12 742
(See Appendix B for more detail)
As at 30 June 2011
Assets under construction
1 660 (9) 1 901 - 3 552
Paintings and art galleries
8 342 - 30 (10) 8 362
TOTAL
10 002 (9) 1 931 (10) 11 914

City of Cape Town Auditor-General: 31 August 2012
for the year ended 30 June 2012 Notes to the financial statements
26
Annual financial statements 2012
3. INVESTMENT PROPERTY
Opening
balance
Transfers/
adjustments Additions Depreciation
Carrying
value
R'000 R'000 R'000 R'000 R'000
As at 30 June 2012
Vacant land
38 366 - 109 132 - 147 498
Land and buildings
46 633 - - (1 653) 44 980
TOTAL
84 999 - 109 132 (1 653) 192 478
(See Appendix B for more detail)
As at 30 June 2011
Vacant land
38 366 - - - 38 366
Land and buildings
48 694 537 - (2 598) 46 633
TOTAL
87 060 537 - (2 598) 84 999
Rental income has been received on various properties during the year.
4. INTANGIBLE ASSETS
Opening Transfers/
Additions Disposals
Carrying
balance adjustments Amortisation value
R'000 R'000 R'000 R'000 R'000 R'000
As at 30 June 2012
Computer software (acquired separately) 44 884 41 121 29 403 42 (15 018) 100 432
(See Appendix B for more detail)
As at 30 June 2011
Computer software (acquired separately) 31 709 14 989 8 393 - (10 207) 44 884
The capitalised computer software was estimated to have a finite life of five years at acquisition. The software is therefore
amortised using the straight-line method over a period of five years.
5. ASSETS CLASSIFIED AS HELD-FOR-SALE
Opening
balance
Transfers/
adjustments Disposals
Carryin
g value
R'000 R'000 R'000 R'000
As at 30 June 2012
Land held for sale 126 (23) (60) 43
(See Appendix B for more detail)
As at 30 June 2011
Land held for sale 66 61 (1) 126
Various properties have been presented as held-for-sale following a Council decision to dispose of properties that are no
longer required for municipal purposes. These properties are identified for sale as and when the need arises.

City of Cape Town Auditor-General: 31 August 2012
for the year ended 30 June 2012 Notes to the financial statements
27
Annual financial statements 2012
6. INVESTMENTS
Amortised
cost Fair value Cost Total
R'000 R'000 R'000 R'000
As at 30 June 2012
RSA Government stock 50 013 - - 50 013
Sinking fund deposits – see note 39 71 064 570 587 - 641 651
Other fixed deposits 1 482 345 - - 1 482 345
Deposits held with fund managers - 4 024 813 - 4 024 813
Shares in CTICC - - 284 000 284 000
1 603 422 4 595 400 284 000 6 482 822
Provision for impairment (9 616) - (245 232) (254 848)
Net investments 1 593 806 4 595 400 38 768 6 227 974
Current portion transferred to short-term investments (37) (2 883 350) - (2 883 387)
Current portion transferred to cash and cash equivalents
– see note 11 (1 482 277) (1 712 050) - (3 194 327)
TOTAL 111 492 - 38 768 150 260
Amortised
cost Fair value Cost Total
R'000 R'000 R'000 R'000
Investments detailed as follows:
Balance at the beginning of the year 1 625 197 3 638 038 38 768 5 302 003
Capital invested 17 170 387 700 000 - 17 870 387
Investments matured (17 231 846) - - (17 231 846)
Recognised in the statement of financial performance 30 068 257 362 - 287 430
Finance income 30 068 260 933 - 291 001
Gains on valuation of investments - 1 543 - 1 543
Transaction cost - (5 114) - (5 114)
Balance at the end of the year 1 593 806 4 595 400 38 768 6 227 974
Amortised
cost Fair value Cost Total
R'000 R'000 R'000 R'000
As at 30 June 2011
RSA Government stock 48 472 - - 48 472
Sinking fund deposits – see note 39 113 233 363 765 - 476 998
Other fixed deposits 1 473 108 - - 1 473 108
Deposits held with fund managers - 3 274 273 - 3 274 273
Shares in CTICC - - 284 000 284 000
1 634 813 3 638 038 284 000 5 556 851
Provision for impairment (9 616) - (245 232) (254 848)
Net investments 1 625 197 3 638 038 38 768 5 302 003
Current portion transferred to short-term investments (50 294) (2 096 302) - (2 146 596)
Current portion transferred to cash and cash equivalents
– see note 11 (1 463 426) (1 541 736) - (3 005 162)
TOTAL 111 477 - 38 768 150 245
Amortised
cost Fair value Cost Total
R'000 R'000 R'000 R'000
Investments detailed as follows:
Balance at the beginning of the year 3 145 737 1 522 542 38 768 4 707 047
Capital invested 10 770 000 3 000 000 - 13 770 000
Investments matured (12 305 556) (1 038 110) - (13 343 666)
Recognised in the statement of financial performance 15 016 153 606 - 168 622
Finance income 15 016 146 740 - 161 756
Gains on valuation of investments - 11 100 - 11 100
Transaction cost - (4 234) - (4 234)
Balance at the end of the year 1 625 197 3 638 038 38 768 5 302 003

City of Cape Town Auditor-General: 31 August 2012
for the year ended 30 June 2012 Notes to the financial statements
28
Annual financial statements 2012
Collateral deposits for staff housing loans
Included in other fixed deposits (unlisted investments) above are fixed deposits with a carrying value of R0,47 million
(2011: R0,47 million), which were pledged as security deposits for securing staff home loans with financial institutions.
These pledges are repaid as soon as the employees outstanding home loan balance is below 80% of the approved loan
amount. The City has not issued fixed deposits as security since 2000. The City's exposure to risk is minimised by an assurance
policy taken out by the employee, and ceded to the City to cover the guaranteed deposit.
Cape Town International Convention Centre (Pty) Ltd
The carrying amount of the City's investment in Convenco, R284 million, has been compared with its share of the present
value of Convenco's estimated future cash flows discounted at a market related rate of interest. As at 30 June 2012, the
value of the previous financial year end was maintained as the change in value was considered insignificant. The
impairment loss provision at 30 June 2011 is therefore maintained at R245,23 million.
2012 2011
R’000 R’000
7. LONG-TERM RECEIVABLES
Sporting bodies
1 194 1 363
Housing land sales
1 026 1 104
16 569 23 798
Public organisations
20 756 28 657
Provision for impairment
(4 187) (4 859)
100 297 108 454
Housing selling development loans
178 591 200 655
Provision for impairment
(78 294) (92 201)
119 086 134 719
Current portion transferred to current receivables
(19 758) (19 193)
TOTAL
99 328 115 526
Reconciliation of impairment provision
Balance at beginning of the year
96 060 118 401
Contributions (from) provisions
(14 578) (21 510)
Transfers to provisions - 169
Balance as at 30 June
82 482 97 060
Sporting bodies
To facilitate the development of sporting facilities, loans were made to provide the necessary financial assistance. These
loans attract interest at a rate of 4% to19% per annum and are repayable over a maximum period of 20 years.
Housing land sale
Long term loan to the Khayelitsha community trust (sale of portion 1-3, Erf 58856) repayable over 18 years. Annual payments
made with the final payment due in 2024.
Public organisations
Loans to public organisations are granted in terms of National Housing Policy. At present, these loans attract interest at 1%
and 11,25% for buildings and infrastructure respectively and are repayable over 30 years. With the implementation of new
legislation (MFMA and Housing Act 107 of 1997) no further loans have been awarded and the final loan repayments are
scheduled for 2032. Examples of public organisations are: National War Memorial and Alta du Toit.
Housing selling development loans
Housing loans were historically granted to qualifying individuals in terms of the National Housing Policy. These loans currently
attract interest at 9,0% per annum, and are repayable over 20 years. The interest rate is determined as per Council policy.
2012 2011
R’000 R’000
8. INVENTORY
Consumable stores
206 251 196 099
Medical supplies
310 492
Spare parts and meters
22 634 14 351
Water
15 070 18 293
Other goods held for resale
8 743 3 549
Green electricity rights
- 2 465
TOTAL
253 008 235 249
Inventory to the value of R5,40 million (2011: R1,24 million) was scrapped during the year. Inventories (excluding bulk water)
that were recognised as issues during the year amounted to R823,11 million (2011: R639,45 million), of which a portion was
capitalised. Green- electricity rights are rights to sell ‘green’ units at ‘green’ tariffs to consumers who ‘green’ electricity.

City of Cape Town Auditor-General: 31 August 2012
for the year ended 30 June 2012 Notes to the financial statements
29
Annual financial statements 2012
9. RECEIVABLES
Gross Provision for Net
balance impairment balance
R'000 R'000 R'000
As at 30 June 2012
From exchange transactions 6 171 246 (3 414 293) 2 756 953
Service debtors 5 156 925 (2 640 642) 2 516 283
Housing rental stock 470 135 (419 818) 50 317
Housing selling stock 389 288 (343 309) 45 979
Other exchange debtors 154 898 (10 524) 144 374
From non-exchange transactions 1 989 266 (766 963) 1 222 303
Rates debtors 1 929 496 (734 060) 1 195 436
Other non-exchange debtors 59 770 (32 903) 26 867
TOTAL 8 160 512 (4 181 256) 3 979 256
As at 30 June 2011
From exchange transactions 5 522 855 (3 068 454) 2 454 401
Service debtors 4 592 489 (2 334 751) 2 257 738
Housing rental stock 421 713 (377 366) 44 347
Housing selling stock 389 461 (347 178) 42 283
Other exchange debtors 119 192 (9 159) 110 033
From non-exchange transactions 2 001 789 (747 079) 1 254 710
Rates debtors 1 941 869 (712 937) 1 228 932
Other non-exchange debtors 59 920 (34 142) 25 778
TOTAL 7 524 644 (3 815 533) 3 709 111
Consumer debtors to the amount of R2,56 billion (2011: R1,47 billion) are only due after 30 days. Included in the outstanding
balances are consumer debtors to the value of R634,76 million (2011: R497,97 million), who have made arrangements to
repay their outstanding debt over a renegotiated period. As at 30 June 2012, the City’s receivables balance included an
amount of approximately R120,36 million (2011: R173 million) owed by National Government and the Provincial Government.
2012 2011
R’000 R’000
Reconciliation of impairment provision
Balance at beginning of the year
3 815 533 3 299 430
Contributions to provisions
803 015 785 503
Transfers (from)/to provisions
(40) 3 292
Bad debts written off
(437 252) (272 692)
Balance as at 30 June
4 181 256 3 815 533
Reconciliation of impairment provision
In determining the recoverability of a receivable, the City considers any change in the credit quality of the receivable from
the date on which the credit was initially granted up to the reporting date. The concentration of credit risk is limited, as the
customer base is large and unrelated. Accordingly, management believes no further credit provisions are required in excess
of the present allowance for doubtful debts.

City of Cape Town Auditor-General: 31 August 2012
for the year ended 30 June 2012 Notes to the financial statements
30
Annual financial statements 2012
Analysis of receivables' age in days
Total Not due 0-30 31-60 61-90 91-365 +365
As at 30 June 2012
R'000 R'000 R'000 R'000 R'000 R'000 R'000
From exchange transactions
Electricity
1 173 436 801 427 103 708 39 641 (5 071) 107 584 126 147
Provision for impairment
(148 768) (17 311) (2 240) (856) 110 (2 324) (126 147)
1 024 668 784 116 101 468 38 785 (4 961) 105 260 -
Water
2 470 316 371 358 11 459 75 677 89 868 484 636 1 437 318
Provision for impairment
(1 613 858) (63 465) (1 959) (12 933) (15 359) (82 824) (1 437 318)
856 458 307 893 9 500 62 744 74 509 401 812 -
Waste management
426 645 93 148 4 168 14 187 15 853 84 303 214 986
Provision for impairment
(230 606) (6 874) (308) (1 047) (1 170) (6 221) (214 986)
196 039 86 274 3 860 13 140 14 683 78 082 -
Wastewater
management
1 086 528 224 820 (38 637) 41 093 48 588 230 265 580 399
Provision for impairment
(647 410) (29 766) 5 116 (5 441) (6 433) (30 487) (580 399)
439 118 195 054 (33 521) 35 652 42 155 199 778 -
Housing rental stock
470 135 34 033 13 521 9 116 9 030 82 991 321 444
Provision for impairment
(419 818) (22 516) (8 946) (6 031) (5 974) (54 907) (321 444)
50 317 11 517 4 575 3 085 3 056 28 084 -
Housing selling stock
389 288 35 447 7 026 2 659 2 526 36 518 305 112
Provision for impairment
(343 309) (16 150) (3 038) (1 222) (1 160) (16 627) (305 112)
45 979 19 297 3 988 1 437 1 366 19 891 -
Other exchange
debtors
154 898 260 869 (25 755) (28 807) (22 447) (25 711) (3 251)
Provision for impairment
(10 524) (22 722) 2 243 2 509 1 955 2 240 3 251
144 374 238 147 (23 512) (26 298) (20 492) (23 471) -
Gross exchange
debtors
6 171 246 1 821 102 75 490 153 566 138 347 1 000 586 2 982 155
Provision for impairment
(3 414 293) (178 804) (9 132) (25 021) (28 031) (191 150) (2 982 155)
From non-exchange transactions
Rates debtors
1 929 496 690 199 (6 195) 66 451 113 065 350 984 714 992
Provision for impairment
(734 060) (10 836) 97 (1 043) (1 775) (5 511) (714 992)
1 195 436 679 363 (6 098) 65 408 111 290 345 473 -
Other non-exchange
debtors
59 770 49 432 (29 541) 1 508 1 685 6 347 30 339
Provision for impairment
(32 903) (4 306) 2 573 (131) (147) (553) (30 339)
26 867 45 126 (26 968) 1 377 1 538 5 794 -
Gross non-exchange
debtors
1 989 266 739 631 (35 736) 67 959 114 750 357 331 745 331
Provision for impairment
(766 963) (15 142) 2 670 (1 174) (1 922) (6 064) (745 331)
Gross debtors
8 160 512 2 560 733 39 754 221 525 253 097 1 357 917 3 727 486
Total provision for
impairment
(4 181 256) (193 946) (6 462) (26 195) (29 953) (197 214) (3 727 486)
TOTAL
3 979 256 2 366 787 33 292 195 330 223 144 1 160 703 -

City of Cape Town Auditor-General: 31 August 2012
for the year ended 30 June 2012 Notes to the financial statements
31
Annual financial statements 2012
Analysis of receivables' age in days
Total Not due 0 - 30 31-60 61-90 91-365 +365
As at 30 June 2011
R'000 R'000 R'000 R'000 R'000 R'000 R'000
From exchange transactions
Electricity
1 035 999 612 027 131 884 40 547 19 886 109 009 122 646
Provision for impairment
(144 384) (14 566) (3 139) (965) (473) (2 595) (122 646)
891 615 597 461 128 745 39 582 19 413 106 414 -
Water
2 233 811 191 120 157 288 75 002 58 744 449 114 1 302 543
Provision for impairment
(1 438 228) (27 846) (22 917) (10 927) (8 559) (65 436) (1 302 543)
795 583 163 274 134 371 64 075 50 185 383 678 -
Waste management
367 479 43 328 28 845 17 284 12 899 83 099 182 024
Provision for impairment
(194 023) (2 803) (1 866) (1 118) (835) (5 377) (182 024)
173 456 40 525 26 979 16 166 12 064 77 722 -
Wastewater
management
955 200 100 707 69 942 37 535 34 103 217 407 495 506
Provision for impairment
(558 116) (13 716) (9 526) (5 112) (4 645) (29 611) (495 506)
397 084 86 991 60 416 32 423 29 458 187 796 -
Housing rental stock
421 713 23 432 12 033 9 295 9 204 80 422 287 327
Provision for impairment
(377 366) (15 699) (8 062) (6 228) (6 167) (53 883) (287 327)
44 347 7 733 3 971 3 067 3 037 26 539 -
Housing selling stock
389 461 30 076 5 845 2 667 2 560 36 352 311 961
Provision for impairment
(347 178) (13 254) (3 061) (1 225) (1 175) (16 502) (311 961)
42 283 16 822 2 784 1 442 1 385 19 850 -
Other exchange
debtors
119 192 ( 26 927) 210 123 (16 594) (10 479) (37 514) 583
Provision for impairment
(9 159) 1 947 (15 192) 1 199 758 2 712 (583)
110 033 (24 980) 194 931 (15 395) (9 721) (34 802) -
Gross exchange
debtors
5 522 855 973 763 615 960 165 736 126 917 937 889 2 702 590
Provision for impairment
(3 068 454) (85 937) (63 763) (24 376) (21 096) (170 692) (2 702 590)
Rates debtors
1 941 869 483 699 270 028 108 203 45 160 392 267 642 512
Provision for impairment
(712 937) (26 216) (14 636) (5 864) (2 448) (21 261) (642 512)
1 228 932 457 483 255 392 102 339 42 712 371 006 -
Other non-exchange
debtors
59 920 13 566 3 448 3 505 867 6 401 32 133
Provision for impairment
(34 142) (981) (249) (253) (63) (463) (32 133)
25 778 12 585 3 199 3 252 804 5 938 -
Gross non-exchange
debtors
2 001 789 497 265 273 476 111 708 46 027 398 668 674 645
Provision for impairment
(747 079) (27 197) (14 885) (6 117) (2 511) (21 724) (674 645)
Gross debtors
7 524 644 1 471 028 889 436 277 444 172 944 1 336 557 3 377 235
Total provision for
impairment
(3 815 533) (113 134) (78 648) (30 493) (23 607) (192 416) (3 377 235)
TOTAL
3 709 111 1 357 894 810 788 246 951 149 337 1 144 141 -

City of Cape Town Auditor-General: 31 August 2012
for the year ended 30 June 2012 Notes to the financial statements
32
Annual financial statements 2012
10. OTHER RECEIVABLES
Gross balance
Provision for
impairment Net balance
R'000 R'000 R'000
As at 30 June 2012
From exchange transactions 191 754 (45 799) 145 955
Payments made in advance 497 - 497
Property rentals 71 678 (38 354) 33 324
Other exchange debtors 119 579 (7 445) 112 134
From non-exchange transactions 157 837 - 157 837
Government subsidies 106 883 - 106 883
Other non-exchange debtors 50 954 - 50 954
TOTAL 349 591 (45 799) 303 792
As at 30 June 2011
From exchange transactions 147 453 (60 649) 86 804
Payments made in advance 130 - 130
Property rentals 55 808 (54 527) 1 281
Other exchange debtors 91 515 (6 122) 85 393
From non-exchange transactions 107 455 - 107 455
Government subsidies 35 723 - 35 723
Other non-exchange debtors 71 732 - 71 732
TOTAL 254 908 (60 649) 194 259
Included in other exchange debtors is an amount of R24,93 million (2011: R3,22 million) for VAT owed by the SARS.
2012 2011
R’000 R’000
Reconciliation of impairment provision
Balance at beginning of the year
60 649 50 749
Contributions (from)/to provisions
(14 731) 9 900
Bad debt written off
(119) -
Balance as at 30 June
45 799 60 649
In determining the recoverability of other receivable, the City considers any change in the credit quality of other receivable
from the date on which the credit was initially granted, up to the reporting date.
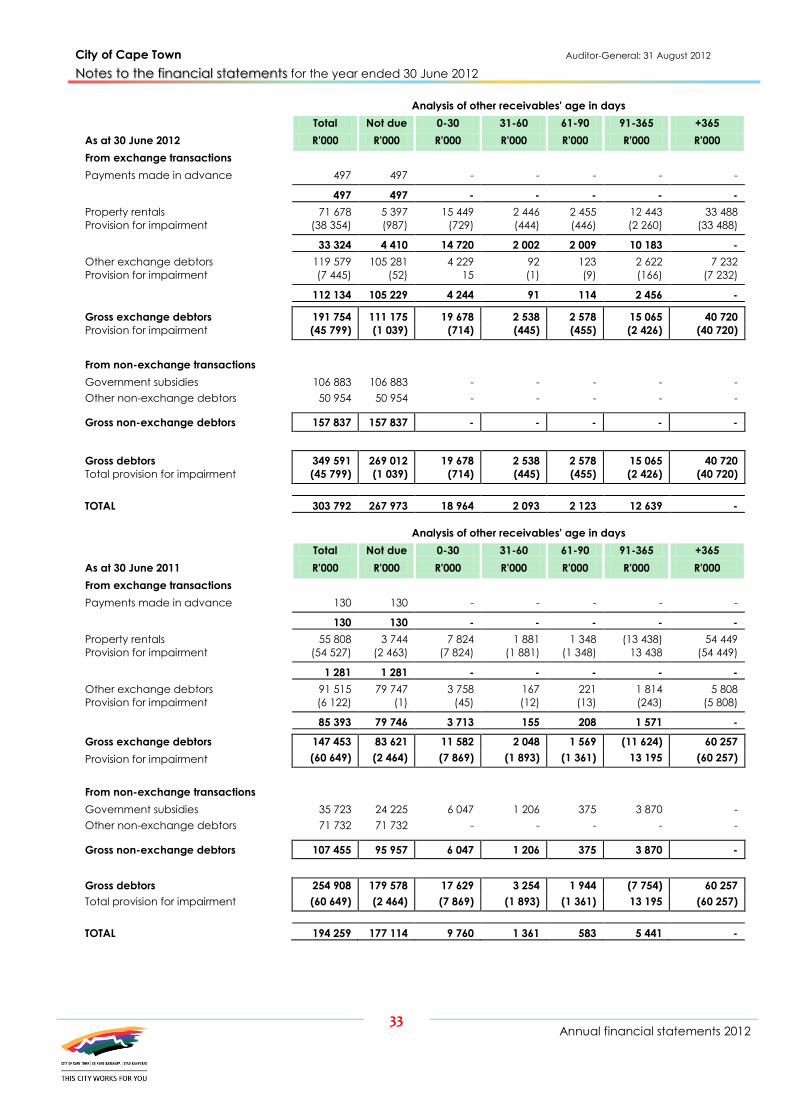
City of Cape Town Auditor-General: 31 August 2012
for the year ended 30 June 2012 Notes to the financial statements
33
Annual financial statements 2012
Analysis of other receivables' age in days
Total Not due 0-30 31-60 61-90 91-365 +365
As at 30 June 2012 R'000 R'000 R'000 R'000 R'000 R'000 R'000
From exchange transactions
Payments made in advance 497 497 - - - - -
497 497 - - - - -
Property rentals 71 678 5 397 15 449 2 446 2 455 12 443 33 488
Provision for impairment (38 354) (987) (729) (444) (446) (2 260) (33 488)
33 324 4 410 14 720 2 002 2 009 10 183 -
Other exchange debtors 119 579 105 281 4 229 92 123 2 622 7 232
Provision for impairment (7 445) (52) 15 (1) (9) (166) (7 232)
112 134 105 229 4 244 91 114 2 456 -
Gross exchange debtors 191 754 111 175 19 678 2 538 2 578 15 065 40 720
Provision for impairment (45 799) (1 039) (714) (445) (455) (2 426) (40 720)
From non-exchange transactions
Government subsidies 106 883 106 883 - - - - -
Other non-exchange debtors 50 954 50 954 - - - - -
Gross non-exchange debtors 157 837 157 837 - - - - -
Gross debtors 349 591 269 012 19 678 2 538 2 578 15 065 40 720
Total provision for impairment (45 799) (1 039) (714) (445) (455) (2 426) (40 720)
TOTAL 303 792 267 973 18 964 2 093 2 123 12 639 -
Analysis of other receivables' age in days
Total Not due 0-30 31-60 61-90 91-365 +365
As at 30 June 2011 R'000 R'000 R'000 R'000 R'000 R'000 R'000
From exchange transactions
Payments made in advance 130 130 - - - - -
130 130 - - - - -
Property rentals 55 808 3 744 7 824 1 881 1 348 (13 438) 54 449
Provision for impairment (54 527) (2 463) (7 824) (1 881) (1 348) 13 438 (54 449)
1 281 1 281 - - - - -
Other exchange debtors 91 515 79 747 3 758 167 221 1 814 5 808
Provision for impairment (6 122) (1) (45) (12) (13) (243) (5 808)
85 393 79 746 3 713 155 208 1 571 -
Gross exchange debtors 147 453 83 621 11 582 2 048 1 569 (11 624) 60 257
Provision for impairment (60 649) (2 464) (7 869) (1 893) (1 361) 13 195 (60 257)
From non-exchange transactions
Government subsidies 35 723 24 225 6 047 1 206 375 3 870 -
Other non-exchange debtors 71 732 71 732 - - - - -
Gross non-exchange debtors 107 455 95 957 6 047 1 206 375 3 870 -
Gross debtors 254 908 179 578 17 629 3 254 1 944 (7 754) 60 257
Total provision for impairment (60 649) (2 464) (7 869) (1 893) (1 361) 13 195 (60 257)
TOTAL 194 259 177 114 9 760 1 361 583 5 441 -

City of Cape Town Auditor-General: 31 August 2012
for the year ended 30 June 2012 Notes to the financial statements
34
Annual financial statements 2012
2012 2011
R’000 R’000
11. CASH AND CASH EQUIVALENTS (BANK AND CASH)
Bank balance 98 651 116 877
ABSA - Primary bank account 40-5658-4470 97 705 116 867
Salary bank account 40-5658-4496 - -
Cashiers bank account 40-5658-4527 - -
General income account (primary) 40-5658-4569 - -
Traffic fines bank account 40-7261-8663 - -
IRT funding account 5435522023983015 946 10
Year-end accruals (246) (194)
Interest accrual 275 291
Bank charges accrual (521) (485)
0 Net cash in bank 98 405 116 683
Cash on hand and in transit 35 100 29 412
Call and term deposits - see note 6 1 482 277 1 463 426
Amortised cost 1 615 782 1 609 521
Call and term deposits - see note 6 1 712 050 1 541 736
Fair value 1 712 050 1 541 736
TOTAL 3 327 832 3 151 257
Cash and cash equivalents comprise cash held and short-term deposits.
12. BORROWINGS
Local registered stock loans
4 279 186 4 278 903
Concessionary loans
27 392 30 357
Other loans
1 164 029 1 273 648
Finance leases
- 66 281
Subtotal - see Appendix A for more details
5 470 607 5 649 189
Current portion transferred to current liabilities
(294 186) (305 353)
TOTAL
5 176 421 5 343 836
A total of R641,65 million (2011: R477,00 million) has been ring-fenced for
the repayment of long-term liabilities - see note 6 and 39 for more details.
LOCAL REGISTERED STOCK 4 279 186 4 278 903
ABSA Nominees (Pty) Ltd
Secured bond paying fixed interest semi-annually. As security, a sinking fund was
established, which, together with interest capitalised, will be used to settle the
original loan liability on 31 March 2014.
Listed Bonds
In terms of the City’s domestic medium term note (DMTN) programme registered on
the JSE unsecured bonds totalling R4,20 billion are listed on the JSE Limited (JSE) of
South Africa. Interest is payable semi-annually, while capital will be redeemed by
way of a bullet repayment on the final redemption date. Certain bond raising costs
have been capitalised and off-set against the proceeds thereof, and are being
written off over the periods of the respective bonds. Sinking funds have been
established for the repayment of the bonds.
7 047
4 272 139
7 047
4 271 856
CONCESSIONARY LOANS 27 392 30 357
Development Bank of Southern Africa (DBSA)
An unsecured fixed-term concessionary loan repayable semi-annually in equal
instalments of capital, with interest payable on the reducing balance. This loan will
be fully paid on 30 June 2020.
Nedcor Bank
An unsecured fixed-rate loan, interest payable annually, and loan capital
repayable on 31 August 2019.
27 376
16
30 343
14

City of Cape Town Auditor-General: 31 August 2012
for the year ended 30 June 2012 Notes to the financial statements
35
Annual financial statements 2012
2012 2011
R’000 R’000
OTHER LOANS 1 164 029 1 273 648
Development Bank of Southern Africa (DBSA)
Unsecured fixed-interest loans, repayable semi-annually in equal instalments of
capital, with interest payable on the reducing balance. These loans have various
final redemptions, ranging from 30 June 2015 to 31 December 2022.
FirstRand Bank
A structured 15-year loan to the value of R220 million of which, R200 million is
repayable semi-annually in equal instalments of capital and fixed-rate interest over
15 years, and the balance of R20 million payable in one instalment, together with
fixed-rate interest, on 30 June 2017. The bullet repayment of the R20 million capital
and interest will be made out of the guaranteed investment portfolios of two
15-year sinking-fund investment policies purchased from Momentum Group.
As part of the loan structure, the City purchased two 15-year sinking-fund policies
from Momentum Group for an upfront premium of R220 million. R20 million of the
premium was invested in the guaranteed investment portfolio referred to above.
The balance of the premium, i.e. R200 million, was invested in a linked investment
(unguaranteed) portfolio. The maturity proceeds of this unguaranteed portfolio
were sold in advance to FirstRand Bank for R200 million on the acception of the
policies. The City has ceded and pledged the sinking-fund policies to FirstRand
Bank as security for the City’s obligations to FirstRand Bank under the policies and
any other debt liability.
FirstRand Bank
A structured 15-year loan to the value of R150 million, repayable semi-annually in
equal instalments of capital and fixed interest.
As part of the loan structure, the City leased moveable electricity assets with a
market value of R150 million to FirstRand Bank for 20 years. Rental was payable in
three instalments from 1998 to 2000, with a nominal annual rental thereafter. The
rentals have been payable into a deposit account with FirstRand Bank, which
attracts a fixed rate of interest. FirstRand Bank leased the assets back to the City
over 15 years, with rentals payable out of the deposit account from 2003 to 2013,
which will reduce to zero on 30 June 2013. The City has ceded its rights to
repayment of the deposit to FirstRand Bank as security for its obligations to FirstRand
Bank under the original loan and any other indebtedness.
The capitalised lease liabilities are secured by items of plant, to the carrying value of
R15,83 million (2011: R20,89 million).
ABSA Bank
An unsecured fixed-interest loan, repayable semi-annually in equal instalments of
capital, with interest payable on the reducing balance. Final redemption on
30 June 2018.
FirstRand Bank
A structured 15-year loan to the value of R300 million, of which, R74,30 million is
repayable semi-annually in equal instalments of capital and fixed-rate interest over
15 years, and the balance of R225,70 million payable in one instalment together
with capitalised fixed-rate interest on 30 June 2018. The bullet repayment of the
R225,70 million capital and interest will be made out of a 15-year sinking-fund
investment policy purchased from Momentum Group.
As part of the loan structure, the City purchased a 15-year sinking-fund policy from
Momentum Group for a premium of R228,40 million, which was invested in an
unguaranteed investment portfolio. The premium is payable semi-annually over
15 years through a series of promissory notes issued by the City to Momentum, later
sold on to FirstRand Bank and Future Growth. In terms of a put-option agreement,
the maturity proceeds of this unguaranteed portfolio were sold in advance to
FirstRand Bank for a fixed-option price of R894,60 million, payable on
30 June 2018. The City has ceded and pledged the sinking-fund policy to FirstRand
Bank as security for the City’s obligations to FirstRand Bank under the put-option
agreement and any other debt liability.
683 284
176 329
20 625
120 000
163 791
731 991
183 268
41 643
140 000
176 746

City of Cape Town Auditor-General: 31 August 2012
for the year ended 30 June 2012 Notes to the financial statements
36
Annual financial statements 2012
2012 2011
R’000 R’000
FINANCE LEASES - 66 281
Nedbank
A sale-and-leaseback, structured 15-year loan to the value of R55,30 million was
funded by Nedbank through an infrastructure trust. Lease rentals equated to fixed-
rate interest were payable semi-annually over 15 years; a bullet rental amount of
R55,30 million was paid on 3 January 2012 out of the proceeds of a sinking fund in
settlement of the loan. The City deposited equal amounts with Nedbank semi-
annually, which, together with compounded interest over 15 years, equated to the
original loan capital. The City ceded its rights under the deposit agreement to
Nedbank as security for repayment of the loan capital.
Investec
A sale-and-leaseback, structured 15-year loan to the value of R54,80 million was
funded by Investec Bank. Lease rentals equated to loan fixed-rate interest plus
capital was payable semi-annually over 15 years. Investec granted the City the
right to acquire the assets at the expiry of the lease at an agreed option price of
R47,60 million. The City deposited with Investec an amount, which, together with
compound interest, equated to the option price paid on 31 December 2011. The
City ceded its rights under the deposit agreement to Investec as security for
repayment of the lease and the option price.
-
-
61 997
4 284
TOTAL - see Appendix A for more details 5 470 607 5 649 189
The rates of interest payable on the abovementioned structured loans and finance leases are based on certain underlying
assumptions relating to the lenders’ statutory costs, and the allowability of deductions by the lenders for income tax
purposes in connection with these loans. In the event of changes to, or interpretation of, the Income Tax Act (Act 58 of 1962)
or any other relevant legislation that has an impact on the loan structure costs, the lenders have the right to increase or
decrease the future rates of interest payable on the loans over their remaining lives, in order to absorb the increase or
decrease in costs.
SHORT-TERM DEBT FACILITIES
The Municipality had the following short-term debt facilities with the City’s main banker:
2012 2011
R’000 R’000
Performance guarantee and/or letter of credit
15 000 15 000
Business travel card
2 000 2 000
Daylight limit
1 000 000 1 000 000
Business credit card
50 50
The short-term debt facilities are reviewed annually and can be explained as follows:
Performance guarantee and/or letters of credit
A guarantee issued by the bank is an undertaking, that should the City fail to fulfil its obligations in terms of a contract or an
agreement, the bank will pay specific amounts as stated on the guarantee. The monies are due and payable on the written
demand from the beneficiary.
Business Credit Card/Travel Card
A card issued by the bank enables the City to obtain goods and services on credit. It entails moneys lent and advanced.
Daylight limit
A daylight limit is a facility that enables the City to transact even if there are insufficient funds during that particular day. It
entails moneys lent and advanced during that day, provided it is settled by the end of that business day

City of Cape Town Auditor-General: 31 August 2012
for the year ended 30 June 2012 Notes to the financial statements
37
Annual financial statements 2012
13. PROVISIONS (NON-CURRENT)
Long-service
leave
benefits
Environmental
rehabilitation
Post-
retirement
medical aid
benefits
Post-retirement
pension
benefits Total
R'000 R'000 R'000 R'000 R'000
As at 30 June 2012
Balance at the beginning of the year 312 294 342 871 2 841 340 15 832 3 512 337
Interest cost
26 905 35 350 254 270 1 536 318 061
Service cost and transitional liability 39 775 (74 882) 79 194 651 44 738
Benefit payments
(40 927) - (126 316) (1 505) (168 748)
Actuarial losses/(gains)
37 535 - 376 394 (1 475) 412 454
Transferred from current provisions
(prior year) 37 489 32 000 141 553 1 965 213 007
413 071 335 339 3 566 435 17 004 4 331 849
Transfer to current provision
(36 256) (6 500) (211 176) (1 716) (255 648)
TOTAL
376 815 328 839 3 355 259 15 288 4 076 201
Long-service leave benefits
An actuarial valuation has been performed of the City's liability for long-service leave benefits relating to vested leave
benefits to which employees may become entitled upon completion of ten years’ service and every five years thereafter.
The provision is utilised when eligible employees receive the value of the vested benefits.
Discount rate
The fund benefit liability as at 30 June 2012 has been discounted at the market yields on government bonds consistent with
the estimated term of the liability. A discount rate of 6,28% (2011: 8,16%) per annum has been used.
2012 2011
% %
Key financial assumptions
Discount rate 6,3 8,2
General salary inflation rate 5,9 6,3
Salary increase 5,0 6,5
Environmental rehabilitation
Provision is made in terms of the City's licensing stipulations on the waste
landfill sites, for the estimated cost of rehabilitating waste sites. The
provision has been determined on the basis of a recent independent
study. The cost factors derived from the study by a firm of consulting
engineers have been applied and projected at an annual inflation rate of
5,2% (2011: 5,6%) and discounted to present value at the average
borrowing cost of 10,59% (2011: 10,97%) - hence the difference. The
payment dates of total closure and rehabilitation are uncertain, but are
currently expected to be between 2011 and 2025.
Post-retirement medical aid and pension benefits
An actuarial valuation has been performed of the City’s liability in respect
of benefits to its eligible retirees and retrenched employees. The provision
is utilised when eligible employees receive the value of the vested benefits
– see note 46 for more details.
14. DEPOSITS
Electricity and water
272 795 233 248
Other deposits
2 149 244
274 944 233 492
Guarantees held in lieu of electricity and water deposits were R38,60 million (2011: R29,26 million). Deposits are released
when the owner/occupant of a property terminates the contract with the City to supply water and electricity to the
property, or when certain contractual services are delivered.

City of Cape Town Auditor-General: 31 August 2012
for the year ended 30 June 2012 Notes to the financial statements
38
Annual financial statements 2012
15. PROVISIONS
Opening
balance
2012
Raised from
statement of
financial
performance
Reversed to
statement of
financial
performance
Transfers from
non-current
Closing
balance
2012
R'000 R'000 R'000 R'000 R'000
Other provisions 149 212 223 132 (45 802) - 326 542
Insurance claims 4 986 8 976 (4 986) - 8 976
Post-retirement benefits 143 518 - (143 518) 212 892 212 892
Legal fees 2 003 - (2 003) - -
Environmental rehabilitation 32 000 - (32 000) 6 500 6 500
Leave benefits 435 952 36 148 (37 489) 36 256 470 867
TOTAL 767 671 268 2556 (265 798) 255 648 1 025 777
Insurance and COID claims
Provision has been made for outstanding insurance claims as at 30 June 2012, funded out of the insurance reserve. The
assessment of claims is based on the assessed quantum of claims received.
Legal fees
Legal costs relating to the process of defending City of Cape Town in Labour Appeal Court and Labour Court cases, for
which court dates have already been set. The calculations of these amounts are based on assessments by attorneys.
Staff leave
Annual leave accrues to employees on a monthly basis, subject to certain conditions. The provision is an estimate of the
amount due to staff as at the financial year-end, based on the value of statutory and non-statutory leave.
2012 2011
R’000 R’000
16. PAYABLES FROM EXCHANGE TRANSACTIONS
Trade creditors
2 589 119 2 152 151
Payments received in advance
800 480 785 846
Inter-company advances
69 746 76 489
Third-party payments
238 908 215 034
Other creditors
84 900 92 397
TOTAL
3 783 153 3 321 917
Guarantees held in lieu of retentions were R219,74 million (2011: R662,24 million).
Payables are non-interest-bearing and are normally settled on
30-day terms, except for retentions which are settled in terms of the
contract agreement.
Payments received in advance are non-interest-bearing and normally
settled on 30-day terms.
Management policies are in place to ensure that all payables are paid
within a reasonable timeframe.
17. UNSPENT CONDITIONAL GRANTS AND RECEIPTS
Conditional grants from other spheres of government
1 603 821 1 040 996
Municipal infrastructure grant (MIG)
- 63 547
National Government
1 378 915 586 486
Provincial Government Western Cape (PGWC) - other
224 906 390 963
Other conditional receipts
61 931 67 684
Public contributions
61 931 67 684
TOTAL
1 665 752 1 108 680
These amounts are separately invested in terms of Section 12 of the MFMA. See note 27 and 28 for more details of grants
from National and Provincial Government.
The unspent portion of the conditional grant will be spent over the next two or three years to the conclusion of the projects
for which they were intended. Substantial portions of the grants were provided in advance for the IRT system.
In many instances, the launch of projects is a protracted process due to interest groups' participation. No amounts are due
for repayment to the donors, for the reasons set out above.

City of Cape Town Auditor-General: 31 August 2012
for the year ended 30 June 2012 Notes to the financial statements
39
Annual financial statements 2012
2012 2011
R’000 R’000
18. VAT
303 077 273 431
VAT payable 420 687 435 785
Impairment
(117 610) (162 354)
VAT receivable (245 321) (216 063)
TOTAL NET VAT PAYABLE
57 756 57 368
The City is registered for VAT on the payment basis. The VAT liability was
impaired as a result of an impairment against debtors.
19. HOUSING DEVELOPMENT FUND
Realised housing proceeds
Opening balance
406 818 397 648
Income
47 781 54 437
Land sales
6 513 2 917
Repayments long-term debtors
29 775 31 342
Repayments public organisations
2 031 3 024
Service contributions
5 321 5 591
Subsidy refunds
4 141 11 563
Interest
19 912 21 761
Expenditure
(55 333) (51 055)
Funding capital projects
(8 519) (22 855)
Funding operating projects
(46 814) (28 200)
Non-cash transfer to provision for impairment
(14 581) (15 973)
Closing balance - realised proceeds
404 597 406 818
Unrealised housing proceeds
Opening balance
132 252 133 824
Loans realised
(29 963) (22 914)
Long-term housing loans
(22 063) (21 395)
Long-term loans public organisations
(7 900) (1 519)
Transfer to provision for impairment - long-term debtors selling schemes
13 906 21 510
Transfer to provision for impairment - long-term public organisations
671 (168)
Closing balance - unrealised proceeds
116 866 132 252
TOTAL
521 463 539 070
Unrealised housing proceeds represent loan repayments not yet due in terms
of the debtors loan agreement.
20. RESERVES
Capital replacement reserve (CRR)
1 274 073 1 186 371
Insurance reserve
496 182 585 163
Self-insurance reserve
438 556 534 055
Compensation for occupational injuries and diseases 57 626 51 108
TOTAL
1 770 255 1 771 534
The CRR and the self-insurance reserve are fully funded and invested in
ring-fenced financial instruments.
21. ACCUMULATED SURPLUS
Accumulated surplus
16 893 664 14 376 892
Receipts from acquired grant-funded assets to the value of R12,23 billion
(2011: R10,57 billion) are included and earmarked to fund the depreciation
charges over the assets’ useful lives.
22. SERVICE CHARGES
Sale of electricity
8 061 911 6 815 178
Sale of water
1 817 183 1 649 307
Waste management
710 609 651 966
Wastewater management
1 002 897 903 205
Other
394 165 340 071
TOTAL
11 986 765 10 359 727
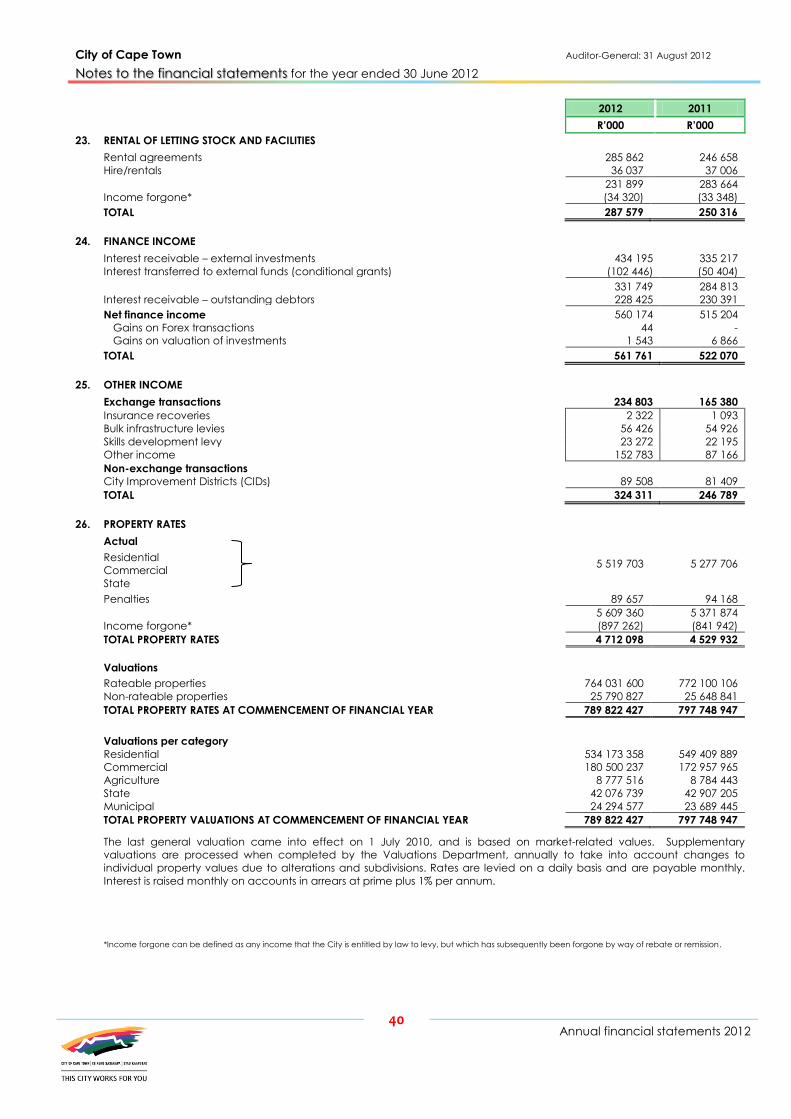
City of Cape Town Auditor-General: 31 August 2012
for the year ended 30 June 2012 Notes to the financial statements
40
Annual financial statements 2012
2012 2011
R’000 R’000
23. RENTAL OF LETTING STOCK AND FACILITIES
Rental agreements 285 862 246 658
Hire/rentals 36 037 37 006
231 899 283 664
Income forgone* (34 320) (33 348)
TOTAL 287 579 250 316
24. FINANCE INCOME
Interest receivable – external investments
434 195 335 217
Interest transferred to external funds (conditional grants) (102 446) (50 404)
331 749 284 813
Interest receivable – outstanding debtors
228 425 230 391
Net finance income
560 174 515 204
Gains on Forex transactions 44 -
Gains on valuation of investments
1 543 6 866
TOTAL
561 761 522 070
25. OTHER INCOME
Exchange transactions 234 803 165 380
Insurance recoveries
2 322 1 093
Bulk infrastructure levies
56 426 54 926
Skills development levy
23 272 22 195
Other income 152 783 87 166
Non-exchange transactions
City Improvement Districts (CIDs)
89 508 81 409
TOTAL
324 311 246 789
26. PROPERTY RATES
Actual
5 519 703 5 277 706
Residential
Commercial
State
Penalties
89 657 94 168
5 609 360 5 371 874
Income forgone*
(897 262) (841 942)
TOTAL PROPERTY RATES 4 712 098 4 529 932
Valuations
Rateable properties
764 031 600 772 100 106
Non-rateable properties
25 790 827 25 648 841
TOTAL PROPERTY RATES AT COMMENCEMENT OF FINANCIAL YEAR 789 822 427 797 748 947
Valuations per category
Residential
534 173 358 549 409 889
Commercial
180 500 237 172 957 965
Agriculture
8 777 516 8 784 443
State
42 076 739 42 907 205
Municipal
24 294 577 23 689 445
TOTAL PROPERTY VALUATIONS AT COMMENCEMENT OF FINANCIAL YEAR 789 822 427 797 748 947
The last general valuation came into effect on 1 July 2010, and is based on market-related values. Supplementary
valuations are processed when completed by the Valuations Department, annually to take into account changes to
individual property values due to alterations and subdivisions. Rates are levied on a daily basis and are payable monthly.
Interest is raised monthly on accounts in arrears at prime plus 1% per annum.
*Income forgone can be defined as any income that the City is entitled by law to levy, but which has subsequently been forgone by way of rebate or remission.

City of Cape Town Auditor-General: 31 August 2012
for the year ended 30 June 2012 Notes to the financial statements
41
Annual financial statements 2012
2012 2011
R’000 R’000
27. GOVERNMENT GRANTS AND SUBSIDIES
Unconditional grants
970 474 910 437
Equitable share
970 474 836 662
Other - 73 775
Conditional grants
2 787 361 1 726 032
Municipal infrastructure grant (MIG)
- 249 772
Provincial health subsidies 136 113 129 925
Provincial: Other - 3 843
Cape Metropolitan Transport Fund (CMTF)
30 049 32 824
National projects
1 919 890 705 761
Provincial projects – other 700 901 592 282
Other
408 11 625
TOTAL
3 757 835 2 636 469
The City does not foresee a significant decrease in the level of grant
funding.
Unconditional grants
These grants are used to subsidise the provision of basic services to
indigent communities.
Analysis of government grants and subsidies
Operating 1 626 991 1 385 536
Capital 2 130 844 1 250 933
3 757 835 2 636 469
Municipal infrastructure grant projects
Balance unspent at beginning of the year
(63 547) -
Regrouping adjustment
- 70 407
Current-year receipts
- (383 726)
Adjustments
63 547 -
Conditions met – transferred to revenue
- 249 772
Conditions still to be met – transferred to liabilities – see note 17 - (63 547)
This grant was used to fund the construction of infrastructural assets for the
City. The conditions of the grant have been met. No funds have been
withheld.
Provincial health subsidies
Balance unspent at beginning of year - -
Current-year receipts – included in public health vote - (129 925)
Conditions met – transferred to revenue - 129 925
Conditions still to be met – transferred to liabilities - -

City of Cape Town Auditor-General: 31 August 2012
for the year ended 30 June 2012 Notes to the financial statements
42
Annual financial statements 2012
2012 2011
R’000 R’000
Provincial projects and CMTF
Balance unspent at beginning of the year (390 963) (246 903)
Regrouping adjustment
68 302 1 545
Reclassification - 3 843
Current-year receipts
(523 637) (719 762)
Interest earned
(7 384) (6 597)
Adjustments
1 646 (18 241)
Conditions met – transferred to revenue
730 950 625 106
Amounts still to be claimed
(103 820) (29 954)
Conditions still to be met – transferred to liabilities – see note 17 (224 906) (390 963) (246 903)
National Government projects
Balance unspent at beginning of year (590 020) (702 923)
Regrouping adjustment 11 380 2 848
Reclassification - 73 775
Current-year receipts (2 625 891) (640 032)
Interest earned (90 070) (37 312)
Adjustments (3 999) 7 863
Conditions met – transferred to revenue 1 919 890 705 761
Amounts still to be claimed/(spent) (205) -
Conditions still to be met – transferred to liabilities – see note 17 (1 378 915) (590 020)
These grants received from National Government are for operating and
capital expenditure, such as budget reform, restructuring, urban renewal,
and so forth. Excluding the amounts unspent, the conditions of the grants
have been met – see Appendix D.
28. PUBLIC CONTRIBUTIONS
Public contributions: Consumer connections
36 984 40 383
Other
26 369 39 337
63 353 79 720
Public contributions and other third-party funds
Balance unspent at beginning of the year
(67 684) (98 614)
Regrouping adjustment
(613) 6 390
Reclassification - 17 900
Current-year receipts
(58 587) (44 529)
Interest earned
(802) (1 372)
Adjustments
6 259 (3 509)
Conditions met – transferred to revenue
62 353 61 820
Amounts still to be claimed
(2 857) (5 770)
Conditions still to be met – transferred to liabilities – see note 17 (61 931) (67 684)
The City receives grants from various private vendors for operating and
capital projects. Included in these funds are monies held on behalf of third
parties. Other than the amounts unspent, the conditions of the grants
have been met. No funds have been withheld.
29. EMPLOYEE-RELATED COSTS
Salaries and wages
4 276 995 3 932 202
Social contributions – UIF, pensions and medical aid
1 125 294 1 031 092
Travel, car, accommodation, subsistence and other allowances
287 457 273 051
Housing benefits and allowances
31 061 31 315
Overtime payments
310 205 277 174
Contribution: Post-retirement and long-service
878 229 600 062
6 909 241 6 144 896
Expenditure recharged to capital projects (22 137) (24 663)
TOTAL
6 887 104 6 120 233

City of Cape Town Auditor-General: 31 August 2012
for the year ended 30 June 2012 Notes to the financial statements
43
Annual financial statements 2012
2012 2011
R’000 R’000
30. REMUNERATION OF COUNCILLORS
Executive Mayor 1 050 971
Deputy Executive Mayor 740 766
Speaker 740 766
Chief Whip 695 719
Mayoral Committee Members 7 350 6 497
Subcouncil Chairpersons 15 206 15 117
Councillors 67 924 54 274
Councillors’ pension contributions 4 067 9 511
TOTAL 97 772 88 621
31. IMPAIRMENT COSTS
Allowances for impairment losses
818 450 773 226
Impairment of property, plant and equipment 27 392 9 866
TOTAL
845 842 783 092
32. DEPRECIATION AND AMORTISATION EXPENSE
Depreciation of property, plant and equipment 1 355 425 1 249 295
Depreciation of investment property
1 653 2 598
Amortisation of intangible assets
15 018 10 207
TOTAL – see to notes 1, 3, 4 and Appendix B 1 372 096 1 262 100
33. FINANCE COSTS
Interest expenses
645 900 683 588
Borrowings (amortised cost)
641 038 661 870
Finance leases (amortised cost)
4 862 21 718
Unwinding of discount 35 350 33 604
Amortisation of bond issue expenses
283 283
TOTAL
681 533 717 475
34. BULK PURCHASES
Electricity 5 385 001 4 326 842
Water 320 262 293 323
TOTAL 5 705 263 4 620 165
35. GRANTS AND SUBSIDIES PAID
Community development and upliftment
9 384 9 315
Economic development and promotion of tourism 71 238 71 307
Education institutions
1 239 1 204
Health forum/health, HIV Aids and programmes 3 675 4 909
Senior citizens – facilities for the aged
289 456
Social development and arts and culture
5 438 5 647
Sporting bodies
2 229 544
Wesgro
10 000 -
TOTAL
103 492 93 382

City of Cape Town Auditor-General: 31 August 2012
for the year ended 30 June 2012 Notes to the financial statements
44
Annual financial statements 2012
2012 2011
R’000 R’000
36. GENERAL EXPENSES
Chemicals
99 450 91 898
Communication and publication
28 743 26 255
Computer services and software
25 508 19 174
Consultants
147 364 141 440
ESKOM – Free basic electricity subsidy (FBE)* 93 563 70 981
Fuel
190 792 143 758
Furniture and fittings
36 15
Hire charges
147 134 118 739
Legal fees
34 698 35 941
Levy: Skills development
48 398 43 499
Licences and permits
70 303 70 869
Materials and consumables
273 402 279 307
City improvement districts (CIDs)
86 823 78 967
Minor tools and equipment
51 172 50 283
Pharmaceutical supplies
71 874 75 441
Postage and courier
26 572 25 973
Printing and stationery
61 545 56 958
Rental
56 561 62 849
Inventory: Scrapped 5 402 1 243
Security services
311 703 272 550
Sewerage services – disposals external 47 450 35 209
Telecommunications
113 985 114 246
Training
69 676 52 179
Insurance: Claims
26 659 26 611
Insurance: Underwriting
25 557 26 217
Indigent relief
369 226 338 696
Contributions, transfers and other
650 684 515 304
3 134 280 2 774 602
Expenditure recharged to capital projects (2 397) (3 253)
TOTAL
3 131 883 2 771 349
37. CASH GENERATED FROM OPERATIONS
Surplus for the year
2 497 887
1 831 705
Adjustment for :
2 649 685
2 467 771
Depreciation
1 372 096
1 262 100 Impairment
27 392
9 866 Gains and losses on disposal of property, plant and equipment
(42 420)
(17 051) Contribution to provisions
821 970
491 448 Contribution to impairment provision
350 873
526 003 Finance income
(561 761)
(522 070) (563 873) (503 857) 2 112 (18 213) Finance costs
681 533
717 475
Operating surplus before working capital changes
5 147 570
4 299 476 (Increase) in inventories
(17 759)
(38 169) (Increase) in receivables
(637 980)
(845 591) (Increase)/Decrease in other receivables
(94 683)
116 942 Increase in unspent conditional grants and receipts
557 072
60 240 Increase in payables
461 236
259 030 Increase in net VAT
388
6 207 Cash generated from operations
5 415 844
3 858 135
38. CASH AND CASH EQUIVALENTS
Balance at the end of the year
3 327 832 3 151 257
Balance at the beginning of the year
3 151 257 4 511 179
Net increase/(decrease) in cash and cash equivalents – see note 11 176 575 (1 359 922)
*Payment to ESKOM to subsidise the FBE portion supplied by ESKOM to residence in the City.

City of Cape Town Auditor-General: 31 August 2012
for the year ended 30 June 2012 Notes to the financial statements
45
Annual financial statements 2012
2012 2011
R’000 R’000
39. RECONCILIATION OF UTILISATION OF LONG-TERM LIABILITIES
External finance fund (EFF) earmarked capital expenditure
(3 801 138) (2 700 480)
2010/11 and prior years
(2 700 480) (1 720 913)
Current year
(1 100 658) (979 567)
Total External finance fund (overdrawn)
(3 801 138) (2 700 480)
Cash set aside for the repayment of long-term liabilities – see note 6 and 12 641 651 476 998
Cash overdrawn
(3 159 487) (2 223 482)
40. BUDGET INFORMATION
40.1 Explanation of variances between approved and final budget amounts
The reasons for the variances between the approved and final budgets are mainly due to virements, and the negative
effect of the abnormal high electricity and solid waste tariff increases on consumer debtors. The decrease in the expected
capital expenditure, and the reprioritising of capital projects, with the corresponding changes to funding sources.
40.2 Explanation of variances greater than 5%: final budget and actual amounts
40.2.1 Statement of financial position
i) Current assets
The cash available were much higher than anticipated due to underspending of capital and operating expenditure
as well as higher than expected payables.
ii) Current liabilities
The actual payables were higher than the budget due to much higher capital spend in June 2012 than what was
budgeted for.
40.2.2 Statement of financial performance
Revenue
i) Rental of letting stock and facilities
The variance is as the result of improved processes relating to rental of property and facilities.
ii) Finance income
Interest earned on the continuous favorable cash/investment balance during the year.
iii) Licences and permits
The variance is the result of an increased number of licenses and permits issued and an improvement in administrative
processes relating to the issue of licenses and permits.
iv) Agency services
The variance is the result of an increase in the number of transactions processed on behalf of Provincial Government.
v) Other income
The variance is the result of a refund on Water Levies paid in the previous financial year and a VAT refund on IRT
related transactions as agreed with SARS.
vi) Fines
The variance is as result of fines reviewed by traffic courts and the number of fines issued by the respective
departments.
vii) Government grants and subsidies
The spending on these projects were influenced by a number of factors, such as delays in the implementation of
various projects, community dynamics, change in contract scope, contract award objection processes, environmental
issues, delays in delivery of materials/goods and contractor performance, thus resulting in underspending for the year.
Various projects will be completed in the 2012/13 financial year and the funding will be rolled over in the August 2012
adjustments budget.
viii) Public contributions
The variance is mainly due to slower than expected property development due to economic downturn resulting in less
Development Levies collected..
ix) Gains on disposal of property, plant and equipment
The variance is due to difficulties in planning the finalisation date of various property sales and transactions that are still
in progress.

City of Cape Town Auditor-General: 31 August 2012
for the year ended 30 June 2012 Notes to the financial statements
46
Annual financial statements 2012
Expenditure
i) Remuneration of councillors
Variance due to less than anticipated transport claims submitted by councillors and the impact of the revised
implementation date by the MEC for the conversion of the Section 79 committee chairpersons to full time councillors.
ii) Impairment costs
The variance is due to lower than anticipated debt impairment mainly on Rates and Electricity services resulting from
an improved actual collection ratio achieved and maintained during the year and the impact of the energy savings
campaign.
iii) Finance costs
The variance is mainly due to the provision made for a long term external loan which has not been taken up as the
City had maintain a favorable cash position throughout the financial year.
40.2.3 Cash flow statement
i) Net cash from operating activities
Mainly due to the cash paid to suppliers and employees being lower than expected due to an udnerspending of
operating expenditure and higher than expected payables at year end.
ii) Net cash from investing activities
Investments increased rather than decreased as expected due to underspending of capital and operating
expenditure. Another contributing factor is the higher than expected payables at year end as more than anticipated
expenditure had been deferred to the 2012/13 financial year.
ii) Net cash from financing activities
Mainly due to a higher than expected increase in the consumer deposits.
40.2.4 Capital expenditure
i) City Manager
Under-expenditure as a result of the contingency provisions which are only utilised for the replacement of assets as and
when insurance claims are settled.
ii) Deputy City Manager
Due to project delays caused by poor performance from contractors not meeting project deadlines. Due to the
adjustment made to the specifications of the contract, further approval from Treasury and SCM was required which
resulted in a temporary suspension in operations and contingency provisions which are only utilised for the
replacement of assets as and when insurance claims are settled.
iii) Economic, Environment and Spatial Planning
Under expenditure as result of the delay of signing of the contracts with relevant stakeholders on certain projects and
appeals against tenders awarded on certain projects.
iv) Social and Early Childhood Development
Under-expenditure on capital projects were caused by cash flows problems experienced by contractors, delays
experienced in land transfers and community interference in the implementation of certain projects.
v) Tourism, Events and Marketing
The variance in expenditure was primarily caused by delays in the commencement of projects due to: environmental
and legal requirements, factors beyond the control of the department such as bad weather conditions and the
prolonged adjudication of tenders and extension in contract periods.
vi) Transport, Roads and Stormwater
Under-expenditure is mainly as a result of: slower implementation of the IRT Inner City bus stop infrastructure and other
IRT contracts due to frequent design changes being required as a result of the presence of existing services where
these had not been indicated on service plans; community disruptions and delays on some housing related projects;
delivery of fewer IRT buses than had been programmed by end June 2012; delays in resolution by the Appeal Authority
of Section 62 appeals against the awards of some major road contracts.
vii) Human Settlements
Expenditure variations on the variety of integrated human settlements developments undertaken by the City of Cape
Town include matters associated with comprehensive community engagements which take longer than anticipated,
unseasonal weather, project planning approvals et al. Beneficial savings on land acquisitions also resulted in a level of
underspend against this budget item.
viii) Water and wastewater management
As a result of departmental constraints such as lack of adequate staff to supervise projects, delays were experienced
in completing certain projects. Inefficiencies from other departments within the City that led to the delay in the
commencement of projects such as approval of Tenders by SCM and the time taken by Legal department to resolve
appeals against tenders awarded. Under-performance of contractors and supply constraints. Environmental Impact
Analyses and obtaining of way leaves. Bad weather conditions experienced during the year which led to project
backlogs. Better cost management techniques which resulted in cost savings on projects completed.
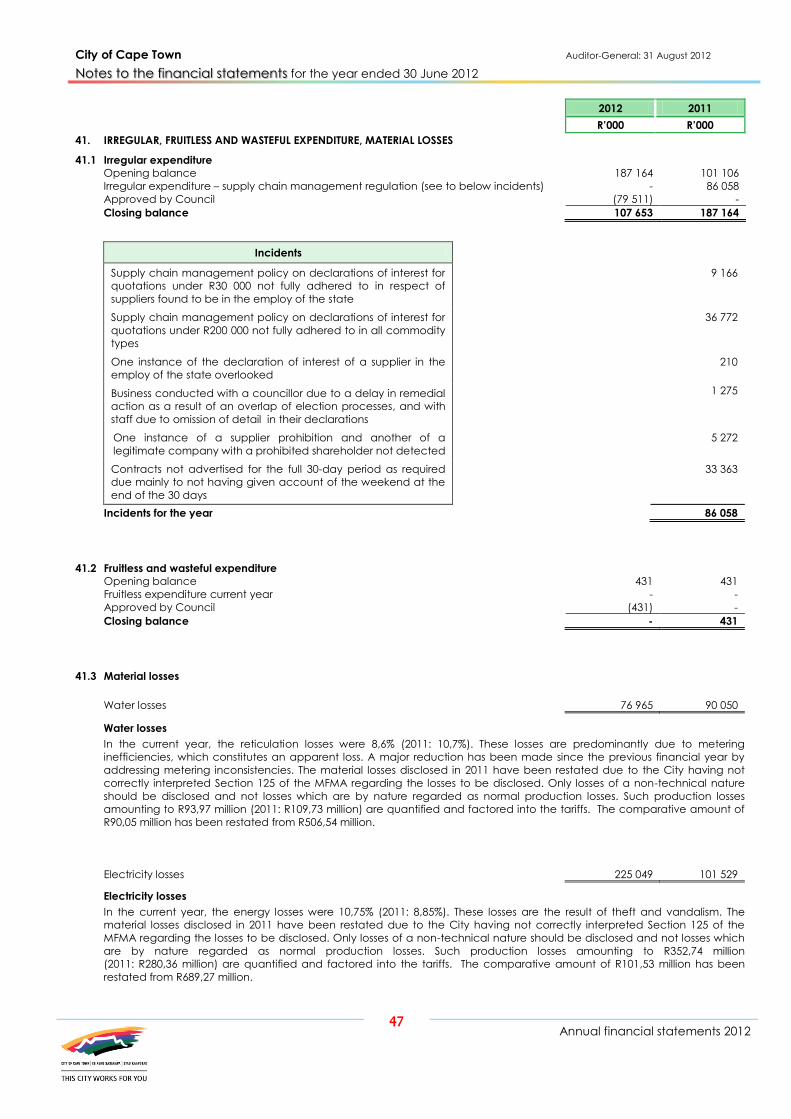
City of Cape Town Auditor-General: 31 August 2012
for the year ended 30 June 2012 Notes to the financial statements
47
Annual financial statements 2012
2012 2011
R’000 R’000
41. IRREGULAR, FRUITLESS AND WASTEFUL EXPENDITURE, MATERIAL LOSSES
41.1 Irregular expenditure
Opening balance
187 164 101 106
Irregular expenditure – supply chain management regulation (see to below incidents) - 86 058
Approved by Council (79 511) -
Closing balance
107 653 187 164
Incidents
Supply chain management policy on declarations of interest for
quotations under R30 000 not fully adhered to in respect of
suppliers found to be in the employ of the state
9 166
Supply chain management policy on declarations of interest for
quotations under R200 000 not fully adhered to in all commodity
types
36 772
One instance of the declaration of interest of a supplier in the
employ of the state overlooked
210
Business conducted with a councillor due to a delay in remedial
action as a result of an overlap of election processes, and with
staff due to omission of detail in their declarations
1 275
One instance of a supplier prohibition and another of a
legitimate company with a prohibited shareholder not detected
5 272
Contracts not advertised for the full 30-day period as required
due mainly to not having given account of the weekend at the
end of the 30 days
33 363
Incidents for the year 86 058
41.2 Fruitless and wasteful expenditure
Opening balance 431 431
Fruitless expenditure current year - -
Approved by Council (431) -
Closing balance - 431
41.3 Material losses
Water losses 76 965 90 050
Water losses
In the current year, the reticulation losses were 8,6% (2011: 10,7%). These losses are predominantly due to metering
inefficiencies, which constitutes an apparent loss. A major reduction has been made since the previous financial year by
addressing metering inconsistencies. The material losses disclosed in 2011 have been restated due to the City having not
correctly interpreted Section 125 of the MFMA regarding the losses to be disclosed. Only losses of a non-technical nature
should be disclosed and not losses which are by nature regarded as normal production losses. Such production losses
amounting to R93,97 million (2011: R109,73 million) are quantified and factored into the tariffs. The comparative amount of
R90,05 million has been restated from R506,54 million.
Electricity losses 225 049 101 529
Electricity losses
In the current year, the energy losses were 10,75% (2011: 8,85%). These losses are the result of theft and vandalism. The
material losses disclosed in 2011 have been restated due to the City having not correctly interpreted Section 125 of the
MFMA regarding the losses to be disclosed. Only losses of a non-technical nature should be disclosed and not losses which
are by nature regarded as normal production losses. Such production losses amounting to R352,74 million
(2011: R280,36 million) are quantified and factored into the tariffs. The comparative amount of R101,53 million has been
restated from R689,27 million.

City of Cape Town Auditor-General: 31 August 2012
for the year ended 30 June 2012 Notes to the financial statements
48
Annual financial statements 2012
2012 2011
R’000 R’000
42. COMMITMENTS
42.1 CAPITAL COMMITMENTS
Commitments in respect of capital expenditure Approved and contracted for:
Infrastructure 1 418 983 480 101
Community 21 302 141 212
Other 587 050 277 215
TOTAL 2 027 335 898 528
42.2 OPERATING LEASE COMMITMENTS
The City as lessee
Future minimum lease payments under non-cancellable operating leases.
Buildings
68 279 56 420
Payable within one year
25 622 44 559
Payable within two to five years
42 657 11 861
Vehicles and other equipment
56 439
Payable within one year
56 116
Payable within two to five years
- 254
Payable after five years
- 69
68 335 56 859
Minimum lease payments recognised as an expense during the period
amount to R44,68 million (2011: R62,63 million). Leased premises are
contracted for remaining periods of between one and four years, with
renewal options available in certain instances.
The City has minimal current lease arrangements for photocopy and fax
machines over a period of one year, without being subject to escalation.
In terms of a recent Council policy decision, such leased equipment shall
be purchased upon termination of the relevant contract. In keeping with
this policy, it has been decided to terminate lease agreements in respect
of older equipment, where the initial period has expired, and the lease is
continuing on a month-to-month basis.
The City as lessor
Future minimum lease income under non-cancellable operating leases.
Buildings 54 446 802 477 375
Receivable within one year 26 589 21 389
Receivable within two to five years 46 910 74 117
Receivable after five years 54 373 303 381 869
54 446 802 477 375
The City has properties under operating lease. Property rental income earned during the year was R42,58 million
(2011: R25,84 million). The properties are maintained by the tenants, at their cost. No investment properties have been
disposed of since the statement of financial performance date.
The impact of charging the escalations in operating leases on a straight-line basis over the term of the lease has been a
decrease in current year income of R4,62 million.

City of Cape Town Auditor-General: 31 August 2012
for the year ended 30 June 2012 Notes to the financial statements
49
Annual financial statements 2012
43. ADDITIONAL DISCLOSURES
43.1 MUNICIPAL FINANCE MANAGEMENT ACT
43.1.2 Section 124
Disclosures concerning councillors, directors and officials
As at 30 June 2012
There were no arrear accounts outstanding.
Total
Outstanding
<90 days
Outstanding
>90 days
R R R
As at 30 June 2011
F.C. Christians 6 526 580 5 946
E.N. Hinana 15 357 11 239 4 118
C.W. Ipser 10 749 6 502 4 247
L.D. Jordaan 5 721 - 5 721
L. Maci 1 859 95 1 764
H.K. Morkel – Carthen Investment (Pty) Ltd 47 040 - 47 040
N. Ndzulwana 4 020 333 3 687
N.C. Nyakatya 1 614 975 639
T. Sakathi 1 964 782 1 182
M. Weavers 4 379 1 102 3 277
G.L. Zondani 2 808 2 335 473
These balances have been paid in full at 31 August 2011 102 037 23 943 78 094
F.L. Abrahams 9 841 700 9 141
A. Gabuza 7 239 811 6 428
T. Gqada 20 612 - 20 612
V.R. Isaacs 43 678 17 226 26 452
L.V. James 17 807 1 495 16 312
C.J. Mack 11 021 8 438 2 583
J.J. Maxheke 14 880 944 13 936
A.X. Ndongeni 65 300 2 018 63 282
Arrangements are in place for the payment of these balances 190 378 31 632 158 746
Total 292 415 55 575 236 840
43.1.2 Section 125
Other compulsory disclosures
SALGA
contributions
Audit
fees
PAYE
UIF
Pension and
medical aid
R'000 R'000 R'000 R'000
As at 30 June 2012
Opening balance
7 170 481 60 419 141 774
Subscriptions/fees
9 500 16 547 804 472 1 813 266
Amount paid – current year
(9 500) (16 284) (741 929) (1 657 961)
Amount paid – previous years
(7 170) (481) (60 419) (141 774)
Balance unpaid (included in payables)
- 263 62 543 155 305
As at 30 June 2011
Opening balance
- 1 296 53 222 122 658
Subscriptions/fees
13 862 18 491 757 366 1 623 657
Amount paid – current year
- (18 010) (696 947) (1 481 883)
Amount paid – previous years
(6 692) (1 296) (53 222) (122 658)
Balance unpaid (included in payables)
7 170 481 60 419 141 774

City of Cape Town Auditor-General: 31 August 2012
for the year ended 30 June 2012 Notes to the financial statements
50
Annual financial statements 2012
2012 2011
R’000 R’000
43.2 SUPPLY CHAIN MANAGEMENT REGULATIONS
43.2.1 Deviations
In terms of section 36 of the Municipal Supply Chain Management
Regulations, any deviation from supply chain management policy needs
to be approved/condoned by the City Manager, and noted by Council.
The expenses incurred, as listed below, have been approved/condoned
by the City Manager and noted by Council. Deviations have been
approved in principle subject to controls such as unit cost and costs and
budget availability.
Incident
Appointment of consultants
72 543 41 068
Information technology upgrade 18 131 7 402
Upgrading of electricity services
- 3 344
Extension of contracts
289 845 518 289
Upgrading of road infrastructure
10 588 32 402
Supply and delivery of plant and equipment 11 092 59 430
Others
39 660 155 078
Deviations less than R200 000 333 615 290 999
Total amount condoned by Council 775 474 1 108 012
All deviations considered by the City Manager are processed in terms of the Supply Chain Management Regulation and the
Supply Chain Management Policy. This process entails being assessed by the Supply Chain Management Bid Adjudication
Committee in terms of the stipulated criteria of procurements of an emergency nature, availability from only one provider,
art historic objects, circumstances where it is impractical or impossible to follow the official procedure or correction of minor
breaches of a technical nature.
43.2.2 Ratification of SCM breaches
2012
R’000
The calling for declaration of interest for quotation under
R200 000 only fully implemented by December 2011. In addition
the non-calling could have given rise to the possibility that the
City may have traded with “employees in service of the State”.
41 593
Contracts not advertised for the full 30-day period as required
due mainly to not having given account of the weekend at the
end of the 30 days
182 167
Total 223 760

City of Cape Town Auditor-General: 31 August 2012
for the year ended 30 June 2012 Notes to the financial statements
51
Annual financial statements 2012
43.2.3 Bids awarded to family of employees in service of the State
In terms of the SCM regulations, any award above R2 000 to family of employee in the service of the State must be
disclosed in the annual financial statements. Herewith a list as recorded in the declaration of interest form.
2012 2011
R’000 R’000
Name Position held in State
J. Adams Secretary
130 152 J. Arendse Handyman 363 167 M.F. Baloyi Worker - 8 P. Booysen Clerk 1 115 1 115 B. Brooks Area Manager 44 - G. Buitendag Principal Professional Officer 3 160 - A. Cedras Senior Superintendent 1 058 1 317 A. Charles Functional Operational Manager - 31 C. Connor Head: COID 238 - L. Daniels Senior Foreman 979 - S.S. Daries Senior Superintendent 4 51 R. Davids COCT SCM Assistant buyer 459 250 J. du Toit Inspector 39 609 37 878 J. du Toit COCT SCM Assistant buyer 251 222 B. Francis Administrative Officer 1 7 N. Goniwe Water Pollution Control Inspector 279 417 T. Hartogh Superintendent - 12 G. Hector Superintendent - 4 J. Hintenaus Environmental Health Officer - 4 N. Hoosain Clerk 823 566 A. Hoppie Clerk - 3 D. Isaacs Clerk 8 42 E. Ishmail Manager : Valuations Data and systems 5 364 - L. January Head : Area 116 27 B. Jones Clerk 272 - A. Jonkers Senior Foreman - 40 M.F. Khan Clerk 232 180 W. Kloppers Senior Health Practitioner - 3 G. Koning Enrolled Nurse 18 52 X. Mama Head : Area Manager 449 - J. Manuel Traffic Officer 13 7 J. Maputsi Learner Fire Fighter/Fire Fighter/Senior 753 1 587 S.S. Merile Operator: Small Plant 663 1 071 D. Michaels Administrative Officer - 15 K. Modack Specialist Clerk 83 - M.C. Mshweshwe Statutory Compliance Specialist 344 53 V. Mwahla Head : Area - 6 M. Pardenwachter Professional Officer 45 - J. Pienaar Senior Professional Officer - 2 R. Platen Special Workman 4 5 C. Rhoda Clerk 10 607 7 222 M.F. Sammy Administrative Officer 104 68 M.S. Shaheed Clerk 1 163 - P.A. Singama Administrative Officer - 15 Q.G. Sipoyo Risk and Safety Advisor 858 350 P. Smith Administrative Officer 66 - P. Sonyabashe Worker 538 172 R. Swanson Courier 63 117 L. Swartz Clerk - 58 I. Taliep Clerk - 236 M. Thorpe COCT SCM Assistant buyer 376 366 W. Timotheus Operational Supervisor/ Driver 4 13 F. Trom Worker 11 5 M. Valentine Senior Operational Supervisor/ Driver - 65 C. van der Vendt Senior Worker 343 379 E. Vermeulen Assistant Librarian (Part Time) - 64 M.F. Votersen Head : Finance Parks 1 248 1 148 J. Williams Clerk 2 127
Total - bids awarded to family of employees in service of the State 72 260 55 699

City of Cape Town Auditor-General: 31 August 2012
for the year ended 30 June 2012 Notes to the financial statements
52
Annual financial statements 2012
44. FINANCIAL RISK MANAGEMENT
Exposure to currency, interest rate, liquidity and credit risk arises in the normal course of the City’s operations. This note
presents information about the City’s exposure to each of the above risks, policies and processes for measuring and
managing risk, and the City’s management of capital. Further quantitative disclosures are included throughout these
financial statements.
Council has established a Risk Management Committee, which is responsible for developing and monitoring the City’s risk
management policies. Every quarter, the risk management committee’s reports are presented to the Audit Committee. The
Risk Management Committee’s policies are established to identify and analyse the risks faced by the City, to set
appropriate risk limits and controls, and to monitor risks and adherence to limits. Risk management policies and systems are
reviewed regularly to reflect changes in the City’s activities.
The accounting policy for financial instruments was applied to the following statement of financial position items:
Amortised
cost
Assets at
fair value Cost
Total
carrying
amount
Carrying
amount fair
value
R'000 R'000 R'000 R'000 R'000
Financial assets
2012
Investments
111 529 2 883 350 38 768 3 033 647 3 074 886
Long-term receivables 119 086 - - 119 086 119 086
Receivables
3 979 256 - - 3 979 256 3 979 256
Other receivables
303 295 - - 303 295 303 295
Cash and cash equivalents 1 615 782 1 712 050 - 3 327 832 3 327 832
6 128 948 4 595 400 38 768 10 763 116 10 804 355
2011
Investments
161 771 2 096 302 38 768 2 296 841 2 318 089
Long-term receivables 134 719 - - 134 719 134 719
Receivables
3 709 111 - - 3 709 111 3 709 111
Other receivables
194 129 - - 194 129 194 129
Cash and cash equivalents 1 609 521 1 541 736 - 3 151 257 3 151 257
5 809 251 3 638 038 38 768 9 486 057 9 506 834
Amortised
cost
Total carrying
amount
Carrying
amount fair
value
R'000 R'000 R'000
Financial liabilities
2012
Borrowings
5 470 607 5 470 607 6 276 226
Payables
2 982 673 2 982 673 2 982 673
8 453 280 8 453 280 9 224 539
2011
Borrowings
5 649 189 5 649 189 6 241 866
Payables
2 536 071 2 536 071 2 536 071
8 185 260 8 185 260 8 777 937

City of Cape Town Auditor-General: 31 August 2012
for the year ended 30 June 2012 Notes to the financial statements
53
Annual financial statements 2012
44.1 Fair values
The table below analyses financial instruments carried at fair value at the end of the reporting period, by level of fair-value
hierarchy as required by GRAP 104. The different levels are based on the extent to which quoted prices are used in the
calculation of the fair value of the financial instruments, and the levels have been defined as follows:
Level 1: Fair values are based on quoted market prices (unadjusted) in active markets for an identical instrument.
Level 2: Fair values are calculated using valuation techniques based on observable inputs, either directly (i.e. as prices) or
indirectly (i.e. derived from prices). This category includes instruments valued using quoted market prices in
active markets for similar instruments, quoted prices for identical or similar instruments in markets that are
considered less than active, or other valuation techniques where all significant inputs are directly or indirectly
observable from market data.
Level 3: Fair values are based on valuation techniques using significant unobservable inputs. This category includes all
instruments where the valuation technique includes inputs not based on observable data, and the unobservable
inputs have a significant effect on the instrument’s valuation. Also, this category includes instruments that are
valued based on quoted prices for similar instruments, where significant unobservable adjustments or assumptions
are required to reflect differences between the instruments.
Level 1 Level 2 Level 3 Total
R'000 R'000 R'000 R'000
Financial assets
2012
Investments 1 844 250 1 039 100 - 2 883 350
Cash and cash equivalents - 1 712 050 - 1 712 050
- 4 595 400 - 4 595 400
2011
Investments 1 832 242 264 060 - 2 096 302
Cash and cash equivalents - 1 541 736 - 1 541 736
1 832 242 1 805 796 - 3 638 038
44.2 Credit risk
Credit risk is the risk of financial loss to the City if customers or counterparties to financial instruments fail to meet their
contractual obligations, and arises principally from the City’s investments, loans, receivables, and cash and cash
equivalents.
The carrying amount of financial assets represents the maximum credit exposure. The maximum exposure to credit risk as at
30 June was:
2012 2011
R’000 R’000
Investments – see note 6 2 994 879 2 258 073
Loans receivable –see note 7 119 086 134 719
Receivables and other receivables – see note 9 and 10 4 282 551 3 903 240
Cash and cash equivalents – see note 11 3 327 832 3 151 257
Total 10 724 348 9 447 289
Investments
The City limits its exposure to credit risk by investing with only reputable financial institutions that have a sound credit rating,
and within specific guidelines set in accordance with Council’s approved investment policy. Consequently, the City does
not consider there to be any significant exposure to credit risk.
Loans receivable
Loans are granted and managed in accordance with policies and regulations as set out in note 7. The associated interest
rates and repayments are clearly defined and, where appropriate, the City obtains certain suitable forms of security when
granting loans. Allowances for impairment are made in certain instances.

City of Cape Town Auditor-General: 31 August 2012
for the year ended 30 June 2012 Notes to the financial statements
54
Annual financial statements 2012
Receivables
Receivables are amounts owing by consumers, and are presented net of impairment losses. The City has a credit risk policy
in place, and the exposure to credit risk is monitored on an ongoing basis. The City is compelled in terms of its constitutional
mandate to provide all its residents with basic minimum services, without recourse to an assessment of creditworthiness.
There were no material changes in the exposure to credit risk and its objectives, policies and processes for managing and
measuring the risk during the year under review. The City’s strategy for managing its risk includes encouraging residents to
install water management devices that control water flow to households, as well as prepaid electricity meters. In certain
instances, a deposit is required for new service connections, serving as a guarantee.
The City’s maximum exposure to credit risk is represented by the carrying value of each financial asset in the statement of
financial performance. The City has no significant concentration of credit risk, with exposure spread over a large number of
consumers, and is not concentrated in any particular sector or geographical area. The City establishes an allowance for
impairment that represents its estimate of anticipated losses in respect of receivables. The outstanding amounts of the ten
largest debtors represent 0,87% (2011: 1,2%) of the total outstanding balance. The average credit period on services
rendered is 30 days from date of invoice. Interest is raised at prime plus 1% on any unpaid accounts after due date. The
City has provided fully for all receivables outstanding over 365 days. Receivables up to 365 days are provided for based on
estimated irrecoverable amounts, determined by reference to past default experience. Additional information relating to
the analysis of receivables is given in note 9 and 10.
Payment of accounts of consumer debtors who are unable to pay, are renegotiated as an ongoing customer relationship in
response to an adverse change in the circumstances of the customer.
Cash and cash equivalents
The City limits its exposure to credit risk by investing with only reputable financial institutions that have a sound credit rating,
and within specific guidelines set in accordance with Council’s approved investment policy. Consequently, the City does
not consider there to be any significant exposure to credit risk.
44.3 Liquidity risk
Liquidity risk is the risk that the City will not be able to meet its obligations as they fall due. The City’s approach to managing
liquidity risk is to ensure that sufficient liquidity is available to meets its liabilities when due, without incurring unacceptable
losses or risking damage to the City’s reputation.
The City ensures that it has sufficient cash on demand to meet expected operating expenses through the use of cash flow
forecasts.
On average, 94,93% (2011: 93,88%) of receivables (own billed) income is realised within 30 days after due date, and
payables are settled within 30 days of invoice. National and provincial grant funding is received in terms of the Division of
Revenue Act (DORA).
The following are contractual liabilities of which interest is included in borrowings:
Up to 1 year 1-5 years >5 years Total
R'000 R'000 R'000 R'000
2012
Liabilities
Borrowings 912 619 3 032 677 8 068 994 12 014 290
Capital repayments 294 186 708 556 4 467 865 5 470 607
Interest 618 433 2 324 121 3 601 129 6 543 683
Payables 2 982 673 - - 2 982 673
Payables 2 589 119 - - 2 589 119
Sundry creditors 393 554 - - 393 554
3 895 292 3 032 677 8 068 994 14 996 963
44.4 Capital management
The primary objective of managing the City’s capital is to ensure that there is sufficient cash available to support the City’s
funding requirement, including capital expenditure, to ensure that the City remains financially in a sound position.
The City monitors capital using a gearing ratio, which is net debt divided by total capital plus net debt. In a capital-intensive
industry, a gearing ratio of 50% or less can be considered reasonable. Included in net debt is interest-bearing loans and
borrowings, payables, less investments.

City of Cape Town Auditor-General: 31 August 2012
for the year ended 30 June 2012 Notes to the financial statements
55
Annual financial statements 2012
44.5 Currency risk
The City is exposed to foreign currency risk through the importation of goods and services, either directly or indirectly,
through the award of contracts to local importers. The City manages any material direct exposure to foreign-currency risk
by entering into forward exchange contracts. The City manages its indirect exposure by requiring the local importer to take
out a forward exchange contract at the time of procurement, in order to predetermine the rand value of the contracted
goods or services. The City was not a direct party to any outstanding forward exchange contracts at the reporting date.
The movement in the currency was not material to the City’s procurement, and, consequently is not elaborated on any
further.
Market risk
Market risk is the risk that changes in market prices, such as foreign-exchange rates and interest rates, will affect the City’s
income or the value of its financial instrument holdings. The objective of market risk management is to manage and control
market risk exposures within acceptable parameters, while optimising the return on the risk.
The effective rates on financial instruments as at 30 June 2012 are as follows:
Maturity of interest-bearing assets/liabilities
Weighted
interest rate 1 years or less 1-5 years >5 years Total
% R'000 R'000 R'000 R'000
Financial assets
Investments 6,70 2 883 387 121 108 - 3 004 495
Cash and cash equivalents 6,06 3 194 327 - - 3 194 327
Total financial assets 6 077 714 121 108 - 6 198 822
Financial liabilities
Borrowings 11,528 294 186 708 556 4 467 865 5 470 607
Total financial liabilities 294 186 708 556 4 467 865 5 470 607
Interest rate sensitivity analysis
Financial assets
As at 30 June 2012, if the weighted interest rate at that date had been 100 basis points higher, with all other variables held
constant, the fair-value impact on the statement of financial performance would have been R65,14 million with the opposite
effect if the interest rate had been 100 basis points lower.
Financial liabilities
As at 30 June 2012, if the interest rate at that date had been 100 basis points higher, with all the other variables held
constant, the fair-value liability would have no significant impact (R5 579), with the opposite effect if the interest rate had
been 100 basis points lower.

City of Cape Town Auditor-General: 31 August 2012
for the year ended 30 June 2012 Notes to the financial statements
56
Annual financial statements 2012
45. PRIOR-YEAR ADJUSTMENTS
45.1 Change in accounting policy
In anticipation of the implementation of GRAP 23, the City amended its accounting policies to bring them in line with the
Accounting Standards which had not yet become effective. This resulted in the unspent conditional grant being recognised
due to the grants being conditional with no repayment terms.
45.2 Correction of errors
Funds received in 2012 that related to 2011 financial year.
The omission of a reversal in 2011 of a bank adjustment.
Adjustment of asset values for inter-company transfer of assets.Presented below are only those items contained in the
statement of financial position and the statement of performance that have been affected by the prior-year adjustments.
As previously
reported
Change in
accounting
policy
Correction of
errors Restated
R'000 R'000 R'000 R'000
2011 Note
Statement of financial position
Other exchange debtors 10 193 788 - 471 194 259
Unspent conditional grants and receipts 17 1 207 732 (95 518) (3 534) 1 108 680
Accumulated surplus 14 277 369 95 518 4 005 14 376 892
Statement of financial performance
Exchange revenue
Other income 25 164 909 - 471 165 380
Non-exchange revenue
Government grants and subsidies 27 2 558 851 77 618 - 2 636 469
Public contributions 28 61 820 17 900 - 79 720
Total revenue 20 380 686 95 518 471 20 476 675
Employee-related costs 29 6 123 767 - (3 534) 6 120 233
Total expenditure 18 648 504 - (3 534) 18 644 970
Surplus for the year 1 732 182 95 518 4 005 1 831 705
45.2 Changes in accounting estimates
The estimate for prepaid electricity payments received in advance has been revised due to new information being
available and experienced gained by management. Due to the revised estimate the accrual decreased with
R67,23 million.
An accrual review of the assets useful lives were performed and the changes had no significant affect in the depreciation
charge to the statement of financial performance.
46. RETIREMENT BENEFIT INFORMATION
The City makes provision for post-retirement benefits to eligible councillors and employees who belong to different pension
schemes. These funds are governed by the Pension Funds Act (Act 24 of 1956) and include both defined-benefit (DB) and
defined-contribution (DC) schemes. Contributions of R652,23 million (2011: R594,15 million) to the DB and DC structures are
expensed as incurred during the year under review. These schemes are subject to a triannual, biannual or annual actuarial
valuation, as set out below.
46.1 DEFINED-BENEFIT SCHEMES
Cape Joint Pension Fund (multi-employer fund)
The DB section is a multi-employer plan, and the contribution rate payable is 27%, i.e. 9% by the members and 18% by their
councils. The fund was certified by the actuary as being in a sound financial condition as at 30 June 2011. The valuation
indicates a break-even actuarial result, and is 98% funded at the financial year-end. The City is included among the local
authorities that contribute to the Cape Joint Pension Fund. Included in the rules of the Fund is a proviso that the assets
provide a minimum return of 5,5% per annum failing which the local authorities associated with the Fund are required to
fund the shortfall in direct proportion to the level of contributions made. As at the date of the financial statements, an
assessment of the performance of the Fund’s assets for the 2011 year had not been completed. Should the return of the
assets be less than 5,5%, the City could be liable for its portion of the shortfall in terms of the rules of the Fund. The City is
currently engaged in a dispute that relates to a shortfall in the return of the fund assets as contemplated above, during the
2008 and 2009 financial years, for an amount of R96 million and interest of R20,4 million. A provision of R96 million has been
included in “Other provisions” in note 15.

City of Cape Town Auditor-General: 31 August 2012
for the year ended 30 June 2012 Notes to the financial statements
57
Annual financial statements 2012
SALA Pension Fund (multi-employer fund)
The fund is a DB plan and is financially sound. It was 98% funded as at 1 July 2011, and had remained stable since the
previous valuation date.
46.2 DEFINED-CONTRIBUTION SCHEMES
Cape Joint Pension Fund (multi-employer fund)
This scheme was established to accommodate the unique characteristics of contract employees and cost-to-company
employees. All existing members were given the option to transfer to the DC plan before 1 July 2003. The actuary report
certified that the structure of the assets is appropriate relative to the nature of the liabilities, assuming a smoothed-bonus
philosophy and given normal circumstances. The fund was certified by the actuary as being in a sound financial condition
as at 30 June 2011. The valuation disclosed funding of 104%.
Cape Retirement Fund for Local Authorities (multi-employer fund)
The contribution rate paid by the members (9%) and their councils (18%) is sufficient to fund the benefits accruing from the
fund in future. The actuary certified the fund, a DC plan, as being in a sound financial position as at 30 June 2011.
Municipal Councillors' Pension Fund (multi-employer fund)
The Municipal Councillors' Pension Fund operates as a DC scheme. The contribution rate paid by the members (13,75%) and
their councils (15%) is sufficient to fund the benefits accruing from the fund in the future.
The fund was certified by the actuary as being in a sound financial condition as at 30 June 2010.
National Fund for Municipal Workers (multi-employer fund)
The retirement and pension funds are both DC schemes. The last voluntary actuarial valuation of the fund was performed
on 30 June 2008. As at 30 June 2008, the valuation disclosed funding of 100%.
South African Municipal Workers Union (SAMWU) National Provident Fund (multi-employer fund)
The SAMWU National Provident Fund is a DC scheme. The last actuarial valuation of the fund was performed at
30 June 2005, when the fund was certified as being in a financially sound position. A statutory valuation will be performed
based on the 30 June 2008 audited financial statements, once it becomes available.
46.3 DEFINED-BENEFIT AND DEFINED-CONTRIBUTION SCHEME
Cape Municipal Pension Fund
The Cape Municipal Pension Fund operates both as a DB and DC scheme. The actuarial valuation of the fund was
performed at 30 June 2011, which certified it as being in a financially sound position. The next statutory valuation is due by
30 June 2012.
Total DB section DC section
In-service members 9 474 322 9 152
Pensioners 5 196 4 014 1 182
Membership as at 30 June 2011 14 670 4 336 10 334
2012 2011
R’million R’million
Past-service position – DB section
3 574 3 420
Past-service position – DC section
5 822 5 001
Total liabilities
9 396 8 421
Assets valued at market value 9 408 8 550
Actuarial surplus 12 -
2012 2011
% %
Key financial assumptions
Actual employer contribution – DB section 20,25 20,25
Actual employer contribution – DC section 18,00 18,00
Net discount rate: Pre-retirement
0,50 0,50
Post-retirement
2,50 2,50
Normal retirement age
60 years 60 years

City of Cape Town Auditor-General: 31 August 2012
for the year ended 30 June 2012 Notes to the financial statements
58
Annual financial statements 2012
46.4 POST-EMPLOYMENT DEFINED BENEFITS
46.4.1 Health care benefits
For past service of in-service and retired employees, the City recognises and provides for the actuarially determined present
value of post-retirement medical-aid employer contributions on an accrual basis, using the projected unit credit method.
The members of medical aid schemes entitled to a post-employment medical scheme subsidy as at 30 June 2012, were
constituted 10 966 (2011: 10 884) in-service members and 6 480 (2011: 6 469) pensioners.
It was assumed that the employer's health care arrangements and subsidy policy would remain as outlined in the
accounting policy, and that the level of benefits and contributions would remain unchanged, with the exception of
inflationary adjustments. Implicit in this approach is the assumption that current levels of cross-subsidisation from in-service
members to retiree members within the medical scheme are sustainable and will continue.
It is further assumed that the subsidy will continue until the last survivor's death for eligible members and their spouses, and to
age 21, if earlier, for dependent children.
Continuation of membership
It is assumed that 100% of in-service members entitled to a post-retirement subsidy retiring from the City of Cape Town will
remain on the employer's health care arrangements.
Family profile
Family profile was based on actual data and, therefore, no assumptions had to be made.
Plan assets
Currently, no long-term assets are set aside off-balance sheet in respect of the employer's post-employment health care
liability.
Discount rate
The fund benefit liability to the City as at 30 June 2012 has been discounted at a rate determined on the basis of the yield of
7,99% per annum on government bonds.
46.4.2 Retirement pension benefits
For past service of employees and retired employees, the City recognises and provides for the actuarially determined
present value of post-retirement revenue pensions on an accrual basis, using the projected unit credit method.
The number of employees who were eligible for a post-retirement pension at 30 June 2012 was 30 (2011: 44) in-service
employees and 125 (2011: 135) pensioners.
Plan assets
Currently, no long-term assets are set aside off-balance sheet in respect of the employer's post-employment retirement
pension liability.
Discount rate
The fund benefit liability to the City as at 30 June 2012 has been discounted at a 7,34% per annum rate determined on the
basis of the market yields on government bonds.
Post-retirement scheme defined-benefit obligations
2012 2011
Health
care
benefits
Retirement
pension
benefits Total
Health care
benefits
Retirement
pension
benefits Total
R'000 R'000 R'000 R'000 R'000 R'000
Present value of unfunded liability
3 566 435 17 004 3 583 439 2 905 696 14 921 2 920 617
Unrecognised actuarial gains - - - 77 197 2 876 80 073
Net liability in statement of financial position 3 566 435 17 004 3 583 439 2 982 893 17 797 3 000 690
Service costs
79 194 651 79 845 50 846 428 51 274
Interest costs
254 270 1 536 255 806 243 681 1 401 245 082
Actuarial losses/(gains) recognised
376 394 (1 475) 374 919 302 782 2 360 305 142
Total included in statement of performance 709 858 712 710 570 597 309 4 189 601 498
Balance at the beginning of the year 2 982 893 17 797 3 000 690 2 500 154 15 215 2 515 369
Net expense recognised in statement of
financial performance 709 858 712 710 570 597 309 4 189 601 498
Contributions paid
(126 316) (1 505) (127 821) (114 570) (1 607) (116 177)
Net liability in statement of financial position 3 566 435 17 004 3 583 439 2 982 893 17 797 3 000 690

City of Cape Town Auditor-General: 31 August 2012
for the year ended 30 June 2012 Notes to the financial statements
59
Annual financial statements 2012
The contributions paid are actual contributions paid by the City, and the unrecognised actuarial gains and losses have
been adjusted accordingly to take into account the difference between the estimated contribution payments determined
by the actuary, and actual contributions paid to members by the City of Cape Town.
Sensitivity analysis
Change in
assumption Liability
Percentage
change
Service
cost
Interest
cost Total costs
Percentage
change
Post-retirement medical aid R'000 % R'000 R'000 R'000 %
Assumptions used 3 566 435 79 194 254 270 333 464
Health care inflation +1% increase 4 160 231 17 96 622 296 475 393 096 18
-1% decrease 3 085 317 (13) 65 501 220 002 285 502 (14)
Post-retirement mortality -1 year reduction 3 702 760 4 81 708 263 729 345 436 4
Average retirement age -1% decrease 3 645 318 2 82 745 263 697 346 443 4
Withdrawal rate -50% 3 698 233 4 85 222 264 309 349 530 5
2012 2011
Health care
benefits
Retirement
pension
benefits
Health-care
benefits
Retirement
pension
benefits
% % % %
Key financial assumptions
Discount rate
7,9 7,3 8,7 8,4
General inflation rate (CPI)
5,4 5,2 5,7 5,6
General salary inflation rate
- 6,2 - 6,6
Health care cost inflation rate
7,2 - 7,4 -
Net effective discount rate
0,8 - 1,2 -
Pension increase rate – pensioners
- - - -
Net effective discount rate – pensioners - - - -
47. GUARANTEES AND CONTINGENT LIABILITY
47.1 Guarantees
The City issued the following guarantees:
• A bank guarantee of R823 446 (2011: R823 446) as security for the lease of property.
47.2 Other contingent liabilities
Contractual disputes
Various contractual claims by contractors/suppliers and staff are currently in dispute, and are subject to mediation. The
potential extent of the liability cannot be determined since it is subject to litigation and a provisional estimate based on
management assessment is R285,52 million (2011: R401,34 million). A potential liability exist regarding the Cape Town
Stadium of a disputed amount of R240,04 million. R200,04 million is in respect of professional fees on the construction of the
Cape Town Stadium and the balance of R40 million for litigation costs. The City and its lawyers are of the opinion that the
litigation is likely to be in the City’s favour. The timing of the legal proceedings regulating the above is however, uncertain.
Outstanding insurance claims
The estimated liability for insurance claims amounts to R105,80 million (2011: R86,37 million). The estimated amount was
based on quotations, medical reports and letters of demand received. The merits must still be determined and could result
in a lesser or greater amount.
48. RELATED PARTY DISCLOSURES
48.1 Municipal entities and special areas
During the year, in the ordinary course of business, transactions between the City and the following entities have occurred
under terms and conditions that are no more favourable than those entered into with third parties in arm's length
transactions.
2012 2011
R’000 R’000
Cape Town International Convention Centre (Pty) Ltd (Convenco)
The Convention Centre was established for Cape Town to become host to
international conferences, with the objectives of promoting Cape Town as
a tourism city. At year-end, the amount owing by Convenco to the City
amounted to R1,31 million (2011: R2,77 million).
Percentage owned 50,18% 50,18%
Arm's-length transactions for the year:
Receivables 1 314 2 766
Service charges 17 738 15 997

City of Cape Town Auditor-General: 31 August 2012
for the year ended 30 June 2012 Notes to the financial statements
60
Annual financial statements 2012
2012 2011
R’000 R’000
Khayelitsha Community Trust
The Khayelitsha Community Trust ceased to be a municipal entity as from
1 July 2011 when the City relinquished effective control over the entity. The
trust was established to upliftment the Khayelitsha Community through
development of the central business district and other community facilities.
At 2011 the amount owing by the trust to the City was R1,22 million.
Percentage owned
Trust
Arm's-length transactions for the year:
Receivables 1 104
Grants 5 401
City Improvement Districts (CIDs)
These entities were established to enable projects at the initiative of local
communities’ initiative, to provide services over and above the services
provided by the City. At year-end, there were no balances due by the
CID’s to the City.
Percentage owned Special rating area’s
Arm's-length transactions for the year:
Receivables - (2)
Service charges 24 22
Levies 86 823 78 967
Cape Metropolitan Transport Fund (administrator of the fund)
The fund was established to pool funds for road networks and
maintenance in the metropolitan area. At year-end, the amount owing
by the City to Cape Metropolitan Transport Fund amounted to
R69,75 million (2011: R76,49 million).
Percentage owned
Administrator
Funds held on behalf of Inter administrator fund
69 746 76 488
Grants and transfers received
30 049 32 824
Interest paid
4 354 5 055
Revenue collected
4 814 4 080
No members of management have significant influence over the financial or operating policies of the above entities.
Executive management
No business transactions took place between the City of Cape Town and key management personnel (City Manager and
Executive Directors) and their close family members during the year under review.

City of Cape Town Auditor-General: 31 August 2012
for the year ended 30 June 2012 Notes to the financial statements
61
Annual financial statements 2012
48.2 Remuneration of management
Mayoral committee members
Analysis of remuneration benefits
Total
Annual
salary
Car
Allowance
Social
Contribution
R'000 R'000 R'000 R'000
2012
Executive Mayor
Alderman P. de Lille 1 050 893 157 -
Executive Deputy Mayor/Finance
Alderman I.D. Neilson 829 628 112 89
Safety and Security Services
Alderman J.P. Smith 778 606 106 66
Corporate Services
Alderman D.L. Qually 778 606 106 66
Economic, Environment and Spatial Planning
Alderman V.M. Walker 778 606 106 66
Social and Early childhood Development
Councillor B.A. Cortje-Alcock 779 590 106 83
Health
Councillor L.V. James 779 673 106 -
Community Services
Councillor T. Gqada 779 673 106 -
Transport, Roads and Stormwater
Councillor B.N. Herron 779 673 106 -
Tourism, Events and Marketing
Councillor G.I. Pascoe 778 606 106 66
Utility Services
Councillor S. Sims 778 673 105 -
Housing
Councillor E.J. Sonnenberg 778 590 105 83
9 663 7 817 1 327 519

City of Cape Town Auditor-General: 31 August 2012
for the year ended 30 June 2012 Notes to the financial statements
62
Annual financial statements 2012
Analysis of remuneration benefits
Total Annual Car Social
salary allowance contribution
R'000 R'000 R'000 R'000
2011
Executive Mayor
Alderman D. Plato (till 20/05/2011)
887 587 210 90
Alderman P. de Lille (w.e.f 01/06/2011)
83 63 20 -
Executive Deputy Mayor / Finance
Alderman I.D. Neilson
765 502 179 84
Safety and Security Services
Alderman J.P. Smith
719 490 169 60
Corporate Services and human resources
Alderman V.M. Walker (till 20 /05/2011)
657 449 154 54
Alderman D.L. Qually (w.e.f 01/06/2011)
62 47 15 -
Economic, Environment and spatial planning
Alderman V.M. Walker (appointed 01/06/2011)
61 41 15 5
Social and Early Childhood Development
Councillor B.A. Cortje-Alcock
62 47 15 -
Health
Councillor D.L. Ximbi (till 05/05/2011)
622 411 145 66
Councillor L.V. James (w.e.f 01/06/2011)
62 47 15 -
Community Services
Councillor B.N. Herron (till 20/05/2011)
657 505 152 -
Councillor T. Gqada (w.e.f 01/06/2011)
62 47 15 -
Transport, Roads and Stormwater
Councillor E.L. Thompson (till 20/05/2011)
655 448 155 52
Councillor B.N Herron (w.e.f 01/06/2011)
62 47 15 -
Tourism, Events and Marketing
Councillor G.I. Pascoe (w.e.f 01/06/2011)
61 41 15 5
Utility Services
Councillor C.R Justus (till 20/05/2011)
658 432 157 69
Councillor S. Sims (w.e.f 01/06/2011)
62 47 15 -
Housing
Councillor S. Sims (till 20/05/2011)
657 503 154 -
Councillor E.J. Sonnenberg w.e.f 01/06/2011)
62 47 15 -
Planning and Environment
Councillor M.J. Nieuwoudt (till 20/05/2011)
657 449 154 54
Economic Development and Tourisme
Councillor F. Purchase (till 20/05/2011)
658 432 157 69
8 231 5 682 1 941 608

City of Cape Town Auditor-General: 31 August 2012
for the year ended 30 June 2012 Notes to the financial statements
63
Annual financial statements 2012
Executive management
Analysis of remuneration benefits
Total
Annual
salary
Perform-
ance
bonus
Car
allowance
Social
contri-
bution
Travel
and
subsista
nce
Relocation
Allowance
R'000 R'000 R'000 R'000 R'000 R'000 R'000
2012
City Manager
A. Ebrahim 1 914 1 532 138 - 242 2 -
Deputy City Manager
M. Marsden (appointed 01/01/2012) 1 035 789 138 - 108 - -
Community Services
L. Mtwazi 1 508 1 140 112 84 172 - -
Corporate Services
D.P. Beretti (contract ended 31/12/2012) 1 140 843 184 30 83 - -
L. Mbandazayo (acting 01/01/2012-31/01/2012) 92 78 - 4 10 - -
F. Habib (appointed 01/02/2012) 307 234 - - - - 73
Economic, Environment and Spatial Planning
M. Mohammed (contract ended 31/10/2011) 386 310 - 24 52 - -
C. Walters (acting 01/11/2011-31/01/2012) 341 237 58 13 33 - -
J. Hugo (appointed 01/02/2012) 611 598 - - 13 - -
Finance
M.J. Richardson (contract ended 31/12/2011) 891 611 124 59 97 - -
J. Steyl (acting 01/01/2012-29/02/2012) 188 143 - 22 22 1 -
K. Jacoby (appointed 01/03/2012) 564 369 - 54 66 - 75
Health
Dr I.K. Bromfield 1 405 912 177 133 183 - -
Integrated Human Settlement Services
J.A. Smit (contracted ended 31/12/2012) 951 752 110 - 89 - -
S Maqetuka (acting 01/01/2012-30/06/2012) 725 640 - - 85 - -
Safety and Security
R. Bosman 1 447 1 090 104 95 158 - -
Social and Early Childhood Development
N.B. Biko (appointed 03/01/2012-30/06/2012) 683 682 - - 1 - -
Tourism, Events and Marketing
A. Groenewald (appointed 01/02/2012) 611 610 - - 1 - -
Transport, Roads and Stormwater
M.G. Marsden (contract ended 31/12/2011) 735 636 - - 99 - -
M. Whitehead (appointed 16/01/2012) 753 677 - - 1 - 75
Utility Services
L. Dhlamini 1 409 1 134 52 42 176 5 -
17 696 14 017 1 197 560 1 691 8 223

City of Cape Town Auditor-General: 31 August 2012
for the year ended 30 June 2012 Notes to the financial statements
64
Annual financial statements 2012
Analysis of remuneration benefits
Total
Annual
salary
Perform-
ance
bonus
Car
allowanc
e
Social
contri-
bution
Travel
and
Subsis-
tance
Relocati
on
Allowan
ce
R'000 R'000 R'000 R'000 R'000 R'000 R'000
2011
City Manager
A. Ebrahim 1 940 1334 375 - 217 14 -
Community Development
L.M. Mtwazi 1 563 1 024 305 84 150 - -
Corporate Services
D.P. Beretti 1 597 1 069 298 60 159 11 -
Economic and Social Development
M. Mohamed 1 407 930 235 72 155 15 -
Finance
M.J. Richardson 1 550 957 305 117 171 - -
Health
Dr I.K. Bromfield 1 429 851 282 133 163 - -
Integrated Human Settlement Services
J.A. Smit 1 517 1 051 298 - 168 - -
Safety and Security
R.G. Bosman 1 313 931 149 95 138 - -
Strategy and Planning
P.S. van Zyl (resigned 31/10/2010) 803 489 298 16 - - -
Transport, Roads and Stormwater
M.G. Marsden 1 728 1 197 339 - 189 3 -
Utility Services
L.T. Dhlamini (w.e.f 13/12/2010) 1 634 1 164 264 47 159 - -
16 481 10 997 3 148 624 1 669 43 -
The comparative figure of the previous year has been restated due to inadvertent inclusion of the Internal Audit Executive
remuneration who does not meet the criteria as defined in the Accounting Standards for disclosure. The 2011 amount of
R16,48 million has been restated from R17,92 million,
48.3 Events after reporting date
The City is currently finalising a loan agreement with the Agence Francaise de Developpement (AFD). In this regard Council
approved the raising of an amount of 200 million Euros, denominated in rand, for the funding of its 2011/12 to 2014 capital
programme.
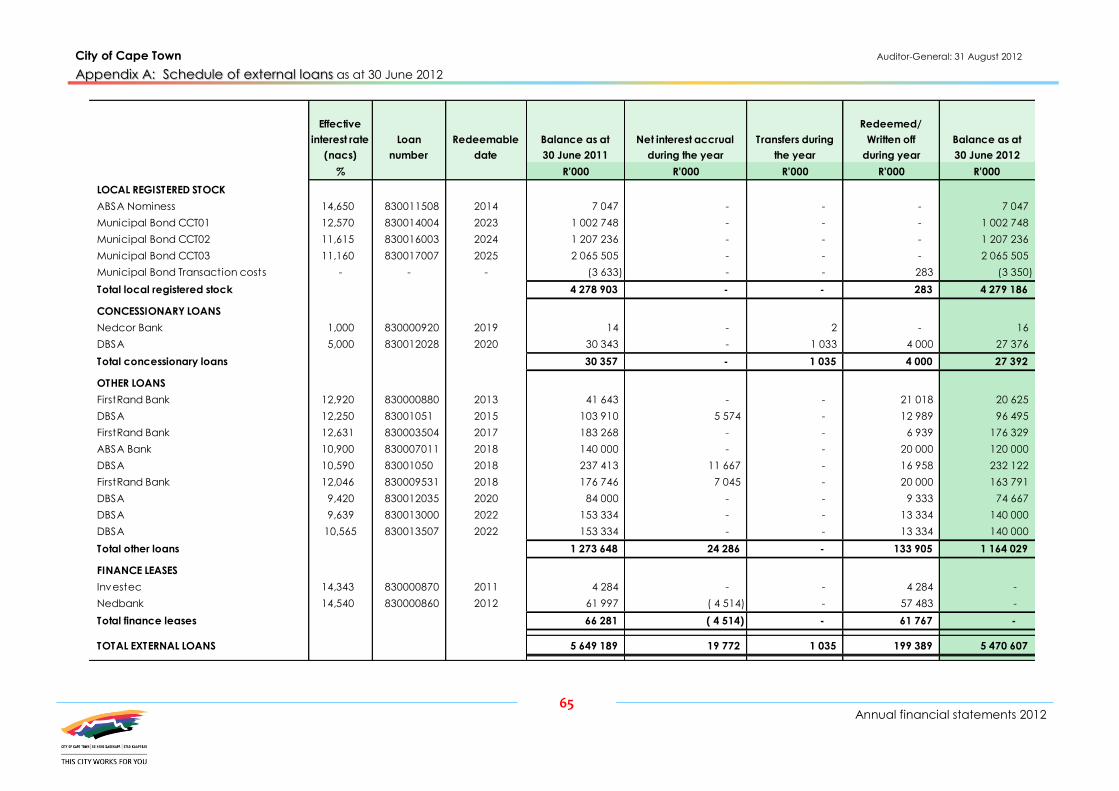
City of Cape Town Auditor-General: 31 August 2012
as at 30 June 2012 Appendix A: Schedule of external loans
65
Annual financial statements 2012
Effective
interest rate
(nacs)
Loan
number
Redeemable
date
Balance as at
30 June 2011
Net interest accrual
during the year
Transfers during
the year
Redeemed/
Written off
during year
Balance as at
30 June 2012
% R'000 R'000 R'000 R'000 R'000
LOCAL REGISTERED STOCK
ABSA Nominess 14,650 830011508 2014 7 047 - - - 7 047
Municipal Bond CCT01 12,570 830014004 2023 1 002 748 - - - 1 002 748
Municipal Bond CCT02 11,615 830016003 2024 1 207 236 - - - 1 207 236
Municipal Bond CCT03 11,160 830017007 2025 2 065 505 - - - 2 065 505
Municipal Bond Transaction costs - - - (3 633) - - 283 (3 350)
Total local registered stock 4 278 903 - - 283 4 279 186
CONCESSIONARY LOANS
Nedcor Bank 1,000 830000920 2019 14 - 2 - 16
DBSA 5,000 830012028 2020 30 343 - 1 033 4 000 27 376
Total concessionary loans 30 357 - 1 035 4 000 27 392
OTHER LOANS
FirstRand Bank 12,920 830000880 2013 41 643 - - 21 018 20 625
DBSA 12,250 83001051 2015 103 910 5 574 - 12 989 96 495
FirstRand Bank 12,631 830003504 2017 183 268 - - 6 939 176 329
ABSA Bank 10,900 830007011 2018 140 000 - - 20 000 120 000
DBSA 10,590 83001050 2018 237 413 11 667 - 16 958 232 122
FirstRand Bank 12,046 830009531 2018 176 746 7 045 - 20 000 163 791
DBSA 9,420 830012035 2020 84 000 - - 9 333 74 667
DBSA 9,639 830013000 2022 153 334 - - 13 334 140 000
DBSA 10,565 830013507 2022 153 334 - - 13 334 140 000
Total other loans 1 273 648 24 286 - 133 905 1 164 029
FINANCE LEASES
Investec 14,343 830000870 2011 4 284 - - 4 284 -
Nedbank 14,540 830000860 2012 61 997 ( 4 514) - 57 483 -
Total finance leases 66 281 ( 4 514) - 61 767 -
TOTAL EXTERNAL LOANS 5 649 189 19 772 1 035 199 389 5 470 607

City of Cape Town Auditor-General: 31 August 2012
as at 30 June 2012 Appendix B: Analysis of property, plant and equipment
66
Annual financial statements 2012
Opening
balance
Transfers/
adjustments Additions ¹ Disposals
Closing
balance
Opening
balance
Transfers/
adjustments Impairments Additions Disposals
Closing
balance
Carrying
value
R'000 R'000 R'000 R'000 R'000 R'000 R'000 R'000 R'000 R'000 R'000 R'000
LAND AND BUILDINGS
Land 658 068 255 319 37 096 - 950 483 (233 955) - (20 327) - (65 126) (319 408) 631 075
Buildings and land 2 588 766 (1 276 353) 32 662 (123) 1 344 952 (1 114 073) (299) - (67 202) 738 035 (443 539) 901 413
3 246 834 (1 021 034) 69 758 (123) 2 295 435 (1 348 028) (299) (20 327) (67 202) 672 909 (762 947) 1 532 488
INFRASTRUCTURE
Assets under construction 2 059 794 (1 344 351) 1 766 974 - 2 482 417 - - - - - - 2 482 417
Drains 567 616 84 324 22 087 - 674 027 (219 297) - - (18 973) (16 621) (254 891) 419 136
Roads 5 076 132 580 741 157 617 - 5 814 490 (1 682 662) 625 - (146 359) (56 650) (1 885 046) 3 929 444
Beach improv ements 36 262 2 552 - - 38 814 (18 679) - - (736) (829) (20 244) 18 570
Sewerage mains and purification 2 133 226 255 369 111 056 - 2 499 651 (616 748) - - (112 889) 16 (729 621) 1 770 030
Electricity peak load equipment and mains 4 609 778 286 579 525 262 - 5 421 619 (1 635 439) (168 498) (234) (211 365) (73) (2 015 609) 3 406 010
Water meters and mains 2 123 009 170 182 62 326 - 2 355 517 (1 021 534) - - (81 949) (230) (1 103 713) 1 251 804
Reserv oirs - water 444 883 3 008 234 - 448 125 (277 933) - - (18 520) (144) (296 597) 151 528
17 050 700 38 404 2 645 556 - 19 734 660 (5 472 292) (167 873) (234) (590 791) (74 531) (6 305 721) 13 428 939
COMMUNITY ASSETS
Assets under construction 148 923 (93 565) 150 735 - 206 093 - - - - - - 206 093
Parks and gardens 48 530 90 772 594 - 139 896 (5 655) - - (1 877) (7 857) (15 389) 124 507
Libraries 197 009 4 204 232 - 201 445 (54 450) - - (3 250) (3 239) (60 939) 140 506
Recreation facilities 4 414 197 649 898 17 797 - 5 081 892 (339 347) - - (180 632) (256 712) (776 691) 4 305 201
Civ ic buildings 1 049 336 463 128 63 556 - 1 576 020 (386 173) - - (34 749) (255 360) (676 282) 899 738
5 857 995 1 114 437 232 914 - 7 205 346 (785 625) - - (220 508) (523 168) (1 529 301) 5 676 045
LEASED ASSETS
Infrastructure and other 234 370 (234 370) - - - (168 778) 168 778 - - - - -
234 370 (234 370) - - - (168 778) 168 778 - - - - -
OTHER ASSETS
Assets under construction 517 535 (357 066) 442 297 - 602 766 - - - - - - 602 766
Buildings and land - 18 - - 18 - (6) - (6) - (12) 6
Landfill sites 559 785 57 938 - - 617 723 (256 155) - - (51 339) (46) (307 540) 310 183
Furniture, fittings and equipment 459 917 4 825 73 700 (9 316) 529 126 (245 313) - - (55 958) 8 668 (292 603) 236 523
Bins and containers 51 230 814 3 870 (175) 55 739 (32 931) - - (5 726) 175 (38 482) 17 257
Emergency equipment 34 901 82 1 112 (116) 35 979 (24 794) - - (4 139) 78 (28 855) 7 124
Motor v ehicles and watercraft 1 148 220 52 274 224 577 (18 314) 1 406 757 (641 776) - - (154 680) 7 001 (789 455) 617 302
Specialised v ehicles 690 953 19 549 192 011 (11 882) 890 631 (330 312) - (6 831) (53 591) 2 220 (388 514) 502 117
Computer equipment 979 030 54 848 131 962 (31 322) 1 134 518 (662 407) - - (123 239) 30 287 (755 359) 379 159
Animals 242 - 40 (14) 268 (56) - - (39) 1 (94) 174
4 441 813 (166 718) 1 069 569 (71 139) 5 273 525 (2 193 744) ( 6) (6 831) (448 717) 48 384 (2 600 914) 2 672 611
HOUSING RENTAL STOCK 1 165 874 227 101 152 690 (2 874) 1 542 791 (554 328) - - (28 207) (53 082) (635 617) 907 174
TOTAL PPE (See note 1) 31 997 586 (42 180) 4 170 487 (74 136) 36 051 757 (10 522 795) 600 (27 392) (1 355 425) 70 512 (11 834 500) 24 217 257
HERITAGE ASSETS (See note 2)
Assets under construction 3 552 (268) 350 - 3 634 - - - - - - 3 634
Painting and art galleries 8 362 750 - (4) 9 108 - - - - - - 9 108
11 914 482 350 (4) 12 742 - - - - - - 12 742
INVESTMENT PROPERTIES (See note 3) 130 612 - 109 132 - 239 744 (45 613) - - (1 653) - (47 266) 192 478
INTANGIBLE ASSETS (See note 4) 326 977 41 888 29 403 - 398 268 (282 093) (767) - (15 018) 42 (297 836) 100 432
ASSETS HELD-FOR-SALE (See note 5) 403 (190) - (169) 44 (277) 167 - - 109 (1) 43
TOTAL OTHER 469 906 42 180 138 885 (173) 650 798 (327 983) (600) - (16 671) 151 (345 103) 305 695
GRAND TOTAL 32 467 492 - 4 309 372 (74 309) 36 702 555 (10 850 778) - (27 392) (1 372 096) 70 663 (12 179 603) 24 522 952
COST ACCUMULATED DEPRECIATION
1. Includes the contributed assets amount of R76,13 million.

City of Cape Town Auditor-General: 31 August 2012
for the year ended 30 June 2012 Appendix C: Segmental statement of financial performance
67
Annual financial statements 2012
R'000 R'000 R'000 R'000 R'000 R'000
Rates and General
321 260 739 814 (418 554) City Health 366 835 822 227 (455 392)
5 14 545 (14 540) City Manager 9 11 280 (11 271)
130 822 1 541 464 (1 410 642) Community Services 153 216 1 701 916 (1 548 700)
30 957 484 333 (453 376) Corporate Services 120 754 599 912 (479 158)
24 245 53 505 (29 260) Deputy City Manager 10 497 87 480 (76 983)
84 354 560 995 (476 641) Economic, Environment and Spatial Planning 80 539 586 326 (505 787)
1 577 837 1 083 879 493 958 Finance 1 804 398 1 022 868 781 530
7 695 912 1 655 516 6 040 396 Rates and Other 8 195 135 1 768 718 6 426 417
236 883 1 509 078 (1 272 195) Safety and Security 229 213 1 718 895 (1 489 682)
104 44 609 (44 505) Social and Early Childhood Development 2 178 79 821 (77 643)
164 397 548 727 (384 330) Tourism, Events and Marketing 23 202 453 073 (429 871)
668 822 1 373 707 (704 885) Transport, Roads and Stormwater 1 323 038 1 680 401 (357 363)
Housing
713 000 825 825 (112 825) Human settlements 962 989 967 957 (4 968)
Utility Services
1 814 050 1 703 826 110 224 Waste Management 1 947 658 1 798 160 149 498
1 514 272 1 487 403 26 869 Wastewater Management 1 850 384 1 709 722 140 662
2 856 893 2 988 250 (131 357) Water 3 040 375 3 016 550 23 825
7 531 964 6 918 596 613 368 Electricity 8 807 459 8 394 686 412 773
25 365 777 23 534 072 1 831 705 Sub-total 28 917 879 26 419 992 2 497 887
4 889 102 4 889 102 - Less: Inter-departmental charges 5 233 241 5 233 241 -
20 476 675 18 644 970 1 831 705 Total 23 684 638 21 186 751 2 497 887
2011 2012
Business UnitActual
income
Actual
expenditure Surplus/(Deficit)
Actual
income
Actual
expenditure Surplus/(Deficit)

City of Cape Town Auditor-General: 31 August 2012
Appendix D: Disclosure of grants and subsidies in terms of section 123 of the Municipal Finance Management Act
68
Annual financial statements 2012
National and Provincial grant funds 2011/2012
Description Source
Operating Capital
R'000 R'000 R'000 R'000 R'000 R'000 R'000 R'000
National Government
2010 FIFA World Cup: Green Point Sport and Recreation (7 550) - - - 1 157 (376) - (6 769)
Accreditation: Development Support State Housing (3 095) - - 772 576 - - (1 747)
Budget Reform Funds National Treasury (416) (1 250) - 1 187 90 - - (389)
Department of Env ironmental Affairs and Tourism: DANIDA Environmental Affairs (3 537) - 3 552 1 - (16) - -
Department of Env ironmental Affairs and Tourism Environmental Affairs (22) (270) - 193 - - - ( 99)
Department of Env ironmental Affairs and Tourism: Carbon Offset Programme Environmental Affairs (297) - 298 - - (1) - -
DME - INEP Energy (2 595) (4 386) 3 531 - 3 551 - (101) -
Energy Efficiency Electricity Demand Side Management National Treasury (1 524) (35 087) - 995 28 962 - - (6 654)
Expanded Public Works Incentive Grant National Treasury - (9 279) - - - - - (9 279)
Health and Hygiene education: Informal Settlements Water (58) - - 47 - - - (11)
Implementation Water Demand Water (7 261) - - 7 070 295 (104) -
LGSETA: Env ironmental Internship Programme Environmental Affairs (254) - - 237 - - - (17)
Municipal Infrastructure Grants National Treasury (63 547) - 63 547 - - - - -
Neighboorhood Development Programme National Treasury (52 038) (74 200) - 1 200 88 990 (3 427) - (39 475)
Park and Ride National Treasury - - ( 824) - 824 - - -
Public Transport and Infrastructure Transport (426 721) (1 608 300) 824 87 809 842 212 (86 246) - (1 190 422)
Restructering Grant - Seed Funding National Treasury (9 938) - - 2 244 961 - - (6 733)
Smart Liv ing Handbook Water (66) - - - - (4) - (70)
Telecommunications Equipment Cape Town Stadium National Treasury - (69 089) - - 69 089 - - -
Urban Renewal National Treasury (73 664) - - 7 952 20 026 - - (45 686)
Urban Settelment Development Grant National Treasury - (824 030) - 23 244 729 919 - - (70 867)
Water Demand Side Water (984) - - 287 - - - (697)
Total national government transfers and grants (653 567) (2 625 891) 70 928 133 238 1 786 652 (90 070) (205) (1 378 915)
ABET Adult Education Education (8) (9) - - 8 - - (9)
Accreditation Assistance Human Settlements (10 085) (10 000) - 1 094 - (696) - (19 687)
Athlone Stadium General Upgrading Transport and Public Works (1 742) - - - - - - (1 742)
Atlantis - Wesfleur Ext 13 Human Settlements (323) - - - - - - (323)
Atlantis Thusong Multi Purpouse Centre Cultural Affairs and Sport - (500) - 322 - - - (178)
Bardale High Mast Lighting Project Human Settlements (471) - - - - - - (471)
Belhar Pentech Human Settlements (132) - 132 - - - - -
Bokmakierie / Hazendal Infill 3 Human Settlements (2 681) - - - - - - (2 681)
Bonteheuwel Multi Puprose Centre Cultural Affairs and Sport (766) - 766 - - - - -
Browns Farm Phase 3,4,5,6 Human Settlements (11 630) - - - 66 - - (11 564)
CBH Wallacedene Phase 1,3,4,5,6 Human Settlements (9 713) (815) - 5 621 - (304) - (5 211)
Conditions met - transferred
to revenue Amounts to
be claimed
Conditions still
to be met -
transferred to
liabilities
Balance unspent
at beginning of
the year
Current year
receipts Adjustments
Interest
earned

City of Cape Town Auditor-General: 31 August 2012
Appendix D: Disclosure of grants and subsidies in terms of section 123 of the Municipal Finance Management Act
69
Annual financial statements 2012
Description Source
Operating Capital
R'000 R'000 R'000 R'000 R'000 R'000 R'000 R'000
CBO Freedom Park Human Settlements (71) - - - - - - (71)
Chemical Toilets in Wallacedene Human Settlements (24) - - - - (1) - (25)
Chris Hani Park Housing Project Human Settlements (274) - - - - - - (274)
Clinics : HIV/AIDS & TB Programmes Health (13) - - - - - - (13)
Coastal Zone Development Guidelines Framework Environmental Affairs and Development Planning (57) - 58 - - (1) - -
Community Residential Units Human Settlements (109 658) (150 729) - 1 062 305 967 - (61 657) (15 015)
Delft South High Density Housing Human Settlements (104) - - - - - - (104)
Delft Sportfield Development Human Settlements (20) - - - - - - (20)
Delft Symphony Way Tra Human Settlements (5 302) - - 1 932 - - - (3 370)
Delft: The Hague Human Settlements (4) - 4 - - - - -
Dial-a-Ride Transport and Public Works (8 698) (10 000) - 8 600 - (325) - (10 423)
Disaster Fund - Fire/Flood Kits Human Settlements - (6 230) 5 340 6 313 - - (5 423) -
Driftsands UISP Human Settlements (260) - 260 - - - - -
Du Noon Phase 1,3 : Transfers Human Settlements (286) (13) - - - - - (299)
E Business Project Treasury (1 712) - - - - (95) - (1 807)
Echo Road Housing Project Human Settlements (34) - - 30 - - - (4)
Edward Road Energy Efficient Project Human Settlements (2 439) - - 33 - (134) - (2 540)
EHP Nyanga, Du Noon and Atlantis Human Settlements (137) - - 197 - - (60) -
EHP Repair and Reconstruct 8 Houses Human Settlements (44) - - - - - - (44)
Enkanini Housing Project Human Settlements (3 305) - - - - - - (3 305)
Establishment Grants Human Settlements (1 417) (1 318) 838 - (102) - (1 999)
Facilitation Grants Human Settlements (184) (126) - 48 - (13) - (275)
False Bay Ecology Economic Development and Tourism - (1 000) - - - (21) - (1 021)
Fire Detection Surveillance Cameras Human Settlements (65) - - - - (4) - (69)
Gabriel Square Restitution Human Settlements (37) - - - - - - (37)
Global Fund Health (2 397) - - - - (133) - (2 530)
Global Fund Anti Retrov irol Health - (14 913) 2 487 14 413 300 - (2 287) -
Global Fund Community Base Response Project Health - (3 969) 1 211 3 507 - - (749) -
Government Grant Community Development Workers Human Settlements (881) - - 160 - (48) - (769)
Green Point Phase 21 Housing Human Settlements (863) - - - - - - (863)
Greenland's Housing Project Human Settlements (971) - - - - - - (971)
Gugulethu Seven Memorial Cultural Affairs and Sport (42) - - - - (2) - (44)
Hangberg Housing Project Human Settlements (52) - - - - - - (52)
Hangberg: Appointment of mediator Human Settlements - (483) 206 192 - - - (85)
Happy Valley - Blackheath Human Settlements (53 939) - 53 892 47 - - - -
HCE Manuals (Housing Consumer Education) Human Settlements (335) - - 7 65 (18) - (281)
Conditions met - transferred
to revenueBalance unspent
at beginning of
the year
Current year
receipts Adjustments
Interest
earned
Amounts to
be claimed
Conditions still
to be met -
transferred to
liabilities

City of Cape Town Auditor-General: 31 August 2012
Appendix D: Disclosure of grants and subsidies in terms of section 123 of the Municipal Finance Management Act
70
Annual financial statements 2012
Description Source
Operating Capital
R'000 R'000 R'000 R'000 R'000 R'000 R'000 R'000
Heideveld Housing Infill Human Settlements - - 619 - - - (619) -
HIV/AIDS Community Based Response Projects Health - (62 075) 6 596 65 450 - - (9 971) -
Hostels Phase 2 Housing Human Settlements (976) - (28) 8 - - - (996)
Imizamo Yethu Phase 2 New Serv ices Human Settlements (931) - - - - - - (931)
Informal Settlements Human Settlements (585) (1 000) 12 572 - - - (1 001)
Jakkelsv lei Canal Upgrading Human Settlements (10 464) - - - 37 - - (10 427)
Joe Slovo Floodlighting Cultural Affairs and Sport - - - - - - - -
Kalkfontein Phase 2 Human Settlements (395) - - - - - - (395)
Kewtown Infill Development Human Settlements (265) - - 73 - - - (192)
Khayelitsha Development of Rememberance Square Economic Development and Tourism (17) - - - - (1) - (18)
Khayelitsha Khuyasa Phase 2 Human Settlements (373) - - - - - - (373)
Khayelitsha Multi Purpose Centre Social Development (787) - - - - (44) - (831)
Khayelitsha Poverty Reduction Programme Social Development (2 521) - - - - (140) - (2 661)
Khayelitsha Site C Subsidies Human Settlements (19 369) - - 14 867 - (582) - (5 084)
Khayelitsha Stadium Site B Cultural Affairs and Sport (106) - - - - - - (106)
Khayelitsha Vacant Land Study Environmental Affairs and Development Planning (250) - - 246 - - - (4)
Kuyasa T3V1 Top Structures Human Settlements (202) - - - - - - (202)
Langa Sportsfield Development Cultural Affairs and Sport (106) - - - - - - (106)
Law Enforcement Officers Cultural Affairs and Sport - (755) - 142 - - - (613)
Local Spatial Plan Environmental Affairs and Development Planning (1) - - - - - - (1)
Luvuyo Clinic Extension Health - (1 148) 194 - 997 - (44) ( 1)
Macassar Treatment Works Human Settlements (8 000) - - - - - - (8 000)
Mamre 55 Houses Environmental Affairs and Development Planning - - - 2 - - (2) -
Mandela Park Sports Fields: Tennis Facilities Cultural Affairs and Sport (42) - - - - - - (42)
Manenberg Infill / The Downs Human Settlements (2) - 2 - - - - -
Manenberg Sport Complex Upgrade Cultural Affairs and Sport (235) - - - - - - (235)
Marconi Beam Human Settlements (56) (74) - 38 - - - (92)
Masiphumelele Tra Human Settlements (805) - - - - (45) - (850)
Masiphemelele Amakhaya Ngoku Human Settlements (1 857) (12 406) - 1 863 - (630) - (13 030)
Melkbosch Village Human Settlements (90) - - - - - - (90)
Metropolitan Transport Fund Transport and Public Works - - (30 049) 11 988 18 061 - - -
Mfuleni and Strand 12 Houses Human Settlements - - - 20 - - (20) -
Mfuleni EPH Tra Human Settlements (1 779) - - 1 561 - - - (218)
Mfuleni Ext 3 Human Settlements (157) - - 28 - - - (129)
Mfuleni Ext 4 Housing Human Settlements (341) - - 9 - - - (332)
Mfuleni Flood Relief Project Human Settlements (3 067) - - 62 - - - (3 005)
Conditions met - transferred
to revenue Amounts to
be claimed
Conditions still
to be met -
transferred to
liabilities
Balance unspent
at beginning of
the year
Current year
receipts Adjustments
Interest
earned

City of Cape Town Auditor-General: 31 August 2012
Appendix D: Disclosure of grants and subsidies in terms of section 123 of the Municipal Finance Management Act
71
Annual financial statements 2012
Description Source
Operating Capital
R'000 R'000 R'000 R'000 R'000 R'000 R'000 R'000
Mfuleni MLS Topstructure Human Settlements (215) - - 2 - - - (213)
Mitchell's Plain Infill Phase 1 Human Settlements (3 108) (1 379) - 287 - - - (4 200)
Mitchell's Plain Youth and Family Development Centre Social Development (655) - - - - (36) - (691)
Mitchell's Plain TA2 Human Settlements (369) - - 93 - - - (276)
Morgan Vill3/Western Cape Human Settlements (941) - - - - (52) - (993)
Netreg Housing Project Human Settlements (350) - - - - - - (350)
Nonqubela Ph2/Makhaza Human Settlements (515) - - - 350 - - (165)
Nutrition Supplement Programme Health - (3 754) 120 4 018 - - (384) -
Nyanga Upgrading Project Human Settlements - (240) 240 - - - - -
Ocean View / Mountain View Human Settlements - (368) 368 - - - - -
Ocean View Infill Human Settlements (10) - 10 - - - - -
Philippi Business Park Planning Environmental Affairs and Development Planning (91) - 93 - - (2) - -
Philippi East Top Structures Human Settlements (3 650) (7 367) - 9 488 - - - (1 529)
Philippi Planning for Development Environmental Affairs and Development Planning (57) - 58 - - (1) - -
Philippi East Market Agriculture (531) - - - - (30) - (561)
Philippi East Phase 5 Human Settlements (30) (162) - 25 51 - - (116)
Philippi Park Flooding Human Settlements (974) - - - - - - (974)
Phoenix Sport Complex (Telkom Park) Cultural Affairs and Sport - - - - - - - -
Phoenix Top Structures Human Settlements - - 41 - - - (41) -
Phoenix UISP Human Settlements (142) - - - - - - (142)
Peoples Housing Project Human Settlements (32 262) (102 092) 25 97 571 - (3 055) (4 741) (44 554)
Phumlani Transfers Human Settlements (24) - - - - - - (24)
Provision of Security Improvements at Rail Park and Ride Facilities Transport and Public Works (1 211) - - 1 057 - (23) - (177)
Public Library Fund Cultural Affairs and Sport (3 334) (21 336) - 16 335 5 500 (515) - (3 350)
Redhill Informal Settlement Human Settlements (244) - - - - (14) - (258)
River Clean and Green Project Environmental Affairs and Development Planning (359) - - - - (20) - (379)
Rondevlei Housing Project Human Settlements (242) - - 94 - - - (148)
SANRAL Emergency Project 1600 Units Human Settlements (8 089) - - 8 089 - - - -
Social Economic Facilities Programme Human Settlements - (3 655) 1 650 - 5 216 - (3 860) (649)
Sercor Park Human Settlements (704) - - - - - - (704)
Silvertown Khayelitsha 2000 Structures Human Settlements (5 175) - - 4 033 - - - (1 142)
Site C Survey and Subdiv ision Human Settlements (1 877) - - 1 577 68 - - (232)
Soccer Club Development Cultural Affairs and Sport -
Somerset West Housing Project Human Settlements (3 632) (16 000) - 15 468 - - - (4 164)
Spandau Project 384 Houses Human Settlements (36) - - - - - - (36)
Spatial Planning District Plans Environmental Affairs and Development Planning (3) - 3 - - - - -
Conditions met - transferred
to revenueBalance unspent
at beginning of
the year
Current year
receipts Adjustments
Interest
earned
Amounts to
be claimed
Conditions still
to be met -
transferred to
liabilities
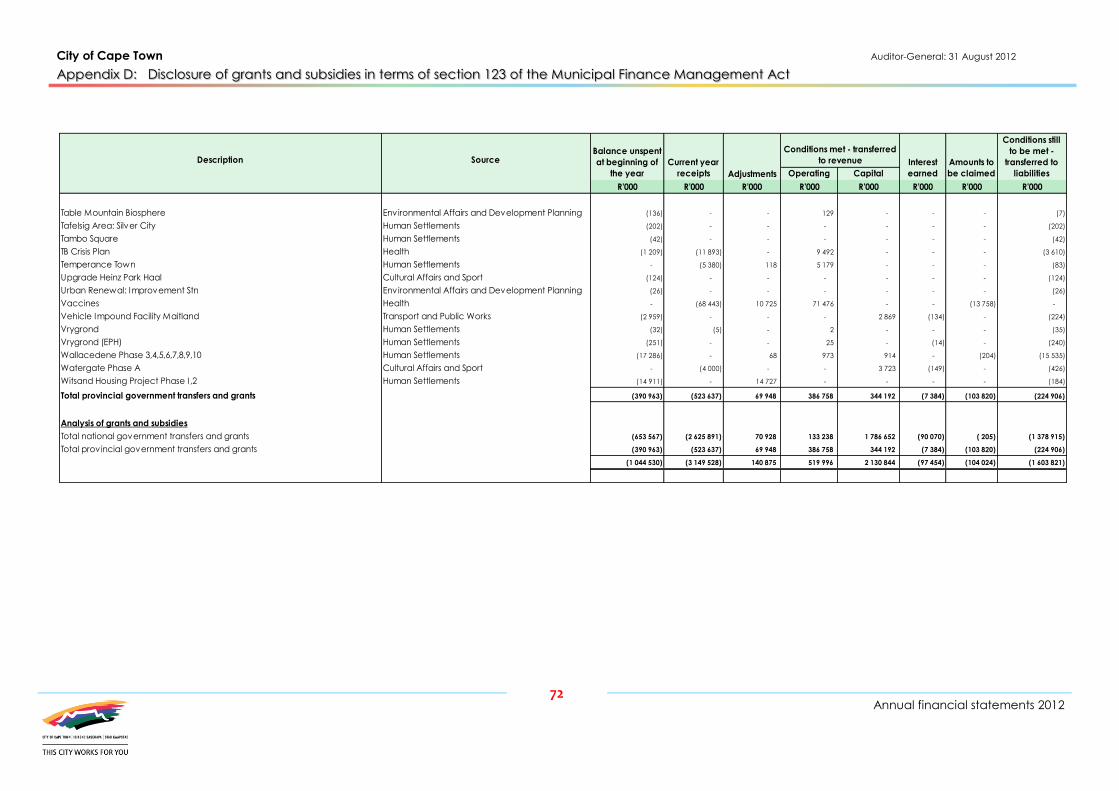
City of Cape Town Auditor-General: 31 August 2012
Appendix D: Disclosure of grants and subsidies in terms of section 123 of the Municipal Finance Management Act
72
Annual financial statements 2012
Description Source
Operating Capital
R'000 R'000 R'000 R'000 R'000 R'000 R'000 R'000
Table Mountain Biosphere Environmental Affairs and Development Planning (136) - - 129 - - - (7)
Tafelsig Area: Silver City Human Settlements (202) - - - - - - (202)
Tambo Square Human Settlements (42) - - - - - - (42)
TB Crisis Plan Health (1 209) (11 893) - 9 492 - - - (3 610)
Temperance Town Human Settlements - (5 380) 118 5 179 - - - (83)
Upgrade Heinz Park Haal Cultural Affairs and Sport (124) - - - - - - (124)
Urban Renewal: Improvement Stn Environmental Affairs and Development Planning (26) - - - - - - (26)
Vaccines Health - (68 443) 10 725 71 476 - - (13 758) -
Vehicle Impound Facility Maitland Transport and Public Works (2 959) - - - 2 869 (134) - (224)
Vrygrond Human Settlements (32) (5) - 2 - - - (35)
Vrygrond (EPH) Human Settlements (251) - - 25 - (14) - (240)
Wallacedene Phase 3,4,5,6,7,8,9,10 Human Settlements (17 286) - 68 973 914 - (204) (15 535)
Watergate Phase A Cultural Affairs and Sport - (4 000) - - 3 723 (149) - (426)
Witsand Housing Project Phase I ,2 Human Settlements (14 911) - 14 727 - - - - (184)
Total provincial government transfers and grants (390 963) (523 637) 69 948 386 758 344 192 (7 384) (103 820) (224 906)
Analysis of grants and subsidies
Total national government transfers and grants (653 567) (2 625 891) 70 928 133 238 1 786 652 (90 070) ( 205) (1 378 915)
Total provincial government transfers and grants (390 963) (523 637) 69 948 386 758 344 192 (7 384) (103 820) (224 906)
(1 044 530) (3 149 528) 140 875 519 996 2 130 844 (97 454) (104 024) (1 603 821)
Adjustments
Interest
earned
Conditions met - transferred
to revenue Amounts to
be claimed
Conditions still
to be met -
transferred to
liabilities
Balance unspent
at beginning of
the year
Current year
receipts