Embed Size (px)
Citation preview

ANNEXURE A
2018/19 - 2020/21 BUDGET
30 MAY 2018
including
Additional Recommendations approved
at the Special Council meeting
(refer page 212 - 214)

City of Cape Town - 2018/19 Budget (including additional recommendations read in at the Council meeting of 30 May 2018
Page i
PART 1 - ANNUAL BUDGET ......................................................................................... 1
1.1 COUNCIL RESOLUTIONS ............................................................................................................................................................................ 1 1.2 EXECUTIVE SUMMARY ............................................................................................................................................................................... 3 1.3 OPERATING REVENUE FRAMEWORK ................................................................................................................................................... 13 1.4 OPERATING EXPENDITURE FRAMEWORK ........................................................................................................................................... 27 1.5 CAPITAL EXPENDITURE ......................................................................................................................................................................... 32 1.6 ANNUAL BUDGET TABLES ..................................................................................................................................................................... 35
PART 2 – SUPPORTING DOCUMENTATION .............................................................. 58
2.1 OVERVIEW OF ANNUAL BUDGET PROCESS .......................................................................................................................................... 58 2.2 OVERVIEW OF ALIGNMENT OF ANNUAL BUDGET WITH INTEGRATED DEVELOPMENT PLAN (IDP) ......................................... 60 2.3 MEASURABLE PERFORMANCE OBJECTIVES AND INDICATORS .......................................................................................................... 65 2.4 OVERVIEW OF BUDGET RELATED-POLICIES ........................................................................................................................................ 77 2.5 OVERVIEW OF BUDGET ASSUMPTIONS APPLIED TO THE 2018/19 MTREF ............................................................................... 78 2.6 OVERVIEW OF BUDGET FUNDING ......................................................................................................................................................... 91 2.7 WARD ALLOCATIONS .......................................................................................................................................................................... 104 2.8 EXPENDITURE ON TRANSFERS AND GRANT PROGRAMMES ........................................................................................................... 105 2.9 ALLOCATIONS AND GRANTS MADE BY THE MUNICIPALITY ............................................................................................................ 107 2.10 COUNCILLOR AND STAFF BENEFITS .................................................................................................................................................. 108 2.11 MONTHLY TARGETS FOR REVENUE, EXPENDITURE AND CASH FLOW .......................................................................................... 111 2.12 ANNUAL BUDGETS – INTERNAL DEPARTMENTS .............................................................................................................................. 120 2.13 ANNUAL BUDGET AND SERVICE DELIVERY AGREEMENT – CAPE TOWN INTERNATIONAL CONVENTION CENTRE
(CTICC) ................................................................................................................................................................................................ 157 2.14 ANNUAL BUDGET AND SERVICE DELIVERY AGREEMENT – CAPE TOWN STADIUM (CTS) ....................................................... 164 2.15 CONTRACTS HAVING FUTURE BUDGETARY IMPLICATIONS ............................................................................................................ 171 2.16 DETAILS OF EXPENDITURE BY ASSET CLASS .................................................................................................................................... 177 2.17 DETAILS OF CAPITAL EXPENDITURE ................................................................................................................................................. 186 2.18 LEGISLATION COMPLIANCE STATUS .................................................................................................................................................. 189 2.19 OTHER SUPPORTING DOCUMENTS ..................................................................................................................................................... 190 2.20 CONSOLIDATED BUDGET TABLES ...................................................................................................................................................... 198 2.21 MUNICIPAL MANAGER’S QUALITY CERTIFICATE ............................................................................................................................. 211 2.22 ADDITIONAL RECOMMENDATIONS READ IN AT THE SPECIAL COUNCIL MEETING ON 30 MAY 2018 .................................. 212
LIST OF TABLES
Table 1 Expenditure components of the 2018/19 budget ............................................................................................................................ 4 Table 2 Staff cost per vote (directorate) ............................................................................................................................................................ 6 Table 3 Revenue categories of the 2018/19 budget ...................................................................................................................................... 6 Table 4 Average Tariff increases for the 2018/19 MTREF ......................................................................................................................... 8 Table 5 Capital funding sources ............................................................................................................................................................................ 9 Table 6 Extract of new projects in the 2018/19 capital budget ............................................................................................................. 13 Table 7 Summary of Revenue classified by main revenue sources ......................................................................................................... 14 Table 8 Revenue by source as a percentage of total budget ...................................................................................................................... 14 Table 9 Operating Transfers and Grant Receipts (MBRR Table SA18) ................................................................................................. 15 Table 10 Comparison between current water tariffs and proposed water tariffs – Non-indigent ............................................ 19 Table 11 Comparison between current sanitation charges and proposed tariffs - Non Indigent .............................................. 20 Table 12 Comparison between current water charges and proposed increases (domestic consumption) –non-indigent............................................................................................................................................................................................................................................ 21 Table 13 Comparison between current sanitation charges and proposed increases (domestic consumption) – non-indigent ........................................................................................................................................................................................................................... 23 Table 14 Comparison between current waste removal fees and increases ......................................................................................... 24 Table 15 Comparison between current electricity charges and increases (domestic consumption) ........................................ 25 Table 16 MBRR Table SA14 - Household bills ................................................................................................................................................. 26 Table 17 Summary of operating expenditure by main type ...................................................................................................................... 27 Table 18 Operational repairs and maintenance ............................................................................................................................................ 30 Table 19 2018/19 MTREF capital budget per vote ....................................................................................................................................... 32 Table 20 MBRR Table A1 - Budget Summary .................................................................................................................................................. 35 Table 21 MBRR Table A2 - Budgeted Financial Performance (revenue and expenditure by standard classification) ...... 37 Table 22 MBRR Table A3 - Budgeted Financial Performance (revenue and expenditure by municipal vote) ...................... 39 Table 23 Surplus / (Deficit) calculations for the trading services .......................................................................................................... 40 Table 24 MBRR Table A4 - Budgeted Financial Performance (revenue and expenditure) ........................................................... 41 Table 25 MBRR Table A5 - Budgeted Capital Expenditure by vote, standard classification and funding source ................ 44
City of Cape Town - 2018/19 Budget (including additional recommendations read in at the Council meeting of 30 May 2018
Page ii
Table 26 MBRR Table A6 - Budgeted Financial Position ............................................................................................................................ 46 Table 27 MBRR Table A7 - Budgeted Cash Flow Statement ...................................................................................................................... 48 Table 28 MBRR Table A8 - Cash Backed Reserves / Accumulated Surplus Reconciliation ........................................................... 50 Table 29 MBRR Table A9 - Asset Management ............................................................................................................................................... 51 Table 30 MBRR Table A10 - Basic Service Delivery Measurement ......................................................................................................... 55 Table 31 MBRR Table SA4 - Reconciliation between the IDP strategic objective and budgeted revenue ............................... 62 Table 32 MBRR Table SA5 - Reconciliation between the IDP and strategic objectives and budgeted operating expenditure ................................................................................................................................................................................................................... 63 Table 33 MBRR Table SA6 - Reconciliation between the IDP strategic objectives and budgeted capital expenditure ..... 64 Table 34 MBRR Table SA7 - Measureable performance objectives ........................................................................................................ 67 Table 35 MBRR Table SA8 - Performance indicators and benchmarks ................................................................................................ 69 Table 36 Basic social package rebates ............................................................................................................................................................... 73 Table 37 Wastewater Treatment Facility Budget ......................................................................................................................................... 76 Table 38 Collection Rates ........................................................................................................................................................................................ 81 Table 39 Credit rating outlook ............................................................................................................................................................................. 84 Table 40 Capital Budget over MTREF ................................................................................................................................................................ 89 Table 41 Summary of parameters applied to Operating Budget ............................................................................................................ 90 Table 42 Breakdown of the operating revenue over the medium-term ............................................................................................... 91 Table 43 MBRR Table SA15 - Detailed investment information .............................................................................................................. 92 Table 44 MBRR Table SA16 - Investment particulars by maturity ......................................................................................................... 93 Table 45 Sources of capital revenue over the MTREF .................................................................................................................................. 95 Table 46 MBRR Table SA18 - Capital transfers and grants receipts ...................................................................................................... 96 Table 47 MBRR Table SA17 - Detail of borrowing ........................................................................................................................................ 97 Table 48 MBRR Table A7 - Budgeted cash flow statement ........................................................................................................................ 98 Table 49 MBRR Table A8 - Cash backed reserves / accumulated surplus reconciliation .............................................................. 99 Table 50 MBRR Table SA10 - Funding Compliance measurement ...................................................................................................... 100 Table 51 MBRR Table SA19 - Expenditure on transfers and grant programmes .......................................................................... 105 Table 52 MBRR Table SA22 – Summary of councillor and staff benefits .......................................................................................... 108 Table 53 MBRR Table SA23 - Salaries, allowances and benefits (political office bearers / councillors / senior officials) for the 2018/19 financial year ........................................................................................................................................................................... 109 Table 54 MBRR Table SA24 - Summary of personnel numbers ............................................................................................................. 110 Table 55 MBRR Table SA25 - Budgeted monthly revenue and expenditure .................................................................................... 111 Table 56 MBRR Table SA26 - Budgeted monthly revenue and expenditure (municipal vote) ................................................. 113 Table 57 MBRR Table SA27 - Budgeted monthly revenue and expenditure (functional classification) ............................... 114 Table 58 MBRR Table SA28 - Budgeted monthly capital expenditure (municipal vote) ............................................................ 116 Table 59 MBRR Table SA29 - Budgeted monthly capital expenditure (functional classification) .......................................... 117 Table 60 MBRR Table SA30 - Budgeted monthly cash flow .................................................................................................................... 118 Table 61 Area Based Service Delivery (Vote 1) - operating revenue by source, expenditure by type and total capital expenditure ................................................................................................................................................................................................................ 122 Table 62 Assets & Facilities Management (Vote 2) - operating revenue by source, expenditure by type and total capital expenditure ................................................................................................................................................................................................................ 124 Table 63 City Manager (Vote 3) - operating revenue by source, expenditure by type and total capital expenditure .... 126 Table 64 Corporate Services (Vote 4) - operating revenue by source, expenditure by type and total capital expenditure......................................................................................................................................................................................................................................... 131 Table 65 Energy (Vote 5) - operating revenue by source, expenditure by type and total capital expenditure .................. 134 Table 66 Finance (Vote 6) - operating revenue by source, expenditure by type and total capital expenditure ................ 136 Table 67 Informal Settlements & Backyarders department (Vote 7) - operating revenue by source, expenditure by type and total capital expenditure ............................................................................................................................................................................. 140 Table 68 Solid Waste Management department (Vote 7) - operating revenue by source, expenditure by type and total capital expenditure ................................................................................................................................................................................................. 143 Table 69 Water & Sanitation department (Vote 7) - operating revenue by source, expenditure by type and total capital expenditure ................................................................................................................................................................................................................ 146 Table 70 Safety & Security (Vote 8) - operating revenue by source, expenditure by type and total capital expenditure......................................................................................................................................................................................................................................... 149 Table 71 Social Services (Vote 9) - operating revenue by source, expenditure by type and total capital expenditure . 152 Table 72 Strategic Governance (Vote 10) - operating revenue by source, expenditure by type and total capital expenditure ................................................................................................................................................................................................................ 153 Table 73 Transport & Urban Development Authority (Vote 11) - operating revenue by source, expenditure by type and total capital expenditure ...................................................................................................................................................................................... 156 Table 74 CTICC – Service Delivery Agreement ............................................................................................................................................. 158 Table 75 CTICC - Table D1 Budget Summary .............................................................................................................................................. 159 Table 76 CTICC - Table D2 Budgeted Financial Performance (revenue and expenditure) ....................................................... 160 Table 77 CTICC - Table D3 Capital Budget by vote and funding ......................................................................................................... 161

City of Cape Town - 2018/19 Budget (including additional recommendations read in at the Council meeting of 30 May 2018
Page iii
Table 78 CTICC - Table D4 Budgeted Financial Position ........................................................................................................................ 162 Table 79 CTICC – Table D5 Budgeted Cash Flow ....................................................................................................................................... 163 Table 80 CTS – Service Delivery Agreement ................................................................................................................................................. 166 Table 81 CTS - Table D1 Budget Summary .................................................................................................................................................. 167 Table 82 CTS - Table D2 Budgeted Financial Performance (revenue and expenditure) ........................................................... 168 Table 83 CTS - Table D4 Budgeted Financial Position ............................................................................................................................ 169 Table 84 CTS – Table D5 Budgeted Cash Flow............................................................................................................................................ 170 Table 85 MBRR Table SA33 - Contracts having future budgetary implications ............................................................................ 171 Table 86 – Projects having future budgetary implications ..................................................................................................................... 173 Table 87 MBRR Table SA34a - Capital expenditure on new assets by asset class .......................................................................... 177 Table 88 MBRR Table SA34b - Capital expenditure on the renewal of existing assets by asset class .................................... 178 Table 89 MBRR Table SA34c - Repairs and maintenance expenditure by asset class .................................................................. 180 Table 90 MBRR Table SA34d Depreciation by asset class ....................................................................................................................... 182 Table 91 MBRR Table SA34e Capital expenditure on the upgrading of existing assets by asset class .................................. 184 Table 92 MBRR Table SA35 - Future financial implication of the capital budget ......................................................................... 186 Table 93 MBRR Table SA37 - Projects delayed from previous financial year/s ............................................................................. 187 Table 94 MBRR Table SA1 - Supporting detail to budgeted financial performance..................................................................... 190 Table 95 MBRR Table SA2 - Matrix financial performance budget (revenue source / expenditure type and department)......................................................................................................................................................................................................................................... 193 Table 96 MBRR Table SA3 - Supporting detail to Statement of Financial Position ..................................................................... 195 Table 97 MBRR Table SA9 - Social, economic and demographic statistics and assumptions ................................................... 197 Table 98 - MBRR Table A1 Consolidated Budget Summary ................................................................................................................... 198 Table 99 - MBRR Table A2 Consolidated Budgeted Financial Performance (revenue and expenditure by standard classification) ............................................................................................................................................................................................................ 200 Table 100 - MBBR Table A3 Consolidated Budgeted Financial Performance (revenue and expenditure by municipal vote) .............................................................................................................................................................................................................................. 201 Table 101 – MBRR Table A4 Consolidated Budgeted Financial Performance (revenue and expenditure) ......................... 202 Table 102 – MBRR Table A5 Consolidated Budgeted Capital Expenditure by vote, standard classification and funding......................................................................................................................................................................................................................................... 203 Table 103 – MBRR Table A6 Consolidated Budgeted Financial Position .......................................................................................... 204 Table 104 – MBRR Table A7 Consolidated Budgeted Cash Flows ........................................................................................................ 205 Table 105 – MBRR Table A8 Consolidated Cash backed reserves/accumulated surplus reconciliation .............................. 206 Table 106 - MBRR Table A9 Consolidated Asset Management .............................................................................................................. 207
LIST OF FIGURES
Figure 1 Main operational expenditure categories for the 2018/19 financial year .................................................... 29 Figure 2 Capital Infrastructure Programme .................................................................................................................................. 34 Figure 3 Revenue by source .................................................................................................................................................................... 42 Figure 4 Expenditure by type ................................................................................................................................................................. 43 Figure 5 Depreciation in relation to repairs and maintenance for previous years and over the MTREF .......... 54 Figure 6 IDP and Budget link ................................................................................................................................................................. 61 Figure 7 Planning, budgeting and reporting cycle ...................................................................................................................... 65 Figure 8 Correlation between the City’s CPI and the salary increase over the MTREF .............................................. 82 Figure 9 Revenue parameters for the MTREF period ................................................................................................................. 86 Figure 10 Breakdown of operating revenue over the 2018/19 MTREF ............................................................................ 91 Figure 11 Sources of capital revenue for the 2018/19 financial year ................................................................................ 95 Figure 12 Growth in outstanding borrowings (long-term liabilities) ................................................................................ 97 Figure 13 Cash and cash equivalents / cash backed reserves and accumulated funds ........................................... 100 LIST OF ANNEXURES
Annexure 1 Multi year capital appropriations by vote
Annexure 2 Property (Tax) Rates
Annexure 3 City Improvement Districts (CIDs) Additional Rates
Annexure 4 Revised consumptive tariffs, rates and basic charges for electricity services, water services
and waste management services
Annexure 5 Rates policy
Annexure 6 Tariffs, fees and charges book
Annexure 7 Tariff policies
Annexure 8 Credit control and debt collection policy
City of Cape Town - 2018/19 Budget (including additional recommendations read in at the Council meeting of 30 May 2018
Page iv
Annexure 9 Grants-In-Aid policy
Annexure 10 Policy On Accounts Payable
Annexure 11 Funding and Reserves Policy
Annexure 12 Virement Policy
Annexure 13 Budget Management and Oversight Policy
Annexure 14 Long Term Financial Plan Policy
Annexure 15 Policy Governing Adjustment Budgets
Annexure 16 Unforeseen and Unavoidable Expenditure Policy
Annexure 17 Policy Governing Planning and Approval of Capital Projects
Annexure 18 Integrated Development Plan July 2017-June 2022 with proposed amendments (2018/19) Annexure 19 Overview of budget assumptions applied to the 2018/19 MTREF required to be included in
Annexure 18 (IDP)
Annexure 20 Transfers and grants to external organisations
Annexure 21 Individual projects with a total project cost in excess of R50 million (to give effect to section
19(1) (B) of the MFMA)
Annexure 22 Operating- and capital ward allocation projects supported by Subcouncils
Annexure 23 Cape Town International Convention Centre (CTICC) (Municipal Entity)- Schedule D (annual
budget and supporting tables)
Annexure 24 Cape Town International Convention Centre (Municipal Entity) – Business plan
Annexure 25 Cape Town Stadium (CTS) (Municipal Entity) - Schedule D (annual budget and supporting
tables)
Annexure 26 Cape Town Stadium (Municipal Entity) – Business plan
Annexure 27 Iconic and other events to be hosted by the City in 2018/19
Annexure 28 National Treasury Circular 89 and Circular 91 - Municipal budget circulars for the 2018/19
MTREF
Annexure 29 Detailed capital budget (MBRR Table SA36)
Annexure 30 Detailed operational projects (MBRR Table SA38)
Annexure 31 List of external mechanisms (MBRR Table SA32)
Annexure 32 Schedule of Service Delivery Standards
City of Cape Town - 2018/19 Budget (including additional recommendations read in at the Council meeting of 30 May 2018
Page v
GLOSSARY OF TERMS AND ABBREVIATIONS Adjustments Budgets – Prescribed in section 28 of the
Municipal Finance Management Act, this is the formal means
by which a municipality may revise its budget during a
financial year.
Allocations – Money received from Provincial- and National
Treasury.
Budget – The financial plan of a municipality.
Budget related policy – Policy of a municipality affecting, or
affected by, the budget. Examples include tariff policy, rates
policy and credit control and debt collection policy.
Budget Steering committee (BSC) – Committee
established to provide technical assistance to the Mayor in
discharging the responsibilities set out in section 53 of the
MFMA.
Capital Expenditure – Spending on municipal assets such
as land, buildings and vehicles. Any capital expenditure must
be reflected as an asset on a municipality’s balance sheet.
Cash Flow Statement – A statement showing when actual
cash will be received and spent by the municipality, and the
cash and short-term investment balances.
CGD – Capital Grants and Donations
CCT/City – City of Cape Town
CPI – Headline Consumer Price Index
CRR – Capital Replacement Reserve
DMTN – Domestic Medium Term Note
DoRA – Division of Revenue Act. Annual legislation, which
shows the allocations from national to local government.
DoRb – Division of Revenue Bill. Annual legislation tabled in
parliament, but not enacted, which shows the allocations from
national to local government.
Executive Management Team (EMT) - A team comprising
of the City Manager and the Executive Directors reporting to
the City Manager.
Equitable Share – A general grant paid to municipalities. It
is predominantly targeted at assisting municipalities with the
costs of free basic services.
GDFI - Gross Domestic Fixed Investment
GFS – Government Finance Statistics. An internationally
recognised classification system that facilitates comparisons
between municipalities.
IDP – Integrated Development Plan. The main strategic
planning document of a municipality.
KPI – Key Performance Indicators. Measure of service
outputs and/or outcomes.
MayCO – Mayoral Committee
MBRR – Municipal Budget Reporting Regulations
MFMA - Municipal Finance Management Act (No 53 of 2003).
The principal piece of legislation relating to municipal
financial management.
mSCOA – municipal Standard Chart of Accounts
MTREF – Medium Term Revenue and Expenditure
Framework, as prescribed by the MFMA. It sets out indicative
revenue and projected expenditure for the budget year, plus
two outer financial years.
MYPD – Multi Year Price Determination
NT – National Treasury
ODTP – Organisational Development and Transformation
Plan
Operating Expenditure – The day-to-day expenses of a
municipality such as general expenses, salaries & wages and
repairs & maintenance.
Portfolio Committee – In line with S.79 of the Structures Act,
the City’s Portfolio Committees process policies and bylaws
relating to the functional areas within their terms of reference,
and are responsible for implementation monitoring of these,
as well as oversight of the functional areas. Portfolio
Committees are also responsible for assessing and
monitoring services delivery, ensuring that annual budgets
are spent wisely, and that there is no wastage or corruption.
Rates – Local Government tax based on assessed valuation
of a property.
TMA – Total Municipal Account
SDBIP – Service Delivery Budget Implementation Plan. A
detailed plan comprising of quarterly performance targets
and monthly budget estimates.
SFA – Strategic Focus Areas. The main priorities of a
municipality as set out in the IDP. Budgeted spending must
contribute towards achievement of these Strategic Focus
Areas.
Subcouncils - The metropolitan area governed by the City is
divided into subcouncils, each of which is made up of a
number of wards. Each ward is made up of a number of
suburbs and is represented by a councillor.
Vote – One of the main segments into which a budget is
divided, usually at directorate level.

City of Cape Town - 2018/19 Budget (including additional recommendations read in at the Council meeting of 30 May 2018
Page 1
Part 1 - Annual Budget
1.1 Council Resolutions
The 2018/19 MTREF budget resolutions recommend that:
1. The City’s annual budget for the financial year 2018/19; and indicative allocations for the two
projected outer years 2019/20 and 2020/21, and related policies as set out in the following
schedules and annexures, be adopted.
a. Operating expenditure by standard classification reflected in Table 21.
b. Operating expenditure by vote reflected in Table 22.
c. Operating revenue by source reflected in Table 24
d. Multi-year capital appropriations by vote reflected in Annexure 1.
e. Capital expenditure by standard classification reflected in Table 25.
f. Capital funding by source reflected in Table 25.
g. Budgeted Cash Flow statement as reflected in Table 27.
h. Salaries and Benefits of Political Office Bearers, Councillors and Senior Officials as reflected
in Table 52 and Table 53.
i. Performance Indicators and benchmarks for 2018/19 as set out in Table 35.
j. Consolidated budget tables for the City and municipal entities (CTICC and CTS) as reflected
in Table 98 to Table 106.
k. Property (Tax) Rates as set out in Annexure 2.
l. City Improvement Districts (CIDs) - Additional Rates Special Rating Areas (SRA) policy, SRA
additional rates as set out in Annexure 3.
m. Revised consumptive tariffs, rates and basic charges for electricity services, water services
and waste management services as set out in Annexure 4.
n. Rates policy as set out in Annexure 5.
o. Tariffs, fees and charges book as set out in Annexure 6.
p. Tariff policies as set out in Annexure 7.
q. Credit control and debt collection policy as set out in Annexure 8 (with effect from 01 June
2018).
r. Grants-In-Aid policy as set out in Annexure 9.
s. Policy On Accounts Payable as set out in Annexure 10.
t. Funding and Reserves Policy as set out in Annexure 11.
u. Virement Policy as set out in Annexure 12.
v. Budget Management and Oversight Policy as set out in Annexure 13.
w. Long Term Financial Plan Policy as set out in Annexure 14.
x. Policy Governing Adjustments Budgets as set out in Annexure 15.
y. Unforeseen and Unavoidable Expenditure Policy as set out in Annexure 16.
z. Policy Governing Planning and Approval of Capital Projects as set out in Annexure 17.
aa. Integrated Development Plan (IDP) July 2017-June 2022 with proposed amendments
(2018/19) as set out in Annexure 18.
bb. Overview of budget assumptions applied to the 2018/19 MTREF required to be included in
Annexure 18 [IDP July 2017-June 2022 with proposed amendments (2018/19)] as set out in
Annexure 19.
cc. Transfers and grants to external organisations as set out in Annexure 20.
City of Cape Town - 2018/19 Budget (including additional recommendations read in at the Council meeting of 30 May 2018
Page 2
dd. Individual projects with a total project cost in excess of R50 million (to give effect to S.19(1)
(b) of the MFMA) as reflected in Table 81 and as set out in Annexure 21.
ee. Operating- and capital ward allocation projects supported by Subcouncils as set out in
Annexure 22.
ff. Cape Town International Convention Centre - Schedule D (annual budget and supporting
tables) as set out in Annexure 23.
gg. Cape Town International Convention Centre – Business Plan as set out in Annexure 24.
hh. Cape Town Stadium – Schedule D (annual budget and supporting tables) as set out in
Annexure 25.
ii. Cape Town Stadium – Business Plan as set out in Annexure 26.
jj. Iconic and other events to be hosted by the City in 2018/19 as set out in Annexure 27.
2. National Treasury Circular 89 and Circular 91 (Municipal budget circulars for the 2018/19 MTREF)
as set out in Annexure 28 to this report be noted.
3. Unspent conditional grant allocations (national), as at the end of the 2017/18 financial year, and
appropriated or voted to 2018/19 and future years, not be committed to expenditure until approval
thereof is obtained from National Treasury, in accordance with the directive of Budget Circular 48
(2009), Circular 51 (2010), Circular 55 (2011), Circular 59 (2012), Circular 67 (2013), Circular 72
(2014), Circular 75 (2015), Circular 79 (2016) and Circular 91 (2018).
4. The Capital Replacement Reserve(CRR): Ward Allocations be funded from savings identified in
the 2017/18 financial year to fund the ward allocation projects in the amount of R53 428 500 for the
2018/19 financial year.
5. The changes to the tabled 2018/19 – 2020/21 budget (March 2018) and the 2018/19 – 2020/21
budget (May 2018) as reported in Annexure B, be adopted. It should be noted that these changes
were already incorporated into the tables in Annexure A to this report.
6. Council approves the commencement of a process, in compliance with Section 46 of the Municipal
Finance Management Act (MFMA), to take up funding to an amount of R4 billion depending on the
City’s cash flow requirements. However, should the cash flow position be sufficient to fund the
capital programme either partially or fully, the funding will be adjusted accordingly.
7. An amount of up to R2 million be made available in support of the Council approved Mayor’s Special
Fund objective, as contemplated in Section 12 of the MFMA, and that this allocation be funded from
within the Rates account.

City of Cape Town - 2018/19 Budget (including additional recommendations read in at the Council meeting of 30 May 2018
Page 3
1.2 Executive Summary
a. mSCOA (municipal Standard Chart of Accounts)
The municipal Standard Chart of Accounts (mSCOA), was developed by National Treasury (NT) to
standardise financial reporting- and related information across all municipalities in South Africa. In
terms of section 168 of the MFMA (Act No. 56 of 2003), the Minister of Finance gazetted the Municipal
Regulations on Standard Chart of Accounts into effect on 22 April 2014. These regulations provide for
full compliance to the mSCOA classification framework, by all municipalities and municipal entities, by
1 July 2017.
The detailed mSCOA requirements and classification are contained in spreadsheets issued by NT and
are also referred to as the mSCOA grid. This grid contains the classification framework for the seven
mSCOA segments i.e. Item, Projects, Funding, Function, Regional Indicator, Standard Classification
and Costing.
NT issues updated versions of the mSCOA grid together with the annual NT Budget Circulars, which
are used as a guide by municipalities when compiling their annual budgets.
The 2018/19 MTREF was drafted using mSCOA version 6.2 as per NT Budget Circular 89 issued in
December 2017. The City will continuously refine mSCOA e.g. Balance Sheet Planning based on
additional requirements in version 6.2. In addition, certain mSCOA principles are to be investigated
following reviews of Project Segment Documents (PSDs), responses from NT on FAQs logged and
changes observed in version 6.2.
b. Total Budget
The total budget quantum for the 2018/19 year is R47 672 million, of which R39 264 million (82.4%) is
allocated to the operating budget and R8 408 million (17.6%) to the capital budget.
City of Cape Town - 2018/19 Budget (including additional recommendations read in at the Council meeting of 30 May 2018
Page 4
c. Operating Budget
Expenditure
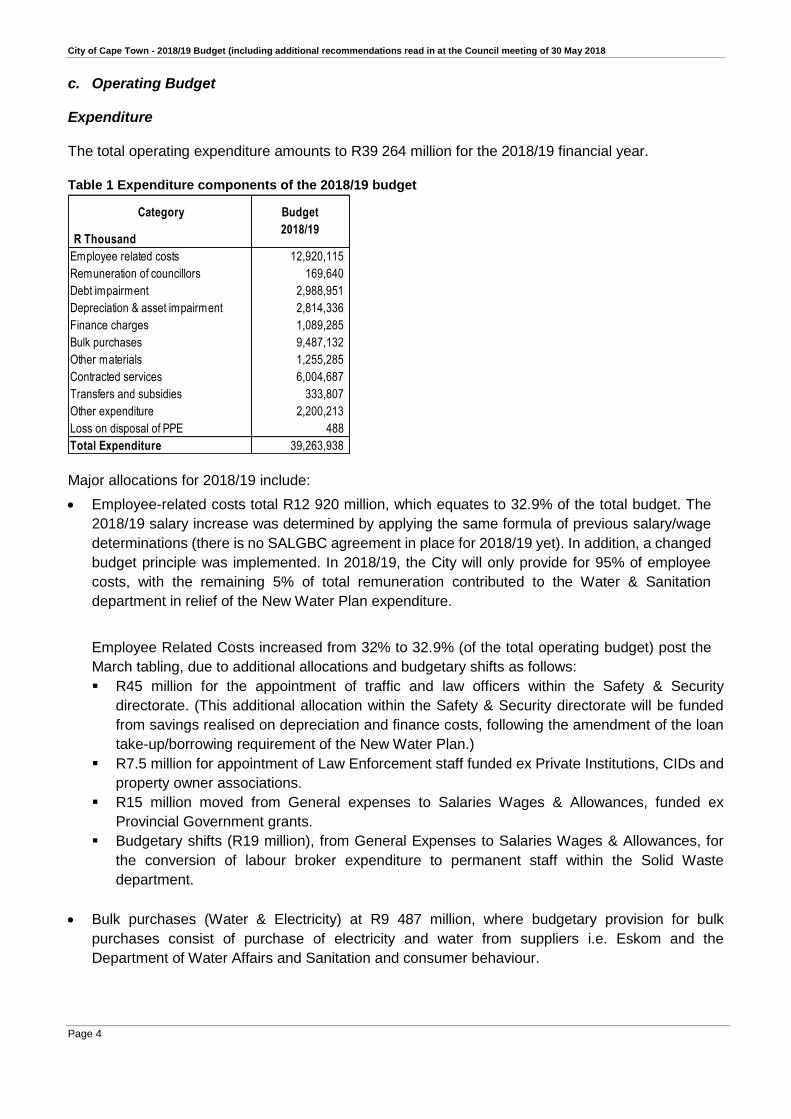
The total operating expenditure amounts to R39 264 million for the 2018/19 financial year.
Table 1 Expenditure components of the 2018/19 budget
R Thousand
Employee related costs 12,920,115
Remuneration of councillors 169,640
Debt impairment 2,988,951
Depreciation & asset impairment 2,814,336
Finance charges 1,089,285
Bulk purchases 9,487,132
Other materials 1,255,285
Contracted services 6,004,687
Transfers and subsidies 333,807
Other expenditure 2,200,213
Loss on disposal of PPE 488
Total Expenditure 39,263,938
Category Budget
2018/19
Major allocations for 2018/19 include:
Employee-related costs total R12 920 million, which equates to 32.9% of the total budget. The
2018/19 salary increase was determined by applying the same formula of previous salary/wage
determinations (there is no SALGBC agreement in place for 2018/19 yet). In addition, a changed
budget principle was implemented. In 2018/19, the City will only provide for 95% of employee
costs, with the remaining 5% of total remuneration contributed to the Water & Sanitation
department in relief of the New Water Plan expenditure.
Employee Related Costs increased from 32% to 32.9% (of the total operating budget) post the
March tabling, due to additional allocations and budgetary shifts as follows:
R45 million for the appointment of traffic and law officers within the Safety & Security
directorate. (This additional allocation within the Safety & Security directorate will be funded
from savings realised on depreciation and finance costs, following the amendment of the loan
take-up/borrowing requirement of the New Water Plan.)
R7.5 million for appointment of Law Enforcement staff funded ex Private Institutions, CIDs and
property owner associations.
R15 million moved from General expenses to Salaries Wages & Allowances, funded ex
Provincial Government grants.
Budgetary shifts (R19 million), from General Expenses to Salaries Wages & Allowances, for
the conversion of labour broker expenditure to permanent staff within the Solid Waste
department.
Bulk purchases (Water & Electricity) at R9 487 million, where budgetary provision for bulk
purchases consist of purchase of electricity and water from suppliers i.e. Eskom and the
Department of Water Affairs and Sanitation and consumer behaviour.
City of Cape Town - 2018/19 Budget (including additional recommendations read in at the Council meeting of 30 May 2018
Page 5
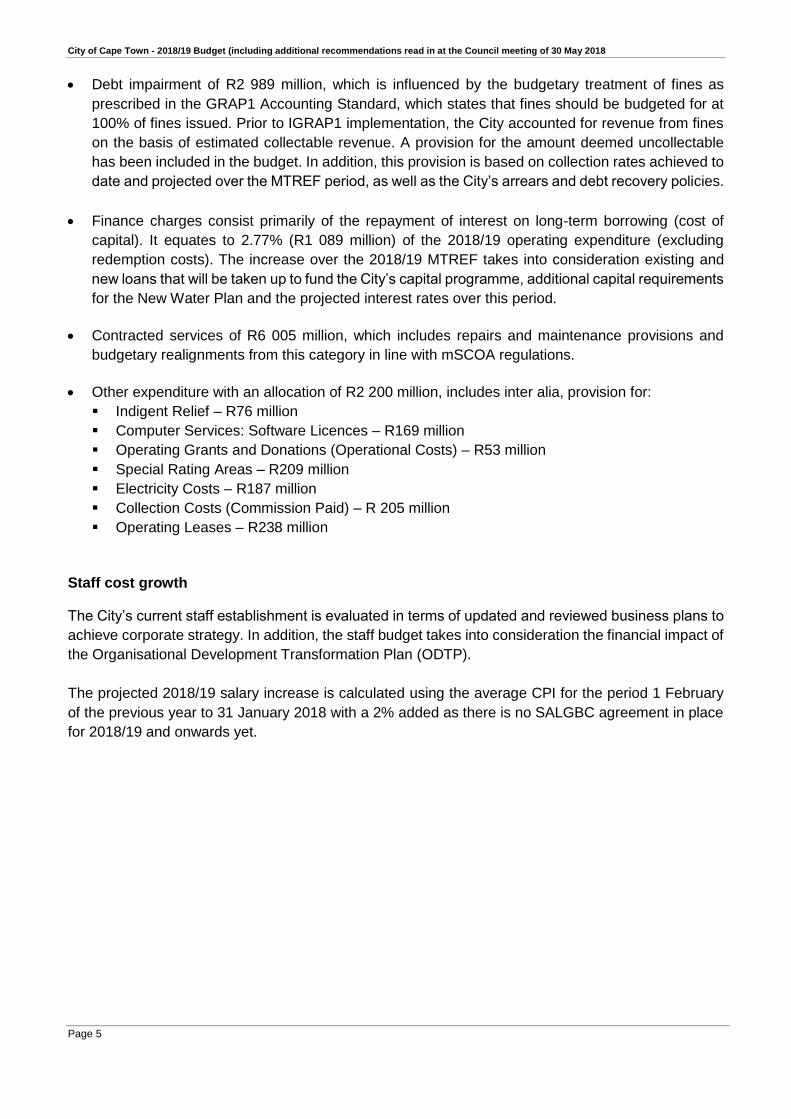
Debt impairment of R2 989 million, which is influenced by the budgetary treatment of fines as
prescribed in the GRAP1 Accounting Standard, which states that fines should be budgeted for at
100% of fines issued. Prior to IGRAP1 implementation, the City accounted for revenue from fines
on the basis of estimated collectable revenue. A provision for the amount deemed uncollectable
has been included in the budget. In addition, this provision is based on collection rates achieved to
date and projected over the MTREF period, as well as the City’s arrears and debt recovery policies.
Finance charges consist primarily of the repayment of interest on long-term borrowing (cost of
capital). It equates to 2.77% (R1 089 million) of the 2018/19 operating expenditure (excluding
redemption costs). The increase over the 2018/19 MTREF takes into consideration existing and
new loans that will be taken up to fund the City’s capital programme, additional capital requirements
for the New Water Plan and the projected interest rates over this period.
Contracted services of R6 005 million, which includes repairs and maintenance provisions and
budgetary realignments from this category in line with mSCOA regulations.
Other expenditure with an allocation of R2 200 million, includes inter alia, provision for:
Indigent Relief – R76 million
Computer Services: Software Licences – R169 million
Operating Grants and Donations (Operational Costs) – R53 million
Special Rating Areas – R209 million
Electricity Costs – R187 million
Collection Costs (Commission Paid) – R 205 million
Operating Leases – R238 million
Staff cost growth
The City’s current staff establishment is evaluated in terms of updated and reviewed business plans to
achieve corporate strategy. In addition, the staff budget takes into consideration the financial impact of
the Organisational Development Transformation Plan (ODTP).
The projected 2018/19 salary increase is calculated using the average CPI for the period 1 February
of the previous year to 31 January 2018 with a 2% added as there is no SALGBC agreement in place
for 2018/19 and onwards yet.
City of Cape Town - 2018/19 Budget (including additional recommendations read in at the Council meeting of 30 May 2018
Page 6
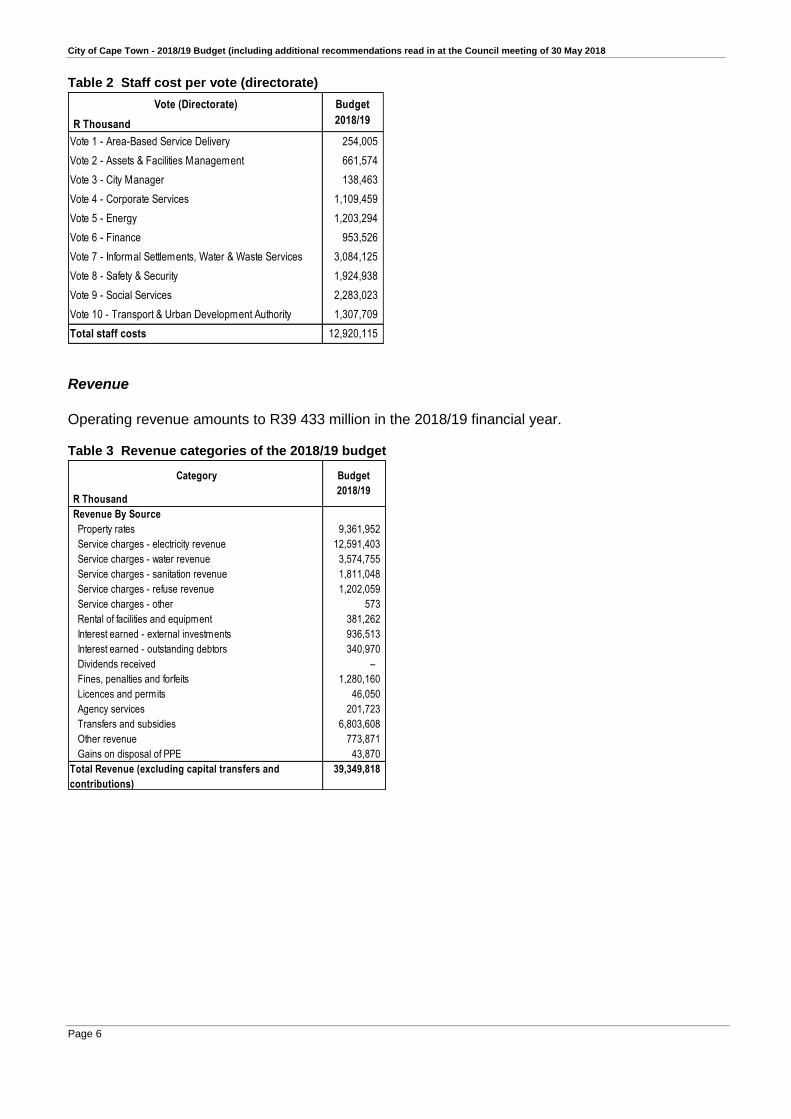
Table 2 Staff cost per vote (directorate)
R Thousand
Vote 1 - Area-Based Service Delivery 254,005
Vote 2 - Assets & Facilities Management 661,574
Vote 3 - City Manager 138,463
Vote 4 - Corporate Services 1,109,459
Vote 5 - Energy 1,203,294
Vote 6 - Finance 953,526
Vote 7 - Informal Settlements, Water & Waste Services 3,084,125
Vote 8 - Safety & Security 1,924,938
Vote 9 - Social Services 2,283,023
Vote 10 - Transport & Urban Development Authority 1,307,709
Total staff costs 12,920,115
Vote (Directorate) Budget
2018/19
Revenue
Operating revenue amounts to R39 433 million in the 2018/19 financial year. Table 3 Revenue categories of the 2018/19 budget
R Thousand
Revenue By Source
Property rates 9,361,952
Service charges - electricity revenue 12,591,403
Service charges - water revenue 3,574,755
Service charges - sanitation revenue 1,811,048
Service charges - refuse revenue 1,202,059
Service charges - other 573
Rental of facilities and equipment 381,262
Interest earned - external investments 936,513
Interest earned - outstanding debtors 340,970
Dividends received –
Fines, penalties and forfeits 1,280,160
Licences and permits 46,050
Agency services 201,723
Transfers and subsidies 6,803,608
Other revenue 773,871
Gains on disposal of PPE 43,870
Total Revenue (excluding capital transfers and
contributions)
39,349,818
Category Budget
2018/19

City of Cape Town - 2018/19 Budget (including additional recommendations read in at the Council meeting of 30 May 2018
Page 7
Major allocations for 2018/19 include:
Property rates (R9 362 million)
This allocation is influenced by the General Valuation (GV) 2015 outcome. The Rates growth
parameter is attributed to a revenue quantum increase of 6.5% and a growth of 0.5% for 2018/19.
In addition, the implementation of the real-time rates billing in terms of the amended Municipal
Property Rates Act (MPRA) improved the Rates revenue considerably.
Service charges – electricity revenue (R12 591 million)
2017/18 was the end of the Multi–Year Price Determination (MYPD) agreement, thus Eskom
applied to the National Energy Regulator of South Africa (NERSA) for an increase for the 2018/19
financial year.
In this regard, NERSA approved an average percentage price increase of 5.23% to Eskom for the
2018/19 financial year, which translated into a 7.32% increase for municipalities. There is currently
no longer term price increase agreement in place; i.e. only an increase for the 2018/19 financial
year of the MTREF was approved. In addition, a Service Charge to Home Users of R150 to cover
fixed costs will be introduced in 2018/19. A portion of all revenue goes towards maintaining the
service connections of residents. Currently this cost is recouped via electricity sales (as a cent per
kWh), however under the current tariff formula only those who use 600 units or more are fully
covering the costs associated with servicing their homes. This means that customers on the
Domestic Tariff who use less than 600 units in a month are being subsidised by other users. It is
not sustainable to provide subsidy to residents who are not considered financially vulnerable.
The City has sought to correct this by proposing activation of the Home User Tariff, that allows the
City to recoup the cost of providing services to Domestic Tariff customers who buy less than 600
units per month. Under the current proposal all customers with a property value of R1 million and
above will be moved onto the Home User Tariff from 1 July 2018.
Service Charges – Water Revenue (R3 575 million) and Sanitation Revenue (R1 811 million)
The revenue base for Water and Sanitation was calculated from a level 1 volumetric consumption
level, as adjusted for growth, to ensure stability in the forecasting, obtaining a revenue neutral
position on the restriction levels and to prevent commitments, which cannot be sustained at the
projected volumetric consumption levels.
Higher than CPI increases are proposed for Water & Sanitation tariffs and are influenced by various
factors such as:
Various initiatives planned over the ensuing years to ensure sustainability and resilience in the
provision of water for the City in light of the current severe drought conditions;
Investment in desalination, underground extraction from aquifers and water reclamation / reuse
initiatives in an effort to ensure water security;
The continued investment in asset replacement programmes to ensure proper asset
management;
Acceleration of the repairs and maintenance programme as well as staffing strategy to ensure
that service delivery and response expectations are met.
The further roll out of water demand management initiatives to limit the abuse of water;
The significantly lower collection rate, as evidenced in the previous financial period’s results;

City of Cape Town - 2018/19 Budget (including additional recommendations read in at the Council meeting of 30 May 2018
Page 8
The projected shrinkage in overall water consumption; and
The projected shrinkage within the high consumption steps which are normally used for cross-
subsidisation.
In addition, due to the current climatic conditions, level 6b water restriction are due to continue for
the 2018/19 financial year and level 6 restrictions tariff will still be applicable from 1 July 2018.
Transfers and Subsidies (R6 804 million; mainly National- and Provincial allocations)
For purposes of the budget compilation, national allocations are based on the 2018 Division of
Revenue Bill (DoRB), which was published in February 2018 and provincial allocations are based
on the latest Provincial Gazette 7890, dated 5 March 2018.
Individual service tariffs / Rates
The proposed tariff increases in the table below are averages; i.e. some ratepayers and service users
may pay more and others less than the average as a result of the impact of rebates,
usage/consumption, property value and type of consumer.
Table 4 Average Tariff increases for the 2018/19 MTREF
CategoryBase Budget
2017/18
Budget Year
2018/19
Budget Year +1
2019/20
Budget Year +2
2020/21
Property Rates 5.00% 6.50% 7.70% 8.16%
Electricity 3.34% 8.14% 9.56% 9.96%
Water * 19.25% 19.90% 39.70% 16.80%
Sanitation * 19.25% 19.90% 39.70% 16.80%
Refuse 6.50% 5.70% 7.90% 8.00%
Disposal 8.30% 14.83% 10.87% 14.24%
*Level 6 Water restrictions
Rates
Property rates are based on values indicated in the General Valuation Roll 2015 (GV), with the date of
valuation being 1 August 2015. The Roll is being updated for properties affected by land sub-divisions,
alterations to buildings, demolitions and improvements through Supplemental Valuations.
Accordingly, the rates levied per individual property will depend on that property’s value compared with
the valuation of all the rateable properties in the municipal area. Rebates and concessions are granted
to certain categories of property usage and/or property owner profile.
The definitions and listing of categories are reflected in the Rates Policy attached as Annexure 5.
Water & Sanitation
There is a proposed average revenue increase of 19.9% for water and sanitation for the 2018/19
financial year. It must be emphasised that the revenue increases are predominantly driven by the
permanent impact of the drought on water consumption levels (which had to be adjusted downwards).
There is a proposed 5.5% increase on miscellaneous tariffs. The proposed consumption-based, as well as miscellaneous tariffs, are shown in the attached Tariffs,
fees and charges book (Annexure 6).

City of Cape Town - 2018/19 Budget (including additional recommendations read in at the Council meeting of 30 May 2018
Page 9
Solid Waste
The Solid Waste tariffs are levied to recover costs of services provided directly to customers and
includes refuse collection fees, disposal fees, compost sales, weighbridge fees and other ad hoc
services. An average increase has been applied on the Consumptive Tariffs for Collections of 5.7%
and Disposal of 14.83%. An average increase has been applied on the Miscellaneous tariffs for
Cleaning of 5.5%. The details are reflected in Annexure 4.
Electricity
On 15 December 2017, NERSA issued a statement allowing Eskom an average 5.23% increase, which
equates to a 7.32% increase to Municipalities. On 28 February 2018, NERSA issued a Consultation
Paper on Guideline Increases for regulated tariffs, which set this increase at 6.84%.
These items resulted in the Electricity Generation and Distribution department requiring a revenue
increase from Sale of Electricity of 5.4% in order to meet the budgeted Operating Expenditure and,
when coupled to the expected negative sales growth of -2.75% (which includes a correction to account
for the lower than expected 2017/18 sales), results in a tariff increase requirement of an average of
8.14%. The details are reflected in Annexure 4.
d. Capital Budget
The total capital budget amounts to R8 408 million in the 2018/19 financial year and will be funded as
reflected in the table below.
Table 5 Capital funding sources
R Thousand
Capital Grants & Donations (CGD) 2,144,096
Capital Replacement Reserve (CRR) 1,101,963
External Financing Fund (EFF) 5,075,996
Revenue (Internal funding source) 85,501
Total 8,407,556
Major Capital Funding Sources Budget
2018/19
Capital Grants and Donations (CGD)
Capital Grants and Donations represent 25.5% of 2018/19 capital funding. CGD largely consist of
National- and Provincial allocations. For purposes of the 2018/19 budget compilation, National
allocations are based on the 2018 Division of Revenue Bill (DoRB), which was published in February
2018. Provincial allocations are based on the Provincial Gazette Extraordinary 7890, dated 5 March
2018.
Capital Replacement Reserves (CRR)
Funding from the CRR represents 13.1% of the 2018/19 capital funding. The City will continue to make
funding available via the CRR in support of priorities in 2018/19, such as:
Traffic congestion relief programme amounting to R225 million;
Land acquisition for Human Settlements amounting to R95 million;
Ward allocations amounting to R55.6 million;
Replacement of fleet amounting to R15 million; and
Electricity Generation & Distribution equipment, facilities, vehicles, street lighting, etc. amounting
to R417 million.

City of Cape Town - 2018/19 Budget (including additional recommendations read in at the Council meeting of 30 May 2018
Page 10
External Financing Fund (EFF)
The most significant source of funding of the Capital Budget is the EFF, which represents 60.4%
of the total 2018/19 capital funding requirement. The total EFF allocation amounts to R 5 076 million
in 2018/19. It is anticipated that R4 000 million will be funded from external loans, while the balance
of R1 076 million will be funded from internal resources.
The City is still working towards diversifying the sources of water supply via bringing additional new
water resources online in order to ensure increased resilience during the current drought. The City
has, therefore, accelerated the implementation of new water resources over this MTREF. The
proposed capital budget includes allocations towards the New Water Plan, funded from EFF,
amounting to R1 521 million, R2 056 million and R2 150 million respectively, in the 2018/19,
2019/20 and 2020/21 financial years.
Additional allocations, strategically aligned to the IDP and flowing from the Strategic Management
Framework (SMF) process, were incorporated into the proposed 2018/19 capital budget. These
additional allocations are:
Social Services directorate: R27 million (2018/19) and R42 million (2019/20) for the Social Services
IT Modernisation project in order to implement innovative digital transformation solutions aimed at
improving customer experience.
Safety and Security directorate: R51 million in 2018/19 and R29 million in 2019/20
o Integrated Contact Centre: Phase 2 (R25 million (2018/19); R25 million (2019/20)) for
replacement of the Contravention System, which will ensure that by-laws are loaded on the
City’s own system as opposed to the National Contravention System.
o Further development of the Film & Events Permitting System (R1 million in 2018/19), which
will allow for online applications, tracking and approved permit downloads,
quicker/streamlined service being received, self-service online updating of Event Company
registration / Public Liability Insurance and other relevant financial information as well as fast
e-mail and SMS notifications.
o Events Support Online Application System (R3 million in 2019/20) to replace the current
system, which is a combination of a manual (paper-based) system and an automated system
lacking built-in workflow and tracking of applications. The new system will address:
• Online applications, tracking and approvals;
• Quicker / streamlined service being received;
• Self-service online updating of Event Company registration/Public Liability Insurance and
other relevant financial information; and
• Fast e-mail and SMS notification.
o Development of an Online Event Calendar (R1 million in 2019/20) to replace the manual
calendar, which is not visible to the public, resulting in events clashes, lack of co-ordination
etc. The online Event Calendar will improve planning and co-ordination of events to improve
the geographical spread of events across the City and minimise / avoid event clashes.
o Additional new vehicles (R25 million) for mainly the traffic and law enforcement sections
within the directorate for new and current staff which were not issued with vehicles.

City of Cape Town - 2018/19 Budget (including additional recommendations read in at the Council meeting of 30 May 2018
Page 11
Corporate Services directorate: R10.4 million in 2018/19
o Procurement of Data Science Infrastructure (R1 million), for software licenses and hardware
to support the enterprise high performance computing infrastructure for data analyses, which
will ultimately lead to better decision-making and service delivery.
o Continued Integration and Enhancement of the SAP PPM system (R8.9 million) for the rollout
of the PPM Operating model across the entire organisation requiring additional BI resources
to complete additional organisational requirements. The PPM Operating model is designed
to achieve maximum project portfolio management maturity across business.
o Procurement of IT equipment and furniture (R473 386) for the replacement of old/obsolete
items and to provide equipment and furniture for additional staff being appointed.
Finance directorate: R5.5 million (2018/19), R44.5 million (2019/20) and R24 million (2020/21)
o Walk-in Centre - Table Bay Mall (R5.5 million in 2018/19) to deal with revenue, housing,
property lease transactions/enquiries and cash receipting for these transactions as part of a
more customer-centric approach.
o e-Tendering System (R44.5 million in 2019/20 and R24 million in 2020/21). City officials
manually process almost 3 000 bids received per annum and the current tender turnaround
time is over 20 weeks. The automation of the tendering system will drive better monitoring,
availability of audit trails and efficiencies in terms of time and cost. e-Tendering will cut across
tender- and contract processes organisation wide.
Energy directorate: Sustainable Energy Markets department (R50 000 in 2018/19, R25 million in
2019/20 and R17.3 million in 2020/21) for work towards achieving Energy2040 carbon. The
allocation will be spent on:
o Procurement of IT equipment (R50 000 per financial year);
o Resource efficiency in large municipal buildings for energy efficiency retrofits to reduce
electricity consumption at facilities (R7 million in 2019/20, R17 million in 2020/21); and
o Installation of photovoltaic solar systems in municipal buildings to generate renewable energy
and to ensure energy security (R18 million in 2019/20).
Major capital expenditure is planned in 2018/19 for the directorates below:
Informal Settlements, Water & Waste Services → R4 207 million
Transport & Urban Development Authority → R1 774 million
Energy → R1 113 million
The most significant projects/programmes are:
Assets & Facilities Management
Asset Management Programme → R90 million
Fleet Management - Replacement Vehicles → R55 million
Rental Stock Sub-Meters → R80 million
Corporate Services
Dark Fibre Broadband Infrastructure → R253 million
Energy
Electricity Facilities → R153 million
Electrification → R95 million
Mitchells Plain - Steenbras 132 kV OHL → R46 million
MV Switchgear Refurbishment → R74 million

City of Cape Town - 2018/19 Budget (including additional recommendations read in at the Council meeting of 30 May 2018
Page 12
MV System Infrastructure → R61 million
Service Connections → R95 million
Steenbras: Refurbishment of Main Plant → R43 million
Street Lighting → R53 million
System Equipment Replacement → R175 million
Informal Settlements, Water & Waste Services
Bellville Waste Water Treatment Works → R114 million
Borchards Quarry Waste Water Treatment Works → R59 million
Bulk Water Augmentation Scheme → R116 million
Bulk Water Infrastructure Replacement → R50 million
Cape Flats Waste Water Treatment Works - Refurbishment → R75 million
Contermanskloof Reservoir → R51 million
Meter Replacement Programme → R270 million
New Water Plan → R1521 million
Replace & Upgrade Sewer Network → R106 million
Replace & Upgrade Water Network → R103 million
Upgrading of drop-off facilities → R54 million
Upgrading Solid Waste facilities → R109 million
Zandvliet Waste Water Treatment Works - Extension → R367 million
Safety & Security
Additional Vehicles → R44 million
CCTV Installations → R9 million
Project EPIC: Integrated Contact Centre → R47 million
Replacement of Vehicles → R20 million
Social Services
Cemetery Developments → R21 million
Du Noon Library Construction → R9 million
Ideal Clinics → R12 million
Manenberg Integrated Project → R10 million
New Fisantekraal Clinic → R14 million
New Pelican Park Clinic → R20 million
Park Upgrades Programme → R11 million
Sport and Recreation Facilities Upgrade → R13 million
Transport & Urban Development Authority
Congestion Relief Projects → R240 million
IRT → R287 million
Land Acquisition → R155 million
Metro Roads: Reconstruction → R73 million
Non-Motorised Transport Programme → R134 million
Paardevlei TOD Project → R66 million
Public Transport Interchange Programme → R124 million
Public Transport Systems Management Project → R70 million
Roads: Rehabilitation → R116 million

City of Cape Town - 2018/19 Budget (including additional recommendations read in at the Council meeting of 30 May 2018
Page 13
Table 6 Extract of new projects in the 2018/19 capital budget
Project Description
R Thousand
Home Ownership Trasnfer,Tenancy Management & Staff Housing Department: Records Management IT System2 700
Revenue Department: Walk in Centre: Table Bay Mall 5 500
Water & Sanitation Department: Cape Flats Aquifer Recharge 500 000
Water & Sanitation Department: Zandvliet Plant Re-use (50ML) 22 000
Informal Settlements & Backyarders Department: DeepFreeze:Services Formal Area-Macassar 15 000
Informal Settlements & Backyarders Department: Professional Services: Monwood, Philippi 2 923
Informal Settlements & Backyarders Department: Internal Services: Monwabisi Park 2 000
Solid Waste Management Department: ARTS: MBT (Phase 2) 1 000
Metropolitan Police Services Department: CCTV Cameras - Subcouncil 13 1 450
Recreation & Parks Department: Solomon Tshuku - Outdoor gym 1 500
Library & Information Services Department: New library Manenberg Regional library 1 000
Human Settlement Implementation Department: Sheffield Road Housing Project 200 units 10 000
Human Settlement Implementation Department: Transitional Housing services 2 000
Budget
2018/19
1.3 Operating Revenue Framework The City’s revenue quantum is determined by setting a package of tariffs, which are not only considered
affordable to its ratepayers and the users of its services, but deemed to be at fair and realistic levels
when viewed in context of its programmes to assist those who do not have the means to pay.
The City’s revenue strategy is built around the following key components:
• National Treasury’s guidelines and macro-economic policy;
• Projected City growth and continued economic development;
• Realistic revenue management, which provides for the achieving of the collection rate targets;
• Electricity tariff increases as approved by the National Electricity Regulator of South Africa (NERSA);
• Setting of trading services’ user charges at levels which are reflective of these services’ cost
recovering nature; and
• The municipality’s Property Rates Policy approved in terms of the Municipal Property Rates Act,
2004 (Act 6 of 2004) (MPRA).

City of Cape Town - 2018/19 Budget (including additional recommendations read in at the Council meeting of 30 May 2018
Page 14
The following table is a summary of the 2018/19 MTREF (classified by main revenue source):
Table 7 Summary of Revenue classified by main revenue sources
Description
R thousandBudget Year
2018/19
Budget
Year +1
2019/20
Budget
Year +2
2020/21
Revenue By Source
Property rates 9,361,952 10,248,287 11,131,713
Service charges - electricity revenue 12,591,403 13,519,095 14,865,239
Service charges - water revenue 3,574,755 5,037,616 5,904,860
Service charges - sanitation revenue 1,811,048 2,524,979 2,947,422
Service charges - refuse revenue 1,202,059 1,331,897 1,486,051
Service charges - other 573 738 896
Rental of facilities and equipment 381,262 402,231 424,570
Interest earned - external investments 936,513 989,834 1,020,077
Interest earned - outstanding debtors 340,970 362,409 385,462
Dividends received – – –
Fines, penalties and forfeits 1,280,160 1,350,569 1,425,526
Licences and permits 46,050 48,432 51,120
Agency services 201,723 212,818 224,629
Transfers and subsidies 6,803,608 7,101,185 7,464,469
Other revenue 773,871 816,747 862,106
Gains on disposal of PPE 43,870 46,283 48,852
Total Revenue (excluding capital transfers and
contributions)
39,349,818 43,993,121 48,242,992
2018/19 Medium Term Revenue &
Expenditure Framework
The following table shows the main revenue sources as a percentage of the total revenue budget:
Table 8 Revenue by source as a percentage of total budget
Description
R thousandBudget Year
2018/19%
Budget Year +1
2019/20%
Budget Year +2
2020/21%
Revenue By Source
Property rates 9,361,952 23.8% 10,248,287 23.3% 11,131,713 23.1%
Service charges - electricity revenue 12,591,403 32.0% 13,519,095 30.7% 14,865,239 30.8%
Service charges - water revenue 3,574,755 9.1% 5,037,616 11.5% 5,904,860 12.2%
Service charges - sanitation revenue 1,811,048 4.6% 2,524,979 5.7% 2,947,422 6.1%
Service charges - refuse revenue 1,202,059 3.1% 1,331,897 3.0% 1,486,051 3.1%
Service charges - other 573 0.0% 738 0.0% 896 0.0%
Rental of facilities and equipment 381,262 1.0% 402,231 0.9% 424,570 0.9%
Interest earned - external investments 936,513 2.4% 989,834 2.2% 1,020,077 2.1%
Interest earned - outstanding debtors 340,970 0.9% 362,409 0.8% 385,462 0.8%
Dividends received – 0.0% – 0.0% – 0.0%
Fines, penalties and forfeits 1,280,160 3.3% 1,350,569 3.1% 1,425,526 3.0%
Licences and permits 46,050 0.1% 48,432 0.1% 51,120 0.1%
Agency services 201,723 0.5% 212,818 0.5% 224,629 0.5%
Transfers and subsidies 6,803,608 17.3% 7,101,185 16.1% 7,464,469 15.5%
Other revenue 773,871 2.0% 816,747 1.9% 862,106 1.8%
Gains on disposal of PPE 43,870 0.1% 46,283 0.1% 48,852 0.1%
Total Revenue (excluding capital transfers and
contributions)
39,349,818 100.0% 43,993,121 100.0% 48,242,992 100.0%
Total Revenue from Rates & Service Charges 28,541,790 72.5% 32,662,612 74.2% 36,336,180 75.3%
2018/19 Medium Term Revenue & Expenditure Framework

City of Cape Town - 2018/19 Budget (including additional recommendations read in at the Council meeting of 30 May 2018
Page 15
In line with the formats prescribed by the Municipal Budget and Reporting Regulations (MBRR), capital
transfers and contributions are excluded from the operating statement, as inclusion of these revenue
sources would distort the calculation of the operating surplus/deficit.
Rates and Service Charges revenue makes up 72.5% of the City’s total revenue mix for 2018/19.
Property rates is the second largest revenue source in 2018/19, totaling R9 362 million (23.8% of
revenue).
Transfers and subsidies (operating grants and transfers) total R6 804 million in 2018/19 and increases
to R7 464 million by 2020/21. This revenue component reflects an increase over the MTREF as a result
of increased allocations from Provincial- and National Government, albeit at a relatively low year-on-
year rate of 5% only. The table below reflects all transfers and grants excluding the Fuel Levy
allocation.
Table 9 Operating Transfers and Grant Receipts (MBRR Table SA18)
Description 2014/15 2015/16 2016/17
R thousandAudited
Outcome
Audited
Outcome
Audited
Outcome
Original
Budget
Adjusted
Budget
Full Year
Forecast
Budget Year
2018/19
Budget Year
+1 2019/20
Budget Year
+2 2020/21
Operating Transfers and Grants: RECEIPTS
National Government: 387,274 50,617 2,480,736 2,849,944 3,067,056 3,067,056 3,264,482 3,391,723 3,628,609
Equitable share – – – 2,292,908 2,292,908 2,292,908 2,574,650 2,815,558 3,092,042
Finance Management grant 1,250 1,050 1,050 1,050 1,050 1,050 1,000 1,000 1,000
Urban Settlements Development Grant – – 1,423,504 215,798 231,796 231,796 204,792 204,301 173,000
Energy Efficiency and Demand Side Management Grant – 3,945 15,000 400 400 400 600 – –
Dept. of Environ Affairs and Tourism 4,401 – 5,158 – 7,158 7,158 – – –
Expanded Public Works Programme 21,204 23,616 31,740 13,783 13,783 13,783 23,266 – –
Integrated City Development Grant – – 44,805 8,944 9,944 9,944 7,622 5,392 8,563
Public Transport Infrastructure & Systems Grant – – – 19,636 70,227 70,227 48,812 53,303 41,770
Infrastructure Skills Development 2,300 7,526 9,416 9,393 10,193 10,193 12,605 15,935 16,000
Public Transport Network Grant – – 950,063 288,032 429,596 429,596 391,135 291,434 291,434
Municipal Human Settlements Capacity Grant 50,371 13,703 – – – – – – –
Public Transport Networks Operations Grant 307,548 – – – – – – – –
Department of Public Service and Administration 200 777 – – – – – – –
Neighbourhood Development Partnership Grant – – – – – – – 4,800 4,800
Provincial Government: 1,033,824 1,083,706 1,046,947 1,176,026 1,508,150 1,508,150 967,719 1,069,142 1,089,509
Cultural Affairs and Sport - Provincial Library Services 40,000 37,833 49,665 37,449 41,236 41,236 47,347 47,057 49,737
Cultural Affairs and Sport - Library Services: Transfer funding to enable City of
Cape Town to procure periodicals and newspapers
– – – 4,500 4,500 4,500 4,770 4,989 5,223
Human Settlements - Human Settlement Development Grant 705,185 730,119 596,558 568,052 878,819 878,819 333,550 419,930 392,280
Human Settlements - Municipal Accreditation Assistance – 5,000 10,000 5,000 10,483 10,483 5,000 – –
Human Settlement - Settlement Assistance – – 1,500 1,500 2,867 2,867 1,500 1,500 1,500
Health - TB 25,813 24,653 27,147 27,112 27,604 27,604 53,063 61,341 79,511
Health - ARV 106,167 159,183 206,350 217,701 217,701 217,701 224,414 244,224 270,814
Health - Nutrition 4,504 4,528 4,143 5,572 5,572 5,572 5,928 6,176 6,520
Health - Vaccines 68,422 61,967 96,758 82,134 96,299 96,299 86,899 91,661 91,661
Comprehensive Health – – – 188,146 173,489 173,489 173,489 173,489 173,489
Transport and Public Works - Provision for persons with special needs 10,000 10,000 10,000 10,000 10,313 10,313 10,000 10,000 10,000
Planning, Maintenance and Rehabilitation of Transport Systems and
Infrastructure
10,900 23,200 18,000 – 3,672 3,672 – 3,500 3,500
Community Safety - Law Enforcement Auxiliary Services 19,384 21,669 25,618 3,500 6,915 6,915 3,938 4,159 4,388
Appointment, Training , Equipping and Operationalisation of School Resource
Officers
– – – – – – 345 – –
Community Development Workers – 1,080 1,089 886 1,354 1,354 886 886 886
Finance Management Capacity Building Grant – – 120 240 362 362 360 – –
Provincial Government: Financial Management Support Grant 300 300 – – 230 230 230 230 –
Provincial Contribution towards addressing Natural Disasters – – – – 2,500 2,500 – – –
Human Settlement – – – 24,234 24,234 24,234 – – –
Health - Global Fund 41,856 – – – – – – – –
Transport Safety and Compliance - Rail Safety 500 4,000 – – – – 16,000 – –
Local Government: Compliance 293 – – – – – – – –
Economic Development and Tourism 500 – – – – – – – –
Commercial Mediation Training – 174 – – – – – – –
Current Year 2017/182018/19 Medium Term Revenue &
Expenditure Framework
Table continues on next page
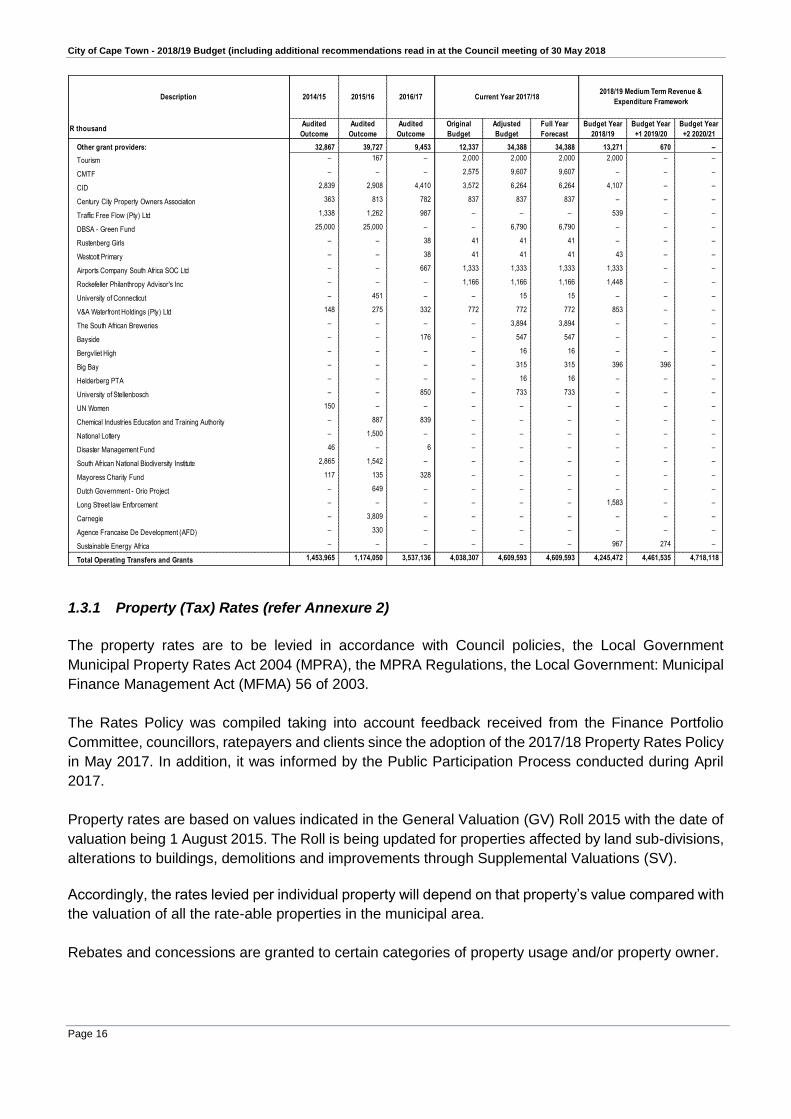
City of Cape Town - 2018/19 Budget (including additional recommendations read in at the Council meeting of 30 May 2018
Page 16
Description 2014/15 2015/16 2016/17
R thousandAudited
Outcome
Audited
Outcome
Audited
Outcome
Original
Budget
Adjusted
Budget
Full Year
Forecast
Budget Year
2018/19
Budget Year
+1 2019/20
Budget Year
+2 2020/21
Other grant providers: 32,867 39,727 9,453 12,337 34,388 34,388 13,271 670 –
Tourism – 167 – 2,000 2,000 2,000 2,000 – –
CMTF – – – 2,575 9,607 9,607 – – –
CID 2,839 2,908 4,410 3,572 6,264 6,264 4,107 – –
Century City Property Owners Association 363 813 782 837 837 837 – – –
Traffic Free Flow (Pty) Ltd 1,338 1,262 987 – – – 539 – –
DBSA - Green Fund 25,000 25,000 – – 6,790 6,790 – – –
Rustenberg Girls – – 38 41 41 41 – – –
Westcott Primary – – 38 41 41 41 43 – –
Airports Company South Africa SOC Ltd – – 667 1,333 1,333 1,333 1,333 – –
Rockefeller Philanthropy Advisor's Inc – – – 1,166 1,166 1,166 1,448 – –
University of Connecticut – 451 – – 15 15 – – –
V&A Waterfront Holdings (Pty) Ltd 148 275 332 772 772 772 853 – –
The South African Breweries – – – – 3,894 3,894 – – –
Bayside – – 176 – 547 547 – – –
Bergvliet High – – – – 16 16 – – –
Big Bay – – – – 315 315 396 396 –
Helderberg PTA – – – – 16 16 – – –
University of Stellenbosch – – 850 – 733 733 – – –
UN Women 150 – – – – – – – –
Chemical Industries Education and Training Authority – 887 839 – – – – – –
National Lottery – 1,500 – – – – – – –
Disaster Management Fund 46 – 6 – – – – – –
South African National Biodiversity Institute 2,865 1,542 – – – – – – –
Mayoress Charity Fund 117 135 328 – – – – – –
Dutch Government - Orio Project – 649 – – – – – – –
Long Street law Enforcement – – – – – – 1,583 – –
Carnegie – 3,809 – – – – – – –
Agence Francaise De Development (AFD) – 330 – – – – – – –
Sustainable Energy Africa – – – – – – 967 274 –
Total Operating Transfers and Grants 1,453,965 1,174,050 3,537,136 4,038,307 4,609,593 4,609,593 4,245,472 4,461,535 4,718,118
Current Year 2017/182018/19 Medium Term Revenue &
Expenditure Framework
1.3.1 Property (Tax) Rates (refer Annexure 2)
The property rates are to be levied in accordance with Council policies, the Local Government
Municipal Property Rates Act 2004 (MPRA), the MPRA Regulations, the Local Government: Municipal
Finance Management Act (MFMA) 56 of 2003.
The Rates Policy was compiled taking into account feedback received from the Finance Portfolio
Committee, councillors, ratepayers and clients since the adoption of the 2017/18 Property Rates Policy
in May 2017. In addition, it was informed by the Public Participation Process conducted during April
2017.
Property rates are based on values indicated in the General Valuation (GV) Roll 2015 with the date of
valuation being 1 August 2015. The Roll is being updated for properties affected by land sub-divisions,
alterations to buildings, demolitions and improvements through Supplemental Valuations (SV).
Accordingly, the rates levied per individual property will depend on that property’s value compared with
the valuation of all the rate-able properties in the municipal area.
Rebates and concessions are granted to certain categories of property usage and/or property owner.

City of Cape Town - 2018/19 Budget (including additional recommendations read in at the Council meeting of 30 May 2018
Page 17
The definitions and listing of categories are reflected in the Rates Policy attached as Annexure 5.
The proposed rates tariffs are shown in the Tariffs, Fees and Charges Book attached as Annexure 6.
1.3.2 Sale of Water and Sanitation and Impact of Tariff Increases (refer Annexure 4)
There is a proposed average revenue increase of 19.9% for water and sanitation. It must be
emphasised that the revenue increases are predominantly driven by the permanent impact of the
drought on water consumption levels (which had to be adjusted downwards).
The projected overall reduction of consumption and specifically evaporation of consumption in the
upper volumetric steps are placing the current progressive domestic stepped tariff structure under
severe strain and increased risk. The City has therefore been forced to act responsibly and consider
alternative methods to ensure much higher levels of certainty and resilience of the financial model to
recover the cost for delivering the service. This is to ensure the current infrastructure can be operated,
maintained and extended to provide the basic services to the community.
The following changes are therefore recommended:
Water Service:
The introduction of a Fixed Basic Charge based on the meter size, which provides the basis of
access to the water network.
Revision of the current six step tariff structure to a four step tariff structure, still designed to
discourage high water consumption, with a higher rate of recovery at the lower steps where usage
is certain.
Uniform tariffs for the non-domestic categories.
The needs of the indigent are addressed and the basic allocation has been increased from 6kl to
10.5kl. This change is however matched by ending the previous subsidisation of step 2 of the
indigent customers. The Fixed Basic Charge for Indigent Customers will be charged at R Nil.
Sanitation Service:
Revision of the current six step tariff structure to a four step tariff structure consumption, with a
higher rate of recovery at the lower steps where usage is certain.
Uniform tariffs for the non-domestic categories.
The needs of the indigent are addressed and the basic allocation has been increased from 4.2kl to
7.35kl. This change is however matched by ending the previous subsidisation of step 2 of the
indigent customers.

City of Cape Town - 2018/19 Budget (including additional recommendations read in at the Council meeting of 30 May 2018
Page 18
With the changes in the tariff structure, it is not possible to specify year-on-year specific tariff increases.
Calculation thereof will depend on the specific set of circumstances of each customer. Significant tariff
increases will however be evident due to the reduction in the volumetric base to recover cost, the
significant cost required for the water augmentation plan to ensure security of water supply from various
sources such as aquifers, water re-use as well as desalination, ensuring the management of assets at
appropriate levels, sustain and enhance the maintenance programs, supplying water and sanitation at
appropriate capacity, service delivery and responsiveness levels. The water collection ratio has also
been adjusted in line with the latest trends.
There are seven tariff sets, which relate to consumption levels in comparison to the Water Demand
Curve. Due to the permanent impact of the drought on water consumption, the volumetric usage per
tariff set had to be adjusted downwards (and will need further refinement once the new levels of
consumption have settled post the drought). Given current circumstances, the level 6 restriction tariffs
will be carried into the 2018/19 financial year and will be subject to change based on further decisions
regarding the water restrictions.
The proposed consumption-based, as well as miscellaneous tariffs, are shown in the Tariffs, Fees and
Charges Book attached as Annexure 6.
The ensuing tables show the proposed tariff charges for water and sanitation over the 2018/19 MTREF.

City of Cape Town - 2018/19 Budget (including additional recommendations read in at the Council meeting of 30 May 2018
Page 19
Table 10 Comparison between current water tariffs and proposed water tariffs – Non-indigent
Current Tariff
2017/18 (10%)
Proposed Tariff
2018/19 (10%)
Current Tariff
2017/18 (20%)
Proposed Tariff
2018/19 (20%)
Current Tariff
2017/18 (30%)
Proposed Tariff
2018/19 (30%)
Current Tariff
2017/18 (40%)
Proposed Tariff
2018/19 (40%)
Current Tariff
2017/18 (50%)
Proposed Tariff
2018/19 (50%)
Current Tariff
2017/18 (60%)
Proposed Tariff
2018/19 (60%)
Current Tariff
2017/18 (70%)
Proposed Tariff
2018/19 (70%)
Rand per Kl
(excl. VAT)
Rand per Kl
(excl. VAT)
Rand per Kl
(excl. VAT)
Rand per Kl
(excl. VAT)
Rand per Kl
(excl. VAT)
Rand per Kl
(excl. VAT)
Rand per Kl (excl.
VAT)
Rand per Kl (excl.
VAT)
Rand per Kl (excl.
VAT)
Rand per Kl (excl.
VAT)
Rand per Kl (excl.
VAT)
Rand per Kl (excl.
VAT)
Rand per Kl (excl.
VAT)
Rand per Kl (excl.
VAT)
DOMESTIC Full
Fixed basic Charge (Assume meter size = 15mm) N/A 56.00 N/A 56.00 N/A 56.00 N/A 56.00 N/A 56.00 N/A 56.00 N/A 56.00
Step 1 (0 < 6kl) 4.00 12.85 4.00 13.26 4.00 13.68 4.00 14.13 18.75 21.19 26.25 28.90 26.25 28.90
Step 2 (>6 < 10.5kl) 15.57 17.13 15.57 18.22 15.57 19.46 15.57 22.52 26.25 34.43 46.00 46.00 46.00 46.00
Step 3 (>10.5 < 35kl) N/A 22.78 N/A 24.76 N/A 27.63 N/A 34.05 N/A 52.39 N/A 120.27 N/A 120.27
Step 3 (>10.5 < 20kl) 18.22 N/A 20.04 N/A 21.87 N/A 22.78 N/A 46.00 N/A 100.00 N/A 100.00 N/A
Step 4 (>20 < 35kl) 26.99 N/A 32.65 N/A 36.43 N/A 38.32 N/A 100.00 N/A 300.00 N/A 300.00 N/A
Step 4 (>35kl) N/A 39.39 N/A 45.69 N/A 60.66 N/A 84.69 N/A 300.00 N/A 1000.00 N/A 1000.00
Step 5 (>35 < 50kl) 33.33 N/A 45.00 N/A 61.66 N/A 99.99 N/A 300.00 N/A 800.00 N/A 800.00 N/A
Step 6 (>50kl) 43.97 N/A 97.71 N/A 209.29 N/A 265.12 N/A 800.00 N/A 800.00 N/A 800.00 N/A
DOMESTIC Cluster
Fixed basic Charge (Assume meter size = 40mm) N/A 400.00 N/A 400.00 N/A 400.00 N/A 400.00 N/A 400.00 N/A 400.00 N/A 400.00
Step 1 (0 < 6kl) 4.00 12.85 4.00 13.26 4.00 13.68 4.00 14.13 18.75 21.19 26.25 28.90 26.25 28.90
Step 2 (>6 kl) N/A N/A N/A N/A N/A N/A N/A N/A N/A N/A N/A N/A N/A N/A
Step 2 (>6 < 20kl) N/A N/A N/A N/A N/A N/A N/A N/A N/A N/A N/A N/A N/A N/A
Step 2 (>6 < 10.5kl) 15.57 17.13 15.57 18.22 15.57 19.46 15.57 22.52 26.25 34.43 46.00 46.00 46.00 46.00
Step 3 (>10.5 < 35kl) N/A 22.78 N/A 24.76 N/A 27.63 N/A 34.05 N/A 52.39 N/A 120.27 N/A 120.27
Step 3 (>10.5 < 20kl) 18.22 N/A 20.04 N/A 21.87 N/A 22.78 N/A 46.00 N/A 100.00 N/A 100.00 N/A
Step 3 (>20kl) N/A N/A N/A N/A N/A N/A N/A N/A N/A N/A N/A N/A N/A N/A
Step 4 (>20 < 35kl) 26.99 N/A 32.65 N/A 36.43 N/A 38.32 N/A 100.00 N/A 300.00 N/A 300.00 N/A
Step 4 (>35kl) N/A 39.39 N/A 45.69 N/A 60.66 N/A 84.69 N/A 300.00 N/A 1000.00 N/A 1000.00
Step 5 (>35 < 50kl) 33.33 N/A 45.00 N/A 61.66 N/A 99.99 N/A 300.00 N/A 800.00 N/A 800.00 N/A
Step 6 (>50kl) 43.97 N/A 97.71 N/A 209.29 N/A 265.12 N/A 800.00 N/A 800.00 N/A 800.00 N/A
COMMERCIAL (assumed meter size = 50mm) N/A 625.00 N/A 625.00 N/A 625.00 N/A 625.00 N/A 625.00 N/A 625.00 N/A 625.00
COMMERCIAL 19.63 22.78 21.59 23.74 23.55 25.06 24.54 28.82 37.50 37.50 50.00 45.75 75.00 60.63
INDUSTRIAL (assumed meter size = 100mm) N/A 2,500.00 N/A 2,500.00 N/A 2,500.00 N/A 2,500.00 N/A 2,500.00 N/A 2,500.00 N/A 2,500.00
INDUSTRIAL 19.63 22.78 21.59 23.74 23.55 25.06 24.54 28.82 37.50 37.50 50.00 45.75 75.00 60.63
Category

City of Cape Town - 2018/19 Budget (including additional recommendations read in at the Council meeting of 30 May 2018
Page 20
Table 11 Comparison between current sanitation charges and proposed tariffs - Non Indigent
Current Tariff
2017/18 (10%)
Proposed Tariff
2018/19 (10%)
Current Tariff
2017/18 (20%)
Proposed Tariff
2018/19 (20%)
Current Tariff
2017/18 (30%)
Proposed Tariff
2018/19 (30%)
Current Tariff
2017/18 (40%)
Proposed Tariff
2018/19 (40%)
Current Tariff
2017/18 (50%)
Proposed Tariff
2018/19 (50%)
Current Tariff
2017/18 (60%)
Proposed Tariff
2018/19 (60%)
Current Tariff
2017/18 (70%)
Proposed Tariff
2018/19 (70%)
Rand per Kl (excl
VAT)
Rand per Kl (excl
VAT)
Rand per Kl (excl
VAT)
Rand per Kl (excl
VAT)
Rand per Kl (excl
VAT)
Rand per Kl (excl
VAT)
Rand per Kl (excl
VAT)
Rand per Kl (excl
VAT)
Rand per Kl (excl
VAT)
Rand per Kl (excl
VAT)
Rand per Kl (excl
VAT)
Rand per Kl (excl
VAT)
Rand per Kl (excl
VAT)
Rand per Kl (excl
VAT)
DOMESTIC Full - Standard
Step 1 (0 < 4,2 kl) 3.85 11.29 3.85 11.65 3.85 12.02 3.85 12.42 16.25 16.93 22.50 24.72 22.50 24.72
Step 2 (>4.2 < 7.35 kl) 13.14 15.05 13.14 16.01 13.14 17.10 13.14 19.79 22.50 30.25 39.00 39.00 39.00 39.00
Step 3 (>7.35 < 24.5kl) N/A 20.47 N/A 22.49 N/A 25.59 N/A 31.93 N/A 45.15 N/A 108.07 N/A 108.07
Step 3 (>7.35 < 14 kl) 21.27 N/A 23.40 N/A 25.53 N/A 26.59 N/A 39.00 N/A 86.00 N/A 86.00 N/A
Step 4 (>14 < 24.5 kl) 23.25 N/A 28.14 N/A 34.88 N/A 43.02 N/A 86.00 N/A 105.00 N/A 105.00 N/A
Step 4 (>24.5 < 35kl) N/A 30.10 N/A 35.37 N/A 46.05 N/A 66.82 N/A 108.09 N/A 108.07 N/A 108.07
Step 5 (>24.5 < 35 kl) 24.42 N/A 32.97 N/A 45.18 N/A 52.02 N/A 105.00 N/A 105.00 N/A 105.00 N/A
DOMESTIC Cluster
Step 1 (0 < 4.2kl) 3.85 11.29 3.85 11.65 3.85 12.02 3.85 12.42 16.25 16.93 22.50 24.72 22.50 24.72
Step 1 (0 < 4.2kl) N/A N/A N/A N/A N/A N/A N/A N/A N/A N/A N/A N/A N/A N/A
Step 2 (> 4.2kl) N/A N/A N/A N/A N/A N/A N/A N/A N/A N/A N/A N/A N/A N/A
Step 2 (>4.2 < 7.35 kl) 13.14 15.05 13.14 16.01 13.14 17.10 13.14 19.79 22.50 30.25 39.00 39.00 39.00 39.00
Step 3 (>7.35 < 24.5kl) N/A 20.47 N/A 22.49 N/A 25.59 N/A 31.93 N/A 45.15 N/A 108.07 N/A 108.07
Step 3 (>7.35 < 14 kl) 21.27 N/A 23.40 N/A 25.56 N/A 26.59 N/A 39.00 N/A 86.00 N/A 86.00 N/A
Step 3 (> 4.2 < 35 kl) N/A N/A N/A N/A N/A N/A N/A N/A N/A N/A N/A N/A N/A n/a
Step 4 (>14 < 24.5 kl) 23.25 N/A 28.14 N/A 34.88 N/A 43.02 N/A 86.00 N/A 105.00 N/A 105.00 N/A
Step 4 (>24.5 < 35kl) N/A 30.10 N/A 35.37 N/A 46.05 N/A 66.82 N/A 108.09 N/A 108.07 N/A 108.07
Step 5 (>24.5 < 35 kl) 24.42 N/A 32.97 N/A 45.18 N/A 52.02 N/A 105.00 N/A 105.00 N/A 105.00 N/A
COMMERCIAL 15.09 20.47 16.59 21.33 18.10 22.51 18.86 24.25 28.75 30.29 38.75 38.75 57.50 57.12
INDUSTRIAL 15.09 20.47 16.59 21.33 18.10 22.51 18.86 24.25 28.75 30.29 38.75 38.75 57.50 57.12
Category
Single residential properties - 70% of water consumption to a maximum of 35 kl of sewerage per month (70% of 50 kl water = 35 kl of sewerage)

City of Cape Town - 2018/19 Budget (including additional recommendations read in at the Council meeting of 30 May 2018
Page 21
The following two tables show the impact of the proposed increases in water- and sanitation tariffs for a single dwelling house. Table 12 Comparison between current water charges and proposed increases (domestic consumption)
–non-indigent
Monthly Consumption
kl
Current amount Payable
2017/18 (10%)
R
Proposed amount Payable
2018/19 (10%)
R (excl VAT)
Difference
(Increase)
Percentage
change
Fixed basic Charge
(Assume meter size = 15mm)
N/A 56.00 - -
6 24.95 133.45 108.50 434.87%
10.5 95.40 211.35 115.95 121.54%
20 270.89 427.76 156.87 57.91%
35 678.78 777.42 98.64 14.53%
50 1,186.02 1,368.27 182.25 15.37%
80 2,505.12 2,549.97 44.85 1.79%
Monthly Consumption
kl
Current amount Payable
2017/18 (20%)
R
Proposed amount Payable
2018/19 (20%)
R (excl VAT)
Difference
(Increase)
Percentage
change
Fixed basic Charge
(Assume meter size = 15mm)
N/A 56.00 - -
6 24.95 135.97 111.02 444.97%
10.5 95.40 218.90 123.50 129.45%
20 289.49 454.12 164.63 56.87%
35 785.16 835.55 50.39 6.42%
50 1,496.27 1,520.90 24.63 1.65%
80 4,427.57 2,891.60 -1,535.97 -34.69%
Monthly Consumption
kl
Current amount Payable
2017/18 (30%)
R
Proposed amount Payable
2018/19 (30%)
R (excl VAT)
Difference
(Increase)
Percentage
change
Fixed basic Charge
(Assume meter size = 15mm)N/A 56.00 - -
6 24.95 138.56 113.61 455.35%
10.5 95.40 227.30 131.90 138.26%
20 307.68 489.79 182.11 59.19%
35 866.22 920.07 53.85 6.22%
50 1,892.24 1,829.97 -62.27 -3.29%
80 8,170.94 3,649.77 -4,521.17 -55.33%
Monthly Consumption
kl
Current amount Payable
2017/18 (40%)
R
Proposed amount Payable
2018/19 (40%)
R (excl VAT)
Difference
(Increase)
Percentage
change
Fixed basic Charge
(Assume meter size = 15mm)
N/A 56.00 - -
6 24.95 141.47 116.52 467.01%
10.5 95.40 244.47 149.07 156.26%
20 316.72 567.94 251.22 79.32%
35 921.09 1,102.97 181.88 19.75%
50 2,534.04 2,373.32 -160.72 -6.34%
80 10,487.64 4,914.02 -5,573.62 -53.14% Table continues on next page
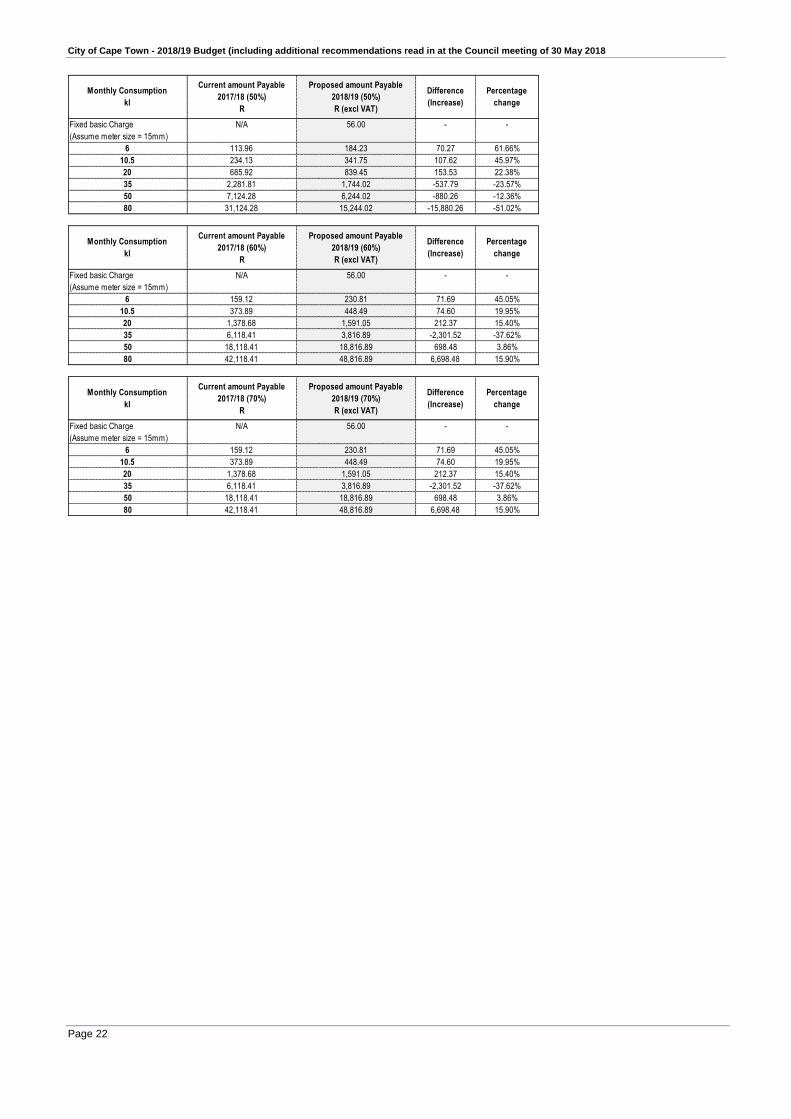
City of Cape Town - 2018/19 Budget (including additional recommendations read in at the Council meeting of 30 May 2018
Page 22
Monthly Consumption
kl
Current amount Payable
2017/18 (50%)
R
Proposed amount Payable
2018/19 (50%)
R (excl VAT)
Difference
(Increase)
Percentage
change
Fixed basic Charge
(Assume meter size = 15mm)
N/A 56.00 - -
6 113.96 184.23 70.27 61.66%
10.5 234.13 341.75 107.62 45.97%
20 685.92 839.45 153.53 22.38%
35 2,281.81 1,744.02 -537.79 -23.57%
50 7,124.28 6,244.02 -880.26 -12.36%
80 31,124.28 15,244.02 -15,880.26 -51.02%
Monthly Consumption
kl
Current amount Payable
2017/18 (60%)
R
Proposed amount Payable
2018/19 (60%)
R (excl VAT)
Difference
(Increase)
Percentage
change
Fixed basic Charge
(Assume meter size = 15mm)
N/A 56.00 - -
6 159.12 230.81 71.69 45.05%
10.5 373.89 448.49 74.60 19.95%
20 1,378.68 1,591.05 212.37 15.40%
35 6,118.41 3,816.89 -2,301.52 -37.62%
50 18,118.41 18,816.89 698.48 3.86%
80 42,118.41 48,816.89 6,698.48 15.90%
Monthly Consumption
kl
Current amount Payable
2017/18 (70%)
R
Proposed amount Payable
2018/19 (70%)
R (excl VAT)
Difference
(Increase)
Percentage
change
Fixed basic Charge
(Assume meter size = 15mm)
N/A 56.00 - -
6 159.12 230.81 71.69 45.05%
10.5 373.89 448.49 74.60 19.95%
20 1,378.68 1,591.05 212.37 15.40%
35 6,118.41 3,816.89 -2,301.52 -37.62%
50 18,118.41 18,816.89 698.48 3.86%
80 42,118.41 48,816.89 6,698.48 15.90%

City of Cape Town - 2018/19 Budget (including additional recommendations read in at the Council meeting of 30 May 2018
Page 23
Table 13 Comparison between current sanitation charges and proposed increases (domestic
consumption) – non-indigent Monthly
Consumption
kl
Current amount Payable
2017/18 (10%)
R
Proposed amount Payable
2018/19 (10%)
R (excl VAT)
Difference
(Increase)
Percentage
change
4.2 16.70 47.63 30.93 185.21%
7.35 58.91 95.59 36.68 62.26%
14 200.74 231.71 30.97 15.43%
24.5 445.26 449.88 4.62 1.04%
35 689.96 751.50 61.54 8.92%
Monthly
Consumption
kl
Current amount Payable
2017/18 (20%)
R
Proposed amount Payable
2018/19 (20%)
R (excl VAT)
Difference
(Increase)
Percentage
change
4.2 16.70 49.18 32.48 194.49%
7.35 58.91 100.26 41.35 70.19%
14 215.65 249.82 34.17 15.85%
24.5 512.74 490.29 -22.45 -4.38%
35 843.12 844.72 1.60 0.19%
Monthly
Consumption
kl
Current amount Payable
2017/18 (30%)
R
Proposed amount Payable
2018/19 (30%)
R (excl VAT)
Difference
(Increase)
Percentage
change
4.2 16.70 50.78 34.08 204.07%
7.35 58.91 105.50 46.59 79.09%
14 230.91 275.67 44.76 19.38%
24.5 600.61 551.23 -49.38 -8.22%
35 1,053.34 1,012.68 -40.66 -3.86%
Monthly
Consumption
kl
Current amount Payable
2017/18 (40%)
R
Proposed amount Payable
2018/19 (40%)
R (excl VAT)
Difference
(Increase)
Percentage
change
4.2 16.70 52.59 35.89 214.91%
7.35 58.91 116.15 57.24 97.17%
14 239.42 328.48 89.06 37.20%
24.5 694.15 675.46 -18.69 -2.69%
35 1,215.42 1,345.03 129.61 10.66%
Monthly
Consumption
kl
Current amount Payable
2017/18 (50%)
R
Proposed amount Payable
2018/19 (50%)
R (excl VAT)
Difference
(Increase)
Percentage
change
4.2 68.61 71.87 3.26 4.75%
7.35 141.15 168.66 27.51 19.49%
14 409.51 468.91 59.40 14.51%
24.5 1,318.89 964.11 -354.78 -26.90%
35 2,371.04 2,047.23 -323.81 -13.66%
Monthly
Consumption
kl
Current amount Payable
2017/18 (60%)
R
Proposed amount Payable
2018/19 (60%)
R (excl VAT)
Difference
(Increase)
Percentage
change
4.2 95.45 104.65 9.20 9.64%
7.35 223.03 234.45 11.42 5.12%
14 798.58 953.12 154.54 19.35%
24.5 1,901.08 2,087.85 186.77 9.82%
35 2,953.23 3,170.77 217.54 7.37%
Monthly
Consumption
kl
Current amount Payable
2017/18 (70%)
R
Proposed amount Payable
2018/19 (70%)
R (excl VAT)
Difference
(Increase)
Percentage
change
4.2 95.45 104.65 9.20 9.64%
7.35 223.03 234.45 11.42 5.12%
14 798.58 953.12 154.54 19.35%
24.5 1,901.08 2,087.85 186.77 9.82%
35 2,953.23 3,170.77 217.54 7.37%

City of Cape Town - 2018/19 Budget (including additional recommendations read in at the Council meeting of 30 May 2018
Page 24
1.3.3 Solid Waste Management and impact of Tariff Increases (refer Annexure 4)
The Solid Waste Tariffs are levied to recover costs of services provided directly to customers and
include refuse collection fees, disposal fees, compost sales, weighbridge fees and other ad hoc
services. An average increase has been applied on the Consumptive Tariffs for Collections of 5.7%
and Disposal of 14.83%. An average increase has been applied on the Miscellaneous Tariffs for
Cleaning of 5.5%.
The proposed tariffs are shown in the Tariffs, Fees and Charges Book attached as Annexure 6.
Table 14 Comparison between current waste removal fees and increases
Basic container service: Residential collection based on
a once-per week 240L service per household/service
point in suburbs containerised.
Per month Account to property owner. Basic container service (weekly
service is 1x 240L Black lid container per week).
119.47 y 126.26
Property owner with property valued from R1 up to and
including R100 000 (100% rebate)
Rebate per month on First
Container only
Account to property owner. Basic container service (weekly
service is 1x 240L Black lid container per week).
-119.47 y -126.26
Property value between R100 001 up to and including
R150 000 (75% rebate)
Rebate per month on First
Container only
Account to property owner. Basic container service (Weekly
service is 1x 240L Black lid container per week).
-89.56 y -94.70
Property value between R150 001 up to and including
R350 000 (50% rebate)
Rebate per month on First
Container only
Account to property owner. Basic container service (weekly
service is 1x 240L Black lid container per week).
-59.74 y -63.13
Property value between R350 001 up to and including
R500 000 (25% rebate)
Rebate per month on First
Container only
Account to property owner. Basic container service (weekly
service is 1x 240L Black lid container per week).
-29.91 y -31.65
Additional once-per-week 240L service (Black lid 240L) Per additional 240 L container per
month
Enhanced service level. (Additional service of 240L Black lid
container(s) serviced on the same day as the normal weekly
service. Per fixed agreement - not variable).
119.47 y 126.26
Providing a lockable 240L container service Per month Account to property owner. Basic container service (weekly
service is 1x 240L Black lid container per week). Subject to
availability.
119.47 y 126.26
Subsidised service to Organisations Accredited by the
Executive Director: Area-Based Service Delivery as per
the Tariff Policy (50% rebate)
Rebate per 240L container per
month (limited to a Maximum of 15
containers per shelter)
Account rendered to the organisations accredited by the
Executive Director: Area-Based Service Delivery. Enhanced
service level (240L black lid containers) serviced once a
week.
59.74 y -63.16
Indigent relief on a 240L container (100% rebate) Rebate per month on First
Container only
In terms of Section 27 of the Credit Control & Debt Collection
Policy. Basic container service (weekly service is 1x 240L
Black lid container per week).
-119.47 y -126.26
Additional Recycling Container service: Residential dry
recyclable collection based on a once-per week service
per participating household.
Per month Account to property owner participating in the dry recyclable
project. Container service.
Free Free
VAT
Yes/No
2018/19
R
excl. VAT
Subsidised : Black lid 240L container service (R/blacklid)
Black lid 240L container service (R/blacklid)
UNITSERVICES RENDERED
REMARKS
To be read in conjunction with Definitions (refer
annexures)
2017/18
R
excl. VAT

City of Cape Town - 2018/19 Budget (including additional recommendations read in at the Council meeting of 30 May 2018
Page 25
1.3.4 Sale of Electricity and Impact of Tariff Increases (refer Annexure 4)
The proposed revisions to the tariffs have been formulated in accordance with the City of Cape Town
Tariff and Rates Policy and comply with Section 74 of the Municipal Systems Act as well as the
recommendations of the National Energy Regulator of South Africa (NERSA).
In terms of section 75A of the Local Government Municipal Systems Act, any fees, charges or tariffs
which a municipality may wish to levy and recover in respect of any function or service of the
municipality, must be approved by a resolution passed by the municipal council with a supporting vote
of a majority of its members.
The Electricity Regulation Act requires that proposed revisions to the electricity consumption based
tariffs be submitted to the Regulator for approval prior to implementation. Provisional approval will
therefore be requested with the express proviso that any alterations required by Council will be
submitted to the Regulator as soon as possible.
The Consumptive Tariff Schedule includes a note indicating that the tariffs are applied in accordance
with the terms and conditions as contained in the Electricity Tariff Policy.
On 15 December 2017, NERSA issued a statement allowing Eskom an average 5.23% increase, which
equates to a 7.32% increase to Municipalities. On 28 February 2018 NERSA issued a Consultation
Paper on Guideline Increases for regulated tariffs, which set this increase at 6.84%. It should be noted
that this excludes items such as the Contribution to Rates, which for 2018/19 contributes a significant
portion of the overall increase for Electricity Generation and Distribution tariffs.
The above items result in the Electricity Generation and Distribution department requiring a revenue
increase from Sale of Electricity of 5.4% in order to meet the budgeted operating expenditure and,
when coupled to the expected negative sales growth of -2.75% (which includes a correction to account
for the lower than expected 2017/18 sales), results in a tariff increase requirement of an average of
8.14%.
These increases are in line with the guidelines established in the MTREF.
Present electricity tariffs were approved by Council on 30 May 2017 and by NERSA (with amendments –
not implemented) on 2 June 2017, and were implemented with effect from 1 July 2017.
The proposed tariffs are shown in the Tariffs, Fees and Charges Book attached as Annexure 6.
Table 15 Comparison between current electricity charges and increases (domestic consumption)
Category Unit StepsVAT
yes/no
2017/18
c/kWh
excl VAT
2018/19
c/kWh
excl VAT
0-350kWh y 102.00 110.30
350.1+ kWh y 205.65 222.39
0-600kWh y 169.12 182.89
600.1+ kWh y 205.65 222.39
Home User Service Charge Per Month y 219.00 130.44
0-600kWh y 132.63 161.15
600.1+ kWh y 205.65 222.39
Energy Charge
(c/kWh)
Lifeline
INCLUDING the FBE portion
Energy Charge
(c/kWh)
DomesticEnergy Charge
(c/kWh)

City of Cape Town - 2018/19 Budget (including additional recommendations read in at the Council meeting of 30 May 2018
Page 26
1.3.5 Overall impact of tariff increases on households
The following table shows the overall expected impact of tariff increases on households with a ‘middle
income range’, an ‘affordable range’ and an ‘indigent household receiving free basic services’.
Table 16 MBRR Table SA14 - Household bills
2014/15 2015/16 2016/172018/19 Medium Term Revenue & Expenditure
Framework
Budget
Year
2018/19
Rand/cent % incr.
Rates and services charges:
Property rates 260.80 286.63 266.54 279.88 279.88 279.88 6.5% 298.08 315.96 334.92
Electricity: Basic levy – – – – – – – 222.39 240.18 259.40
Electricity: Consumption 1,464.04 1,676.32 1,787.26 1,837.32 1,837.32 1,837.32 8.1% 1,986.90 2,145.85 2,317.52
Water: Basic levy – – – – – – – – –
Water: Consumption 335.55 372.43 608.33 652.75 4,278.50 4,278.50 1,633.5% 11,315.59 12,107.68 12,955.22
Sanitation 235.41 261.30 415.60 471.50 1,524.25 1,524.25 238.9% 1,598.01 1,805.75 2,040.50
Refuse removal 95.96 103.95 112.19 119.47 119.47 119.47 5.7% 126.32 133.90 141.93
Other – – – – – – – – – –
sub-total 2,391.76 2,700.63 3,189.92 3,360.92 8,039.42 8,039.42 362.6% 15,547.29 16,749.33 18,049.49
VAT on Services 298.33 337.96 409.27 431.35 1,086.34 1,086.34 – 2,287.38 2,465.00 2,657.19
Total large household bill: 2,690.09 3,038.59 3,599.19 3,792.27 9,125.76 9,125.76 370.3% 17,834.67 19,214.33 20,706.67
% increase/-decrease 13.0% 18.4% 5.4% 140.6% 95.4% 7.7% 7.8%
Rates and services charges:
Property rates 156.35 171.98 159.93 167.93 167.93 167.93 6.5% 178.85 189.58 200.96
Electricity: Basic levy – – – – – – – 182.89 197.52 213.32
Electricity: Consumption 673.80 771.50 822.55 845.60 845.60 845.60 8.1% 914.45 987.61 1,066.61
Water: Basic levy – – – – – – – – –
Water: Consumption 242.66 269.33 426.61 470.60 2,778.50 2,778.50 1,242.0% 6,315.59 6,757.68 7,230.72
Sanitation 179.38 199.11 261.08 349.42 1,156.75 1,156.75 249.1% 1,219.76 1,378.33 1,557.51
Refuse removal 95.96 103.95 112.19 119.47 119.47 119.47 5.7% 126.32 133.90 141.93
Other – – – – – – – – – –
sub-total 1,348.15 1,515.87 1,782.36 1,953.02 5,068.25 5,068.25 357.6% 8,937.86 9,644.62 10,411.06
VAT on Services 166.85 188.14 227.14 249.91 686.04 686.04 – 1,313.85 1,418.26 1,531.52
Total small household bill: 1,515.00 1,704.01 2,009.50 2,202.93 5,754.29 5,754.29 365.4% 10,251.71 11,062.87 11,942.57
% increase/-decrease 12.5% 17.9% 9.6% 161.2% 78.2% 7.9% 8.0%
Rates and services charges:
Property rates 52.12 57.33 53.31 55.98 55.98 55.98 6.5% 59.62 63.20 66.99
Electricity: Basic levy – – – – – – – 110.30 119.12 128.65
Electricity: Consumption 252.96 273.18 291.27 306.00 306.00 306.00 26.2% 386.05 416.93 450.29
Water: Basic levy – – – – – – – – –
Water: Consumption 149.76 166.23 246.96 264.45 1,014.50 1,014.50 336.6% 1,154.59 1,235.41 1,321.89
Sanitation 123.34 136.92 198.88 211.17 613.29 613.29 240.3% 718.66 812.09 917.66
Refuse removal 47.98 51.97 56.14 59.74 59.74 59.74 5.7% 63.16 66.95 70.97
sub-total 626.16 685.63 846.56 897.34 2,049.51 2,049.51 177.8% 2,492.38 2,713.70 2,956.45
VAT on Services 80.37 87.96 111.06 117.79 279.09 279.09 – 364.91 397.58 433.42
Total small household bill: 706.53 773.59 957.62 1,015.13 2,328.60 2,328.60 181.5% 2,857.29 3,111.28 3,389.86
% increase/-decrease 9.5% 23.8% 6.0% 129.4% 22.7% 8.9% 9.0%
Monthly Account for Household - 'Indigent' Household receiving free basic services
Description
Current Year 2017/18
Monthly Account for Household - 'Middle Income Range'
Monthly Account for Household - 'Affordable Range'
Audited
Outcome
Audited
Outcome
Audited
Outcome
Original
Budget
Adjusted
Budget
Full Year
Forecast
Budget
Year
2018/19
Budget
Year +1
2019/20
Budget
Year +2
2020/21

City of Cape Town - 2018/19 Budget (including additional recommendations read in at the Council meeting of 30 May 2018
Page 27
1.4 Operating Expenditure Framework
The City’s expenditure for the 2018/19 budget and MTREF is informed by the following:
• Modelling of feasible and sustainable budgets over the medium term,
• Cognisance of international, national and local economic- and fiscal conditions,
• Expenditure limits set by realistic and realisable revenue levels,
• The City’s asset renewal strategy and its medium- to long term asset repairs and maintenance
goals,
• Relevant (budget and other) legislative imperatives, and
• Operational gains and efficiencies directed to fund areas of strategic priority and known
commitments.
A differentiated budgeting approach for the 2017/18 MTREF was adopted and continued with in the
2018/19 MTREF. The principles of cost containment, elimination of wasteful expenditure, and
reprioritisation of spending were the technical themes of the budget.
The following table is a high level summary of the 2018/19 MTREF operating expenditure (classified by main type): Table 17 Summary of operating expenditure by main type
Description 2014/15 2015/16 2016/17
R thousandAudited
Outcome
Audited
Outcome
Audited
Outcome
Original
Budget
Adjusted
Budget
Full Year
Forecast
Budget
Year
2018/19
Budget Year
+1 2019/20
Budget Year
+2 2020/21
Expenditure By Type
Employee related costs 8,124,733 9,357,740 9,659,300 12,050,690 11,505,286 11,505,286 12,920,115 13,804,026 14,883,272
Remuneration of councillors 128,412 134,637 138,374 155,787 155,565 155,565 169,640 180,666 192,500
Debt impairment 1,523,784 1,898,476 2,323,482 2,508,738 2,491,185 2,491,185 2,988,951 3,346,843 3,644,602
Depreciation & asset impairment 1,917,134 2,117,336 2,313,471 2,574,607 2,520,137 2,520,137 2,814,336 3,092,708 3,279,697
Finance charges 774,895 747,256 731,823 1,131,010 993,544 993,544 1,089,285 1,564,844 1,885,513
Bulk purchases 7,108,843 8,073,336 8,438,102 8,540,135 8,742,293 8,742,293 9,487,132 10,896,898 11,739,035
Other materials 323,901 300,405 476,050 1,190,177 1,182,760 1,182,760 1,255,285 1,399,291 1,465,941
Contracted services 3,536,355 3,766,255 4,171,123 6,086,610 6,146,828 6,146,828 6,004,687 6,363,514 6,790,937
Transfers and subsidies 136,487 148,246 111,829 140,985 414,450 414,450 333,807 356,864 365,224
Other expenditure 3,777,783 4,139,457 4,486,789 2,978,990 2,260,231 2,260,231 2,200,213 2,422,275 2,561,922
Loss on disposal of PPE 3,096 8,118 7,376 387 462 462 488 515 543
Total Expenditure 27,355,422 30,691,262 32,857,719 37,358,116 36,412,742 36,412,742 39,263,938 43,428,443 46,809,187
Current Year 2017/182018/19 Medium Term Revenue &
Expenditure Framework
Employee relates costs are R12 920 million in 2018/19, which equates to 32.9% of the total
operating expenditure. The projected 2018/19 cost of living increase is 7.1% as there was no salary
and wage collective agreement in place for the 2018/19 MTREF period. The process is currently
under consultation; no finality on the matter has been reached to date.
The cost associated with the remuneration of councillors is determined by the Minister of Co-
operative Governance and Traditional Affairs in accordance with the Remuneration of Public Office
Bearers Act, 1998 (Act 20 of 1998). The most recent proclamation in this regard was taken into
account when compiling the City’s 2018/19 budget.

City of Cape Town - 2018/19 Budget (including additional recommendations read in at the Council meeting of 30 May 2018
Page 28
The provision for debt impairment is based on collection rates achieved to date and projected over
the MTREF period, as well as the City’s arrears and debt recovery policies. For 2018/19, this
equates to R2 989 million escalating to R3 645 million by 2020/21. While this expenditure is
considered to be a non-cash flow item, it informs the total cost associated with rendering services
of the municipality as well as the municipality’s realistically anticipated revenues.
Budgeted appropriations for Depreciation & Asset Impairment totals R2 814 million for 2018/19 and
is linked to the capitalisation rate of assets. The calculation of depreciation on new capital
expenditure is based on variables such as asset class and lifespan depending on the nature of the
asset. An annual capital expenditure implementation rate of 100% is assumed. Depreciation of
existing assets is calculated based on simulated SAP (financial system) data that reflect actual
values per annum. Assets Under Construction (AUC) are calculated based on asset class lifespan
and the projected capitalisation dates.
Finance Charges consist primarily of the repayment of interest on long-term borrowing (cost of
capital). It equates to 3% (R1 089 million) of the 2018/19 operating expenditure (excluding
redemption costs) and increases to R1 885 million by 2020/21. The increase over the 2018/19
MTREF is informed by existing and new loans that will be taken up to fund the City’s capital
programme, which includes additional capital requirements for the New Water Plan and the
projected interest rates over this period. The financial impact of this growth was considered in the
2018/19 MTREF.
Budgetary provision for Bulk Purchases is informed by the purchase of electricity and water from
suppliers i.e. Eskom and the National Department of Water & Sanitation and consumer behaviour.
In this regard, annual price increases have been factored into the budget appropriations, which in
turn impacts on the tariff requirements for these tariff-based services.
Other Materials provision caters for sundry items such as the purchase of fuel, diesel, materials for
maintenance, cleaning materials and chemicals. Growth is projected for this expenditure
component over the MTREF period; R1 255 million in 2018/19 estimating to increase to R1 466
million by 2020/21.
Contracted Services expenditure component includes provisions for repairs & maintenance and
additional allocations for service delivery enhancements. Expenditure levels are projected at
R6 005 million in 2018/19 escalating to R6 791 million in 2020/21.

City of Cape Town - 2018/19 Budget (including additional recommendations read in at the Council meeting of 30 May 2018
Page 29
Figure 1 below gives a breakdown of the main expenditure categories for 2018/19.
Figure 1 Main operational expenditure categories for the 2018/19 financial year
1.4.1 Priority given to Repairs & Maintenance
The City has acknowledged its obligation to optimally preserve its extended asset base and recognises
current inherent backlogs in this regard. In line with the approach of recent financial years, 2018/19
appropriations again provide for increases (with the exception of support services) to this cost
component largely based on average CPI. This included adopting a differentiated budgeting approach
for the 2018/19 MTREF:
10% reduction to 2017/18 base with no increase for the 2018/19 financial year – to support services;
A CPI increase to services whose main function is not providing repairs & maintenance although
the nature of their business and facilities demands proper maintenance provision; and
CPI + 1% applied to services to secure the health of their assets.
In terms of the MBRR, operational repairs and maintenance is not considered a direct expenditure
driver, but an outcome of other expenditures, such as remuneration, purchases of materials and
contracted services. Considering these cost drivers, the following table is a consolidation of all the
expenditures associated with repairs and maintenance.

City of Cape Town - 2018/19 Budget (including additional recommendations read in at the Council meeting of 30 May 2018
Page 30
Table 18 Operational repairs and maintenance
2014/15 2015/16 2016/17
R thousand
Repairs & Maintenance by Expenditure Item
Employee related costs 1,187,006 1,262,852 1,271,125 1,430,455 1,341,534 1,341,534 1,300,132 1,384,643 1,475,335
Other materials 46,996 45,260 276,260 276,952 284,552 284,015 325,242 346,219 368,896
Contracted Services 1,450,264 1,660,202 2,010,873 2,070,347 1,942,034 1,951,800 2,173,011 2,362,911 2,575,141
Other Expenditure 318,892 370,681 203,039 256,538 185,594 189,824 176,078 187,473 199,729
Total Repairs and Maintenance Expenditure 3,003,158 3,338,995 3,761,297 4,034,293 3,753,714 3,767,172 3,974,465 4,281,247 4,619,102
DescriptionCurrent Year 2017/18
2018/19 Medium Term Revenue &
Expenditure Framework
Original
Budget
Audited
Outcome
Audited
Outcome
Audited
Outcome
Adjusted
Budget
Full Year
Forecast
Budget
Year
2018/19
Budget
Year +1
2019/20
Budget
Year +2
2020/21
The total Repairs & Maintenance allocation for 2018/19 is R3 974 million. The increased allocations
are influenced by above-CPI increases as well as the full cost absorption method applied to calculate
labour unit price, and the increases in activity prices based on the total cost of employment (TCOE) of
direct labour workers influenced by the TASK outcome/job grading system, where jobs and positions
are graded based on the content of approved job descriptions.
This growth trend continues over the MTREF increasing to R4 619 million in 2020/21. The 2018/19
Repairs & Maintenance provision represents 10% of the total operating expenditure.
1.4.2 Free Basic Services: Basic Social Services Package
The City provides free basic services (electricity, refuse removal, water, sanitation and rates) to
residential properties via three methods, namely:
a) Based on the municipal value of the property; or
b) On application by those with limited income whose property values exceed set valuation levels; or
c) Based on consumer behaviour i.e. usage.
a) Municipal value of the property
The utilisation of the valuation method prevents the need to deal with the expected 250 000 to 280
000 applications that would qualify if all had to apply on a periodic basis. The challenge with this
valuation method is that it applies to households irrespective of their ability to pay. However, the
cost of providing the service using this method outweighs the benefit of not providing the free
services. The benefit of the valuation based approach is that it provides certainty and reduces the
risks of fraud.
A varying set of rebates are available to properties up to R750 000. This includes a R50 per month
rebate for property rates for properties valued from R400 001 to R750 000, provided no other
rebates are applicable.

City of Cape Town - 2018/19 Budget (including additional recommendations read in at the Council meeting of 30 May 2018
Page 31
Varying percentage rebates for refuse removal based on property values for properties between
R1 and R500 000 are applied as follows:
Property Value Rebate %
R400 001 – R500 000 25%
R350 001 – R400 000 25%
R300 001 – R350 000 50%
R200 001 – R300 000 50%
R150 001 – R200 000 50%
R100 001 – R150 000 75%
R100 000 and below 100%
b) Income based
The second method allows any resident who is required to pay for municipal services and whose
gross monthly household income is R4 000 or below to register as indigent to receive the same
benefits as if their property values were below R100 000. The current number of indigent registered
was 3 219 at the end of April 2018. This number varies monthly as registration is valid for 12 months
where after re-application is required.
In addition, Property Rates rebates are granted to residents based on their gross monthly
household income as reflected below:
Income bracket Rebate %
R4 001 – R5 000 75%
R5 001 – R5 500 50%
R5 501 – R6 000 25%
The current number of beneficiaries in the above categories was 18 as at end April 2018.
Senior citizens’ and disabled persons’ rates rebates are granted to qualifying applicants where the
gross monthly household income is below R15 000. For household income up to R4 000 the rates
rebate is 100%, reducing gradually to 10% for income between R14 001 and R15 000.
c) Electricity – Based on consumer behaviour
Electricity lifeline tariff customers receiving less than 250kWh per month will receive a free basic
supply of 60kWh, while those receiving between 250kWh and 450kWh per month will receive a
free basic supply of 25kWh per month.
Assistance to the households mentioned above are regulated by Council’s budget-related policies,
which are reviewed annually based on modelling the impact of the tariffs and policies on all
residential properties. All free basic services are provided for in the City’s balanced operating
budget.
The costs for the indigent support on charges for refuse removal, water and sanitation and the 60kWh
of free electricity are partially financed by National Government through the local government Equitable
Share received in terms of the annual Division of Revenue Act. The City, however, supplements this
expenditure from rates income whilst the costs of the free 6 kilolitres of water (and concomitant
sanitation) and the R200 000 valuation rebate on rates for those residents within the valuation brackets
deemed to be indigent are paid for by those remaining residents.

City of Cape Town - 2018/19 Budget (including additional recommendations read in at the Council meeting of 30 May 2018
Page 32
Further detail relating to the number of households receiving free basic services, the cost of free basic
services, highest level of free basic services as well as the revenue cost associated with the free basic
services is contained in Table 30 MBRR Table A10 - Basic Service Delivery Measurement on page 55.
1.5 Capital Expenditure
Table 19 2018/19 MTREF capital budget per vote
Vote Description
R thousand Adjusted Budget %Budget Year
2018/19%
Budget Year +1
2019/20%
Budget Year +2
2020/21%
Vote 1 - Area-Based Service Delivery 19,648 0.3% 13,110 0.2% 82,870 0.8% 74,870 0.7%
Vote 2 - Assets & Facilities Management 430,422 5.6% 413,287 4.9% 301,701 3.1% 91,372 0.9%
Vote 3 - City Manager 2,523 0.0% 735 0.0% 735 0.0% 760 0.0%
Vote 4 - Corporate Services 379,349 4.9% 354,597 4.2% 342,571 3.5% 336,546 3.3%
Vote 5 - Energy 1,177,050 15.3% 1,113,506 13.2% 1,427,000 14.5% 1,741,137 17.2%
Vote 6 - Finance 14,610 0.2% 20,549 0.2% 65,419 0.7% 35,411 0.4%
Vote 7 - Informal Settlements, Water & Waste Services 3,654,940 47.6% 4,206,581 50.0% 5,681,026 57.9% 5,968,036 59.0%
Vote 8 - Safety & Security 160,128 2.1% 196,078 2.3% 79,515 0.8% 42,115 0.4%
Vote 9 - Social Services 279,906 3.6% 315,508 3.8% 238,127 2.4% 215,704 2.1%
Vote 10 - Transport & Urban Development Authority 1,562,428 20.3% 1,773,606 21.1% 1,596,358 16.3% 1,600,833 15.8%
Total Capital Expenditure - Vote 7,681,003 100% 8,407,556 100% 9,815,321 100% 10,106,785 100%
2018/19 Medium Term Revenue & Expenditure FrameworkCurrent Year 2017/18
The capital budget increases from R7 681 million in 2017/18 (April 2018 adjustments budget) to
R8 407 million in 2018/19. This is an overall increase of 9.5% when measured against the latest
2017/18 budgetary provision.
The above table clearly indicates that expenditure emphasis is still on those votes responsible for
infrastructure development e.g. Informal Settlements, Water & Waste Services, Transport & Urban
Development Authority and Energy. The 2018/19 allocation to these votes represents just over R7 094
million or 84.4% of the total budgetary allocation for the year. Informal Settlements, Water & Waste
Services receives the largest allocation of R4 207 million in 2018/19, which represents 50.0% of the
budget. This is largely due to acceleration of the implementation of new water resources in light of the
current drought conditions. The proposed budget includes allocation of R950 million for aquifers
(ground water), R11 million for desalination plants and R560 million for water re-use projects in
2018/19. The City will continue to invest in these New Water Plan initiatives with a total allocation of
R2 056 million and R2 150 million respectively, in the 2019/20 and 2020/21 financial years.
The second highest allocation amounting to R1 774 million or 21.1% is made to Transport & Urban
Development Authority, which is followed by Energy at R1 114 million (13.2%), Assets & Facilities
Management at R413 million (4.9%) and Corporate Services at R355 million (4.2%).
In the outer years the majority of the allocations are also made to infrastructure development; R8 704
million (88.7%) in 2019/20 and R9 310 million (92.1%) in 2020/21.
NT, in its MFMA circulars, indicated that a minimum of 40% of a municipality’s capital budget should
be for renewal of existing assets as opposed to new infrastructure. In the City’s proposed capital budget
the renewal of existing assets equates to R1 884 million (22.4%), upgrading of existing assets
represents R1 805 million (21.5%) and new assets represents R4 719 million (56.1%) of the total
2018/19 capital budget. It is important to note that existing assets can be renewed or upgraded, while
new assets will result in an increase in the asset base of the City.

City of Cape Town - 2018/19 Budget (including additional recommendations read in at the Council meeting of 30 May 2018
Page 33
Additional details regarding asset classes and proposed capital expenditure is contained in Table 29
MBRR Table A9 - Asset Management on page 51, while MBRR Tables A9, Table SA34a, Table SA34b
and Table SA 34e provides a detailed breakdown of the capital budget with regards to new asset
construction and capital asset renewal and upgrading (refer pages 177 and 178).
A detailed breakdown of the capital budget per project/programme over the medium term is available
in Annexure 29.
Major projects/programmes to be implemented over the medium term are:
Athlone Waste Water Treatment Works - Capacity Extension - Phase 1 → R177 million
Backyards/Informal Settlements Upgrade: Enkanini - Khayelitsha → R118 million
Backyards/Informal Settlements Upgrade: Monwabisi Park - Khayelitsha → R76 million
Backyards/Informal Settlements Upgrade: Monwood - Philippi → R59 million
Beacon Valley Housing Project - Mitchells Plain → R85 million
Bellville Integrated Recreation Facility → R14 million
Bishop Lavis Integrated Recreation Facility → R14 million
Books, Periodicals & Subscription → R29 million
Bulk Reticulation Sewers in Milnerton Rehabilitation → R220 million
Cape Flats Rehabilitation → R250 million
Coastal Structures: Rehabilitation → R67 million
Conradie Housing Development (PGWC) → R129 million
Development of Additional Water & Sanitation Infrastructure → R148 million
Development of landfill infrastructure → R424 million
Development of the Regional Landfill Site → R92 million
Development of Transfer Stations → R526 million
Diabetic Campaign programme → R30 million
Durbanville Non-Motorised Transport Project → R54 million
EAM Depot Realignment - 5 Nodal System → R132 million
Early Childhood Development Centres: Informal Settlements → R36 million
Eastridge Main Substation Upgrade → R60 million
Electricity Substations: Fencing → R64 million
E-Tendering System → R77 million
Extension of Smart City Strategy → R12 million
Facilities Management Infrastructure → R79 million
Hanover Park Integrated Recreational Facility → R10 million
Harare Infill Housing Project → R43 million
Imizamo Yethu Housing Project (Phase 3) → R110 million
Imizamo Yethu Informal Settlement Emergency Project → R61 million
Infrastructure Replace/Refurbish - Waste Water Treatment Wprks → R165 million
Integrated Recreation & Parks Facilities → R28 million
Land acquisition for municipal purposes → R53 million
Langa Hostels CRU Project: New Flats → R55 million
Langa Hostels CRU Project: Siyahlala → R58 million
Langa Hostels CRU Project: Special Quarters → R121 million
Library Upgrades and Extensions → R34 million
Macassar BNG Housing Project → R70 million
Macassar Waste Water Treatment Works Extension → R121 million
Mfuleni Integrated Recreation Facility → R11 million
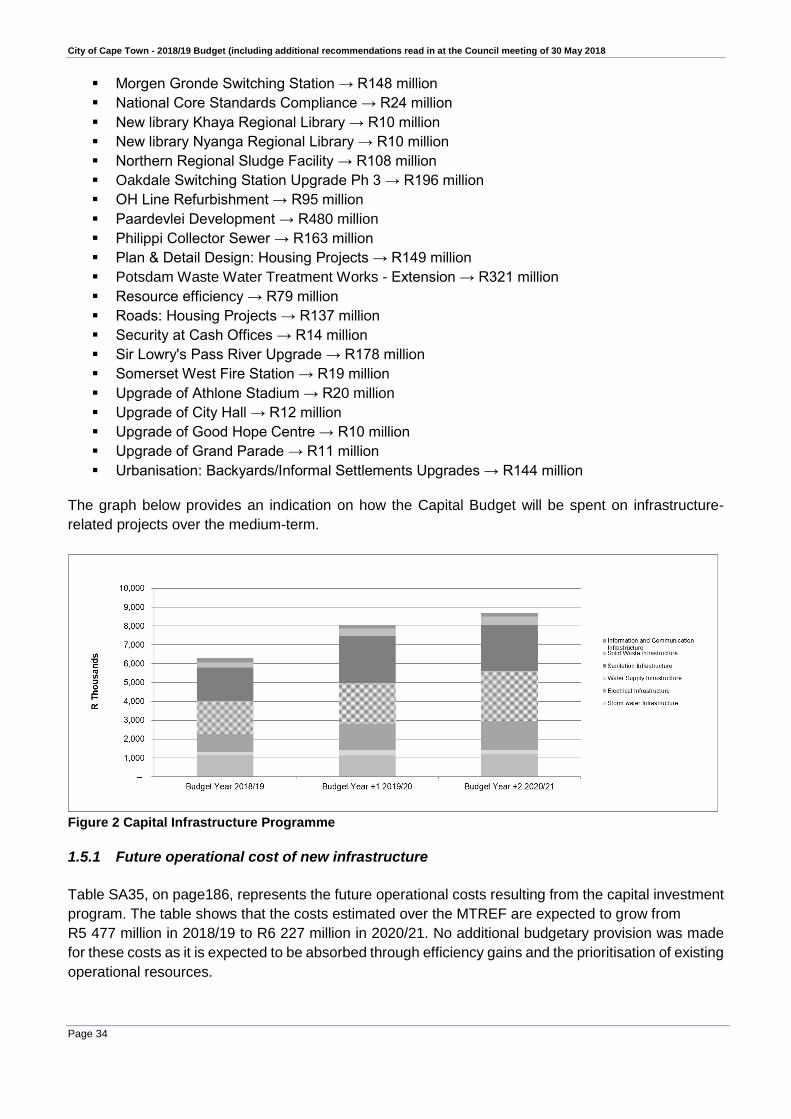
City of Cape Town - 2018/19 Budget (including additional recommendations read in at the Council meeting of 30 May 2018
Page 34
Morgen Gronde Switching Station → R148 million
National Core Standards Compliance → R24 million
New library Khaya Regional Library → R10 million
New library Nyanga Regional Library → R10 million
Northern Regional Sludge Facility → R108 million
Oakdale Switching Station Upgrade Ph 3 → R196 million
OH Line Refurbishment → R95 million
Paardevlei Development → R480 million
Philippi Collector Sewer → R163 million
Plan & Detail Design: Housing Projects → R149 million
Potsdam Waste Water Treatment Works - Extension → R321 million
Resource efficiency → R79 million
Roads: Housing Projects → R137 million
Security at Cash Offices → R14 million
Sir Lowry's Pass River Upgrade → R178 million
Somerset West Fire Station → R19 million
Upgrade of Athlone Stadium → R20 million
Upgrade of City Hall → R12 million
Upgrade of Good Hope Centre → R10 million
Upgrade of Grand Parade → R11 million
Urbanisation: Backyards/Informal Settlements Upgrades → R144 million
The graph below provides an indication on how the Capital Budget will be spent on infrastructure-
related projects over the medium-term.
Figure 2 Capital Infrastructure Programme
1.5.1 Future operational cost of new infrastructure
Table SA35, on page186, represents the future operational costs resulting from the capital investment
program. The table shows that the costs estimated over the MTREF are expected to grow from
R5 477 million in 2018/19 to R6 227 million in 2020/21. No additional budgetary provision was made
for these costs as it is expected to be absorbed through efficiency gains and the prioritisation of existing
operational resources.
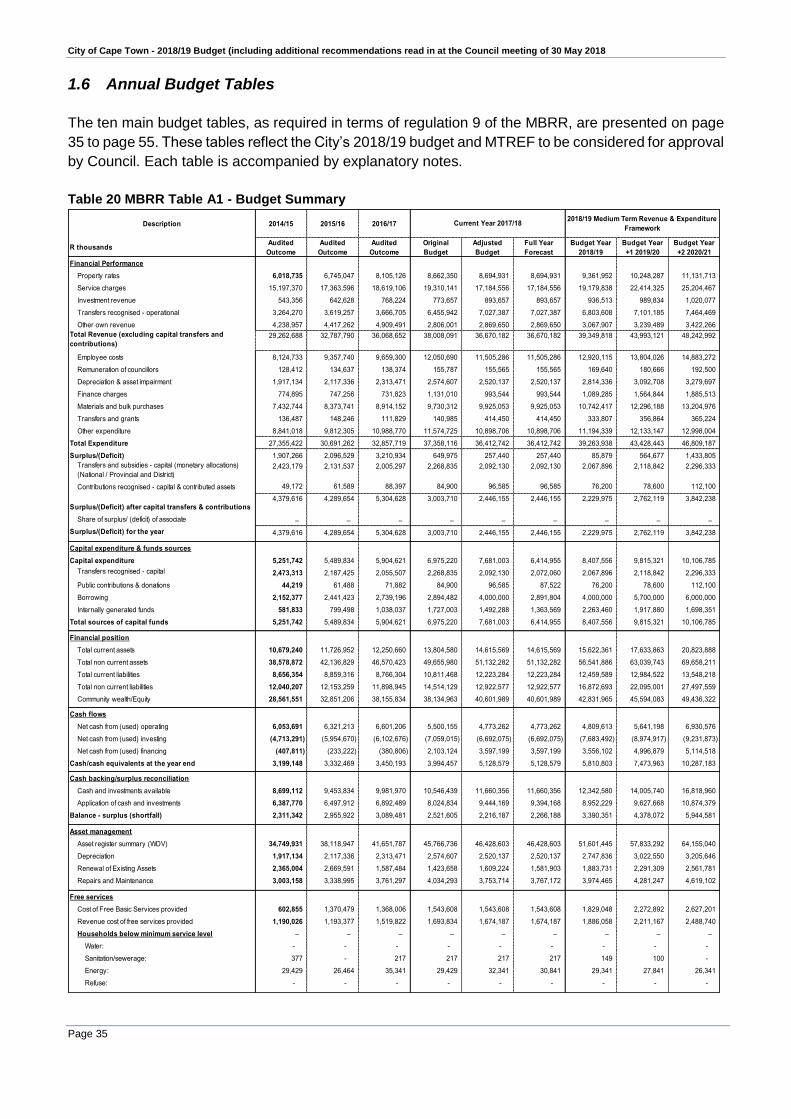
City of Cape Town - 2018/19 Budget (including additional recommendations read in at the Council meeting of 30 May 2018
Page 35
1.6 Annual Budget Tables
The ten main budget tables, as required in terms of regulation 9 of the MBRR, are presented on page
35 to page 55. These tables reflect the City’s 2018/19 budget and MTREF to be considered for approval
by Council. Each table is accompanied by explanatory notes.
Table 20 MBRR Table A1 - Budget Summary
Description 2014/15 2015/16 2016/17
R thousandsAudited
Outcome
Audited
Outcome
Audited
Outcome
Original
Budget
Adjusted
Budget
Full Year
Forecast
Budget Year
2018/19
Budget Year
+1 2019/20
Budget Year
+2 2020/21
Financial Performance
Property rates 6,018,735 6,745,047 8,105,126 8,662,350 8,694,931 8,694,931 9,361,952 10,248,287 11,131,713
Service charges 15,197,370 17,363,596 18,619,106 19,310,141 17,184,556 17,184,556 19,179,838 22,414,325 25,204,467
Investment revenue 543,356 642,628 768,224 773,657 893,657 893,657 936,513 989,834 1,020,077
Transfers recognised - operational 3,264,270 3,619,257 3,666,705 6,455,942 7,027,387 7,027,387 6,803,608 7,101,185 7,464,469
Other own revenue 4,238,957 4,417,262 4,909,491 2,806,001 2,869,650 2,869,650 3,067,907 3,239,489 3,422,266
Total Revenue (excluding capital transfers and
contributions)29,262,688 32,787,790 36,068,652 38,008,091 36,670,182 36,670,182 39,349,818 43,993,121 48,242,992
Employee costs 8,124,733 9,357,740 9,659,300 12,050,690 11,505,286 11,505,286 12,920,115 13,804,026 14,883,272
Remuneration of councillors 128,412 134,637 138,374 155,787 155,565 155,565 169,640 180,666 192,500
Depreciation & asset impairment 1,917,134 2,117,336 2,313,471 2,574,607 2,520,137 2,520,137 2,814,336 3,092,708 3,279,697
Finance charges 774,895 747,256 731,823 1,131,010 993,544 993,544 1,089,285 1,564,844 1,885,513
Materials and bulk purchases 7,432,744 8,373,741 8,914,152 9,730,312 9,925,053 9,925,053 10,742,417 12,296,188 13,204,976
Transfers and grants 136,487 148,246 111,829 140,985 414,450 414,450 333,807 356,864 365,224
Other expenditure 8,841,018 9,812,305 10,988,770 11,574,725 10,898,706 10,898,706 11,194,339 12,133,147 12,998,004
Total Expenditure 27,355,422 30,691,262 32,857,719 37,358,116 36,412,742 36,412,742 39,263,938 43,428,443 46,809,187
Surplus/(Deficit) 1,907,266 2,096,529 3,210,934 649,975 257,440 257,440 85,879 564,677 1,433,805
Transfers and subsidies - capital (monetary allocations)
(National / Provincial and District)2,423,179 2,131,537 2,005,297 2,268,835 2,092,130 2,092,130 2,067,896 2,118,842 2,296,333
Contributions recognised - capital & contributed assets 49,172 61,589 88,397 84,900 96,585 96,585 76,200 78,600 112,100
Surplus/(Deficit) after capital transfers & contributions4,379,616 4,289,654 5,304,628 3,003,710 2,446,155 2,446,155 2,229,975 2,762,119 3,842,238
Share of surplus/ (deficit) of associate – – – – – – – – –
Surplus/(Deficit) for the year 4,379,616 4,289,654 5,304,628 3,003,710 2,446,155 2,446,155 2,229,975 2,762,119 3,842,238
Capital expenditure & funds sources
Capital expenditure 5,251,742 5,489,834 5,904,621 6,975,220 7,681,003 6,414,955 8,407,556 9,815,321 10,106,785
Transfers recognised - capital 2,473,313 2,187,425 2,055,507 2,268,835 2,092,130 2,072,060 2,067,896 2,118,842 2,296,333
Public contributions & donations 44,219 61,488 71,882 84,900 96,585 87,522 76,200 78,600 112,100
Borrowing 2,152,377 2,441,423 2,739,196 2,894,482 4,000,000 2,891,804 4,000,000 5,700,000 6,000,000
Internally generated funds 581,833 799,498 1,038,037 1,727,003 1,492,288 1,363,569 2,263,460 1,917,880 1,698,351
Total sources of capital funds 5,251,742 5,489,834 5,904,621 6,975,220 7,681,003 6,414,955 8,407,556 9,815,321 10,106,785
Financial position
Total current assets 10,679,240 11,726,952 12,250,660 13,804,580 14,615,569 14,615,569 15,622,361 17,633,863 20,823,888
Total non current assets 38,578,872 42,136,829 46,570,423 49,655,980 51,132,282 51,132,282 56,541,886 63,039,743 69,658,211
Total current liabilities 8,656,354 8,859,316 8,766,304 10,811,468 12,223,284 12,223,284 12,459,589 12,984,522 13,548,218
Total non current liabilities 12,040,207 12,153,259 11,898,945 14,514,129 12,922,577 12,922,577 16,872,693 22,095,001 27,497,559
Community wealth/Equity 28,561,551 32,851,206 38,155,834 38,134,963 40,601,989 40,601,989 42,831,965 45,594,083 49,436,322
Cash flows
Net cash from (used) operating 6,053,691 6,321,213 6,601,206 5,500,155 4,773,262 4,773,262 4,809,613 5,641,198 6,930,576
Net cash from (used) investing (4,713,291) (5,954,670) (6,102,676) (7,059,015) (6,692,075) (6,692,075) (7,683,492) (8,974,917) (9,231,873)
Net cash from (used) financing (407,811) (233,222) (380,806) 2,103,124 3,597,199 3,597,199 3,556,102 4,996,879 5,114,518
Cash/cash equivalents at the year end 3,199,148 3,332,469 3,450,193 3,994,457 5,128,579 5,128,579 5,810,803 7,473,963 10,287,183
Cash backing/surplus reconciliation
Cash and investments available 8,699,112 9,453,834 9,981,970 10,546,439 11,660,356 11,660,356 12,342,580 14,005,740 16,818,960
Application of cash and investments 6,387,770 6,497,912 6,892,489 8,024,834 9,444,169 9,394,168 8,952,229 9,627,668 10,874,379
Balance - surplus (shortfall) 2,311,342 2,955,922 3,089,481 2,521,605 2,216,187 2,266,188 3,390,351 4,378,072 5,944,581
Asset management
Asset register summary (WDV) 34,749,931 38,118,947 41,651,787 45,766,736 46,428,603 46,428,603 51,601,445 57,833,292 64,155,040
Depreciation 1,917,134 2,117,336 2,313,471 2,574,607 2,520,137 2,520,137 2,747,836 3,022,550 3,205,646
Renewal of Existing Assets 2,365,004 2,669,591 1,587,484 1,423,658 1,609,224 1,581,903 1,883,731 2,291,309 2,561,781
Repairs and Maintenance 3,003,158 3,338,995 3,761,297 4,034,293 3,753,714 3,767,172 3,974,465 4,281,247 4,619,102
Free services
Cost of Free Basic Services provided 602,855 1,370,479 1,368,006 1,543,608 1,543,608 1,543,608 1,829,048 2,272,892 2,627,201
Revenue cost of free services provided 1,190,026 1,193,377 1,519,822 1,693,834 1,674,187 1,674,187 1,886,058 2,211,167 2,488,740
Households below minimum service level – – – – – – – – –
Water: - - - - - - - - -
Sanitation/sewerage: 377 - 217 217 217 217 149 100 -
Energy: 29,429 26,464 35,341 29,429 32,341 30,841 29,341 27,841 26,341
Refuse: - - - - - - - - -
Current Year 2017/182018/19 Medium Term Revenue & Expenditure
Framework

City of Cape Town - 2018/19 Budget (including additional recommendations read in at the Council meeting of 30 May 2018
Page 36
Explanatory notes to MBRR Table A1 – Budget Summary
1. Table A1 represents a high-level summation of the City’s budget, providing a view that includes all
major components, i.e. operating, capital, financial position, cash flow and MFMA funding
compliance.
2. In essence it provides a synopsis of the amounts to be approved by Council for operating
performance, resources deployed to capital expenditure, financial position, cash and funding
compliance and the City’s commitment to eliminate basic service delivery backlogs.
3. The importance of ensuring that a municipal budget is fully funded is stressed in the financial
management reforms. The MFMA through Section 18 requires that a budget only be funded by
realistically anticipated revenue to be collected and cash-backed accumulated funds from previous
years, not committed for other purposes.
4. To test whether the City’s budget is funded, it is required to collectively assess the financial
performance, capital budget, financial position and cash flow budget.
5. The City’s key outcomes in this regard are as follows:
a. The Financial Performance shows a surplus position over the 2018/19 MTREF. The narrative
to Table A4 on page 41 provides further details on how this surplus will be utilised.
b. The cash flow budget outcome shows that the budget is funded.
c. The capital budget is funded from the following sources:
i. Transfers recognised capital and public contributions & donations;
ii. Borrowing; and
iii. Internally generated funds which are financed from previous years’ accumulated
surpluses, previous years’ contributions to CRR and bulk infrastructure levies already
collected. The affordability and sustainability of these funds are confirmed by the
positive cash flow outcome over the 2018/19 MTREF.
6. The City’s cash backing/surplus reconciliation over the 2018/19 MTREF shows a positive outcome,
which is an indication that the City will be able to afford its commitments over the next three years.
7. The City’s persistent strive to eradicate infrastructure backlogs is evident in the annual increase of
investment in the Cost of Free Basic Services and the Revenue Cost of Free Basic Services
provided. Backlogs still exist for Electricity Services but are projected to reduce.
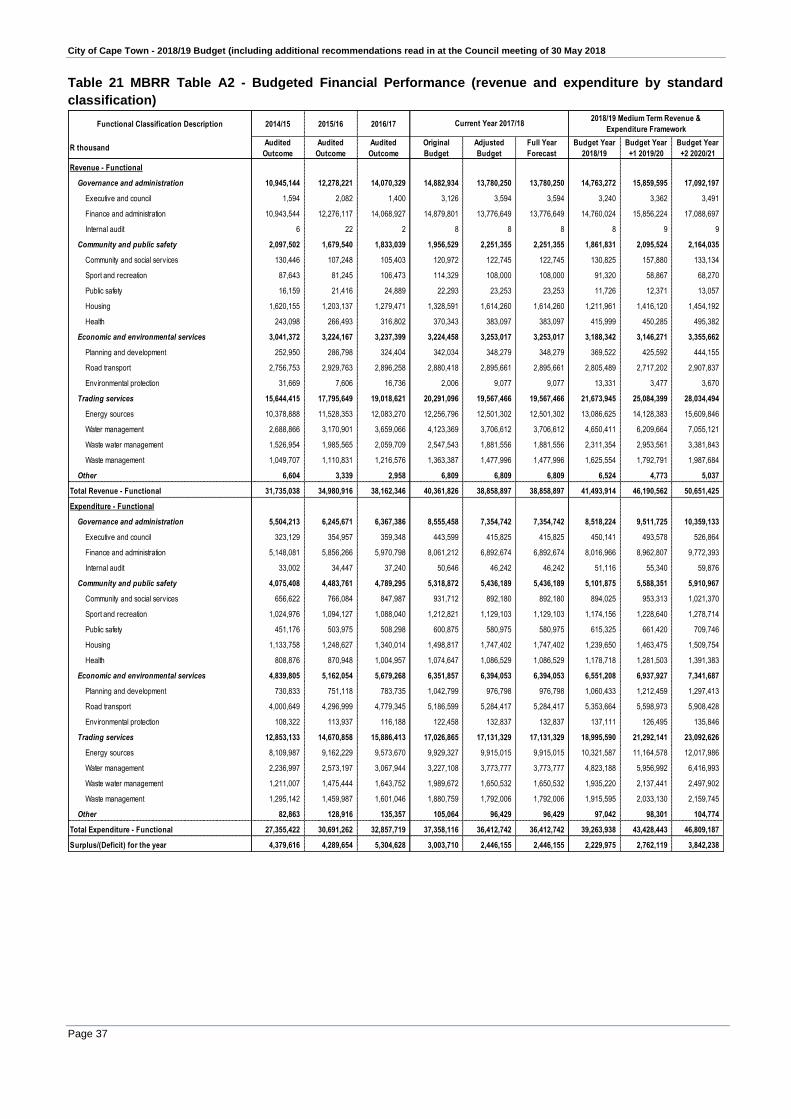
City of Cape Town - 2018/19 Budget (including additional recommendations read in at the Council meeting of 30 May 2018
Page 37
Table 21 MBRR Table A2 - Budgeted Financial Performance (revenue and expenditure by standard
classification)
Functional Classification Description 2014/15 2015/16 2016/17
R thousandAudited
Outcome
Audited
Outcome
Audited
Outcome
Original
Budget
Adjusted
Budget
Full Year
Forecast
Budget Year
2018/19
Budget Year
+1 2019/20
Budget Year
+2 2020/21
Revenue - Functional
Governance and administration 10,945,144 12,278,221 14,070,329 14,882,934 13,780,250 13,780,250 14,763,272 15,859,595 17,092,197
Executive and council 1,594 2,082 1,400 3,126 3,594 3,594 3,240 3,362 3,491
Finance and administration 10,943,544 12,276,117 14,068,927 14,879,801 13,776,649 13,776,649 14,760,024 15,856,224 17,088,697
Internal audit 6 22 2 8 8 8 8 9 9
Community and public safety 2,097,502 1,679,540 1,833,039 1,956,529 2,251,355 2,251,355 1,861,831 2,095,524 2,164,035
Community and social services 130,446 107,248 105,403 120,972 122,745 122,745 130,825 157,880 133,134
Sport and recreation 87,643 81,245 106,473 114,329 108,000 108,000 91,320 58,867 68,270
Public safety 16,159 21,416 24,889 22,293 23,253 23,253 11,726 12,371 13,057
Housing 1,620,155 1,203,137 1,279,471 1,328,591 1,614,260 1,614,260 1,211,961 1,416,120 1,454,192
Health 243,098 266,493 316,802 370,343 383,097 383,097 415,999 450,285 495,382
Economic and environmental services 3,041,372 3,224,167 3,237,399 3,224,458 3,253,017 3,253,017 3,188,342 3,146,271 3,355,662
Planning and development 252,950 286,798 324,404 342,034 348,279 348,279 369,522 425,592 444,155
Road transport 2,756,753 2,929,763 2,896,258 2,880,418 2,895,661 2,895,661 2,805,489 2,717,202 2,907,837
Environmental protection 31,669 7,606 16,736 2,006 9,077 9,077 13,331 3,477 3,670
Trading services 15,644,415 17,795,649 19,018,621 20,291,096 19,567,466 19,567,466 21,673,945 25,084,399 28,034,494
Energy sources 10,378,888 11,528,353 12,083,270 12,256,796 12,501,302 12,501,302 13,086,625 14,128,383 15,609,846
Water management 2,688,866 3,170,901 3,659,066 4,123,369 3,706,612 3,706,612 4,650,411 6,209,664 7,055,121
Waste water management 1,526,954 1,985,565 2,059,709 2,547,543 1,881,556 1,881,556 2,311,354 2,953,561 3,381,843
Waste management 1,049,707 1,110,831 1,216,576 1,363,387 1,477,996 1,477,996 1,625,554 1,792,791 1,987,684
Other 6,604 3,339 2,958 6,809 6,809 6,809 6,524 4,773 5,037
Total Revenue - Functional 31,735,038 34,980,916 38,162,346 40,361,826 38,858,897 38,858,897 41,493,914 46,190,562 50,651,425
Expenditure - Functional
Governance and administration 5,504,213 6,245,671 6,367,386 8,555,458 7,354,742 7,354,742 8,518,224 9,511,725 10,359,133
Executive and council 323,129 354,957 359,348 443,599 415,825 415,825 450,141 493,578 526,864
Finance and administration 5,148,081 5,856,266 5,970,798 8,061,212 6,892,674 6,892,674 8,016,966 8,962,807 9,772,393
Internal audit 33,002 34,447 37,240 50,646 46,242 46,242 51,116 55,340 59,876
Community and public safety 4,075,408 4,483,761 4,789,295 5,318,872 5,436,189 5,436,189 5,101,875 5,588,351 5,910,967
Community and social services 656,622 766,084 847,987 931,712 892,180 892,180 894,025 953,313 1,021,370
Sport and recreation 1,024,976 1,094,127 1,088,040 1,212,821 1,129,103 1,129,103 1,174,156 1,228,640 1,278,714
Public safety 451,176 503,975 508,298 600,875 580,975 580,975 615,325 661,420 709,746
Housing 1,133,758 1,248,627 1,340,014 1,498,817 1,747,402 1,747,402 1,239,650 1,463,475 1,509,754
Health 808,876 870,948 1,004,957 1,074,647 1,086,529 1,086,529 1,178,718 1,281,503 1,391,383
Economic and environmental services 4,839,805 5,162,054 5,679,268 6,351,857 6,394,053 6,394,053 6,551,208 6,937,927 7,341,687
Planning and development 730,833 751,118 783,735 1,042,799 976,798 976,798 1,060,433 1,212,459 1,297,413
Road transport 4,000,649 4,296,999 4,779,345 5,186,599 5,284,417 5,284,417 5,353,664 5,598,973 5,908,428
Environmental protection 108,322 113,937 116,188 122,458 132,837 132,837 137,111 126,495 135,846
Trading services 12,853,133 14,670,858 15,886,413 17,026,865 17,131,329 17,131,329 18,995,590 21,292,141 23,092,626
Energy sources 8,109,987 9,162,229 9,573,670 9,929,327 9,915,015 9,915,015 10,321,587 11,164,578 12,017,986
Water management 2,236,997 2,573,197 3,067,944 3,227,108 3,773,777 3,773,777 4,823,188 5,956,992 6,416,993
Waste water management 1,211,007 1,475,444 1,643,752 1,989,672 1,650,532 1,650,532 1,935,220 2,137,441 2,497,902
Waste management 1,295,142 1,459,987 1,601,046 1,880,759 1,792,006 1,792,006 1,915,595 2,033,130 2,159,745
Other 82,863 128,916 135,357 105,064 96,429 96,429 97,042 98,301 104,774
Total Expenditure - Functional 27,355,422 30,691,262 32,857,719 37,358,116 36,412,742 36,412,742 39,263,938 43,428,443 46,809,187
Surplus/(Deficit) for the year 4,379,616 4,289,654 5,304,628 3,003,710 2,446,155 2,446,155 2,229,975 2,762,119 3,842,238
Current Year 2017/182018/19 Medium Term Revenue &
Expenditure Framework

City of Cape Town - 2018/19 Budget (including additional recommendations read in at the Council meeting of 30 May 2018
Page 38
Explanatory notes to MBRR Table A2 - Budgeted Financial Performance (revenue and expenditure by
standard classification)
1. Table A2 is an overview of the budgeted financial performance in relation to revenue and
expenditure per standard classification, which divides the municipal services into 16 classifications.
2. Major contributing items to the increased operating revenue are additional allocations on the Fuel
Levy, the projected growth and tariff increases on Property Rates Tax and Service Charges
(Water, Sanitation, Electricity and Refuse).
3. The surplus of R2 229 million reflected in the 2018/19 financial year includes Transfers recognised
- capital (Capital Grants and Donations received), while the expenditure category excludes these
transfers.
4. This table highlights the surplus/deficits for Energy services, Waste water management and
Waste management. This is due to the exclusion of internal cost charges/recoveries and other
provisions e.g. Contribution from the Energy directorate to the Rates Account on this table.
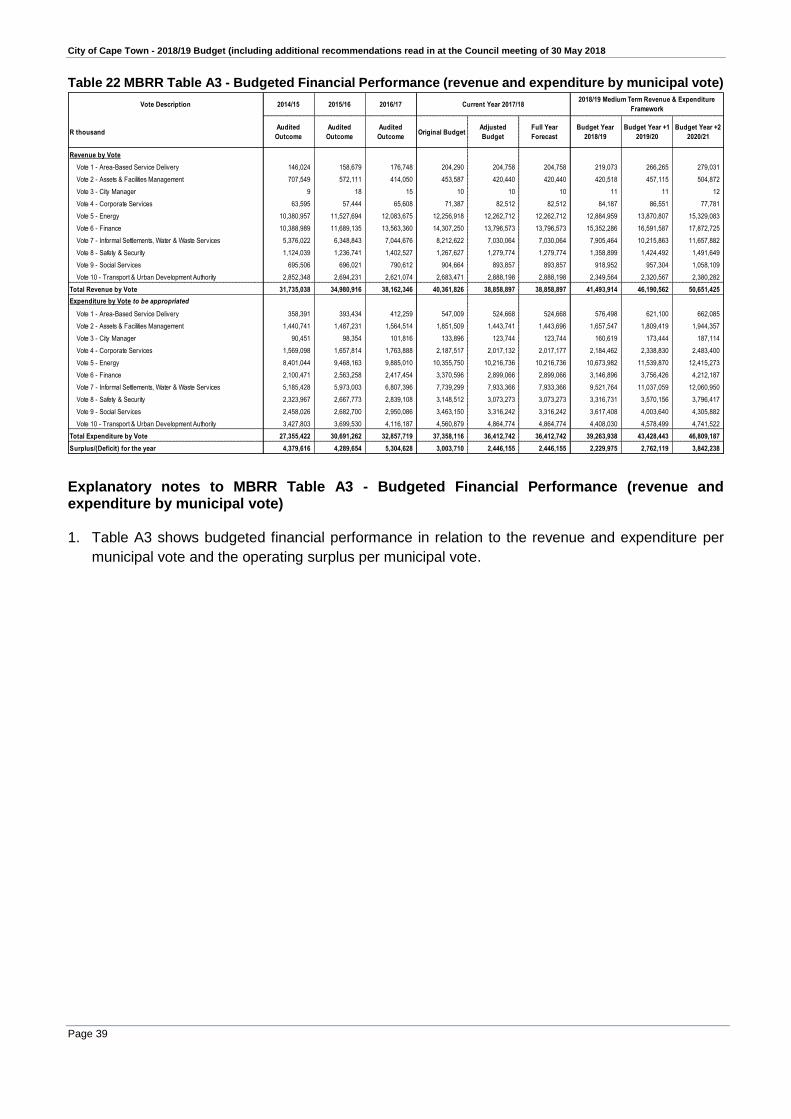
City of Cape Town - 2018/19 Budget (including additional recommendations read in at the Council meeting of 30 May 2018
Page 39
Table 22 MBRR Table A3 - Budgeted Financial Performance (revenue and expenditure by municipal vote)
Vote Description 2014/15 2015/16 2016/17
R thousandAudited
Outcome
Audited
Outcome
Audited
OutcomeOriginal Budget
Adjusted
Budget
Full Year
Forecast
Budget Year
2018/19
Budget Year +1
2019/20
Budget Year +2
2020/21
Revenue by Vote
Vote 1 - Area-Based Service Delivery 146,024 158,679 176,748 204,290 204,758 204,758 219,073 266,265 279,031
Vote 2 - Assets & Facilities Management 707,549 572,111 414,050 453,587 420,440 420,440 420,518 457,115 504,872
Vote 3 - City Manager 9 18 15 10 10 10 11 11 12
Vote 4 - Corporate Services 63,595 57,444 65,608 71,387 82,512 82,512 84,187 86,551 77,781
Vote 5 - Energy 10,380,957 11,527,694 12,083,675 12,256,918 12,262,712 12,262,712 12,884,959 13,870,807 15,329,083
Vote 6 - Finance 10,388,989 11,689,135 13,563,360 14,307,250 13,796,573 13,796,573 15,352,286 16,591,587 17,872,725
Vote 7 - Informal Settlements, Water & Waste Services 5,376,022 6,348,843 7,044,676 8,212,622 7,030,064 7,030,064 7,905,464 10,215,863 11,657,882
Vote 8 - Safety & Security 1,124,039 1,236,741 1,402,527 1,267,627 1,279,774 1,279,774 1,358,899 1,424,492 1,491,649
Vote 9 - Social Services 695,506 696,021 790,612 904,664 893,857 893,857 918,952 957,304 1,058,109
Vote 10 - Transport & Urban Development Authority 2,852,348 2,694,231 2,621,074 2,683,471 2,888,198 2,888,198 2,349,564 2,320,567 2,380,282
Total Revenue by Vote 31,735,038 34,980,916 38,162,346 40,361,826 38,858,897 38,858,897 41,493,914 46,190,562 50,651,425
Expenditure by Vote to be appropriated
Vote 1 - Area-Based Service Delivery 358,391 393,434 412,259 547,009 524,668 524,668 576,498 621,100 662,085
Vote 2 - Assets & Facilities Management 1,440,741 1,487,231 1,564,514 1,851,509 1,443,741 1,443,696 1,657,547 1,809,419 1,944,357
Vote 3 - City Manager 90,451 98,354 101,816 133,896 123,744 123,744 160,619 173,444 187,114
Vote 4 - Corporate Services 1,569,098 1,657,814 1,763,888 2,187,517 2,017,132 2,017,177 2,184,462 2,338,830 2,483,400
Vote 5 - Energy 8,401,044 9,468,163 9,885,010 10,355,750 10,216,736 10,216,736 10,673,982 11,539,870 12,415,273
Vote 6 - Finance 2,100,471 2,563,258 2,417,454 3,370,596 2,899,066 2,899,066 3,146,896 3,756,426 4,212,187
Vote 7 - Informal Settlements, Water & Waste Services 5,185,428 5,973,003 6,807,396 7,739,299 7,933,366 7,933,366 9,521,764 11,037,059 12,060,950
Vote 8 - Safety & Security 2,323,967 2,667,773 2,839,108 3,148,512 3,073,273 3,073,273 3,316,731 3,570,156 3,796,417
Vote 9 - Social Services 2,458,026 2,682,700 2,950,086 3,463,150 3,316,242 3,316,242 3,617,408 4,003,640 4,305,882
Vote 10 - Transport & Urban Development Authority 3,427,803 3,699,530 4,116,187 4,560,879 4,864,774 4,864,774 4,408,030 4,578,499 4,741,522
Total Expenditure by Vote 27,355,422 30,691,262 32,857,719 37,358,116 36,412,742 36,412,742 39,263,938 43,428,443 46,809,187
Surplus/(Deficit) for the year 4,379,616 4,289,654 5,304,628 3,003,710 2,446,155 2,446,155 2,229,975 2,762,119 3,842,238
Current Year 2017/182018/19 Medium Term Revenue & Expenditure
Framework
Explanatory notes to MBRR Table A3 - Budgeted Financial Performance (revenue and expenditure by municipal vote) 1. Table A3 shows budgeted financial performance in relation to the revenue and expenditure per
municipal vote and the operating surplus per municipal vote.

City of Cape Town - 2018/19 Budget (including additional recommendations read in at the Council meeting of 30 May 2018
Page 40
The table below is an analysis of the surplus or deficit for trading services.
Table 23 Surplus / (Deficit) calculations for the trading services
Description
R thousandBudget Year
2018/19
Budget Year +1
2019/20
Budget Year +2
2020/21
Energy
Total Operating Revenue (including capital transfers and
contributions)
12,884,959 13,870,807 15,329,083
Total Operating Expenditure 10,673,982 11,539,870 12,415,273
Operating Surplus/(Deficit) for the year 2,210,977 2,330,937 2,913,810
Percentage Surplus 17.2% 16.8% 19.0%
Water & Sanitation
Total Operating Revenue including capital transfers and
contributions)
6,200,338 8,346,765 9,552,436
Total Operating Expenditure 6,594,010 7,918,084 8,630,464
Operating Surplus/(Deficit) for the year (393,672) 428,680 921,973
Percentage Surplus -6.3% 5.1% 9.7%
Solid Waste Management
Total Operating Revenue including capital transfers and
contributions)
1,502,353 1,658,509 1,841,323
Total Operating Expenditure 968,535 1,025,896 1,087,132
Operating Surplus/(Deficit) for the year 533,817 632,612 754,191
Percentage Surplus 35.5% 38.1% 41.0%
2018/19 Medium Term Revenue & Expenditure
Framework
2. Electricity revenue and expenditure growth fluctuates over the MTREF period. This is influenced
by Eskom bulk purchases as well as the impact of City’s tariff setting policy.
3. The surplus/deficit reflected in the trading services (Energy, Water & Sanitation and Solid Waste
Management) is based on primary revenue and expenditure items only. This does not include
contributions from Energy to Rates and Rates Contribution to Water & Sanitation for the drought
relief o r internal cost charges/recoveries. These “secondary elements” are, however, included
in the tariff calculations for the various trading services. Taking the secondary budget into
account, none of the Trading Services have deficit/surplus positions.
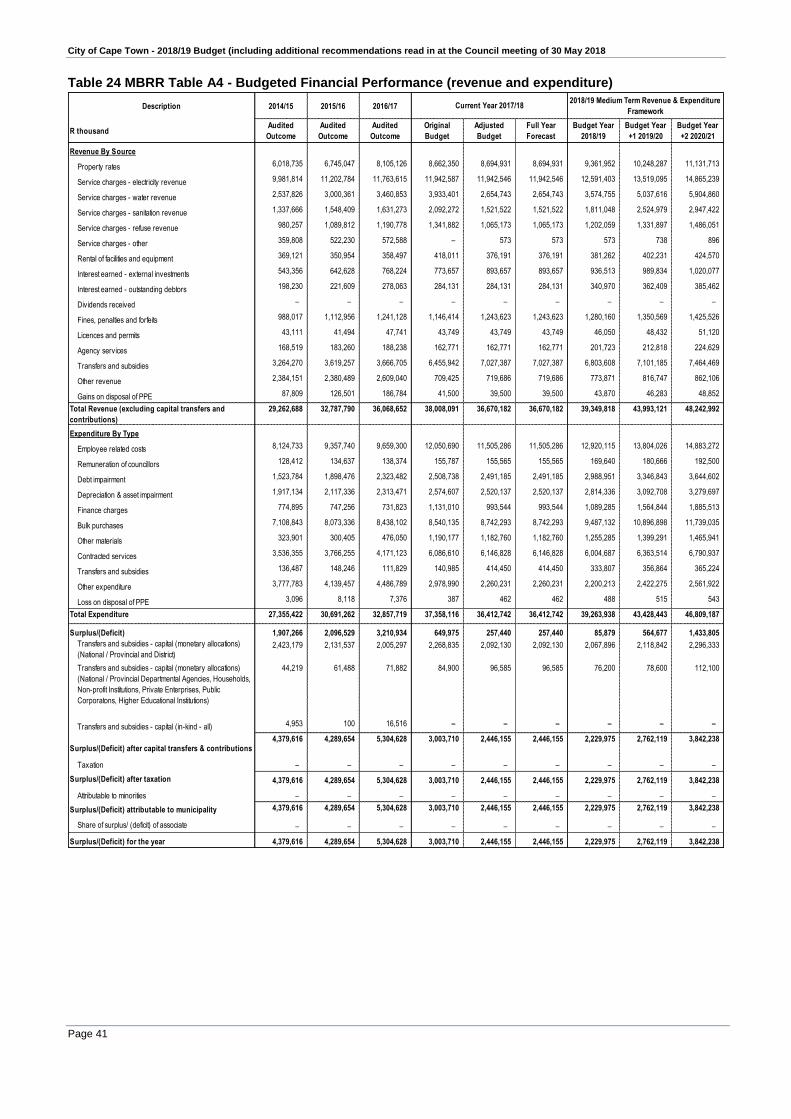
City of Cape Town - 2018/19 Budget (including additional recommendations read in at the Council meeting of 30 May 2018
Page 41
Table 24 MBRR Table A4 - Budgeted Financial Performance (revenue and expenditure)
Description 2014/15 2015/16 2016/17
R thousandAudited
Outcome
Audited
Outcome
Audited
Outcome
Original
Budget
Adjusted
Budget
Full Year
Forecast
Budget Year
2018/19
Budget Year
+1 2019/20
Budget Year
+2 2020/21
Revenue By Source
Property rates 6,018,735 6,745,047 8,105,126 8,662,350 8,694,931 8,694,931 9,361,952 10,248,287 11,131,713
Service charges - electricity revenue 9,981,814 11,202,784 11,763,615 11,942,587 11,942,546 11,942,546 12,591,403 13,519,095 14,865,239
Service charges - water revenue 2,537,826 3,000,361 3,460,853 3,933,401 2,654,743 2,654,743 3,574,755 5,037,616 5,904,860
Service charges - sanitation revenue 1,337,666 1,548,409 1,631,273 2,092,272 1,521,522 1,521,522 1,811,048 2,524,979 2,947,422
Service charges - refuse revenue 980,257 1,089,812 1,190,778 1,341,882 1,065,173 1,065,173 1,202,059 1,331,897 1,486,051
Service charges - other 359,808 522,230 572,588 – 573 573 573 738 896
Rental of facilities and equipment 369,121 350,954 358,497 418,011 376,191 376,191 381,262 402,231 424,570
Interest earned - external investments 543,356 642,628 768,224 773,657 893,657 893,657 936,513 989,834 1,020,077
Interest earned - outstanding debtors 198,230 221,609 278,063 284,131 284,131 284,131 340,970 362,409 385,462
Dividends received – – – – – – – – –
Fines, penalties and forfeits 988,017 1,112,956 1,241,128 1,146,414 1,243,623 1,243,623 1,280,160 1,350,569 1,425,526
Licences and permits 43,111 41,494 47,741 43,749 43,749 43,749 46,050 48,432 51,120
Agency services 168,519 183,260 188,238 162,771 162,771 162,771 201,723 212,818 224,629
Transfers and subsidies 3,264,270 3,619,257 3,666,705 6,455,942 7,027,387 7,027,387 6,803,608 7,101,185 7,464,469
Other revenue 2,384,151 2,380,489 2,609,040 709,425 719,686 719,686 773,871 816,747 862,106
Gains on disposal of PPE 87,809 126,501 186,784 41,500 39,500 39,500 43,870 46,283 48,852
Total Revenue (excluding capital transfers and
contributions)
29,262,688 32,787,790 36,068,652 38,008,091 36,670,182 36,670,182 39,349,818 43,993,121 48,242,992
Expenditure By Type
Employee related costs 8,124,733 9,357,740 9,659,300 12,050,690 11,505,286 11,505,286 12,920,115 13,804,026 14,883,272
Remuneration of councillors 128,412 134,637 138,374 155,787 155,565 155,565 169,640 180,666 192,500
Debt impairment 1,523,784 1,898,476 2,323,482 2,508,738 2,491,185 2,491,185 2,988,951 3,346,843 3,644,602
Depreciation & asset impairment 1,917,134 2,117,336 2,313,471 2,574,607 2,520,137 2,520,137 2,814,336 3,092,708 3,279,697
Finance charges 774,895 747,256 731,823 1,131,010 993,544 993,544 1,089,285 1,564,844 1,885,513
Bulk purchases 7,108,843 8,073,336 8,438,102 8,540,135 8,742,293 8,742,293 9,487,132 10,896,898 11,739,035
Other materials 323,901 300,405 476,050 1,190,177 1,182,760 1,182,760 1,255,285 1,399,291 1,465,941
Contracted services 3,536,355 3,766,255 4,171,123 6,086,610 6,146,828 6,146,828 6,004,687 6,363,514 6,790,937
Transfers and subsidies 136,487 148,246 111,829 140,985 414,450 414,450 333,807 356,864 365,224
Other expenditure 3,777,783 4,139,457 4,486,789 2,978,990 2,260,231 2,260,231 2,200,213 2,422,275 2,561,922
Loss on disposal of PPE 3,096 8,118 7,376 387 462 462 488 515 543
Total Expenditure 27,355,422 30,691,262 32,857,719 37,358,116 36,412,742 36,412,742 39,263,938 43,428,443 46,809,187
Surplus/(Deficit) 1,907,266 2,096,529 3,210,934 649,975 257,440 257,440 85,879 564,677 1,433,805
Transfers and subsidies - capital (monetary allocations)
(National / Provincial and District)2,423,179 2,131,537 2,005,297 2,268,835 2,092,130 2,092,130 2,067,896 2,118,842 2,296,333
Transfers and subsidies - capital (monetary allocations)
(National / Provincial Departmental Agencies, Households,
Non-profit Institutions, Private Enterprises, Public
Corporatons, Higher Educational Institutions)
44,219 61,488 71,882 84,900 96,585 96,585 76,200 78,600 112,100
Transfers and subsidies - capital (in-kind - all) 4,953 100 16,516 – – – – – –
Surplus/(Deficit) after capital transfers & contributions4,379,616 4,289,654 5,304,628 3,003,710 2,446,155 2,446,155 2,229,975 2,762,119 3,842,238
Taxation – – – – – – – – –
Surplus/(Deficit) after taxation 4,379,616 4,289,654 5,304,628 3,003,710 2,446,155 2,446,155 2,229,975 2,762,119 3,842,238
Attributable to minorities – – – – – – – – –
Surplus/(Deficit) attributable to municipality 4,379,616 4,289,654 5,304,628 3,003,710 2,446,155 2,446,155 2,229,975 2,762,119 3,842,238
Share of surplus/ (deficit) of associate – – – – – – – – –
Surplus/(Deficit) for the year 4,379,616 4,289,654 5,304,628 3,003,710 2,446,155 2,446,155 2,229,975 2,762,119 3,842,238
Current Year 2017/182018/19 Medium Term Revenue & Expenditure
Framework

City of Cape Town - 2018/19 Budget (including additional recommendations read in at the Council meeting of 30 May 2018
Page 42
Explanatory notes to MBRR Table A4 - Budgeted Financial Performance (revenue and expenditure) 1. Table A4 is a view of the budgeted financial performance in relation to the revenue by source and
expenditure by type. Total revenue is R39 350 million (excluding appropriations, which are
disclosed in the financial position statement) in 2018/19 and escalates to R48 243 million by
2020/21. Major contributing items are the increased operating allocations from National- and
Provincial Government, the projected growth and tariff increases on Property Rates Tax and
Service Charges.
Figure 3 Revenue by source
2. Revenue to be generated from Property Rates amounts to R9 362 million in 2018/19 and increases
to R11 132 million by 2020/21, which represents 23.7% of the operating revenue base of the City
and therefore remain significant funding source for the City.
3. Service charges relating to Electricity, Water, Sanitation and Refuse Removal constitute the biggest
component of the revenue basket of the City, totalling to R19 180 million in 2018/19 and increases
to R25 204 million in 2020/21. For 2018/19, service charges are 49% of the total revenue base.
4. Transfers & Subsidies increases from R6 804 million in 2018/19 to R7 464 million in 2020/21. This
includes external allocations received from National- and Provincial Government, private sector
funding and the Fuel Levy.
5. Following tabling of the March 2018 City Budget, a reassessment of the Water & Sanitation
department’s budget, based on updated information of both the current as well as future years,
resulted in an amended loan take-up/borrowing requirement, with concomitant reduced
depreciation cost. The resultant surpluses will be used to further reduce the loan-take up
requirement of the New Water Plan and replacement of externally funded capital assets. Initiatives
planned over the next few years to ensure sustainability and resilience in the provision of water for
the City, include:

City of Cape Town - 2018/19 Budget (including additional recommendations read in at the Council meeting of 30 May 2018
Page 43
Investment in desalination, underground extraction from aquifers and water
reclamation/reuse initiatives;
Continued investment in asset replacement programmes to ensure optimum asset
management;
Acceleration of repairs and maintenance programmes as well as a purpose fit staffing strategy,
to ensure that service delivery and response expectations are met; and
Further roll-out of water demand management initiatives to limit the abuse of water.
Figure 4 Expenditure by type
6. Bulk purchases have increased significantly over the MTREF, escalating from R9 487 million to
R11 739 million in 2020/21. This increase can be attributed to substantial increases in the cost of
bulk electricity from Eskom and bulk water from the National Department of Water Affairs.
7. Employee-related costs are the main cost driver within the City’s operating expenditure budget
increasing from R12 920 million in 2018/19 to R14 883 million in 2020/21.
8. Depreciation & Asset Impairment totals R2 814 million for the 2018/19 financial year and is linked
to the capitalisation rate of assets. The calculation of depreciation on new capital expenditure is
based on variables such as asset class and lifespan depending on the nature of the asset. An
annual capital expenditure implementation rate of 100% is assumed. Depreciation of existing
assets is calculated based on simulated financial system data (SAP), which reflects actual values
per annum. Assets Under Construction (AUC) are calculated based on asset class lifespan and
the projected capitalisation dates.
9. Contracted Services increases from R6 005 million in 2018/19 to R6 791 million in 2020/21 and
includes budgetary provision for Repairs & Maintenance.

City of Cape Town - 2018/19 Budget (including additional recommendations read in at the Council meeting of 30 May 2018
Page 44
Table 25 MBRR Table A5 - Budgeted Capital Expenditure by vote, standard classification and funding
source
Vote Description 2014/15 2015/16 2016/17
R thousandAudited
Outcome
Audited
Outcome
Audited
Outcome
Original
Budget
Adjusted
Budget
Full Year
Forecast
Budget Year
2018/19
Budget Year
+1 2019/20
Budget Year
+2 2020/21
Capital expenditure - Vote
Multi-year expenditure to be appropriated
Vote 1 - Area-Based Service Delivery 6,981 11,287 12,384 39,430 19,648 19,576 13,110 82,870 74,870
Vote 2 - Assets & Facilities Management 505,910 289,059 358,089 394,119 430,422 424,688 413,287 301,701 91,372
Vote 3 - City Manager 763 816 997 2,404 2,523 2,224 735 735 760
Vote 4 - Corporate Services 323,414 337,912 266,229 366,613 379,349 378,041 354,597 342,571 336,546
Vote 5 - Energy 952,415 1,090,855 1,248,887 1,292,814 1,177,050 1,103,282 1,113,506 1,427,000 1,741,137
Vote 6 - Finance 43,231 38,133 23,989 18,036 14,610 14,444 20,549 65,419 35,411
Vote 7 - Informal Settlements, Water & Waste Services 1,291,505 1,698,228 1,828,616 2,445,238 3,654,940 2,514,629 4,206,581 5,681,026 5,968,036
Vote 8 - Safety & Security 83,097 152,051 114,835 191,120 160,128 160,040 196,078 79,515 42,115
Vote 9 - Social Services 243,995 229,454 243,940 283,413 279,906 276,641 315,508 238,127 215,704
Vote 10 - Transport & Urban Development Authority 1,800,430 1,642,040 1,806,655 1,942,035 1,562,428 1,521,389 1,773,606 1,596,358 1,600,833
Total Capital Expenditure - Vote 5,251,742 5,489,834 5,904,621 6,975,220 7,681,003 6,414,955 8,407,556 9,815,321 10,106,785
Capital Expenditure - Functional
Governance and administration 626,449 750,055 1,073,026 1,244,434 1,206,296 1,226,746 986,516 827,799 856,764
Executive and council 4,227 19,672 9,164 3,594 4,725 4,655 4,380 5,180 3,480
Finance and administration 622,098 730,250 1,063,731 1,239,881 1,200,612 1,221,411 982,005 822,487 853,224
Internal audit 124 133 131 959 959 680 131 131 60
Community and public safety 1,258,375 640,879 773,993 955,697 808,387 781,182 1,082,792 1,006,810 880,569
Community and social services 132,294 160,898 127,329 151,270 143,487 133,263 97,129 107,017 66,323
Sport and recreation 123,797 113,637 127,927 105,711 113,891 103,414 84,261 23,766 26,178
Public safety 20,011 12,272 18,865 46,799 20,354 20,354 35,064 7,659 7,659
Housing 962,099 336,949 476,876 606,733 488,196 479,769 794,497 817,971 732,913
Health 20,173 17,122 22,996 45,183 42,460 44,381 71,841 50,396 47,496
Economic and environmental services 1,317,978 1,576,687 1,578,032 1,662,703 1,442,449 1,404,040 1,389,642 1,211,925 1,197,686
Planning and development 59,335 66,962 70,697 44,786 37,512 37,239 39,904 76,795 96,723
Road transport 1,247,713 1,492,691 1,495,384 1,599,888 1,387,328 1,348,526 1,331,443 1,120,251 1,094,021
Environmental protection 10,930 17,034 11,951 18,028 17,608 18,275 18,294 14,880 6,942
Trading services 2,046,941 2,521,327 2,474,957 3,104,956 4,216,440 2,995,557 4,939,787 6,761,392 7,166,070
Energy sources 920,376 1,050,923 1,131,636 1,183,872 1,065,474 995,023 1,071,737 1,422,800 1,643,542
Water management 509,417 641,907 608,426 853,967 2,301,319 1,251,039 2,366,730 3,097,400 3,297,047
Waste water management 460,858 680,773 659,092 684,576 658,872 623,226 1,135,113 1,673,849 1,716,148
Waste management 156,289 147,724 75,803 382,541 190,776 126,269 366,207 567,344 509,333
Other 1,999 886 4,613 7,432 7,431 7,430 8,818 7,395 5,695
Total Capital Expenditure - Functional 5,251,742 5,489,834 5,904,621 6,975,220 7,681,003 6,414,955 8,407,556 9,815,321 10,106,785
Funded by:
National Government 2,189,129 2,030,362 2,009,376 2,189,832 2,057,467 2,037,622 2,015,146 1,993,692 2,138,633
Provincial Government 282,292 156,729 46,130 79,002 34,663 34,439 52,750 125,150 157,700
District Municipality – – – – – – – – –
Other transfers and grants 1,892 333 – – – – – – –
Transfers recognised - capital 2,473,313 2,187,425 2,055,507 2,268,835 2,092,130 2,072,060 2,067,896 2,118,842 2,296,333
Public contributions & donations 44,219 61,488 71,882 84,900 96,585 87,522 76,200 78,600 112,100
Borrowing 2,152,377 2,441,423 2,739,196 2,894,482 4,000,000 2,891,804 4,000,000 5,700,000 6,000,000
Internally generated funds 581,833 799,498 1,038,037 1,727,003 1,492,288 1,363,569 2,263,460 1,917,880 1,698,351
Total Capital Funding 5,251,742 5,489,834 5,904,621 6,975,220 7,681,003 6,414,955 8,407,556 9,815,321 10,106,785
Current Year 2017/182018/19 Medium Term Revenue & Expenditure
Framework

City of Cape Town - 2018/19 Budget (including additional recommendations read in at the Council meeting of 30 May 2018
Page 45
Explanatory notes to Table A5 - Budgeted Capital Expenditure by vote, standard classification and
funding source
1. Table A5 reflects the City’s capital programme in relation to capital expenditure by municipal vote
(directorate); capital expenditure by standard classification; and funding sources required to fund
the capital budget, including information on capital transfers from National and Provincial
Departments.
2. The MFMA provides that a municipality may approve multi-year or single-year capital budget
appropriations. The City has allocated multi-year appropriations amounting to R8 407 million for
2018/19, increasing to R9 815 million and R10 107 million in 2019/20 and 2020/21, respectively.
3. The capital budget is funded by allocations made to the City by National- and Provincial government
in the form of grants, as well as public contributions and donations, borrowings and internally
generated funds.
Capital transfers from National Government and the Western Cape Government amount to R2 068
million (24.6%) in 2018/19, increasing slightly to R2 119 million in 2019/20 and R2 296 million in
2020/21.
Public contributions and donations amounts to R76.2 million, R78.6 million and R112.1 million over
the respective years. Borrowings amounts to R4 000 million, R5 700 million and R6 000 million
over the MTREF and has been provided for in terms of affordability levels as determined during the
MTREF modelling.
Internally generated funds have been provided for over the MTREF amounting to R2 263 million,
R1 918 million and R1 698 million for each of the respective financial years.

City of Cape Town - 2018/19 Budget (including additional recommendations read in at the Council meeting of 30 May 2018
Page 46
Table 26 MBRR Table A6 - Budgeted Financial Position
Description 2014/15 2015/16 2016/17
R thousandAudited
Outcome
Audited
Outcome
Audited
Outcome
Original
Budget
Adjusted
Budget
Full Year
Forecast
Budget Year
2018/19
Budget Year +1
2019/20
Budget Year +2
2020/21
ASSETS
Current assets
Cash 142,947 93,002 500,739 103,918 103,918 103,918 103,918 146,904 146,396
Call investment deposits 4,802,548 5,394,644 4,608,866 6,599,932 6,891,683 6,891,683 7,335,199 8,687,514 11,202,766
Consumer debtors 4,618,497 5,106,634 5,724,863 5,635,475 6,008,994 6,008,994 6,349,964 6,712,373 7,097,836
Other debtors 815,094 858,306 1,077,455 1,135,110 1,239,073 1,239,073 1,424,934 1,638,674 1,884,476
Current portion of long-term receivables 19,838 17,093 14,201 18,845 14,911 14,911 15,657 16,439 17,261
Inventory 280,316 257,273 324,536 311,300 356,990 356,990 392,689 431,957 475,153
Total current assets 10,679,240 11,726,952 12,250,660 13,804,580 14,615,569 14,615,569 15,622,361 17,633,863 20,823,888
Non current assets
Long-term receivables 75,324 51,695 40,973 46,655 38,924 38,924 36,978 35,129 33,373
Investments 3,753,617 3,966,188 4,877,663 3,842,589 4,664,755 4,664,755 4,903,463 5,171,322 5,469,798
Investment property 589,382 588,191 586,427 586,473 584,713 584,713 582,999 581,285 579,571
Investment in Associate – – – – – – – – –
Property, plant and equipment 33,443,104 36,892,544 40,377,585 44,648,942 45,305,040 45,305,040 50,601,468 56,951,031 63,390,035
Agricultural – – – – – – – – –
Biological – – – – – – – – –
Intangible 708,383 629,162 678,871 522,272 529,946 529,946 408,074 292,072 176,530
Other non-current assets 9,062 9,049 8,904 9,049 8,904 8,904 8,904 8,904 8,904
Total non current assets 38,578,872 42,136,829 46,570,423 49,655,980 51,132,282 51,132,282 56,541,886 63,039,743 69,658,211
TOTAL ASSETS 49,258,112 53,863,781 58,821,083 63,460,560 65,747,851 65,747,851 72,164,247 80,673,606 90,482,099
LIABILITIES
Current liabilities
Bank overdraft – – 5,298 – – – – – –
Borrowing 345,682 469,936 334,185 428,372 366,249 416,250 619,342 993,842 1,405,990
Consumer deposits 272,258 324,633 351,710 392,806 386,881 386,881 425,569 468,126 514,939
Trade and other payables 6,911,132 6,995,470 7,110,819 8,766,074 10,438,362 10,388,361 10,346,153 10,351,535 10,375,667
Provisions 1,127,282 1,069,277 964,292 1,224,215 1,031,792 1,031,792 1,068,525 1,171,019 1,251,623
Total current liabilities 8,656,354 8,859,316 8,766,304 10,811,468 12,223,284 12,223,284 12,459,589 12,984,522 13,548,218
Non current liabilities
Borrowing 6,415,499 6,036,906 5,789,616 7,770,349 6,442,550 6,442,550 9,772,937 14,457,083 19,290,056
Provisions 5,624,708 6,116,353 6,109,329 6,743,780 6,480,027 6,480,027 7,099,756 7,637,918 8,207,503
Total non current liabilities 12,040,207 12,153,259 11,898,945 14,514,129 12,922,577 12,922,577 16,872,693 22,095,001 27,497,559
TOTAL LIABILITIES 20,696,561 21,012,575 20,665,249 25,325,597 25,145,861 25,145,861 29,332,282 35,079,523 41,045,777
NET ASSETS 28,561,551 32,851,206 38,155,834 38,134,963 40,601,989 40,601,989 42,831,965 45,594,083 49,436,322
COMMUNITY WEALTH/EQUITY
Accumulated Surplus/(Deficit) 25,771,287 29,846,771 34,382,649 35,341,724 37,278,268 37,278,268 39,405,832 41,245,471 43,569,995
Reserves 2,790,264 3,004,435 3,773,185 2,793,239 3,323,721 3,323,721 3,426,132 4,348,613 5,866,327
TOTAL COMMUNITY WEALTH/EQUITY 28,561,551 32,851,206 38,155,834 38,134,963 40,601,989 40,601,989 42,831,965 45,594,083 49,436,322
Current Year 2017/182018/19 Medium Term Revenue & Expenditure
Framework

City of Cape Town - 2018/19 Budget (including additional recommendations read in at the Council meeting of 30 May 2018
Page 47
Explanatory notes to Table A6 - Budgeted Financial Position
a. The budgeted Statement of Financial Position of the City has been prepared on a basis consistent
with GRAP 1 and international accounting standards and as such makes it comparable with the
present Statement of Financial Position and those of previous years. This will enable all
stakeholders to interpret the impact of the budget as such on the Statement of Financial Position.
b. The assets are in the order of relative liquidity and liabilities according to their priority of being met
with cash and an extensive table of notes (MBRR Table SA3 on page 195) are provided with details
of the major components of items, such as:
• Call Investment Deposits
• Consumer Debtors
• Property, Plant and Equipment
• Trade and Other Payables
• Non-Current Provisions
• Changes in Net Assets
• Reserves
c. Movements on the Budgeted Statement of Financial Performance will impact on the Budgeted
Statement of Financial Position. Assumptions made on the collection rate for instance, will affect
the budgeted cash position of the City and the budgeted impairment of debtors. As such the
assumptions form a critical link in determining the applicability and relevance of the budget, the
determination of financial indicators, the assessment of funding compliance and the general viability
of the municipality.
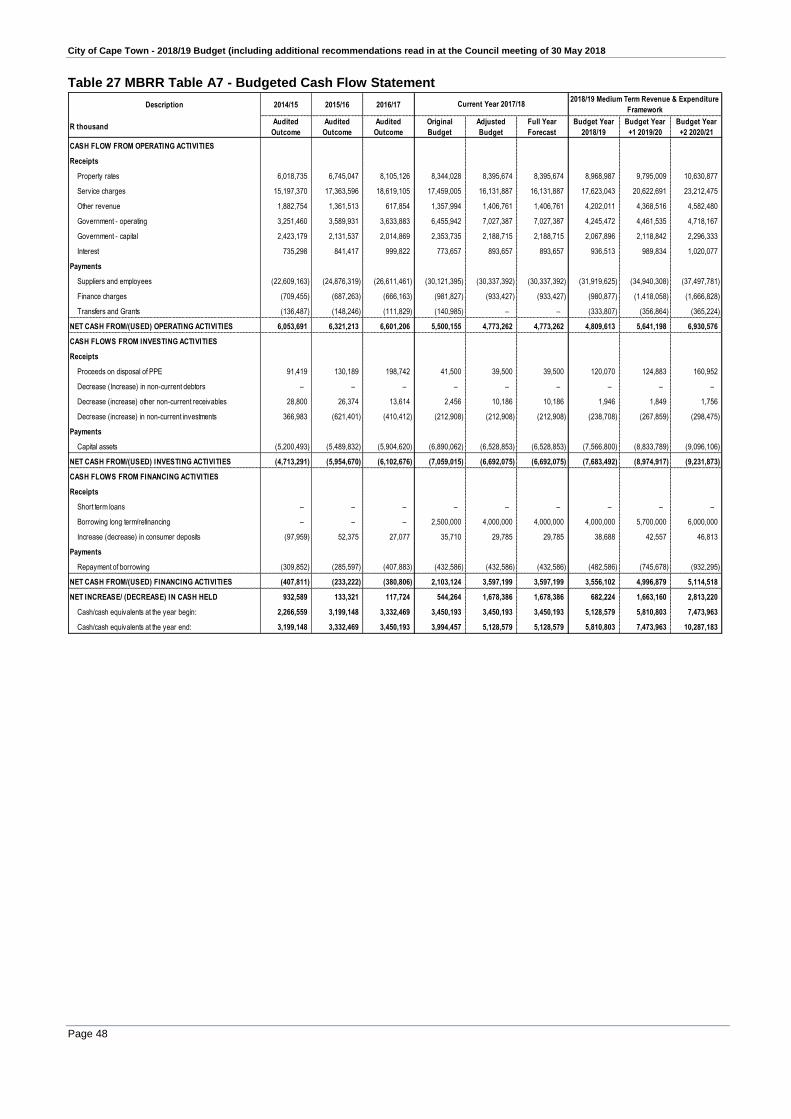
City of Cape Town - 2018/19 Budget (including additional recommendations read in at the Council meeting of 30 May 2018
Page 48
Table 27 MBRR Table A7 - Budgeted Cash Flow Statement
Description 2014/15 2015/16 2016/17
R thousandAudited
Outcome
Audited
Outcome
Audited
Outcome
Original
Budget
Adjusted
Budget
Full Year
Forecast
Budget Year
2018/19
Budget Year
+1 2019/20
Budget Year
+2 2020/21
CASH FLOW FROM OPERATING ACTIVITIES
Receipts
Property rates 6,018,735 6,745,047 8,105,126 8,344,028 8,395,674 8,395,674 8,968,987 9,795,009 10,630,877
Service charges 15,197,370 17,363,596 18,619,105 17,459,005 16,131,887 16,131,887 17,623,043 20,622,691 23,212,475
Other revenue 1,882,754 1,361,513 617,854 1,357,994 1,406,761 1,406,761 4,202,011 4,368,516 4,582,480
Government - operating 3,251,460 3,589,931 3,633,883 6,455,942 7,027,387 7,027,387 4,245,472 4,461,535 4,718,167
Government - capital 2,423,179 2,131,537 2,014,869 2,353,735 2,188,715 2,188,715 2,067,896 2,118,842 2,296,333
Interest 735,298 841,417 999,822 773,657 893,657 893,657 936,513 989,834 1,020,077
Payments
Suppliers and employees (22,609,163) (24,876,319) (26,611,461) (30,121,395) (30,337,392) (30,337,392) (31,919,625) (34,940,308) (37,497,781)
Finance charges (709,455) (687,263) (666,163) (981,827) (933,427) (933,427) (980,877) (1,418,058) (1,666,828)
Transfers and Grants (136,487) (148,246) (111,829) (140,985) – – (333,807) (356,864) (365,224)
NET CASH FROM/(USED) OPERATING ACTIVITIES 6,053,691 6,321,213 6,601,206 5,500,155 4,773,262 4,773,262 4,809,613 5,641,198 6,930,576
CASH FLOWS FROM INVESTING ACTIVITIES
Receipts
Proceeds on disposal of PPE 91,419 130,189 198,742 41,500 39,500 39,500 120,070 124,883 160,952
Decrease (Increase) in non-current debtors – – – – – – – – –
Decrease (increase) other non-current receivables 28,800 26,374 13,614 2,456 10,186 10,186 1,946 1,849 1,756
Decrease (increase) in non-current investments 366,983 (621,401) (410,412) (212,908) (212,908) (212,908) (238,708) (267,859) (298,475)
Payments
Capital assets (5,200,493) (5,489,832) (5,904,620) (6,890,062) (6,528,853) (6,528,853) (7,566,800) (8,833,789) (9,096,106)
NET CASH FROM/(USED) INVESTING ACTIVITIES (4,713,291) (5,954,670) (6,102,676) (7,059,015) (6,692,075) (6,692,075) (7,683,492) (8,974,917) (9,231,873)
CASH FLOWS FROM FINANCING ACTIVITIES
Receipts
Short term loans – – – – – – – – –
Borrowing long term/refinancing – – – 2,500,000 4,000,000 4,000,000 4,000,000 5,700,000 6,000,000
Increase (decrease) in consumer deposits (97,959) 52,375 27,077 35,710 29,785 29,785 38,688 42,557 46,813
Payments
Repayment of borrowing (309,852) (285,597) (407,883) (432,586) (432,586) (432,586) (482,586) (745,678) (932,295)
NET CASH FROM/(USED) FINANCING ACTIVITIES (407,811) (233,222) (380,806) 2,103,124 3,597,199 3,597,199 3,556,102 4,996,879 5,114,518
NET INCREASE/ (DECREASE) IN CASH HELD 932,589 133,321 117,724 544,264 1,678,386 1,678,386 682,224 1,663,160 2,813,220
Cash/cash equivalents at the year begin: 2,266,559 3,199,148 3,332,469 3,450,193 3,450,193 3,450,193 5,128,579 5,810,803 7,473,963
Cash/cash equivalents at the year end: 3,199,148 3,332,469 3,450,193 3,994,457 5,128,579 5,128,579 5,810,803 7,473,963 10,287,183
Current Year 2017/182018/19 Medium Term Revenue & Expenditure
Framework

City of Cape Town - 2018/19 Budget (including additional recommendations read in at the Council meeting of 30 May 2018
Page 49
Explanatory notes to Table A7 – Budgeted Cash Flow Statement 1. The table shows the cash and cash equivalents of the City during the 2018/19 MTREF.
2. For the 2018/19 MTREF the budget has been prepared to ensure adequate levels of working capital
representing cash and cash equivalents over the medium-term, with cash levels anticipated to
exceed R5 811 million by 2018/19 and increasing to R10 287 million by 2020/21.
3. The following assumptions were used in the preparation of the cash flow budget.
a. Revenue categories were reduced by the following percentages of the working capital bad
debtor provision:
Property rates 13.15%
Electricity 3.29%
Water 23.01%
Sanitation 16.43%
Solid Waste 3.29%
Rental income 6.57%
Fines 34.26%
b. The revised collection rates as a result of the above calculation are:
Property rates 96%
Electricity 99%
Water 81%
Sanitation 73%
Solid waste 90%
Rental income 48.4%
Fines 20%
c. Fuel Levy revenue was excluded from the ‘Government – operating’ category and included
under the ‘Other revenue’ category.
d. The assumptions for expenditure is 100% spend with the exception of capital, which is
calculated at 90% spend.

City of Cape Town - 2018/19 Budget (including additional recommendations read in at the Council meeting of 30 May 2018
Page 50
Table 28 MBRR Table A8 - Cash Backed Reserves / Accumulated Surplus Reconciliation
Description 2014/15 2015/16 2016/17
R thousandAudited
Outcome
Audited
Outcome
Audited
Outcome
Original
Budget
Adjusted
Budget
Full Year
Forecast
Budget Year
2018/19
Budget Year +1
2019/20
Budget Year +2
2020/21
Cash and investments available
Cash/cash equivalents at the year end 3,199,148 3,332,469 3,450,193 3,994,457 5,128,579 5,128,579 5,810,803 7,473,963 10,287,183
Other current investments > 90 days 1,746,347 2,155,177 1,654,114 2,709,393 1,867,022 1,867,022 1,628,314 1,360,455 1,061,979
Non current assets - Investments 3,753,617 3,966,188 4,877,663 3,842,589 4,664,755 4,664,755 4,903,463 5,171,322 5,469,798
Cash and investments available: 8,699,112 9,453,834 9,981,970 10,546,439 11,660,356 11,660,356 12,342,580 14,005,740 16,818,960
Application of cash and investments
Unspent conditional transfers 1,527,445 1,199,955 1,054,374 680,263 1,740,079 1,740,079 1,460,147 1,772,337 2,112,983
Unspent borrowing – – – – – – – – –
Statutory requirements – – – – – – – – –
Other working capital requirements 281,584 324,693 13,061 1,979,259 2,017,680 1,967,679 1,162,194 335,103 (575,021)
Other provisions – – – – – – 400,000 400,000 400,000
Long term investments committed 1,788,477 1,968,829 2,051,869 2,265,047 2,265,047 2,265,047 2,503,755 2,771,615 3,070,090
Reserves to be backed by cash/investments 2,790,264 3,004,435 3,773,185 3,100,264 3,421,363 3,421,363 3,426,132 4,348,613 5,866,327
Total Application of cash and investments: 6,387,770 6,497,912 6,892,489 8,024,834 9,444,169 9,394,168 8,952,229 9,627,668 10,874,379
Surplus(shortfall) 2,311,342 2,955,922 3,089,481 2,521,605 2,216,187 2,266,188 3,390,351 4,378,072 5,944,581
Current Year 2017/182018/19 Medium Term Revenue & Expenditure
Framework
Explanatory notes to Table A8 – Cash Backed Reserves/Accumulated Surplus Reconciliation
1. The cash backed reserves/accumulated surplus reconciliation is aligned to the requirements of
MFMA Circular 42 – Funding a Municipal Budget.
2. In essence the table evaluates the funding levels of the budget by firstly forecasting the cash and
investments at year end and secondly reconciling the available funding to the
liabilities/commitments that exist.
3. The outcome of this exercise would either be a surplus or deficit. A deficit would indicate that the
applications exceed the cash and investments available and would be indicative of non-compliance
with the MFMA requirements that the municipality’s budget must be “funded”.
4. From the table it can be seen that the City remains in a surplus net cash flow position for the period
2018/19 to 2020/21.
5. Considering the requirements of section 18 of the MFMA, it can be concluded that the 2018/19
MTREF is fully funded.
6. As part of the budgeting and planning guidelines that informed the compilation of the 2018/19
MTREF, the end objective of the medium-term framework was to ensure the budget is
funded/aligned to section 18 of the MFMA.
7. Table A8 reflects a surplus of R3 390 million in 2018/19 increasing to R5 945 million by 2020/21.

City of Cape Town - 2018/19 Budget (including additional recommendations read in at the Council meeting of 30 May 2018
Page 51
Table 29 MBRR Table A9 - Asset Management
Description 2014/15 2015/16 2016/17
R thousandAudited
Outcome
Audited
Outcome
Audited
Outcome
Original
Budget
Adjusted
Budget
Full Year
Forecast
Budget Year
2018/19
Budget Year
+1 2019/20
Budget Year
+2 2020/21
CAPITAL EXPENDITURE
Total New Assets 2,886,738 2,820,243 3,006,491 3,764,497 4,538,164 3,438,260 4,718,832 5,544,098 5,669,396
Roads Infrastructure 616,988 665,367 897,860 956,768 648,443 828,293 643,094 705,135 717,212
Storm water Infrastructure 200 2,803 3,845 124,492 109,122 3,888 94,818 121,371 133,515
Electrical Infrastructure 447,696 509,555 555,112 567,420 488,776 463,321 410,532 568,545 658,971
Water Supply Infrastructure 136,191 143,479 208,170 518,930 1,659,910 689,933 1,291,185 1,677,325 2,041,734
Sanitation Infrastructure 103,850 205,274 154,686 120,422 240,794 62,489 749,890 1,100,724 895,080
Solid Waste Infrastructure 138,914 68,991 41,370 194,077 80,929 74,854 168,000 290,100 417,140
Information and Communication Infrastructure 133,046 182,718 131,324 189,528 157,583 163,082 240,406 200,427 197,980
Infrastructure 1,576,886 1,778,186 1,992,367 2,671,635 3,385,556 2,285,861 3,597,926 4,663,627 5,061,633
Community Facilities 116,047 209,143 135,821 272,744 231,164 236,506 302,827 208,624 164,952
Sport and Recreation Facilities 2,131 1,626 10 350 1,243 1,243 180 – –
Community Assets 118,178 210,769 135,831 273,094 232,407 237,749 303,007 208,624 164,952
Heritage Assets – – – – – – – – –
Revenue Generating – – 81 – – – – – –
Investment properties – – 81 – – – – – –
Operational Buildings 45,365 100,642 216,943 216,517 202,058 205,799 166,287 68,007 51,250
Housing 14,364 44,823 3,255 66,041 13,628 13,452 54,240 128,060 120,040
Other Assets 59,728 145,465 220,198 282,558 215,686 219,251 220,527 196,066 171,290
Licences and Rights – 495 500 2,000 9,792 4,090 16,765 63,075 34,965
Intangible Assets – 495 500 2,000 9,792 4,090 16,765 63,075 34,965
Computer Equipment 71,679 122,051 144,155 207,103 237,458 228,897 105,987 132,906 90,794
Furniture and Office Equipment 252,027 306,688 133,346 78,378 129,573 132,338 123,168 87,355 72,637
Machinery and Equipment 42,245 97,819 152,897 128,188 132,851 135,006 34,547 30,900 35,841
Transport Assets 349,210 105,449 62,793 51,970 193,141 193,117 108,906 51,544 37,284
Land 416,784 53,319 164,323 69,570 1,700 1,950 208,000 110,000 –
Total Renewal of Existing Assets 2,365,004 2,669,591 1,587,484 1,423,658 1,609,224 1,581,903 1,883,731 2,291,309 2,561,781
Roads Infrastructure 278,810 435,911 254,173 183,678 154,579 175,429 220,181 213,908 254,748
Storm water Infrastructure 18,768 44,902 27,082 48,495 35,102 9,189 30,275 22,400 24,000
Electrical Infrastructure 358,552 429,547 305,935 461,479 366,525 336,630 425,796 669,300 673,200
Water Supply Infrastructure 306,728 401,675 318,909 275,892 448,625 457,085 433,000 475,000 561,000
Sanitation Infrastructure 348,155 467,650 182,065 79,595 98,384 101,233 339,750 564,500 653,250
Solid Waste Infrastructure 18,755 87,176 1,059 4,000 1,000 730 5,280 – 10,000
Information and Communication Infrastructure – – 138 1,500 5,007 6,537 1,560 1,500 2,650
Infrastructure 1,329,768 1,866,859 1,089,361 1,054,639 1,109,222 1,086,833 1,455,842 1,946,608 2,178,848
Community Facilities 94,584 93,572 3,493 40,373 47,815 12,321 5,522 800 100
Sport and Recreation Facilities 59,695 37,166 – – 424 439 – – –
Community Assets 154,279 130,739 3,493 40,373 48,239 12,759 5,522 800 100
Heritage Assets 514 6,547 – 650 607 607 1,800 1,800 2,000
Operational Buildings 224,296 157,526 83,740 10,150 23,461 23,977 16,017 14,567 97,267
Housing 345,863 124,428 49,186 9,180 20,575 20,575 76,583 42,134 –
Other Assets 570,159 281,954 132,926 19,330 44,036 44,552 92,601 56,701 97,267
Licences and Rights – – – 2,500 9,500 2,500 7,000 7,000 7,000
Intangible Assets – – – 2,500 9,500 2,500 7,000 7,000 7,000
Computer Equipment 112,064 98,753 70,328 75,080 72,861 80,085 62,240 64,660 53,312
Furniture and Office Equipment 49,270 47,862 13,047 18,658 18,775 15,180 17,925 20,798 17,424
Machinery and Equipment 20,369 17,207 6,318 29,713 53,904 56,138 29,100 11,604 13,350
Transport Assets 128,582 219,670 272,011 182,714 252,081 283,249 211,700 181,337 192,479
Current Year 2017/182018/19 Medium Term Revenue &
Expenditure Framework
Table continues on next page
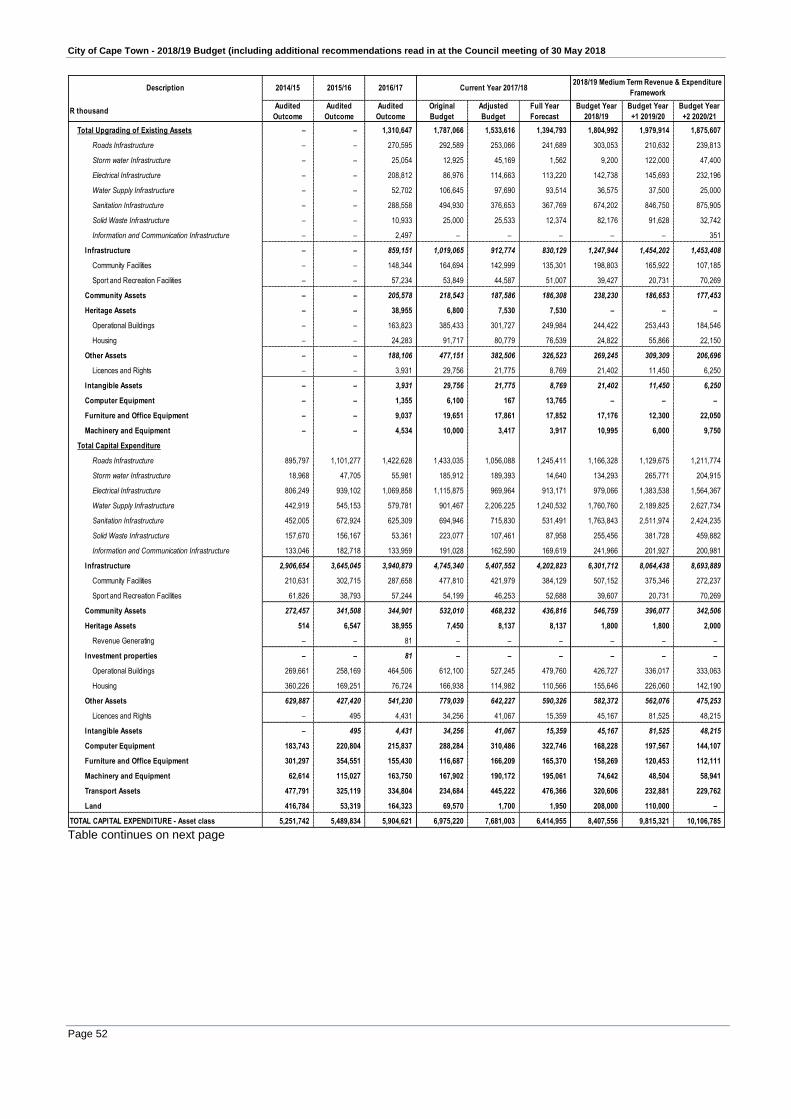
City of Cape Town - 2018/19 Budget (including additional recommendations read in at the Council meeting of 30 May 2018
Page 52
Description 2014/15 2015/16 2016/17
R thousandAudited
Outcome
Audited
Outcome
Audited
Outcome
Original
Budget
Adjusted
Budget
Full Year
Forecast
Budget Year
2018/19
Budget Year
+1 2019/20
Budget Year
+2 2020/21
Total Upgrading of Existing Assets – – 1,310,647 1,787,066 1,533,616 1,394,793 1,804,992 1,979,914 1,875,607
Roads Infrastructure – – 270,595 292,589 253,066 241,689 303,053 210,632 239,813
Storm water Infrastructure – – 25,054 12,925 45,169 1,562 9,200 122,000 47,400
Electrical Infrastructure – – 208,812 86,976 114,663 113,220 142,738 145,693 232,196
Water Supply Infrastructure – – 52,702 106,645 97,690 93,514 36,575 37,500 25,000
Sanitation Infrastructure – – 288,558 494,930 376,653 367,769 674,202 846,750 875,905
Solid Waste Infrastructure – – 10,933 25,000 25,533 12,374 82,176 91,628 32,742
Information and Communication Infrastructure – – 2,497 – – – – – 351
Infrastructure – – 859,151 1,019,065 912,774 830,129 1,247,944 1,454,202 1,453,408
Community Facilities – – 148,344 164,694 142,999 135,301 198,803 165,922 107,185
Sport and Recreation Facilities – – 57,234 53,849 44,587 51,007 39,427 20,731 70,269
Community Assets – – 205,578 218,543 187,586 186,308 238,230 186,653 177,453
Heritage Assets – – 38,955 6,800 7,530 7,530 – – –
Operational Buildings – – 163,823 385,433 301,727 249,984 244,422 253,443 184,546
Housing – – 24,283 91,717 80,779 76,539 24,822 55,866 22,150
Other Assets – – 188,106 477,151 382,506 326,523 269,245 309,309 206,696
Licences and Rights – – 3,931 29,756 21,775 8,769 21,402 11,450 6,250
Intangible Assets – – 3,931 29,756 21,775 8,769 21,402 11,450 6,250
Computer Equipment – – 1,355 6,100 167 13,765 – – –
Furniture and Office Equipment – – 9,037 19,651 17,861 17,852 17,176 12,300 22,050
Machinery and Equipment – – 4,534 10,000 3,417 3,917 10,995 6,000 9,750
Total Capital Expenditure
Roads Infrastructure 895,797 1,101,277 1,422,628 1,433,035 1,056,088 1,245,411 1,166,328 1,129,675 1,211,774
Storm water Infrastructure 18,968 47,705 55,981 185,912 189,393 14,640 134,293 265,771 204,915
Electrical Infrastructure 806,249 939,102 1,069,858 1,115,875 969,964 913,171 979,066 1,383,538 1,564,367
Water Supply Infrastructure 442,919 545,153 579,781 901,467 2,206,225 1,240,532 1,760,760 2,189,825 2,627,734
Sanitation Infrastructure 452,005 672,924 625,309 694,946 715,830 531,491 1,763,843 2,511,974 2,424,235
Solid Waste Infrastructure 157,670 156,167 53,361 223,077 107,461 87,958 255,456 381,728 459,882
Information and Communication Infrastructure 133,046 182,718 133,959 191,028 162,590 169,619 241,966 201,927 200,981
Infrastructure 2,906,654 3,645,045 3,940,879 4,745,340 5,407,552 4,202,823 6,301,712 8,064,438 8,693,889
Community Facilities 210,631 302,715 287,658 477,810 421,979 384,129 507,152 375,346 272,237
Sport and Recreation Facilities 61,826 38,793 57,244 54,199 46,253 52,688 39,607 20,731 70,269
Community Assets 272,457 341,508 344,901 532,010 468,232 436,816 546,759 396,077 342,506
Heritage Assets 514 6,547 38,955 7,450 8,137 8,137 1,800 1,800 2,000
Revenue Generating – – 81 – – – – – –
Investment properties – – 81 – – – – – –
Operational Buildings 269,661 258,169 464,506 612,100 527,245 479,760 426,727 336,017 333,063
Housing 360,226 169,251 76,724 166,938 114,982 110,566 155,646 226,060 142,190
Other Assets 629,887 427,420 541,230 779,039 642,227 590,326 582,372 562,076 475,253
Licences and Rights – 495 4,431 34,256 41,067 15,359 45,167 81,525 48,215
Intangible Assets – 495 4,431 34,256 41,067 15,359 45,167 81,525 48,215
Computer Equipment 183,743 220,804 215,837 288,284 310,486 322,746 168,228 197,567 144,107
Furniture and Office Equipment 301,297 354,551 155,430 116,687 166,209 165,370 158,269 120,453 112,111
Machinery and Equipment 62,614 115,027 163,750 167,902 190,172 195,061 74,642 48,504 58,941
Transport Assets 477,791 325,119 334,804 234,684 445,222 476,366 320,606 232,881 229,762
Land 416,784 53,319 164,323 69,570 1,700 1,950 208,000 110,000 –
TOTAL CAPITAL EXPENDITURE - Asset class 5,251,742 5,489,834 5,904,621 6,975,220 7,681,003 6,414,955 8,407,556 9,815,321 10,106,785
Current Year 2017/182018/19 Medium Term Revenue & Expenditure
Framework
Table continues on next page

City of Cape Town - 2018/19 Budget (including additional recommendations read in at the Council meeting of 30 May 2018
Page 53
Description 2014/15 2015/16 2016/17
R thousandAudited
Outcome
Audited
Outcome
Audited
Outcome
Original
Budget
Adjusted
Budget
Full Year
Forecast
Budget Year
2018/19
Budget Year +1
2019/20
Budget Year +2
2020/21
ASSET REGISTER SUMMARY - PPE (WDV)
Roads Infrastructure 5,407,043 5,801,545 7,848,021 7,350,826 8,662,678 8,662,678 9,415,671 10,096,569 10,818,637
Storm water Infrastructure 620,126 673,066 734,352 994,374 870,338 870,338 944,325 1,144,013 1,285,062
Electrical Infrastructure 5,309,846 6,128,665 6,941,124 7,786,614 7,649,556 7,649,556 8,328,033 9,365,031 10,545,953
Water Supply Infrastructure 1,943,653 2,286,374 2,640,397 3,312,937 4,532,731 4,532,731 5,942,405 7,633,504 9,688,877
Sanitation Infrastructure 2,182,565 2,629,979 2,876,204 3,542,502 3,206,469 3,206,469 4,624,837 6,746,001 8,715,726
Solid Waste Infrastructure 496,906 724,955 744,567 937,173 780,119 780,119 974,112 1,286,514 1,673,305
Information and Communication Infrastructure 2,435,659 3,054,072 3,815,860 3,200,737 3,938,357 3,938,357 4,133,382 4,280,904 4,426,728
Infrastructure 18,395,798 21,298,655 25,600,525 27,125,163 29,640,250 29,640,250 34,362,764 40,552,537 47,154,288
Community Facilities 2,487,054 2,570,657 4,154,769 2,491,982 4,464,953 4,464,953 4,843,527 5,088,067 5,224,319
Sport and Recreation Facilities 4,136,786 3,916,192 3,792,476 3,807,667 3,617,884 3,617,884 3,437,004 3,242,751 3,102,425
Community Assets 6,623,840 6,486,848 7,947,245 6,299,648 8,082,837 8,082,837 8,280,531 8,330,817 8,326,744
Heritage Assets 9,062 9,049 8,904 9,049 8,904 8,904 8,904 8,904 8,904
Revenue Generating 40,633 69,959 68,247 68,242 66,533 66,533 64,819 63,106 61,392
Non-revenue Generating 548,749 518,232 518,180 518,232 518,180 518,180 518,180 518,180 518,180
Investment properties 589,382 588,191 586,427 586,474 584,713 584,713 582,999 581,286 579,572
Operational Buildings 2,259,328 3,087,639 687,614 3,861,856 1,039,890 1,039,890 1,284,020 1,436,483 1,588,979
Housing 1,736,863 1,993,969 2,132,053 2,135,419 2,143,924 2,143,924 2,192,123 2,303,145 2,328,727
Other Assets 3,996,190 5,081,608 2,819,667 5,997,275 3,183,814 3,183,814 3,476,143 3,739,627 3,917,706
Licences and Rights 708,383 629,162 678,871 522,272 529,946 529,946 450,982 412,429 342,691
Intangible Assets 708,383 629,162 678,871 522,272 529,946 529,946 450,982 412,429 342,691
Computer Equipment 617,046 589,188 572,894 888,975 666,843 666,843 603,172 559,727 470,277
Furniture and Office Equipment 360,841 373,843 366,760 523,635 411,431 411,431 441,147 428,300 420,537
Machinery and Equipment 246,437 248,211 635,507 477,153 874,083 874,083 846,578 770,249 702,035
Transport Assets 1,939,489 2,040,316 1,439,906 2,272,442 1,449,002 1,449,002 1,420,343 1,287,193 1,144,115
Land 1,263,463 773,875 995,081 1,064,651 996,781 996,781 1,127,881 1,162,223 1,088,172
TOTAL ASSET REGISTER SUMMARY - PPE (WDV) 34,749,931 38,118,947 41,651,787 45,766,736 46,428,603 46,428,603 51,601,445 57,833,292 64,155,040
EXPENDITURE OTHER ITEMS
Depreciation 1,917,134 2,117,336 2,313,471 2,574,607 2,520,137 2,520,137 2,747,836 3,022,550 3,205,646
Repairs and Maintenance by Asset Class 3,003,158 3,338,995 3,761,297 4,034,293 3,753,714 3,767,172 3,974,465 4,281,247 4,619,102
Roads Infrastructure 690,603 592,642 609,310 664,923 656,419 631,419 671,164 700,536 746,421
Storm water Infrastructure – – – – – – – – –
Electrical Infrastructure 467,531 512,940 504,116 523,507 503,480 503,180 536,787 571,679 609,122
Water Supply Infrastructure 413,630 455,983 482,019 421,887 396,382 396,382 548,620 621,440 698,473
Sanitation Infrastructure 389,040 424,040 447,780 418,866 366,166 366,166 401,043 465,225 515,041
Solid Waste Infrastructure 1,758 2,774 2,497 2,303 3,850 3,850 4,104 4,371 4,657
Infrastructure 1,962,562 1,988,379 2,045,722 2,031,486 1,926,297 1,900,997 2,161,718 2,363,252 2,573,715
Community Facilities 78,026 85,482 115,109 100,442 94,820 96,620 100,533 106,908 113,912
Sport and Recreation Facilities 241,286 301,035 381,822 447,605 390,717 390,717 244,273 260,160 277,215
Community Assets 319,312 386,517 496,931 548,047 485,537 487,337 344,806 367,068 391,126
Heritage Assets 986 461 1,647 1,812 1,811 1,811 1,928 2,053 2,188
Revenue Generating 11,083 26,566 19,001 19,800 136 148 16 17 18
Non-revenue Generating – – – – 12,740 12,740 20,694 22,040 23,483
Investment properties 11,083 26,566 19,001 19,800 12,877 12,888 20,710 22,057 23,501
Operational Buildings 77,511 89,710 140,548 144,517 144,999 150,183 177,353 185,650 199,609
Housing – – – – – – – – –
Other Assets 77,511 89,710 140,548 144,517 144,999 150,183 177,353 185,650 199,609
Computer Equipment 117,859 144,340 179,935 312,785 258,652 258,662 269,549 277,899 296,120
Furniture and Office Equipment 360,714 354,833 424,463 504,006 502,156 508,910 551,321 587,095 625,455
Machinery and Equipment – – – – – – – – –
Transport Assets 153,131 348,190 453,049 471,840 421,385 446,385 447,079 476,172 507,387
TOTAL EXPENDITURE OTHER ITEMS 4,920,292 5,456,330 6,074,768 6,608,900 6,273,852 6,287,310 6,722,300 7,303,797 7,824,748
Renewal and upgrading of Existing Assets as % of total capex 45.0% 48.6% 49.1% 46.0% 40.9% 46.4% 43.9% 43.5% 43.9%
Renewal and upgrading of Existing Assets as % of deprecn 123.4% 126.1% 125.3% 124.7% 124.7% 118.1% 134.2% 141.3% 138.4%
R&M as a % of PPE 9.0% 9.1% 9.3% 9.0% 8.3% 8.3% 7.9% 7.5% 7.3%
Renewal and upgrading and R&M as a % of PPE 15.0% 16.0% 16.0% 16.0% 15.0% 15.0% 15.0% 15.0% 14.0%
Current Year 2017/182018/19 Medium Term Revenue & Expenditure
Framework

City of Cape Town - 2018/19 Budget (including additional recommendations read in at the Council meeting of 30 May 2018
Page 54
Explanatory notes to Table A9 – Asset Management 1. Table A9 provides an overview of municipal capital allocations to building new assets and renewal
of existing assets, as well as spending on repairs and maintenance by asset class.
2. The section on ‘Upgrading of Existing Assets’ in table A9 was introduced via Version 6.1 of the
MBRR Schedule A - refer NT Budget Circular 85 (dated 9 December 2016). Records older than
2016/17 cannot be split into this category as the indicator does not exist on older records.
3. The following chart provides an analysis between depreciation (including capital asset impairment)
and operational repairs and maintenance over the MTREF. It highlights the City’s strategy to
address the maintenance backlog. To ensure compliance the City will embark on an asset creation
project which will be finalised over a couple of years.
Figure 5 Depreciation in relation to repairs and maintenance for previous years and over the MTREF
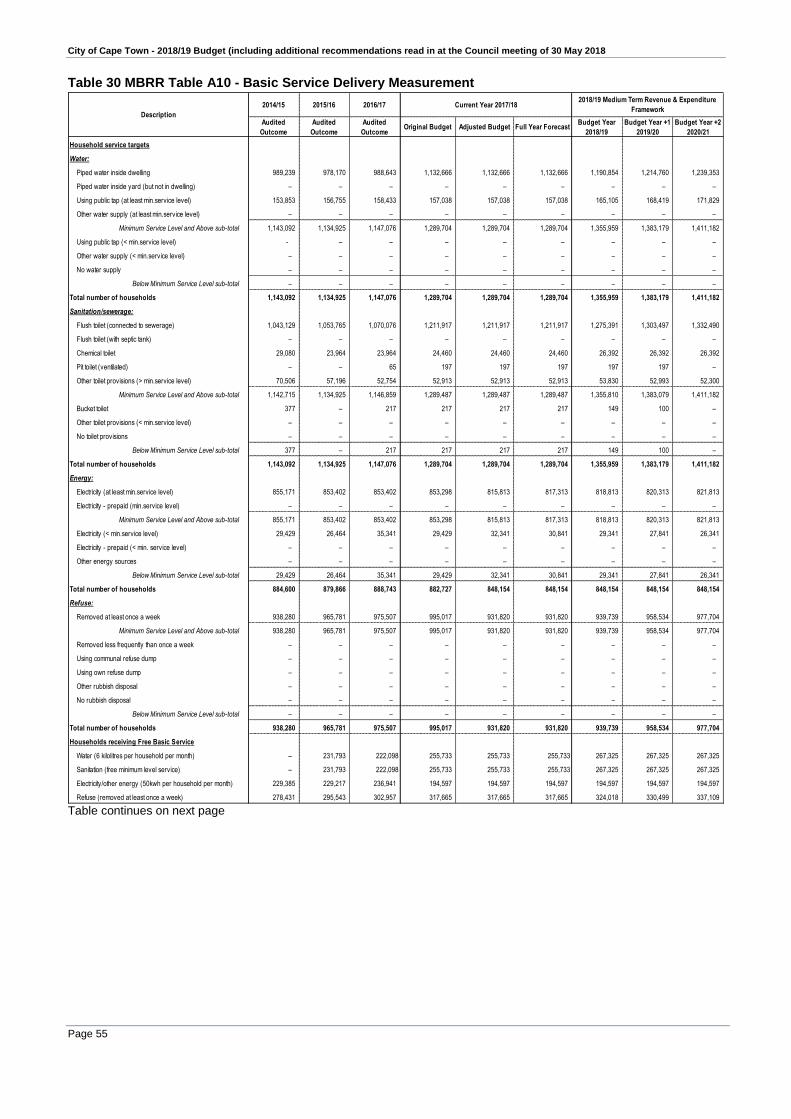
City of Cape Town - 2018/19 Budget (including additional recommendations read in at the Council meeting of 30 May 2018
Page 55
Table 30 MBRR Table A10 - Basic Service Delivery Measurement
2014/15 2015/16 2016/17
Audited
Outcome
Audited
Outcome
Audited
OutcomeOriginal Budget Adjusted Budget Full Year Forecast
Budget Year
2018/19
Budget Year +1
2019/20
Budget Year +2
2020/21
Household service targets
Water:
Piped water inside dwelling 989,239 978,170 988,643 1,132,666 1,132,666 1,132,666 1,190,854 1,214,760 1,239,353
Piped water inside yard (but not in dwelling) – – – – – – – – –
Using public tap (at least min.service level) 153,853 156,755 158,433 157,038 157,038 157,038 165,105 168,419 171,829
Other water supply (at least min.service level) – – – – – – – – –
Minimum Service Level and Above sub-total 1,143,092 1,134,925 1,147,076 1,289,704 1,289,704 1,289,704 1,355,959 1,383,179 1,411,182
Using public tap (< min.service level) - – – – – – – – –
Other water supply (< min.service level) – – – – – – – – –
No water supply – – – – – – – – –
Below Minimum Service Level sub-total – – – – – – – – –
Total number of households 1,143,092 1,134,925 1,147,076 1,289,704 1,289,704 1,289,704 1,355,959 1,383,179 1,411,182
Sanitation/sewerage:
Flush toilet (connected to sewerage) 1,043,129 1,053,765 1,070,076 1,211,917 1,211,917 1,211,917 1,275,391 1,303,497 1,332,490
Flush toilet (with septic tank) – – – – – – – – –
Chemical toilet 29,080 23,964 23,964 24,460 24,460 24,460 26,392 26,392 26,392
Pit toilet (ventilated) – – 65 197 197 197 197 197 –
Other toilet provisions (> min.service level) 70,506 57,196 52,754 52,913 52,913 52,913 53,830 52,993 52,300
Minimum Service Level and Above sub-total 1,142,715 1,134,925 1,146,859 1,289,487 1,289,487 1,289,487 1,355,810 1,383,079 1,411,182
Bucket toilet 377 – 217 217 217 217 149 100 –
Other toilet provisions (< min.service level) – – – – – – – – –
No toilet provisions – – – – – – – – –
Below Minimum Service Level sub-total 377 – 217 217 217 217 149 100 –
Total number of households 1,143,092 1,134,925 1,147,076 1,289,704 1,289,704 1,289,704 1,355,959 1,383,179 1,411,182
Energy:
Electricity (at least min.service level) 855,171 853,402 853,402 853,298 815,813 817,313 818,813 820,313 821,813
Electricity - prepaid (min.service level) – – – – – – – – –
Minimum Service Level and Above sub-total 855,171 853,402 853,402 853,298 815,813 817,313 818,813 820,313 821,813
Electricity (< min.service level) 29,429 26,464 35,341 29,429 32,341 30,841 29,341 27,841 26,341
Electricity - prepaid (< min. service level) – – – – – – – – –
Other energy sources – – – – – – – – –
Below Minimum Service Level sub-total 29,429 26,464 35,341 29,429 32,341 30,841 29,341 27,841 26,341
Total number of households 884,600 879,866 888,743 882,727 848,154 848,154 848,154 848,154 848,154
Refuse:
Removed at least once a week 938,280 965,781 975,507 995,017 931,820 931,820 939,739 958,534 977,704
Minimum Service Level and Above sub-total 938,280 965,781 975,507 995,017 931,820 931,820 939,739 958,534 977,704
Removed less frequently than once a week – – – – – – – – –
Using communal refuse dump – – – – – – – – –
Using own refuse dump – – – – – – – – –
Other rubbish disposal – – – – – – – – –
No rubbish disposal – – – – – – – – –
Below Minimum Service Level sub-total – – – – – – – – –
Total number of households 938,280 965,781 975,507 995,017 931,820 931,820 939,739 958,534 977,704
Households receiving Free Basic Service
Water (6 kilolitres per household per month) – 231,793 222,098 255,733 255,733 255,733 267,325 267,325 267,325
Sanitation (free minimum level service) – 231,793 222,098 255,733 255,733 255,733 267,325 267,325 267,325
Electricity/other energy (50kwh per household per month) 229,385 229,217 236,941 194,597 194,597 194,597 194,597 194,597 194,597
Refuse (removed at least once a week) 278,431 295,543 302,957 317,665 317,665 317,665 324,018 330,499 337,109
Description
Current Year 2017/182018/19 Medium Term Revenue & Expenditure
Framework
Table continues on next page
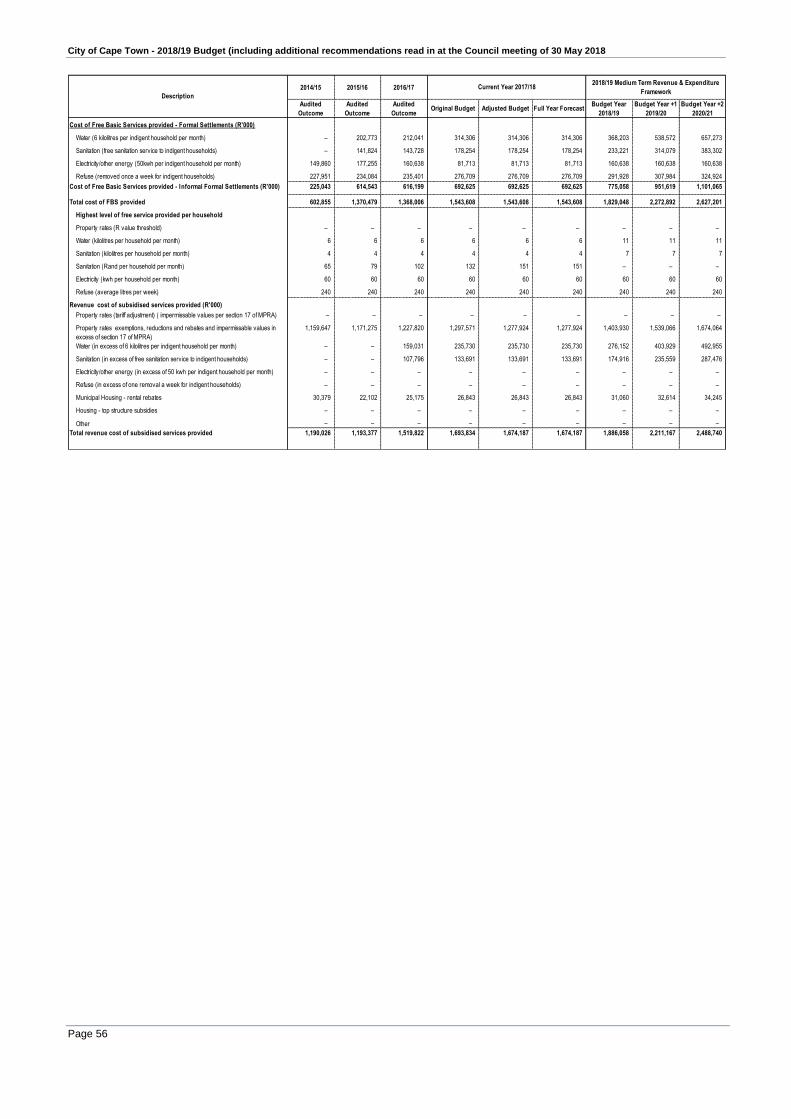
City of Cape Town - 2018/19 Budget (including additional recommendations read in at the Council meeting of 30 May 2018
Page 56
2014/15 2015/16 2016/17
Audited
Outcome
Audited
Outcome
Audited
OutcomeOriginal Budget Adjusted Budget Full Year Forecast
Budget Year
2018/19
Budget Year +1
2019/20
Budget Year +2
2020/21
Cost of Free Basic Services provided - Formal Settlements (R'000)
Water (6 kilolitres per indigent household per month) – 202,773 212,041 314,306 314,306 314,306 368,203 538,572 657,273
Sanitation (free sanitation service to indigent households) – 141,824 143,728 178,254 178,254 178,254 233,221 314,079 383,302
Electricity/other energy (50kwh per indigent household per month) 149,860 177,255 160,638 81,713 81,713 81,713 160,638 160,638 160,638
Refuse (removed once a week for indigent households) 227,951 234,084 235,401 276,709 276,709 276,709 291,928 307,984 324,924
Cost of Free Basic Services provided - Informal Formal Settlements (R'000) 225,043 614,543 616,199 692,625 692,625 692,625 775,058 951,619 1,101,065
Total cost of FBS provided 602,855 1,370,479 1,368,006 1,543,608 1,543,608 1,543,608 1,829,048 2,272,892 2,627,201
Highest level of free service provided per household
Property rates (R value threshold) – – – – – – – – –
Water (kilolitres per household per month) 6 6 6 6 6 6 11 11 11
Sanitation (kilolitres per household per month) 4 4 4 4 4 4 7 7 7
Sanitation (Rand per household per month) 65 79 102 132 151 151 – – –
Electricity (kwh per household per month) 60 60 60 60 60 60 60 60 60
Refuse (average litres per week) 240 240 240 240 240 240 240 240 240
Revenue cost of subsidised services provided (R'000)
Property rates (tariff adjustment) ( impermissable values per section 17 of MPRA) – – – – – – – – –
Property rates exemptions, reductions and rebates and impermissable values in
excess of section 17 of MPRA)
1,159,647 1,171,275 1,227,820 1,297,571 1,277,924 1,277,924 1,403,930 1,539,066 1,674,064
Water (in excess of 6 kilolitres per indigent household per month) – – 159,031 235,730 235,730 235,730 276,152 403,929 492,955
Sanitation (in excess of free sanitation service to indigent households) – – 107,796 133,691 133,691 133,691 174,916 235,559 287,476
Electricity/other energy (in excess of 50 kwh per indigent household per month) – – – – – – – – –
Refuse (in excess of one removal a week for indigent households) – – – – – – – – –
Municipal Housing - rental rebates 30,379 22,102 25,175 26,843 26,843 26,843 31,060 32,614 34,245
Housing - top structure subsidies – – – – – – – – –
Other – – – – – – – – –
Total revenue cost of subsidised services provided 1,190,026 1,193,377 1,519,822 1,693,834 1,674,187 1,674,187 1,886,058 2,211,167 2,488,740
Description
Current Year 2017/182018/19 Medium Term Revenue & Expenditure
Framework

City of Cape Town - 2018/19 Budget (including additional recommendations read in at the Council meeting of 30 May 2018
Page 57
Explanatory notes to Table A10 – Basic Service Delivery Measurement 1. Table A10 provides an overview of service delivery levels, including backlogs (below minimum
service level), for each of the main services.
2. The City is persistently striving to eradicate backlogs. The City’s backlog status are as follows:
a) Water services: Cape Town’s population, both formal and informal settlements, receives
potable water in accordance with the National minimum standards as required by the Water
Services Act 108 (of 1997).
b) Sanitation services: Cape Town’s population, both formal and informal settlements, receives
sanitation services in accordance with the National minimum standards. Funding is still
provided to further improve the service levels in Informal Settlements in line with the City’s
strategy. The bucket toilet value of 149 households reflected in the ‘below minimum standards’
category in the 2018/19 financial year is not seen as a backlog as these households using the
bucket system do so despite being offered and encouraged to use alternative sanitation
services which are available and accessible. It was intended to remove the remaining bucket
systems in 2015/16, however it did not realise due to various challenges which included
community resistance. Some of the 25ℓ bucket toilets could be removed, bringing the total down
from 377 during 2015 to the current 149. Initiatives to remove the remaining ones are ongoing,
including a settlement upgrade as part of a new housing development project.
c) Electricity services: The electrification strategy is to reduce the backlog by 1 500 annually over
the 2018/19 MTREF.
d) Refuse services: This service does not have any backlogs.
3. The increase in the number of households receiving free basic services increase the cost for
providing the services. The associated cost of providing free basic services is projected to escalate
from R1 829 million in 2018/19 to R2 627 million in 2020/21.
4. The following assumptions are applied when determining the number of households per service:
a) Water & Sanitation
The number of households is based on the StatsSA 2017 Mid-Year Estimates.
b) Energy
The City supplies only part of the metro and provides electricity connections irrespective of the
number of households.
c) Refuse
The number of households is based on a formal property count of the actual number of
households that requests this service.
City of Cape Town - 2018/19 Budget (including additional recommendations read in at the Council meeting of 30 May 2018
Page 58
Part 2 – Supporting Documentation
2.1 Overview of annual budget process
2.1.1 Mayoral oversight and responsibility
Section 53 of the MFMA requires the Mayor of a municipality to provide general political guidance over
the budget process and the priorities that guide the preparation of the budget. In addition, Regulation
4 of the MBRR states that:
1) The mayor of a municipality must establish a budget steering committee to provide technical
assistance to the mayor in discharging the responsibilities set out in section 53 of the Act.
2) The steering committee must consist of at least the following persons:
a) the councillor responsible for financial matters;
b) the municipal manager;
c) the chief financial officer;
d) the senior managers responsible for at least the three largest votes in the municipality;
e) the manager responsible for budgeting;
f) the manager responsible for planning; and
g) any technical experts on infrastructure.
The City has an established Budget Steering Committee (BSC) that embodies all the requirements as
set out in the MFMA and MBRR. In addition, the City established a Budget Strategy Committee (BSM)
in 2013 whose purpose is to provide strategic guidance and ensure that the budget is aligned to the
City’s strategies.
2.1.2 Budget process overview
Section 21 of the MFMA requires the Mayor to table a time schedule, which sets out the process to
draft the IDP and prepare the budget, ten months before the start of the new financial year. The IDP-
and budget cycle time schedule was tabled at Council on 30 May 2017.
The 2017/18 financial year heralded a shift in focus by the City as Cape Town experiences its worst
drought in 100 years. Although the Water & Sanitation department designed its water tariffs to
discourage high water usage, not all initiatives were taken into account or envisaged when compiling
the 2017/18 budget. The 2017/18 financial year therefore focused on securing alternative water
sources and restricting water demand as outlined in the City’s New Water Plan. This required the
reprioritisation of the City’s 2017/18 budget to accommodate its requirements and remains the main
theme of the 2018/19 MTREF.
The City adopted the Strategic Management Framework (SMF); a product of the Organisational
Development and Transformation Plan (ODTP) endorsed by the Mayor and the EMT. The SMF aims
to integrate the strategic planning activities and deliverables across directorates to bring together a
holistic shared strategy, which enables integrated decision making.

City of Cape Town - 2018/19 Budget (including additional recommendations read in at the Council meeting of 30 May 2018
Page 59
The SMF consisted of 4 review stages:
Strategic Review, which resulted in updated City Strategies of the City Development Strategy
(CDS), Economic Growth Strategy (EGS) and Social Development Strategy (SDS);
Programme Review: to ensure alignment with City strategies, executive directors presented their
directorates’ sector management plans, projects and programmes to feed into the Updated
Municipal Spatial Development Framework (MSDF) and Integrated Development Plan (IDP).
These sessions took place in November 2017;
The Item Review required the assessment of funding and budget (operating and capital) flowing
from the Programme Review. This process took place in December 2017 to feed into the 2018/19
MTREF; and
The Strategy and Budget Review, which assesses the outcome of the above processes in terms of
the 2018/19 MTREF.
The budget process for the 2018/19 MTREF has/will proceed according to the following timeline:
May 2017
The 2018/19 IDP and Budget timetable was tabled at Council.
July to August 2017
Long Term Financial Plan (LTFP) modelling and BSM sessions focussed on the New Water Plan
requirements and its impact on outer years; and
Financial impact discussions at various Water-related fora i.e. Water Resilience Financial Strategy
workgroup, Water Resilience Steering Committee and BSM.
September to November 2017
BSM guidance on key parameters including financial and economic assumptions applied to the
LTFP model and New Water Plan requirements;
Budget brief issued by Executive Mayor to all Mayoral committee members and executive directors;
Programme Review with the SMF core team and all executive directors to assess adherence to
City strategies; and
Budget consultation with subcouncils, where a report was submitted to September 2017 cycle of
subcouncil meetings. The process included prioritisation per subcouncil in the 4-area model
approach, as set out in the ODTP. Requirements stemming from subcouncils were submitted to
line departments for consideration.
Issue of Mayor's Budget Brief, which provided political direction to formulation of functional budget
considerations.
December 2017 to February 2018
Iterative interactions with BSC and BSM. Refinements of the LTFP model to ensure a credible,
affordable and sustainable budget over the medium term;
Item review and consideration of its impact on the capital- and operating budget; and
Preparation of detailed capital- and operating budget.
March to April 2018
2018/19 capital- and operating budget and IDP review tabled at Council on 28 March 2018.
Publication of budget, IDP and tariff proposals for comment and consultation as part of the public
participation process. 2018 LG MTEC engagement took place on 24 April 2018.
April to May 2018
Comments received as a result of the public participation process submitted to Mayco for
consideration.
The 2018 Municipal Benchmark Engagement with National Treasury took place on 14 and 15 May
2018.

City of Cape Town - 2018/19 Budget (including additional recommendations read in at the Council meeting of 30 May 2018
Page 60
2018/19 MTREF budget, IDP review and BEPP scheduled for consideration and adoption by
Council on 30 May 2018.
2.1.3 Integrated Development Plan (IDP) and Service Delivery and Budget Implementation Plan (SDBIP)
The City’s IDP is its principal strategic planning instrument, which guides and informs its on-going
planning, management and development actions. The IDP represents the City administration’s
commitment to exercise its executive authority. This 5-Year Term of Office Plan, is in line with National-
and Provincial government legislation and is effectively the local government’s blueprint by which it
strives to realise its vision for Cape Town in the short-, medium- and long term.
The 5-Year Term of Office IDP (2017/18 – 2021/22) was developed in line with the Term of Office IDP
Process Plan (2017/18 – 2021/22) and the annual IDP and Budget Time schedule, which was approved
by Council in May 2017.
IDP Review
Section 34(a) of the abovementioned legislation requires a municipal council to review its IDP:
i) annually, in accordance with an assessment of its performance measurements;
ii) and to the extent that changing circumstances so demand.
IDP Amendment
Section 34(b) of the legislation states that a municipal council may amend its IDP in accordance with
the prescribed process.
The prescribed process for amending an IDP is contained in Section 3 of the Municipal Planning and
Performance Management Regulations, 2001. The main steps in the process can be summarised as
follows:
i) Only a member or committee of a municipal council may introduce a proposal for amending the
IDP;
ii) Any proposal for amending the IDP must be accompanied by:
- a memorandum setting out the reasons for the proposal
iii) The proposed amendment must be published for public comment for a minimum period of 21 days
iv) An amendment to the IDP is adopted by a decision taken by a municipal council in accordance with
the rules and orders of council.
2.2 Overview of alignment of annual budget with Integrated Development Plan (IDP)
The City’s priority objectives are set out in its IDP, which provides the strategic framework that guides
the City’s planning and budgeting over the course of the 5-year political term.
To this extent this IDP consists of two main parts, being a strategic plan, which contains the longer
term strategic vision, priorities and narrative as well as an implementation plan, which focuses only
on key strategic programmes, projects and initiatives that will support the achievement of the priorities
through the 5-year term of office.
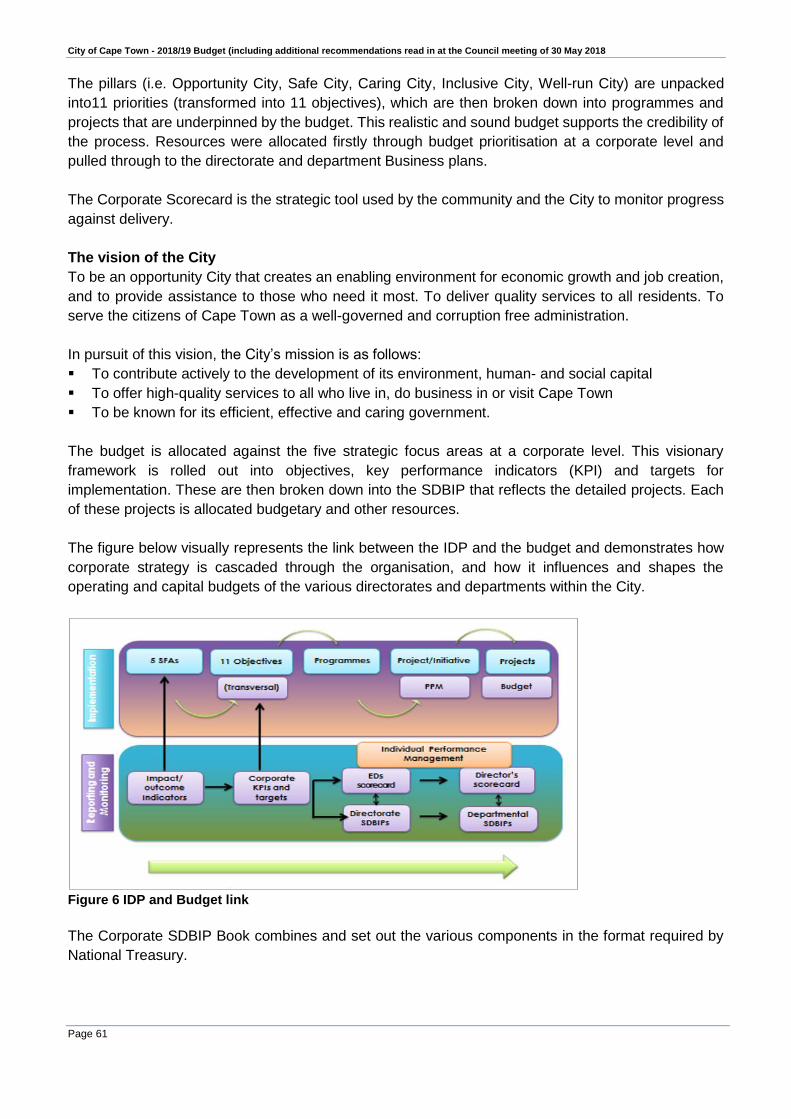
City of Cape Town - 2018/19 Budget (including additional recommendations read in at the Council meeting of 30 May 2018
Page 61
The pillars (i.e. Opportunity City, Safe City, Caring City, Inclusive City, Well-run City) are unpacked
into11 priorities (transformed into 11 objectives), which are then broken down into programmes and
projects that are underpinned by the budget. This realistic and sound budget supports the credibility of
the process. Resources were allocated firstly through budget prioritisation at a corporate level and
pulled through to the directorate and department Business plans.
The Corporate Scorecard is the strategic tool used by the community and the City to monitor progress
against delivery.
The vision of the City
To be an opportunity City that creates an enabling environment for economic growth and job creation,
and to provide assistance to those who need it most. To deliver quality services to all residents. To
serve the citizens of Cape Town as a well-governed and corruption free administration.
In pursuit of this vision, the City’s mission is as follows:
To contribute actively to the development of its environment, human- and social capital
To offer high-quality services to all who live in, do business in or visit Cape Town
To be known for its efficient, effective and caring government.
The budget is allocated against the five strategic focus areas at a corporate level. This visionary
framework is rolled out into objectives, key performance indicators (KPI) and targets for
implementation. These are then broken down into the SDBIP that reflects the detailed projects. Each
of these projects is allocated budgetary and other resources.
The figure below visually represents the link between the IDP and the budget and demonstrates how
corporate strategy is cascaded through the organisation, and how it influences and shapes the
operating and capital budgets of the various directorates and departments within the City.
Figure 6 IDP and Budget link
The Corporate SDBIP Book combines and set out the various components in the format required by
National Treasury.

City of Cape Town - 2018/19 Budget (including additional recommendations read in at the Council meeting of 30 May 2018
Page 62
The tables below provide details on the reconciliation between the IDP strategic objectives, the operating revenue and expenditure and the capital expenditure
budget.
Table 31 MBRR Table SA4 - Reconciliation between the IDP strategic objective and budgeted revenue
Strategic Objective 2014/15 2015/16 2016/17
R thousand
Audited
Outcome
Audited
Outcome
Audited
Outcome
Original
Budget
Adjusted
Budget
Full Year
Forecast
Budget
Year
2018/19
Budget
Year +1
2019/20
Budget
Year +2
2020/21
The Opportunity City Attract investment for econ growth/jobs 1.1 96,645 103,191 124,616 – – – – – –
Prov of economic & social infrastructure 1.2 15,446,992 17,291,668 18,541,175 – – – – – –
Sustainable environment through resource 1.3 8,066 20,632 263 – – – – – –
Mobility via effective public transport 1.4 460,775 482,891 482,850 – – – – – –
City Assets for econ growth & developmnt 1.5 135,549 151,412 170,236 – – – – – –
The Safe City Expand resources for safety and security 2.1 1 1 0 – – – – – –
Resource depts for optimum operations 2.2 57,044 66,958 76,909 – – – – – –
Enhance intelligence-driven policing 2.3 1,032,064 1,128,735 1,273,961 – – – – – –
Improve emergency staff through training 2.4 16,118 16,602 20,848 – – – – – –
Safety and security through partnerships 2.5 1,398 1,316 206 – – – – – –
The Caring City Human settlements for increased acccess 3.2 709,330 790,774 756,678 – – – – – –
Assess rental stock to beneficiaries 3.3 222,964 233,092 247,133 – – – – – –
Innovative human settlements access 3.4 849,916 940,332 1,128,382 – – – – – –
Effective environmental health services 3.5 1,398 3,140 6,679 – – – – – –
Provide effective air quality management & pollution 3.6 340 225 362 – – – – – –
Effective primary health care services 3.7 485,148 521,117 581,820 – – – – – –
Substance abuse treatment/rehabilitation 3.8 0 1 0 – – – – – –
The Inclusive City Response for citizens to be communicated 4.1 67 132 250 – – – – – –
Facilities that make citizens feel home 4.2 134,868 114,618 116,472 – – – – – –
The Well-Run City Transparent & corruption free government 5.1 4,620 2,690 1,443 – – – – – –
Efficient & productive administration 5.2 50,347 144,598 69,629 – – – – – –
Ensure unqualified audits by AG 5.3 9,549,039 10,773,663 12,468,739 – – – – – –
The Opportunity City Position CT as globally competitive City 1.1 – – – 6,508,985 326,950 326,950 393,901 499,560 565,719
Leveraging Technology for Progress 1.2 – – – 27,905 22,916 22,916 24,177 25,506 26,922
Economic Inclusion 1.3 – – – – – – – – –
Resource Efficiency and Security 1.4 – – – 1,685 13,844 13,844 18,847 7,918 8,068
The Safe City Safe Communities 2.1 – – – 1,242,927 1,275,141 1,275,141 1,380,687 1,447,479 1,515,912
The Caring City Excellence in Basic Service delivery 3.1 – – – 14,208,408 19,443,496 19,443,496 20,416,487 23,664,555 26,406,914
Mstr basic service to inf settl bkyard 3.2 – – – 42,443 40,197 40,197 29,427 53,005 66,047
The Inclusive City Dense_Transit Orientated Growth and Dev 4.1 – – – 16,423 25,040 25,040 9,374 6,519 0
An Efficient Integrated Transport System 4.2 – – – 498,583 670,976 670,976 625,579 562,427 582,490
Building Integrated Communities 4.3 – – – 655,175 12,594,141 12,594,141 13,474,732 14,543,628 15,705,205
The Well-Run City Operational sustainability 5.1 – – – 14,805,558 2,257,482 2,257,482 2,976,605 3,182,525 3,365,715
– – – – – – – – –
29,262,688 32,787,790 36,068,652 38,008,091 36,670,182 36,670,182 39,349,818 43,993,121 48,242,992 Total Revenue (excluding capital transfers and contributions)
Allocations to other priorities
Current Year 2017/182018/19 Medium Term Revenue &
Expenditure FrameworkGoal
CodeGoal
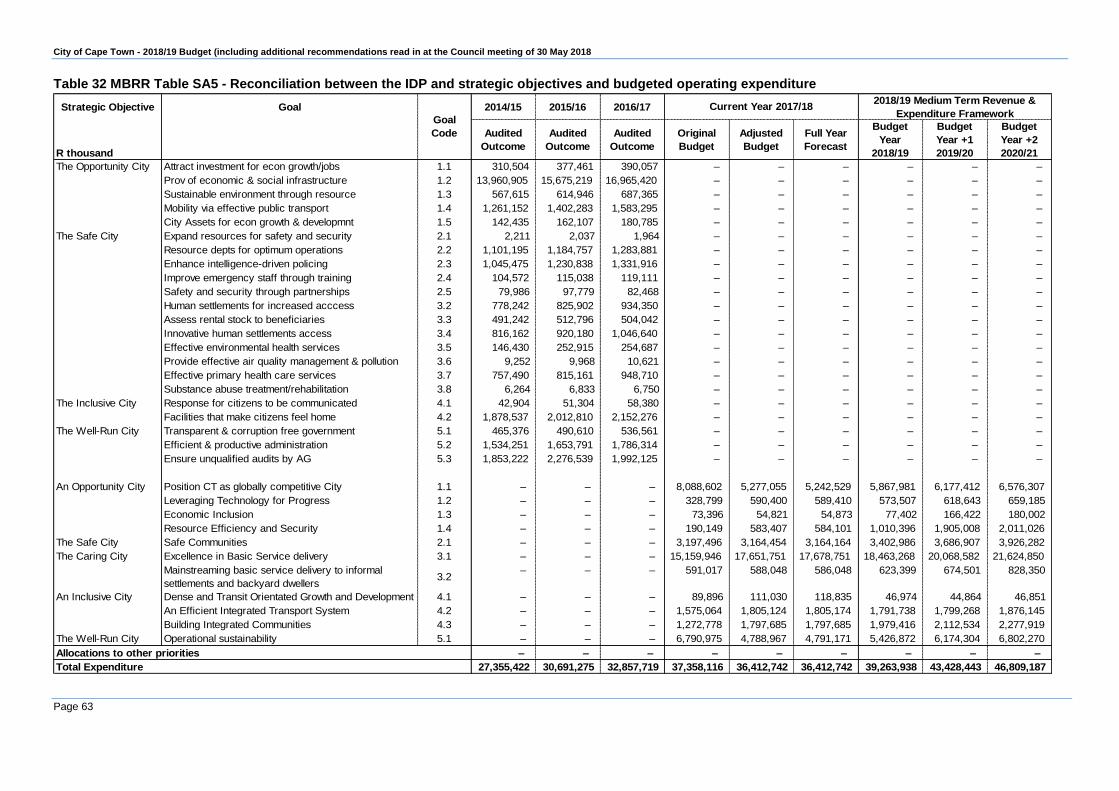
City of Cape Town - 2018/19 Budget (including additional recommendations read in at the Council meeting of 30 May 2018
Page 63
Table 32 MBRR Table SA5 - Reconciliation between the IDP and strategic objectives and budgeted operating expenditure
Strategic Objective Goal 2014/15 2015/16 2016/17
R thousand
Audited
Outcome
Audited
Outcome
Audited
Outcome
Original
Budget
Adjusted
Budget
Full Year
Forecast
Budget
Year
2018/19
Budget
Year +1
2019/20
Budget
Year +2
2020/21
The Opportunity City Attract investment for econ growth/jobs 1.1 310,504 377,461 390,057 – – – – – –
Prov of economic & social infrastructure 1.2 13,960,905 15,675,219 16,965,420 – – – – – –
Sustainable environment through resource 1.3 567,615 614,946 687,365 – – – – – –
Mobility via effective public transport 1.4 1,261,152 1,402,283 1,583,295 – – – – – –
City Assets for econ growth & developmnt 1.5 142,435 162,107 180,785 – – – – – –
The Safe City Expand resources for safety and security 2.1 2,211 2,037 1,964 – – – – – –
Resource depts for optimum operations 2.2 1,101,195 1,184,757 1,283,881 – – – – – –
Enhance intelligence-driven policing 2.3 1,045,475 1,230,838 1,331,916 – – – – – –
Improve emergency staff through training 2.4 104,572 115,038 119,111 – – – – – –
Safety and security through partnerships 2.5 79,986 97,779 82,468 – – – – – –
Human settlements for increased acccess 3.2 778,242 825,902 934,350 – – – – – –
Assess rental stock to beneficiaries 3.3 491,242 512,796 504,042 – – – – – –
Innovative human settlements access 3.4 816,162 920,180 1,046,640 – – – – – –
Effective environmental health services 3.5 146,430 252,915 254,687 – – – – – –
Provide effective air quality management & pollution 3.6 9,252 9,968 10,621 – – – – – –
Effective primary health care services 3.7 757,490 815,161 948,710 – – – – – –
Substance abuse treatment/rehabilitation 3.8 6,264 6,833 6,750 – – – – – –
The Inclusive City Response for citizens to be communicated 4.1 42,904 51,304 58,380 – – – – – –
Facilities that make citizens feel home 4.2 1,878,537 2,012,810 2,152,276 – – – – – –
The Well-Run City Transparent & corruption free government 5.1 465,376 490,610 536,561 – – – – – –
Efficient & productive administration 5.2 1,534,251 1,653,791 1,786,314 – – – – – –
Ensure unqualified audits by AG 5.3 1,853,222 2,276,539 1,992,125 – – – – – –
An Opportunity City Position CT as globally competitive City 1.1 – – – 8,088,602 5,277,055 5,242,529 5,867,981 6,177,412 6,576,307
Leveraging Technology for Progress 1.2 – – – 328,799 590,400 589,410 573,507 618,643 659,185
Economic Inclusion 1.3 – – – 73,396 54,821 54,873 77,402 166,422 180,002
Resource Efficiency and Security 1.4 – – – 190,149 583,407 584,101 1,010,396 1,905,008 2,011,026
The Safe City Safe Communities 2.1 – – – 3,197,496 3,164,454 3,164,164 3,402,986 3,686,907 3,926,282
The Caring City Excellence in Basic Service delivery 3.1 – – – 15,159,946 17,651,751 17,678,751 18,463,268 20,068,582 21,624,850
Mainstreaming basic service delivery to informal
settlements and backyard dwellers3.2
– – – 591,017 588,048 586,048 623,399 674,501 828,350
An Inclusive City Dense and Transit Orientated Growth and Development 4.1 – – – 89,896 111,030 118,835 46,974 44,864 46,851
An Efficient Integrated Transport System 4.2 – – – 1,575,064 1,805,124 1,805,174 1,791,738 1,799,268 1,876,145
Building Integrated Communities 4.3 – – – 1,272,778 1,797,685 1,797,685 1,979,416 2,112,534 2,277,919
The Well-Run City Operational sustainability 5.1 – – – 6,790,975 4,788,967 4,791,171 5,426,872 6,174,304 6,802,270
– – – – – – – – –
27,355,422 30,691,275 32,857,719 37,358,116 36,412,742 36,412,742 39,263,938 43,428,443 46,809,187 Total Expenditure
Allocations to other priorities
2018/19 Medium Term Revenue &
Expenditure FrameworkCurrent Year 2017/18
Goal
Code
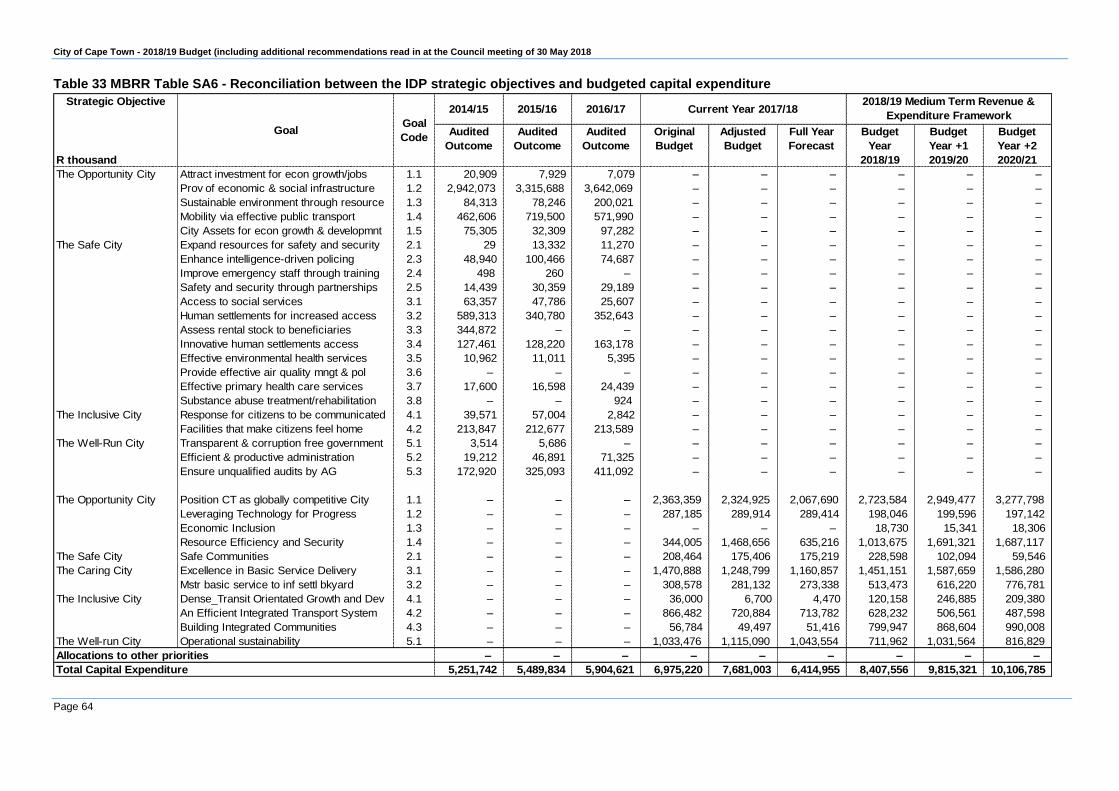
City of Cape Town - 2018/19 Budget (including additional recommendations read in at the Council meeting of 30 May 2018
Page 64
Table 33 MBRR Table SA6 - Reconciliation between the IDP strategic objectives and budgeted capital expenditure
Strategic Objective2014/15 2015/16 2016/17
R thousand
Audited
Outcome
Audited
Outcome
Audited
Outcome
Original
Budget
Adjusted
Budget
Full Year
Forecast
Budget
Year
2018/19
Budget
Year +1
2019/20
Budget
Year +2
2020/21
The Opportunity City Attract investment for econ growth/jobs 1.1 20,909 7,929 7,079 – – – – – –
Prov of economic & social infrastructure 1.2 2,942,073 3,315,688 3,642,069 – – – – – –
Sustainable environment through resource 1.3 84,313 78,246 200,021 – – – – – –
Mobility via effective public transport 1.4 462,606 719,500 571,990 – – – – – –
City Assets for econ growth & developmnt 1.5 75,305 32,309 97,282 – – – – – –
The Safe City Expand resources for safety and security 2.1 29 13,332 11,270 – – – – – –
Enhance intelligence-driven policing 2.3 48,940 100,466 74,687 – – – – – –
Improve emergency staff through training 2.4 498 260 – – – – – – –
Safety and security through partnerships 2.5 14,439 30,359 29,189 – – – – – –
Access to social services 3.1 63,357 47,786 25,607 – – – – – –
Human settlements for increased access 3.2 589,313 340,780 352,643 – – – – – –
Assess rental stock to beneficiaries 3.3 344,872 – – – – – – – –
Innovative human settlements access 3.4 127,461 128,220 163,178 – – – – – –
Effective environmental health services 3.5 10,962 11,011 5,395 – – – – – –
Provide effective air quality mngt & pol 3.6 – – – – – – – – –
Effective primary health care services 3.7 17,600 16,598 24,439 – – – – – –
Substance abuse treatment/rehabilitation 3.8 – – 924 – – – – – –
The Inclusive City Response for citizens to be communicated 4.1 39,571 57,004 2,842 – – – – – –
Facilities that make citizens feel home 4.2 213,847 212,677 213,589 – – – – – –
The Well-Run City Transparent & corruption free government 5.1 3,514 5,686 – – – – – – –
Efficient & productive administration 5.2 19,212 46,891 71,325 – – – – – –
Ensure unqualified audits by AG 5.3 172,920 325,093 411,092 – – – – – –
The Opportunity City Position CT as globally competitive City 1.1 – – – 2,363,359 2,324,925 2,067,690 2,723,584 2,949,477 3,277,798
Leveraging Technology for Progress 1.2 – – – 287,185 289,914 289,414 198,046 199,596 197,142
Economic Inclusion 1.3 – – – – – – 18,730 15,341 18,306
Resource Efficiency and Security 1.4 – – – 344,005 1,468,656 635,216 1,013,675 1,691,321 1,687,117
The Safe City Safe Communities 2.1 – – – 208,464 175,406 175,219 228,598 102,094 59,546
The Caring City Excellence in Basic Service Delivery 3.1 – – – 1,470,888 1,248,799 1,160,857 1,451,151 1,587,659 1,586,280
Mstr basic service to inf settl bkyard 3.2 – – – 308,578 281,132 273,338 513,473 616,220 776,781
The Inclusive City Dense_Transit Orientated Growth and Dev 4.1 – – – 36,000 6,700 4,470 120,158 246,885 209,380
An Efficient Integrated Transport System 4.2 – – – 866,482 720,884 713,782 628,232 506,561 487,598
Building Integrated Communities 4.3 – – – 56,784 49,497 51,416 799,947 868,604 990,008
The Well-run City Operational sustainability 5.1 – – – 1,033,476 1,115,090 1,043,554 711,962 1,031,564 816,829
– – – – – – – – –
5,251,742 5,489,834 5,904,621 6,975,220 7,681,003 6,414,955 8,407,556 9,815,321 10,106,785
Allocations to other priorities
Total Capital Expenditure
2018/19 Medium Term Revenue &
Expenditure FrameworkGoal
CodeGoal
Current Year 2017/18

City of Cape Town - 2018/19 Budget (including additional recommendations read in at the Council meeting of 30 May 2018
Page 65
2.3 Measurable performance objectives and indicators
The Corporate Scorecard is the strategic tool used by the community and the City to monitor progress
against delivery.
The City’s cycle and process of performance management system can be graphically illustrated below:
Figure 7 Planning, budgeting and reporting cycle
The City must involve the community in deciding what priorities and needs it want to achieve.
Community involvement will be in line with relevant legislation and approved policy.
The planning cycle delivers a 5-year and annually reviewed IDP (including a Corporate Scorecard with
definitions), annual corporate, directorate and departmental SDBIP, performance indicator
measurement sheets, Section 57 performance plans and individual performance assessments.
Planning ensures that clear strategic direction is set and prioritised. Planning is informed by feedback
on performance. This is the stage where Strategic Focus Areas (SFA), objectives, performance
indicators and targets are determined. Indicators measure the extent to which objectives are being
achieved, indicating performance in relation to outcomes, outputs, activities and inputs. Targets set the
level of performance to be achieved within a defined period of time.
Indicators must be measurable, relevant, objective and precise. They must include outcomes, output
and input indicators. National general indicators must be included. Proxy indicators will be used until
auditable and cost effective systems and processes are in place to measure the national general
indicators.
City of Cape Town - 2018/19 Budget (including additional recommendations read in at the Council meeting of 30 May 2018
Page 66
The IDP is set for the 5-year term of office of the elected council and reviewed annually. It includes the
SFA, corporate objectives (strategic objectives), corporate indicators and targets. There will be a direct
relationship between the SFA, corporate objective, corporate indicator and target. The actual
achievements of targets set for the objectives will be reported on quarterly bases, where appropriate.
They will form the platform for the quarterly and annual reports on performance.
The components will be interlinked to ensure implementation. All the corporate objectives and
indicators will cascade into a directorate and/or a departmental SDBIP and/or the City Manager’s
and/or Section 57 appointees’ scorecards.
Monitoring, Measuring, Evaluating and Reviewing performance
Monitoring and measuring are the processes and procedures to collect, collate and analyse
organisational performance data on an on-going basis to determine whether planned performance
targets have been met, exceeded or not met. This takes place on a quarterly and an annual basis.
The performance evaluation results are determined by regular management meetings to establish:
Year-to- date performance progress and reasons for variances for both under- or over performance;
Remedial action (effective methods of correction or enhancement), if any, which need to be taken
to achieve the agreed performance targets; and
A date for implementation and a responsible person will be identified.
A review of indicators and targets can take place to the extent that changing circumstances so demand
and in accordance with a prescribed process. These are limited to major organisational changes and
when the budget is adjusted.
Reporting performance includes an Annual Report to the relevant Council committees and to the
community for comment and quarterly reports at corporate, directorate and department level to the
relevant Council committees.
Auditing and Oversight
Internal Audit and Audit Committee (including the Performance Management committee) review the
Organisational Performance Management (OPM) system for functionality, performance information
and compliance. The Auditor General and the Municipal Public Accounts Committee (MPAC) reviews
the Annual Report.
The final measurable performance indicators to be accomplished in 2018/19 will be approved by the
Executive Mayor as part of the Corporate SDBIP in June 2018.
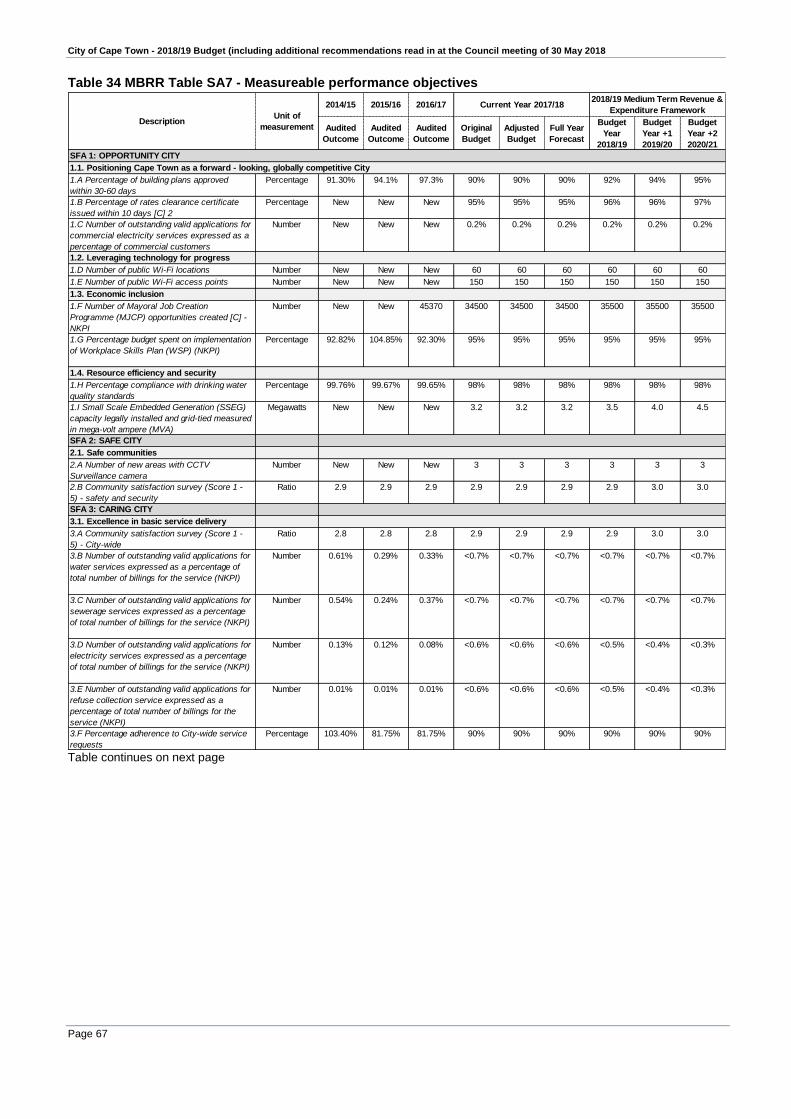
City of Cape Town - 2018/19 Budget (including additional recommendations read in at the Council meeting of 30 May 2018
Page 67
Table 34 MBRR Table SA7 - Measureable performance objectives
2014/15 2015/16 2016/17
Audited
Outcome
Audited
Outcome
Audited
Outcome
Original
Budget
Adjusted
Budget
Full Year
Forecast
Budget
Year
2018/19
Budget
Year +1
2019/20
Budget
Year +2
2020/21
SFA 1: OPPORTUNITY CITY
1.1. Positioning Cape Town as a forward - looking, globally competitive City
1.A Percentage of building plans approved
within 30-60 days
Percentage 91.30% 94.1% 97.3% 90% 90% 90% 92% 94% 95%
1.B Percentage of rates clearance certificate
issued within 10 days [C] 2
Percentage New New New 95% 95% 95% 96% 96% 97%
1.C Number of outstanding valid applications for
commercial electricity services expressed as a
percentage of commercial customers
Number New New New 0.2% 0.2% 0.2% 0.2% 0.2% 0.2%
1.2. Leveraging technology for progress
1.D Number of public Wi-Fi locations Number New New New 60 60 60 60 60 60
1.E Number of public Wi-Fi access points Number New New New 150 150 150 150 150 150
1.3. Economic inclusion
1.F Number of Mayoral Job Creation
Programme (MJCP) opportunities created [C] -
NKPI
Number New New 45370 34500 34500 34500 35500 35500 35500
1.G Percentage budget spent on implementation
of Workplace Skills Plan (WSP) (NKPI)
Percentage 92.82% 104.85% 92.30% 95% 95% 95% 95% 95% 95%
1.4. Resource efficiency and security
1.H Percentage compliance with drinking water
quality standards
Percentage 99.76% 99.67% 99.65% 98% 98% 98% 98% 98% 98%
1.I Small Scale Embedded Generation (SSEG)
capacity legally installed and grid-tied measured
in mega-volt ampere (MVA)
Megawatts New New New 3.2 3.2 3.2 3.5 4.0 4.5
SFA 2: SAFE CITY
2.1. Safe communities
2.A Number of new areas with CCTV
Surveillance camera
Number New New New 3 3 3 3 3 3
2.B Community satisfaction survey (Score 1 -
5) - safety and security
Ratio 2.9 2.9 2.9 2.9 2.9 2.9 2.9 3.0 3.0
SFA 3: CARING CITY
3.1. Excellence in basic service delivery
3.A Community satisfaction survey (Score 1 -
5) - City-wide
Ratio 2.8 2.8 2.8 2.9 2.9 2.9 2.9 3.0 3.0
3.B Number of outstanding valid applications for
water services expressed as a percentage of
total number of billings for the service (NKPI)
Number 0.61% 0.29% 0.33% <0.7% <0.7% <0.7% <0.7% <0.7% <0.7%
3.C Number of outstanding valid applications for
sewerage services expressed as a percentage
of total number of billings for the service (NKPI)
Number 0.54% 0.24% 0.37% <0.7% <0.7% <0.7% <0.7% <0.7% <0.7%
3.D Number of outstanding valid applications for
electricity services expressed as a percentage
of total number of billings for the service (NKPI)
Number 0.13% 0.12% 0.08% <0.6% <0.6% <0.6% <0.5% <0.4% <0.3%
3.E Number of outstanding valid applications for
refuse collection service expressed as a
percentage of total number of billings for the
service (NKPI)
Number 0.01% 0.01% 0.01% <0.6% <0.6% <0.6% <0.5% <0.4% <0.3%
3.F Percentage adherence to City-wide service
requests
Percentage 103.40% 81.75% 81.75% 90% 90% 90% 90% 90% 90%
Unit of
measurementDescription
Current Year 2017/182018/19 Medium Term Revenue &
Expenditure Framework
Table continues on next page

City of Cape Town - 2018/19 Budget (including additional recommendations read in at the Council meeting of 30 May 2018
Page 68
2014/15 2015/16 2016/17
Audited
Outcome
Audited
Outcome
Audited
Outcome
Original
Budget
Adjusted
Budget
Full Year
Forecast
Budget
Year
2018/19
Budget
Year +1
2019/20
Budget
Year +2
2020/21
3.2. Mainstreaming basic service delivery to informal settlements and backyard dwellers
3.G Number of water service points
(taps) provided to informal
settlements (NKPI)
Number 948 919 676 600 600 600 700 700 700
3.H Number of sanitation service
points (toilets) provided to informal
settlements (NKPI)
Number 3091 3058 2085 2800 2800 2800 2600 2500 2500
3.I Percentage of informal
settlements receiving a door-to-
door refuse collection service
(NKPI)
Percentage 99.74% 99.74% 99.74% 99% 99% 99% 99% 99% 99%
3.J Number of service points (toilet
and tap with hand basin) provided
to backyarders
Number New New New 1000 1000 1000 1200 1600 1100
3.K Number of electricity
subsidised connections installed
(NKPI)
Number 5096 2909 1747 1500 1500 1500 1500 1500 1500
3.L Percentage progress made in
establishing a verifiable database
that determines housing needs
Percentage New New New 50% 50% 50% 100% - -
3.M Percentage of allocated
housing opportunity budget spent
Percentage New New New 90% 90% 90% 90% 90% 90%
3.N Number of deeds of sale
agreements signed with identified
beneficiaries per annum
Number 1283 1065 760 1000 1000 1000 2000 2500 2500
3.O Number of sites serviced in the
informal settlements (incremental
housing & reblocking)
Number New New New 2000 2000 2000 2000 1800 2500
3.P Number of community services
facilities within informal
settlements
Number New New New - - - - 1 2
SFA 4: INCLUSIVE CITY
4.1. Dense and transit oriented growth and development
4.A Number of passenger journeys
per kilometre operated (MyCiTi)
Number New New New 1.07 1.07 1.07 1.09 1.11 1.14
4.B Percentage identified priority
projects moved out of pre-projects
to inception phase
Percentage New New New 10% 10% 10% - 25% -
4.C Percentage identified priority
projects moved out of inception to
implementation phase (To be
implemented in 2021/22)
Percentage New New New - - - To be
implemented
in 2021/22
To be
implemented
in 2021/22
To be
implemented
in 2021/22
4.2. An efficient, integrated transport system
4.D Total number of passenger
journeys on MyCiTi
Number 15.4
Million
18.5
Million
19.9
Million
19.1
Million
19.1
Million
19.1
Million
19.5 Million 19.9 Million 20.3 Million
4.3. Building integrated communities
4.E Percentage of people from
employment equity target groups
employed in the three highest
levels of management in
compliance with the City's
approved employment equity plan
(EE) (NKPI)
Percentage 66% 66.34% 69.86% 75% 75% 75% 75% 75% 75%
4.F Number of strengthening
families programmes implemented
Number New New New 18 18 18 18 18 18
SFA 5: WELL-RUN CITY
5.1. Operational sustainability
5.A Opinion of independent rating
agency
Opinion High
investment
rating
reaffirmed
A1.za
High
investment
rating
Aaa.za
High
investment
rating
(Aaa.za)
High
investment
rating
High
investment
rating
High
investment
rating
High
investment
rating
High
investment
rating
High
investment
rating
5.B Opinion of the Auditor-General Opinion Clean
Audit
Clean
Audit
Unqualifie
d with
findings
Clean
Audit
Clean
Audit
Clean
Audit
Clean Audit Clean Audit Clean Audit
5.C Percentage spend of capital
budget (NKPI)
Percentage 85.70% 89.57% 92.85% 90% 90% 90% 90% 90% 90%
5.D Percentage spend on Repairs
and Maintenance
Percentage 95.81% 94% 99.52% 95% 95% 95% 95% 95% 95%
5.E Cash/cost coverage ratio
(excluding unspent conditional
grants) (NKPI)
Ratio 1.88:1 2.021:1 2.28:1 2:1 2:1 2:1 2:1 2:1 2:1
5.F Net Debtors to annual income
(NKPI)
Percentage 20.44% 20.39% 21.15% 21.5% 21.5% 21.5% 21.50% 21.50% 21.50%
5.G Debt (total borrowings) to total
operating revenue (NKPI)
Percentage 4.91:1 5.83:1 New 27% 27% 27% 30% 34% 35%
Current Year 2017/182018/19 Medium Term Revenue &
Expenditure FrameworkUnit of
measurementDescription

City of Cape Town - 2018/19 Budget (including additional recommendations read in at the Council meeting of 30 May 2018
Page 69
The following table sets out the municipalities main performance indicators and benchmarks for the 2018/19 MTREF. Table 35 MBRR Table SA8 - Performance indicators and benchmarks
2014/15 2015/16 2016/17
Audited
Outcome
Audited
Outcome
Audited
Outcome
Original
Budget
Adjusted
Budget
Full Year
Forecast
Budget Year
2018/19
Budget Year
+1 2019/20
Budget Year
+2 2020/21
Borrowing Management
Credit Rating A1.za A1.za Aaa.za Aaa.za
Capital Charges to Operating Expenditure Interest & Principal Paid /Operating Expenditure 4.0% 3.4% 3.5% 4.2% 3.9% 3.9% 4.0% 5.3% 6.0%
Capital Charges to Own Revenue Finance charges & Repayment of borrowing /Own
Revenue
4.2% 3.5% 3.5% 5.0% 4.8% 4.8% 4.8% 6.3% 6.9%
Borrowed funding of 'own' capital expenditure Borrowing/Capital expenditure excl. transfers and grants
and contributions
0.0% 0.0% 0.0% 54.1% 72.8% 94.0% 63.9% 74.8% 77.9%
Safety of Capital
Gearing Long Term Borrowing/ Funds & Reserves 229.9% 200.9% 153.4% 278.2% 193.8% 193.8% 285.2% 332.5% 328.8%
Liquidity
Current Ratio Current assets/current liabilities 1.2 1.3 1.4 1.3 1.2 1.2 1.3 1.4 1.5
Current Ratio adjusted for aged debtors Current assets less debtors > 90 days/current liabilities 1.2 1.3 1.4 1.3 1.2 1.2 1.3 1.4 1.5
Liquidity Ratio Monetary Assets/Current Liabilities 0.6 0.6 0.6 0.6 0.6 0.6 0.6 0.7 0.8
Revenue Management
Annual Debtors Collection Rate (Payment Level %) Last 12 Mths Receipts/Last 12 Mths Billing 0.0% 100.1% 100.1% 100.1% 92.3% 94.8% 0.0% 93.2% 93.1%
Current Debtors Collection Rate (Cash receipts % of Ratepayer
& Other revenue)
100.0% 100.0% 100.0% 92.2% 94.8% 94.8% 93.2% 93.1% 93.1%
Outstanding Debtors to Revenue Total Outstanding Debtors to Annual Revenue 18.9% 18.4% 19.0% 18.0% 19.9% 19.9% 19.9% 19.1% 18.7%
Longstanding Debtors Recovered Debtors > 12 Mths Recovered/Total Debtors > 12 Months
Old
0.0% 0.0% 0.0% 0.0% 0.0% 0.0% 0.0% 0.0% 0.0%
Creditors Management
Creditors System Efficiency % of Creditors Paid Within Terms (within`MFMA' s 65(e)) 96.2% 96.4% 96.5% 97% 97.2% 97.5% 97.5% 98% 98%
Creditors to Cash and Investments 165.6% 171.7% 172.8% 200.4% 167.7% 166.7% 151.2% 113.3% 79.2%
Other Indicators
Total Volume Losses (kW) 1,134,334,700 1,157,007,605 1,075,357,226 1,075,357,226 1,075,357,226 1,075,357,226 1,075,357,226 1,075,357,226 1,075,357,226
Total Cost of Losses (Rand '000) 755,580 871,875 877,599 880,287 880,287 880,287 950,723 1,026,781 1,108,924
% Volume (units purchased and generated less units
sold)/units purchased and generated
11.25% 11.42% 10.9% 10.89% 10.89% 10.89% 10.89% 10.89% 10.89%
Total Volume Losses (kℓ) 65,468,324 61,960,222 63,571,089 73,029,336 73,029,336 48,400,000 41,900,000 41,900,000 41,900,000
Total Cost of Losses (Rand '000) 228,484 247,841 317,697 303,557 303,557 283,785 466,766 466,766 466,766
% Volume (units purchased and generated less units
sold)/units purchased and generated
19.10% 18.83% 22.05% 21.35% 21.35% 22.51% 22.85% 22.85% 22.85%
Employee costs Employee costs/(Total Revenue - capital revenue) 27.8% 28.5% 26.8% 31.7% 31.4% 31.4% 32.8% 31.4% 30.9%
Remuneration Total remuneration/(Total Revenue - capital revenue) 28.2% 29.0% 27.2% 32.1% 31.8% 31.8% 33.3% 31.8% 31.2%
Repairs & Maintenance R&M/(Total Revenue excluding capital revenue) 10.3% 10.2% 10.4% 10.6% 10.2% 10.3% 10.1% 9.7% 9.6%
Finance charges & Depreciation FC&D/(Total Revenue - capital revenue) 9.2% 8.7% 8.4% 9.7% 9.6% 9.6% 9.9% 10.6% 10.7%
IDP regulation financial viability indicators
i. Debt coverage (Total Operating Revenue - Operating Grants)/Debt
service payments due within financial year)
23.1 20.7 26.9 23.8 23.8 23.8 18.8 18.9 20.9
ii.O/S Service Debtors to Revenue Total outstanding service debtors/annual revenue received
for services
25.3% 24.5% 25.2% 23.9% 27.7% 27.7% 26.9% 25.3% 24.5%
iii. Cost coverage (Available cash + Investments)/monthly fixed operational
expenditure
1.7 1.6 1.5 1.5 2.0 2.0 2.1 2.4 3.1
Water Distribution Losses (2)
Description of financial indicator Basis of calculation
Current Year 2017/182018/19 Medium Term Revenue &
Expenditure Framework
Electricity Distribution Losses (2)
City of Cape Town - 2018/19 Budget (including additional recommendations read in at the Council meeting of 30 May 2018
Page 70
2.3.1 Performance indicators and benchmarks
2.3.1.1 Borrowing Management
The City’s capital expenditure is funded from four sources, namely, government grants, public
contributions and donations, borrowing and internally generated funds. The City’s borrowing is done in
terms of Chapter 6 of the MFMA and the City’s Borrowing Policy, where long-term loans will only be
entered into based on affordability and sustainability. This is influenced by the capital investment
requirement over the 2018/19 MTREF.
The City needs a credit rating to demonstrate its ability to meet its short- and long-term financial
obligations. Potential lenders also use it to assess the City's credit risk, which in turn affects the pricing
of any subsequent loans taken. Factors used to evaluate the creditworthiness of municipalities include
the economy, debt, finances, politics, management and institutional framework.
On 29 March 2018, Moody’s Investors Service provided an update to the City’s credit analysis. The
City’s global and national scale ratings were confirmed with a negative outlook. The City’s outlook was
not upgraded to “Stable” in line with the action taken on the sovereign rating due to challenges
associated with the current water crisis.
The City’s national scale rating is currently Aaa.za/P-1.za, which reflects the City’s credit profile of
strong financial performance characterised by annual operating surplus, strong financial debt
management, low debt and diverse economic profile. The City’s credit profile is, however, constrained
by the water shortage, the direct impact it has on water revenue, the indirect economic and societal
effects and the increased capital expenditure required to ensure the supply of water.
The following financial performance indicators formed part of the compilation of the 2018/19 MTREF:
Capital charges to operating expenditure, which is the measure of the cost of borrowing in relation
to the operating expenditure. This ratio averages 5.1% over the 2018/19 MTREF indicating that the
City spends an average of 5.1% of its operating expenditure budget on finance charges annually,
which is considered feasible and sustainable.
Borrowing funding as a ratio of own capital expenditure reflects the degree to which own capital
expenditure (excluding government grants and public contributions) has been funded by way of
borrowing. The ratio shows 63.9% for 2018/19 and averages 76.4% over the two outer years of the
MTREF. This ratio outcome is as a result of the accelerated investment in sustainable water supply
initiatives.
2.3.1.2 Safety of Capital
The gearing ratio is a measure of the total long-term borrowings over funds and reserves. The City
does not agree with the methodology applied to calculate this ratio. The preferred calculation is
borrowing less cash and bank balances divided by community wealth/equity, of which the City’s
outcome over the 2018/19 MTREF averages 12%.

City of Cape Town - 2018/19 Budget (including additional recommendations read in at the Council meeting of 30 May 2018
Page 71
2.3.1.3 Liquidity
Current ratio
The current ratio is used to assess the City’s ability to pay back its short-term liabilities (debt and
payables) with short-term assets (cash, inventory, and receivables). According to NT Circular 71,
the higher the current ratio, the more capable the municipality will be to pay its current or short-
term obligations and provide for risk cover to enable it to continue operations at desired levels. It is
preferable that the ratio is at least above 1. This ratio for the City averages 1.4 over the MTREF
period.
Liquidity ratio
The liquidity ratio is a measure of the ability of the City to utilise cash and cash equivalents to
extinguish or retire its current liabilities immediately. Anything below 1 indicates a shortage in cash
to meet creditor obligations. The City also does not agree with the methodology applied to calculate
this ratio. The preferred calculation is current assets less inventory divided by current liabilities.
This ratio averages 1.3 for the City over the MTREF period.
2.3.1.4 Revenue Management
Debt Management actions, including legal actions, are carried out against debtors who can pay,
but choose not to, with a special focus on:
Categorization of accounts into high value accounts: business and residential;
Top 1000 debtors;
Government accounts;
Staff and councillor arrears; and
Appropriate action against irrecoverable debt.
Allocating high value accounts to area offices to follow up on debtors within their respective areas.
Limiting/blocking of electricity prepaid meters: Collecting other debts via the prepaid electricity
meters.
Debtors who are experiencing difficulties in paying their accounts are given options to either enter
into affordable payment arrangements or to apply to be registered as indigent or apply for rates
rebates. The City provides the option of an affordable payment plan for debtors to settle their
arrears, where compliance with the agreed payment plan leads to the suspension of all debt
management actions and interest being raised, until the arrears are paid in full.
Adverse Credit Listing
Adverse credit listing – enforce debtors who are active credit users to settle their debts,
otherwise they cannot enter into any other credit/loan agreements.
Handing over of accounts, which could lead to a sale in execution (SIE) of the property, to recover
municipal debts.
Focus on the high value accounts handed over for legal actions.
Progress of accounts handed over to the appointed panel of attorneys is performance managed
and monitored.
In addition to the above, the City’s strategy for the Indigent debtors are:
Water leaks are fixed on all indigent properties free of charge;
Water demand management devices (WDM) and prepaid electricity meters are installed free of
charge;
When water leaks have been repaired and the WDMs and pre-paid electricity meters are
installed a once off write-off is done of all the outstanding debt; and

City of Cape Town - 2018/19 Budget (including additional recommendations read in at the Council meeting of 30 May 2018
Page 72
Council approved the write-off of all interest charges as well as suspension of interest charges
on indigent properties until the water leaks have been repaired, the WDMs and the pre-paid
electricity meters have been installed and applicable outstanding debts have been written off.
Estimation system logic change
Changed the estimation logic in the SAP billing system from estimating back to the previous
year’s (12 months) consumptions to only going back to the past 3-5 months (implemented from
22 Feb 2018 to 31 March 2018)
o The above change was implemented as most people drastically reduced their water
consumptions because of the water crises; accounts will be based on a more accurate and
reliable estimation of customers’ consumptions (3 -5 months) compared to 12 months where
there was much higher water usage.
o The full implementation of the above should result in debtors receiving more realistic
estimations of water billings, less queries, decrease in negative publicity etc.
Estimation system logic change on Indigent Properties with set WMDs
Changed the estimation logic in the billing system to estimate the water billings for WMDs to
the kilo litres setting of the WMDs e.g. 10,5 KL (implemented from 5 April 2018).
o This change should result in a more accurate and reliable estimations of customers’
consumptions to the WMDs settings (especially in “no go” and dangerous areas, where
actual readings are far and between).
2.3.1.5 Creditors Management
In compliance with Section 65 of the MFMA, the City has continuously managed to ensure that all
its creditors are settled within 30 days of invoice or statement in all cases where goods and services
are rendered timeously and in good condition. Under exceptional circumstances where services
cannot be rendered on time, existing follow-up procedures and control measures are applied to
ascertain reasons, thus facilitating timeous payments. This is built-in within the City’s payment
processes. The City also ensures that suppliers are familiar with all the agreed payment terms and
conditions. This remarkable service excellence is attributable to strong business relations that exist
between the City and its suppliers.
2.3.1.6 Other Indicators
Electricity distribution losses
Performance in the 2016/17 financial year has shown that Electricity distribution losses was
10.89%. The City’s strategy to address these included the appointment of additional revenue
protection teams, which compared to the 2015/16 financial year where performance was 11.42%,
have shown significant success. Losses have been growing over the last number of years while
still within the benchmark, budgeting for a loss factor is therefore prudent.
Water distribution losses
High priority is being given to a comprehensive water loss reduction strategy with detailed action
plans to address and reduce each of the physical or real losses and apparent losses. The Water &
Sanitation department are applying the resources required to implement Water Demand
Management interventions, which has been accelerated during the current drought. These include:
Education and awareness programmes;
Leak Detection and repair;
Pressure Management Systems to minimise leakage in the system and reduce night flows;
Pipe replacement programme (priority areas as well as alignment with the pressure
management system);
Meter Replacement programme to improve accuracy of meters.

City of Cape Town - 2018/19 Budget (including additional recommendations read in at the Council meeting of 30 May 2018
Page 73
2.3.2 Free Basic Services: basic social services package for indigent households
The social package for indigent households is based on the blanket approach i.e. where rebates are
provided for indigent households based on property value of R0 to R400 000 as well as the targeted
approach.
The following rebates are provided to the indigent based property value:
Table 36 Basic social package rebates
Property Value
Refuse
Removal
charges
Water Sanitation Rates
R350 001 – R400 000 25% 10.5kl free water 7.35kl free sanitation -
R300 001 – R350 000 50% 10.5kl free water 7.35kl free sanitation -
R200 001 – R300 000 50% 10.5kl free water 7.35kl free sanitation -
R150 001 – R200 000 50% 10.5kl free water 7.35kl free sanitation 100%
R100 001 – R150 000 75% 10.5kl free water 7.35kl free sanitation 100%
R100 000 and below 100% 10.5kl free water 7.35kl free sanitation 100%
With the targeted approach any resident who is required to pay for the municipal services and whose
gross monthly household income is R4 000 or below registers as indigent to receive the same benefits
as if their property values were below R100 000.
The current number of indigent registered is 3 219 at the end of April 2018. This number varies monthly
as registration is valid for 12 months where after re-application is required.
In addition, property rates rebates are granted to residents based on their gross monthly household
income as follows:
Income bracket Rebate %
R4 001 – R5 000 75%
R5 001 – R5 500 50%
R5 501 – R6 000 25%
The current number of beneficiaries in the above categories is 18 as at end April 2018.
2.3.3 Providing potable water and managing waste water
In managing the provision of drinking water and the treatment of wastewater, the City performs the
dual role of Water Service Authority and Water Service Provider. It also provides bulk drinking water
to adjacent local authorities namely Drakenstein Municipality and Stellenbosch Municipality.

City of Cape Town - 2018/19 Budget (including additional recommendations read in at the Council meeting of 30 May 2018
Page 74
Blue Drop Status
The entire water supply system (including the City-owned catchments, dams, twelve water treatment
plants, the bulk conveyance system and the whole distribution system) was assessed in all five Blue
Drop audits since inception of this programme by the Department of Water and Sanitation (DWS) in
2009. Subsequent to achieving 100% in the first assessment, the City scored 98.2%, 97.6%, 98.1%
and 95.9% respectively in the progressively more stringent follow-up audits. Since the beginning of the
Blue Drop programme, the City has been in the top scores for the country.
As a water service provider, the City constantly strives to improve its performance with respect to water
quality management. Water safety planning and risk mitigation methodologies are integrated into its
management processes. Although no major corrective interventions are currently required in terms of
the water safety plan, the City will constantly evaluate the need for additional risk mitigation barriers.
Although provision is made in the normal budget allocations to maintain the high standards already
achieved, should additional safety barriers be identified, then budgetary allocations will prioritise the
associated intervention.
Major Water Projects included in the future Capital Programme are:
Bulk Water Augmentation Scheme- It is required to augment, refurbish and maintain the City’s bulk
water supply system, to ensure a safe, reliable and sustainable supply of water to Cape Town and
its surrounding region. The Bulk Water Augmentation Scheme includes new major reservoirs as
well as a new water treatment plant and distribution bulk mains.
Water supply Baden Powell to Khayelitsha- New bulk supply main (1000mmØ) off the existing
Faure 2400mmØ pipeline to supplement the water supply to the Khayelitsha area. This will increase
the supply to the area which will accommodate the formalisation of various areas within
Khayelitsha.
In light of the current climatic condition in the greater Cape Town Region, drastic water saving
measures have also been implemented. The following projects form part of the New Water Plan
to ensure the security of water:
Drilling of boreholes into the Atlantis, Cape Flats and Table Mountain Group (TMG) Aquifers
Implementation of water re-use for drinking use at Zandvliet, Macassar and Potsdam Treatment
Plants
Small-scale desalination plants are already being installed during this financial year with the
intent of larger plants in the future.
Green Drop Status
The City has a risk-based approach in place whereby the strategic risks to the wastewater business
have been identified, rated and mitigation measures have been put in place. The plan is being
implemented but there is a significant financial requirement for maintaining, rehabilitating and replacing
the ageing assets to mitigate the critical risks in the Wastewater Risk Abatement Plan (WWRAP). This
plan is specifically related to new license conditions imposed by the national Department of Water and
Sanitation. This document is reviewed to further refine prioritisation of the risks and resource
allocations. The City has clear objectives based on a sound baseline and knowledge of their processes
and technologies. The application of risk management and abatement is an integral part of the
wastewater business.
City of Cape Town - 2018/19 Budget (including additional recommendations read in at the Council meeting of 30 May 2018
Page 75
The City received 12 Green Drops and an overall score of 89.7% for its 27 wastewater treatment
systems during the 2012/13 assessment up from the 11 Green Drops awarded and the 86.8% score
achieved in 2011/12.
The City continues to display a strong commitment to improving wastewater treatment and its Green
Drop scores and strives for on-going improvement by the implementation of the principles of best
practices management throughout the entire workforce.
The primary problems experienced are that of ageing infrastructure which needs to be rehabilitated or
replaced, rapid population growth, maintenance of the existing assets, a shortage of relevant skills, as
well as more stringent license conditions.
Additional challenges include significant financial investment requirements:
for new infrastructure to cater for the rapidly developing city; and
to improve on the existing wastewater effluent quality.
These problems are being experienced throughout South Africa and the City is addressing such
challenges via recruitment of appropriate staff and training existing staff- in an effort to minimise the
shortage of experienced employees. The City ‘s Water & Sanitation department has formulated
comprehensive long term master plans (for wastewater, bulk water and the sewer and water reticulation
services) and improved business processes. This allows for efficient allocation of financial resources
to create new facilities with appropriate technologies and expanding as well as maintaining existing
assets.
Some of the major wastewater projects are:
Zandvliet Ext (WWTW) - increase in treatment capacity;
Bellville Ext (WWTW) - increase in treatment capacity; and
Borchards Quarry (WWTW) - Replacement of Centrifuges with Belt Presses
The capital budget is allocated for increased treatment capacity, process improvements and improved
effluent quality.
2018/19 Budget and MTREF proposed allocations
The capital budget is allocated for increased treatment capacity, process improvements or improved
effluent quality.

City of Cape Town - 2018/19 Budget (including additional recommendations read in at the Council meeting of 30 May 2018
Page 76
The proposed 2018/19 operating- and capital budget is shown on the table below.
Table 37 Wastewater Treatment Facility Budget
Wastewater Treatment Facility
R Thousand
Original
budget
Adjusted
Budget
Original
budget
Adjusted
Budget
Bellville - 20 MI/d increase in treatment capacity 60,500 43,650 71,650 73,578 113,700
Athlone: Capacity Extension-phase 1 10,000 6,000 6,000 6,000 10,000
Cape Flats: Disinfection of Effluent 40,000 28,000 36,000 18,800 75,000
Zandvliet: 18 ML/d increase in treatment capacity 187,757 108,862 199,080 91,000 366,500
Gordons Bay WWTW-Improvements: Upgrade 500 500 - -
Borchards Quarry: Replacement of Centrifuges with
Belt Presses
50,000 99,900 95,500 95,500 59,086
Mitchells Plain: Replacement of Centrifuges with Belt
Presses
50,500 50,000 10,800 10,800 2,000
Scottsdene: Capacity extension 13,000 4,500 12,100 14,969 20,017
Hout Bay: Refurbishment 14,500 4,387
Potsdam: Extension 8,000 2,120 4,000 4,000 35,100
Melkbos: Effluent Disinfection 10,000 3,000 6,000 1,200 12,000
Wesfleur WWTW: Capacity Extension 1,000 1,000 20,000 10,000 35,000
Macassar WWTW: Capacity Extension 5,000 290 15,050 10,000 25,000
Northern Regional Sludge Facility: Centralized
sludge handling facility
21,285
Infrastructure Replace / Refurbish: Replace &
Refurbish WWTW Plants
14,110 29,605 6,200 11,007 30,000
TOTAL 450,367 391,927 482,380 351,240 804,688
Category
R Thousand
Original
budget
Adjusted
Budget
Original
budget
Adjusted
Budget
Remuneration 124,656 124,253 140,708 119,499 136,543
Depreciation 97,515 109,930 117,821 124,083 133,219
Repairs & Maintenance 202,803 114,927 127,515 127,454 131,181
Contracted Services 72,534 74,467 162,297 164,083 172,747
General Expenses 174,396 159,157 101,730 90,491 102,302
Interest Internal Borrowings 80,742 73,930 79,939 74,347 78,039
Appropriation Account 228,045 200,699 327,576 201,916 351,583
Internal Utilities Expenditure 113,541 113,541 98,010 110,453 109,705
Insurance Departmental 5,924 5,924 5,412 5,412 5,671
Activity Based Costs -76,222 15,491 28,735 27,822 29,625
Support Services 53,806 48,917 70,414 61,344 66,037
TOTAL 1,077,740 1,041,236 1,260,157 1,106,903 1,316,652
Budget Year 2017/18Budget Year
2018/19
Wastewater Treatment Facility Operating Budget
Wastewater Treatment Facility Capital Budget
Budget Year 2017/18Budget Year
2018/19
Budget Year 2016/17
Budget Year 2016/17
City of Cape Town - 2018/19 Budget (including additional recommendations read in at the Council meeting of 30 May 2018
Page 77
2.4 Overview of budget related-policies
2.4.1 Approved policies
The following budget-related policies have been approved by Council and are available on the City’s
website.
• Supply Chain Management Policy (Approved July 2013)
• Management and Investment Policy (Approved October 2015; currently in the process of being
amended.)
• Asset Management Policy (Approved February 2013)
2.4.2 Policies reviewed and not amended
The following policy was reviewed at the budget-related policy workshops held during the year but was
not amended. It is available on the City’s website.
• Ward Allocation Policy (Approved January 2014)
2.4.3 Policies amended and annexed to this document
The following policies were reviewed and amended at the budget-related policy workshops held during
the year.
• Property (Tax) Rates – Annexure 2
• City Improvement Districts (CIDs) - Additional Rates - Annexure 3
• Revised Consumptive Tariffs, Rates and Basic Charges for Electricity Services, Water Services
and Waste Management Services - Annexure 4
• Rates Policy – Annexure 5
• Tariffs, Fees and Charges Book – Annexure 6
• Tariff Policies – Annexure 7
• Credit Control and Debt Collection Policy – Annexure 8
• Grants-in-Aid Policy – Annexure 9
• Policy On Accounts Payable – Annexure 10
• Funding and Reserves Policy – Annexure 11
• Virement Policy – Annexure 12
• Budget Management and Oversight Policy – Annexure 13
• Long Term Financial Plan Policy – Annexure 14
• Policy Governing Adjustment Budgets – Annexure 15
• Unforeseen and Unavoidable Expenditure Policy – Annexure 16
• Policy Governing Planning and Approval of Capital Projects – Annexure 17
2.4.4 Credit control and debt collection procedures/policies
This policy has been formulated in terms of the provisions of section 96 (b) of the Local Government:
Municipal Systems Act, 32 of 2000. The policy also includes the Indigent Policy as per Annexure 8.

City of Cape Town - 2018/19 Budget (including additional recommendations read in at the Council meeting of 30 May 2018
Page 78
2.4.5 Tariff Policy
Section 74 of the Municipal Systems Act (MSA) and section 62(1) (f) of the MFMA requires the City to
adopt and implement a tariff policy. Specific legislation applicable to each service has been taken into
consideration when determining this policy. The General Tariff Policy and subsequent Water &
Sanitation, Electricity and Waste Management tariff policies are attached as Annexure 7.
2.5 Overview of budget assumptions applied to the 2018/19 MTREF
Introduction The key budget assumptions of the 2018/19 MTREF include a discussion of the sources of information
used to develop assumptions for revenue and expenditure that drive the 3-year MTREF of the City
under the following headings:
Financial Strategic Approach
Financial Modelling and Key Planning Drivers
Economic outlook / external factors
o National and Provincial influences
Expenditure analysis – a three-year preview
Revenue analysis – a three-year preview
Local Government Equitable Share and Fuel Levy
2.5.1 Financial Strategic Approach
The 2018/19 MTREF was prepared in the midst of the City facing a critical challenge in the water crisis
that created a significant impact on the organisation’s operations. This, coupled with the fairly new
Organisation Development Transformation Plan (ODTP) requiring investment, as well as ensuring
alignment with the IDP and affordable revenue parameters made this MTREF a difficult balancing act.
The budget brief, issued by the Executive Mayor in November 2017, highlighted this and stressed that
the year’s planning cycle is definitely not business as usual. Budgetary proposals had to demonstrate
alignment to the City’s 11 transformational priorities as set out in the IDP as well as alignment to the
City’s strategies all the while remaining financially sustainable.
The New Water Plan required multi-year capital and operating investment starting with the 2017/18
financial year. The City Manager issued a directive calling for budget interventions to support the
financial impact of the drought relief actions during the current year. This is followed through into the
2018/19 financial year with further reprioritisation of the operating expenditure budget across the
organisation from Rates and other Trading Services to Water & Sanitation.
Subsequent to the tabling of the budget in March 2018 amendments to the budget were made after
considering input received via the public participation process e.g. inputs from Subcouncils, Portfolio
Committees and other technical fora and stakeholders as well as impact of the updated the New Water
Plan. The changes between the tabled and approved budget are included in the assumptions below.

City of Cape Town - 2018/19 Budget (including additional recommendations read in at the Council meeting of 30 May 2018
Page 79
2.5.2 Financial Modelling and Key Planning Drivers The principles applied to the MTREF in determining and maintaining an affordability envelope included:
Measures to absorb the financial impact of the New Water Plan:
o The permanent reduction of certain expenditure items with operating efficiencies implemented
to absorb reductions;
o The introduction of a budget principle of only providing 95% for employee costs; and
o Savings identified by introducing these measures would contribute to Water Service.
A 100% capital expenditure implementation rate assumed.
Credible collection rates based on collection achievements to date and incorporating improved
success anticipated in selected revenue items.
National- and Provincial allocations as per the 2018 Division of Revenue Bill and 2018 Provincial
Government gazette.
2.5.3 Economic outlook / external factors
Developments on the political front triggered a series of events, which favourably influenced the
domestic economy over the last few months. These changes led to an improvement in the current
economic position. NT, however, highlighted that there are various risks, which might still influence the
economic outlook. These risks include policy uncertainty and the impact of the drought on agriculture,
tourism and jobs in these sectors.
The year commenced with the Rand strengthening against the US Dollar due to the favourable
domestic political developments. Over the last few months the Rand started to depreciate which is
mainly as a result of global factors. The Rand is currently fluctuating at levels below R13/US$.
According to BER, the R/$ exchange rate is expected to end 2018 at levels of R12.02/US$.
The average Brent Crude oil price increased over the last few months reaching a three-year high of
$70.36/bbl during May. The price increase is mainly due to supply concerns. The shrinkage in the
supply is as a result of the Organisation of Petroleum Exporting Countries (OPEC) indicating that the
reduction in the supply will be sustained until the end of the year and the US plans to reintroduce
sanctions against Iran. The cost of Brent crude oil is expected to average R63.5/US$ over the next
three years.
Real GDP is expected to grow by an average of 1.8% over the next three years. The 2018 Budget
Review indicated that the improved outlook flows from strong growth in agriculture, higher commodity
prices and recovery in investor sentiments.
The Minister of Finance’s announcement of the one percentage point increase in VAT is expected to
have an impact on the future inflation outlook. According to BER this increase should raise the average
price of consumer goods and services but estimating that consumer inflation will remain below the 6%
upper ceiling of the South African Reserve Bank’s (SARB) range. The outlook on CPI fluctuated over
the last few months. The City’s CPI projection was based on BER projection during the budget planning
phase and is 5.50% for the first two years of the MTREF and 5.55% for 2020/21 per municipal financial
year.

City of Cape Town - 2018/19 Budget (including additional recommendations read in at the Council meeting of 30 May 2018
Page 80
National and Provincial influences a) National Treasury MFMA Circular No. 89, issued in December 2017
The objectives of this budget circular is to demonstrate how municipalities should undertake annual
budget preparation in accordance with the budget and financial reform agenda and associated
“game changers”. Some of the key points from the circular are:
2018/19 MTREF to be drafted in version 6.2 of Schedule A of mSCOA;
Municipalities must reconcile data on the valuation roll, billing system and Deeds office – this
might become a formal disclosure item in the near future;
Water tariff increases – the importance of improving demand management, infrastructure maintenance, loss management, meter reading and tariff setting iro water services and ensuring tariffs charged are able to cover the cost of bulk purchases, ongoing operations and provision of future infrastructure; and
Ability for customers to pay for services are declining, municipalities must consider:
o Improving the effectiveness of revenue management processes and procedures;
o Pay special attention to cost containment measures;
o Affordability of providing free basic services to all households;
o Curb consumption of water and electricity by indigents to not exceed their allocation; and
o Ensuring value for money through the procurement process.
b) National Treasury MFMA circular No. 91 issued in March 2018
This circular was the follow-up to the Circular No. 89 issued in December. It reiterated guidelines
provided in the previous circular with the main focus being the grant allocations per the 2018
Budget Review and the 2018 DORb. Circular highlights are:
A review of the economic outlook and inflation targets;
Local government grants were reprioritised and reduced. The average reduction over the
medium term is 3.5% of the local government allocations;
Government’s commitment to managing available water supply to ensure basic needs are met
and preparedness to provide financial assistance;
Section 22 of the 2017 DoRA requires that unspent conditional grants must revert back to the
National Revenue Fund unless the unspent funds is proved to be committed in which case the
funds may be rolled over. This circular provides the criteria for such rollovers and unspent grant
funds;
Application to the Office of the Chief Procurement Officer (OCPO) to participate in the RT15-
2016 transversal contract account management service offering for smart meters should
comply with the required process, which will be communicated via a circular;
A reminder to municipalities that VAT will increase from 14% to 15% and that it’s a tax increase
as a result of tax legislation that municipalities must implement, not an increase of tariffs by
municipalities; and
The budget document should be aligned to the requirements of the MBRR Schedule A
(mSCOA) format and that mSCOA data strings should be uploaded to the LG upload portal.
c) National Treasury released version 6.2 of the mSCOA grid for preparation of the 2018/19 MTREF
in December 2017.
d) The latest Division of Revenue Bill (DoRb) and Provincial Gazette as well as Fuel Levy
allocation was incorporated into the 2018/19 MTREF.

City of Cape Town - 2018/19 Budget (including additional recommendations read in at the Council meeting of 30 May 2018
Page 81
2.5.4 Expenditure analysis – a three-year preview
The required expenditure investment to provide the sustainable provision of water led to a full review
of the City’s expenditure budget. The budget was prepared with a combination of interventions that
aimed to ensure that the City gives effect to its strategies and the crucial new reality of sourcing
alternative water supply. The interventions included budget reprioritisation, budget cuts, applying
differentiated parameters and budgeting for salaries at 95%.
a) General inflation outlook and its impact on municipal activities
The City’s budget was not primarily driven by CPI this year given the budget cuts and the
differentiated parameters applied.
The annual consumer price inflation ended 2017 with an average of 5.3%. This outcome was mainly
due to a decrease in food & non–alcoholic beverages, which can be attributed to the recovery in
agriculture. The City’s CPI projection is 5.50% for the first two years of the MTREF and 5.55% for
2020/21, per municipal financial year. National Treasury’s CPI projection was reviewed to 5.3%
for 2018/19, and 5.4% and 5.5% for 2019/20 and 2020/21 respectively over the national financial
years. These levels are within the SARB inflation targeting range of between 3% to 6%.
b) Contracted Services, Overtime and Operational Cost
The underlying budget theme remains cost containment and budget efficiencies and to give effect
to this a combination of a zero-based budgeting and a differentiated approach was adopted based
on the nature of expenditure and previous years’ expenditure performance. This approach included
reducing the base and applying differentiated parameters to elements in the above mentioned
categories of expenditure over the 2018/19 MTREF. In addition, budget reprioritisation was also
implemented to assist with the cost of providing new sources of water supply.
c) Interest rates for borrowing and investment of funds
The City’s investments are done in terms of the Cash Management and Investment policy, which
aims to secure the sound and sustainable management of the City’s surplus cash and investments.
An average investment rate of 7% is forecasted over the 2018/19 MTREF.
d) Collection rate for Property Rates and Service charges
Table 38 Collection Rates
ServiceBase Budget
2017/18
Budget Year
2018/19
Budget Year +1
2019/20
Budget Year +2
2020/21
Rates 96.0% 96.0% 96.0% 96.0%
Electricity 98.0% 98.0% 98.0% 98.0%
Water 82.0% 70.7% 70.7% 82.0%
Sanitation 86.0% 86.0% 86.0% 86.0%
Refuse 93.0% 93.0% 93.0% 93.0%
The Property Rates collection rate remains at 96%, which is supported by previous years’
outcomes.
Electricity collection rate remains at 98% over the 2018/19 MTREF. This is mainly attributed to
the continuous rollout of prepaid meters and revenue protection initiatives.
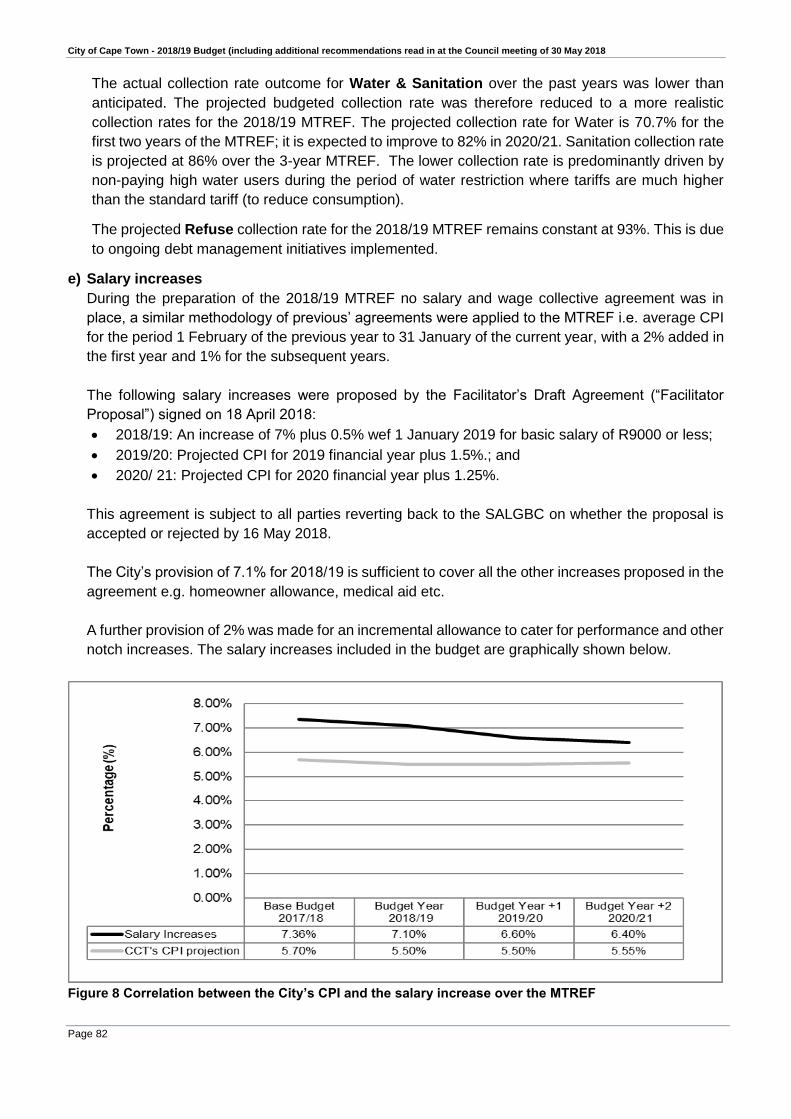
City of Cape Town - 2018/19 Budget (including additional recommendations read in at the Council meeting of 30 May 2018
Page 82
The actual collection rate outcome for Water & Sanitation over the past years was lower than
anticipated. The projected budgeted collection rate was therefore reduced to a more realistic
collection rates for the 2018/19 MTREF. The projected collection rate for Water is 70.7% for the
first two years of the MTREF; it is expected to improve to 82% in 2020/21. Sanitation collection rate
is projected at 86% over the 3-year MTREF. The lower collection rate is predominantly driven by
non-paying high water users during the period of water restriction where tariffs are much higher
than the standard tariff (to reduce consumption).
The projected Refuse collection rate for the 2018/19 MTREF remains constant at 93%. This is due
to ongoing debt management initiatives implemented.
e) Salary increases
During the preparation of the 2018/19 MTREF no salary and wage collective agreement was in
place, a similar methodology of previous’ agreements were applied to the MTREF i.e. average CPI
for the period 1 February of the previous year to 31 January of the current year, with a 2% added in
the first year and 1% for the subsequent years.
The following salary increases were proposed by the Facilitator’s Draft Agreement (“Facilitator
Proposal”) signed on 18 April 2018:
2018/19: An increase of 7% plus 0.5% wef 1 January 2019 for basic salary of R9000 or less;
2019/20: Projected CPI for 2019 financial year plus 1.5%.; and
2020/ 21: Projected CPI for 2020 financial year plus 1.25%.
This agreement is subject to all parties reverting back to the SALGBC on whether the proposal is
accepted or rejected by 16 May 2018.
The City’s provision of 7.1% for 2018/19 is sufficient to cover all the other increases proposed in the
agreement e.g. homeowner allowance, medical aid etc.
A further provision of 2% was made for an incremental allowance to cater for performance and other
notch increases. The salary increases included in the budget are graphically shown below.
Figure 8 Correlation between the City’s CPI and the salary increase over the MTREF
City of Cape Town - 2018/19 Budget (including additional recommendations read in at the Council meeting of 30 May 2018
Page 83
In addition to the above, the City instituted a change in the method of budgeting for salaries.
Previous years’ outcome showed a constant under performance on salaries. Based on this it was
decided that salaries will be budgeted at 95% over the MTREF period.
f) Ensuring maintenance of existing assets
As per 2017/18, a differentiated approach was applied to the expenditure elements relating to
repairs and maintenance over the 2018/19 MTREF. This approach considered the nature of the
work that individual services provide. The following varying parameters were applied:
10% reduction to 2017/18 base with no increase over the 2018/19 MTREF for services that are
supportive in nature;
A CPI increase to services whose main function is not providing repairs & maintenance,
however the nature of their business and facilities is such that it requires a proper maintenance
provision; and
CPI + 1% applied to services who needs to secure the health of their assets.
NT Circular 55 and NT Circular 70 set the ratio of operational repairs and maintenance to asset
value (write down value of the municipality’s property, plant and equipment (PPE) at 8%. The City
averages 7.6% over the 2018/19 MTREF. The lower ratio outcome is as a result of the
reprioritisation of the budget and the accelerated capital investment in new water supply initiatives.
This new capital investment would not require immediate repairs and maintenance.
g) Operational financing for capital
Depreciation
The calculation of depreciation on new capital expenditure is based on variables such as asset
class and lifespan, depending on the nature of the asset. An annual capital expenditure
implementation rate of 100% was assumed. Depreciation of existing assets is calculated based
on simulated SAP data that reflect actual values per annum. Assets under construction (AUC) are
calculated based on asset class lifespan and projected capitalisation dates.
Credit rating outlook and borrowing
The City needs a credit rating to demonstrate its ability to meet its short- and long-term financial
obligations. Potential lenders also use it to assess the City's credit risk, which in turn affects the
pricing of any subsequent loans taken. Factors used to evaluate the creditworthiness of
municipalities include the economy, debt, finances, politics, management and institutional
framework.
On 29 March 2018, Moody’s Investors Service provided an update to the City’s credit analysis.
The City’s global and national scale ratings were confirmed with a negative outlook. The City’s
outlook was not upgraded to “Stable” in line with the action taken on the sovereign rating due to
challenges associated with the current water crisis.
The City’s national scale rating is currently Aaa.za/P-1.za, which reflects the City’s credit profile of
strong financial performance characterised by annual operating surplus, strong financial debt
management, low debt and diverse economic profile. The City’s credit profile is, however,
constrained by the water shortage, the direct impact it has on water revenue, the indirect economic
and societal effects and the increased capital expenditure required to ensure the supply of water.
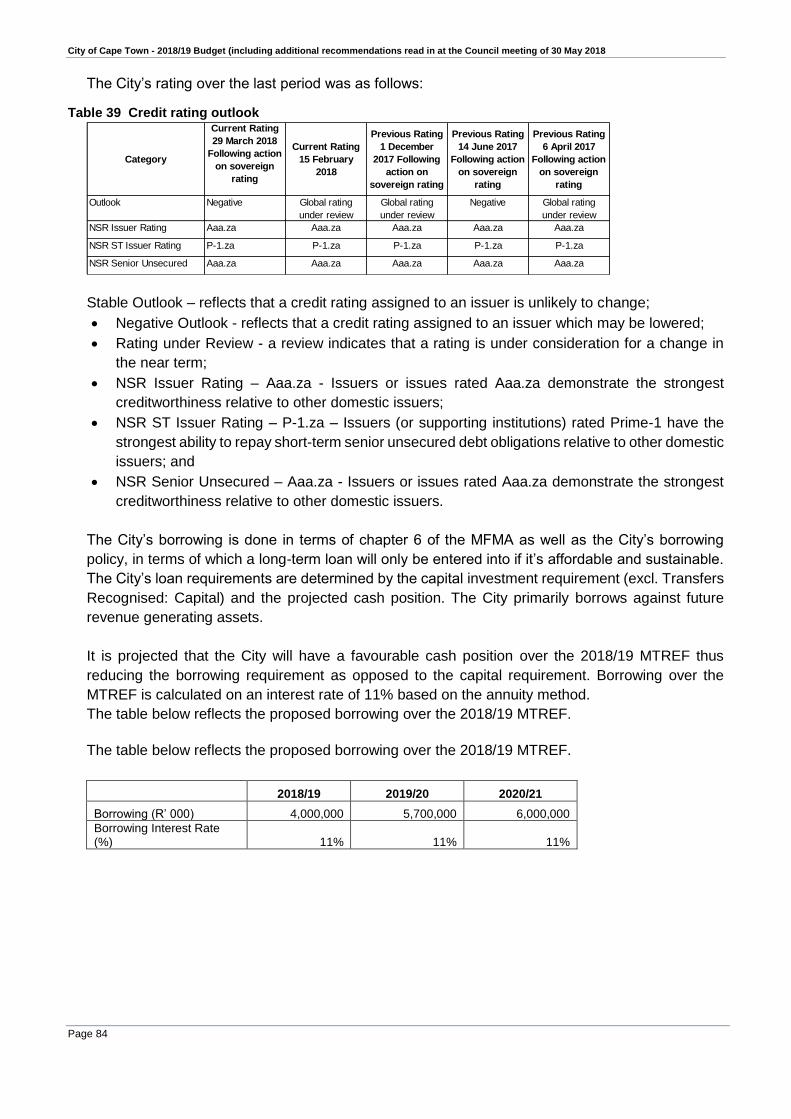
City of Cape Town - 2018/19 Budget (including additional recommendations read in at the Council meeting of 30 May 2018
Page 84
The City’s rating over the last period was as follows:
Table 39 Credit rating outlook
Category
Current Rating
29 March 2018
Following action
on sovereign
rating
Current Rating
15 February
2018
Previous Rating
1 December
2017 Following
action on
sovereign rating
Previous Rating
14 June 2017
Following action
on sovereign
rating
Previous Rating
6 April 2017
Following action
on sovereign
rating
Outlook Negative Global rating
under review
Global rating
under review
Negative Global rating
under review
NSR Issuer Rating Aaa.za Aaa.za Aaa.za Aaa.za Aaa.za
NSR ST Issuer Rating P-1.za P-1.za P-1.za P-1.za P-1.za
NSR Senior Unsecured Aaa.za Aaa.za Aaa.za Aaa.za Aaa.za
Stable Outlook – reflects that a credit rating assigned to an issuer is unlikely to change;
Negative Outlook - reflects that a credit rating assigned to an issuer which may be lowered;
Rating under Review - a review indicates that a rating is under consideration for a change in
the near term;
NSR Issuer Rating – Aaa.za - Issuers or issues rated Aaa.za demonstrate the strongest
creditworthiness relative to other domestic issuers;
NSR ST Issuer Rating – P-1.za – Issuers (or supporting institutions) rated Prime-1 have the
strongest ability to repay short-term senior unsecured debt obligations relative to other domestic
issuers; and
NSR Senior Unsecured – Aaa.za - Issuers or issues rated Aaa.za demonstrate the strongest
creditworthiness relative to other domestic issuers.
The City’s borrowing is done in terms of chapter 6 of the MFMA as well as the City’s borrowing
policy, in terms of which a long-term loan will only be entered into if it’s affordable and sustainable.
The City’s loan requirements are determined by the capital investment requirement (excl. Transfers
Recognised: Capital) and the projected cash position. The City primarily borrows against future
revenue generating assets.
It is projected that the City will have a favourable cash position over the 2018/19 MTREF thus
reducing the borrowing requirement as opposed to the capital requirement. Borrowing over the
MTREF is calculated on an interest rate of 11% based on the annuity method.
The table below reflects the proposed borrowing over the 2018/19 MTREF.
The table below reflects the proposed borrowing over the 2018/19 MTREF.
2018/19 2019/20 2020/21
Borrowing (R’ 000) 4,000,000 5,700,000 6,000,000
Borrowing Interest Rate (%) 11% 11% 11%
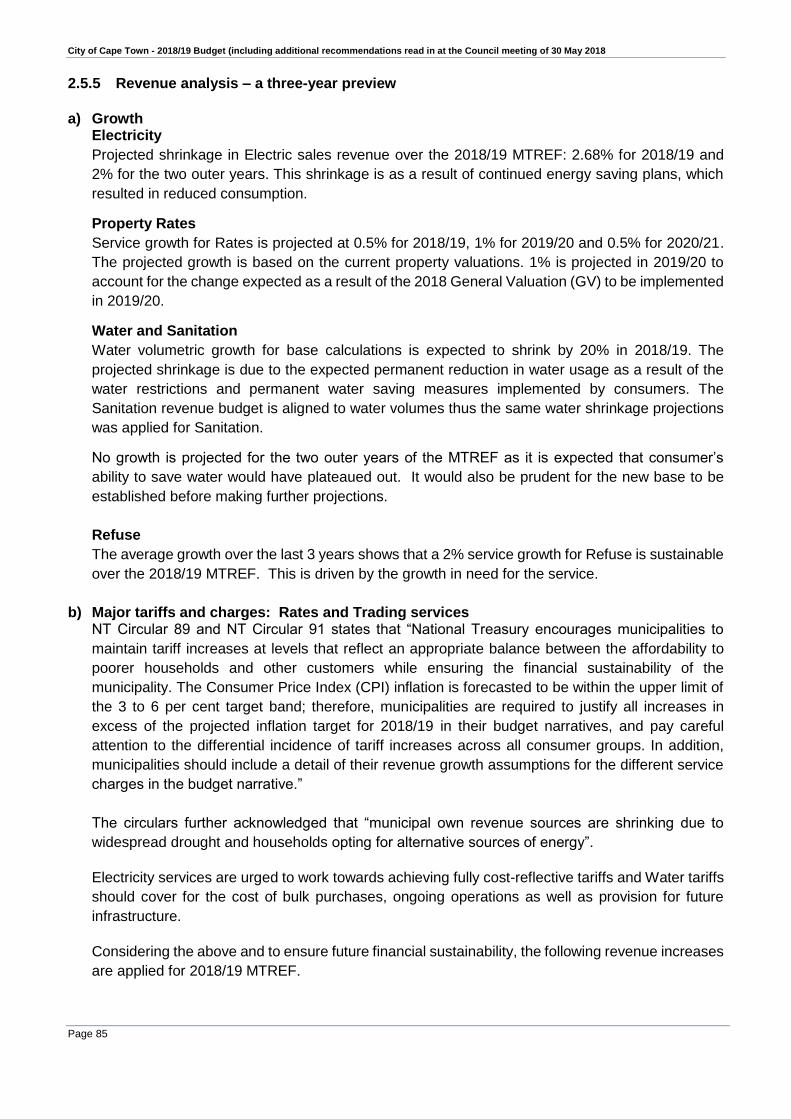
City of Cape Town - 2018/19 Budget (including additional recommendations read in at the Council meeting of 30 May 2018
Page 85
2.5.5 Revenue analysis – a three-year preview
a) Growth
Electricity
Projected shrinkage in Electric sales revenue over the 2018/19 MTREF: 2.68% for 2018/19 and
2% for the two outer years. This shrinkage is as a result of continued energy saving plans, which
resulted in reduced consumption.
Property Rates
Service growth for Rates is projected at 0.5% for 2018/19, 1% for 2019/20 and 0.5% for 2020/21.
The projected growth is based on the current property valuations. 1% is projected in 2019/20 to
account for the change expected as a result of the 2018 General Valuation (GV) to be implemented
in 2019/20.
Water and Sanitation
Water volumetric growth for base calculations is expected to shrink by 20% in 2018/19. The
projected shrinkage is due to the expected permanent reduction in water usage as a result of the
water restrictions and permanent water saving measures implemented by consumers. The
Sanitation revenue budget is aligned to water volumes thus the same water shrinkage projections
was applied for Sanitation.
No growth is projected for the two outer years of the MTREF as it is expected that consumer’s
ability to save water would have plateaued out. It would also be prudent for the new base to be
established before making further projections.
Refuse
The average growth over the last 3 years shows that a 2% service growth for Refuse is sustainable
over the 2018/19 MTREF. This is driven by the growth in need for the service.
b) Major tariffs and charges: Rates and Trading services NT Circular 89 and NT Circular 91 states that “National Treasury encourages municipalities to
maintain tariff increases at levels that reflect an appropriate balance between the affordability to
poorer households and other customers while ensuring the financial sustainability of the
municipality. The Consumer Price Index (CPI) inflation is forecasted to be within the upper limit of
the 3 to 6 per cent target band; therefore, municipalities are required to justify all increases in
excess of the projected inflation target for 2018/19 in their budget narratives, and pay careful
attention to the differential incidence of tariff increases across all consumer groups. In addition,
municipalities should include a detail of their revenue growth assumptions for the different service
charges in the budget narrative.”
The circulars further acknowledged that “municipal own revenue sources are shrinking due to
widespread drought and households opting for alternative sources of energy”.
Electricity services are urged to work towards achieving fully cost-reflective tariffs and Water tariffs
should cover for the cost of bulk purchases, ongoing operations as well as provision for future
infrastructure.
Considering the above and to ensure future financial sustainability, the following revenue increases
are applied for 2018/19 MTREF.
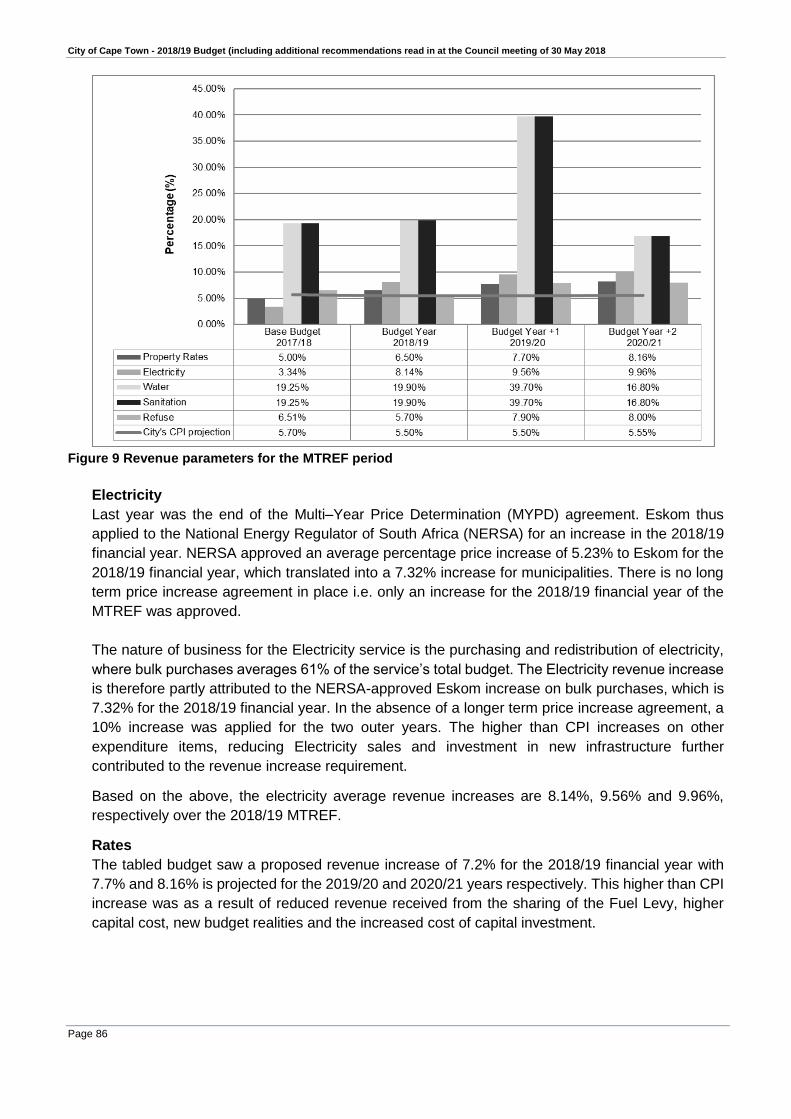
City of Cape Town - 2018/19 Budget (including additional recommendations read in at the Council meeting of 30 May 2018
Page 86
Figure 9 Revenue parameters for the MTREF period
Electricity
Last year was the end of the Multi–Year Price Determination (MYPD) agreement. Eskom thus
applied to the National Energy Regulator of South Africa (NERSA) for an increase in the 2018/19
financial year. NERSA approved an average percentage price increase of 5.23% to Eskom for the
2018/19 financial year, which translated into a 7.32% increase for municipalities. There is no long
term price increase agreement in place i.e. only an increase for the 2018/19 financial year of the
MTREF was approved.
The nature of business for the Electricity service is the purchasing and redistribution of electricity,
where bulk purchases averages 61% of the service’s total budget. The Electricity revenue increase
is therefore partly attributed to the NERSA-approved Eskom increase on bulk purchases, which is
7.32% for the 2018/19 financial year. In the absence of a longer term price increase agreement, a
10% increase was applied for the two outer years. The higher than CPI increases on other
expenditure items, reducing Electricity sales and investment in new infrastructure further
contributed to the revenue increase requirement.
Based on the above, the electricity average revenue increases are 8.14%, 9.56% and 9.96%,
respectively over the 2018/19 MTREF.
Rates
The tabled budget saw a proposed revenue increase of 7.2% for the 2018/19 financial year with
7.7% and 8.16% is projected for the 2019/20 and 2020/21 years respectively. This higher than CPI
increase was as a result of reduced revenue received from the sharing of the Fuel Levy, higher
capital cost, new budget realities and the increased cost of capital investment.
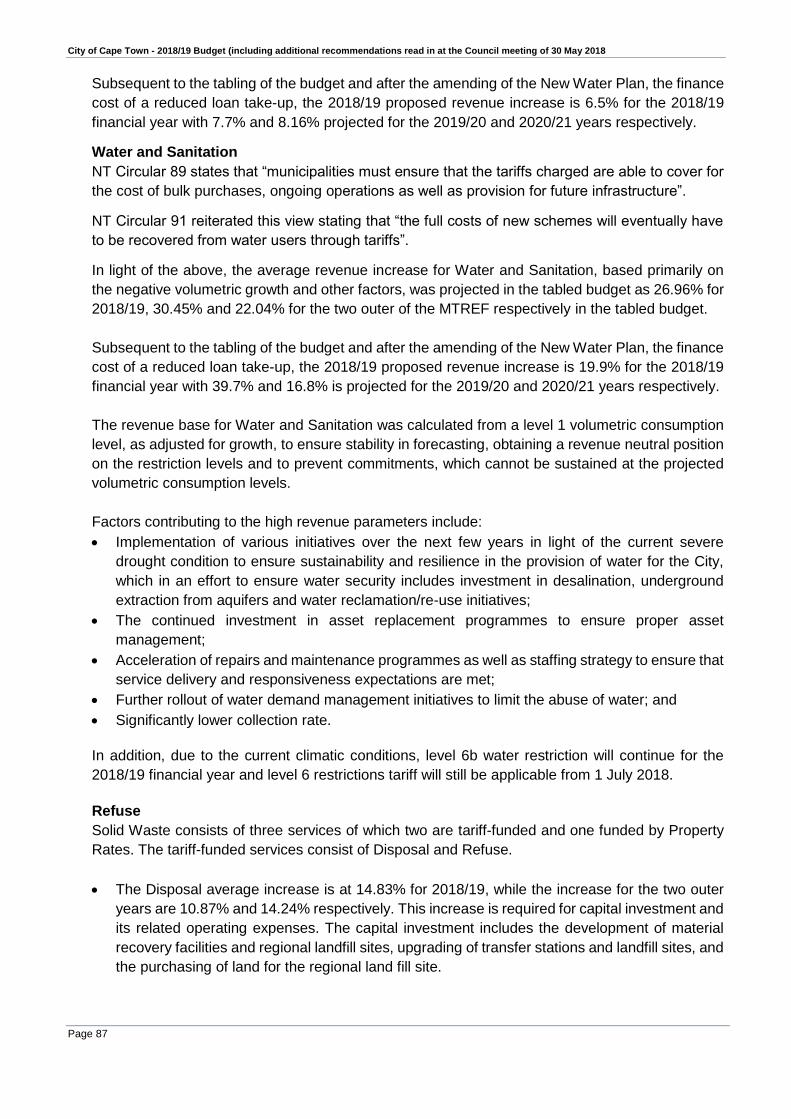
City of Cape Town - 2018/19 Budget (including additional recommendations read in at the Council meeting of 30 May 2018
Page 87
Subsequent to the tabling of the budget and after the amending of the New Water Plan, the finance
cost of a reduced loan take-up, the 2018/19 proposed revenue increase is 6.5% for the 2018/19
financial year with 7.7% and 8.16% projected for the 2019/20 and 2020/21 years respectively.
Water and Sanitation
NT Circular 89 states that “municipalities must ensure that the tariffs charged are able to cover for
the cost of bulk purchases, ongoing operations as well as provision for future infrastructure”.
NT Circular 91 reiterated this view stating that “the full costs of new schemes will eventually have
to be recovered from water users through tariffs”.
In light of the above, the average revenue increase for Water and Sanitation, based primarily on
the negative volumetric growth and other factors, was projected in the tabled budget as 26.96% for
2018/19, 30.45% and 22.04% for the two outer of the MTREF respectively in the tabled budget.
Subsequent to the tabling of the budget and after the amending of the New Water Plan, the finance
cost of a reduced loan take-up, the 2018/19 proposed revenue increase is 19.9% for the 2018/19
financial year with 39.7% and 16.8% is projected for the 2019/20 and 2020/21 years respectively.
The revenue base for Water and Sanitation was calculated from a level 1 volumetric consumption
level, as adjusted for growth, to ensure stability in forecasting, obtaining a revenue neutral position
on the restriction levels and to prevent commitments, which cannot be sustained at the projected
volumetric consumption levels.
Factors contributing to the high revenue parameters include:
Implementation of various initiatives over the next few years in light of the current severe
drought condition to ensure sustainability and resilience in the provision of water for the City,
which in an effort to ensure water security includes investment in desalination, underground
extraction from aquifers and water reclamation/re-use initiatives;
The continued investment in asset replacement programmes to ensure proper asset
management;
Acceleration of repairs and maintenance programmes as well as staffing strategy to ensure that
service delivery and responsiveness expectations are met;
Further rollout of water demand management initiatives to limit the abuse of water; and
Significantly lower collection rate.
In addition, due to the current climatic conditions, level 6b water restriction will continue for the
2018/19 financial year and level 6 restrictions tariff will still be applicable from 1 July 2018.
Refuse
Solid Waste consists of three services of which two are tariff-funded and one funded by Property
Rates. The tariff-funded services consist of Disposal and Refuse.
The Disposal average increase is at 14.83% for 2018/19, while the increase for the two outer
years are 10.87% and 14.24% respectively. This increase is required for capital investment and
its related operating expenses. The capital investment includes the development of material
recovery facilities and regional landfill sites, upgrading of transfer stations and landfill sites, and
the purchasing of land for the regional land fill site.
City of Cape Town - 2018/19 Budget (including additional recommendations read in at the Council meeting of 30 May 2018
Page 88
The Refuse average increase is 5.7% for 2018/19 and 7.9% and 8% for the two outer years
respectively. The average increase will allow, inter alia, for the service to comply with the
NEMWA waste minimisation requirements by increasing the removal of recycling at the source
and upgrading of solid waste depot facilities.
Housing rental (Council rental properties)
The monthly rental charge for the City’s housing rental properties is based on a rate per square
meter applied to the size of the unit being rented coupled with a set of premiums/deductions based
on the location, maintenance level, facilities et al of the specific property for which the rent is
charged.
Through addressing the economic challenges faced by many poorer communities residing in,
particularly, the City’s rental stock, the average total monthly rental charge percentage increase
associated with the City’s rental properties has been retained at an affordable level and is based
on an annual increase of 7.02% (where the unit has a separate water meter) or 14.30% (for those
units which include water in the rental charge) for 2018/19.
The annual rental charge percentage increase, acknowledging the ongoing multi-year implications
of inflation on the costs associated with the management of rental properties including, inter alia,
maintenance of the properties, administrative costs is not directly aligned to the full economic cost
of operating the rental units and operates on a City of Cape Town subsidized basis for the financial
differential between the economic cost recovery based rental (CPI linked) and the actual amount
charged.
Tenants who were in occupation of the City’s rental properties in 2007 receive a subsidy of 20% of
the rental charge being the final portion of the phase out program which was not fully implemented
by the City to facilitate affordability of long standing tenants. This key initiative, reflected within the
City’s Housing Debt Management Policy, supports affordable rentals to many poor communities
and supports the City’s initiatives in terms of its housing debt collection drives whilst supporting the
City’s housing debtor book that it does not unduly increase due to, potentially, unreachable
charges.
The proposed 2018/19 housing rental charge is in line with previous annual rental increases and is
again aimed at ensuring affordability for the City’s poorer communities. The rental rate (per square
meter per month) is R10.37 (where the unit has a separate water meter) or a rental charge
(including water charge where applicable) of R16.87 per square meter per month.
The City’s housing premiums and deductions charge structure addressing the variations in the
City’s diverse rental properties remains as follows:
Discounts on account
• Outside toilet (R20 per month)
• External Water (R30 per month)
• No ceiling (R15 per month)

City of Cape Town - 2018/19 Budget (including additional recommendations read in at the Council meeting of 30 May 2018
Page 89
Premiums on account
• Saleable unit (R4,50 per month)
• Well maintained (R5 per month)
• Local environment (R3,50 per month)
• Well located (R5 per month)
• Hot water cylinder (R4 per month)
A surcharge for tenants earning a monthly income above the rental income threshold of R3 500 is
charged at a stepped rate of 8% for those earning R3 501 – R7 500 and 10% for those earning R7
501 – R10 000. Tenants who earn more than R10 000 per month will pay a surcharge of 25% of
any amount above R10 000. A two (2) year lease agreement will be signed which will not be
renewed if the income remains more than R10 000.
c) Capital funding The total capital budget included for the MTREF is:
Table 40 Capital Budget over MTREF
Capital funding
R thousands
Budget Year
2018/19
Budget Year +1
2019/20
Budget Year +2
2020/21
Transfers recognised - capital 2,067,896 2,118,842 2,296,333
Public contributions & donations 76,200 78,600 112,100
Borrowing 4,000,000 5,700,000 6,000,000
Internally generated funds 2,263,460 1,917,880 1,698,351
TOTAL 8,407,556 9,815,321 10,106,785
2.5.6 2018 Division of Revenue Bill (DoRb) and Fuel Levy
Equitable Share
In terms of section 227 of the Constitution, local government is entitled to an equitable share of
nationally raised revenue to enable it to provide basic services and perform its allocated functions. The
local government equitable share is an unconditional transfer that supplements the revenue that
municipalities can raise themselves (including revenue raised through property rates and service
charges).
The equitable share provision included in the budget is based on the 2018 DoRb. The equitable share
amounts allocated to the City are:
2018/19 – R2 575 million
2019/20 – R2 816 million
2020/21 – R3 092 million
Sharing of the Fuel Levy
The sharing of the general Fuel Levy with metropolitan municipalities was introduced in 2008/09 as a
replacement for the RSC levies previously collected by municipalities. The general Fuel Levy is
legislated by the Taxation Laws Amendment Act (Act 17 of 2009), which provides that each
metropolitan’s share should be announced in the government gazette.
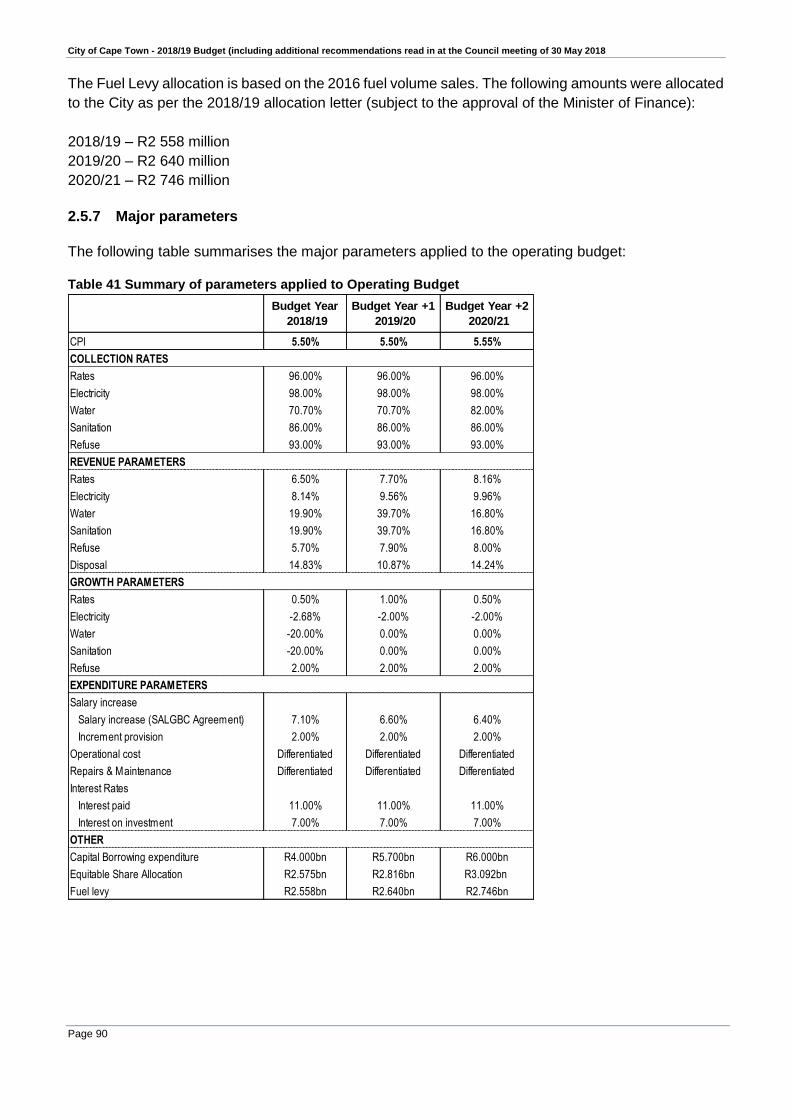
City of Cape Town - 2018/19 Budget (including additional recommendations read in at the Council meeting of 30 May 2018
Page 90
The Fuel Levy allocation is based on the 2016 fuel volume sales. The following amounts were allocated
to the City as per the 2018/19 allocation letter (subject to the approval of the Minister of Finance):
2018/19 – R2 558 million
2019/20 – R2 640 million
2020/21 – R2 746 million
2.5.7 Major parameters
The following table summarises the major parameters applied to the operating budget: Table 41 Summary of parameters applied to Operating Budget
Budget Year
2018/19
Budget Year +1
2019/20
Budget Year +2
2020/21
CPI 5.50% 5.50% 5.55%
COLLECTION RATES
Rates 96.00% 96.00% 96.00%
Electricity 98.00% 98.00% 98.00%
Water 70.70% 70.70% 82.00%
Sanitation 86.00% 86.00% 86.00%
Refuse 93.00% 93.00% 93.00%
REVENUE PARAMETERS
Rates 6.50% 7.70% 8.16%
Electricity 8.14% 9.56% 9.96%
Water 19.90% 39.70% 16.80%
Sanitation 19.90% 39.70% 16.80%
Refuse 5.70% 7.90% 8.00%
Disposal 14.83% 10.87% 14.24%
GROWTH PARAMETERS
Rates 0.50% 1.00% 0.50%
Electricity -2.68% -2.00% -2.00%
Water -20.00% 0.00% 0.00%
Sanitation -20.00% 0.00% 0.00%
Refuse 2.00% 2.00% 2.00%
EXPENDITURE PARAMETERS
Salary increase
Salary increase (SALGBC Agreement) 7.10% 6.60% 6.40%
Increment provision 2.00% 2.00% 2.00%
Operational cost Differentiated Differentiated Differentiated
Repairs & Maintenance Differentiated Differentiated Differentiated
Interest Rates
Interest paid 11.00% 11.00% 11.00%
Interest on investment 7.00% 7.00% 7.00%
OTHER
Capital Borrowing expenditure R4.000bn R5.700bn R6.000bn
Equitable Share Allocation R2.575bn R2.816bn R3.092bn
Fuel levy R2.558bn R2.640bn R2.746bn

City of Cape Town - 2018/19 Budget (including additional recommendations read in at the Council meeting of 30 May 2018
Page 91
2.6 Overview of budget funding
2.6.1 Medium-term outlook: operating revenue The following table is a breakdown of the operating revenue over the medium-term: Table 42 Breakdown of the operating revenue over the medium-term
Description
R thousandBudget Year
2018/19%
Budget Year +1
2019/20%
Budget Year +2
2020/21%
Property Rates 9,361,952 23.8% 10,248,287 23.3% 11,131,713 23.1%
Service Charges 19,179,838 48.7% 22,414,325 50.9% 25,204,467 52.2%
Investment Revenue 936,513 2.4% 989,834 2.2% 1,020,077 2.1%
Transfers & Subsidies 6,803,608 17.3% 7,101,185 16.1% 7,464,469 15.5%
Other own revenue 3,067,907 7.8% 3,239,489 7.4% 3,422,266 7.1%
Total Revenue (excluding capital transfers and
contributions)
39,349,818 100% 43,993,121 100% 48,242,992 100%
2018/19 Medium Term Revenue & Expenditure Framework
The following graph is a breakdown of the operational revenue per main category for 2018/19.
Figure 10 Breakdown of operating revenue over the 2018/19 MTREF
Tariff setting plays a major role in ensuring desired levels of revenue. To ensure an effective, efficient
and well-run City, higher tariff increases are inevitable. Getting tariffs right assists in the compilation of
a credible and funded budget.

City of Cape Town - 2018/19 Budget (including additional recommendations read in at the Council meeting of 30 May 2018
Page 92
The City derives most of its operational revenue from its service charges (48.7% of total revenue) i.e.
provision of services such as water, electricity, sanitation and solid waste removal. Property Rates
(23.8%), Transfers & Subsidies (17.3%), Investment revenue (2.4%) and Other own revenue (minor
charges i.e. building plan fees, licences, permits etc.) (7.8%) forms part of the 2018/19 revenue base.
The revenue strategy is a function of a number of key aspects such as:
National Treasury Guidelines;
General Economic Climate (Nationally and Local);
City’s Strategic Guidelines and Priorities;
General Tariff Policy;
Credit Control and Debt Collection Policy;
Property Rates Policy;
Total Municipal Account Modelling Process;
Achievement of full recovery of cost for specific user charges; and a
Credible collection ratio.
The principles as mentioned above guide and inform the annual increase of tariffs and rates charged
to the consumers and ratepayers.
Revenue to be generated from Property Rates in 2018/19 amounts to R9 362 million and represents
23.7% of the operating revenue base of the City. It increases to R11 132 million in 2020/21.
Service Charges relating to electricity, water, sanitation and refuse removal constitute the biggest
component of the revenue basket of the City totalling R19 180 million in 2018/19. For 2018/19, Service
Charges are 49% of the total revenue base.
Transfers & Subsidies increases from R6 804 in 2018/19 to R7 464 million in 2020/21. This includes
external allocations received from National- and Provincial Government, private sector funding and the
Fuel Levy.
Table 43 MBRR Table SA15 - Detailed investment information
2014/15 2015/16 2016/17
R thousand
Parent municipality
Securities - National Government 69,820 76,655 84,240 84,240 84,240 84,240 84,240 84,240 84,240
Listed Corporate Bonds – – – – – – – – –
Deposits - Bank 6,854,595 7,495,700 7,350,420 8,093,233 9,207,150 9,207,150 9,650,666 11,002,981 13,518,234
Deposits - Public Investment Commissioners – – – – – – – – –
Deposits - Corporation for Public Deposits – – – – – – – – –
Bankers Acceptance Certificates – – – – – – – – –
Negotiable Certificates of Deposit - Banks – – – – – – – – –
Guaranteed Endowment Policies (sinking) 1,631,750 1,788,477 2,051,869 2,265,047 2,265,047 2,265,047 2,503,755 2,771,615 3,070,090
Repurchase Agreements - Banks – – – – – – – – –
Municipal Bonds – – – – – – – – –
TOTAL 8,556,165 9,360,832 9,486,529 10,442,521 11,556,438 11,556,438 12,238,662 13,858,836 16,672,564
Audited
Outcome
Audited
Outcome
Audited
Outcome
Original
Budget
Adjusted
Budget
Full Year
Forecast
Budget Year
+2 2020/21
Budget Year
+1 2019/20
Budget Year
2018/19
Investment typeCurrent Year 2017/18
2018/19 Medium Term Revenue & Expenditure
Framework

City of Cape Town - 2018/19 Budget (including additional recommendations read in at the Council meeting of 30 May 2018
Page 93
Table 44 MBRR Table SA16 - Investment particulars by maturity
Investments by MaturityPeriod of
Investment
Name of institution &
investment IDYrs/Months
ABSA 73 Fixed Deposit No Fixed 7.15 No N/A 25-May-18 25,000 36 – – 25,036
ABSA 70 Fixed Deposit No Fixed 7.15 No N/A 25-May-18 150,000 206 – – 150,206
ABSA 17 Fixed Deposit No Fixed 6.7 No N/A 25-May-18 25,000 8 – – 25,008
ABSA 70 Fixed Deposit No Fixed 7.15 No N/A 31-May-18 25,000 34 – – 25,034
ABSA 51 Fixed Deposit No Fixed 6.85 No N/A 1-Jun-18 15,000 14 – – 15,014
ABSA 50 Fixed Deposit No Fixed 6.85 No N/A 1-Jun-18 20,000 19 – – 20,019
ABSA 72 Fixed Deposit No Fixed 7.15 No N/A 8-Jun-18 30,000 42 – – 30,042
ABSA 87 Fixed Deposit No Fixed 7.25 No N/A 15-Jun-18 155,000 268 – – 155,268
ABSA 72 Fixed Deposit No Fixed 6.95 No N/A 15-Jun-18 45,000 62 – – 45,062
ABSA 78 Fixed Deposit No Fixed 6.97 No N/A 22-Jun-18 25,000 37 – – 25,037
ABSA 59 Fixed Deposit No Fixed 6.9 No N/A 22-Jun-18 25,000 28 – – 25,028
ABSA 63 Fixed Deposit No Fixed 6.85 No N/A 25-Jun-18 50,000 59 – – 50,059
ABSA 54 Fixed Deposit No Fixed 6.85 No N/A 25-Jun-18 30,000 30 – – 30,030
ABSA 47 Fixed Deposit No Fixed 6.85 No N/A 25-Jun-18 20,000 18 – – 20,018
ABSA 92 Fixed Deposit No Fixed 7.25 No N/A 27-Jun-18 25,000 46 – – 25,046
ABSA 93 Fixed Deposit No Fixed 7.25 No N/A 27-Jun-18 30,000 55 – – 30,055
ABSA 70 Fixed Deposit No Fixed 6.9 No N/A 29-Jun-18 25,000 33 – – 25,033
ABSA 72 Fixed Deposit No Fixed 6.9 No N/A 29-Jun-18 25,000 34 – – 25,034
ABSA 71 Fixed Deposit No Fixed 6.9 No N/A 29-Jun-18 15,000 20 – – 15,020
ABSA 56 Fixed Deposit No Fixed 6.9 No N/A 6-Jul-18 25,000 26 – – 25,026
ABSA 59 Fixed Deposit No Fixed 6.9 No N/A 13-Jul-18 40,000 45 – – 40,045
ABSA 56 Fixed Deposit No Fixed 6.88 No N/A 13-Jul-18 20,000 21 – – 20,021
ABSA 64 Fixed Deposit No Fixed 6.9 No N/A 13-Jul-18 20,000 24 – – 20,024
ABSA 58 Fixed Deposit No Fixed 6.9 No N/A 13-Jul-18 20,000 22 – – 20,022
ABSA 57 Fixed Deposit No Fixed 6.88 No N/A 13-Jul-18 20,000 21 – – 20,021
Firstrand 73 Fixed Deposit No Fixed 6.9 No N/A 25-May-18 20,000 28 – – 20,028
Firstrand 70 Fixed Deposit No Fixed 6.875 No N/A 25-May-18 165,000 218 – – 165,218
Firstrand 17 Fixed Deposit No Fixed 6.55 No N/A 25-May-18 40,000 12 – – 40,012
Firstrand 70 Fixed Deposit No Fixed 6.875 No N/A 31-May-18 25,000 33 – – 25,033
Firstrand 51 Fixed Deposit No Fixed 6.64 No N/A 1-Jun-18 25,000 23 – – 25,023
Firstrand 50 Fixed Deposit No Fixed 6.63 No N/A 1-Jun-18 20,000 18 – – 20,018
Firstrand 72 Fixed Deposit No Fixed 6.9 No N/A 8-Jun-18 35,000 48 – – 35,048
Firstrand 87 Fixed Deposit No Fixed 7.05 No N/A 15-Jun-18 165,000 277 – – 165,277
Firstrand 72 Fixed Deposit No Fixed 6.7 No N/A 15-Jun-18 40,000 53 – – 40,053
Firstrand 78 Fixed Deposit No Fixed 6.7 No N/A 22-Jun-18 30,000 43 – – 30,043
Firstrand 59 Fixed Deposit No Fixed 6.675 No N/A 22-Jun-18 15,000 16 – – 15,016
Firstrand 54 Fixed Deposit No Fixed 6.62 No N/A 25-Jun-18 40,000 39 – – 40,039
Firstrand 47 Fixed Deposit No Fixed 6.64 No N/A 25-Jun-18 30,000 26 – – 30,026
Firstrand 92 Fixed Deposit No Fixed 7.05 No N/A 27-Jun-18 25,000 44 – – 25,044
Firstrand 93 Fixed Deposit No Fixed 7.05 No N/A 27-Jun-18 45,000 81 – – 45,081
Firstrand 92 Fixed Deposit No Fixed 6.867 No N/A 29-Jun-18 10,000 17 – – 10,017
Firstrand 92 Fixed Deposit No Fixed 6.867 No N/A 29-Jun-18 12,000 21 – – 12,021
Firstrand 92 Fixed Deposit No Fixed 6.867 No N/A 29-Jun-18 9,000 16 – – 9,016
Firstrand 92 Fixed Deposit No Fixed 6.867 No N/A 29-Jun-18 12,000 21 – – 12,021
Firstrand 70 Fixed Deposit No Fixed 6.7 No N/A 29-Jun-18 30,000 39 – – 30,039
Firstrand 72 Fixed Deposit No Fixed 6.7 No N/A 29-Jun-18 25,000 33 – – 25,033
Firstrand 71 Fixed Deposit No Fixed 6.7 No N/A 29-Jun-18 20,000 26 – – 20,026
Firstrand 53 Fixed Deposit No Fixed 6.64 No N/A 6-Jul-18 40,000 39 – – 40,039
Firstrand 59 Fixed Deposit No Fixed 6.675 No N/A 13-Jul-18 30,000 32 – – 30,032
Firstrand 64 Fixed Deposit No Fixed 6.675 No N/A 13-Jul-18 20,000 23 – – 20,023
Firstrand 58 Fixed Deposit No Fixed 6.675 No N/A 13-Jul-18 20,000 21 – – 20,021
Firstrand 57 Fixed Deposit No Fixed 6.675 No N/A 13-Jul-18 25,000 26 – – 25,026
Investec Bank Limited 70 Fixed Deposit No Fixed 7.35 No N/A 25-May-18 50,000 70 – – 50,070
Investec Bank Limited 17 Fixed Deposit No Fixed 6.65 No N/A 25-May-18 25,000 8 – – 25,008
Investec Bank Limited 70 Fixed Deposit No Fixed 7.15 No N/A 31-May-18 10,000 14 – – 10,014
Investec Bank Limited 51 Fixed Deposit No Fixed 6.9 No N/A 1-Jun-18 10,000 10 – – 10,010
Investec Bank Limited 87 Fixed Deposit No Fixed 7.35 No N/A 15-Jun-18 55,000 96 – – 55,096
Investec Bank Limited 72 Fixed Deposit No Fixed 7.05 No N/A 15-Jun-18 15,000 21 – – 15,021
Investec Bank Limited 78 Fixed Deposit No Fixed 7.05 No N/A 22-Jun-18 10,000 15 – – 10,015
Investec Bank Limited 52 Fixed Deposit No Fixed 6.95 No N/A 25-Jun-18 10,000 10 – – 10,010
Investec Bank Limited 54 Fixed Deposit No Fixed 6.95 No N/A 25-Jun-18 15,000 15 – – 15,015
Investec Bank Limited 92 Fixed Deposit No Fixed 7.6 No N/A 27-Jun-18 30,000 57 – – 30,057
Investec Bank Limited 92 Fixed Deposit No Fixed 7.6 No N/A 27-Jun-18 30,000 57 – – 30,057
Investec Bank Limited 93 Fixed Deposit No Fixed 7.35 No N/A 27-Jun-18 20,000 37 – – 20,037
Investec Bank Limited 70 Fixed Deposit No Fixed 7 No N/A 29-Jun-18 10,000 13 – – 10,013
Investec Bank Limited 71 Fixed Deposit No Fixed 7 No N/A 29-Jun-18 15,000 20 – – 15,020
Investec Bank Limited 59 Fixed Deposit No Fixed 6.95 No N/A 13-Jul-18 45,000 51 – – 45,051
Investec Bank Limited 64 Fixed Deposit No Fixed 6.9 No N/A 13-Jul-18 10,000 12 – – 10,012
Investec Bank Limited 58 Fixed Deposit No Fixed 6.95 No N/A 13-Jul-18 10,000 11 – – 10,011
Interest to
be realised
Closing
Balance
Type of
Investment
Capital
Guarantee
(Yes/ No)
Variable or
Fixed
interest
rate
Interest
Rate
Expiry date
of
investment
Opening
balance
Commissio
n Paid
(Rands)
Commission
Recipient
Partial /
Premature
Withdrawal
(4)
Investment
Top Up
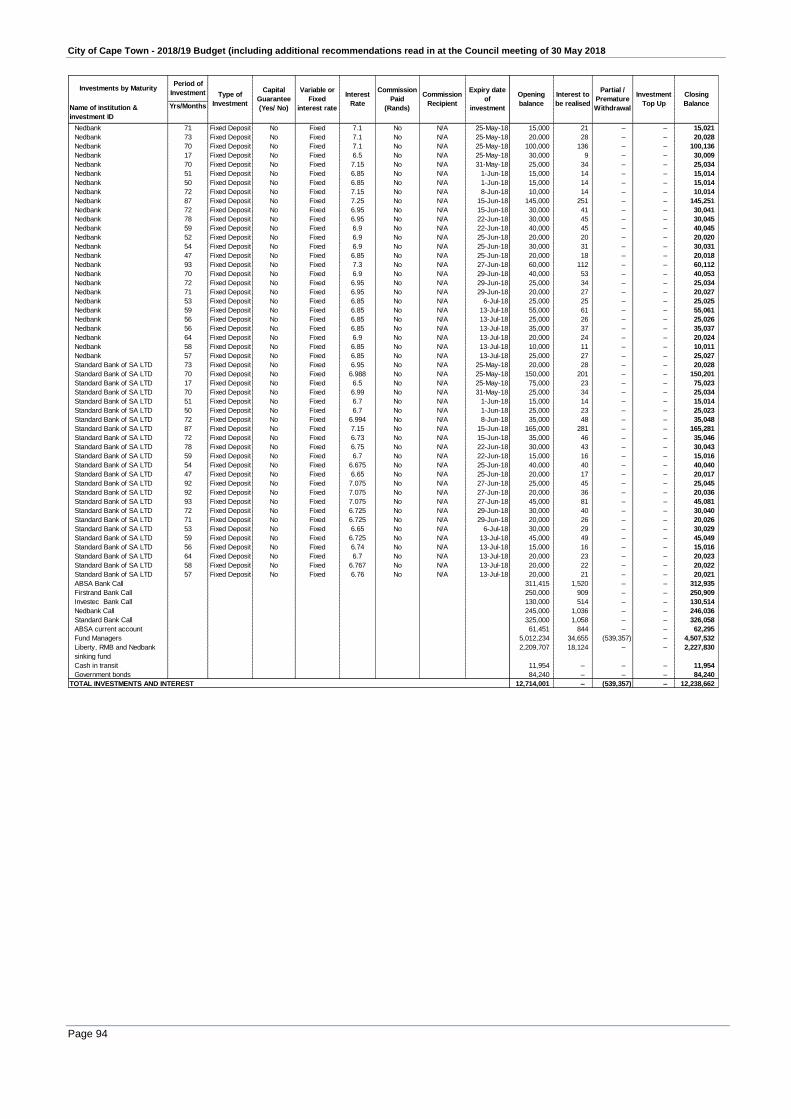
City of Cape Town - 2018/19 Budget (including additional recommendations read in at the Council meeting of 30 May 2018
Page 94
Investments by MaturityPeriod of
Investment
Name of institution &
investment ID
Yrs/Months
Nedbank 71 Fixed Deposit No Fixed 7.1 No N/A 25-May-18 15,000 21 – – 15,021
Nedbank 73 Fixed Deposit No Fixed 7.1 No N/A 25-May-18 20,000 28 – – 20,028
Nedbank 70 Fixed Deposit No Fixed 7.1 No N/A 25-May-18 100,000 136 – – 100,136
Nedbank 17 Fixed Deposit No Fixed 6.5 No N/A 25-May-18 30,000 9 – – 30,009
Nedbank 70 Fixed Deposit No Fixed 7.15 No N/A 31-May-18 25,000 34 – – 25,034
Nedbank 51 Fixed Deposit No Fixed 6.85 No N/A 1-Jun-18 15,000 14 – – 15,014
Nedbank 50 Fixed Deposit No Fixed 6.85 No N/A 1-Jun-18 15,000 14 – – 15,014
Nedbank 72 Fixed Deposit No Fixed 7.15 No N/A 8-Jun-18 10,000 14 – – 10,014
Nedbank 87 Fixed Deposit No Fixed 7.25 No N/A 15-Jun-18 145,000 251 – – 145,251
Nedbank 72 Fixed Deposit No Fixed 6.95 No N/A 15-Jun-18 30,000 41 – – 30,041
Nedbank 78 Fixed Deposit No Fixed 6.95 No N/A 22-Jun-18 30,000 45 – – 30,045
Nedbank 59 Fixed Deposit No Fixed 6.9 No N/A 22-Jun-18 40,000 45 – – 40,045
Nedbank 52 Fixed Deposit No Fixed 6.9 No N/A 25-Jun-18 20,000 20 – – 20,020
Nedbank 54 Fixed Deposit No Fixed 6.9 No N/A 25-Jun-18 30,000 31 – – 30,031
Nedbank 47 Fixed Deposit No Fixed 6.85 No N/A 25-Jun-18 20,000 18 – – 20,018
Nedbank 93 Fixed Deposit No Fixed 7.3 No N/A 27-Jun-18 60,000 112 – – 60,112
Nedbank 70 Fixed Deposit No Fixed 6.9 No N/A 29-Jun-18 40,000 53 – – 40,053
Nedbank 72 Fixed Deposit No Fixed 6.95 No N/A 29-Jun-18 25,000 34 – – 25,034
Nedbank 71 Fixed Deposit No Fixed 6.95 No N/A 29-Jun-18 20,000 27 – – 20,027
Nedbank 53 Fixed Deposit No Fixed 6.85 No N/A 6-Jul-18 25,000 25 – – 25,025
Nedbank 59 Fixed Deposit No Fixed 6.85 No N/A 13-Jul-18 55,000 61 – – 55,061
Nedbank 56 Fixed Deposit No Fixed 6.85 No N/A 13-Jul-18 25,000 26 – – 25,026
Nedbank 56 Fixed Deposit No Fixed 6.85 No N/A 13-Jul-18 35,000 37 – – 35,037
Nedbank 64 Fixed Deposit No Fixed 6.9 No N/A 13-Jul-18 20,000 24 – – 20,024
Nedbank 58 Fixed Deposit No Fixed 6.85 No N/A 13-Jul-18 10,000 11 – – 10,011
Nedbank 57 Fixed Deposit No Fixed 6.85 No N/A 13-Jul-18 25,000 27 – – 25,027
Standard Bank of SA LTD 73 Fixed Deposit No Fixed 6.95 No N/A 25-May-18 20,000 28 – – 20,028
Standard Bank of SA LTD 70 Fixed Deposit No Fixed 6.988 No N/A 25-May-18 150,000 201 – – 150,201
Standard Bank of SA LTD 17 Fixed Deposit No Fixed 6.5 No N/A 25-May-18 75,000 23 – – 75,023
Standard Bank of SA LTD 70 Fixed Deposit No Fixed 6.99 No N/A 31-May-18 25,000 34 – – 25,034
Standard Bank of SA LTD 51 Fixed Deposit No Fixed 6.7 No N/A 1-Jun-18 15,000 14 – – 15,014
Standard Bank of SA LTD 50 Fixed Deposit No Fixed 6.7 No N/A 1-Jun-18 25,000 23 – – 25,023
Standard Bank of SA LTD 72 Fixed Deposit No Fixed 6.994 No N/A 8-Jun-18 35,000 48 – – 35,048
Standard Bank of SA LTD 87 Fixed Deposit No Fixed 7.15 No N/A 15-Jun-18 165,000 281 – – 165,281
Standard Bank of SA LTD 72 Fixed Deposit No Fixed 6.73 No N/A 15-Jun-18 35,000 46 – – 35,046
Standard Bank of SA LTD 78 Fixed Deposit No Fixed 6.75 No N/A 22-Jun-18 30,000 43 – – 30,043
Standard Bank of SA LTD 59 Fixed Deposit No Fixed 6.7 No N/A 22-Jun-18 15,000 16 – – 15,016
Standard Bank of SA LTD 54 Fixed Deposit No Fixed 6.675 No N/A 25-Jun-18 40,000 40 – – 40,040
Standard Bank of SA LTD 47 Fixed Deposit No Fixed 6.65 No N/A 25-Jun-18 20,000 17 – – 20,017
Standard Bank of SA LTD 92 Fixed Deposit No Fixed 7.075 No N/A 27-Jun-18 25,000 45 – – 25,045
Standard Bank of SA LTD 92 Fixed Deposit No Fixed 7.075 No N/A 27-Jun-18 20,000 36 – – 20,036
Standard Bank of SA LTD 93 Fixed Deposit No Fixed 7.075 No N/A 27-Jun-18 45,000 81 – – 45,081
Standard Bank of SA LTD 72 Fixed Deposit No Fixed 6.725 No N/A 29-Jun-18 30,000 40 – – 30,040
Standard Bank of SA LTD 71 Fixed Deposit No Fixed 6.725 No N/A 29-Jun-18 20,000 26 – – 20,026
Standard Bank of SA LTD 53 Fixed Deposit No Fixed 6.65 No N/A 6-Jul-18 30,000 29 – – 30,029
Standard Bank of SA LTD 59 Fixed Deposit No Fixed 6.725 No N/A 13-Jul-18 45,000 49 – – 45,049
Standard Bank of SA LTD 56 Fixed Deposit No Fixed 6.74 No N/A 13-Jul-18 15,000 16 – – 15,016
Standard Bank of SA LTD 64 Fixed Deposit No Fixed 6.7 No N/A 13-Jul-18 20,000 23 – – 20,023
Standard Bank of SA LTD 58 Fixed Deposit No Fixed 6.767 No N/A 13-Jul-18 20,000 22 – – 20,022
Standard Bank of SA LTD 57 Fixed Deposit No Fixed 6.76 No N/A 13-Jul-18 20,000 21 – – 20,021
ABSA Bank Call 311,415 1,520 – – 312,935
Firstrand Bank Call 250,000 909 – – 250,909
Investec Bank Call 130,000 514 – – 130,514
Nedbank Call 245,000 1,036 – – 246,036
Standard Bank Call 325,000 1,058 – – 326,058
ABSA current account 61,451 844 – – 62,295
Fund Managers 5,012,234 34,655 (539,357) – 4,507,532
Liberty, RMB and Nedbank
sinking fund
2,209,707 18,124 – – 2,227,830
Cash in transit 11,954 – – – 11,954
Government bonds 84,240 – – – 84,240
12,714,001 – (539,357) – 12,238,662 TOTAL INVESTMENTS AND INTEREST
Interest to
be realised
Partial /
Premature
Withdrawal
Investment
Top Up
Closing
Balance
Commission
Paid
(Rands)
Commission
Recipient
Type of
Investment
Capital
Guarantee
(Yes/ No)
Variable or
Fixed
interest rate
Interest
Rate
Expiry date
of
investment
Opening
balance

City of Cape Town - 2018/19 Budget (including additional recommendations read in at the Council meeting of 30 May 2018
Page 95
2.6.2 Medium-term outlook: capital revenue The following table is a breakdown of the funding composition of the 2018/19 medium-term capital programme: Table 45 Sources of capital revenue over the MTREF
Vote Description
R thousand Adjusted Budget %Budget Year
2018/19%
Budget Year +1
2019/20%
Budget Year +2
2020/21%
Funded by:
National Government 2,057,467 2,015,146 1,993,692 2,138,633
Provincial Government 34,663 52,750 125,150 157,700
Other transfers and grants – – – –
Transfers recognised - capital 2,092,130 27.2% 2,067,896 24.6% 2,118,842 21.6% 2,296,333 22.7%
Public contributions & donations 96,585 1.3% 76,200 0.9% 78,600 0.8% 112,100 1.1%
Borrowing 4,000,000 52.1% 4,000,000 47.6% 5,700,000 58.1% 6,000,000 59.4%
Internally generated funds 1,492,288 19.4% 2,263,460 26.9% 1,917,880 19.5% 1,698,351 16.8%
Total Capital Funding 7,681,003 100.0% 8,407,556 100.0% 9,815,321 100.0% 10,106,785 100.0%
Current Year 2017/18 2018/19 Medium Term Revenue & Expenditure Framework
Sources of capital revenue for the 2018/19 financial year are graphically represented below.
Figure 11 Sources of capital revenue for the 2018/19 financial year
Grants from national and provincial governments as well as other external sources still remain a
significant funding source for the 2018/19 - 2020/21 capital budget. Transfers recognised – capital
represents R2 068 million in 2018/19, R2 119 million in 2019/20 and R2 296 million in 2020/21,
decreases slightly from 24.6% to 22.7% as a percentage of the total capital budget over the MTREF.
Borrowing continues to be a major source of funding of the 2018/19 – 2020/21 capital budget. The
borrowing amount reflected in the table above for the 2018/19 financial year includes certain rollovers
where directorates have already indicated that they will not be able to spend the full 2017/18 budgetary
allocation by year-end. The additional amount has, however, been included during the modelling phase
of the MTREF.

City of Cape Town - 2018/19 Budget (including additional recommendations read in at the Council meeting of 30 May 2018
Page 96
Table 46 MBRR Table SA18 - Capital transfers and grants receipts
Description 2014/15 2015/16 2016/17
R thousandAudited
Outcome
Audited
Outcome
Audited
Outcome
Original
Budget
Adjusted
Budget
Full Year
Forecast
Budget Year
2018/19
Budget Year
+1 2019/20
Budget Year
+2 2020/21
Capital Transfers and Grants
National Government: 2,520,974 2,381,397 25,180 2,189,832 2,057,467 2,037,622 2,015,146 1,993,692 2,138,633
Cooperative Governance: Emergency Disaster Relief Grant – – – – 20,812 20,812 – – –
Minerals and Energy: Energy Efficiency and Demand Side Management Grant – 12,000 – 9,600 9,600 8,300 9,400 10,000 15,000
Minerals and Energy: Integrated National Electrification Programme (Municipal) Grant 5,000 5,000 – 5,000 5,000 5,000 10,000 25,600 12,800
National Treasury: Expanded Public Works Programme – – – 400 400 400 1,000 – –
National Treasury: Infrastructure Skills Development Grant – – – 1,000 1,103 1,103 1,000 – –
National Treasury: Integrated City Development Grant 57,171 50,826 – 52,319 51,319 57,424 56,740 51,529 51,529
National Treasury: Local Government Restructuring Grant – – – 50 128 128 600 – –
National Treasury: Neighbourhood Development Partnership Grant 30,784 44,310 25,180 2,109 2,109 2,109 – 35,200 35,200
National Treasury: Urban Settlements Development Grant 1,358,879 1,387,760 – 1,278,988 1,145,691 1,125,912 1,279,998 1,355,956 1,473,104
Transport: Public Transport Infrastructure & Systems Grant 1,069,140 881,501 – 128,875 128,875 128,875 2,021 9,681 1,434
Transport: Public Transport Network Grant – – – 711,492 569,928 565,055 654,387 505,726 549,567
National Treasury: Municipal Disaster Grant – – – – 122,502 122,502 – – –
Provincial Government: 10,700 12,298 7,500 79,002 34,663 34,439 52,750 125,150 157,700
Cultural Affairs and Sport: Library Services (Conditional Grant) – – – 15,850 15,877 15,877 1,600 – –
Cultural Affairs and Sport: Library Services: Metro Library Grant – 5,000 7,500 10,000 10,379 10,379 10,000 10,000 10,550
Housing: Integrated Housing and Human Settlement Development Grant – – – 53,002 8,256 8,032 41,000 115,000 147,000
Provincial Government: Fibre Optic Broadband Roll Out 10,700 7,298 – – – – – – –
Provincial Government: Community Development Workers (CDW) Operational Grant Support – – – 150 150 150 150 150 150
Other grant providers: 44,412 47,088 87,813 84,900 96,585 87,522 76,200 78,600 112,100
Other: Other 44,412 47,088 87,813 84,900 96,585 87,522 76,200 78,600 112,100
Total Capital Transfers and Grants 2,576,086 2,440,783 120,493 2,353,735 2,188,715 2,159,582 2,144,096 2,197,442 2,408,433
Current Year 2017/182018/19 Medium Term Revenue & Expenditure
Framework
Internally generated funds are funded in accordance with Section 18 of the MFMA, which requires that
the annual budget must be funded from amongst others cash-backed accumulated funds from previous
years’ surpluses not committed for other purposes.
The internally-funded component of the capital budget is mainly funded from:
• previous years’ accumulated surpluses;
• contributions made to a Capital Replacement Reserve (CRR) in the previous year’s operating
budget; and
• Bulk Infrastructure Contribution Levies already collected.
• The levels of contributions made to the CRR on the previous year’s operating budget are
considered within the MTREF process to determine affordability and sustainability. Internally
generated funds amount to R2 263 million, R1 918 million and R1 698 million respectively, over the
MTREF.
The percentage of internally generated funds in relation to the total annual budget decreases from
26.9% in 2018/19, 19.5% in 2019/20 and 16.8% in 2020/21.
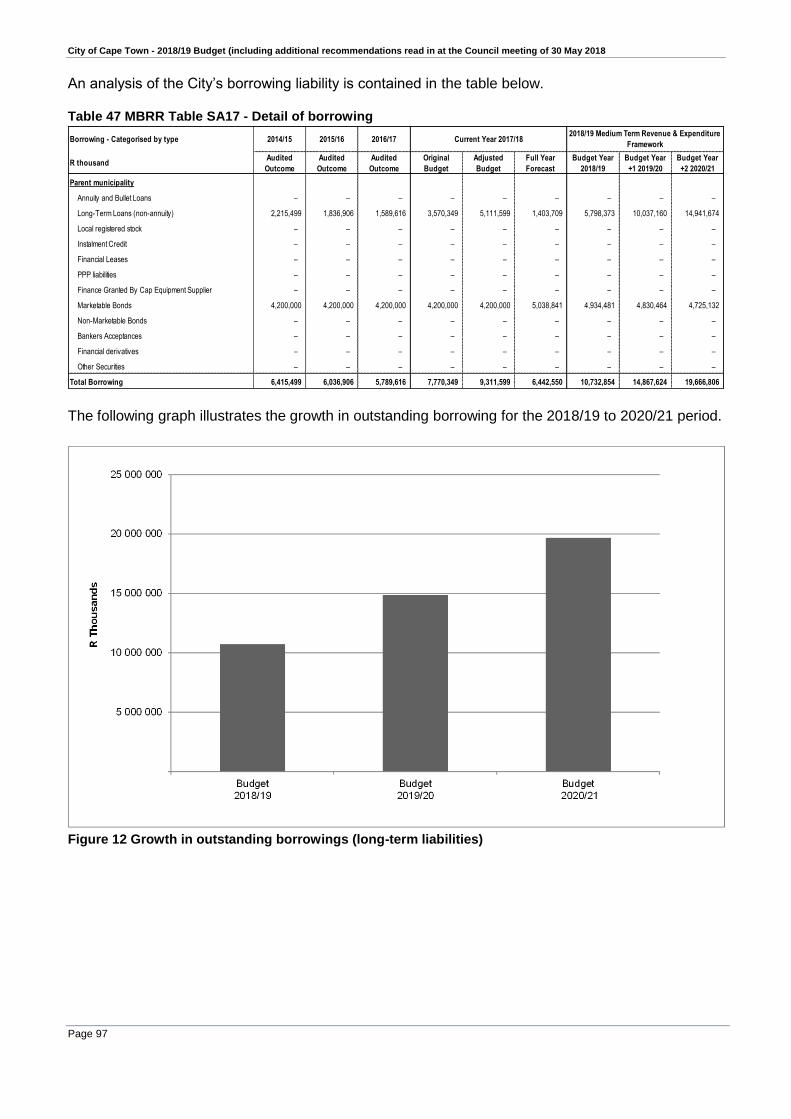
City of Cape Town - 2018/19 Budget (including additional recommendations read in at the Council meeting of 30 May 2018
Page 97
An analysis of the City’s borrowing liability is contained in the table below. Table 47 MBRR Table SA17 - Detail of borrowing
Borrowing - Categorised by type 2014/15 2015/16 2016/17
R thousandAudited
Outcome
Audited
Outcome
Audited
Outcome
Original
Budget
Adjusted
Budget
Full Year
Forecast
Budget Year
2018/19
Budget Year
+1 2019/20
Budget Year
+2 2020/21
Parent municipality
Annuity and Bullet Loans – – – – – – – – –
Long-Term Loans (non-annuity) 2,215,499 1,836,906 1,589,616 3,570,349 5,111,599 1,403,709 5,798,373 10,037,160 14,941,674
Local registered stock – – – – – – – – –
Instalment Credit – – – – – – – – –
Financial Leases – – – – – – – – –
PPP liabilities – – – – – – – – –
Finance Granted By Cap Equipment Supplier – – – – – – – – –
Marketable Bonds 4,200,000 4,200,000 4,200,000 4,200,000 4,200,000 5,038,841 4,934,481 4,830,464 4,725,132
Non-Marketable Bonds – – – – – – – – –
Bankers Acceptances – – – – – – – – –
Financial derivatives – – – – – – – – –
Other Securities – – – – – – – – –
Total Borrowing 6,415,499 6,036,906 5,789,616 7,770,349 9,311,599 6,442,550 10,732,854 14,867,624 19,666,806
Current Year 2017/182018/19 Medium Term Revenue & Expenditure
Framework
The following graph illustrates the growth in outstanding borrowing for the 2018/19 to 2020/21 period.
Figure 12 Growth in outstanding borrowings (long-term liabilities)

City of Cape Town - 2018/19 Budget (including additional recommendations read in at the Council meeting of 30 May 2018
Page 98
Cash Flow Management Table 48 MBRR Table A7 - Budgeted cash flow statement
Description 2014/15 2015/16 2016/17
R thousandAudited
Outcome
Audited
Outcome
Audited
OutcomeOriginal Budget
Adjusted
Budget
Full Year
Forecast
Budget Year
2018/19
Budget Year +1
2019/20
Budget Year +2
2020/21
CASH FLOW FROM OPERATING ACTIVITIES
Receipts
Property rates 6,018,735 6,745,047 8,105,126 8,344,028 8,395,674 8,395,674 8,968,987 9,795,009 10,630,877
Service charges 15,197,370 17,363,596 18,619,105 17,459,005 16,131,887 16,131,887 17,623,043 20,622,691 23,212,475
Other revenue 1,882,754 1,361,513 617,854 1,357,994 1,406,761 1,406,761 4,202,011 4,368,516 4,582,480
Government - operating 3,251,460 3,589,931 3,633,883 6,455,942 7,027,387 7,027,387 4,245,472 4,461,535 4,718,167
Government - capital 2,423,179 2,131,537 2,014,869 2,353,735 2,188,715 2,188,715 2,067,896 2,118,842 2,296,333
Interest 735,298 841,417 999,822 773,657 893,657 893,657 936,513 989,834 1,020,077
Payments
Suppliers and employees (22,609,163) (24,876,319) (26,611,461) (30,121,395) (30,337,392) (30,337,392) (31,919,625) (34,940,308) (37,497,781)
Finance charges (709,455) (687,263) (666,163) (981,827) (933,427) (933,427) (980,877) (1,418,058) (1,666,828)
Transfers and Grants (136,487) (148,246) (111,829) (140,985) – – (333,807) (356,864) (365,224)
NET CASH FROM/(USED) OPERATING ACTIVITIES 6,053,691 6,321,213 6,601,206 5,500,155 4,773,262 4,773,262 4,809,613 5,641,198 6,930,576
CASH FLOWS FROM INVESTING ACTIVITIES
Receipts
Proceeds on disposal of PPE 91,419 130,189 198,742 41,500 39,500 39,500 120,070 124,883 160,952
Decrease (Increase) in non-current debtors – – – – – – – – –
Decrease (increase) other non-current receivables 28,800 26,374 13,614 2,456 10,186 10,186 1,946 1,849 1,756
Decrease (increase) in non-current investments 366,983 (621,401) (410,412) (212,908) (212,908) (212,908) (238,708) (267,859) (298,475)
Payments
Capital assets (5,200,493) (5,489,832) (5,904,620) (6,890,062) (6,528,853) (6,528,853) (7,566,800) (8,833,789) (9,096,106)
NET CASH FROM/(USED) INVESTING ACTIVITIES (4,713,291) (5,954,670) (6,102,676) (7,059,015) (6,692,075) (6,692,075) (7,683,492) (8,974,917) (9,231,873)
CASH FLOWS FROM FINANCING ACTIVITIES
Receipts
Short term loans – – – – – – – – –
Borrowing long term/refinancing – – – 2,500,000 4,000,000 4,000,000 4,000,000 5,700,000 6,000,000
Increase (decrease) in consumer deposits (97,959) 52,375 27,077 35,710 29,785 29,785 38,688 42,557 46,813
Payments
Repayment of borrowing (309,852) (285,597) (407,883) (432,586) (432,586) (432,586) (482,586) (745,678) (932,295)
NET CASH FROM/(USED) FINANCING ACTIVITIES (407,811) (233,222) (380,806) 2,103,124 3,597,199 3,597,199 3,556,102 4,996,879 5,114,518
NET INCREASE/ (DECREASE) IN CASH HELD 932,589 133,321 117,724 544,264 1,678,386 1,678,386 682,224 1,663,160 2,813,220
Cash/cash equivalents at the year begin: 2,266,559 3,199,148 3,332,469 3,450,193 3,450,193 3,450,193 5,128,579 5,810,803 7,473,963
Cash/cash equivalents at the year end: 3,199,148 3,332,469 3,450,193 3,994,457 5,128,579 5,128,579 5,810,803 7,473,963 10,287,183
Current Year 2017/182018/19 Medium Term Revenue & Expenditure
Framework
The above table shows the cash and cash equivalents of the City with the tabled 2018/19 MTREF. The
City continues to embark on an extensive debt collection process to boost cash levels. These initiatives
and interventions have translated into a positive cash position for the City.
For the 2018/19 MTREF, the budget has been prepared to ensure high levels of cash and cash
equivalents over the medium-term with cash levels anticipated to exceed R5 790 million by 2018/19,
R7 459 million by 2019/20 and R10 273 million by 2020/21.
2.6.3 Cash Backed Reserves/Accumulated Surplus Reconciliation
The following table meets the requirements of MFMA Circular 42, which deals with the funding of a
municipal budget in accordance with sections 18 and 19 of the MFMA. The table seeks to answer three
key questions regarding the use and availability of cash:
What are the predicted cash and investments that are available at the end of the budget year?
How are those funds used?
What is the net funds available or funding shortfall?
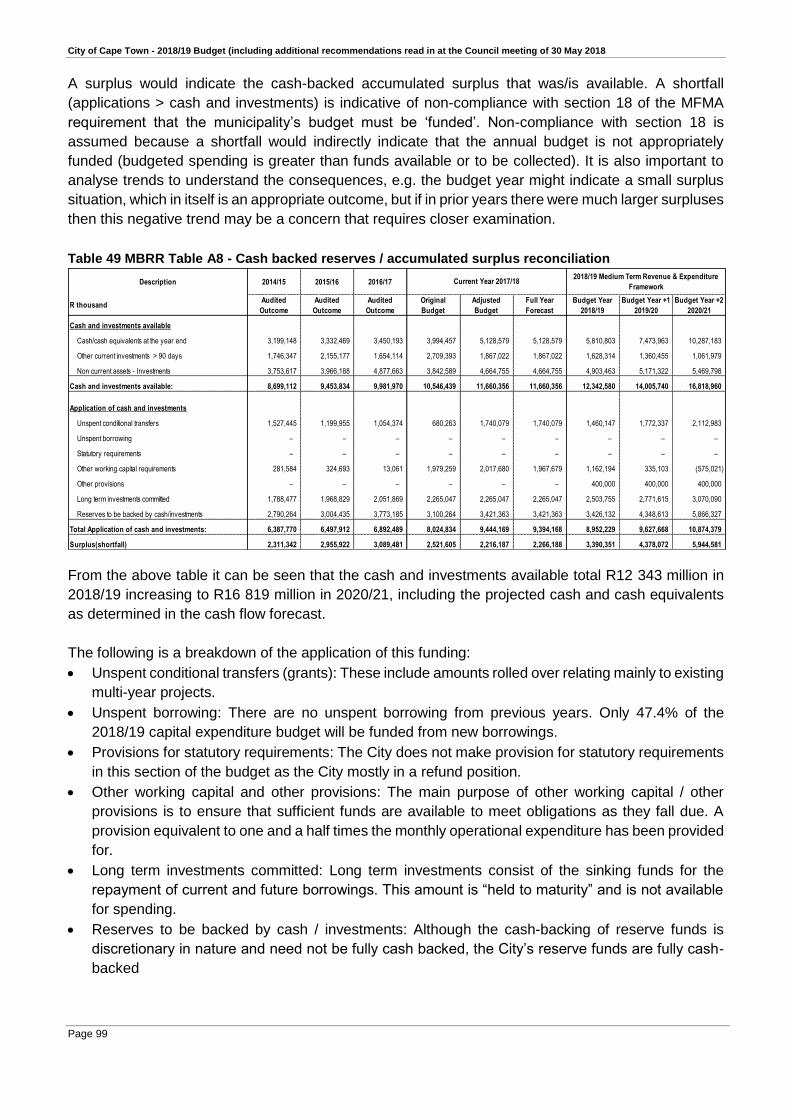
City of Cape Town - 2018/19 Budget (including additional recommendations read in at the Council meeting of 30 May 2018
Page 99
A surplus would indicate the cash-backed accumulated surplus that was/is available. A shortfall
(applications > cash and investments) is indicative of non-compliance with section 18 of the MFMA
requirement that the municipality’s budget must be ‘funded’. Non-compliance with section 18 is
assumed because a shortfall would indirectly indicate that the annual budget is not appropriately
funded (budgeted spending is greater than funds available or to be collected). It is also important to
analyse trends to understand the consequences, e.g. the budget year might indicate a small surplus
situation, which in itself is an appropriate outcome, but if in prior years there were much larger surpluses
then this negative trend may be a concern that requires closer examination.
Table 49 MBRR Table A8 - Cash backed reserves / accumulated surplus reconciliation
Description 2014/15 2015/16 2016/17
R thousandAudited
Outcome
Audited
Outcome
Audited
Outcome
Original
Budget
Adjusted
Budget
Full Year
Forecast
Budget Year
2018/19
Budget Year +1
2019/20
Budget Year +2
2020/21
Cash and investments available
Cash/cash equivalents at the year end 3,199,148 3,332,469 3,450,193 3,994,457 5,128,579 5,128,579 5,810,803 7,473,963 10,287,183
Other current investments > 90 days 1,746,347 2,155,177 1,654,114 2,709,393 1,867,022 1,867,022 1,628,314 1,360,455 1,061,979
Non current assets - Investments 3,753,617 3,966,188 4,877,663 3,842,589 4,664,755 4,664,755 4,903,463 5,171,322 5,469,798
Cash and investments available: 8,699,112 9,453,834 9,981,970 10,546,439 11,660,356 11,660,356 12,342,580 14,005,740 16,818,960
Application of cash and investments
Unspent conditional transfers 1,527,445 1,199,955 1,054,374 680,263 1,740,079 1,740,079 1,460,147 1,772,337 2,112,983
Unspent borrowing – – – – – – – – –
Statutory requirements – – – – – – – – –
Other working capital requirements 281,584 324,693 13,061 1,979,259 2,017,680 1,967,679 1,162,194 335,103 (575,021)
Other provisions – – – – – – 400,000 400,000 400,000
Long term investments committed 1,788,477 1,968,829 2,051,869 2,265,047 2,265,047 2,265,047 2,503,755 2,771,615 3,070,090
Reserves to be backed by cash/investments 2,790,264 3,004,435 3,773,185 3,100,264 3,421,363 3,421,363 3,426,132 4,348,613 5,866,327
Total Application of cash and investments: 6,387,770 6,497,912 6,892,489 8,024,834 9,444,169 9,394,168 8,952,229 9,627,668 10,874,379
Surplus(shortfall) 2,311,342 2,955,922 3,089,481 2,521,605 2,216,187 2,266,188 3,390,351 4,378,072 5,944,581
Current Year 2017/182018/19 Medium Term Revenue & Expenditure
Framework
From the above table it can be seen that the cash and investments available total R12 343 million in
2018/19 increasing to R16 819 million in 2020/21, including the projected cash and cash equivalents
as determined in the cash flow forecast.
The following is a breakdown of the application of this funding:
Unspent conditional transfers (grants): These include amounts rolled over relating mainly to existing
multi-year projects.
Unspent borrowing: There are no unspent borrowing from previous years. Only 47.4% of the
2018/19 capital expenditure budget will be funded from new borrowings.
Provisions for statutory requirements: The City does not make provision for statutory requirements
in this section of the budget as the City mostly in a refund position.
Other working capital and other provisions: The main purpose of other working capital / other
provisions is to ensure that sufficient funds are available to meet obligations as they fall due. A
provision equivalent to one and a half times the monthly operational expenditure has been provided
for.
Long term investments committed: Long term investments consist of the sinking funds for the
repayment of current and future borrowings. This amount is “held to maturity” and is not available
for spending.
Reserves to be backed by cash / investments: Although the cash-backing of reserve funds is
discretionary in nature and need not be fully cash backed, the City’s reserve funds are fully cash-
backed
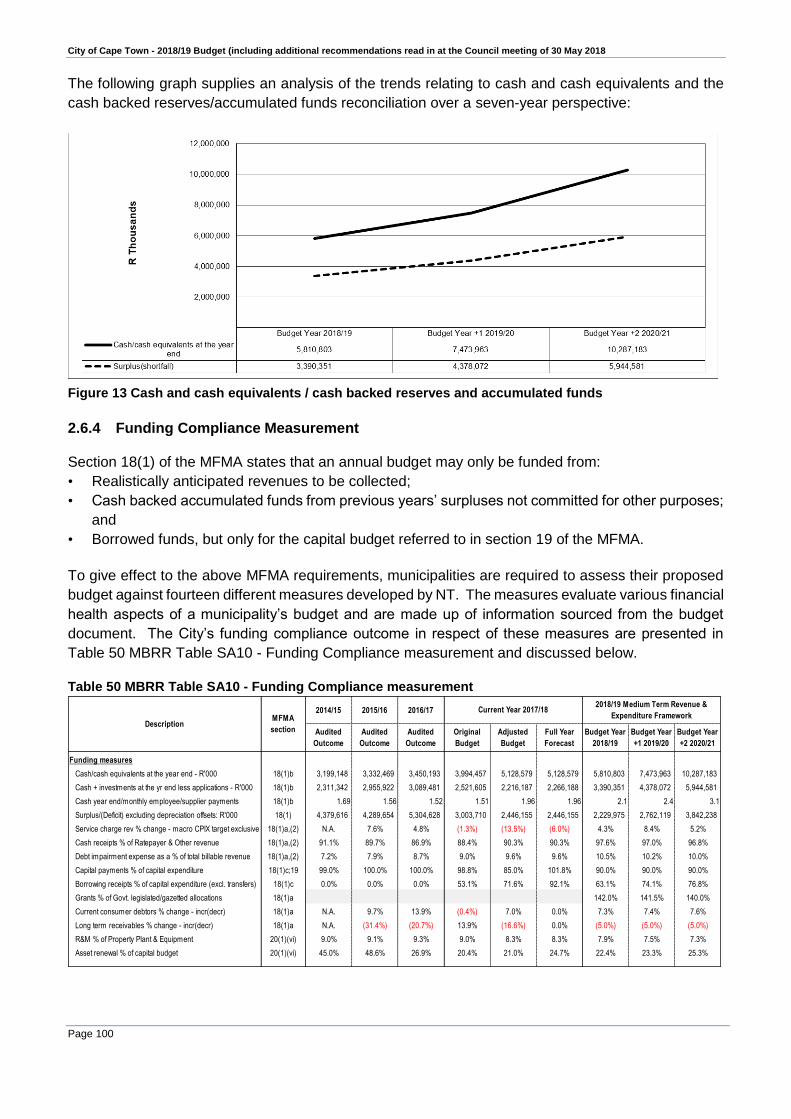
City of Cape Town - 2018/19 Budget (including additional recommendations read in at the Council meeting of 30 May 2018
Page 100
The following graph supplies an analysis of the trends relating to cash and cash equivalents and the
cash backed reserves/accumulated funds reconciliation over a seven-year perspective:
Figure 13 Cash and cash equivalents / cash backed reserves and accumulated funds
2.6.4 Funding Compliance Measurement Section 18(1) of the MFMA states that an annual budget may only be funded from:
• Realistically anticipated revenues to be collected;
• Cash backed accumulated funds from previous years’ surpluses not committed for other purposes;
and
• Borrowed funds, but only for the capital budget referred to in section 19 of the MFMA.
To give effect to the above MFMA requirements, municipalities are required to assess their proposed
budget against fourteen different measures developed by NT. The measures evaluate various financial
health aspects of a municipality’s budget and are made up of information sourced from the budget
document. The City’s funding compliance outcome in respect of these measures are presented in
Table 50 MBRR Table SA10 - Funding Compliance measurement and discussed below.
Table 50 MBRR Table SA10 - Funding Compliance measurement
2014/15 2015/16 2016/17
Audited
Outcome
Audited
Outcome
Audited
Outcome
Original
Budget
Adjusted
Budget
Full Year
Forecast
Budget Year
2018/19
Budget Year
+1 2019/20
Budget Year
+2 2020/21
Funding measures
Cash/cash equivalents at the year end - R'000 18(1)b 3,199,148 3,332,469 3,450,193 3,994,457 5,128,579 5,128,579 5,810,803 7,473,963 10,287,183
Cash + investments at the yr end less applications - R'000 18(1)b 2,311,342 2,955,922 3,089,481 2,521,605 2,216,187 2,266,188 3,390,351 4,378,072 5,944,581
Cash year end/monthly employee/supplier payments 18(1)b 1.69 1.56 1.52 1.51 1.96 1.96 2.1 2.4 3.1
Surplus/(Deficit) excluding depreciation offsets: R'000 18(1) 4,379,616 4,289,654 5,304,628 3,003,710 2,446,155 2,446,155 2,229,975 2,762,119 3,842,238
Service charge rev % change - macro CPIX target exclusive 18(1)a,(2) N.A. 7.6% 4.8% (1.3%) (13.5%) (6.0%) 4.3% 8.4% 5.2%
Cash receipts % of Ratepayer & Other revenue 18(1)a,(2) 91.1% 89.7% 86.9% 88.4% 90.3% 90.3% 97.6% 97.0% 96.8%
Debt impairment expense as a % of total billable revenue 18(1)a,(2) 7.2% 7.9% 8.7% 9.0% 9.6% 9.6% 10.5% 10.2% 10.0%
Capital payments % of capital expenditure 18(1)c;19 99.0% 100.0% 100.0% 98.8% 85.0% 101.8% 90.0% 90.0% 90.0%
Borrowing receipts % of capital expenditure (excl. transfers) 18(1)c 0.0% 0.0% 0.0% 53.1% 71.6% 92.1% 63.1% 74.1% 76.8%
Grants % of Govt. legislated/gazetted allocations 18(1)a 142.0% 141.5% 140.0%
Current consumer debtors % change - incr(decr) 18(1)a N.A. 9.7% 13.9% (0.4%) 7.0% 0.0% 7.3% 7.4% 7.6%
Long term receivables % change - incr(decr) 18(1)a N.A. (31.4%) (20.7%) 13.9% (16.6%) 0.0% (5.0%) (5.0%) (5.0%)
R&M % of Property Plant & Equipment 20(1)(vi) 9.0% 9.1% 9.3% 9.0% 8.3% 8.3% 7.9% 7.5% 7.3%
Asset renewal % of capital budget 20(1)(vi) 45.0% 48.6% 26.9% 20.4% 21.0% 24.7% 22.4% 23.3% 25.3%
DescriptionMFMA
section
Current Year 2017/182018/19 Medium Term Revenue &
Expenditure Framework

City of Cape Town - 2018/19 Budget (including additional recommendations read in at the Council meeting of 30 May 2018
Page 101
2.6.4.1 Cash/cash equivalent position
A positive increasing cash position is shown over the forecasted 2018/19 MTREF, indicating that the medium term budget is affordable and sustainable. The cash position is as a result of a favourable opening cash balance and operating surpluses in the outer years. 2.6.4.2 Cash plus investment less application of funds
This measure shows how a municipality applies its available cash and investments. Total of cash plus
investment less applications is more than the commitments for each corresponding year of the 2018/19
MTREF, which shows that the City is able to afford its commitments over the medium term.
The category descriptions on the cash flow tables in MBRR Schedule A (Table A7 and Table SA30)
was not aligned to version 6.2 of mSCOA although Table A4 (Financial Performance) was aligned.
This resulted in the Fuel levy being part of Other Revenue in Table A7 and Table SA30 whereas it is
shown under Transfers and Subsidies on MBRR Table A4. This misalignment distorts the outcome of
the estimated debtor’s collection rate and therefore the value reflected for other working capital
requirements on Table A8 (Cash backed reserves/accumulated surplus reconciliation).
2.6.4.3 Monthly average payments covered by cash or cash equivalents
This measure outlines the level of financial risk in the event of the municipality being under financial
stress, i.e. it indicates the number of times average monthly payments are covered. This ratio outcome
averages 2.5% over the MTREF.
2.6.4.4 Surplus/deficit excluding depreciation offsets
The purpose of this measure is to highlight whether revenue levels are sufficient to conclude that the
community is making a significant contribution towards the municipal resources consumed each year.
The outcome shows a surplus over the MTREF, which means that the community is making an
adequate contribution towards the economic benefits being consumed by the City.
2.6.4.5 Property rates/service charge revenue as a percentage increase less macro inflation target
This measure tests whether the municipality is contributing appropriately to the achievement of the
national inflation targets. The revenue increases applied can be substantiated by motivating the
individual services’ increases, which are as follows:
Rates
A revenue increase of 6.5% is proposed for the 2018/19 financial year, 7.7% and 8.16% is projected
for the 2019/20 and 2020/21 years respectively. The higher than CPI increase is as a result of
reduced revenue received from the sharing of the fuel levy, higher capital cost, new budget realities
and the increased cost of capital investment.
Electricity
The nature of business for this service is the purchasing and redistribution of electricity, where bulk
purchases averages 61% of the service’s total budget. The electricity revenue increase is therefore
partly attributed to the NERSA-approved Eskom increase on bulk purchases, which is 7.32% for
the 2018/19 financial year. In the absence of a longer term price increase agreement, a 10%
increase was applied for the two outer years. The higher than CPI increases on other expenditure
items, reducing electricity sales and investments in new infrastructure further contributes to the
revenue increase requirement. Based on the above, the electricity average revenue increases are
8.14%, 9.56% and 9.96%, respectively, over the 2018/19 MTREF.
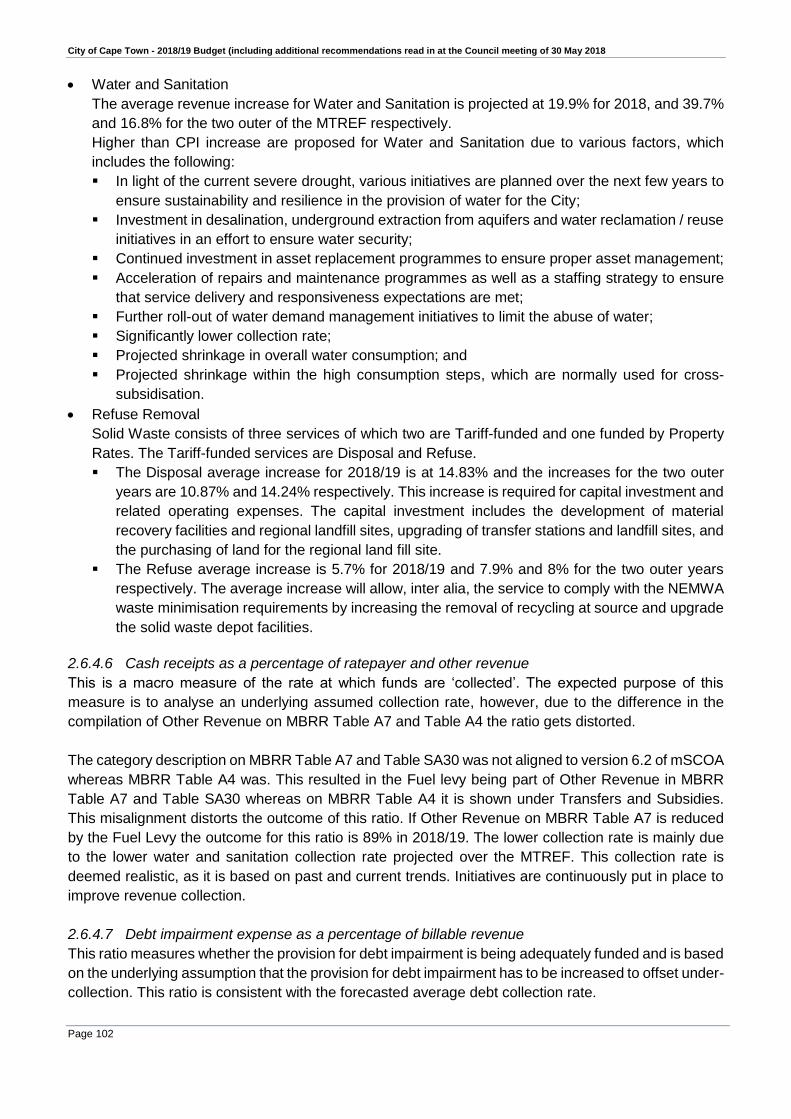
City of Cape Town - 2018/19 Budget (including additional recommendations read in at the Council meeting of 30 May 2018
Page 102
Water and Sanitation
The average revenue increase for Water and Sanitation is projected at 19.9% for 2018, and 39.7%
and 16.8% for the two outer of the MTREF respectively.
Higher than CPI increase are proposed for Water and Sanitation due to various factors, which
includes the following:
In light of the current severe drought, various initiatives are planned over the next few years to
ensure sustainability and resilience in the provision of water for the City;
Investment in desalination, underground extraction from aquifers and water reclamation / reuse
initiatives in an effort to ensure water security;
Continued investment in asset replacement programmes to ensure proper asset management;
Acceleration of repairs and maintenance programmes as well as a staffing strategy to ensure
that service delivery and responsiveness expectations are met;
Further roll-out of water demand management initiatives to limit the abuse of water;
Significantly lower collection rate;
Projected shrinkage in overall water consumption; and
Projected shrinkage within the high consumption steps, which are normally used for cross-
subsidisation.
Refuse Removal
Solid Waste consists of three services of which two are Tariff-funded and one funded by Property
Rates. The Tariff-funded services are Disposal and Refuse.
The Disposal average increase for 2018/19 is at 14.83% and the increases for the two outer
years are 10.87% and 14.24% respectively. This increase is required for capital investment and
related operating expenses. The capital investment includes the development of material
recovery facilities and regional landfill sites, upgrading of transfer stations and landfill sites, and
the purchasing of land for the regional land fill site.
The Refuse average increase is 5.7% for 2018/19 and 7.9% and 8% for the two outer years
respectively. The average increase will allow, inter alia, the service to comply with the NEMWA
waste minimisation requirements by increasing the removal of recycling at source and upgrade
the solid waste depot facilities.
2.6.4.6 Cash receipts as a percentage of ratepayer and other revenue
This is a macro measure of the rate at which funds are ‘collected’. The expected purpose of this
measure is to analyse an underlying assumed collection rate, however, due to the difference in the
compilation of Other Revenue on MBRR Table A7 and Table A4 the ratio gets distorted.
The category description on MBRR Table A7 and Table SA30 was not aligned to version 6.2 of mSCOA
whereas MBRR Table A4 was. This resulted in the Fuel levy being part of Other Revenue in MBRR
Table A7 and Table SA30 whereas on MBRR Table A4 it is shown under Transfers and Subsidies.
This misalignment distorts the outcome of this ratio. If Other Revenue on MBRR Table A7 is reduced
by the Fuel Levy the outcome for this ratio is 89% in 2018/19. The lower collection rate is mainly due
to the lower water and sanitation collection rate projected over the MTREF. This collection rate is
deemed realistic, as it is based on past and current trends. Initiatives are continuously put in place to
improve revenue collection.
2.6.4.7 Debt impairment expense as a percentage of billable revenue
This ratio measures whether the provision for debt impairment is being adequately funded and is based
on the underlying assumption that the provision for debt impairment has to be increased to offset under-
collection. This ratio is consistent with the forecasted average debt collection rate.
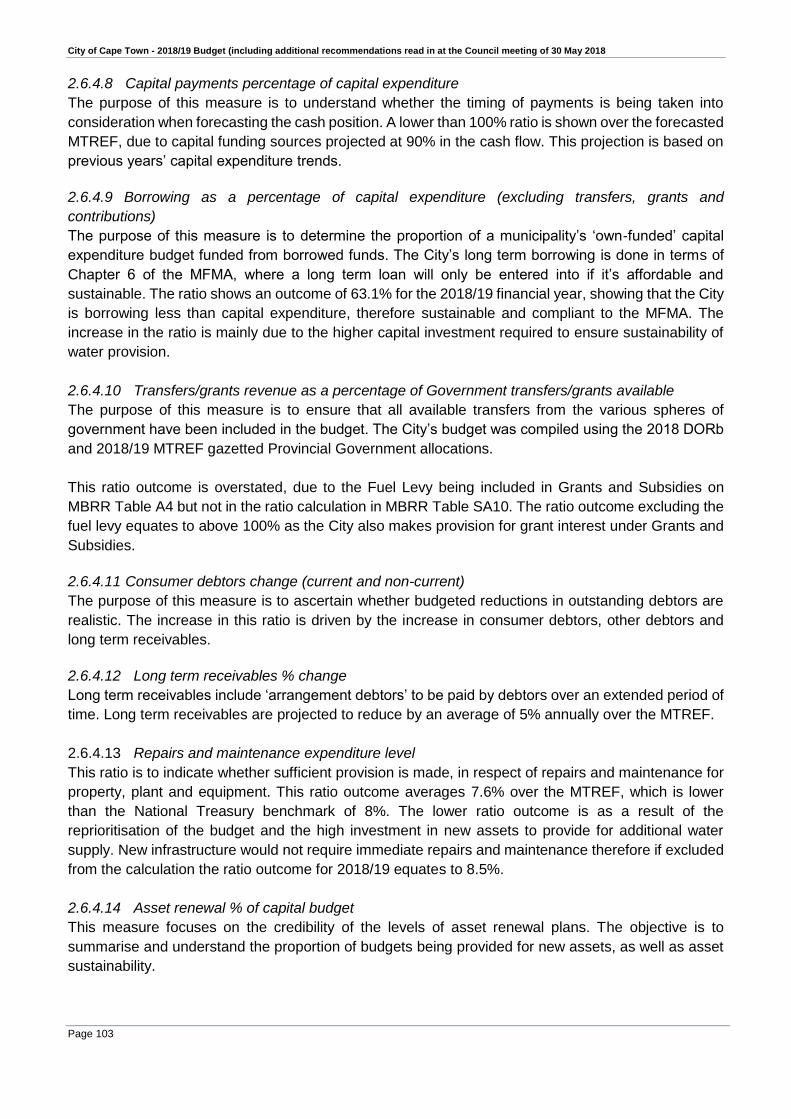
City of Cape Town - 2018/19 Budget (including additional recommendations read in at the Council meeting of 30 May 2018
Page 103
2.6.4.8 Capital payments percentage of capital expenditure
The purpose of this measure is to understand whether the timing of payments is being taken into
consideration when forecasting the cash position. A lower than 100% ratio is shown over the forecasted
MTREF, due to capital funding sources projected at 90% in the cash flow. This projection is based on
previous years’ capital expenditure trends.
2.6.4.9 Borrowing as a percentage of capital expenditure (excluding transfers, grants and
contributions)
The purpose of this measure is to determine the proportion of a municipality’s ‘own-funded’ capital
expenditure budget funded from borrowed funds. The City’s long term borrowing is done in terms of
Chapter 6 of the MFMA, where a long term loan will only be entered into if it’s affordable and
sustainable. The ratio shows an outcome of 63.1% for the 2018/19 financial year, showing that the City
is borrowing less than capital expenditure, therefore sustainable and compliant to the MFMA. The
increase in the ratio is mainly due to the higher capital investment required to ensure sustainability of
water provision.
2.6.4.10 Transfers/grants revenue as a percentage of Government transfers/grants available
The purpose of this measure is to ensure that all available transfers from the various spheres of
government have been included in the budget. The City’s budget was compiled using the 2018 DORb
and 2018/19 MTREF gazetted Provincial Government allocations.
This ratio outcome is overstated, due to the Fuel Levy being included in Grants and Subsidies on
MBRR Table A4 but not in the ratio calculation in MBRR Table SA10. The ratio outcome excluding the
fuel levy equates to above 100% as the City also makes provision for grant interest under Grants and
Subsidies.
2.6.4.11 Consumer debtors change (current and non-current)
The purpose of this measure is to ascertain whether budgeted reductions in outstanding debtors are
realistic. The increase in this ratio is driven by the increase in consumer debtors, other debtors and
long term receivables.
2.6.4.12 Long term receivables % change
Long term receivables include ‘arrangement debtors’ to be paid by debtors over an extended period of
time. Long term receivables are projected to reduce by an average of 5% annually over the MTREF.
2.6.4.13 Repairs and maintenance expenditure level
This ratio is to indicate whether sufficient provision is made, in respect of repairs and maintenance for
property, plant and equipment. This ratio outcome averages 7.6% over the MTREF, which is lower
than the National Treasury benchmark of 8%. The lower ratio outcome is as a result of the
reprioritisation of the budget and the high investment in new assets to provide for additional water
supply. New infrastructure would not require immediate repairs and maintenance therefore if excluded
from the calculation the ratio outcome for 2018/19 equates to 8.5%.
2.6.4.14 Asset renewal % of capital budget
This measure focuses on the credibility of the levels of asset renewal plans. The objective is to
summarise and understand the proportion of budgets being provided for new assets, as well as asset
sustainability.

City of Cape Town - 2018/19 Budget (including additional recommendations read in at the Council meeting of 30 May 2018
Page 104
The mSCOA MBRR format split the previously known ‘renewal of existing assets’ into ‘renewal of
existing assets’ and ‘upgrading of existing assets’. This ratio now only takes into consideration the
renewal of existing assets portion over the total capital budget and shows an outcome averaging 23.7%
over the MTREF, whereas renewal and upgrading of existing assets over the total capital budget shows
an average outcome of 43.8% over the MTREF. The lower ratio outcome is as a result of the high
investment in new assets to provide for additional water supply.
2.7 Ward Allocations
It is proposed that the City allocates budgetary resources for projects, programmes or other initiatives’
application at subcouncil level. While these resources will be spent by line departments, subcouncils
identify and recommend ward allocation adoption (following sundry internal line departmental input and
liaison) by Mayco and Council.
The City has 116 demarcated wards, which forms part of 24 subcouncils. These subcouncils serve the
residents by engaging with them on municipal issues. The total available to each ward for the 2018/19
financial year is set at R850 000 per ward. These allocations could be spent on either capital or
operating projects/programmes.
A ward allocation project must form part of the core business activities and assets of the lead
department and must be aligned with the Service Delivery Business Implementation Plan of the
directorate. Ward allocation projects must, as far as possible, be completed within the financial year in
which they are approved. However, unspent capital funds may be rolled over to the next financial year,
where compelling reasons exist for such roll-over.

City of Cape Town - 2018/19 Budget (including additional recommendations read in at the Council meeting of 30 May 2018
Page 105
2.8 Expenditure on transfers and grant programmes
Table 51 MBRR Table SA19 - Expenditure on transfers and grant programmes
Description 2014/15 2015/16 2016/17
R thousandAudited
Outcome
Audited
Outcome
Audited
OutcomeOriginal Budget Adjusted Budget
Full Year
Forecast
Budget Year
2018/19
Budget Year +1
2019/20
Budget Year +2
2020/21
EXPENDITURE:
Operating expenditure of Transfers and Grants
National Government: 978,797 594,660 353,550 2,849,944 3,067,056 3,067,056 3,264,482 3,391,723 3,628,609
Equitable share 6,294 1,281 – 2,292,908 2,292,908 2,292,908 2,574,650 2,815,558 3,092,042
Finance Management grant 973 1,050 1,050 1,050 1,050 1,050 1,000 1,000 1,000
Urban Settlements Development Grant 162,977 171,610 41,560 215,798 231,796 231,796 204,792 204,301 173,000
Energy Efficiency and Demand Side Management Grant 599 424 568 400 400 400 600 – –
Dept. of Environ Affairs and Tourism 4,326 4,613 5,868 – 7,158 7,158 – – –
Expanded Public Works Programme 23,552 23,216 31,340 13,783 13,783 13,783 23,266 – –
Integrated City Development Grant 3,116 2,915 6,290 8,944 9,944 9,944 7,622 5,392 8,563
Public Transport Infrastructure & Systems Grant – 20,998 32,413 19,636 70,227 70,227 48,812 53,303 41,770
Infrastructure Skills Development 2,763 6,932 7,365 9,393 10,193 10,193 12,605 15,935 16,000
Public Transport Network Grant 307,548 283,209 232,093 288,032 429,596 429,596 391,135 291,434 291,434
Public Transport Infrastructure Grant 79,844 (83) – – – – – – –
Public Transport Network Operations Grant 367,748 58,569 (5,183) – – – – – –
Municipal Human Settlements Capacity Grant 18,363 18,743 – – – – – – –
Department of Water Affairs and Forestry Grant 697 – – – – – – – –
Department of Public Services and Administration – 1,183 – – – – – – –
2014 African Nations Championship Host City Operating Grant (26) – – – – – – – –
Housing Accreditation 23 – – – – – – – –
Department of Public Services and Administration – – 190 – – – – – –
Neighbourhood Development Partnership Grant – – – – – – – 4,800 4,800
LGSETA Post Graduate Internship Programme – – (3) – – – – – –
Provincial Government: 730,253 772,721 801,688 1,176,026 1,508,150 1,508,150 967,719 1,069,142 1,089,508
Cultural Affairs and Sport - Provincial Library Services 28,874 32,142 37,626 37,449 41,236 41,236 47,347 47,057 49,736
Cultural Affairs and Sport - Library Services: Transfer funding to enable City of Cape
Town to procure periodicals and newspapers– – – 4,500 4,500 4,500 4,770 4,989 5,223
Human Settlements - Human Settlement Development Grant 411,253 428,773 424,143 568,052 878,819 878,819 333,550 419,930 392,280
Human Settlements - Municipal Accreditation Assistance 3,989 6,584 6,111 5,000 10,483 10,483 5,000 – –
Human Settlement - Settlement Assistance – – 697 1,500 2,867 2,867 1,500 1,500 1,500
Health - TB 17,206 24,535 25,626 27,112 27,604 27,604 53,063 61,341 79,511
Health - Global Fund 37,936 – – – – – – – –
Health - ARV 109,584 162,829 179,967 217,701 217,701 217,701 224,414 244,224 270,814
Health - Nutrition 4,065 4,169 4,733 5,572 5,572 5,572 5,928 6,176 6,520
Health - Vaccines 65,565 71,152 80,874 82,134 96,299 96,299 86,899 91,661 91,661
Comprehensive Health – – – 188,146 173,489 173,489 173,489 173,489 173,489
Transport and Public Works - Provision for persons with special needs 10,075 10,112 10,089 10,000 10,313 10,313 10,000 10,000 10,000
Transport Safety and Compliance - Rail Safety 2,197 48 56 – – – 16,000 – –
Community Development Workers 741 1,446 469 886 1,354 1,354 886 886 886
Planning, Maintenance and Rehabilitation of Transport Systems and Infrastructure 5,353 7,527 5,674 – 3,672 3,672 – 3,500 3,500
Community Safety - Law Enforcement Auxiliary Services 19,384 21,715 25,620 3,500 6,915 6,915 3,938 4,159 4,388
Appointment, Training , Equipping and Operationalisation of School Resource Officers– – – – – – 345 – –
Finance Management Capacity Building Grant – – – 240 362 362 360 – –
Provincial Government: Financial Management Support Grant 300 303 – – 230 230 230 230 –
Provincial Contribution towards addressing Natural Disasters – – – – 2,500 2,500 – – –
Human Settlement – – – 24,234 24,234 24,234 – – –
Metropolitan Land Transport Fund 12,514 – – – – – – – –
Local Government Compliance 467 – – – – – – – –
Economic Development and Tourism 500 – – – – – – – –
Cultural Affairs and Sport: Three Anchor Bay Tennis Court 250 1,196 – – – – – – –
Economic Development and Tourism: Public Access Centres – 43 – – – – – – –
Cultural Affairs and Sport: Library Services: Metro Library Grant – 147 – – – – – – –
Finance Management Support Grant – – 4 – – – – – –
Current Year 2017/182018/19 Medium Term Revenue & Expenditure
Framework
Table continues on next page
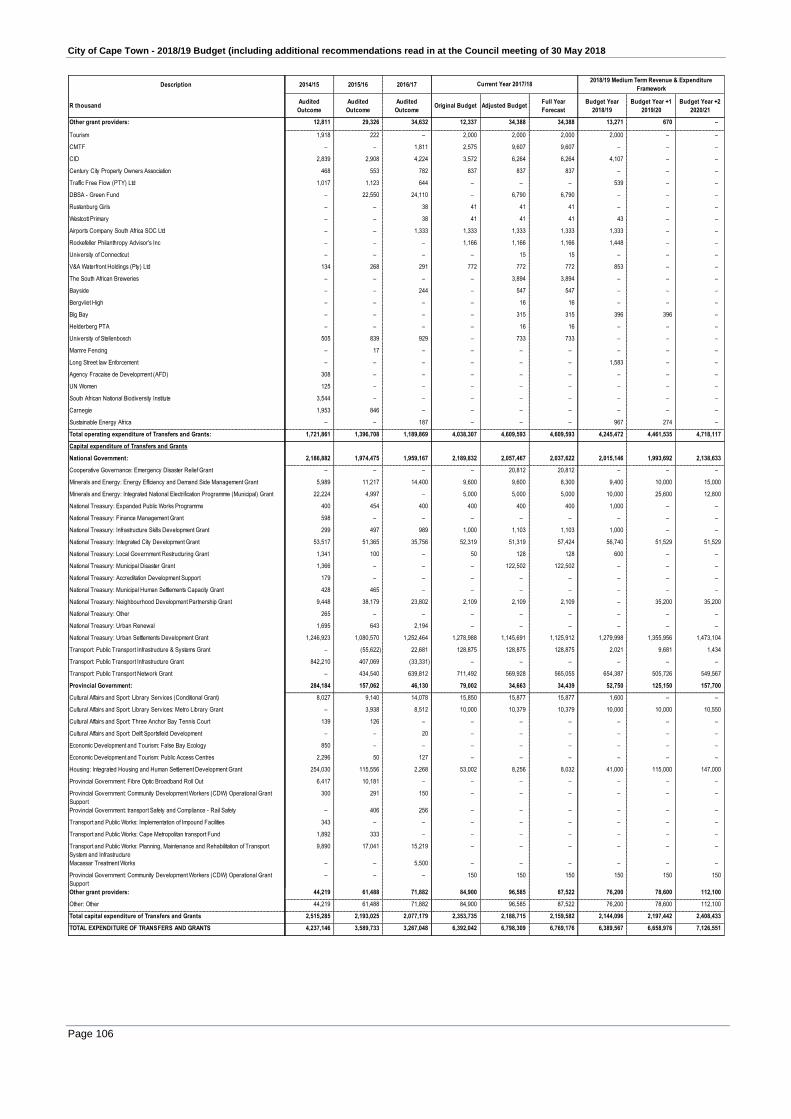
City of Cape Town - 2018/19 Budget (including additional recommendations read in at the Council meeting of 30 May 2018
Page 106
Description 2014/15 2015/16 2016/17
R thousandAudited
Outcome
Audited
Outcome
Audited
OutcomeOriginal Budget Adjusted Budget
Full Year
Forecast
Budget Year
2018/19
Budget Year +1
2019/20
Budget Year +2
2020/21
Other grant providers: 12,811 29,326 34,632 12,337 34,388 34,388 13,271 670 –
Tourism 1,918 222 – 2,000 2,000 2,000 2,000 – –
CMTF – – 1,811 2,575 9,607 9,607 – – –
CID 2,839 2,908 4,224 3,572 6,264 6,264 4,107 – –
Century City Property Owners Association 468 553 782 837 837 837 – – –
Traffic Free Flow (PTY) Ltd 1,017 1,123 644 – – – 539 – –
DBSA - Green Fund – 22,550 24,110 – 6,790 6,790 – – –
Rustenburg Girls – – 38 41 41 41 – – –
Westcott Primary – – 38 41 41 41 43 – –
Airports Company South Africa SOC Ltd – – 1,333 1,333 1,333 1,333 1,333 – –
Rockefeller Philanthropy Advisor's Inc – – – 1,166 1,166 1,166 1,448 – –
University of Connecticut – – – – 15 15 – – –
V&A Waterfront Holdings (Pty) Ltd 134 268 291 772 772 772 853 – –
The South African Breweries – – – – 3,894 3,894 – – –
Bayside – – 244 – 547 547 – – –
Bergvliet High – – – – 16 16 – – –
Big Bay – – – – 315 315 396 396 –
Helderberg PTA – – – – 16 16 – – –
University of Stellenbosch 505 839 929 – 733 733 – – –
Mamre Fencing – 17 – – – – – – –
Long Street law Enforcement – – – – – – 1,583 – –
Agency Fracaise de Development (AFD) 308 – – – – – – – –
UN Women 125 – – – – – – – –
South African National Biodiversity Institute 3,544 – – – – – – – –
Carnegie 1,953 846 – – – – – – –
Sustainable Energy Africa – – 187 – – – 967 274 –
Total operating expenditure of Transfers and Grants: 1,721,861 1,396,708 1,189,869 4,038,307 4,609,593 4,609,593 4,245,472 4,461,535 4,718,117
Capital expenditure of Transfers and Grants
National Government: 2,186,882 1,974,475 1,959,167 2,189,832 2,057,467 2,037,622 2,015,146 1,993,692 2,138,633
Cooperative Governance: Emergency Disaster Relief Grant – – – – 20,812 20,812 – – –
Minerals and Energy: Energy Efficiency and Demand Side Management Grant 5,989 11,217 14,400 9,600 9,600 8,300 9,400 10,000 15,000
Minerals and Energy: Integrated National Electrification Programme (Municipal) Grant 22,224 4,997 – 5,000 5,000 5,000 10,000 25,600 12,800
National Treasury: Expanded Public Works Programme 400 454 400 400 400 400 1,000 – –
National Treasury: Finance Management Grant 598 – – – – – – – –
National Treasury: Infrastructure Skills Development Grant 299 497 989 1,000 1,103 1,103 1,000 – –
National Treasury: Integrated City Development Grant 53,517 51,365 35,756 52,319 51,319 57,424 56,740 51,529 51,529
National Treasury: Local Government Restructuring Grant 1,341 100 – 50 128 128 600 – –
National Treasury: Municipal Disaster Grant 1,366 – – – 122,502 122,502 – – –
National Treasury: Accreditation Development Support 179 – – – – – – – –
National Treasury: Municipal Human Settlements Capacity Grant 428 465 – – – – – – –
National Treasury: Neighbourhood Development Partnership Grant 9,448 38,179 23,802 2,109 2,109 2,109 – 35,200 35,200
National Treasury: Other 265 – – – – – – – –
National Treasury: Urban Renewal 1,695 643 2,194 – – – – – –
National Treasury: Urban Settlements Development Grant 1,246,923 1,080,570 1,252,464 1,278,988 1,145,691 1,125,912 1,279,998 1,355,956 1,473,104
Transport: Public Transport Infrastructure & Systems Grant – (55,622) 22,681 128,875 128,875 128,875 2,021 9,681 1,434
Transport: Public Transport Infrastructure Grant 842,210 407,069 (33,331) – – – – – –
Transport: Public Transport Network Grant – 434,540 639,812 711,492 569,928 565,055 654,387 505,726 549,567
Provincial Government: 284,184 157,062 46,130 79,002 34,663 34,439 52,750 125,150 157,700
Cultural Affairs and Sport: Library Services (Conditional Grant) 8,027 9,140 14,078 15,850 15,877 15,877 1,600 – –
Cultural Affairs and Sport: Library Services: Metro Library Grant – 3,938 8,512 10,000 10,379 10,379 10,000 10,000 10,550
Cultural Affairs and Sport: Three Anchor Bay Tennis Court 139 126 – – – – – – –
Cultural Affairs and Sport: Delft Sportsfield Development – – 20 – – – – – –
Economic Development and Tourism: False Bay Ecology 850 – – – – – – – –
Economic Development and Tourism: Public Access Centres 2,296 50 127 – – – – – –
Housing: Integrated Housing and Human Settlement Development Grant 254,030 115,556 2,268 53,002 8,256 8,032 41,000 115,000 147,000
Provincial Government: Fibre Optic Broadband Roll Out 6,417 10,181 – – – – – – –
Provincial Government: Community Development Workers (CDW) Operational Grant
Support
300 291 150 – – – – – –
Provincial Government: transport Safety and Compliance - Rail Safety – 406 256 – – – – – –
Transport and Public Works: Implementation of Impound Facilities 343 – – – – – – – –
Transport and Public Works: Cape Metropolitan transport Fund 1,892 333 – – – – – – –
Transport and Public Works: Planning, Maintenance and Rehabilitation of Transport
System and Infrastructure
9,890 17,041 15,219 – – – – – –
Macassar Treatment Works – – 5,500 – – – – – –
Provincial Government: Community Development Workers (CDW) Operational Grant
Support
– – – 150 150 150 150 150 150
Other grant providers: 44,219 61,488 71,882 84,900 96,585 87,522 76,200 78,600 112,100
Other: Other 44,219 61,488 71,882 84,900 96,585 87,522 76,200 78,600 112,100
Total capital expenditure of Transfers and Grants 2,515,285 2,193,025 2,077,179 2,353,735 2,188,715 2,159,582 2,144,096 2,197,442 2,408,433
TOTAL EXPENDITURE OF TRANSFERS AND GRANTS 4,237,146 3,589,733 3,267,048 6,392,042 6,798,309 6,769,176 6,389,567 6,658,976 7,126,551
Current Year 2017/182018/19 Medium Term Revenue & Expenditure
Framework
City of Cape Town - 2018/19 Budget (including additional recommendations read in at the Council meeting of 30 May 2018
Page 107
2.9 Allocations and grants made by the municipality
Transfers and Grants are allocations of funds, from the City’s approved budget, to outside
organisations or bodies. These allocations are gratuitous or unrequited transfers by the City to the
grantee organisations and are not payments made in compliance with any commercial or other
business transaction. All transfers and grants are disbursed in terms of section 67 of the Municipal
Finance Management Act. Application in respect of S 67 grant and grant- in aid allocations are
approved by the City’s Grants Committee and event related sponsorships by the Executive Mayor as
per the City’s System of delegations.
The Grant Committee approves grants applications in terms of the City’s Grant Policy and the members
of the Committee are officials of the City appointed by the CFO. The Committee will co-ordinate,
administer, and control the Screening Process in respect of applications recommended by line
departments & sub-councils to ensure that all recommended grants complies with City’s Grant Policy,
the Constitution and relevant legislation.
A Section 80 Special Events Committee was established in March 2013 to facilitate the selection of
events and recommend to the Mayor which events the City wishes to support in terms of the Integrated
Development Plan (IDP) and Council’s Events Policy. The Committee is chaired by the Deputy Mayor
and includes the following members: Executive Mayor, Mayco Member: Safety and Security, Mayco
Member: Finance, Mayco Member: Area Based Oversight (North), Mayco Member: Assets & Facilities
and Mayco Member: Area Based Oversight (South).
The Committee meets as and when required. The Committee invites the MAYCO member/s who is/are
not a member/s of this Committee to participate in the meeting where an event/s that falls within the
functional area of such MAYCO member.
Full disclosure on transfers and grants to external organisations by the City can be found in Annexure 20.
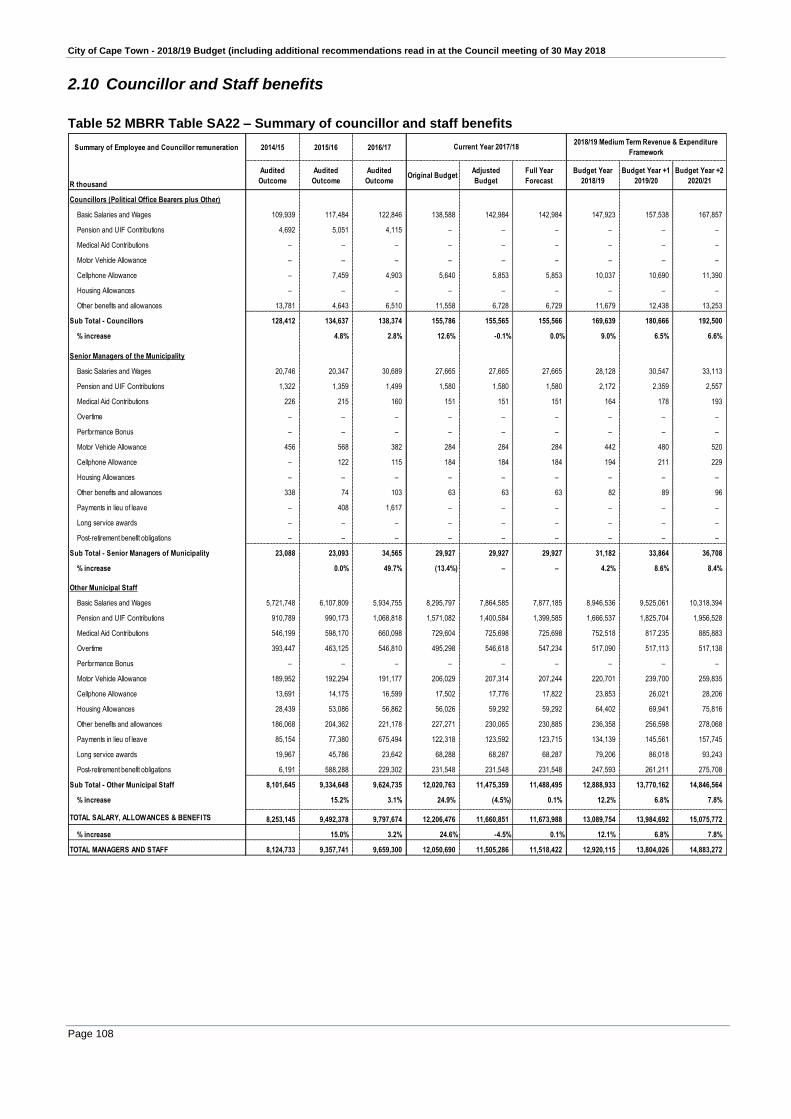
City of Cape Town - 2018/19 Budget (including additional recommendations read in at the Council meeting of 30 May 2018
Page 108
2.10 Councillor and Staff benefits
Table 52 MBRR Table SA22 – Summary of councillor and staff benefits
Summary of Employee and Councillor remuneration 2014/15 2015/16 2016/17
R thousand
Audited
Outcome
Audited
Outcome
Audited
OutcomeOriginal Budget
Adjusted
Budget
Full Year
Forecast
Budget Year
2018/19
Budget Year +1
2019/20
Budget Year +2
2020/21
Councillors (Political Office Bearers plus Other)
Basic Salaries and Wages 109,939 117,484 122,846 138,588 142,984 142,984 147,923 157,538 167,857
Pension and UIF Contributions 4,692 5,051 4,115 – – – – – –
Medical Aid Contributions – – – – – – – – –
Motor Vehicle Allowance – – – – – – – – –
Cellphone Allowance – 7,459 4,903 5,640 5,853 5,853 10,037 10,690 11,390
Housing Allowances – – – – – – – – –
Other benefits and allowances 13,781 4,643 6,510 11,558 6,728 6,729 11,679 12,438 13,253
Sub Total - Councillors 128,412 134,637 138,374 155,786 155,565 155,566 169,639 180,666 192,500
% increase 4.8% 2.8% 12.6% -0.1% 0.0% 9.0% 6.5% 6.6%
Senior Managers of the Municipality
Basic Salaries and Wages 20,746 20,347 30,689 27,665 27,665 27,665 28,128 30,547 33,113
Pension and UIF Contributions 1,322 1,359 1,499 1,580 1,580 1,580 2,172 2,359 2,557
Medical Aid Contributions 226 215 160 151 151 151 164 178 193
Overtime – – – – – – – – –
Performance Bonus – – – – – – – – –
Motor Vehicle Allowance 456 568 382 284 284 284 442 480 520
Cellphone Allowance – 122 115 184 184 184 194 211 229
Housing Allowances – – – – – – – – –
Other benefits and allowances 338 74 103 63 63 63 82 89 96
Payments in lieu of leave – 408 1,617 – – – – – –
Long service awards – – – – – – – – –
Post-retirement benefit obligations – – – – – – – – –
Sub Total - Senior Managers of Municipality 23,088 23,093 34,565 29,927 29,927 29,927 31,182 33,864 36,708
% increase 0.0% 49.7% (13.4%) – – 4.2% 8.6% 8.4%
Other Municipal Staff
Basic Salaries and Wages 5,721,748 6,107,809 5,934,755 8,295,797 7,864,585 7,877,185 8,946,536 9,525,061 10,318,394
Pension and UIF Contributions 910,789 990,173 1,068,818 1,571,082 1,400,584 1,399,585 1,666,537 1,825,704 1,956,528
Medical Aid Contributions 546,199 598,170 660,098 729,604 725,698 725,698 752,518 817,235 885,883
Overtime 393,447 463,125 546,810 495,298 546,618 547,234 517,090 517,113 517,138
Performance Bonus – – – – – – – – –
Motor Vehicle Allowance 189,952 192,294 191,177 206,029 207,314 207,244 220,701 239,700 259,835
Cellphone Allowance 13,691 14,175 16,599 17,502 17,776 17,822 23,853 26,021 28,206
Housing Allowances 28,439 53,086 56,862 56,026 59,292 59,292 64,402 69,941 75,816
Other benefits and allowances 186,068 204,362 221,178 227,271 230,065 230,885 236,358 256,598 278,068
Payments in lieu of leave 85,154 77,380 675,494 122,318 123,592 123,715 134,139 145,561 157,745
Long service awards 19,967 45,786 23,642 68,288 68,287 68,287 79,206 86,018 93,243
Post-retirement benefit obligations 6,191 588,288 229,302 231,548 231,548 231,548 247,593 261,211 275,708
Sub Total - Other Municipal Staff 8,101,645 9,334,648 9,624,735 12,020,763 11,475,359 11,488,495 12,888,933 13,770,162 14,846,564
% increase 15.2% 3.1% 24.9% (4.5%) 0.1% 12.2% 6.8% 7.8%
TOTAL SALARY, ALLOWANCES & BENEFITS 8,253,145 9,492,378 9,797,674 12,206,476 11,660,851 11,673,988 13,089,754 13,984,692 15,075,772
% increase 15.0% 3.2% 24.6% -4.5% 0.1% 12.1% 6.8% 7.8%
TOTAL MANAGERS AND STAFF 8,124,733 9,357,741 9,659,300 12,050,690 11,505,286 11,518,422 12,920,115 13,804,026 14,883,272
Current Year 2017/182018/19 Medium Term Revenue & Expenditure
Framework

City of Cape Town - 2018/19 Budget (including additional recommendations read in at the Council meeting of 30 May 2018
Page 109
Table 53 MBRR Table SA23 - Salaries, allowances and benefits (political office bearers / councillors /
senior officials) for the 2018/19 financial year
Disclosure of Salaries, Allowances & Benefits
Rand per annum
Councillors
Speaker 1 1,116,702 – 88,203 1,204,905
Chief Whip 1 1,051,915 – 79,690 1,131,605
Executive Mayor 1 1,382,708 – 71,590 1,454,298
Deputy Executive Mayor 1 1,116,702 – 88,203 1,204,905
Executive Committee 10 10,519,154 – 434,520 10,953,674
Total for all other councillors 217 132,736,083 – 20,954,232 153,690,315
Total Councillors 231 147,923,264 – 21,716,438 169,639,702
Senior Managers of the Municipality
Municipal Manager (MM) 1 3,223,035 478,945 17,664 – 3,719,644
Chief Finance Officer 1 2,635,832 267,967 104,431 – 3,008,230
Executive Director: Area-Based Service Delivery 1 1,872,077 245,257 17,664 – 2,134,998
Executive Director: Assets and Facilities Management 1 1,977,936 1,912 155,150 – 2,134,998
Executive Director: Corporate Services 1 2,665,673 324,893 17,664 – 3,008,230
Executive Director: Strategic Governance 1 2,665,673 324,893 17,664 – 3,008,230
Executive Director: Energy 1 2,115,422 1,912 17,664 – 2,134,998
Executive Director: Informal Settlements, Water and Waste Services 1 2,805,395 69,481 133,354 – 3,008,230
Executive Director: Safety & Security 1 2,563,467 324,893 119,870 – 3,008,230
Executive Director: Social Services 1 2,614,999 375,567 17,664 – 3,008,230
Commissioner: Transport and Urban Development Authority 1 2,988,654 1,912 17,664 – 3,008,230
Total Senior Managers of the Municipality 11 28,128,163 2,417,632 636,453 – 31,182,248
TOTAL COST OF COUNCILLOR, DIRECTOR and EXECUTIVE REMUNERATION 242 176,051,427 2,417,632 22,352,891 – 200,821,950
Total PackageNo. Salary Contributions AllowancesPerformance
Bonuses
In-kind
benefits

City of Cape Town - 2018/19 Budget (including additional recommendations read in at the Council meeting of 30 May 2018
Page 110
Table 54 MBRR Table SA24 - Summary of personnel numbers
Summary of Personnel Numbers
Number PositionsPermanent
employees
Contract
employeesPositions
Permanent
employees
Contract
employeesPositions
Permanent
employees
Contract
employees
Municipal Council and Boards of Municipal Entities
Councillors (Political Office Bearers plus Other Councillors) 221 – 221 231 – 231 231 – 231
Board Members of municipal entities – – – – – – – – –
Municipal employees
Municipal Manager and Senior Managers 12 – 12 11 – 11 11 – 11
Other Managers 912 895 17 914 910 4 986 974 12
Professionals 1,180 1,069 111 1,441 1,397 44 1,447 1,348 99
Finance 113 111 2 77 77 – 89 88 1
Spatial/town planning 32 31 1 68 68 – 63 63 –
Information Technology 54 54 – 79 72 7 84 84 –
Roads 17 17 – 44 42 2 38 36 2
Electricity 119 117 2 124 124 – 130 128 2
Water 140 140 – 201 182 19 232 188 44
Sanitation 18 18 – – – – – – –
Refuse 12 12 – 14 14 – 14 14 –
Other 675 569 106 834 818 16 797 747 50
Technicians 3,843 3,589 254 4,019 3,888 131 4,159 4,032 127
Finance 200 199 1 123 123 – 129 128 1
Spatial/town planning 27 27 – 185 185 – 184 184 –
Information Technology 280 274 6 298 280 18 432 428 4
Roads 15 15 – 60 57 3 59 56 3
Electricity 261 261 – 313 312 1 326 318 8
Water 330 298 32 352 322 30 417 378 39
Sanitation 11 11 – – – – – – –
Refuse 76 76 – 80 80 – 80 80 –
Other 2,643 2,428 215 2,608 2,529 79 2,532 2,460 72
Clerks (Clerical and administrative) 6,817 6,509 208 7,060 7,023 37 7,183 7,025 158
Service and sales workers 4,229 3,405 824 4,026 3,613 413 3,948 3,630 318
Skilled agricultural and fishery workers – – – – – – – – –
Craft and related trades 2,726 2,721 5 2,756 2,756 – 2,656 2,656 –
Plant and Machine Operators 3,737 3,730 7 3,751 3,744 7 3,700 3,697 3
Elementary Occupations 5,818 5,791 27 5,759 5,754 5 5,686 5,681 5
TOTAL PERSONNEL NUMBERS 29,495 27,709 1,686 29,968 29,085 883 30,007 29,043 964
% increase – – – 1.6% 5.0% (47.6% ) 0.1% (0.1% ) 9.2%
Total municipal employees headcount 29,174 27,709 1,465 29,737 29,085 652 29,776 29,043 733
Finance personnel headcount 1,752 1,738 14 1,578 1,576 2 1,622 1,620 2
Human Resources personnel headcount 337 323 14 376 374 2 371 365 6
2016/17 Current Year 2017/18 Budget Year 2018/19

City of Cape Town - 2018/19 Budget (including additional recommendations read in at the Council meeting of 30 May 2018
Page 111
2.11 Monthly targets for revenue, expenditure and cash flow
Table 55 MBRR Table SA25 - Budgeted monthly revenue and expenditure
Description
R thousand July August Sept. October November December January February March April May JuneBudget Year
2018/19
Budget Year
+1 2019/20
Budget Year
+2 2020/21
Revenue By Source
Property rates 780,163 780,163 780,163 780,163 780,163 780,163 780,163 780,163 780,163 780,163 780,163 780,163 9,361,952 10,248,287 11,131,713
Service charges - electricity revenue 1,148,665 1,136,927 1,066,141 1,063,963 1,017,226 956,053 1,077,388 999,101 996,361 1,029,971 1,010,337 1,089,269 12,591,403 13,519,095 14,865,239
Service charges - water revenue 297,941 297,941 297,941 297,941 297,941 297,941 297,941 297,941 297,941 297,941 297,941 297,408 3,574,755 5,037,616 5,904,860
Service charges - sanitation revenue 150,921 150,921 150,921 150,921 150,921 150,921 150,921 150,921 150,921 150,921 150,921 150,921 1,811,048 2,524,979 2,947,422
Service charges - refuse revenue 100,172 100,172 100,172 100,172 100,172 100,172 100,172 100,172 100,172 100,172 100,172 100,172 1,202,059 1,331,897 1,486,051
Service charges - other – – – – – – – – – – – 573 573 738 896
Rental of facilities and equipment 31,771 31,772 31,772 31,772 31,772 31,772 31,772 31,772 31,772 31,772 31,772 31,773 381,262 402,231 424,570
Interest earned - external investments 78,043 78,043 78,043 78,043 78,043 78,043 78,043 78,043 78,043 78,043 78,043 78,043 936,513 989,834 1,020,077
Interest earned - outstanding debtors 28,414 28,414 28,414 28,414 28,414 28,414 28,414 28,414 28,414 28,414 28,414 28,414 340,970 362,409 385,462
Dividends received – – – – – – – – – – – – – – –
Fines, penalties and forfeits 106,680 106,680 106,680 106,680 106,680 106,680 106,680 106,680 106,680 106,680 106,680 106,680 1,280,160 1,350,569 1,425,526
Licences and permits 3,770 3,833 3,837 3,832 3,838 3,833 3,845 3,845 3,857 3,844 3,857 3,857 46,050 48,432 51,120
Agency services 16,810 16,810 16,810 16,810 16,810 16,810 16,810 16,810 16,810 16,810 16,810 16,810 201,723 212,818 224,629
Transfers and subsidies 280,794 1,149,322 301,518 291,803 303,221 1,158,599 315,446 307,132 1,146,712 358,190 320,744 870,127 6,803,608 7,101,185 7,464,469
Other revenue 63,172 64,073 65,073 64,075 64,073 66,573 64,075 65,073 64,073 64,073 64,575 64,963 773,871 816,747 862,106
Gains on disposal of PPE 3,447 3,448 3,447 3,447 3,448 3,447 3,447 3,448 3,447 3,448 3,448 5,947 43,870 46,283 48,852
Total Revenue (excluding capital transfers and
contributions)
3,090,763 3,948,516 3,030,932 3,018,036 2,982,720 3,779,420 3,055,116 2,969,513 3,805,365 3,050,441 2,993,876 3,625,120 39,349,818 43,993,121 48,242,992
Budget Year 2018/19Medium Term Revenue and Expenditure
Framework
Table continues on next page
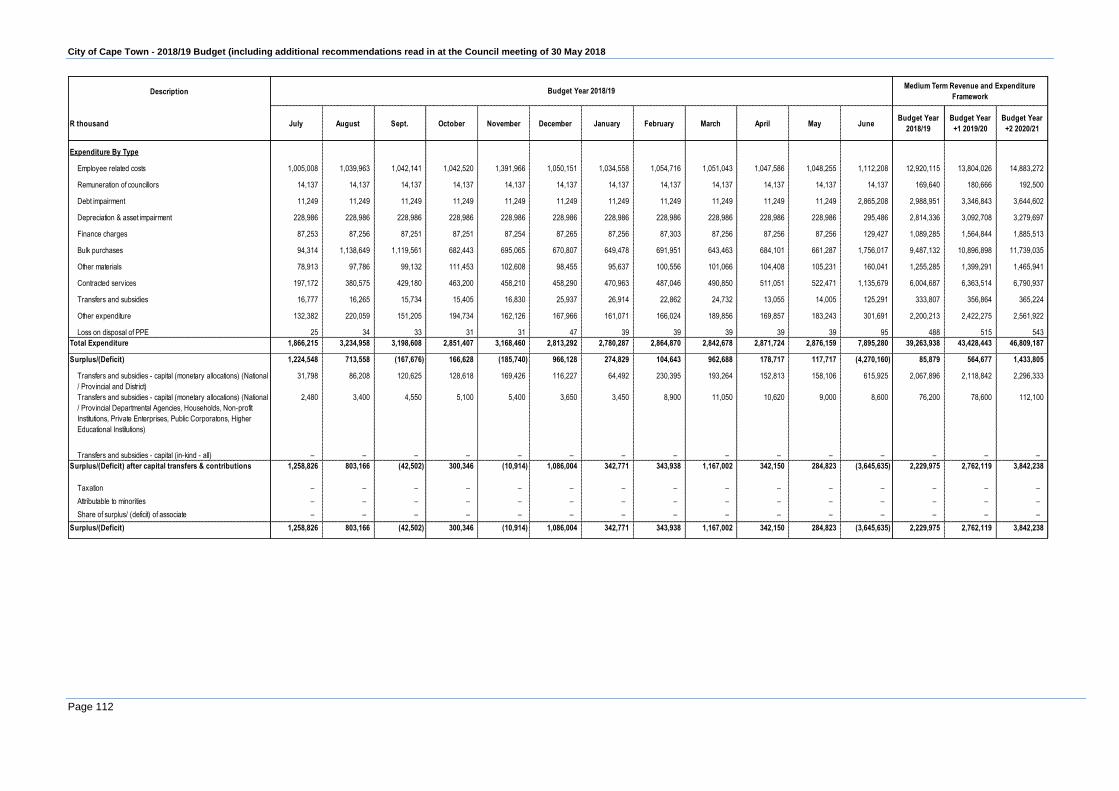
City of Cape Town - 2018/19 Budget (including additional recommendations read in at the Council meeting of 30 May 2018
Page 112
Description
R thousand July August Sept. October November December January February March April May JuneBudget Year
2018/19
Budget Year
+1 2019/20
Budget Year
+2 2020/21
Expenditure By Type
Employee related costs 1,005,008 1,039,963 1,042,141 1,042,520 1,391,966 1,050,151 1,034,558 1,054,716 1,051,043 1,047,586 1,048,255 1,112,208 12,920,115 13,804,026 14,883,272
Remuneration of councillors 14,137 14,137 14,137 14,137 14,137 14,137 14,137 14,137 14,137 14,137 14,137 14,137 169,640 180,666 192,500
Debt impairment 11,249 11,249 11,249 11,249 11,249 11,249 11,249 11,249 11,249 11,249 11,249 2,865,208 2,988,951 3,346,843 3,644,602
Depreciation & asset impairment 228,986 228,986 228,986 228,986 228,986 228,986 228,986 228,986 228,986 228,986 228,986 295,486 2,814,336 3,092,708 3,279,697
Finance charges 87,253 87,256 87,251 87,251 87,254 87,265 87,256 87,303 87,256 87,256 87,256 129,427 1,089,285 1,564,844 1,885,513
Bulk purchases 94,314 1,138,649 1,119,561 682,443 695,065 670,807 649,478 691,951 643,463 684,101 661,287 1,756,017 9,487,132 10,896,898 11,739,035
Other materials 78,913 97,786 99,132 111,453 102,608 98,455 95,637 100,556 101,066 104,408 105,231 160,041 1,255,285 1,399,291 1,465,941
Contracted services 197,172 380,575 429,180 463,200 458,210 458,290 470,963 487,046 490,850 511,051 522,471 1,135,679 6,004,687 6,363,514 6,790,937
Transfers and subsidies 16,777 16,265 15,734 15,405 16,830 25,937 26,914 22,862 24,732 13,055 14,005 125,291 333,807 356,864 365,224
Other expenditure 132,382 220,059 151,205 194,734 162,126 167,966 161,071 166,024 189,856 169,857 183,243 301,691 2,200,213 2,422,275 2,561,922
Loss on disposal of PPE 25 34 33 31 31 47 39 39 39 39 39 95 488 515 543
Total Expenditure 1,866,215 3,234,958 3,198,608 2,851,407 3,168,460 2,813,292 2,780,287 2,864,870 2,842,678 2,871,724 2,876,159 7,895,280 39,263,938 43,428,443 46,809,187
Surplus/(Deficit) 1,224,548 713,558 (167,676) 166,628 (185,740) 966,128 274,829 104,643 962,688 178,717 117,717 (4,270,160) 85,879 564,677 1,433,805
Transfers and subsidies - capital (monetary allocations) (National
/ Provincial and District)
31,798 86,208 120,625 128,618 169,426 116,227 64,492 230,395 193,264 152,813 158,106 615,925 2,067,896 2,118,842 2,296,333
Transfers and subsidies - capital (monetary allocations) (National
/ Provincial Departmental Agencies, Households, Non-profit
Institutions, Private Enterprises, Public Corporatons, Higher
Educational Institutions)
2,480 3,400 4,550 5,100 5,400 3,650 3,450 8,900 11,050 10,620 9,000 8,600 76,200 78,600 112,100
Transfers and subsidies - capital (in-kind - all) – – – – – – – – – – – – – – –
Surplus/(Deficit) after capital transfers & contributions 1,258,826 803,166 (42,502) 300,346 (10,914) 1,086,004 342,771 343,938 1,167,002 342,150 284,823 (3,645,635) 2,229,975 2,762,119 3,842,238
Taxation – – – – – – – – – – – – – – –
Attributable to minorities – – – – – – – – – – – – – – –
Share of surplus/ (deficit) of associate – – – – – – – – – – – – – – –
Surplus/(Deficit) 1,258,826 803,166 (42,502) 300,346 (10,914) 1,086,004 342,771 343,938 1,167,002 342,150 284,823 (3,645,635) 2,229,975 2,762,119 3,842,238
Budget Year 2018/19Medium Term Revenue and Expenditure
Framework
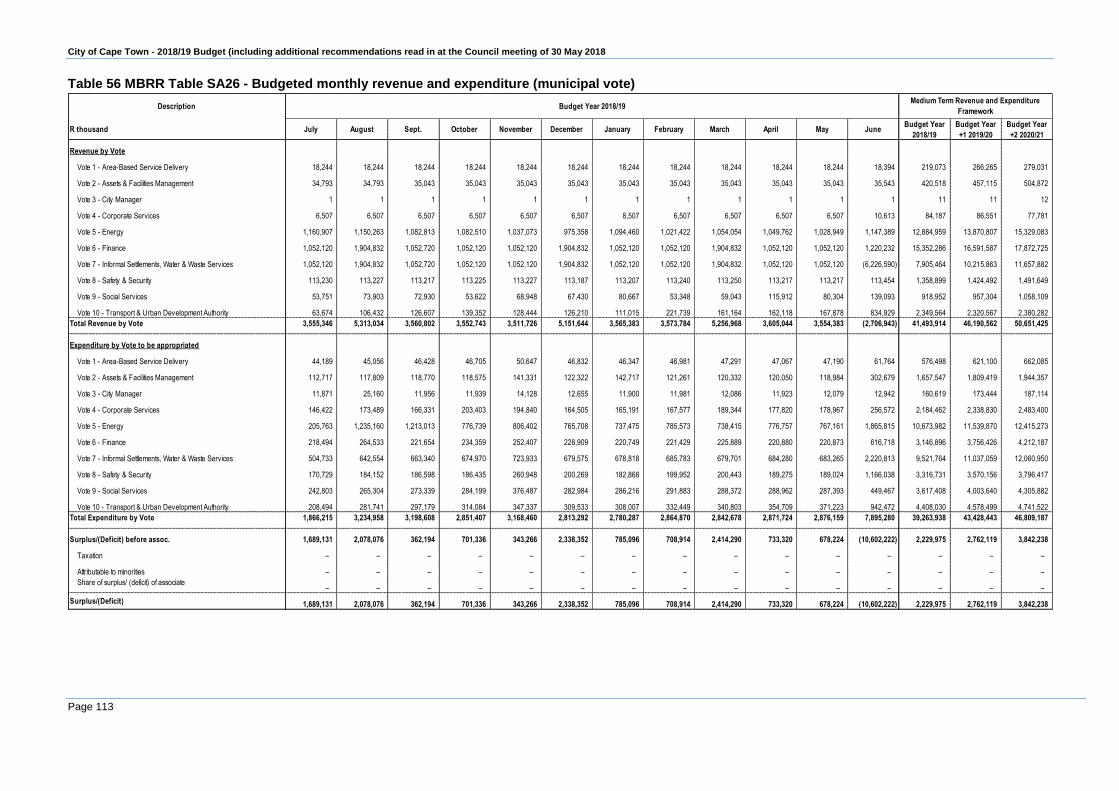
City of Cape Town - 2018/19 Budget (including additional recommendations read in at the Council meeting of 30 May 2018
Page 113
Table 56 MBRR Table SA26 - Budgeted monthly revenue and expenditure (municipal vote)
Description
R thousand July August Sept. October November December January February March April May JuneBudget Year
2018/19
Budget Year
+1 2019/20
Budget Year
+2 2020/21
Revenue by Vote
Vote 1 - Area-Based Service Delivery 18,244 18,244 18,244 18,244 18,244 18,244 18,244 18,244 18,244 18,244 18,244 18,394 219,073 266,265 279,031
Vote 2 - Assets & Facilities Management 34,793 34,793 35,043 35,043 35,043 35,043 35,043 35,043 35,043 35,043 35,043 35,543 420,518 457,115 504,872
Vote 3 - City Manager 1 1 1 1 1 1 1 1 1 1 1 1 11 11 12
Vote 4 - Corporate Services 6,507 6,507 6,507 6,507 6,507 6,507 8,507 6,507 6,507 6,507 6,507 10,613 84,187 86,551 77,781
Vote 5 - Energy 1,160,907 1,150,263 1,082,813 1,082,510 1,037,073 975,358 1,094,460 1,021,422 1,054,054 1,049,762 1,028,949 1,147,389 12,884,959 13,870,807 15,329,083
Vote 6 - Finance 1,052,120 1,904,832 1,052,720 1,052,120 1,052,120 1,904,832 1,052,120 1,052,120 1,904,832 1,052,120 1,052,120 1,220,232 15,352,286 16,591,587 17,872,725
Vote 7 - Informal Settlements, Water & Waste Services 1,052,120 1,904,832 1,052,720 1,052,120 1,052,120 1,904,832 1,052,120 1,052,120 1,904,832 1,052,120 1,052,120 (6,226,590) 7,905,464 10,215,863 11,657,882
Vote 8 - Safety & Security 113,230 113,227 113,217 113,225 113,227 113,187 113,207 113,240 113,250 113,217 113,217 113,454 1,358,899 1,424,492 1,491,649
Vote 9 - Social Services 53,751 73,903 72,930 53,622 68,948 67,430 80,667 53,348 59,043 115,912 80,304 139,093 918,952 957,304 1,058,109
Vote 10 - Transport & Urban Development Authority 63,674 106,432 126,607 139,352 128,444 126,210 111,015 221,739 161,164 162,118 167,878 834,929 2,349,564 2,320,567 2,380,282
Total Revenue by Vote 3,555,346 5,313,034 3,560,802 3,552,743 3,511,726 5,151,644 3,565,383 3,573,784 5,256,968 3,605,044 3,554,383 (2,706,943) 41,493,914 46,190,562 50,651,425
Expenditure by Vote to be appropriated
Vote 1 - Area-Based Service Delivery 44,189 45,056 46,428 46,705 50,647 46,832 46,347 46,981 47,291 47,067 47,190 61,764 576,498 621,100 662,085
Vote 2 - Assets & Facilities Management 112,717 117,809 118,770 118,575 141,331 122,322 142,717 121,261 120,332 120,050 118,984 302,679 1,657,547 1,809,419 1,944,357
Vote 3 - City Manager 11,871 25,160 11,956 11,939 14,128 12,655 11,900 11,981 12,086 11,923 12,079 12,942 160,619 173,444 187,114
Vote 4 - Corporate Services 146,422 173,489 166,331 203,403 194,840 164,505 165,191 167,577 189,344 177,820 178,967 256,572 2,184,462 2,338,830 2,483,400
Vote 5 - Energy 205,763 1,235,160 1,213,013 776,739 806,402 765,708 737,475 785,573 738,415 776,757 767,161 1,865,815 10,673,982 11,539,870 12,415,273
Vote 6 - Finance 218,494 264,533 221,654 234,359 252,407 228,909 220,749 221,429 225,889 220,880 220,873 616,718 3,146,896 3,756,426 4,212,187
Vote 7 - Informal Settlements, Water & Waste Services 504,733 642,554 663,340 674,970 723,933 679,575 678,818 685,783 679,701 684,280 683,265 2,220,813 9,521,764 11,037,059 12,060,950
Vote 8 - Safety & Security 170,729 184,152 186,598 186,435 260,948 200,269 182,868 199,952 200,443 189,275 189,024 1,166,038 3,316,731 3,570,156 3,796,417
Vote 9 - Social Services 242,803 265,304 273,339 284,199 376,487 282,984 286,216 291,883 288,372 288,962 287,393 449,467 3,617,408 4,003,640 4,305,882
Vote 10 - Transport & Urban Development Authority 208,494 281,741 297,179 314,084 347,337 309,533 308,007 332,449 340,803 354,709 371,223 942,472 4,408,030 4,578,499 4,741,522
Total Expenditure by Vote 1,866,215 3,234,958 3,198,608 2,851,407 3,168,460 2,813,292 2,780,287 2,864,870 2,842,678 2,871,724 2,876,159 7,895,280 39,263,938 43,428,443 46,809,187
Surplus/(Deficit) before assoc. 1,689,131 2,078,076 362,194 701,336 343,266 2,338,352 785,096 708,914 2,414,290 733,320 678,224 (10,602,222) 2,229,975 2,762,119 3,842,238
Taxation – – – – – – – – – – – – – – –
Attributable to minorities – – – – – – – – – – – – – – –
Share of surplus/ (deficit) of associate– – – – – – – – – – – – – – –
Surplus/(Deficit) 1,689,131 2,078,076 362,194 701,336 343,266 2,338,352 785,096 708,914 2,414,290 733,320 678,224 (10,602,222) 2,229,975 2,762,119 3,842,238
Budget Year 2018/19Medium Term Revenue and Expenditure
Framework

City of Cape Town - 2018/19 Budget (including additional recommendations read in at the Council meeting of 30 May 2018
Page 114
Table 57 MBRR Table SA27 - Budgeted monthly revenue and expenditure (functional classification)
Description
R thousand July August Sept. October November December January February March April May JuneBudget Year
2018/19
Budget Year
+1 2019/20
Budget Year
+2 2020/21
Revenue - Functional
Governance and administration 993,027 1,860,774 1,007,948 985,798 1,853,546 1,001,320 986,148 1,000,606 1,853,560 1,015,073 986,158 1,219,313 14,763,272 15,859,595 17,092,197
Executive and council 258 258 258 258 258 258 258 258 258 258 258 408 3,240 3,362 3,491
Finance and administration 992,769 1,860,516 1,007,690 985,540 1,853,288 1,001,062 985,890 1,000,348 1,853,302 1,014,815 985,900 1,218,905 14,760,024 15,856,224 17,088,697
Internal audit 1 1 1 1 1 1 1 1 1 1 1 1 8 9 9
Community and public safety 234,711 266,325 286,272 92,425 117,663 128,273 130,407 113,000 112,888 99,957 185,565 94,344 1,861,831 2,095,524 2,164,035
Community and social services 14,621 14,891 14,987 7,311 7,445 7,494 7,653 8,835 7,768 7,773 9,844 22,202 130,825 157,880 133,134
Sport and recreation 14,493 20,531 17,049 7,246 10,265 8,525 5,225 4,926 4,651 4,951 6,226 (12,769) 91,320 58,867 68,270
Public safety 1,863 1,863 1,863 977 977 977 977 977 977 977 977 (1,679) 11,726 12,371 13,057
Housing 142,300 163,224 185,116 46,173 66,067 77,649 84,885 66,359 67,665 56,204 139,966 116,352 1,211,961 1,416,120 1,454,192
Health 61,434 65,817 67,257 30,717 32,908 33,628 31,667 31,903 31,827 30,052 28,552 (29,762) 415,999 450,285 495,382
Economic and environmental services 379,764 452,015 468,949 478,235 484,345 470,900 458,428 494,538 503,765 503,431 513,898 (2,019,926) 3,188,342 3,146,271 3,355,662
Planning and development 61,016 60,963 60,913 61,543 61,023 60,499 60,691 61,193 61,587 62,143 62,701 (304,751) 369,522 425,592 444,155
Road transport 318,395 390,499 407,484 416,139 422,769 409,848 397,184 432,793 441,625 440,735 450,643 (1,722,626) 2,805,489 2,717,202 2,907,837
Environmental protection 353 553 553 553 553 553 553 553 553 553 553 7,451 13,331 3,477 3,670
Trading services 3,945,706 3,727,985 3,599,874 3,611,562 3,535,795 3,383,606 3,614,387 3,544,908 3,503,187 3,618,606 3,684,582 (18,096,254) 21,673,945 25,084,399 28,034,494
Energy sources 2,356,925 2,332,537 2,197,417 2,200,111 2,103,336 1,981,157 2,217,910 2,084,435 2,077,257 2,170,935 2,161,409 (10,796,804) 13,086,625 14,128,383 15,609,846
Water management 754,943 757,609 763,618 761,612 781,620 764,609 758,638 809,633 773,658 771,632 807,062 (3,854,226) 4,650,411 6,209,664 7,055,121
Waste water management 562,907 366,907 367,907 378,907 379,907 366,907 366,907 379,907 381,340 405,107 445,178 (2,090,527) 2,311,354 2,953,561 3,381,843
Waste management 270,932 270,932 270,932 270,932 270,932 270,932 270,932 270,932 270,932 270,932 270,932 (1,354,696) 1,625,554 1,792,791 1,987,684
Other 1,268 1,268 1,268 1,268 1,268 1,268 7,268 1,268 1,268 1,268 1,268 (13,429) 6,524 4,773 5,037
Total Revenue - Functional 5,554,476 6,308,368 5,364,313 5,169,288 5,992,618 4,985,367 5,196,640 5,154,320 5,974,668 5,238,336 5,371,471 (18,815,951) 41,493,914 46,190,562 50,651,425
Budget Year 2018/19Medium Term Revenue and Expenditure
Framework
Table continues on next page

City of Cape Town - 2018/19 Budget (including additional recommendations read in at the Council meeting of 30 May 2018
Page 115
Description
R thousand July August Sept. October November December January February March April May JuneBudget Year
2018/19
Budget Year
+1 2019/20
Budget Year
+2 2020/21
Expenditure - Functional
Governance and administration 610,806 722,544 652,796 700,282 758,007 675,647 648,163 676,330 698,809 673,950 673,865 1,027,024 8,518,224 9,511,725 10,359,133
Executive and council 34,189 47,120 33,780 33,970 40,925 34,693 34,497 34,619 34,816 34,623 34,775 52,135 450,141 493,578 526,864
Finance and administration 572,598 671,363 614,911 662,261 711,700 636,196 609,632 637,621 659,827 635,292 634,913 970,652 8,016,966 8,962,807 9,772,393
Internal audit 4,020 4,061 4,105 4,051 5,382 4,757 4,035 4,091 4,166 4,035 4,177 4,236 51,116 55,340 59,876
Community and public safety 651,135 693,617 724,697 737,379 959,974 740,799 773,430 755,737 762,712 779,092 791,797 (3,268,493) 5,101,875 5,588,351 5,910,967
Community and social services 126,672 136,324 142,299 146,004 205,481 139,625 138,979 143,397 142,551 144,856 152,867 (725,032) 894,025 953,313 1,021,370
Sport and recreation 159,952 172,252 183,976 191,780 232,379 183,835 184,856 186,165 187,356 186,934 191,703 (887,032) 1,174,156 1,228,640 1,278,714
Public safety 89,504 93,357 94,329 93,530 131,435 99,407 103,861 106,306 106,834 103,718 102,399 (509,355) 615,325 661,420 709,746
Housing 105,011 106,961 119,442 121,463 147,123 131,974 158,925 132,643 139,242 145,484 158,103 (226,723) 1,239,650 1,463,475 1,509,754
Health 169,996 184,723 184,651 184,602 243,555 185,956 186,810 187,225 186,729 198,098 186,724 (920,352) 1,178,718 1,281,503 1,391,383
Economic and environmental services 685,025 850,444 844,699 910,254 1,041,358 858,657 895,213 901,519 909,334 940,211 942,016 (3,227,522) 6,551,208 6,937,927 7,341,687
Planning and development 190,445 193,964 153,998 191,175 176,709 159,986 184,761 157,260 156,582 179,920 170,760 (855,126) 1,060,433 1,212,459 1,297,413
Road transport 476,195 635,429 670,537 698,226 838,434 677,905 688,420 721,977 729,604 737,445 748,839 (2,269,348) 5,353,664 5,598,973 5,908,428
Environmental protection 18,385 21,052 20,164 20,853 26,214 20,767 22,033 22,282 23,148 22,846 22,417 (103,048) 137,111 126,495 135,846
Trading services 1,287,896 3,614,473 3,623,104 2,771,814 2,910,488 2,761,731 2,708,211 2,817,205 2,709,263 2,806,257 2,792,767 (11,807,619) 18,995,590 21,292,141 23,092,626
Energy sources 368,982 2,409,533 2,368,438 1,494,689 1,543,791 1,473,171 1,416,828 1,513,845 1,416,769 1,497,663 1,477,577 (6,659,699) 10,321,587 11,164,578 12,017,986
Water management 559,363 680,758 694,888 688,425 764,062 691,744 700,053 700,990 694,001 689,815 698,003 (2,738,914) 4,823,188 5,956,992 6,416,993
Waste water management 175,837 240,828 286,280 274,888 286,923 274,731 269,221 280,263 276,377 296,660 300,725 (1,027,514) 1,935,220 2,137,441 2,497,902
Waste management 183,713 283,354 273,498 313,812 315,713 322,085 322,109 322,106 322,115 322,118 316,462 (1,381,492) 1,915,595 2,033,130 2,159,745
Other 18,914 19,604 19,461 19,484 17,807 48,975 42,436 28,754 35,710 13,408 13,082 (180,592) 97,042 98,301 104,774
Total Expenditure - Functional 3,253,777 5,900,681 5,864,756 5,139,212 5,687,633 5,085,809 5,067,453 5,179,545 5,115,828 5,212,919 5,213,528 (17,457,202) 39,263,938 43,428,443 46,809,187
Surplus/(Deficit) before assoc. 2,300,699 407,686 (500,444) 30,076 304,985 (100,442) 129,186 (25,225) 858,840 25,418 157,943 (1,358,749) 2,229,975 2,762,119 3,842,238
Share of surplus/ (deficit) of associate– – – – – – – – – – – – – – –
Surplus/(Deficit) 2,300,699 407,686 (500,444) 30,076 304,985 (100,442) 129,186 (25,225) 858,840 25,418 157,943 (1,358,749) 2,229,975 2,762,119 3,842,238
Budget Year 2018/19Medium Term Revenue and Expenditure
Framework
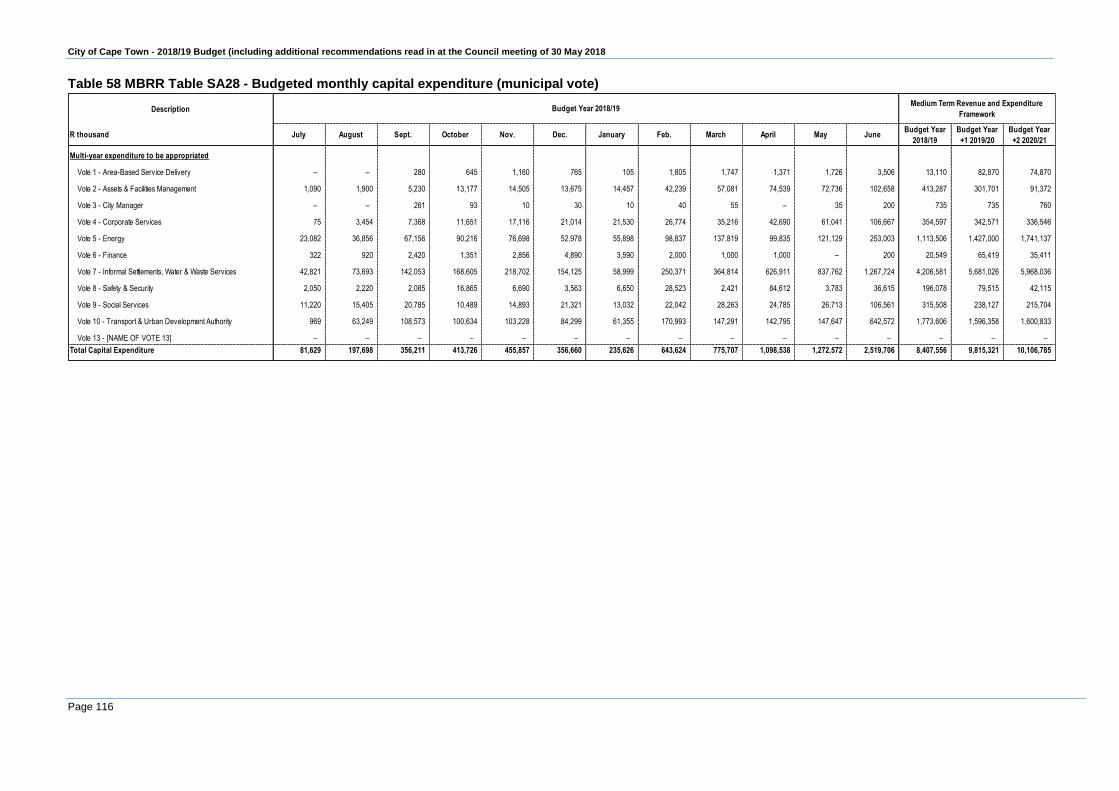
City of Cape Town - 2018/19 Budget (including additional recommendations read in at the Council meeting of 30 May 2018
Page 116
Table 58 MBRR Table SA28 - Budgeted monthly capital expenditure (municipal vote)
Description
R thousand July August Sept. October Nov. Dec. January Feb. March April May JuneBudget Year
2018/19
Budget Year
+1 2019/20
Budget Year
+2 2020/21
Multi-year expenditure to be appropriated
Vote 1 - Area-Based Service Delivery – – 280 645 1,160 765 105 1,805 1,747 1,371 1,726 3,506 13,110 82,870 74,870
Vote 2 - Assets & Facilities Management 1,090 1,900 5,230 13,177 14,505 13,675 14,457 42,239 57,081 74,539 72,736 102,658 413,287 301,701 91,372
Vote 3 - City Manager – – 261 93 10 30 10 40 55 – 35 200 735 735 760
Vote 4 - Corporate Services 75 3,454 7,368 11,651 17,116 21,014 21,530 26,774 35,216 42,690 61,041 106,667 354,597 342,571 336,546
Vote 5 - Energy 23,082 36,856 67,156 90,216 76,698 52,978 55,898 98,837 137,819 99,835 121,129 253,003 1,113,506 1,427,000 1,741,137
Vote 6 - Finance 322 920 2,420 1,351 2,856 4,890 3,590 2,000 1,000 1,000 – 200 20,549 65,419 35,411
Vote 7 - Informal Settlements, Water & Waste Services 42,821 73,693 142,053 168,605 218,702 154,125 58,999 250,371 364,814 626,911 837,762 1,267,724 4,206,581 5,681,026 5,968,036
Vote 8 - Safety & Security 2,050 2,220 2,085 16,865 6,690 3,563 6,650 28,523 2,421 84,612 3,783 36,615 196,078 79,515 42,115
Vote 9 - Social Services 11,220 15,405 20,785 10,489 14,893 21,321 13,032 22,042 28,263 24,785 26,713 106,561 315,508 238,127 215,704
Vote 10 - Transport & Urban Development Authority 969 63,249 108,573 100,634 103,228 84,299 61,355 170,993 147,291 142,795 147,647 642,572 1,773,606 1,596,358 1,600,833
Vote 13 - [NAME OF VOTE 13] – – – – – – – – – – – – – – –
Total Capital Expenditure 81,629 197,698 356,211 413,726 455,857 356,660 235,626 643,624 775,707 1,098,538 1,272,572 2,519,706 8,407,556 9,815,321 10,106,785
Budget Year 2018/19Medium Term Revenue and Expenditure
Framework

City of Cape Town - 2018/19 Budget (including additional recommendations read in at the Council meeting of 30 May 2018
Page 117
Table 59 MBRR Table SA29 - Budgeted monthly capital expenditure (functional classification)
Description
R thousand July August Sept. October Nov. Dec. January Feb. March April May JuneBudget Year
2018/19
Budget Year
+1 2019/20
Budget Year
+2 2020/21
Capital Expenditure - Functional
Governance and administration 9,434 13,934 29,081 45,411 48,691 55,146 51,105 57,497 99,531 193,738 134,898 248,049 986,516 827,799 856,764
Executive and council – 26 60 101 598 30 – 90 586 504 64 2,320 4,380 5,180 3,480
Finance and administration 9,434 13,908 28,900 45,305 48,093 55,116 51,105 57,407 98,945 193,234 134,834 245,724 982,005 822,487 853,224
Internal audit – – 121 5 – – – – – – – 5 131 131 60
Community and public safety 25,110 48,854 56,882 54,314 40,939 44,888 32,539 137,041 97,833 99,834 100,324 344,233 1,082,792 1,006,810 880,569
Community and social services 3,498 5,101 4,746 2,465 3,732 4,726 2,657 7,610 8,096 7,096 8,781 38,621 97,129 107,017 66,323
Sport and recreation 2,820 5,839 6,579 2,665 4,466 6,285 3,554 6,038 8,298 12,025 10,923 14,767 84,261 23,766 26,178
Public safety – – – – – – – 7,659 – – – 27,405 35,064 7,659 7,659
Housing 13,890 33,799 40,573 47,835 29,011 30,062 23,608 115,195 75,889 79,742 79,970 224,923 794,497 817,971 732,913
Health 4,901 4,115 4,985 1,350 3,730 3,815 2,720 540 5,550 970 650 38,516 71,841 50,396 47,496
Economic and environmental services 600 43,624 85,011 82,096 93,771 71,579 51,839 116,138 119,726 120,713 128,542 476,003 1,389,642 1,211,925 1,197,686
Planning and development – 2,295 2,545 1,863 3,953 1,443 1,168 3,898 5,060 4,914 3,449 9,313 39,904 76,795 96,723
Road transport 600 41,281 81,405 79,959 89,818 68,670 50,530 111,698 114,080 112,298 120,056 461,048 1,331,443 1,120,251 1,094,021
Environmental protection – 48 1,061 274 – 1,466 140 541 586 3,500 5,036 5,643 18,294 14,880 6,942
Trading services 46,435 91,086 184,971 230,881 271,352 184,186 98,914 331,763 457,582 683,343 908,228 1,451,046 4,939,787 6,761,392 7,166,070
Energy sources 19,135 33,536 61,455 86,526 73,211 47,886 53,394 96,013 131,917 97,834 120,129 250,703 1,071,737 1,422,800 1,643,542
Water management 11,700 27,750 40,600 48,948 59,300 64,250 29,000 96,300 187,480 394,755 587,500 819,147 2,366,730 3,097,400 3,297,047
Waste water management 14,500 28,500 47,000 59,490 101,800 70,250 12,450 104,259 100,650 149,550 156,450 290,214 1,135,113 1,673,849 1,716,148
Waste management 1,100 1,300 35,916 35,916 37,041 1,800 4,070 35,191 37,536 41,205 44,150 90,982 366,207 567,344 509,333
Other 50 200 265 1,025 1,103 860 1,230 1,185 1,035 910 580 375 8,818 7,395 5,695
Total Capital Expenditure - Functional 81,629 197,698 356,211 413,726 455,857 356,660 235,626 643,624 775,707 1,098,538 1,272,572 2,519,706 8,407,556 9,815,321 10,106,785
Budget Year 2018/19Medium Term Revenue and Expenditure
Framework
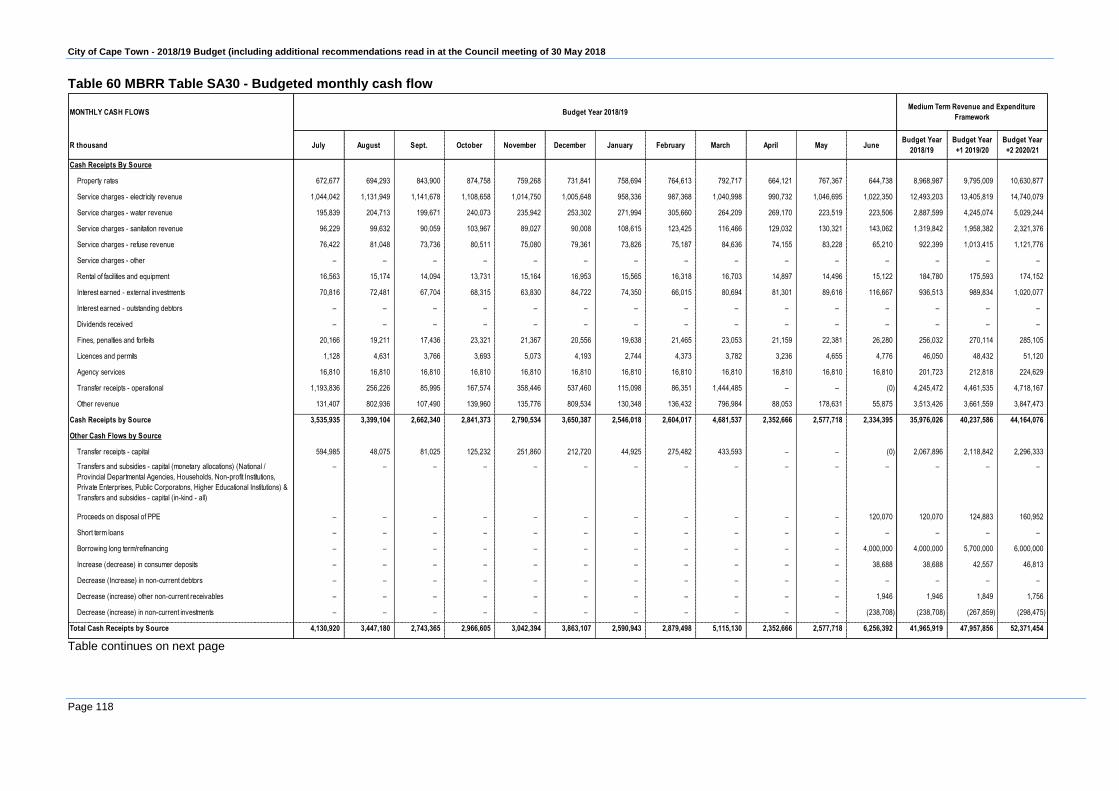
City of Cape Town - 2018/19 Budget (including additional recommendations read in at the Council meeting of 30 May 2018
Page 118
Table 60 MBRR Table SA30 - Budgeted monthly cash flow
MONTHLY CASH FLOWS
R thousand July August Sept. October November December January February March April May JuneBudget Year
2018/19
Budget Year
+1 2019/20
Budget Year
+2 2020/21
Cash Receipts By Source
Property rates 672,677 694,293 843,900 874,758 759,268 731,841 758,694 764,613 792,717 664,121 767,367 644,738 8,968,987 9,795,009 10,630,877
Service charges - electricity revenue 1,044,042 1,131,949 1,141,678 1,108,658 1,014,750 1,005,648 958,336 987,368 1,040,998 990,732 1,046,695 1,022,350 12,493,203 13,405,819 14,740,079
Service charges - water revenue 195,839 204,713 199,671 240,073 235,942 253,302 271,994 305,660 264,209 269,170 223,519 223,506 2,887,599 4,245,074 5,029,244
Service charges - sanitation revenue 96,229 99,632 90,059 103,967 89,027 90,008 108,615 123,425 116,466 129,032 130,321 143,062 1,319,842 1,958,382 2,321,376
Service charges - refuse revenue 76,422 81,048 73,736 80,511 75,080 79,361 73,826 75,187 84,636 74,155 83,228 65,210 922,399 1,013,415 1,121,776
Service charges - other – – – – – – – – – – – – – – –
Rental of facilities and equipment 16,563 15,174 14,094 13,731 15,164 16,953 15,565 16,318 16,703 14,897 14,496 15,122 184,780 175,593 174,152
Interest earned - external investments 70,816 72,481 67,704 68,315 63,830 84,722 74,350 66,015 80,694 81,301 89,616 116,667 936,513 989,834 1,020,077
Interest earned - outstanding debtors – – – – – – – – – – – – – – –
Dividends received – – – – – – – – – – – – – – –
Fines, penalties and forfeits 20,166 19,211 17,436 23,321 21,367 20,556 19,638 21,465 23,053 21,159 22,381 26,280 256,032 270,114 285,105
Licences and permits 1,128 4,631 3,766 3,693 5,073 4,193 2,744 4,373 3,782 3,236 4,655 4,776 46,050 48,432 51,120
Agency services 16,810 16,810 16,810 16,810 16,810 16,810 16,810 16,810 16,810 16,810 16,810 16,810 201,723 212,818 224,629
Transfer receipts - operational 1,193,836 256,226 85,995 167,574 358,446 537,460 115,098 86,351 1,444,485 – – (0) 4,245,472 4,461,535 4,718,167
Other revenue 131,407 802,936 107,490 139,960 135,776 809,534 130,348 136,432 796,984 88,053 178,631 55,875 3,513,426 3,661,559 3,847,473
Cash Receipts by Source 3,535,935 3,399,104 2,662,340 2,841,373 2,790,534 3,650,387 2,546,018 2,604,017 4,681,537 2,352,666 2,577,718 2,334,395 35,976,026 40,237,586 44,164,076
Other Cash Flows by Source
Transfer receipts - capital 594,985 48,075 81,025 125,232 251,860 212,720 44,925 275,482 433,593 – – (0) 2,067,896 2,118,842 2,296,333
Transfers and subsidies - capital (monetary allocations) (National /
Provincial Departmental Agencies, Households, Non-profit Institutions,
Private Enterprises, Public Corporatons, Higher Educational Institutions) &
Transfers and subsidies - capital (in-kind - all)
– – – – – – – – – – – – – – –
Proceeds on disposal of PPE – – – – – – – – – – – 120,070 120,070 124,883 160,952
Short term loans – – – – – – – – – – – – – – –
Borrowing long term/refinancing – – – – – – – – – – – 4,000,000 4,000,000 5,700,000 6,000,000
Increase (decrease) in consumer deposits – – – – – – – – – – – 38,688 38,688 42,557 46,813
Decrease (Increase) in non-current debtors – – – – – – – – – – – – – – –
Decrease (increase) other non-current receivables – – – – – – – – – – – 1,946 1,946 1,849 1,756
Decrease (increase) in non-current investments – – – – – – – – – – – (238,708) (238,708) (267,859) (298,475)
Total Cash Receipts by Source 4,130,920 3,447,180 2,743,365 2,966,605 3,042,394 3,863,107 2,590,943 2,879,498 5,115,130 2,352,666 2,577,718 6,256,392 41,965,919 47,957,856 52,371,454
Budget Year 2018/19Medium Term Revenue and Expenditure
Framework
Table continues on next page
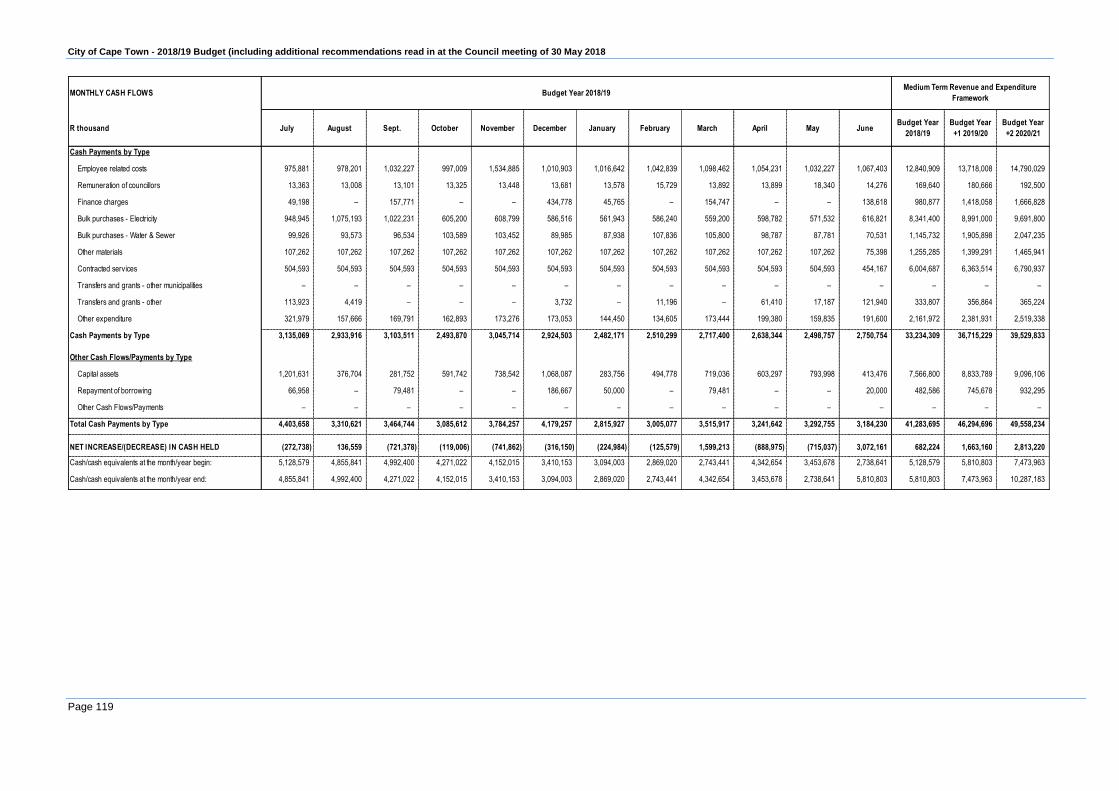
City of Cape Town - 2018/19 Budget (including additional recommendations read in at the Council meeting of 30 May 2018
Page 119
MONTHLY CASH FLOWS
R thousand July August Sept. October November December January February March April May JuneBudget Year
2018/19
Budget Year
+1 2019/20
Budget Year
+2 2020/21
Cash Payments by Type
Employee related costs 975,881 978,201 1,032,227 997,009 1,534,885 1,010,903 1,016,642 1,042,839 1,098,462 1,054,231 1,032,227 1,067,403 12,840,909 13,718,008 14,790,029
Remuneration of councillors 13,363 13,008 13,101 13,325 13,448 13,681 13,578 15,729 13,892 13,899 18,340 14,276 169,640 180,666 192,500
Finance charges 49,198 – 157,771 – – 434,778 45,765 – 154,747 – – 138,618 980,877 1,418,058 1,666,828
Bulk purchases - Electricity 948,945 1,075,193 1,022,231 605,200 608,799 586,516 561,943 586,240 559,200 598,782 571,532 616,821 8,341,400 8,991,000 9,691,800
Bulk purchases - Water & Sewer 99,926 93,573 96,534 103,589 103,452 89,985 87,938 107,836 105,800 98,787 87,781 70,531 1,145,732 1,905,898 2,047,235
Other materials 107,262 107,262 107,262 107,262 107,262 107,262 107,262 107,262 107,262 107,262 107,262 75,398 1,255,285 1,399,291 1,465,941
Contracted services 504,593 504,593 504,593 504,593 504,593 504,593 504,593 504,593 504,593 504,593 504,593 454,167 6,004,687 6,363,514 6,790,937
Transfers and grants - other municipalities – – – – – – – – – – – – – – –
Transfers and grants - other 113,923 4,419 – – – 3,732 – 11,196 – 61,410 17,187 121,940 333,807 356,864 365,224
Other expenditure 321,979 157,666 169,791 162,893 173,276 173,053 144,450 134,605 173,444 199,380 159,835 191,600 2,161,972 2,381,931 2,519,338
Cash Payments by Type 3,135,069 2,933,916 3,103,511 2,493,870 3,045,714 2,924,503 2,482,171 2,510,299 2,717,400 2,638,344 2,498,757 2,750,754 33,234,309 36,715,229 39,529,833
Other Cash Flows/Payments by Type
Capital assets 1,201,631 376,704 281,752 591,742 738,542 1,068,087 283,756 494,778 719,036 603,297 793,998 413,476 7,566,800 8,833,789 9,096,106
Repayment of borrowing 66,958 – 79,481 – – 186,667 50,000 – 79,481 – – 20,000 482,586 745,678 932,295
Other Cash Flows/Payments – – – – – – – – – – – – – – –
Total Cash Payments by Type 4,403,658 3,310,621 3,464,744 3,085,612 3,784,257 4,179,257 2,815,927 3,005,077 3,515,917 3,241,642 3,292,755 3,184,230 41,283,695 46,294,696 49,558,234
NET INCREASE/(DECREASE) IN CASH HELD (272,738) 136,559 (721,378) (119,006) (741,862) (316,150) (224,984) (125,579) 1,599,213 (888,975) (715,037) 3,072,161 682,224 1,663,160 2,813,220
Cash/cash equivalents at the month/year begin: 5,128,579 4,855,841 4,992,400 4,271,022 4,152,015 3,410,153 3,094,003 2,869,020 2,743,441 4,342,654 3,453,678 2,738,641 5,128,579 5,810,803 7,473,963
Cash/cash equivalents at the month/year end: 4,855,841 4,992,400 4,271,022 4,152,015 3,410,153 3,094,003 2,869,020 2,743,441 4,342,654 3,453,678 2,738,641 5,810,803 5,810,803 7,473,963 10,287,183
Budget Year 2018/19Medium Term Revenue and Expenditure
Framework
City of Cape Town - 2018/19 Budget (including additional recommendations read in at the Council meeting of 30 May 2018
Page 120
2.12 Annual budgets – internal departments
2.12.1 Area Based Service Delivery (Vote 1)
The directorate was established on 1 January 2017 through the Organisational Development and
Transformation Programme (ODTP) and aims to embed a customer-centred service delivery
improvement programme aimed at:
improving service delivery at a local level through an integrated customer-centric service
delivery model; and
improve area co-ordination and management of service delivery in a specified area with
agreed upon area boundaries.
This will ensure that all City services are operational, functional and measurable in line with the
five strategic pillars within 4 demarcated geographical areas.
The directorate consists of the following departments/functions:
Customer Relations
The Customer Relations (CR) unit provides an effective and efficient customer relations
service to the City’s customers to address their requirements in terms of access to municipal
service delivery, thereby creating a positive image of the City.
The goal of the unit is to provide a contact centre service to the City’s residents and businesses
that will ensure a speedy and effective response to customer enquiries and service requests
relating to accounts enquiries, general enquiries and service delivery, thereby supporting a
customer centric organisation. This is in line with Strategic Focus Area (SFA) 4 of the IDP -
“An inclusive City”. The focus is to improve the overall customer experience while engaging
with the City.
Public Participation
This unit is responsible for co-ordinating, advising and executing public participation across
the City. These functions have been included within this directorate in order to allow for
improved interactions with the local community in respect of matters such as organising,
advising, coordinating, communicating and distributing information as public participation
focuses on involvement of the local community in the affairs of the City.
Mayoral Urban Regeneration Programmes
This function is tasked to facilitate, co-ordinate and support interventions aimed at addressing
nodal priorities as identified by communities and directed by strategic intents of the City. The
main purpose of the function is to uplift former neglected, dysfunctional CBDs, Town Centres
and Community Nodes by improving safety, quality of life and socio-economic situation, with
a focus on the public and shared environment. It also seeks to introduce sustainable integrated
urban management of public infrastructure in partnership with communities, public and private
sector stakeholders.

City of Cape Town - 2018/19 Budget (including additional recommendations read in at the Council meeting of 30 May 2018
Page 121
City Improvement District Unit
The City Improvement District model is aimed at turning around / preventing degeneration of
areas by facilitating upliftment, economic growth and sustainable development through urban
management, cleaning of grime and combatting crime and improving service delivery in an
affordable and sustainable manner. The CID Unit is the point of entry for all matters relating
to CIDs as it facilitates the corporate involvement and provides strategic leadership and
corporate direction by managing processes and co-ordinating CIDs within the City to ensure
that they are compliant, affordable and sustainable.
The CID Unit is responsible for the establishment, renewal, extension of CID boundaries and
financial oversight/modelling/reporting. It reviews and maintains the legislative framework and
ensures that the CIDs business plans are aligned with the City’s IDP, supports the objectives
of the SA Constitution and the Integrated Urban Development Framework. The CID Unit is
the catalyst in fast tracking good governance to create safe, clean and sustainable
environments for CIDs to focus on urban management and service delivery as they are an
alternative funding solution for urban management and assist the City to use resources
optimally to ensure better value for money.
Area Departments
SubCouncils
This unit renders strategic, operational and specialist support to the decision-making
structures within the City. It establishes, institutes and manages the activities of
Subcouncils and Ward Participatory Mechanisms. It undertakes transversal management
through the Area Based Service Delivery Model implemented across the four Areas.
Area Economic Development
This unit is responsible for local tourism development as well as informal trading. The main
purpose is the co-ordination and development of amenities, facilities, products and
services that support host communities to deliver quality experiences for visitors and
residents well-being. It will also tap into the collective wisdom of local operator’s
knowledge, facilitate new tourism, partnership and investment and ensure that growth
benefits the poor and is accepted by the wider community. The unit is also responsible for
the day-to day management of informal traders and markets.

City of Cape Town - 2018/19 Budget (including additional recommendations read in at the Council meeting of 30 May 2018
Page 122
Table 61 Area Based Service Delivery (Vote 1) - operating revenue by source, expenditure by type
and total capital expenditure
Description 2014/15 2015/16 2016/17
R thousandAudited
Outcome
Audited
Outcome
Audited
Outcome
Original
Budget
Adjusted
Budget
Full Year
Forecast
Budget
Year
2018/19
Budget
Year +1
2019/20
Budget
Year +2
2020/21
Operating Revenue By Source
Property rates 134,172 150,645 169,260 198,921 198,921 198,921 215,691 227,554 240,183
Service charges - electricity revenue – – – – – – – – –
Service charges - water revenue – – – – – – – – –
Service charges - sanitation revenue – 0 – – – – – – –
Service charges - refuse revenue – – – – – – – – –
Service charges - other – – – – – – – – –
Rental of facilities and equipment 228 – – – – – – – –
Interest earned - external investments – – – – – – – – –
Interest earned - outstanding debtors 843 756 927 0 0 0 0 0 0
Dividends received – – – – – – – – –
Fines, penalties and forfeits – 621 – – – – – – –
Licences and permits 1 (48) (31) – – – – – –
Agency services – – – – – – – – –
Transfers and subsidies 4,341 2,727 469 886 1,354 1,354 886 886 886
Other revenue 2,931 3,613 3,760 2,224 2,224 2,224 2,346 2,475 2,612
Gains on disposal of PPE 18 10 19 – – – – – –
Total Operating Revenue (excluding capital
transfers and contributions)
142,534 158,323 174,404 202,031 202,499 202,499 218,923 230,915 243,681
Operating Expenditure By Type – – – – – – – – –
Employee related costs 149,639 159,205 174,446 230,656 226,405 226,405 254,005 267,586 289,949
Remuneration of councillors – – – – – – – – –
Debt impairment 4,025 4,519 5,078 5,968 5,968 5,968 6,471 6,471 6,471
Depreciation & asset impairment 6,754 7,186 (4,872) 10,314 9,054 9,054 10,604 10,432 11,622
Finance charges – – – 1,074 – – – – –
Bulk purchases – – – – – – – – –
Other materials 195 280 805 8,583 5,478 5,478 5,050 5,061 5,072
Contracted services 18,941 21,199 22,763 72,192 58,019 58,038 60,563 80,126 83,408
Transfers and subsidies 19,835 24,414 16,518 5,312 6,487 6,487 8,450 7,158 7,555
Other expenditure 158,999 176,620 197,513 212,911 213,254 213,235 231,353 244,262 258,004
Loss on disposal of PPE 3 11 8 – 3 3 3 3 4
Total Operating Expenditure 358,391 393,434 412,259 547,009 524,668 524,668 576,498 621,100 662,085
Surplus/(Deficit) (215,857) (235,111) (237,854) (344,978) (322,169) (322,169) (357,575) (390,185) (418,403)
Transfers & subsidies capital NT & PT 3,490 356 2,344 2,259 2,259 2,259 150 35,350 35,350
Transfers & subsidies capital agency,oth – – – – – – – – –
Transfers & subsidies capital in-kind – – – – – – – – –
Surplus/(Deficit) after capital transfers &
contributions
(212,367) (234,755) (235,510) (342,719) (319,910) (319,910) (357,425) (354,835) (383,053)
Taxation – – – – – – – – –
Surplus/(Deficit) after taxation (212,367) (234,755) (235,510) (342,719) (319,910) (319,910) (357,425) (354,835) (383,053)
Attributable to minorities – – – – – – – – –
Surplus/(Deficit) attributable to municipality (212,367) (234,755) (235,510) (342,719) (319,910) (319,910) (357,425) (354,835) (383,053)
Share of surplus/ (deficit) of associate – – – – – – – – –
Surplus/(Deficit) for the year (212,367) (234,755) (235,510) (342,719) (319,910) (319,910) (357,425) (354,835) (383,053)
Capital Expenditure 6,981 11,287 12,384 39,430 19,648 19,576 13,110 82,870 74,870
Directorate: Area-Based Service Delivery
Budgeted Financial Performance (revenue and expenditure)
Current Year 2017/18 2018/19 Medium Term Revenue &
Expenditure Framework

City of Cape Town - 2018/19 Budget (including additional recommendations read in at the Council meeting of 30 May 2018
Page 123
2.12.2 Assets & Facilities Management (Vote 2)
The Assets & Facilities Management directorate was established with the intention to engage in
the complete asset lifecycle management including the phases of Planning, Acquisition, Holding
and Disposal. Due to the fact that the City has a substantial portfolio of assets, the efficient and
effective distribution and management of these assets is critical to the sustained service delivery
objectives of the City and the community it serves.
The core functions and objectives of this directorate are:
Property Management
The purpose of this department is to ensure a sustained and cost effective Real Estate,
Property Development and Immovable Property Asset Management Functionality. Property
Management as the custodian of immovable property is accountable for oversight of the
deployment, use and performance of all immovable property assets as well as the creation
and retirement of immovable assets. The purpose of the Priority Assets branch in Property
Management is to ensure the financial sustainability of key City assets and the utilisation of
these assets in promoting Cape Town as a premier events destination.
Home Ownership Transfer, Tenancy Management and Staff Housing
The Home Ownership Transfer, Tenancy Management and Staff Housing department is
responsible to direct, manage and control the operations with regards to the transfer of City’s
Public Housing Assets as well as for tenancy transfer and management. The department is
also responsible for the development and implementation of maintenance plans by assessing
conditions, maintenance costing, and roll-out. The department also manages and administers
properties envisaged to be retained as operational staff housing.
Facilities Management
This department provides Transversal Facilities Management and Maintenance Services to
the directorate and to devolved asset users and will develop a facilities management and
maintenance support strategy, facilitate period tenders, assist with tender specifications and
quality control.
Fleet Management
The main function of this department is to provide a comprehensive fleet management service
to fulfil the City’s vehicles, plant and workshop requirements. Approximately 4 000 Fleet
(Vehicles and Plant Equipment) and the devolved fleets (self–owned vehicles and plant) are
managed by this section i.e.
Attend to special projects, emergencies in support of Disaster Management Services and
other Directorates (e.g. emergencies, whale recoveries, informal housing fires etc.);
Ensure availability of Fleet;
Procurement and disposal of Fleet;
Repairs and maintenance of Fleet;
On road fuelling of the Fleet;
Introduce fuel saving projects;
Private hire management of Fleet;
Legislative compliance; and
Fleet utilisation.

City of Cape Town - 2018/19 Budget (including additional recommendations read in at the Council meeting of 30 May 2018
Page 124
Significant capital projects to be undertaken over the medium term include, amongst
others:
Facilities Management Structural Rehabilitation of the Cape Town Civic Centre, which includes
the upgrading of the Ablution facilities;
Establishment of Municipal Courts;
Security Hardening of various facilities;
Replacement of Vehicles / Plant and associated equipment;
Development of a Fleet Management Information System;
Upgrading of the Fleet Workshops;
Upgrading of Priority Assets such Athlone Stadium, City Hall and Grand Parade;
Acquisition of land for Municipal Purposes;
Major Upgrading of Housing Rental Stock; and
Installation of Rental Stock Sub-Meters as part of the Water Resilience Programme.
Table 62 Assets & Facilities Management (Vote 2) - operating revenue by source, expenditure by
type and total capital expenditure
Description 2014/15 2015/16 2016/17
R thousandAudited
Outcome
Audited
Outcome
Audited
Outcome
Original
Budget
Adjusted
Budget
Full Year
Forecast
Budget Year
2018/19
Budget Year
+1 2019/20
Budget Year
+2 2020/21
Operating Revenue By Source
Property rates – – – – – – – – –
Service charges - electricity revenue – – – – – – – – –
Service charges - water revenue – – – – – – – – –
Service charges - sanitation revenue – – – – – – – – –
Service charges - refuse revenue – 2 – – – – – – –
Service charges - other – – 524 532 532 532 532 695 848
Rental of facilities and equipment 343,369 331,672 338,944 388,531 346,710 346,710 350,315 369,582 390,109
Interest earned - external investments 232 – 121 95 95 95 100 105 111
Interest earned - outstanding debtors 10,575 8,007 6,612 9,606 9,606 9,606 10,135 10,692 11,286
Dividends received – – – – – – – – –
Fines, penalties and forfeits 3 1,039 455 – – – – – –
Licences and permits 52 91 7 – – – – – –
Agency services – – – – – – – – –
Transfers and subsidies 27 – – 1,000 9,673 9,673 3,000 16,500 39,673
Other revenue 21,421 23,283 31,079 19,823 19,823 19,823 20,566 21,697 22,902
Gains on disposal of PPE 62,530 114,441 25,687 34,000 34,000 34,000 35,870 37,843 39,943
Total Operating Revenue (excluding capital
transfers and contributions)
438,210 478,535 403,429 453,587 420,440 420,440 420,518 457,115 504,872
Expenditure By Type
Employee related costs 428,562 467,010 504,474 660,219 614,539 614,661 661,574 724,361 784,810
Remuneration of councillors – – – – – – – – –
Debt impairment 170,317 124,317 104,843 159,259 159,259 159,259 152,024 148,716 153,863
Depreciation & asset impairment 310,756 325,716 320,862 372,706 370,610 370,610 201,125 215,763 227,647
Finance charges 2 1 5 30,959 – – – – –
Bulk purchases – – – – – – – – –
Other materials 31,057 28,222 73,720 41,976 43,516 43,516 44,111 60,935 62,556
Contracted services 226,506 272,349 272,825 389,922 399,140 398,525 481,131 498,456 544,360
Transfers and subsidies 5,311 2,505 256 1,500 1,500 1,500 – – –
Other expenditure 266,564 263,973 282,122 194,940 121,175 121,668 117,553 161,156 171,089
Loss on disposal of PPE 1,666 3,137 5,408 28 28 28 29 31 33
Total Operating Expenditure 1,440,741 1,487,231 1,564,514 1,851,509 1,709,767 1,709,767 1,657,547 1,809,419 1,944,357
Surplus/(Deficit) (1,002,532) (1,008,695) (1,161,086) (1,397,922) (1,289,327) (1,289,327) (1,237,029) (1,352,305) (1,439,485)
Transfers & subsidies capital NT & PT 269,339 93,576 95 – – – – – –
Transfers & subsidies capital agency,oth – – 10,526 – – – – – –
Transfers & subsidies capital in-kind – – – – – – – – –
Surplus/(Deficit) after capital transfers &
contributions
(733,192) (915,120) (1,150,465) (1,397,922) (1,289,327) (1,289,327) (1,237,029) (1,352,305) (1,439,485)
Taxation – – – – – – – – –
Surplus/(Deficit) after taxation (733,192) (915,120) (1,150,465) (1,397,922) (1,289,327) (1,289,327) (1,237,029) (1,352,305) (1,439,485)
Attributable to minorities – – – – – – – – –
Surplus/(Deficit) attributable to municipality (733,192) (915,120) (1,150,465) (1,397,922) (1,289,327) (1,289,327) (1,237,029) (1,352,305) (1,439,485)
Share of surplus/ (deficit) of associate – – – – – – – – –
Surplus/(Deficit) for the year (733,192) (915,120) (1,150,465) (1,397,922) (1,289,327) (1,289,327) (1,237,029) (1,352,305) (1,439,485)
Capital Expenditure 505,910 289,059 358,089 394,119 430,422 424,688 413,287 301,701 91,372
Directorate: Assets & Facilities Management
Budgeted Financial Performance (revenue and expenditure)
Current Year 2017/18 2018/19 Medium Term Revenue &
Expenditure Framework
City of Cape Town - 2018/19 Budget (including additional recommendations read in at the Council meeting of 30 May 2018
Page 125
2.12.3 City Manager (Vote 3)
The City Manager heads the administration of the City and chairs the Executive Management
Team (EMT) of the City, whose primary responsibility is advising the City Manager on strategy
and policy. The EMT also supports the City Manager by driving the implementation of strategic
programmes within the 5-year Integrated Development Plan (IDP).
Contained within the City Manager directorate are two strategic functionaries that advise the City
Manager on policy decisions and ensures compliance.
The recent structure change (adopted at Council in April 2018) saw the Probity department move
from Corporate Service directorate to the City Manager directorate. The Probity department
provides independent, objective and reliable assurance and advisory services, which is designed
to add value and improve the City’s operations. It further assists the City to accomplish its
objectives by bringing about a systematic, disciplined approach to evaluate and improve the
effectiveness of risk management, control and governance processes, forensics, ethics, integrity
and other investigations.
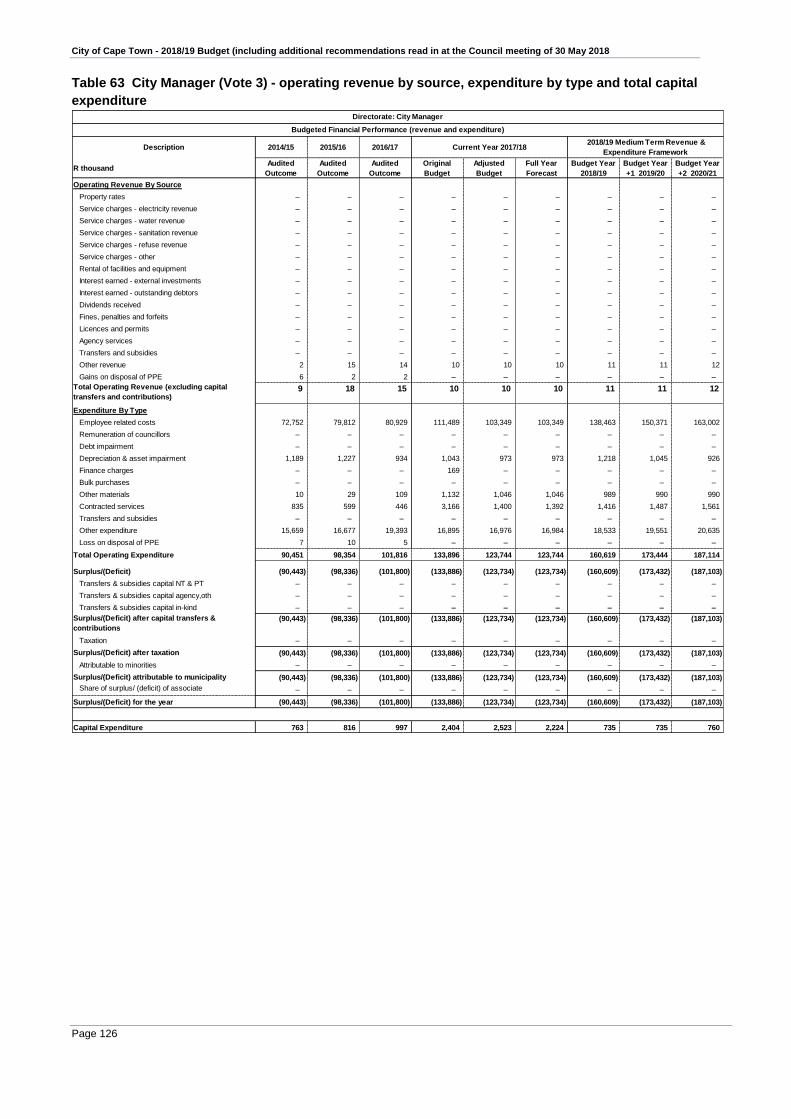
City of Cape Town - 2018/19 Budget (including additional recommendations read in at the Council meeting of 30 May 2018
Page 126
Table 63 City Manager (Vote 3) - operating revenue by source, expenditure by type and total capital
expenditure
Description 2014/15 2015/16 2016/17
R thousandAudited
Outcome
Audited
Outcome
Audited
Outcome
Original
Budget
Adjusted
Budget
Full Year
Forecast
Budget Year
2018/19
Budget Year
+1 2019/20
Budget Year
+2 2020/21
Operating Revenue By Source
Property rates – – – – – – – – –
Service charges - electricity revenue – – – – – – – – –
Service charges - water revenue – – – – – – – – –
Service charges - sanitation revenue – – – – – – – – –
Service charges - refuse revenue – – – – – – – – –
Service charges - other – – – – – – – – –
Rental of facilities and equipment – – – – – – – – –
Interest earned - external investments – – – – – – – – –
Interest earned - outstanding debtors – – – – – – – – –
Dividends received – – – – – – – – –
Fines, penalties and forfeits – – – – – – – – –
Licences and permits – – – – – – – – –
Agency services – – – – – – – – –
Transfers and subsidies – – – – – – – – –
Other revenue 2 15 14 10 10 10 11 11 12
Gains on disposal of PPE 6 2 2 – – – – – –
Total Operating Revenue (excluding capital
transfers and contributions)9 18 15 10 10 10 11 11 12
Expenditure By Type
Employee related costs 72,752 79,812 80,929 111,489 103,349 103,349 138,463 150,371 163,002
Remuneration of councillors – – – – – – – – –
Debt impairment – – – – – – – – –
Depreciation & asset impairment 1,189 1,227 934 1,043 973 973 1,218 1,045 926
Finance charges – – – 169 – – – – –
Bulk purchases – – – – – – – – –
Other materials 10 29 109 1,132 1,046 1,046 989 990 990
Contracted services 835 599 446 3,166 1,400 1,392 1,416 1,487 1,561
Transfers and subsidies – – – – – – – – –
Other expenditure 15,659 16,677 19,393 16,895 16,976 16,984 18,533 19,551 20,635
Loss on disposal of PPE 7 10 5 – – – – – –
Total Operating Expenditure 90,451 98,354 101,816 133,896 123,744 123,744 160,619 173,444 187,114
Surplus/(Deficit) (90,443) (98,336) (101,800) (133,886) (123,734) (123,734) (160,609) (173,432) (187,103)
Transfers & subsidies capital NT & PT – – – – – – – – –
Transfers & subsidies capital agency,oth – – – – – – – – –
Transfers & subsidies capital in-kind – – – – – – – – –
Surplus/(Deficit) after capital transfers &
contributions
(90,443) (98,336) (101,800) (133,886) (123,734) (123,734) (160,609) (173,432) (187,103)
Taxation – – – – – – – – –
Surplus/(Deficit) after taxation (90,443) (98,336) (101,800) (133,886) (123,734) (123,734) (160,609) (173,432) (187,103)
Attributable to minorities – – – – – – – – –
Surplus/(Deficit) attributable to municipality (90,443) (98,336) (101,800) (133,886) (123,734) (123,734) (160,609) (173,432) (187,103)
Share of surplus/ (deficit) of associate – – – – – – – – –
Surplus/(Deficit) for the year (90,443) (98,336) (101,800) (133,886) (123,734) (123,734) (160,609) (173,432) (187,103)
Capital Expenditure 763 816 997 2,404 2,523 2,224 735 735 760
Directorate: City Manager
Budgeted Financial Performance (revenue and expenditure)
Current Year 2017/18 2018/19 Medium Term Revenue &
Expenditure Framework

City of Cape Town - 2018/19 Budget (including additional recommendations read in at the Council meeting of 30 May 2018
Page 127
2.12.4 Corporate Services (Vote 4) The Corporate Services directorate is a transversal directorate by nature. Its core purpose is to
provide multi-disciplinary services and professional partnerships to directorates, supporting and
enabling service delivery for the City through value adding programmes, systems, processes,
policies and knowledge management.
The core functions and objectives of this directorate are:
Executive and Council Support
The department provides an interface between the executive and decision-making structures
and the organisation through effective and efficient facilitation of the decision-making process.
To this end, the department drives, develops, manages and maintains sound governance
systems, processes and procedures as key components of the professional support given to
Council and its committees, the Executive Mayor, the Mayoral Committee, the City Manager
and his Executive Management Team, and the organisation as a whole. It also drives the
implementation of the City’s Language Policy as well as the promotion of multilingualism.
Its Councillor Support branch provides operational and institutional support to all councillors.
Legal Services
To provide an effective and efficient legal support service to Council in order to enable it to
comply with its Constitutional Mandate and within the relevant legislative framework, so as to
manage and limit the legal risks of the City.
Human Resources
The purpose of Human Resources is to render a professional, efficient and effective service
to the City. The overarching aim is to ensure the City is recognised as a responsible, efficient
and customer-centric employer and the HR benchmark within local government in South Africa
by being a strategic business partner to business.
Information Systems & Technology (IS & T)
This department deploys its Digital City Strategy to maximize the use of Information and
Communication Technologies (ICT) within the City and thereby improving services to officials,
citizens, visitors and other stakeholders. As a strategic partner to Council and its various
business lines, it aims to be a catalyst for the transformation of public services and to continue
to enable the City to become a more efficient and effective local government authority. As a
technology leader the IS & T department positions itself as a dependable and trusted change
agent serving as the forefront of technological progress and innovation in order to render the
City more sustainable for all its stakeholders.
Information and Knowledge Management
This department is responsible, at a corporate level, for ensuring that relevant institutional
information, knowledge and records are managed, retained and shared across the
organisation in order to support planning, service delivery and more efficient management.

City of Cape Town - 2018/19 Budget (including additional recommendations read in at the Council meeting of 30 May 2018
Page 128
The department also provides specialised support services to City departments including land
surveying, geographic data management, map production, 3D modelling and information and
records management services.
Significant capital projects to be undertaken over the medium term include, amongst others:
Construction of a Metro Area Fibre Optic Network;
Enhance Corporate Business Systems;
Renew ICT Infrastructure; and
Update of aerial photography for municipal area.
The following additional key programmes and projects will be undertaken:
Staff Engagement Survey;
Enhancement of the Open Data Portal;
Records Management Programme including the enabling of Electronic Records Management,
Occupational Health and Safety Management programme;
Enable Mobile Government;
Enable Corporate Business Services;
e-HR Programme;
Talent Management Programme; and
External Skills Development programme (including external bursaries, learnerships, in-service
training and apprenticeships).
The recent structure change (adopted at Council in April 2018) saw the Strategic
Governance directorate (excluding the Probity department who moved to the City Manager
directorate) move to the Corporate Services directorate.
The following functional areas (departments) now form part of Corporate Services:
Organisational Effectiveness
This department is a Centre of Excellence established to provide the organisation with
strategies, tools and resources through its focus in driving strategic change through the People
Strategy; Operational Excellence and Innovation in order to improve service delivery and drive
customer centricity through a culture of collaboration and transversal management. Ultimately
the department must drive the City’s Government Modernization initiatives to prepare the City
for future challenges and opportunities. The department also provides strategic direction and
develops corporate guidelines for the implementation of the City’s Employment Equity (EE)
Policy and EE Plan, which forms the basis of the City’s transformation agenda.
Communication
The department provides a range of specialist communication services to all departments of
the City around all facets of communication. One of the main deliverables involves managing
the City’s Corporate Brand and media strategies, which in turn builds towards positive
perceptions and reputation for the City. Services provided include: media, communication
strategy and campaign development, publications, electronic communications, photography,
videography and audio-visual services. The dimensions of the department’s activities are
defined by the Corporate Brand Strategy, Brand Architecture and the Media and
Communication Strategies of the City.

City of Cape Town - 2018/19 Budget (including additional recommendations read in at the Council meeting of 30 May 2018
Page 129
Enterprise and Investment
The department is concerned with creating and sustaining the enabling environment required to
attract investment into the City for the purpose of generating inclusive economic growth and job
creation as well as improve the ease of doing business within the City for investors & SMME’s.
The department develops strategies and provides guidance for catalytic economic sectors and
works with sector organisations on specific deliverables in value chains, clustering and
partnerships. It advises on incentives for investors and performs “one-stop-shop” investment
facilitation services for both firm-level investors and larger property investors. It runs the Atlantis
Investment Facilitation office, which offers facilitation services in a Special Economic Zone.
It offers support services to Small Medium and Micro Enterprises (SMMEs) and co-ordinates
efforts to ease the cost of doing business in the city. It works on destination marketing, with specific
emphasis on growing the investment and tourism brands of the City.
The department also co-ordinates the international relations function of the City and works closely
with Wesgro, the trade and investment promotion agency of Cape Town and the Western Cape.
Organisation Performance Management
To manage and monitor the City’s performance and benchmark the City’s organisational
performance management against international best practise in order to improve service delivery
quality, accountability and create a mind-set of continuous improvement through performance
systems and processes.
Organisational Policy and Planning
The department has the role of leading, managing and supporting the organisation’s policy and
planning processes including the City’s corporate policy process, the development and review of
the IDP, the development and review of by-laws; the provision of legal comments on draft national
and provincial legislation, and research and evidence gathering and analysis to support decision-
making.
The department also provides support for transversal management systems and processes in the
City, including for the Executive Leadership.
Executive Coordination
This department ensures the efficient and effective management of support services for the
executive political offices of the Executive Mayor, Executive Deputy Mayor, Chief Whip and
Speaker by providing strategic transversal services. The branch includes STS Administration, the
VIP Unit, the Stakeholder Unit, Events and Protocol who are all engaged in supporting the
executive offices.
Resilience
The Resilience Office, working with multiple internal and external stakeholders, and partnering
with 100 Resilient Cities, is tasked with developing Cape Town’s first ever City Resilience Strategy,
and associated initiatives. The aim of the strategy is to help the city as whole, inclusive of all its
people, organisations and systems, to survive, adapt and thrive no matter what shocks and
stresses are experienced. Internally within the organisation, the Resilience Office is expected to
lead the mainstreaming of resilience thinking among staff in order to ensure that the principle of
resilience is embedded in line with the provisions of the current IDP.

City of Cape Town - 2018/19 Budget (including additional recommendations read in at the Council meeting of 30 May 2018
Page 130
Selected initiatives in the 2018/19 financial year
Facilitation and management of the City’s Strategic Management Framework process
(2019/20)
Preparation of the City’s Strategic policy agenda
Facilitation and management of the IDP 2019/20 review and amendment process
City of Cape Town Research Strategy and action plan
Backyard information project (Phase 2 – communication, further analytics, system proposal)
Economic impact modelling
Quarterly reports on the State of the Cape Town economy
Annual Customer/Community Satisfaction Survey
Project Portfolio Management: Organisational Development and Transformation Project
(ODTP) enhancements
Roll-out of information sessions on King IV and its supplements to Local Government to the
City’s leadership and line management in the various directorates in order to contribute
towards the continuous improvements to the governance and the control environment of the
City.
Development of a range of multi-faceted communication campaigns to inform and educate
residents on a range of City matters that affect them.
Support smaller, more focused initiatives to inform and educate specific target audiences on
various City services matters, at a local level.
Leverage the City’s corporate identity; logo and payoff line in a wide range of products to
identify and showcase the work the City does.
Visually document the City’s business; be it photographs or video to showcase what the City
does.
Development of Cape Town’s first City Resilience Strategy in partnership with 100 Resilient
Cities.

City of Cape Town - 2018/19 Budget (including additional recommendations read in at the Council meeting of 30 May 2018
Page 131
Table 64 Corporate Services (Vote 4) - operating revenue by source, expenditure by type and total
capital expenditure
Description 2014/15 2015/16 2016/17
R thousandAudited
Outcome
Audited
Outcome
Audited
Outcome
Original
Budget
Adjusted
Budget
Full Year
Forecast
Budget Year
2018/19
Budget Year
+1 2019/20
Budget Year
+2 2020/21
Operating Revenue By Source
Property rates – – – – – – – – –
Service charges - electricity revenue – – – – – – – – –
Service charges - water revenue – – – – – – – – –
Service charges - sanitation revenue – – – – – – – – –
Service charges - refuse revenue – – – – – – – – –
Service charges - other – – – – – – – – –
Rental of facilities and equipment 36 128 45 74 74 74 78 82 87
Interest earned - external investments 1,332 – – – – – – – –
Interest earned - outstanding debtors 1 13 19 30 30 30 31 33 35
Dividends received – – – – – – – – –
Fines, penalties and forfeits 1 2 0 1 – – – – –
Licences and permits (8) – (5) – – – – – –
Agency services – – – – – – – – –
Transfers and subsidies 7,966 12,986 7,552 12,799 28,220 28,220 27,707 28,019 16,000
Other revenue 45,271 32,560 56,448 57,484 52,485 52,485 55,371 58,417 61,659
Gains on disposal of PPE 195 279 273 – – – – – –
Total Operating Revenue (excluding capital
transfers and contributions)
54,795 45,967 64,332 70,387 80,809 80,809 83,187 86,551 77,781
Expenditure By Type
Employee related costs 633,663 694,809 769,813 980,110 909,123 903,907 1,109,459 1,204,344 1,304,993
Remuneration of councillors 128,412 134,637 138,374 155,787 155,565 155,565 169,640 180,666 192,500
Debt impairment (27) (67) 31 – – – – – –
Depreciation & asset impairment 130,462 145,901 168,605 165,695 177,403 177,403 187,808 203,371 209,174
Finance charges – – – 16,891 – – – – –
Bulk purchases – – – – – – – – –
Other materials 1,615 2,292 3,650 34,159 30,694 30,506 26,693 27,539 28,446
Contracted services 252,377 98,164 112,637 222,874 198,707 204,145 190,735 195,753 204,428
Transfers and subsidies 64,283 53,413 57,130 71,515 83,480 83,480 84,285 88,120 93,632
Other expenditure 358,228 528,545 513,537 540,410 462,083 462,017 415,762 438,952 450,137
Loss on disposal of PPE 84 122 112 77 77 109 81 86 90
Total Operating Expenditure 1,569,098 1,657,814 1,763,888 2,187,517 2,017,132 2,017,132 2,184,462 2,338,830 2,483,400
Surplus/(Deficit) (1,514,303) (1,611,848) (1,699,556) (2,117,129) (1,936,324) (1,936,324) (2,101,275) (2,252,279) (2,405,620)
Transfers & subsidies capital NT & PT 8,800 11,475 989 1,000 1,103 1,103 1,000 – –
Transfers & subsidies capital agency,oth – – 287 – 600 600 – – –
Transfers & subsidies capital in-kind – – – – – – – – –
Surplus/(Deficit) after capital transfers &
contributions
(1,505,503) (1,600,372) (1,698,281) (2,116,129) (1,934,621) (1,934,621) (2,100,275) (2,252,279) (2,405,620)
Taxation – – – – – – – – –
Surplus/(Deficit) after taxation (1,505,503) (1,600,372) (1,698,281) (2,116,129) (1,934,621) (1,934,621) (2,100,275) (2,252,279) (2,405,620)
Attributable to minorities – – – – – – – – –
Surplus/(Deficit) attributable to municipality (1,505,503) (1,600,372) (1,698,281) (2,116,129) (1,934,621) (1,934,621) (2,100,275) (2,252,279) (2,405,620)
Share of surplus/ (deficit) of associate – – – – – – – – –
Surplus/(Deficit) for the year (1,505,503) (1,600,372) (1,698,281) (2,116,129) (1,934,621) (1,934,621) (2,100,275) (2,252,279) (2,405,620)
Capital Expenditure 323,414 337,912 266,229 366,613 379,349 378,041 354,597 342,571 336,546
Directorate: Corporate Services
Budgeted Financial Performance (revenue and expenditure)
Current Year 2017/18 2018/19 Medium Term Revenue &
Expenditure Framework

City of Cape Town - 2018/19 Budget (including additional recommendations read in at the Council meeting of 30 May 2018
Page 132
2.12.5 Energy (Vote 5)
The Constitution stipulates that an object of local government is to ensure the provision of services
to communities in a sustainable manner. It also provides that a municipality has executive authority
in respect of, and has the right to administer local government matters listed in Part B of Schedule
4 and Part B of Schedule 5. Electricity reticulation is a Schedule 4B function and street lighting is
schedule 5B function, both of which the City has elected to exercise its authority and rights.
To meet this responsibility, the Energy directorate must ensure the provision of effective electricity
reticulation and street lighting services in a sustainable manner through effective management of
natural resources and service delivery infrastructure.
Electricity Generation and Distribution
The City’s Electricity Generation and Distribution department reticulates electricity to
residential and commercial/industrial customers in its electricity area of supply. The
department holds a distribution licence from the National Energy Regulator of South Africa
(NERSA). Under the NERSA licence, the standard of services provided must meet the
requirements as set out in the national standards NRS047 and NRS048.
The operating budget of which the largest component is electrical energy costs also supports
the operation, maintenance, growth and refurbishment of the electricity distribution network
that is the backbone for the provision of electricity reticulation services. Asset management
plans where infrastructure projects are evaluated and graded on a risk matrix inform the capital
budget.
Access to electricity services for new consumers is achieved through the demand driven
capital programme funded through shared network cost contributions for non-subsidised
residential and commercial consumers. In the case of housing developments, which consist of
dwellings for which the beneficiaries are eligible for Government housing subsidies, access to
electricity services is subsidised via the Integrated National Electrification Plan (INEP) or
Urban Settlements Development Grant (USDG) funding. In the case of informal housing,
access to electricity services is undertaken through the department’s electrification and
backyarder plans, which are also INEP and USDG funded.
The budget presented is based on a combination of zero as well as parameter based
budgetary methods. The planned change is premised on the framework that will allow the
finance function to add value to the business it serves. The financial plan is cognitive of the
key cost drivers.
Unless otherwise stated, financial modelling is based on the assumptions listed below:
System energy growth calculation based on recent and current energy consumptive
patterns which are declining;
CPIX as determined by Corporate Finance for the next three years;
Effective Eskom increase for municipalities is assumed to be 7.32%; and
Collection ratio of 98% for the next three years.

City of Cape Town - 2018/19 Budget (including additional recommendations read in at the Council meeting of 30 May 2018
Page 133
The capital budget is funded from a number of funding sources with the Capital Replacement
Reserve (CRR), External Financing Fund (EFF) and Grants & Donations (CGD) being the
largest.
It is critically important to match the benchmark for the investment in refurbishment in
accordance with international best practice to ensure good quality of supply and excellent
customer and service delivery.
External Financing Fund (EFF) envelopes are set by Corporate Finance and increases in
capital charges related to this funding source have an impact on tariffs. Non-generating
revenue projects in respect of infrastructure and refurbishment are earmarked to be funded
from CRR (revenue) rather than from EFF (loans). This practice over an extended period will
have the effect of reducing tariff increase requirements.
Legislated principles, which are in the long-term interests of the electricity consumer in South
Africa, inform the City’s annual tariff adjustment process. In terms of these, electricity tariffs
should reflect the underlying costs of supply for the majority of consumers. This will ensure
that consumers make rational decisions on electricity consumption, and that the correct levels
of resources are dedicated to electricity supply in South Africa over time. Tariff structure
adjustments shall be introduced in a phased manner in order to give customers the opportunity
to respond and adjust behavior accordingly. The Home User Tariff will be introduced this year
for residential customers and the Large User Time of Use Tariffs for the commercial and
industrial customers.
The department is also responsible for the provision of street and public lighting across the
entire metro area of the City (both the City’s and Eskom’s electricity area of supply). This,
however, excludes the provision of street lighting on national and provincial roads.
Sustainable Energy Markets
The newly created Sustainable Energy Markets department’s focus will be to make Cape Town
more energy secure by exploring all available options to buy energy directly from Independent
Power Producers; encouraging embedded generation; developing a revenue model that is less
reliant on the sale of electricity; and working towards a more sustainable mix of energy sources
with a greater emphasis on renewables. This will include coordinating the implementation and
monitoring of the City’s Sustainable Energy Action Plan with departments and stakeholders
towards achieving the Cape Town Energy 2040 vision, ensuring the continuation of improving
the City’s own energy use and carbon footprint by retrofitting City buildings and operations and
promoting renewable energy technologies (solar water heating) and energy efficiency.

City of Cape Town - 2018/19 Budget (including additional recommendations read in at the Council meeting of 30 May 2018
Page 134
Table 65 Energy (Vote 5) - operating revenue by source, expenditure by type and total capital
expenditure
Description 2014/15 2015/16 2016/17
R thousandAudited
Outcome
Audited
Outcome
Audited
Outcome
Original
Budget
Adjusted
Budget
Full Year
Forecast
Budget Year
2018/19
Budget Year
+1 2019/20
Budget Year
+2 2020/21
Operating Revenue By Source
Property rates – – – – – – – – –
Service charges - electricity revenue 9,981,814 11,202,784 11,763,615 11,942,546 11,942,546 11,942,546 12,591,403 13,519,095 14,865,239
Service charges - water revenue – – – – – – – – –
Service charges - sanitation revenue – – – – – – – – –
Service charges - refuse revenue – – – – – – – – –
Service charges - other – – – – – – – – –
Rental of facilities and equipment 453 517 794 820 820 820 975 1,028 1,085
Interest earned - external investments 0 – – – – – – – –
Interest earned - outstanding debtors 19,868 21,678 21,736 22,000 22,000 22,000 25,800 27,219 28,730
Dividends received – – – – – – – – –
Fines, penalties and forfeits 150 1,745 – – – – – – –
Licences and permits – – – – – – – – –
Agency services – – – – – – – – –
Transfers and subsidies 88,623 3,438 4,596 1,400 7,608 7,608 4,567 3,274 –
Other revenue 108,166 96,150 129,078 100,152 100,152 100,152 98,805 104,238 110,019
Gains on disposal of PPE 3,104 2,090 2,979 2,500 2,500 2,500 2,500 2,638 2,784
Total Operating Revenue (excluding capital
transfers and contributions)
10,202,179 11,328,403 11,922,798 12,069,418 12,075,626 12,075,626 12,724,050 13,657,492 15,007,857
Expenditure By Type
Employee related costs 786,445 909,886 937,460 1,145,547 1,084,980 1,083,515 1,203,294 1,300,153 1,402,895
Remuneration of councillors – – – – – – – – –
Debt impairment 95,576 132,560 84,156 171,106 126,106 126,106 128,522 189,782 204,701
Depreciation & asset impairment 236,487 253,589 280,638 315,958 316,023 316,023 353,185 378,946 402,631
Finance charges – – – 278 – – – – –
Bulk purchases 6,708,777 7,656,071 8,069,461 8,094,800 8,094,800 8,094,800 8,341,400 8,991,000 9,691,800
Other materials 92,384 86,650 92,510 136,750 134,742 134,197 134,931 141,465 148,475
Contracted services 275,785 203,714 200,903 284,564 285,460 287,560 315,872 332,357 347,787
Transfers and subsidies – – – – – – – – –
Other expenditure 205,391 225,285 219,528 206,564 174,441 174,351 196,586 205,962 216,768
Loss on disposal of PPE 199 409 355 184 184 184 194 205 216
Total Operating Expenditure 8,401,044 9,468,163 9,885,010 10,355,750 10,216,736 10,216,736 10,673,982 11,539,870 12,415,273
Surplus/(Deficit) 1,801,136 1,860,239 2,037,788 1,713,668 1,858,890 1,858,890 2,050,068 2,117,622 2,592,584
Transfers & subsidies capital NT & PT 147,016 155,071 115,465 134,600 122,686 122,686 116,709 166,716 271,126
Transfers & subsidies capital agency,oth 31,762 44,220 45,412 52,900 64,400 64,400 44,200 46,600 50,100
Transfers & subsidies capital in-kind – – – – – – – – –
Surplus/(Deficit) after capital transfers &
contributions
1,979,913 2,059,530 2,198,665 1,901,168 2,045,977 2,045,977 2,210,977 2,330,937 2,913,810
Taxation – – – – – – – – –
Surplus/(Deficit) after taxation 1,979,913 2,059,530 2,198,665 1,901,168 2,045,977 2,045,977 2,210,977 2,330,937 2,913,810
Attributable to minorities – – – – – – – – –
Surplus/(Deficit) attributable to municipality 1,979,913 2,059,530 2,198,665 1,901,168 2,045,977 2,045,977 2,210,977 2,330,937 2,913,810
Share of surplus/ (deficit) of associate – – – – – – – – –
Surplus/(Deficit) for the year 1,979,913 2,059,530 2,198,665 1,901,168 2,045,977 2,045,977 2,210,977 2,330,937 2,913,810
Capital Expenditure 952,415 1,090,855 1,248,887 1,292,814 1,177,050 1,103,282 1,113,506 1,427,000 1,741,137
Directorate: Energy
Budgeted Financial Performance (revenue and expenditure)
Current Year 2017/18 2018/19 Medium Term Revenue &
Expenditure Framework
City of Cape Town - 2018/19 Budget (including additional recommendations read in at the Council meeting of 30 May 2018
Page 135
2.12.6 Finance (Vote 6)
The ultimate aim of the Finance directorate is to ensure that excellent financial governance is
embedded throughout the organisation, with clear internal controls, sustainable policies and
standardised procedures that ensure legislative compliance whilst supporting the organisations
strategic and service delivery mandates.
The departmental structure within the directorate consists of the Chief Finance Officer and seven
(7) directors i.e. Budgets, Expenditure, Revenue, Supply Chain Management, Treasury, Grant
Funding and Valuations.
The key projects contained within the 2018/19 capital budget of the Finance directorate support
both financial control and enhanced service delivery and includes a number of strategically aligned
projects including the E-Tender Tracking System, Walk-in Centre Table Bay Mall, Furniture & IT
equipment and Security at Cash/MVR offices, all of which support the ease with which ratepayers
can engage and do business with the City.
The departments in the Finance directorate are responsible, for inter alia:
Budgeting, which gives financial effect to the strategic focus in the form of credible, viable and
sustainable short, medium & long term financial planning.
Maintaining accurate and complete financial records of the City to enhance decision-making
thereby sustaining confidence in these records.
Managing the City’s banking, investments, borrowings and cash flow in the most effective,
economical and efficient manner.
Billing and collecting money and funds due to the City.
Controlling and monitoring all expenditure in order to embed sound financial discipline and
ensure accountability for the use of public funds.
Market related property valuations and the maintenance of compliant rates rebates in order to
equitably levy rates on all rateable properties for the provision of the unconditional revenue
stream to finance non-tariff funded services.
Payment of creditors in compliance with MFMA provisions.
Development and implementation of a comprehensive conditional grant fund, compliance and
synergistic grant fund management structure.
Development and reviewing of financial and finance-related policies.
Ensuring compliance to relevant legislation, and the implementation and maintenance of good
governance practices.
Modelling the impact of the Total Municipal Account (TMA) on residents to ensure a fair
distribution of the burden.
Implementation of sound supply chain management policies and procedures - to improve on
supply chain turnaround times.
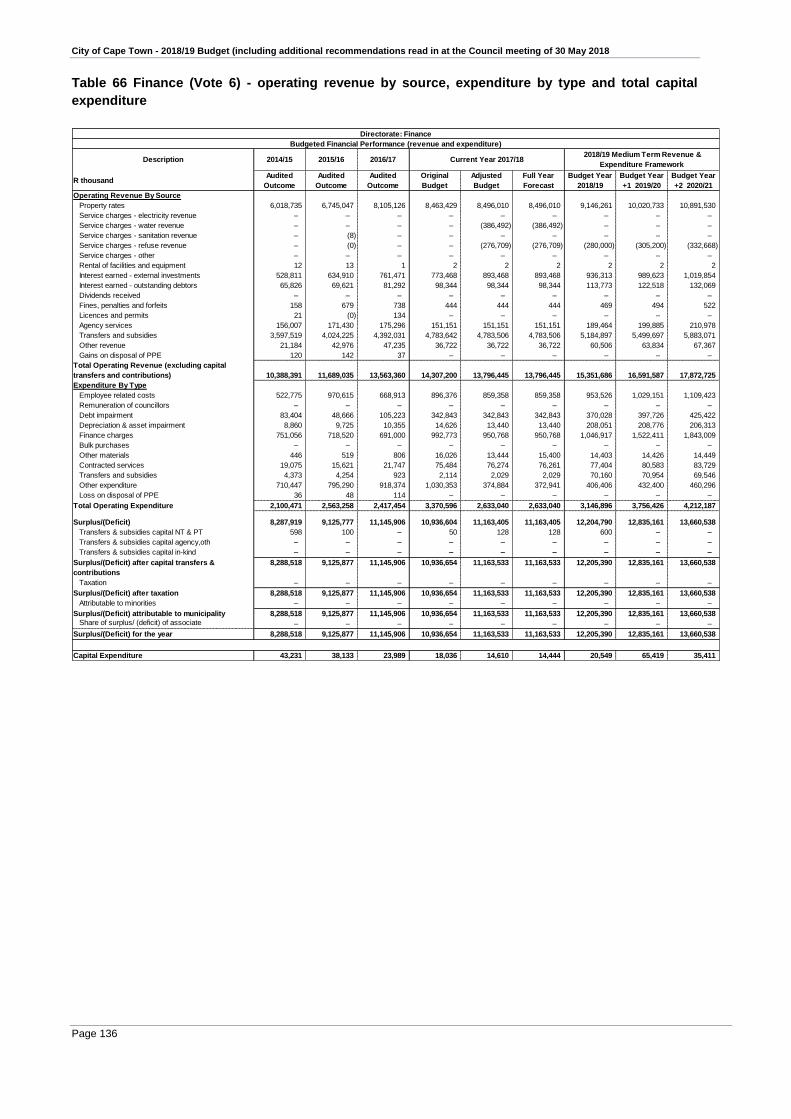
City of Cape Town - 2018/19 Budget (including additional recommendations read in at the Council meeting of 30 May 2018
Page 136
Table 66 Finance (Vote 6) - operating revenue by source, expenditure by type and total capital
expenditure
Description 2014/15 2015/16 2016/17
R thousandAudited
Outcome
Audited
Outcome
Audited
Outcome
Original
Budget
Adjusted
Budget
Full Year
Forecast
Budget Year
2018/19
Budget Year
+1 2019/20
Budget Year
+2 2020/21
Operating Revenue By Source
Property rates 6,018,735 6,745,047 8,105,126 8,463,429 8,496,010 8,496,010 9,146,261 10,020,733 10,891,530
Service charges - electricity revenue – – – – – – – – –
Service charges - water revenue – – – – (386,492) (386,492) – – –
Service charges - sanitation revenue – (8) – – – – – – –
Service charges - refuse revenue – (0) – – (276,709) (276,709) (280,000) (305,200) (332,668)
Service charges - other – – – – – – – – –
Rental of facilities and equipment 12 13 1 2 2 2 2 2 2
Interest earned - external investments 528,811 634,910 761,471 773,468 893,468 893,468 936,313 989,623 1,019,854
Interest earned - outstanding debtors 65,826 69,621 81,292 98,344 98,344 98,344 113,773 122,518 132,069
Dividends received – – – – – – – – –
Fines, penalties and forfeits 158 679 738 444 444 444 469 494 522
Licences and permits 21 (0) 134 – – – – – –
Agency services 156,007 171,430 175,296 151,151 151,151 151,151 189,464 199,885 210,978
Transfers and subsidies 3,597,519 4,024,225 4,392,031 4,783,642 4,783,506 4,783,506 5,184,897 5,499,697 5,883,071
Other revenue 21,184 42,976 47,235 36,722 36,722 36,722 60,506 63,834 67,367
Gains on disposal of PPE 120 142 37 – – – – – –
Total Operating Revenue (excluding capital
transfers and contributions) 10,388,391 11,689,035 13,563,360 14,307,200 13,796,445 13,796,445 15,351,686 16,591,587 17,872,725
Expenditure By Type
Employee related costs 522,775 970,615 668,913 896,376 859,358 859,358 953,526 1,029,151 1,109,423
Remuneration of councillors – – – – – – – – –
Debt impairment 83,404 48,666 105,223 342,843 342,843 342,843 370,028 397,726 425,422
Depreciation & asset impairment 8,860 9,725 10,355 14,626 13,440 13,440 208,051 208,776 206,313
Finance charges 751,056 718,520 691,000 992,773 950,768 950,768 1,046,917 1,522,411 1,843,009
Bulk purchases – – – – – – – – –
Other materials 446 519 806 16,026 13,444 15,400 14,403 14,426 14,449
Contracted services 19,075 15,621 21,747 75,484 76,274 76,261 77,404 80,583 83,729
Transfers and subsidies 4,373 4,254 923 2,114 2,029 2,029 70,160 70,954 69,546
Other expenditure 710,447 795,290 918,374 1,030,353 374,884 372,941 406,406 432,400 460,296
Loss on disposal of PPE 36 48 114 – – – – – –
Total Operating Expenditure 2,100,471 2,563,258 2,417,454 3,370,596 2,633,040 2,633,040 3,146,896 3,756,426 4,212,187
Surplus/(Deficit) 8,287,919 9,125,777 11,145,906 10,936,604 11,163,405 11,163,405 12,204,790 12,835,161 13,660,538
Transfers & subsidies capital NT & PT 598 100 – 50 128 128 600 – –
Transfers & subsidies capital agency,oth – – – – – – – – –
Transfers & subsidies capital in-kind – – – – – – – – –
Surplus/(Deficit) after capital transfers &
contributions
8,288,518 9,125,877 11,145,906 10,936,654 11,163,533 11,163,533 12,205,390 12,835,161 13,660,538
Taxation – – – – – – – – –
Surplus/(Deficit) after taxation 8,288,518 9,125,877 11,145,906 10,936,654 11,163,533 11,163,533 12,205,390 12,835,161 13,660,538
Attributable to minorities – – – – – – – – –
Surplus/(Deficit) attributable to municipality 8,288,518 9,125,877 11,145,906 10,936,654 11,163,533 11,163,533 12,205,390 12,835,161 13,660,538
Share of surplus/ (deficit) of associate – – – – – – – – –
Surplus/(Deficit) for the year 8,288,518 9,125,877 11,145,906 10,936,654 11,163,533 11,163,533 12,205,390 12,835,161 13,660,538
Capital Expenditure 43,231 38,133 23,989 18,036 14,610 14,444 20,549 65,419 35,411
Directorate: Finance
Budgeted Financial Performance (revenue and expenditure)
Current Year 2017/18 2018/19 Medium Term Revenue &
Expenditure Framework

City of Cape Town - 2018/19 Budget (including additional recommendations read in at the Council meeting of 30 May 2018
Page 137
2.12.7 Informal Settlements, Water and Waste Services (Vote 7)
The Constitution stipulates that the City has a responsibility to ensure that its citizens have access
to basic services. Municipal powers and functions are dealt with in Section 156 (Schedules 4B and
5B) of the Constitution. Specific functions are contained in Schedule 4B pertaining to electricity
reticulation, water and sanitation and schedule 5B pertaining to cleansing, refuse removal, refuse
dumps and solid waste disposal.
The Informal Settlements, Water & Waste Services directorate must ensure the provision of
effective and reliable water, sanitation and solid waste management services through effective
management of natural resources and service delivery infrastructure. The provision of electricity
to backyard residences and informal settlements is in collaboration with the City’s Energy
directorate. It is also recognised that a transversal approach is necessary in addressing Informal
Settlements and Backyarders where cross-cutting challenges prevail that touch on issues of
poverty, social, economic, health, policing, engineering and many other functions.
The core purpose of the directorate is:
To ensure sustainable municipal infrastructure and services (water, sanitation and solid waste
management) that will enable economic development;
To provide equitable access to basic services for all the citizens of Cape Town;
Implementation of upgrading projects for informal settlements; and
The provision of basic services to backyarders on Council-owned land as a priority across the
City.
a. Informal Settlements & Backyarders
The Informal Settlements and Backyarders department leads the City’s development of Informal
Settlements and Backyarders by aiming to improve the overall living and upliftment of communities
within the City, with specific focus on improving the livelihood of the poor. In this way, the
department is supporting the National Outcome 8 imperatives and contributing tangibly to the
upliftment of individuals, families and communities across Cape Town.
b. Solid Waste Management
The City’s Solid Waste Management department is the service authority and regulator of waste
management activities in Cape Town, per the system of delegations and the municipality’s
executive powers conferred on it by law. The City is responsible for services in the metropolitan
municipal area (as a service authority or regulator).
c. Water & Sanitation
The core business of the Water and Sanitation department is to equitably and efficiently provide
access to water and sanitation services to all citizens of the City in a sustainable, safe, reliable,
environmentally friendly and financially viable way observing the dictates of sound good
governance principles. The department continually seeks to introduce new and innovative
methods of service delivery to its citizens whilst meeting all the legislative requirements.

City of Cape Town - 2018/19 Budget (including additional recommendations read in at the Council meeting of 30 May 2018
Page 138
2.12.7.1 Informal Settlements & Backyarders department This department is responsible for the mainstreaming of basic service delivery to informal
settlements and backyard dwellers so that there is an improvement in the living conditions of these
communities.
The department’s main purpose and approach towards the upgrading, delivery of basic services
and daily management of informal settlements and backyarders can be summarised as follow:
Strategic management and implementation of upgrading projects for informal settlements thus
working with and not against informality;
Giving priority to the provision of basic services (water and sanitation) to all informal
settlements;
Ensuring a rapid response at scale i.e. ensuring that some level of change and improvement
occurs in all informal settlements within a short to medium period of time;
Multi-pronged and flexible, consisting of a range of different responses which are responsive
to and appropriate for local conditions;
Giving priority to the upgrading and improvement of informal settlements in-situ with
relocations being only undertaken as a last resort;
To direct the implementation of strategic support (operational and functional) to informal
settlements, ensuring meaningful community participation, engagement and local ownership,
preventative measures and monitoring functions relating to all informal settlements;
Implementation of planning -, engineering -, and operational services to informal settlements
and backyards including the facilitation, preventative / monitoring and functional support
functions relating to all Informal Settlements management;
Maximising the use of scarce land by integrating and including informal settlements into the
planning of the City;
Understanding informal settlements in their spatial and socio-economic context;
Ensuring that livelihoods and economic opportunities are afforded priority (protected or
supported); and
Improving access to public transport key social facilities.
The National Housing Code for the Upgrading of Informal Settlements Programme (UISP) is
designed to facilitate the in-situ upgrading of informal settlements in a structured way. It includes
the possible relocation and resettlement of people on a voluntary and co-operative basis, as may
be appropriate.
Most of the existing informal settlements in Cape Town have been in existence for a considerable
number of years and the households living in the informal settlements have made significant
investments (in terms of their low incomes) both in terms of funds into their structures and their
social capital into the community.
Backyard dwellings is a growing phenomenon in the country and is becoming more prominent in
areas such as Du Noon, Doornbach, Joe Slovo in Milnerton, Khayelitsha and numerous state
subsidised housing projects as well as public rental stock. This raises a challenge to provide
adequate services to backyarders and requires infrastructure upgrades in areas unable to cope.

City of Cape Town - 2018/19 Budget (including additional recommendations read in at the Council meeting of 30 May 2018
Page 139
The Backyarder Implementation project provides basic services to backyard dwellers on City rental
properties. It consists of basic services such as water, sanitation, solid waste and electricity.
These properties are owned by the City and can either be freestanding rental units, or flat type
units clustered together in one complex. Backyarders or backyarder families stay in structures at
the back or on the side of these properties.
The initiative of providing basic services to backyard dwellers in City rental units will be rolled out
across the City, where such installations are possible. Further areas for service installation will be
identified. Progress on this programme will be measured against the number of households
benefiting from access to basic services.
The future growth of the population in Cape Town will place continued and increasing strain on
City resources and infrastructure. To this end, the City will focus on households living in informal
settlements.
The City expedites the administrative incorporation of all informal settlements through a process
of rapid assessment. This rapid assessment process provides an overview of the locality, scale
and nature of informal settlements and, in particular, to better understand the priority needs as
well as the site constraints and develop-ability pertaining to different settlements.
The initial categorisation of all informal settlements indicates the appropriate type of
developmental response for each settlement based on a preliminary assessment of site develop-
ability and formalisation potential. This is a normal part of building any project pipeline consisting
of large numbers of projects, each with diverse complexities and particularities.
The outcome then enables strategic prioritisation of informal settlements for different
developmental responses and the allocation of budgets for professional services and capital
expenditure on multi-year expenditure frameworks (MTEF) (associated with further pre-feasibility
and feasibilities studies, design, and implementation / construction e.g. emergency or basic
services, land acquisition, full services, housing.
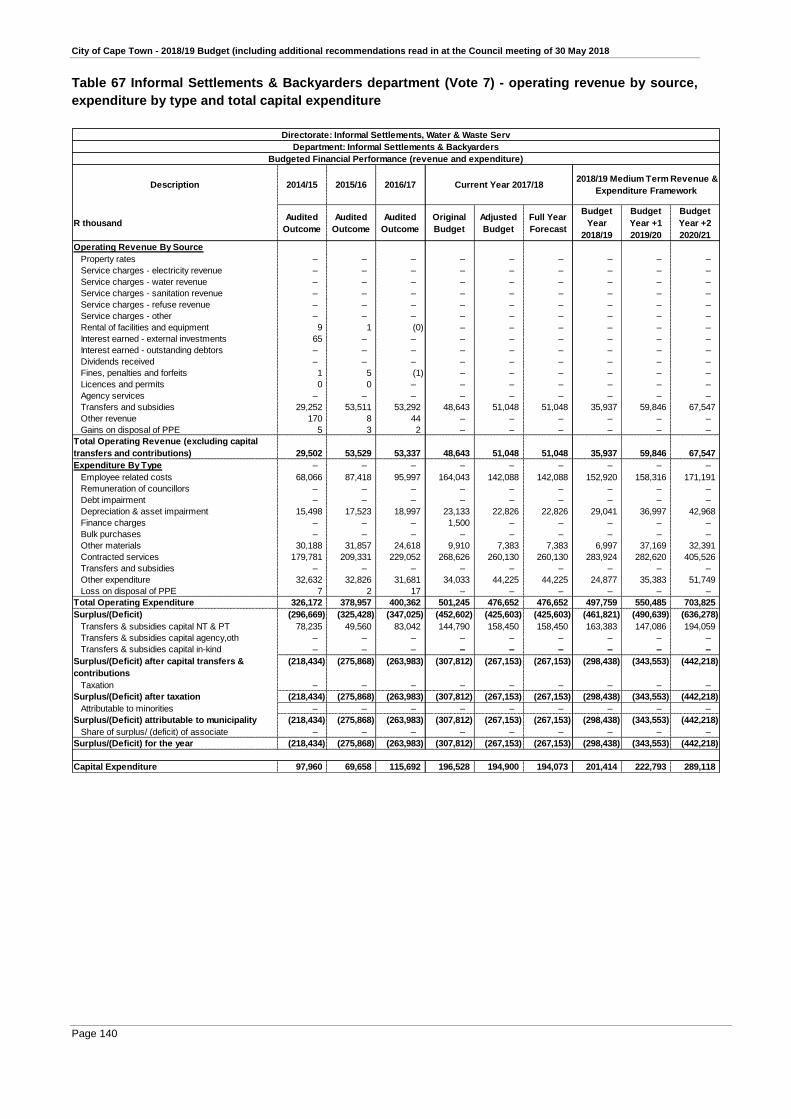
City of Cape Town - 2018/19 Budget (including additional recommendations read in at the Council meeting of 30 May 2018
Page 140
Table 67 Informal Settlements & Backyarders department (Vote 7) - operating revenue by source,
expenditure by type and total capital expenditure
Description 2014/15 2015/16 2016/17
R thousandAudited
Outcome
Audited
Outcome
Audited
Outcome
Original
Budget
Adjusted
Budget
Full Year
Forecast
Budget
Year
2018/19
Budget
Year +1
2019/20
Budget
Year +2
2020/21
Operating Revenue By Source
Property rates – – – – – – – – –
Service charges - electricity revenue – – – – – – – – –
Service charges - water revenue – – – – – – – – –
Service charges - sanitation revenue – – – – – – – – –
Service charges - refuse revenue – – – – – – – – –
Service charges - other – – – – – – – – –
Rental of facilities and equipment 9 1 (0) – – – – – –
Interest earned - external investments 65 – – – – – – – –
Interest earned - outstanding debtors – – – – – – – – –
Dividends received – – – – – – – – –
Fines, penalties and forfeits 1 5 (1) – – – – – –
Licences and permits 0 0 – – – – – – –
Agency services – – – – – – – – –
Transfers and subsidies 29,252 53,511 53,292 48,643 51,048 51,048 35,937 59,846 67,547
Other revenue 170 8 44 – – – – – –
Gains on disposal of PPE 5 3 2 – – – – – –
Total Operating Revenue (excluding capital
transfers and contributions) 29,502 53,529 53,337 48,643 51,048 51,048 35,937 59,846 67,547
Expenditure By Type – – – – – – – – –
Employee related costs 68,066 87,418 95,997 164,043 142,088 142,088 152,920 158,316 171,191
Remuneration of councillors – – – – – – – – –
Debt impairment – – – – – – – – –
Depreciation & asset impairment 15,498 17,523 18,997 23,133 22,826 22,826 29,041 36,997 42,968
Finance charges – – – 1,500 – – – – –
Bulk purchases – – – – – – – – –
Other materials 30,188 31,857 24,618 9,910 7,383 7,383 6,997 37,169 32,391
Contracted services 179,781 209,331 229,052 268,626 260,130 260,130 283,924 282,620 405,526
Transfers and subsidies – – – – – – – – –
Other expenditure 32,632 32,826 31,681 34,033 44,225 44,225 24,877 35,383 51,749
Loss on disposal of PPE 7 2 17 – – – – – –
Total Operating Expenditure 326,172 378,957 400,362 501,245 476,652 476,652 497,759 550,485 703,825
Surplus/(Deficit) (296,669) (325,428) (347,025) (452,602) (425,603) (425,603) (461,821) (490,639) (636,278)
Transfers & subsidies capital NT & PT 78,235 49,560 83,042 144,790 158,450 158,450 163,383 147,086 194,059
Transfers & subsidies capital agency,oth – – – – – – – – –
Transfers & subsidies capital in-kind – – – – – – – – –
Surplus/(Deficit) after capital transfers &
contributions
(218,434) (275,868) (263,983) (307,812) (267,153) (267,153) (298,438) (343,553) (442,218)
Taxation – – – – – – – – –
Surplus/(Deficit) after taxation (218,434) (275,868) (263,983) (307,812) (267,153) (267,153) (298,438) (343,553) (442,218)
Attributable to minorities – – – – – – – – –
Surplus/(Deficit) attributable to municipality (218,434) (275,868) (263,983) (307,812) (267,153) (267,153) (298,438) (343,553) (442,218)
Share of surplus/ (deficit) of associate – – – – – – – – –
Surplus/(Deficit) for the year (218,434) (275,868) (263,983) (307,812) (267,153) (267,153) (298,438) (343,553) (442,218)
Capital Expenditure 97,960 69,658 115,692 196,528 194,900 194,073 201,414 222,793 289,118
Directorate: Informal Settlements, Water & Waste Serv
Department: Informal Settlements & Backyarders
Budgeted Financial Performance (revenue and expenditure)
Current Year 2017/18 2018/19 Medium Term Revenue &
Expenditure Framework

City of Cape Town - 2018/19 Budget (including additional recommendations read in at the Council meeting of 30 May 2018
Page 141
2.12.7.2 Solid Waste Management department
The Integrated Waste Management (IWM) Plan and approved IWM Policy enables the City to
ensure and regulate the provision of waste management services, either through internal or
departmental services, or external service mechanisms, where the City has to act as a service
authority in terms of the Municipal Systems Act, to execute its constitutional mandate. The policy
applies in the Cape Town municipal area, as defined by the Demarcation Board.
The Solid Waste Management (SWM) department is the service authority and regulator of waste
management activities in Cape Town, per the system of delegations and the municipality’s
executive powers conferred on it by law.
The City is responsible for services in the metropolitan municipal area (as a service authority or
regulator) for:
The management and minimisation of waste that will be collected, streamed, diverted,
processed or treated, recycled;
The management of waste that will be disposed of at a licensed, regulated landfill site inside
the City’s boundaries or any other waste management site under its direct control;
All individuals residing or visiting the City, and entities doing business or providing any form of
private, public of community service requiring waste management services;
All service providers operating in the waste management industry;
The management and regulation of all waste that may include liquid or fluid wastes, which are
generated in the municipality, with special provisions for the handling, processing, treatment
and disposal of hazardous waste, as well as waste generated by the health services industry
(including veterinary services);
The regulation of waste crossing the City’s boundaries to ensure proper management,
recycling and control of all types of waste.
Residential waste collection service to formal and informal residence in the municipality;
Public awareness, communication and education on all waste management issues;
Creating and enabling environment for the waste management sector to grow and create job
opportunities;
Management of waste information and reporting to the relevant authority;
Full cost accounting for all waste management services provided by the City and establishment
of tariffs;
Solid waste by-law enforcement and reduction of illegal dumping and improving compliance in
the sector; and
Cleaning of all public open spaces and clean-up of illegal dumping throughout the municipality.
The long-term vision for the City’s waste management services, is to integrate waste management
services in such a way that they are able to not only provide basic services, but to augment
economic activity and minimise the effects of waste on human and environmental health. Much
national support and development is necessary, as waste minimisation and recycling activities are
not limited to Cape Town and involve the processing and manufacturing sectors on a national
scale. It will require a country-wide approach in terms of planning, infrastructure, facilities,
incentives and disincentives to drive out economies of scale that will make this sustainable and
economically viable.

City of Cape Town - 2018/19 Budget (including additional recommendations read in at the Council meeting of 30 May 2018
Page 142
These are key influences in achieving the long term waste management vision and objectives set
by the department. The long-term vision for the Cape Town Waste Management sector is:
to improve access to basic services for residents to as close to 100% as possible within the
constraints of available funds and unplanned growth;
to develop multiple integrated initiatives that will reduce waste and the associated impacts
substantially as well as contribute to and support economic development;
to generate other sources of funding for integrated waste management through Public-Private
Partnerships within the Cape Town municipal area;
to improve the income generated by the City’s waste services;
to optimise the utilisation of the City’s resources and capital; and
to regulate waste and the associated services that will ensure sustainability and prevent impact
or harm to people and the environment.
The basis of funding is determined by the nature and the type of service and related resources,
fleet, plant, equipment or infrastructure and whether a fee can be used to recover the cost of the
service (as determined by the City’s Tariff Schedule).
The following funding groups are provided for the City’s waste management functions in both the
SWM IWM and the SWM tariff policies:
Tariffs
Collection of refuse in formal residential areas and partly businesses.
Waste treatment and disposal, including landfill sites, transfer stations and related waste
handling and waste minimisation infrastructure.
Rates
Cleansing services.
Drop-off facilities.
Waste planning, including waste minimisation.
Support Services (incl. Human resources, administration, Finance & Commercial, Loss
Control, Technical Services and management overheads).
In general, the funding provided for SWM specific integrated waste management aspects are:
Capital costs: Includes, but not limited to land acquisition, infrastructure development, vehicles,
plant & equipment acquisition, new buildings and facilities (i.e. liners for landfills, transfer
stations, drop-off or recycling centres, composting plants etc.); and
Operating costs: Defined as those costs expended by the SWM in managing and implementing
the day-to-day operations required for SWM services rendered by the City. It also includes the
cost of external service providers, consultants and contractors employed by the SWM, the
costs of repairs and maintenance of existing infrastructure, plant and equipment.
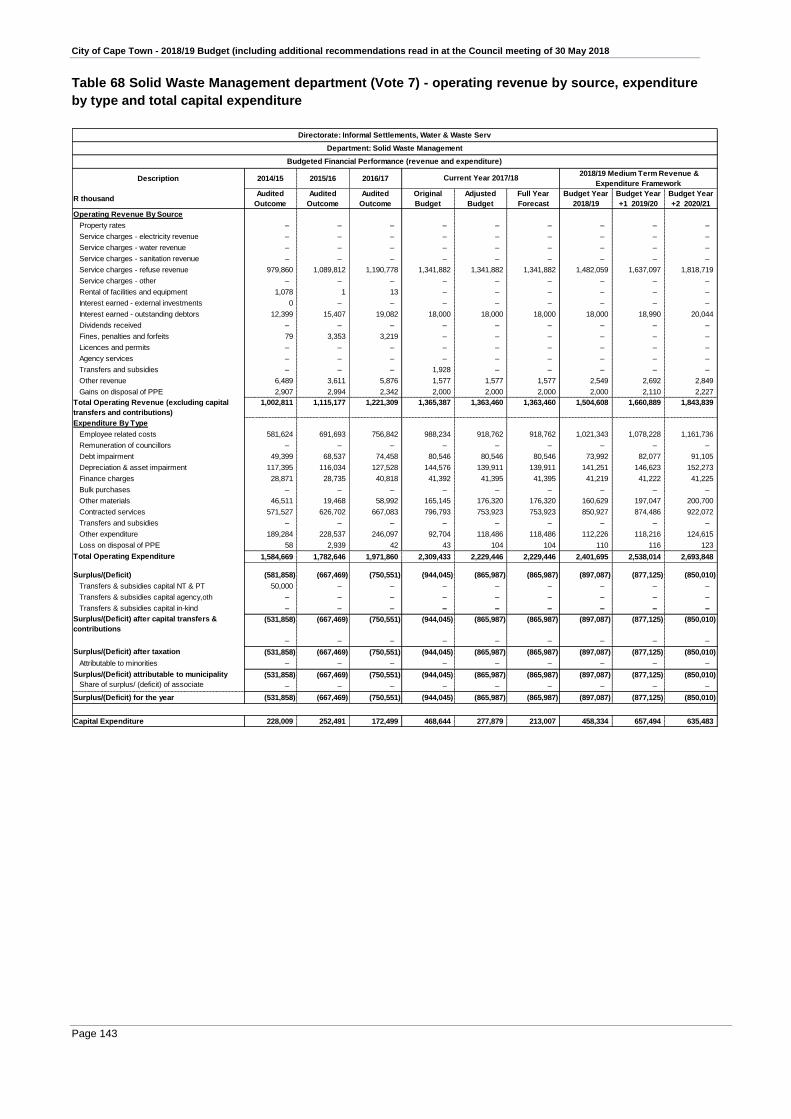
City of Cape Town - 2018/19 Budget (including additional recommendations read in at the Council meeting of 30 May 2018
Page 143
Table 68 Solid Waste Management department (Vote 7) - operating revenue by source, expenditure
by type and total capital expenditure
Description 2014/15 2015/16 2016/17
R thousandAudited
Outcome
Audited
Outcome
Audited
Outcome
Original
Budget
Adjusted
Budget
Full Year
Forecast
Budget Year
2018/19
Budget Year
+1 2019/20
Budget Year
+2 2020/21
Operating Revenue By Source
Property rates – – – – – – – – –
Service charges - electricity revenue – – – – – – – – –
Service charges - water revenue – – – – – – – – –
Service charges - sanitation revenue – – – – – – – – –
Service charges - refuse revenue 979,860 1,089,812 1,190,778 1,341,882 1,341,882 1,341,882 1,482,059 1,637,097 1,818,719
Service charges - other – – – – – – – – –
Rental of facilities and equipment 1,078 1 13 – – – – – –
Interest earned - external investments 0 – – – – – – – –
Interest earned - outstanding debtors 12,399 15,407 19,082 18,000 18,000 18,000 18,000 18,990 20,044
Dividends received – – – – – – – – –
Fines, penalties and forfeits 79 3,353 3,219 – – – – – –
Licences and permits – – – – – – – – –
Agency services – – – – – – – – –
Transfers and subsidies – – – 1,928 – – – – –
Other revenue 6,489 3,611 5,876 1,577 1,577 1,577 2,549 2,692 2,849
Gains on disposal of PPE 2,907 2,994 2,342 2,000 2,000 2,000 2,000 2,110 2,227
Total Operating Revenue (excluding capital
transfers and contributions)
1,002,811 1,115,177 1,221,309 1,365,387 1,363,460 1,363,460 1,504,608 1,660,889 1,843,839
Expenditure By Type
Employee related costs 581,624 691,693 756,842 988,234 918,762 918,762 1,021,343 1,078,228 1,161,736
Remuneration of councillors – – – – – – – – –
Debt impairment 49,399 68,537 74,458 80,546 80,546 80,546 73,992 82,077 91,105
Depreciation & asset impairment 117,395 116,034 127,528 144,576 139,911 139,911 141,251 146,623 152,273
Finance charges 28,871 28,735 40,818 41,392 41,395 41,395 41,219 41,222 41,225
Bulk purchases – – – – – – – – –
Other materials 46,511 19,468 58,992 165,145 176,320 176,320 160,629 197,047 200,700
Contracted services 571,527 626,702 667,083 796,793 753,923 753,923 850,927 874,486 922,072
Transfers and subsidies – – – – – – – – –
Other expenditure 189,284 228,537 246,097 92,704 118,486 118,486 112,226 118,216 124,615
Loss on disposal of PPE 58 2,939 42 43 104 104 110 116 123
Total Operating Expenditure 1,584,669 1,782,646 1,971,860 2,309,433 2,229,446 2,229,446 2,401,695 2,538,014 2,693,848
Surplus/(Deficit) (581,858) (667,469) (750,551) (944,045) (865,987) (865,987) (897,087) (877,125) (850,010)
Transfers & subsidies capital NT & PT 50,000 – – – – – – – –
Transfers & subsidies capital agency,oth – – – – – – – – –
Transfers & subsidies capital in-kind – – – – – – – – –
Surplus/(Deficit) after capital transfers &
contributions
(531,858) (667,469) (750,551) (944,045) (865,987) (865,987) (897,087) (877,125) (850,010)
– – – – – – – – –
Surplus/(Deficit) after taxation (531,858) (667,469) (750,551) (944,045) (865,987) (865,987) (897,087) (877,125) (850,010)
Attributable to minorities – – – – – – – – –
Surplus/(Deficit) attributable to municipality (531,858) (667,469) (750,551) (944,045) (865,987) (865,987) (897,087) (877,125) (850,010)
Share of surplus/ (deficit) of associate – – – – – – – – –
Surplus/(Deficit) for the year (531,858) (667,469) (750,551) (944,045) (865,987) (865,987) (897,087) (877,125) (850,010)
Capital Expenditure 228,009 252,491 172,499 468,644 277,879 213,007 458,334 657,494 635,483
Directorate: Informal Settlements, Water & Waste Serv
Department: Solid Waste Management
Budgeted Financial Performance (revenue and expenditure)
Current Year 2017/18 2018/19 Medium Term Revenue &
Expenditure Framework

City of Cape Town - 2018/19 Budget (including additional recommendations read in at the Council meeting of 30 May 2018
Page 144
2.12.7.3 Water & Sanitation department The Water & Sanitation department continues to make significant progress in providing water and
sanitation services to the City’s residents since the formation of the one metro administration. All
formal areas are adequately provided for with water and sanitation services while services within
informal settlement areas are continually being improved. The principal challenge for the
department is to maintain an existing water and sanitation service for the City while also providing
services for an ever-increasing number of households in a sustainable way during the Level 6
water restrictions.
To ensure sustainable, fair, equitable, reliable and financially viable provision of water and
sanitation services, the department has developed and is implementing strategies that address
priorities to ensure effective water services management. The strategies also seek to ensure
compliance with the National Water Act, Water Services Act and the related regulations, National
and City policies.
The ongoing drought in the Western Cape has given rise to a number of initiatives focused on
averting a crisis in the short term but also incrementally diversifying water sources away from the
reliance on surface water. The diverse water sources will be made of ground water which will be
a major thrust, wastewater reuse and to a lesser extent desalination. Recovery from the drought
and improved dam levels is expected to take a minimum of three years.
To reduce pressure on the system a number of demand management interventions is underway,
which includes aggressive pressure management, leak detection on public and private water
infrastructure, rapid installation of water demand management devices and the use of treated
effluent. All these interventions will receive substantially more funding over the next 3 years.
The development of expertise to manage the City’s infrastructure under drought has also been
part of the program. The drought has required the department to redirect many of its resources to
managing the impact of the drought with major thrust on diversifying the City’s water resource
base.
The following business improvements initiatives are receiving focused attention:
The Informal Settlements & Backyarders department will enable improvement of the level of
basic service (water and sanitation) to ensure adherence to the City’s Basic Service Level
Targets to households.
Alternative waterless technologies will need to urgently be explored due to the current drought
imperative;
Internal staff with experience and expertise in the development and maintenance of alternative
sanitation technologies are needed. This is to further develop fast track service delivery and
to sustain technology lifecycle maintenance.
The increased amount of people needing to be in the indigent bracket, due to the high rate of
urbanisation coupled with the ageing infrastructure, which will put stress on the tariffs and
subsidies.
Asset performance and monitoring systems in order to improve asset operations, and thereby
asset performance, where the use of technology is being investigated as a facilitation tool.
City of Cape Town - 2018/19 Budget (including additional recommendations read in at the Council meeting of 30 May 2018
Page 145
A service provider was employed to assist the department in developing line managers to be
coaches who will support shift workers to cope with a changing environment.
A communication protocol, which addresses the communication needs with both internal and
external customers, has been developed and it is currently in the implementation stage.
Scientific Services has developed productivity standards for the Sampling Laboratory and it is
the objective of the Business Development section to determine productivity standards across
the entire department.
The department conforms to the City’s financial budgeting process, which forms part of the IDP
and bases its budget formulation on some key strategic plans.
Capital budget
The high requirement for necessary infrastructure is driven largely by capacity requirements
resulting from growth and economic development, the refurbishment of current infrastructure as
well as projects relating to system efficiency, which places severe pressure on the City’s capital
budget.
The capital budget had to be reprioritised with the focus on diversifying the City’s water resources,
due to the drought measures being implemented in the City.
The capital budget for the 2018/19 financial year includes the Catchment and Stormwater branch
as they form part of the Water & Sanitation department.
To achieve the required capital budget, it is necessary to maximise the use of grant funding and
to make optimal use of the Capital Replacement Reserve (CRR) within the financial constraints.
Operating budget
It is difficult to reach optimum levels of staff, maintain acceptable levels of infrastructure
maintenance and carry the impact of the capital programme within the financial constraints during
difficult economic conditions.
The pressure on the operating budget needs to be addressed via possible above-inflation tariff
increases and initiatives to ensure that money due to the City is collected. There is a benefit
envisaged from the current debt action and projects related to metering efficiency gains and data
purification.
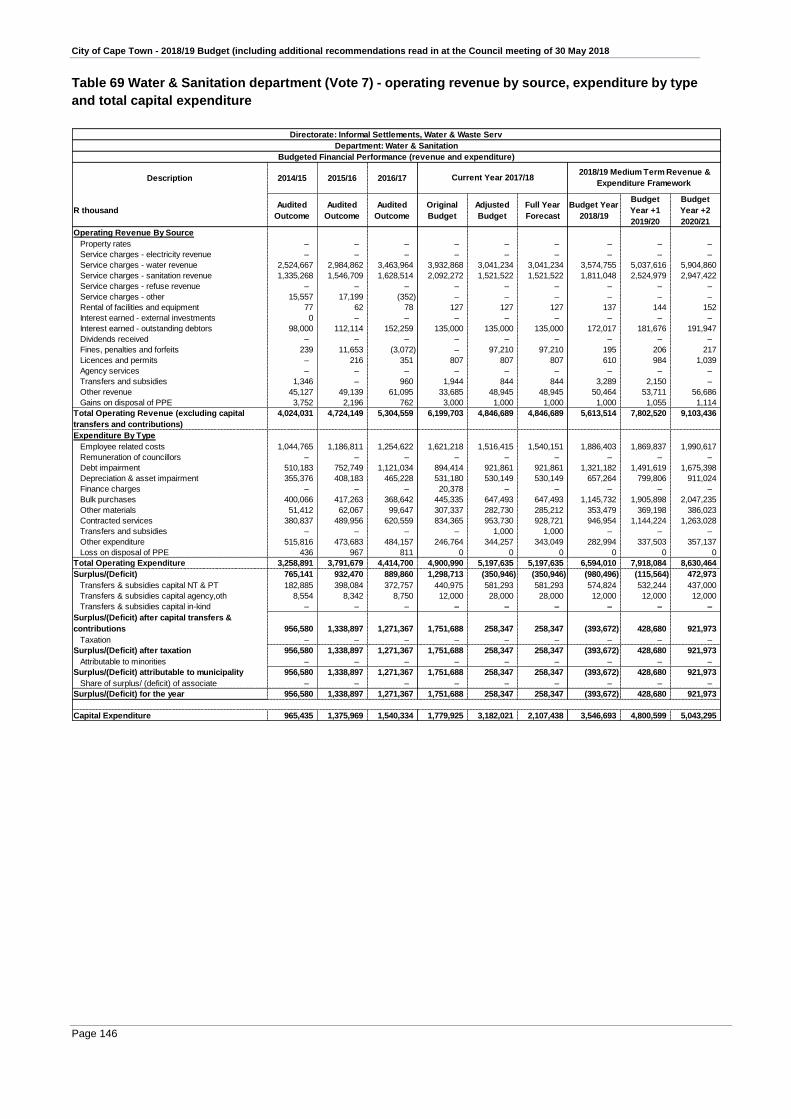
City of Cape Town - 2018/19 Budget (including additional recommendations read in at the Council meeting of 30 May 2018
Page 146
Table 69 Water & Sanitation department (Vote 7) - operating revenue by source, expenditure by type
and total capital expenditure
Description 2014/15 2015/16 2016/17
R thousandAudited
Outcome
Audited
Outcome
Audited
Outcome
Original
Budget
Adjusted
Budget
Full Year
Forecast
Budget Year
2018/19
Budget
Year +1
2019/20
Budget
Year +2
2020/21
Operating Revenue By Source
Property rates – – – – – – – – –
Service charges - electricity revenue – – – – – – – – –
Service charges - water revenue 2,524,667 2,984,862 3,463,964 3,932,868 3,041,234 3,041,234 3,574,755 5,037,616 5,904,860
Service charges - sanitation revenue 1,335,268 1,546,709 1,628,514 2,092,272 1,521,522 1,521,522 1,811,048 2,524,979 2,947,422
Service charges - refuse revenue – – – – – – – – –
Service charges - other 15,557 17,199 (352) – – – – – –
Rental of facilities and equipment 77 62 78 127 127 127 137 144 152
Interest earned - external investments 0 – – – – – – – –
Interest earned - outstanding debtors 98,000 112,114 152,259 135,000 135,000 135,000 172,017 181,676 191,947
Dividends received – – – – – – – – –
Fines, penalties and forfeits 239 11,653 (3,072) – 97,210 97,210 195 206 217
Licences and permits – 216 351 807 807 807 610 984 1,039
Agency services – – – – – – – – –
Transfers and subsidies 1,346 – 960 1,944 844 844 3,289 2,150 –
Other revenue 45,127 49,139 61,095 33,685 48,945 48,945 50,464 53,711 56,686
Gains on disposal of PPE 3,752 2,196 762 3,000 1,000 1,000 1,000 1,055 1,114
Total Operating Revenue (excluding capital
transfers and contributions)
4,024,031 4,724,149 5,304,559 6,199,703 4,846,689 4,846,689 5,613,514 7,802,520 9,103,436
Expenditure By Type
Employee related costs 1,044,765 1,186,811 1,254,622 1,621,218 1,516,415 1,540,151 1,886,403 1,869,837 1,990,617
Remuneration of councillors – – – – – – – – –
Debt impairment 510,183 752,749 1,121,034 894,414 921,861 921,861 1,321,182 1,491,619 1,675,398
Depreciation & asset impairment 355,376 408,183 465,228 531,180 530,149 530,149 657,264 799,806 911,024
Finance charges – – – 20,378 – – – – –
Bulk purchases 400,066 417,263 368,642 445,335 647,493 647,493 1,145,732 1,905,898 2,047,235
Other materials 51,412 62,067 99,647 307,337 282,730 285,212 353,479 369,198 386,023
Contracted services 380,837 489,956 620,559 834,365 953,730 928,721 946,954 1,144,224 1,263,028
Transfers and subsidies – – – – 1,000 1,000 – – –
Other expenditure 515,816 473,683 484,157 246,764 344,257 343,049 282,994 337,503 357,137
Loss on disposal of PPE 436 967 811 0 0 0 0 0 0
Total Operating Expenditure 3,258,891 3,791,679 4,414,700 4,900,990 5,197,635 5,197,635 6,594,010 7,918,084 8,630,464
Surplus/(Deficit) 765,141 932,470 889,860 1,298,713 (350,946) (350,946) (980,496) (115,564) 472,973
Transfers & subsidies capital NT & PT 182,885 398,084 372,757 440,975 581,293 581,293 574,824 532,244 437,000
Transfers & subsidies capital agency,oth 8,554 8,342 8,750 12,000 28,000 28,000 12,000 12,000 12,000
Transfers & subsidies capital in-kind – – – – – – – – –
Surplus/(Deficit) after capital transfers &
contributions 956,580 1,338,897 1,271,367 1,751,688 258,347 258,347 (393,672) 428,680 921,973
Taxation – – – – – – – – –
Surplus/(Deficit) after taxation 956,580 1,338,897 1,271,367 1,751,688 258,347 258,347 (393,672) 428,680 921,973
Attributable to minorities – – – – – – – – –
Surplus/(Deficit) attributable to municipality 956,580 1,338,897 1,271,367 1,751,688 258,347 258,347 (393,672) 428,680 921,973
Share of surplus/ (deficit) of associate – – – – – – – – –
Surplus/(Deficit) for the year 956,580 1,338,897 1,271,367 1,751,688 258,347 258,347 (393,672) 428,680 921,973
Capital Expenditure 965,435 1,375,969 1,540,334 1,779,925 3,182,021 2,107,438 3,546,693 4,800,599 5,043,295
Directorate: Informal Settlements, Water & Waste Serv
Department: Water & Sanitation
Budgeted Financial Performance (revenue and expenditure)
Current Year 2017/18 2018/19 Medium Term Revenue &
Expenditure Framework
City of Cape Town - 2018/19 Budget (including additional recommendations read in at the Council meeting of 30 May 2018
Page 147
2.12.8 Safety & Security (Vote 8)
The directorate consist of six functional departments i.e. Metropolitan Police Services; Law
Enforcement, Traffic Services and Coordination; 107 Public Emergency Communication Centre;
Fire and Rescue Services; Disaster Risk Management Centre and Events Department. The
Safety & Security directorate is committed to ensuring a safe and secure environment for all its
residents, by combating crime and disorder, reducing vehicle speed and accidents on our roads,
improving response time to emergency fire calls, reducing disaster risks in all communities within
the City and supporting community events in order to create opportunities for communities and
build social cohesion.
Metropolitan Police Services
The Metro Police Services department was established in terms of the South African Police
Service Act. Its mandate is the enforcement of traffic laws, enforcement of bylaws and crime
prevention. Its current operations include clamping down on drug- and alcohol-related
offences and addressing gang-related violence. To this end, the Gang and Drug Task Force
was established, resulting in significant operational successes. Other major initiatives include
the expansion of the department’s Neighbourhood Safety Teams in order to bring policing
closer to the people of the City; the establishment of an integrated information management
system (Project EPIC) and the rollout of the shot spotter programme to other areas within the
City. Major projects include the increase in CCTV installations areas within the City based on
the City’s CCTV master plan, CCTV installations in various wards across the City, replacement
of vehicles, the procurement of additional firearms and related equipment.
Law Enforcement, Traffic and Coordination
This department consist of Law Enforcement Services, Traffic Services and Special
Investigation Unit.
Law Enforcement Services
The department is responsible for the enforcement of bylaws and regulations in terms of the
Criminal Procedures Act. This includes general bylaw enforcement in residential areas and
resorts as well as specialised enforcement through various units. These units are responsible
in dealing with copper theft, informal trading, displaced people, land invasion, liquor control,
problem buildings and security at Council rental housing stock. The department plays a major
role in beach management over festive seasons as well as other public events and actively
supports other directorates in land invasion actions. Major projects include purchasing of
specialised equipment for the combating of land invasions, strike actions and reducing anti-
social behaviour and illegal activities within the City’s rental housing areas, building
improvements to very old buildings and replacement of vehicles.
Traffic Services
The department was established in terms of the National Road Traffic Act. It consists of two
sections; the Operations and the Licensing Sections. The Operations Section deals with
specialised and general activities, the enforcement on roads, while the Licensing Section deals
with all learner- and driver licence testing, card conversions and renewals, as well as managing
the traffic court division and the public/private partnership agreement on traffic cameras.

City of Cape Town - 2018/19 Budget (including additional recommendations read in at the Council meeting of 30 May 2018
Page 148
Major projects include replacement of vehicles, purchasing of specialised vehicles to assist
during protest actions and strikes, improvements to various traffic and licensing centres and
the acquisition of various traffic licensing equipment and radios.
Special Investigation Unit
The function of this unit is to provide investigation support to the directorate and the City in
areas such as, fraud and corruption, misconduct by City employees, malicious damage to
Council property, hijacking and theft of council vehicles, protest actions, land invasions, service
delivery strikes, gang-related violence and anti-social behaviour within communities.
107 Public Communication Emergency Call Centre
The City has a single emergency number (107) to a call-taking and dispatching centre, which
directs all calls to appropriate institutions and agencies. The centre is manned by well-trained
quality-controlled operators. Key focus programmes include education and public awareness
campaigns at schools, old-age homes, frail-care facilities and shopping centres. Major projects
include the installation of and upgrade of communication equipment and systems.
Fire and Rescue Services
The Fire and Rescue Services was established in terms of the Fire Brigade Services Act. The
department has 30 fire stations operating on a 24-hour basis. Its core functions include
responding to fires and emergencies as well as medical emergencies. The major programmes
include educational programmes, raising awareness around fires, life safety on building,
structures and events. Major projects include the construction of Masiphumelele and Lwandle
Fire Stations, the replacement of fire vehicles, the replacement of fire-fighting, medical,
communication and hazmat equipment.
Disaster Risk Management Centre
The core function of this department is to prevent and mitigate the effect of disasters. To this
end, the department aims to identify, prevent and reduce the occurrence of disasters. The
department has a well-established volunteer corps, who plays a key role in event safety, co-
ordination of corporate safety initiatives, festive season planning, winter preparedness
planning, unrest, and service delivery protest. Key projects include the upgrading of various
Disaster Management centres, replacement of IT equipment and procurement of vehicles for
volunteers.
Events Department
The function of this department includes the support of community events in order to create
economic opportunities and to build social cohesion. The department seeks to establish Cape
Town through improved strategic management, logistical coordination and support as the top
events destination locally and regionally, and a premier events destination globally. Mayor
projects include the e-Permitting system, which will allow applications to be made online as
well as the Online Event Calendar project.

City of Cape Town - 2018/19 Budget (including additional recommendations read in at the Council meeting of 30 May 2018
Page 149
Significant capital projects for the 2018/19 MTREF
Implementation of phase 2 of the Integrated Emergency Contact Centre (EPIC);
Upgrading and improving the driving and licencing testing centres;
Installation and upgrading of CCTV cameras in various areas within the City, including the
MURP areas and wards;
Implementation of Phase 2 of the construction of Lwandle and Masiphumelele fire stations;
Implementation of Phase 2 of the e-Permitting and Online Event Calendar systems;
Replacement and acquisition of additional vehicles;
Replacement and acquisition of additional radios and equipment;
Expansion of shot spotter installation in various areas within the City; and
Acquisition of firearms and related equipment.
Table 70 Safety & Security (Vote 8) - operating revenue by source, expenditure by type and total
capital expenditure
Description 2014/15 2015/16 2016/17
R thousandAudited
Outcome
Audited
Outcome
Audited
Outcome
Original
Budget
Adjusted
Budget
Full Year
Forecast
Budget
Year
2018/19
Budget
Year +1
2019/20
Budget
Year +2
2020/21
Operating Revenue By Source
Property rates – – – – – – – – –
Service charges - electricity revenue – – – – – – – – –
Service charges - water revenue – – – – – – – – –
Service charges - sanitation revenue – – – – – – – – –
Service charges - refuse revenue – – – – – – – – –
Service charges - other (7) 4 187 – – – – – –
Rental of facilities and equipment 418 376 583 268 268 268 283 298 315
Interest earned - external investments 0 – – – – – – – –
Interest earned - outstanding debtors 1,044 1,255 1,716 1,130 1,130 1,130 1,192 1,258 1,327
Dividends received – – – – – – – – –
Fines, penalties and forfeits 997,658 1,098,967 1,251,561 1,140,262 1,140,262 1,140,262 1,273,476 1,343,518 1,418,083
Licences and permits 40,144 37,161 38,287 29,962 29,962 29,962 31,060 32,769 34,587
Agency services 12,513 11,838 12,942 11,620 11,620 11,620 12,259 12,933 13,651
Transfers and subsidies 37,594 40,867 46,373 47,931 58,971 58,971 27,678 20,054 9,265
Other revenue 20,584 23,825 22,819 11,754 11,754 11,754 12,950 13,663 14,421
Gains on disposal of PPE 145 54 124 – – – – – –
Total Operating Revenue (excluding capital
transfers and contributions)
1,110,094 1,214,347 1,374,591 1,242,927 1,253,967 1,253,967 1,358,899 1,424,492 1,491,649
Expenditure By Type
Employee related costs 1,375,142 1,474,879 1,595,384 1,832,594 1,811,760 1,813,403 1,924,938 2,058,158 2,212,140
Remuneration of councillors – – – – – – – – –
Debt impairment 605,795 764,300 828,823 854,602 854,602 854,602 936,732 1,030,453 1,087,643
Depreciation & asset impairment 33,861 42,416 52,659 66,630 70,397 70,397 88,931 99,063 96,860
Finance charges – – – 4,999 – – – – –
Bulk purchases – – – – – – – – –
Other materials 5,246 4,254 11,547 79,814 62,656 63,765 56,027 56,467 55,963
Contracted services 46,879 51,381 52,324 105,757 84,415 82,927 103,655 109,201 115,117
Transfers and subsidies 36,333 54,423 33,902 38,805 34,408 35,081 42,015 44,326 46,786
Other expenditure 220,280 275,921 264,212 165,276 154,990 153,054 164,385 172,439 181,857
Loss on disposal of PPE 432 199 258 34 45 45 47 50 52
Total Operating Expenditure 2,323,967 2,667,773 2,839,108 3,148,512 3,073,273 3,073,273 3,316,731 3,570,156 3,796,417
Surplus/(Deficit) (1,213,873) (1,453,426) (1,464,517) (1,905,585) (1,819,306) (1,819,306) (1,957,832) (2,145,664) (2,304,769)
Transfers & subsidies capital NT & PT 13,910 22,394 27,630 24,700 25,660 25,660 – – –
Transfers & subsidies capital agency,oth – – – – 146 146 – – –
Transfers & subsidies capital in-kind 35 – 306 – – – – – –
Surplus/(Deficit) after capital transfers &
contributions
(1,199,928) (1,431,032) (1,436,581) (1,880,885) (1,793,500) (1,793,500) (1,957,832) (2,145,664) (2,304,769)
Taxation – – – – – – – – –
Surplus/(Deficit) after taxation (1,199,928) (1,431,032) (1,436,581) (1,880,885) (1,793,500) (1,793,500) (1,957,832) (2,145,664) (2,304,769)
Attributable to minorities – – – – – – – – –
Surplus/(Deficit) attributable to municipality (1,199,928) (1,431,032) (1,436,581) (1,880,885) (1,793,500) (1,793,500) (1,957,832) (2,145,664) (2,304,769)
Share of surplus/ (deficit) of associate – – – – – – – – –
Surplus/(Deficit) for the year (1,199,928) (1,431,032) (1,436,581) (1,880,885) (1,793,500) (1,793,500) (1,957,832) (2,145,664) (2,304,769)
Capital Expenditure 83,097 152,051 114,835 191,120 160,128 160,040 196,078 79,515 42,115
Directorate: Safety & Security
Budgeted Financial Performance (revenue and expenditure)
Current Year 2017/18 2018/19 Medium Term Revenue &
Expenditure Framework

City of Cape Town - 2018/19 Budget (including additional recommendations read in at the Council meeting of 30 May 2018
Page 150
2.12.9 Social Services (Vote 9)
Social Services continues to provide community facilities, spaces and services, as well as
developmental programmes in support of building communities and individuals’ capabilities
towards improved social well-being of all the citizens of Cape Town. In so doing, the directorate
directly supports “The Opportunity City”, “The Caring City” and “The Inclusive City”, as well as
contributes to “The Safe City” and “The Well-Run City”.
The directorate is the lead coordinator of the Social Development Strategy (SDS) and as such
ensures coordination of same across all directorates. As the key driver of the City’s Expanded
Public Works Programme (EPWP), the directorate is a contributor towards giving life to the
Economic Growth Strategy (EGS).
Service delivery is achieved through six line departments within the directorate, namely:
City Health;
Library and Information Services;
Recreation and Parks;
Social Development and Early Childhood Development;
Expanded Public Works Programme; and
Planning, Development and Project Management Office.
Within the Transversal Safe Communities Working Group, Social Services drives the following
Transversal Work Streams through its Social Development & Early Childhood Development
department:
Integrated Youth Development Strategy with its implementation Plan;
Social & Situational Crime Prevention Strategy with its implementation Plan; and
Alcohol & Other Drug Harm Minimisation Strategy with its implementation Plan.
Through the directorate’s departments, the broad social challenges and needs are addressed by
providing and maintaining a holistic and integrated range of mandated social facilities, services
and developmental programmes and functions, including, but not limited to the following:
Delivering a Comprehensive Primary Health Care Service, including Personal and Specialised
Primary Health Care (commonly referred to as clinic services) as well as Municipal Health Care
(also referred to as Environmental Health Services);
Providing access to the services and resources required for informational, educational, cultural
and recreational needs through a free public library service that includes spaces and
programmes for social development;
Providing attractive, safe, accessible and sustainable social facilities and spaces where the
citizens of Cape Town can engage in active and passive recreation;
Providing cemeteries and crematoria, which are an integral part of a dignified and efficient
interment service;
Horticultural services at City facilities;
Community engagements and social preparation;
Providing a number of targeted social services programmes focusing on substance abuse,
homelessness, youth development, early childhood development, poverty alleviation and
vulnerable groups;
Developing, implementing and maintaining community orientated arts, culture and heritage
programmes, services, infrastructure and partnerships; and

City of Cape Town - 2018/19 Budget (including additional recommendations read in at the Council meeting of 30 May 2018
Page 151
Providing new Social Service facilities that are planned and developed in a joint, integrated,
clustered and multifunctional manner in areas that maximise community use, ownership and
pride. Protective measures are also put in place to ensure that these facilities are safe and
secure.
The core capital function is to provide social facilities (Libraries, ECD’s, clinics, recreational
facilities, etc.) linked to the Caring City Strategic Focus Area (SFA) with the Excellence in Basic
Service delivery objective and Social Services facility provision programme. Significant capital
projects to be undertaken over the MTREF include, but are not limited to:
IT Modernisation: Sports Field & Swimming Pool SAP Booking System; Library Halls/Meeting
Room SAP Booking System; X-Ray System; Integrated Facility Booking Mobile Field Services
App;
New Pelican Park and Fisantekraal Clinics;
Manenberg Integrated Project;
Sport and Recreation Facilities Upgrade (which will be prioritised as per the City’s New Water
Plan) as well as major upgrade requirements identified;
Du Noon Library Construction;
Construction of New Zakhele Clinic; and
Vaalfontein Cemetery Development.
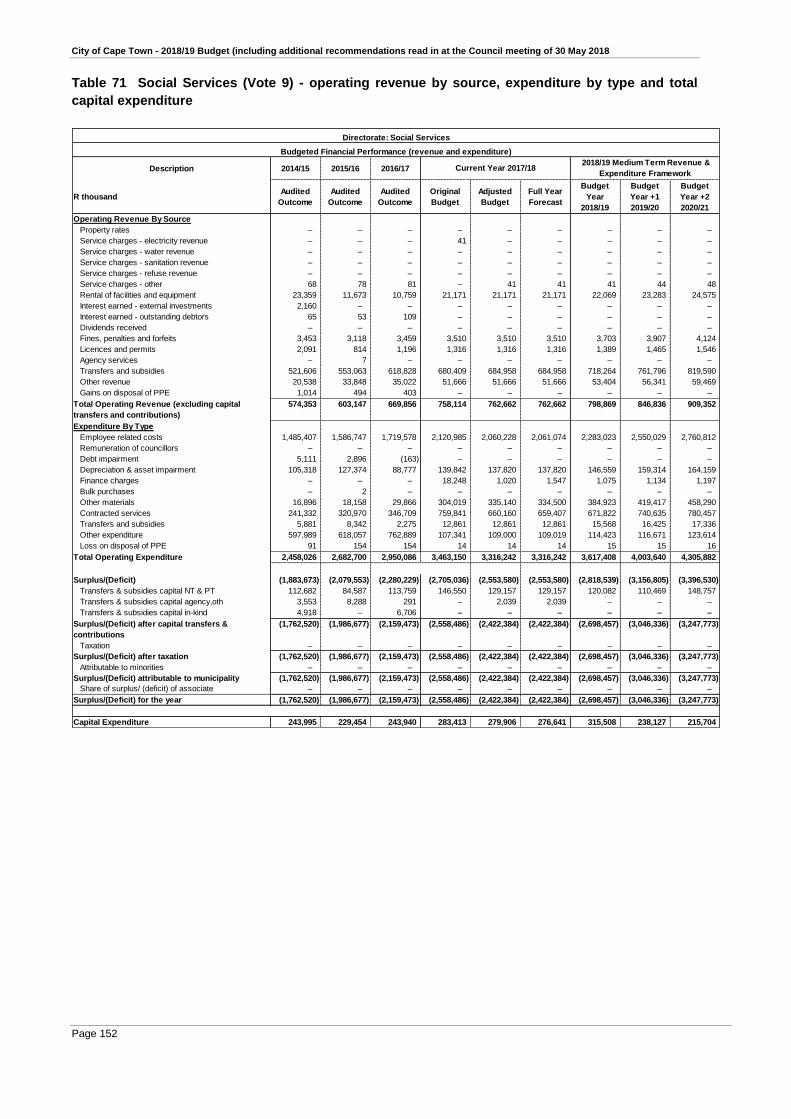
City of Cape Town - 2018/19 Budget (including additional recommendations read in at the Council meeting of 30 May 2018
Page 152
Table 71 Social Services (Vote 9) - operating revenue by source, expenditure by type and total
capital expenditure
Description 2014/15 2015/16 2016/17
R thousandAudited
Outcome
Audited
Outcome
Audited
Outcome
Original
Budget
Adjusted
Budget
Full Year
Forecast
Budget
Year
2018/19
Budget
Year +1
2019/20
Budget
Year +2
2020/21
Operating Revenue By Source
Property rates – – – – – – – – –
Service charges - electricity revenue – – – 41 – – – – –
Service charges - water revenue – – – – – – – – –
Service charges - sanitation revenue – – – – – – – – –
Service charges - refuse revenue – – – – – – – – –
Service charges - other 68 78 81 – 41 41 41 44 48
Rental of facilities and equipment 23,359 11,673 10,759 21,171 21,171 21,171 22,069 23,283 24,575
Interest earned - external investments 2,160 – – – – – – – –
Interest earned - outstanding debtors 65 53 109 – – – – – –
Dividends received – – – – – – – – –
Fines, penalties and forfeits 3,453 3,118 3,459 3,510 3,510 3,510 3,703 3,907 4,124
Licences and permits 2,091 814 1,196 1,316 1,316 1,316 1,389 1,465 1,546
Agency services – 7 – – – – – – –
Transfers and subsidies 521,606 553,063 618,828 680,409 684,958 684,958 718,264 761,796 819,590
Other revenue 20,538 33,848 35,022 51,666 51,666 51,666 53,404 56,341 59,469
Gains on disposal of PPE 1,014 494 403 – – – – – –
Total Operating Revenue (excluding capital
transfers and contributions)
574,353 603,147 669,856 758,114 762,662 762,662 798,869 846,836 909,352
Expenditure By Type
Employee related costs 1,485,407 1,586,747 1,719,578 2,120,985 2,060,228 2,061,074 2,283,023 2,550,029 2,760,812
Remuneration of councillors – – – – – – – – –
Debt impairment 5,111 2,896 (163) – – – – – –
Depreciation & asset impairment 105,318 127,374 88,777 139,842 137,820 137,820 146,559 159,314 164,159
Finance charges – – – 18,248 1,020 1,547 1,075 1,134 1,197
Bulk purchases – 2 – – – – – – –
Other materials 16,896 18,158 29,866 304,019 335,140 334,500 384,923 419,417 458,290
Contracted services 241,332 320,970 346,709 759,841 660,160 659,407 671,822 740,635 780,457
Transfers and subsidies 5,881 8,342 2,275 12,861 12,861 12,861 15,568 16,425 17,336
Other expenditure 597,989 618,057 762,889 107,341 109,000 109,019 114,423 116,671 123,614
Loss on disposal of PPE 91 154 154 14 14 14 15 15 16
Total Operating Expenditure 2,458,026 2,682,700 2,950,086 3,463,150 3,316,242 3,316,242 3,617,408 4,003,640 4,305,882
Surplus/(Deficit) (1,883,673) (2,079,553) (2,280,229) (2,705,036) (2,553,580) (2,553,580) (2,818,539) (3,156,805) (3,396,530)
Transfers & subsidies capital NT & PT 112,682 84,587 113,759 146,550 129,157 129,157 120,082 110,469 148,757
Transfers & subsidies capital agency,oth 3,553 8,288 291 – 2,039 2,039 – – –
Transfers & subsidies capital in-kind 4,918 – 6,706 – – – – – –
Surplus/(Deficit) after capital transfers &
contributions
(1,762,520) (1,986,677) (2,159,473) (2,558,486) (2,422,384) (2,422,384) (2,698,457) (3,046,336) (3,247,773)
Taxation – – – – – – – – –
Surplus/(Deficit) after taxation (1,762,520) (1,986,677) (2,159,473) (2,558,486) (2,422,384) (2,422,384) (2,698,457) (3,046,336) (3,247,773)
Attributable to minorities – – – – – – – – –
Surplus/(Deficit) attributable to municipality (1,762,520) (1,986,677) (2,159,473) (2,558,486) (2,422,384) (2,422,384) (2,698,457) (3,046,336) (3,247,773)
Share of surplus/ (deficit) of associate – – – – – – – – –
Surplus/(Deficit) for the year (1,762,520) (1,986,677) (2,159,473) (2,558,486) (2,422,384) (2,422,384) (2,698,457) (3,046,336) (3,247,773)
Capital Expenditure 243,995 229,454 243,940 283,413 279,906 276,641 315,508 238,127 215,704
Directorate: Social Services
Budgeted Financial Performance (revenue and expenditure)
Current Year 2017/18 2018/19 Medium Term Revenue &
Expenditure Framework

City of Cape Town - 2018/19 Budget (including additional recommendations read in at the Council meeting of 30 May 2018
Page 153
2.12.10 Strategic Governance (Vote 10)
Table 72 Strategic Governance (Vote 10) - operating revenue by source, expenditure by type and
total capital expenditure
VOTE (DIRECTORATE) AMALGAMATED WITH CORPORATE SERVICES (VOTE 4) AND
CHANGES EFFECTED ON MBRR SCHEDULE A AFTER COUNCIL APPROVAL AS PER THE
RECOMMENDATION BELOW.
Amendment to budget tables to include organisational structure change serving before Council - Finance It is recommended that:
(a) Subject to Council’s consideration and subsequent approval of item C 22/05/18
dealing with the ALMALGAMATION OF THE VACANT EXECUTIVE
DIRECTOR: CORPORATE SERVICES AND EXECUTIVE DIRECTOR:
STRATEGIC GOVERNANCE POSITIONS at the Council meeting on 31 May
2018, the relevant legislated MBRR Schedule A tables contained in item
SPC04/05/18 BUDGET 2018/19 TO 2020/21 be amended after Council
approval, before the submission of the 2018/19 Budget to National Treasury

City of Cape Town - 2018/19 Budget (including additional recommendations read in at the Council meeting of 30 May 2018
Page 154
2.12.11 Transport & Urban Development Authority (Vote 11)
The City’s Transport and Urban Development Authority (TDA) directorate supports spatial
transformation in the built environment in planning and providing integrated transport infrastructure
and services, human settlement development and environmental and development management
in support or transit oriented development, to ensure the provision of basic services and build
integrated communities.
Integrated Transport Portfolio
Asset Management and Maintenance ensures the ongoing infrastructure and plant
maintenance and upgrades for the metropolitan road network and is responsible for fleet and
asset management relating to the MyCiTi fleet and public transport facilities. Repairs and
maintenance relating to roads, storm water, culverts and local area and informal networks is
the largest area of operating expenditure in this department with capital expenditure over
MTREF focused on the roads rehabilitation and Metro Roads Reconstruction programmes.
The Transport Planning department is responsible for metropolitan wide integrated transport
planning, integrated public transport network, transport systems planning and modelling,
universal access, conceptualisation, design and costing for bus rapid transit, bus, rail, public
transport interchanges and non-motorised transport.
Network Management maintains and commissions the traffic management system in Cape
Town, manages parking, destination signage, camera networks, traffic calming and contributes
towards freeway management. The department is responsible for network, systems and
integration across all modes of public transport including transport enforcement. The
assignment of the passenger rail function represents a large areas of operating expenditure
over the MTREF.
Contract Operations provides operational management and performance management of
public transport contracts and advertising contracts; manages client services; ensures
technical functioning of stations and facilities and provides event coordination. The department
manages and oversees the control centre are the Transport Management Centre. Over the
MTREF the key operating expenditure relates to the MyCiTi vehicle operating companies and
station management services.
The Regulations department provides the Municipal Regulatory Entity secretariat, manages
the relevant aspects of the operating licence administration system and manages the
registration of taxi associations operating in the City. The department manages the MyCiTi
industry transition and negotiations for service providers.
Urban Development and Investment Portfolio
The built environment department manages and implements transport and urban development
projects through project management, contract management and capital budgeting. The key
focus areas over the MTREF is on public transport infrastructure, non-motorised transport
infrastructure and public transport interchanges to expand the MyCiTi integrated public
transport network to increase access to social and economic activities for all citizens. The
congestion relief programme aims to improve mobility in the metropolitan area though
investment in road infrastructure.

City of Cape Town - 2018/19 Budget (including additional recommendations read in at the Council meeting of 30 May 2018
Page 155
Human settlement implementation is responsible for the development of new, integrated
housing, which includes the transformation of hostels and land reform and restitution in the
City. The focus is on integrated human settlement facilitation and implementation, technical
infrastructure services, and social and rental housing in line with national housing
programmes.
The Business Resource Management department provides budgeting, reporting and financial
management support to TDA. The department is responsible for the development and
management of the MyCiTi Automated Fare Collection System and Advanced Public
Transport Management Systems, as well as business planning and analysis in support of
integrated transport, housing and urban development.
Urban Catalytic Investment is responsible to provide an enabling environment for spatial
transformation and investment through leveraging land, planning infrastructure to catalyse
development, developing supporting financial and funding models for catalytic projects to
support investment and development. Key TOD catalytic projects over the MTREF includes
Paardevlei.
Environmental management
The department aims to ensure urban resilience, low carbon compact and resource efficient
development. Key areas programmes in this department include the climate change, green
infrastructure, biodiversity, coastal management and heritage management.
Development management
The department ensures the effective and efficient processing of land use and building
development management applications.
Urban Integration
The department is responsible for urban land strategy development and integration, forward
planning for land acquisition for human settlements, urban planning and design, transversal
alignment within TDA departments and other service delivery directorates of the City. A key
focus over the MTREF is on land acquisition to support to support human settlement planning
and spatial transformation.
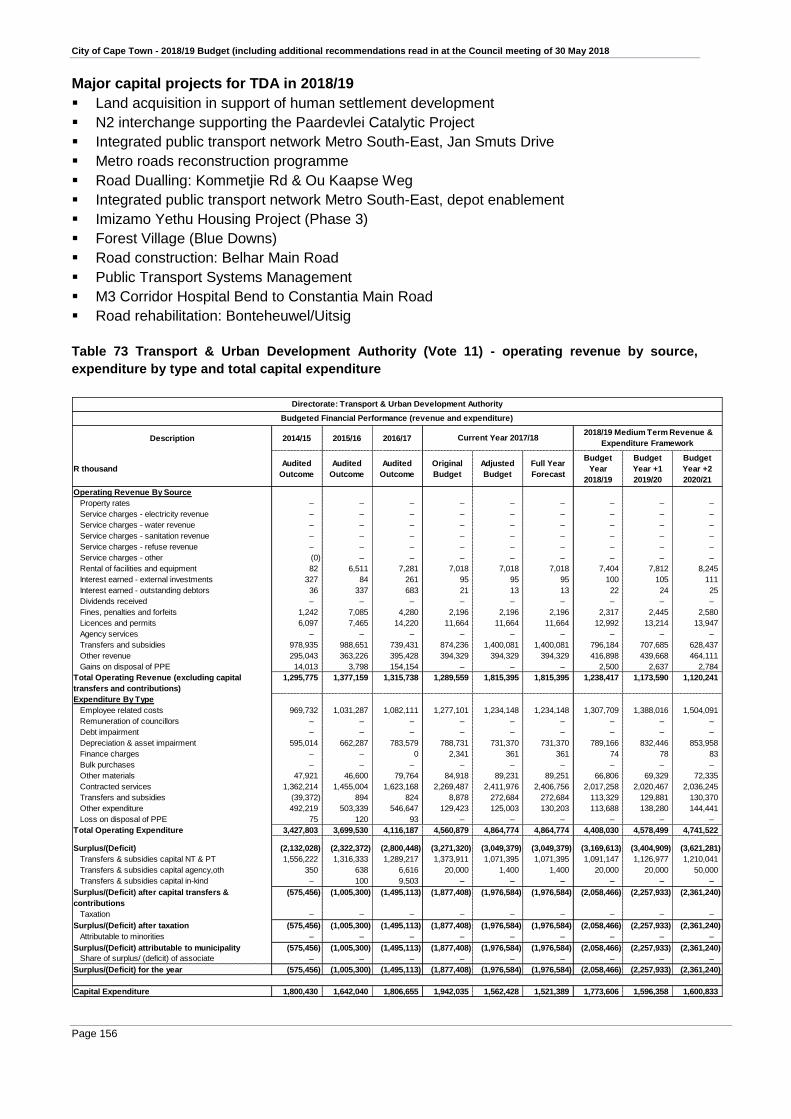
City of Cape Town - 2018/19 Budget (including additional recommendations read in at the Council meeting of 30 May 2018
Page 156
Major capital projects for TDA in 2018/19
Land acquisition in support of human settlement development
N2 interchange supporting the Paardevlei Catalytic Project
Integrated public transport network Metro South-East, Jan Smuts Drive
Metro roads reconstruction programme
Road Dualling: Kommetjie Rd & Ou Kaapse Weg
Integrated public transport network Metro South-East, depot enablement
Imizamo Yethu Housing Project (Phase 3)
Forest Village (Blue Downs)
Road construction: Belhar Main Road
Public Transport Systems Management
M3 Corridor Hospital Bend to Constantia Main Road
Road rehabilitation: Bonteheuwel/Uitsig
Table 73 Transport & Urban Development Authority (Vote 11) - operating revenue by source,
expenditure by type and total capital expenditure
Description 2014/15 2015/16 2016/17
R thousandAudited
Outcome
Audited
Outcome
Audited
Outcome
Original
Budget
Adjusted
Budget
Full Year
Forecast
Budget
Year
2018/19
Budget
Year +1
2019/20
Budget
Year +2
2020/21
Operating Revenue By Source
Property rates – – – – – – – – –
Service charges - electricity revenue – – – – – – – – –
Service charges - water revenue – – – – – – – – –
Service charges - sanitation revenue – – – – – – – – –
Service charges - refuse revenue – – – – – – – – –
Service charges - other (0) – – – – – – – –
Rental of facilities and equipment 82 6,511 7,281 7,018 7,018 7,018 7,404 7,812 8,245
Interest earned - external investments 327 84 261 95 95 95 100 105 111
Interest earned - outstanding debtors 36 337 683 21 13 13 22 24 25
Dividends received – – – – – – – – –
Fines, penalties and forfeits 1,242 7,085 4,280 2,196 2,196 2,196 2,317 2,445 2,580
Licences and permits 6,097 7,465 14,220 11,664 11,664 11,664 12,992 13,214 13,947
Agency services – – – – – – – – –
Transfers and subsidies 978,935 988,651 739,431 874,236 1,400,081 1,400,081 796,184 707,685 628,437
Other revenue 295,043 363,226 395,428 394,329 394,329 394,329 416,898 439,668 464,111
Gains on disposal of PPE 14,013 3,798 154,154 – – – 2,500 2,637 2,784
Total Operating Revenue (excluding capital
transfers and contributions)
1,295,775 1,377,159 1,315,738 1,289,559 1,815,395 1,815,395 1,238,417 1,173,590 1,120,241
Expenditure By Type
Employee related costs 969,732 1,031,287 1,082,111 1,277,101 1,234,148 1,234,148 1,307,709 1,388,016 1,504,091
Remuneration of councillors – – – – – – – – –
Debt impairment – – – – – – – – –
Depreciation & asset impairment 595,014 662,287 783,579 788,731 731,370 731,370 789,166 832,446 853,958
Finance charges – – 0 2,341 361 361 74 78 83
Bulk purchases – – – – – – – – –
Other materials 47,921 46,600 79,764 84,918 89,231 89,251 66,806 69,329 72,335
Contracted services 1,362,214 1,455,004 1,623,168 2,269,487 2,411,976 2,406,756 2,017,258 2,020,467 2,036,245
Transfers and subsidies (39,372) 894 824 8,878 272,684 272,684 113,329 129,881 130,370
Other expenditure 492,219 503,339 546,647 129,423 125,003 130,203 113,688 138,280 144,441
Loss on disposal of PPE 75 120 93 – – – – – –
Total Operating Expenditure 3,427,803 3,699,530 4,116,187 4,560,879 4,864,774 4,864,774 4,408,030 4,578,499 4,741,522
Surplus/(Deficit) (2,132,028) (2,322,372) (2,800,448) (3,271,320) (3,049,379) (3,049,379) (3,169,613) (3,404,909) (3,621,281)
Transfers & subsidies capital NT & PT 1,556,222 1,316,333 1,289,217 1,373,911 1,071,395 1,071,395 1,091,147 1,126,977 1,210,041
Transfers & subsidies capital agency,oth 350 638 6,616 20,000 1,400 1,400 20,000 20,000 50,000
Transfers & subsidies capital in-kind – 100 9,503 – – – – – –
Surplus/(Deficit) after capital transfers &
contributions
(575,456) (1,005,300) (1,495,113) (1,877,408) (1,976,584) (1,976,584) (2,058,466) (2,257,933) (2,361,240)
Taxation – – – – – – – – –
Surplus/(Deficit) after taxation (575,456) (1,005,300) (1,495,113) (1,877,408) (1,976,584) (1,976,584) (2,058,466) (2,257,933) (2,361,240)
Attributable to minorities – – – – – – – – –
Surplus/(Deficit) attributable to municipality (575,456) (1,005,300) (1,495,113) (1,877,408) (1,976,584) (1,976,584) (2,058,466) (2,257,933) (2,361,240)
Share of surplus/ (deficit) of associate – – – – – – – – –
Surplus/(Deficit) for the year (575,456) (1,005,300) (1,495,113) (1,877,408) (1,976,584) (1,976,584) (2,058,466) (2,257,933) (2,361,240)
Capital Expenditure 1,800,430 1,642,040 1,806,655 1,942,035 1,562,428 1,521,389 1,773,606 1,596,358 1,600,833
Directorate: Transport & Urban Development Authority
Budgeted Financial Performance (revenue and expenditure)
Current Year 2017/18 2018/19 Medium Term Revenue &
Expenditure Framework
City of Cape Town - 2018/19 Budget (including additional recommendations read in at the Council meeting of 30 May 2018
Page 157
2.13 Annual budget and service delivery agreement – Cape Town International Convention Centre (CTICC)
2.13.1 Executive Summary
Despite global and national economic challenges, the CTICC’s financial history indicates that the
company has managed to generate an operating profit year-on-year. As a municipal entity, the
CTICC is mandated to ensure its financial sustainability, while also contributing to GDP and job
creation.
The 2018/19 financial plan reflects that, with the projected hosting of 560 events, the company will
be generating total revenue of R286.6 million (excluding interest income of R4.5million) for the
year. The operational plans, which are factored into the budget, have taken into account growth
in primary and secondary revenue streams, as well as the continuous drive to save on costs. The
business needs in respect of capital expenditure, which is funded from CTICC reserves, have
been budgeted at R49.2 million for 2018/19. The capital expenditure is for new and existing assets,
which will contribute to the CTICC remaining a world class facility.
The 2018/19 budget process was prepared following a similar approach used in previous years.
The budget takes into account the current market conditions, such as inflation, historical trend
analysis, as well as the proposed City budget guidelines. In certain categories, zero-based
budgeting was used, where all expenses were justified and analysed for its need and cost.
The company’s budgeted 2018/19 operating profit before interest, tax, depreciation and
amortisation (EBITDA) is projected at R7.4 million for the year. The existing facility (CTICC1) will
generate a R28.6 million operating profit before interest, tax, depreciation and amortisation
(EBITDA), however, this will be absorbed by the start-up costs of the CTICC2. The budget takes
into account twelve (12) months of trading of the CTICC2.
The 2018/19 budget includes a 53% (R73 million) “blue sky” revenue, as the budget is prepared
for the City well in advance of the start date of the 2018/19 financial year, when there are few
bookings in the system on which the budget can be based. CTICC2 includes budgeted “blue sky”
at 62%.
Owing to the nature of the company’s business and the increase in short term bookings the CTICC
has always included a portion of “unknown” revenue for the unknown or short term business. As
venue rental income is the primary source of revenue, the other revenue streams’ budgets are
prepared with these same assumptions.
Gross margins are budgeted to be maintained at 81%. Indirect costs for the existing facility has
been budgeted to increase at 11% in total, mainly as a result of an increase in tariffs relating to
utility services, which have been budgeted to increase in line with the City budget guidelines. The
CTICC1’s and CTICC2’s 2018/19 budget reflects a R3.4 million net loss and a R27.3 million
respectively resulting in a combined net loss of R30.7 million.
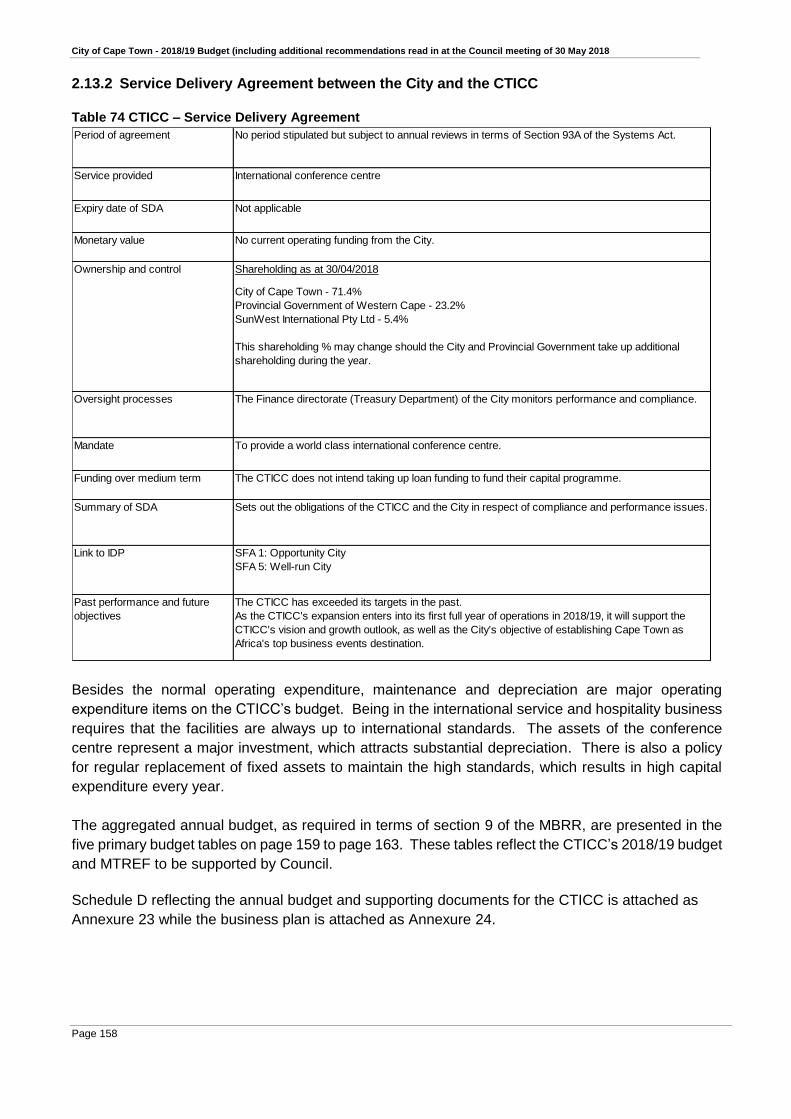
City of Cape Town - 2018/19 Budget (including additional recommendations read in at the Council meeting of 30 May 2018
Page 158
2.13.2 Service Delivery Agreement between the City and the CTICC
Table 74 CTICC – Service Delivery Agreement
Period of agreement No period stipulated but subject to annual reviews in terms of Section 93A of the Systems Act.
Shareholding as at 30/04/2018
City of Cape Town - 71.4%
Provincial Government of Western Cape - 23.2%
SunWest International Pty Ltd - 5.4%
This shareholding % may change should the City and Provincial Government take up additional
shareholding during the year.
Mandate To provide a world class international conference centre.
Funding over medium term The CTICC does not intend taking up loan funding to fund their capital programme.
Link to IDP SFA 1: Opportunity City
SFA 5: Well-run City
Ownership and control
Oversight processes The Finance directorate (Treasury Department) of the City monitors performance and compliance.
Summary of SDA Sets out the obligations of the CTICC and the City in respect of compliance and performance issues.
Past performance and future
objectives
The CTICC has exceeded its targets in the past.
As the CTICC's expansion enters into its first full year of operations in 2018/19, it will support the
CTICC's vision and growth outlook, as well as the City's objective of establishing Cape Town as
Africa's top business events destination.
Service provided International conference centre
Expiry date of SDA Not applicable
Monetary value No current operating funding from the City.
Besides the normal operating expenditure, maintenance and depreciation are major operating
expenditure items on the CTICC’s budget. Being in the international service and hospitality business
requires that the facilities are always up to international standards. The assets of the conference
centre represent a major investment, which attracts substantial depreciation. There is also a policy
for regular replacement of fixed assets to maintain the high standards, which results in high capital
expenditure every year.
The aggregated annual budget, as required in terms of section 9 of the MBRR, are presented in the
five primary budget tables on page 159 to page 163. These tables reflect the CTICC’s 2018/19 budget
and MTREF to be supported by Council.
Schedule D reflecting the annual budget and supporting documents for the CTICC is attached as
Annexure 23 while the business plan is attached as Annexure 24.

City of Cape Town - 2018/19 Budget (including additional recommendations read in at the Council meeting of 30 May 2018
Page 159
Table 75 CTICC - Table D1 Budget Summary
Description 2014/15 2015/16 2016/17 Current Year 2017/18Medium Term Revenue and
Expenditure Framework
R thousandsAudited
Outcome
Audited
Outcome
Audited
Outcome
Original
Budget
Adjusted
Budget
Full Year
Forecast
Budget
Year
2018/19
Budget
Year +1
2019/20
Budget
Year +2
2020/21
Financial Performance
Property rates – – – – – – – – –
Service charges – – – – – – – – –
Investment revenue 30,742 35,272 28,825 11,671 11,671 11,671 4,515 4,786 5,073
Transfers and subsidies – – – – – – – – –
Other own revenue 195,924 208,733 215,648 272,780 249,738 249,738 286,614 303,811 322,040
Total Revenue (excluding capital transfers and
contributions)
226,666 244,005 244,473 284,451 261,409 261,409 291,129 308,597 327,113
Employee costs 44,017 47,502 57,457 88,887 77,513 77,513 92,542 98,909 104,843
Remuneration of Board Members 356 457 578 804 700 700 756 816 882
Depreciation & asset impairment 22,968 24,832 24,424 702,868 705,317 705,317 42,651 45,211 47,923
Finance charges – 42 3 3,651 – – – – –
Materials and bulk purchases – – – – – – 41,317 43,940 46,577
Transfers and subsidies – – – – – – 57 61 64
Other expenditure 98,606 103,911 104,551 167,947 147,477 147,477 144,517 153,687 162,892
Total Expenditure 165,947 176,745 187,013 964,158 931,008 931,008 321,840 342,624 363,182
Surplus/(Deficit) 60,719 67,260 57,460 (679,707) (669,599) (669,599) (30,711) (34,027) (36,069)
Transfers and subsidies - capital (monetary
allocations) (National / Provincial and District)
– – – – – – – – –
Contributions recognised - capital & contributed
assets
– – – – – – – – –
Surplus/(Deficit) after capital transfers &
contributions
60,719 67,260 57,460 (679,707) (669,599) (669,599) (30,711) (34,027) (36,069)
Taxation 18,576 20,007 13,983 – – – – – –
Surplus/ (Deficit) for the year 42,143 47,253 43,476 (679,707) (669,599) (669,599) (30,711) (34,027) (36,069)
Capital expenditure & funds sources
Capital expenditure 81,879 380,306 367,936 47,982 175,476 175,476 49,193 40,631 43,069
Transfers recognised - capital – – – – – – – – –
Public contributions & donations – – – – – – – – –
Borrowing – – – – – – – – –
Internally generated funds 81,879 380,306 367,936 47,982 175,476 175,476 49,193 40,631 43,069
Total sources of capital funds 81,879 380,306 367,936 47,982 175,476 175,476 49,193 40,631 43,069
Financial position
Total current assets 579,936 437,337 268,623 248,244 149,536 149,536 132,686 110,948 87,460
Total non current assets 264,115 619,426 961,750 345,398 431,909 431,909 438,450 433,870 429,016
Total current liabilities 91,881 142,989 77,470 109,454 98,140 98,140 118,543 126,252 133,979
Total non current liabilities (5) (2,654) – 37,552 – – – – –
Community wealth/Equity 752,174 916,427 1,152,904 446,636 483,304 483,304 452,593 418,566 382,498
Cash flows
Net cash from (used) operating 78,796 127,270 46,030 40,398 49,982 49,982 29,498 17,566 18,175
Net cash from (used) investing (81,879) (380,307) (405,437) (47,982) (175,476) (175,476) (49,193) (40,631) (43,069)
Net cash from (used) financing 202,715 117,000 193,000 (2,573) – – – – –
Cash/cash equivalents at the year end 554,632 418,595 252,188 225,378 126,694 126,694 107,000 83,935 59,041

City of Cape Town - 2018/19 Budget (including additional recommendations read in at the Council meeting of 30 May 2018
Page 160
Table 76 CTICC - Table D2 Budgeted Financial Performance (revenue and expenditure) Description
2014/15 2015/16 2016/17
R thousandsAudited
Outcome
Audited
Outcome
Audited
Outcome
Original
Budget
Adjusted
Budget
Full Year
Forecast
Budget
Year
2018/19
Budget
Year +1
2019/20
Budget
Year +2
2020/21
Revenue by Source
Property rates – – – – – – – – –
Service charges - electricity revenue – – – – – – – – –
Service charges - water revenue – – – – – – – – –
Service charges - sanitation revenue – – – – – – – – –
Service charges - refuse revenue – – – – – – – – –
Service charges - other – – – – – – – – –
Rental of facilities and equipment 94,607 99,937 104,571 131,571 121,642 121,642 138,802 147,131 155,958
Interest earned - external investments 30,742 35,272 28,825 11,671 11,671 11,671 4,515 4,786 5,073
Interest earned - outstanding debtors – – – – – – – – –
Dividends received – – – – – – – – –
Fines, penalties and forfeits – – – – – – – – –
Licences and permits – – – – – – – – –
Agency services – – – – – – – – –
Transfers and subsidies – – – – – – – – –
Other revenue 101,318 108,796 111,077 141,209 128,096 128,096 147,812 156,680 166,081
Gains on disposal of PPE – – – – – – – – –
Total Revenue (excluding capital transfers and
contributions)
226,666 244,005 244,473 284,451 261,409 261,409 291,129 308,597 327,113
Expenditure By Type
Employee related costs 44,017 47,502 57,457 88,887 77,513 77,513 92,542 98,909 104,843
Remuneration of councillors 356 457 578 804 700 700 756 816 882
Debt impairment – – – – – – 300 312 315
Depreciation & asset impairment 22,968 24,832 24,424 702,868 705,317 705,317 42,651 45,211 47,923
Finance charges – 42 3 3,651 – – – – –
Bulk purchases – – – – – – – – –
Other materials – – – – – – 41,317 43,940 46,577
Contracted services – – – – – – 62,884 66,877 70,889
Transfers and subsidies – – – – – – 57 61 64
Other expenditure 98,606 103,911 104,551 167,947 147,477 147,477 81,334 86,498 91,688
Loss on disposal of PPE – – – – – – – – –
Total Expenditure 165,947 176,745 187,013 964,158 931,008 931,008 321,840 342,624 363,182
Surplus/(Deficit) 60,719 67,260 57,460 (679,707) (669,599) (669,599) (30,711) (34,027) (36,069)
Transfers and subsidies - capital (monetary allocations)
(National / Provincial and District)
– – – – – – – – –
Transfers and subsidies - capital (monetary allocations)
(National / Provincial Departmental Agencies,
Households, Non-profit Institutions, Private Enterprises,
Public Corporatons, Higher Educational Institutions)
– – – – – – – – –
Transfers and subsidies - capital (in-kind - all) – – – – – – – – –
Surplus/(Deficit) after capital transfers &
contributions
60,719 67,260 57,460 (679,707) (669,599) (669,599) (30,711) (34,027) (36,069)
Taxation 18,576 20,007 13,983 – – – – – –
Surplus/ (Deficit) for the year 42,143 47,253 43,476 (679,707) (669,599) (669,599) (30,711) (34,027) (36,069)
Current Year 2017/18Medium Term Revenue and
Expenditure Framework

City of Cape Town - 2018/19 Budget (including additional recommendations read in at the Council meeting of 30 May 2018
Page 161
Table 77 CTICC - Table D3 Capital Budget by vote and funding
Vote Description 2014/15 2015/16 2016/17
R thousands
Audited
Outcome
Audited
Outcome
Audited
Outcome
Original
Budget
Adjusted
Budget
Full Year
Forecast
Budget
Year
2018/19
Budget
Year +1
2019/20
Budget
Year +2
2020/21
Capital expenditure by Asset Class/Sub-class
Other assets 71,598 367,264 351,231 25,300 151,793 151,793 27,247 22,450 23,797
Operational Buildings 71,598 367,264 351,231 25,300 151,793 151,793 27,247 22,450 23,797
Municipal Offices 71,598 367,264 351,231 25,300 151,793 151,793 27,247 22,450 23,797
Computer Equipment 7,078 9,413 12,853 15,224 15,224 15,224 15,218 15,803 16,751
Computer Equipment 7,078 9,413 12,853 15,224 15,224 15,224 15,218 15,803 16,751
Furniture and Office Equipment 3,203 2,609 3,165 6,110 6,110 6,110 5,380 1,030 1,092
Furniture and Office Equipment 3,203 2,609 3,165 6,110 6,110 6,110 5,380 1,030 1,092
Machinery and Equipment – 1,020 687 1,348 2,348 2,348 1,348 1,348 1,429
Machinery and Equipment – 1,020 687 1,348 2,348 2,348 1,348 1,348 1,429
Total capital expenditure on assets 81,879 380,306 367,936 47,982 175,476 175,476 49,193 40,631 43,069
Funded by:
National Government – – – – – – – – –
Provincial Government – – – – – – – – –
Parent Municipality – – – – – – – – –
District Municipality – – – – – – – – –
Transfers recognised - capital – – – – – – – – –
Public contributions & donations – – – – – – – – –
Borrowing – – – – – – – – –
Internally generated funds 81,879 380,306 367,936 47,982 175,476 175,476 49,193 40,631 43,069
Total Capital Funding 81,879 380,306 367,936 47,982 175,476 175,476 49,193 40,631 43,069
Current Year 2017/18Medium Term Revenue and
Expenditure Framework

City of Cape Town - 2018/19 Budget (including additional recommendations read in at the Council meeting of 30 May 2018
Page 162
Table 78 CTICC - Table D4 Budgeted Financial Position
Description 2014/15 2015/16 2016/17
R thousandsAudited
Outcome
Audited
Outcome
Audited
Outcome
Original
Budget
Adjusted
Budget
Full Year
Forecast
Budget
Year
2018/19
Budget
Year +1
2019/20
Budget
Year +2
2020/21
ASSETS
Current assets
Cash 9,770 9,771 14,301 – – – – – –
Call investment deposits 544,862 408,824 237,887 225,378 126,694 126,694 107,000 83,935 59,041
Consumer debtors – – – – – – – – –
Other debtors 23,539 17,482 15,237 21,004 21,396 21,396 24,027 25,254 26,555
Current portion of long-term receivables – – – – – – – – –
Inventory 1,766 1,260 1,198 1,862 1,445 1,445 1,659 1,758 1,864
Total current assets 579,936 437,337 268,623 248,244 149,536 149,536 132,686 110,948 87,460
Non current assets
Long-term receivables – – – – – – – – –
Investments – – – – – – – – –
Investment property – – – – – – – – –
Investment in Associate – – – – – – – – –
Property, plant and equipment 264,115 619,426 961,750 345,398 431,909 431,909 438,450 433,870 429,016
Agricultural – – – – – – – – –
Biological – – – – – – – – –
Intangible – – – – – – – – –
Other non-current assets – – – – – – – – –
Total non current assets 264,115 619,426 961,750 345,398 431,909 431,909 438,450 433,870 429,016
TOTAL ASSETS 844,051 1,056,763 1,230,373 593,642 581,444 581,444 571,136 544,818 516,476
LIABILITIES
Current liabilities
Bank overdraft – – – – – – – – –
Borrowing – – – – – – – – –
Consumer deposits 36,429 46,620 19,687 49,100 22,799 22,799 26,166 27,736 29,400
Trade and other payables 52,088 92,831 56,399 56,680 69,964 69,964 86,549 92,198 97,730
Provisions 3,365 3,538 1,383 3,673 5,376 5,376 5,828 6,318 6,848
Total current liabilities 91,881 142,989 77,470 109,454 98,140 98,140 118,543 126,252 133,979
Non current liabilities
Borrowing – – – 36,821 – – – – –
Provisions (5) (2,654) – 731 – – – – –
Total non current liabilities (5) (2,654) – 37,552 – – – – –
TOTAL LIABILITIES 91,877 140,336 77,470 147,006 98,140 98,140 118,543 126,252 133,979
NET ASSETS 752,174 916,427 1,152,903 446,636 483,304 483,304 452,593 418,566 382,498
COMMUNITY WEALTH/EQUITY
Accumulated Surplus/(Deficit) (215,253) (168,001) (124,524) (839,004) (794,123) (794,123) (824,834) (858,861) (894,930)
Reserves – – – – – – – – –
Share capital 967,428 1,084,428 1,277,428 1,285,640 1,277,428 1,277,428 1,277,428 1,277,428 1,277,428
TOTAL COMMUNITY WEALTH/EQUITY 752,174 916,427 1,152,904 446,636 483,304 483,304 452,593 418,566 382,498
Current Year 2017/18Medium Term Revenue and
Expenditure Framework
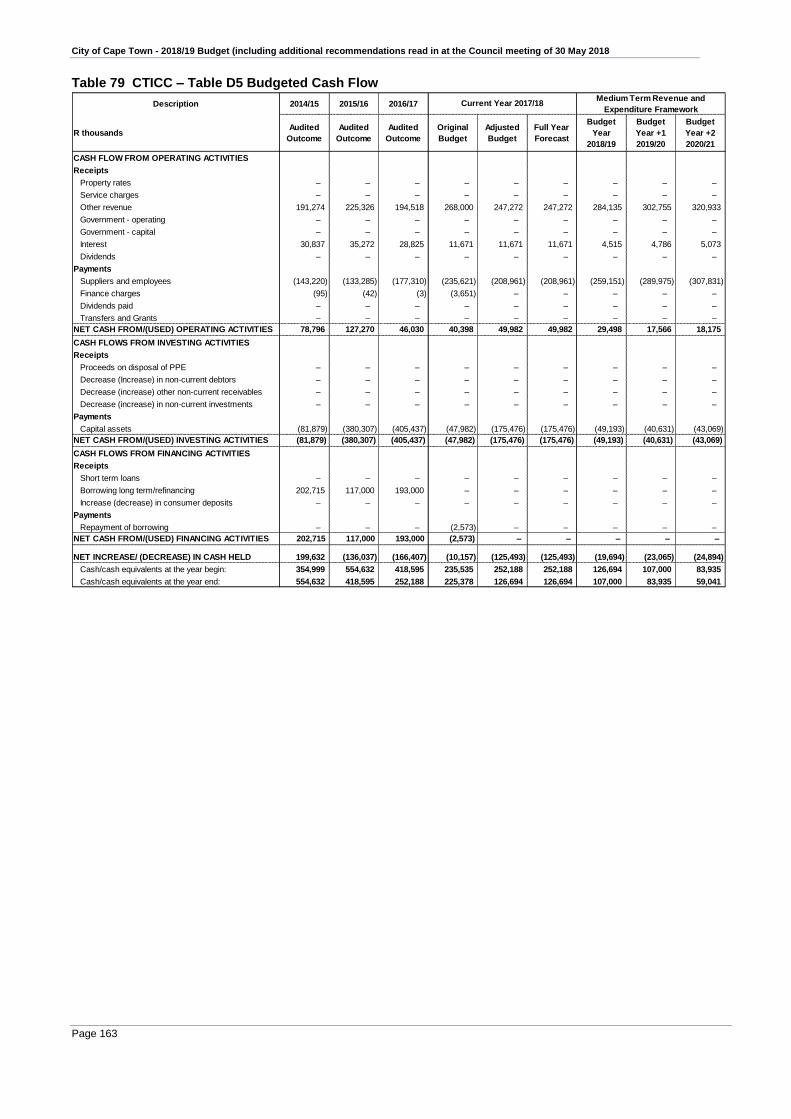
City of Cape Town - 2018/19 Budget (including additional recommendations read in at the Council meeting of 30 May 2018
Page 163
Table 79 CTICC – Table D5 Budgeted Cash Flow
Description 2014/15 2015/16 2016/17
R thousandsAudited
Outcome
Audited
Outcome
Audited
Outcome
Original
Budget
Adjusted
Budget
Full Year
Forecast
Budget
Year
2018/19
Budget
Year +1
2019/20
Budget
Year +2
2020/21
CASH FLOW FROM OPERATING ACTIVITIES
Receipts
Property rates – – – – – – – – –
Service charges – – – – – – – – –
Other revenue 191,274 225,326 194,518 268,000 247,272 247,272 284,135 302,755 320,933
Government - operating – – – – – – – – –
Government - capital – – – – – – – – –
Interest 30,837 35,272 28,825 11,671 11,671 11,671 4,515 4,786 5,073
Dividends – – – – – – – – –
Payments
Suppliers and employees (143,220) (133,285) (177,310) (235,621) (208,961) (208,961) (259,151) (289,975) (307,831)
Finance charges (95) (42) (3) (3,651) – – – – –
Dividends paid – – – – – – – – –
Transfers and Grants – – – – – – – – –
NET CASH FROM/(USED) OPERATING ACTIVITIES 78,796 127,270 46,030 40,398 49,982 49,982 29,498 17,566 18,175
CASH FLOWS FROM INVESTING ACTIVITIES
Receipts
Proceeds on disposal of PPE – – – – – – – – –
Decrease (Increase) in non-current debtors – – – – – – – – –
Decrease (increase) other non-current receivables – – – – – – – – –
Decrease (increase) in non-current investments – – – – – – – – –
Payments
Capital assets (81,879) (380,307) (405,437) (47,982) (175,476) (175,476) (49,193) (40,631) (43,069)
NET CASH FROM/(USED) INVESTING ACTIVITIES (81,879) (380,307) (405,437) (47,982) (175,476) (175,476) (49,193) (40,631) (43,069)
CASH FLOWS FROM FINANCING ACTIVITIES
Receipts
Short term loans – – – – – – – – –
Borrowing long term/refinancing 202,715 117,000 193,000 – – – – – –
Increase (decrease) in consumer deposits – – – – – – – – –
Payments
Repayment of borrowing – – – (2,573) – – – – –
NET CASH FROM/(USED) FINANCING ACTIVITIES 202,715 117,000 193,000 (2,573) – – – – –
NET INCREASE/ (DECREASE) IN CASH HELD 199,632 (136,037) (166,407) (10,157) (125,493) (125,493) (19,694) (23,065) (24,894)
Cash/cash equivalents at the year begin: 354,999 554,632 418,595 235,535 252,188 252,188 126,694 107,000 83,935
Cash/cash equivalents at the year end: 554,632 418,595 252,188 225,378 126,694 126,694 107,000 83,935 59,041
Current Year 2017/18Medium Term Revenue and
Expenditure Framework

City of Cape Town - 2018/19 Budget (including additional recommendations read in at the Council meeting of 30 May 2018
Page 164
2.14 Annual budget and service delivery agreement – Cape Town Stadium (CTS)
2.14.1 Executive Summary
The CTS has entered into an exciting and dynamic phase of its business development and
commercialization process. A flexible independent public/private governance and management
vehicle for CTS, a municipal entity (Cape Town Stadium (RF) SOC Limited), has been established
and commenced business operations as of 1 February 2018.
The recent re-zoning of the use-rights of the land upon which CTS and its immediate precinct is
built has laid the platform upon which an optimised commercialisation of the CTS and its
immediate precinct can take place. Critically, this leveraging of the commercialisation of CTS will
be effected against the backdrop of an open canvass – a commercially clean stadium. These long
awaited developments have provided the catalyst for a compelling sustainable business case to
be developed for CTS to, inter alia, materially attenuate the historical financial burden carried by
City ratepayers to operate and maintain this iconic, world class arena.
The 2018/19 budget is drafted under the mandate given in terms of the Service Delivery
Agreement between the City and the CTS.
The CTS’s budget is balanced through the provision of an annual grant allocation from the City.
The expenditure component of this budget is only subject to prior year actual level plus inflationary
increases. The income determination is based on carry over events from the prior year and
anticipated demand for the current budget year.
This 2018/19 Business Plan, which is aligned with the City’s Integrated Development Plan (IDP)
and Economic Growth Strategy (EGS), and constitutes its vision toward achieving local and
international recognition as a preferred major venue for the hosting of significant, financially
sustainable, international, national and local sports, recreational, cultural and community events.
2.14.2 Purpose & Service Mandate • Key Aspects of Required Service Delivery
Municipal legislation (Municipal Systems Act, 2000 read with Municipal Finance Management
Act, 2003) required the CTS ME to enter into a monitored service delivery agreement (“SDA”)
with the City in respect of the governance, management and operation of the CTS.
• SDA to be entered into between the City and CTS
The salient features of the SDA to be entered into between the City and the CTS are captured
in Table 80 on page 166.

City of Cape Town - 2018/19 Budget (including additional recommendations read in at the Council meeting of 30 May 2018
Page 165
• CTS’s services and functions ito the SDA
The CTS has been mandated in terms of the SDA between the City and the Stadium to, inter
alia, provide the following services and functions:
General Facility Operations
Asset management and maintenance: ICT services and infrastructure support (tickets,
advertising, audio-visual, etc.); safety and security; capital and refurbishment; and
investment projects.
Events and Entertainment Services Management
Bowl and non-bowl event scheduling; planning and execution; development and hosting of
signature events; managing of events industry and service provider requirement; events
leveraging and bidding processes etc.
Commercialization, Marketing and Hospitality Management
Advertising; merchandising; supplier and pouring rights; ticketing; hospitality;
sponsorships; tourism; marketing of bowl and non-bowl facilities; property development
and management; commercial legal services.
Finance, Legal and Administration Management
Establishment and management of structures, systems and processes with regards to
finance, revenue and expenditure, legal, governance and administration and such
additional services as the City may require from time to time.
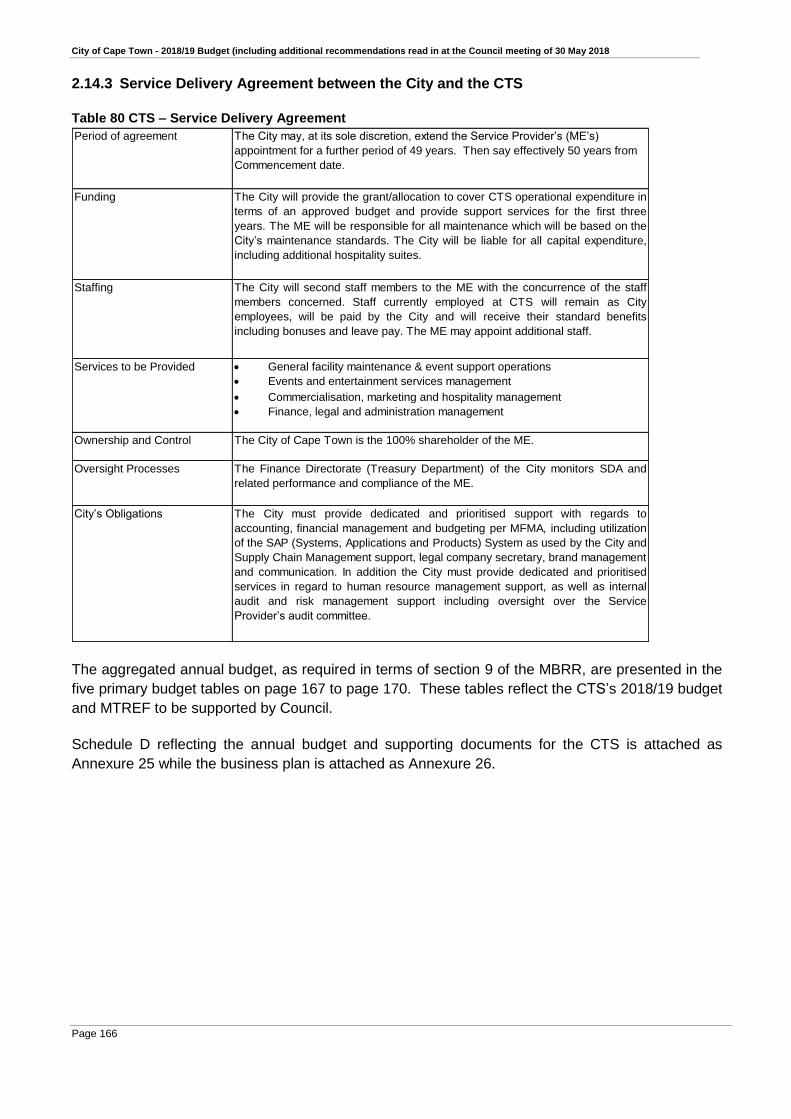
City of Cape Town - 2018/19 Budget (including additional recommendations read in at the Council meeting of 30 May 2018
Page 166
2.14.3 Service Delivery Agreement between the City and the CTS
Table 80 CTS – Service Delivery Agreement
Period of agreement The City may, at its sole discretion, extend the Service Provider’s (ME’s)
appointment for a further period of 49 years. Then say effectively 50 years from
Commencement date.
Funding The City will provide the grant/allocation to cover CTS operational expenditure in
terms of an approved budget and provide support services for the first three
years. The ME will be responsible for all maintenance which will be based on the
City’s maintenance standards. The City will be liable for all capital expenditure,
including additional hospitality suites.
Staffing The City will second staff members to the ME with the concurrence of the staff
members concerned. Staff currently employed at CTS will remain as City
employees, will be paid by the City and will receive their standard benefits
including bonuses and leave pay. The ME may appoint additional staff.
General facility maintenance & event support operations
Events and entertainment services management
Commercialisation, marketing and hospitality management
Finance, legal and administration management
Ownership and Control The City of Cape Town is the 100% shareholder of the ME.
Oversight Processes The Finance Directorate (Treasury Department) of the City monitors SDA and
related performance and compliance of the ME.
City’s Obligations The City must provide dedicated and prioritised support with regards to
accounting, financial management and budgeting per MFMA, including utilization
of the SAP (Systems, Applications and Products) System as used by the City and
Supply Chain Management support, legal company secretary, brand management
and communication. In addition the City must provide dedicated and prioritised
services in regard to human resource management support, as well as internal
audit and risk management support including oversight over the Service
Provider’s audit committee.
Services to be Provided
The aggregated annual budget, as required in terms of section 9 of the MBRR, are presented in the
five primary budget tables on page 167 to page 170. These tables reflect the CTS’s 2018/19 budget
and MTREF to be supported by Council.
Schedule D reflecting the annual budget and supporting documents for the CTS is attached as
Annexure 25 while the business plan is attached as Annexure 26.
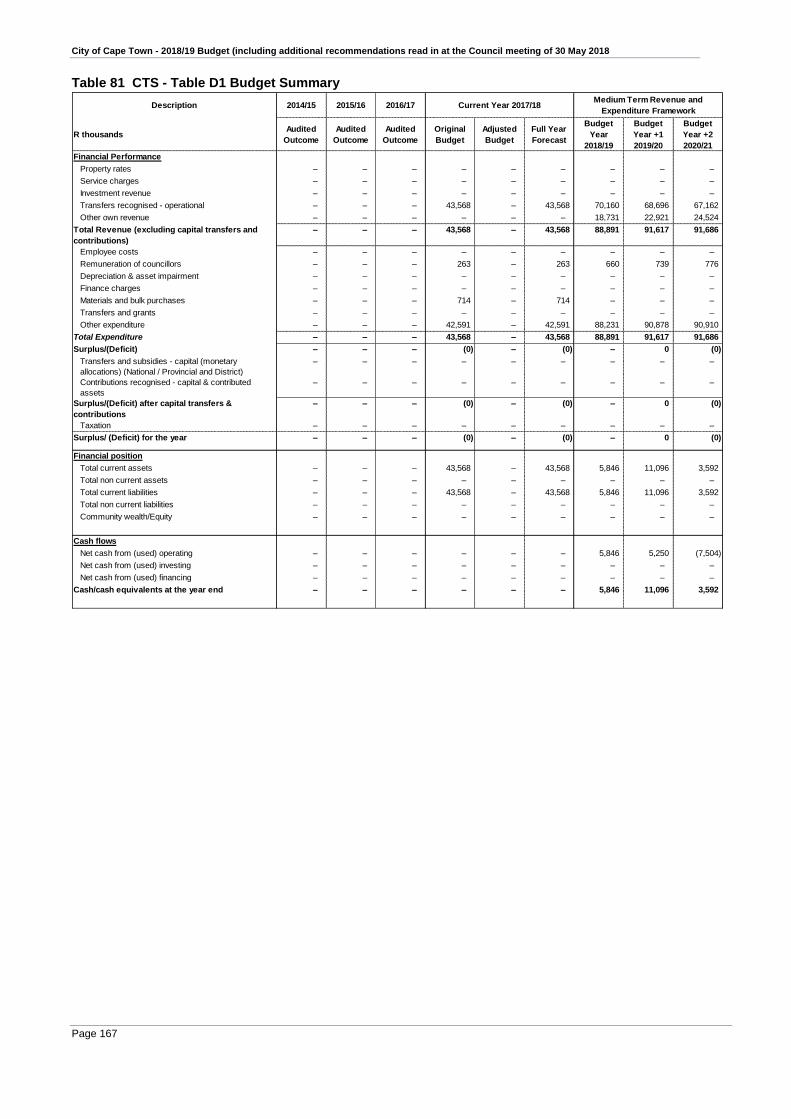
City of Cape Town - 2018/19 Budget (including additional recommendations read in at the Council meeting of 30 May 2018
Page 167
Table 81 CTS - Table D1 Budget Summary
Description 2014/15 2015/16 2016/17
R thousandsAudited
Outcome
Audited
Outcome
Audited
Outcome
Original
Budget
Adjusted
Budget
Full Year
Forecast
Budget
Year
2018/19
Budget
Year +1
2019/20
Budget
Year +2
2020/21
Financial Performance
Property rates – – – – – – – – –
Service charges – – – – – – – – –
Investment revenue – – – – – – – – –
Transfers recognised - operational – – – 43,568 – 43,568 70,160 68,696 67,162
Other own revenue – – – – – – 18,731 22,921 24,524
Total Revenue (excluding capital transfers and
contributions)
– – – 43,568 – 43,568 88,891 91,617 91,686
Employee costs – – – – – – – – –
Remuneration of councillors – – – 263 – 263 660 739 776
Depreciation & asset impairment – – – – – – – – –
Finance charges – – – – – – – – –
Materials and bulk purchases – – – 714 – 714 – – –
Transfers and grants – – – – – – – – –
Other expenditure – – – 42,591 – 42,591 88,231 90,878 90,910
Total Expenditure – – – 43,568 – 43,568 88,891 91,617 91,686
Surplus/(Deficit) – – – (0) – (0) – 0 (0)
Transfers and subsidies - capital (monetary
allocations) (National / Provincial and District)
– – – – – – – – –
Contributions recognised - capital & contributed
assets
– – – – – – – – –
Surplus/(Deficit) after capital transfers &
contributions
– – – (0) – (0) – 0 (0)
Taxation – – – – – – – – –
Surplus/ (Deficit) for the year – – – (0) – (0) – 0 (0)
Financial position
Total current assets – – – 43,568 – 43,568 5,846 11,096 3,592
Total non current assets – – – – – – – – –
Total current liabilities – – – 43,568 – 43,568 5,846 11,096 3,592
Total non current liabilities – – – – – – – – –
Community wealth/Equity – – – – – – – – –
Cash flows
Net cash from (used) operating – – – – – – 5,846 5,250 (7,504)
Net cash from (used) investing – – – – – – – – –
Net cash from (used) financing – – – – – – – – –
Cash/cash equivalents at the year end – – – – – – 5,846 11,096 3,592
Current Year 2017/18Medium Term Revenue and
Expenditure Framework

City of Cape Town - 2018/19 Budget (including additional recommendations read in at the Council meeting of 30 May 2018
Page 168
Table 82 CTS - Table D2 Budgeted Financial Performance (revenue and expenditure) Description
2014/15 2015/16 2016/17
R thousandsAudited
Outcome
Audited
Outcome
Audited
Outcome
Original
Budget
Adjusted
Budget
Full Year
Forecast
Budget
Year
2018/19
Budget
Year +1
2019/20
Budget
Year +2
2020/21
Revenue by Source
Property rates – – – – – – – – –
Service charges - electricity revenue – – – – – – – – –
Service charges - water revenue – – – – – – – – –
Service charges - sanitation revenue – – – – – – – – –
Service charges - refuse revenue – – – – – – – – –
Service charges - other – – – – – – – – –
Rental of facilities and equipment – – – – – – 14,131 16,582 17,582
Interest earned - external investments – – – – – – – – –
Interest earned - outstanding debtors – – – – – – – – –
Dividends received – – – – – – – – –
Fines, penalties and forfeits – – – – – – – – –
Licences and permits – – – – – – – – –
Agency services – – – – – – – – –
Transfers and subsidies – – – 43,568 – 43,568 70,160 68,696 67,162
Other revenue – – – – – – 4,600 6,339 6,942
Gains on disposal of PPE – – – – – – – – –
Total Revenue (excluding capital transfers and
contributions)
– – – 43,568 – 43,568 88,891 91,617 91,686
Expenditure By Type
Employee related costs – – – – – – – – –
Remuneration of councillors – – – 263 – 263 660 739 776
Debt impairment – – – – – – – – –
Depreciation & asset impairment – – – – – – – – –
Finance charges – – – – – – – – –
Bulk purchases – – – – – – – – –
Other materials – – – 714 – 714 – – –
Contracted services – – – 33,946 – 33,946 51,540 53,087 53,106
Transfers and subsidies – – – – – – – – –
Other expenditure – – – 8,645 – 8,645 36,690 37,791 37,804
Loss on disposal of PPE – – – – – – – – –
Total Expenditure – – – 43,568 – 43,568 88,891 91,617 91,686
Surplus/(Deficit)
Transfers and subsidies - capital (monetary
allocations) (National / Provincial and District)
– – – – – – – – –
Transfers and subsidies - capital (monetary
allocations) (National / Provincial Departmental
Agencies, Households, Non-profit Institutions, Private
Enterprises, Public Corporatons, Higher Educational
Institutions)
– – – – – – – – –
Transfers and subsidies - capital (in-kind - all) – – – – – – – – –
Surplus/(Deficit) after capital transfers &
contributions
– – – (0) – (0) – 0 (0)
Taxation – – – – – – – – –
Surplus/ (Deficit) for the year – – – (0) – (0) – 0 (0)
Current Year 2017/18Medium Term Revenue and
Expenditure Framework

City of Cape Town - 2018/19 Budget (including additional recommendations read in at the Council meeting of 30 May 2018
Page 169
Table 83 CTS - Table D4 Budgeted Financial Position
Description 2014/15 2015/16 2016/17
R thousandsAudited
Outcome
Audited
Outcome
Audited
Outcome
Original
Budget
Adjusted
Budget
Full Year
Forecast
Budget
Year
2018/19
Budget
Year +1
2019/20
Budget
Year +2
2020/21
ASSETS
Current assets
Cash – – – – – – 5,846 11,096 3,592
Call investment deposits – – – – – – – – –
Consumer debtors – – – – – – – – –
Other debtors – – – – – – – – –
Current portion of long-term receivables – – – 43,568 – 43,568 – – –
Inventory – – – – – – – – –
Total current assets – – – 43,568 – 43,568 5,846 11,096 3,592
Non current assets
Long-term receivables – – – – – – – – –
Investments – – – – – – – – –
Investment property – – – – – – – – –
Investment in Associate – – – – – – – – –
Property, plant and equipment – – – – – – – – –
Agricultural – – – – – – – – –
Biological – – – – – – – – –
Intangible – – – – – – – – –
Other non-current assets – – – – – – – – –
Total non current assets – – – – – – – – –
TOTAL ASSETS – – – 43,568 – 43,568 5,846 11,096 3,592
LIABILITIES
Current liabilities
Bank overdraft – – – – – – – – –
Borrowing – – – – – – – – –
Consumer deposits – – – – – – – – –
Trade and other payables – – – 43,568 – 43,568 5,846 11,096 3,592
Provisions – – – – – – – – –
Total current liabilities – – – 43,568 – 43,568 5,846 11,096 3,592
Non current liabilities
Borrowing – – – – – – – – –
Provisions – – – – – – – – –
Total non current liabilities – – – – – – – – –
TOTAL LIABILITIES – – – 43,568 – 43,568 5,846 11,096 3,592
NET ASSETS – – – – – – – – –
COMMUNITY WEALTH/EQUITY
Accumulated Surplus/(Deficit) – – – – – – – – –
Reserves – – – – – – – – –
Share capital – – – – – – – – –
TOTAL COMMUNITY WEALTH/EQUITY – – – – – – – – –
Current Year 2017/18Medium Term Revenue and
Expenditure Framework
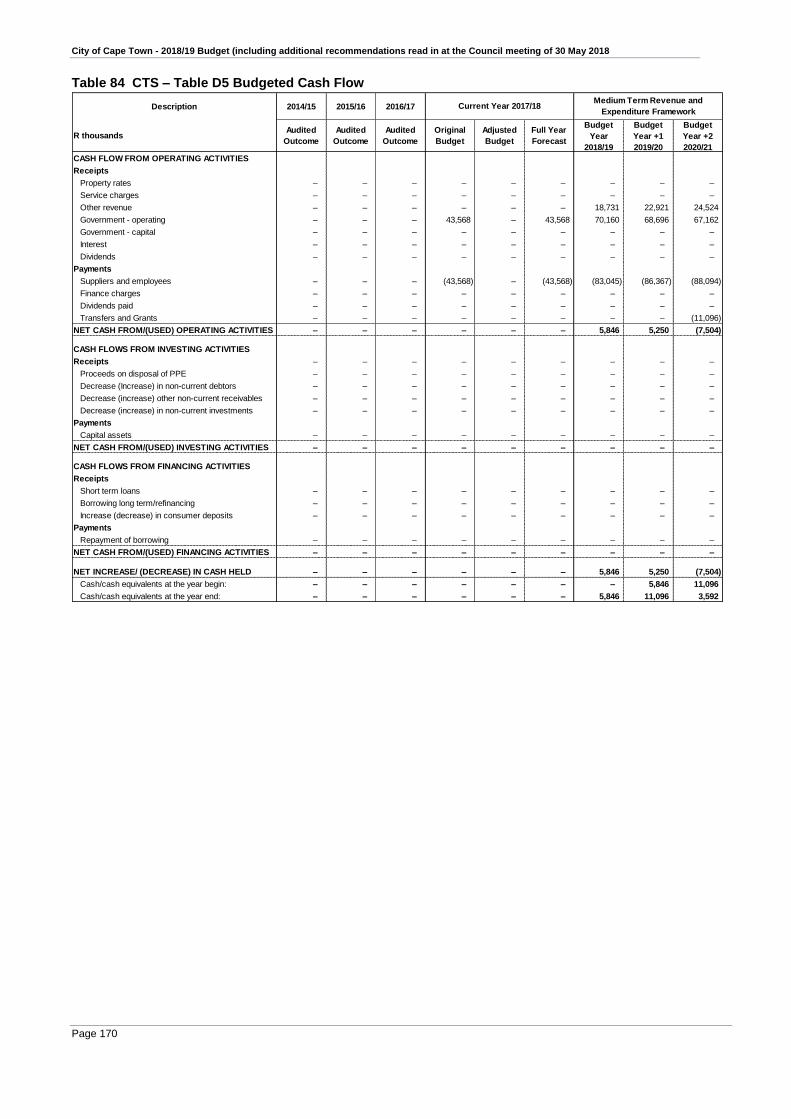
City of Cape Town - 2018/19 Budget (including additional recommendations read in at the Council meeting of 30 May 2018
Page 170
Table 84 CTS – Table D5 Budgeted Cash Flow
Description 2014/15 2015/16 2016/17
R thousandsAudited
Outcome
Audited
Outcome
Audited
Outcome
Original
Budget
Adjusted
Budget
Full Year
Forecast
Budget
Year
2018/19
Budget
Year +1
2019/20
Budget
Year +2
2020/21
CASH FLOW FROM OPERATING ACTIVITIES
Receipts
Property rates – – – – – – – – –
Service charges – – – – – – – – –
Other revenue – – – – – – 18,731 22,921 24,524
Government - operating – – – 43,568 – 43,568 70,160 68,696 67,162
Government - capital – – – – – – – – –
Interest – – – – – – – – –
Dividends – – – – – – – – –
Payments
Suppliers and employees – – – (43,568) – (43,568) (83,045) (86,367) (88,094)
Finance charges – – – – – – – – –
Dividends paid – – – – – – – – –
Transfers and Grants – – – – – – – – (11,096)
NET CASH FROM/(USED) OPERATING ACTIVITIES – – – – – – 5,846 5,250 (7,504)
CASH FLOWS FROM INVESTING ACTIVITIES
Receipts – – – – – – – – –
Proceeds on disposal of PPE – – – – – – – – –
Decrease (Increase) in non-current debtors – – – – – – – – –
Decrease (increase) other non-current receivables – – – – – – – – –
Decrease (increase) in non-current investments – – – – – – – – –
Payments
Capital assets – – – – – – – – –
NET CASH FROM/(USED) INVESTING ACTIVITIES – – – – – – – – –
CASH FLOWS FROM FINANCING ACTIVITIES
Receipts
Short term loans – – – – – – – – –
Borrowing long term/refinancing – – – – – – – – –
Increase (decrease) in consumer deposits – – – – – – – – –
Payments
Repayment of borrowing – – – – – – – – –
NET CASH FROM/(USED) FINANCING ACTIVITIES – – – – – – – – –
NET INCREASE/ (DECREASE) IN CASH HELD – – – – – – 5,846 5,250 (7,504)
Cash/cash equivalents at the year begin: – – – – – – – 5,846 11,096
Cash/cash equivalents at the year end: – – – – – – 5,846 11,096 3,592
Current Year 2017/18Medium Term Revenue and
Expenditure Framework
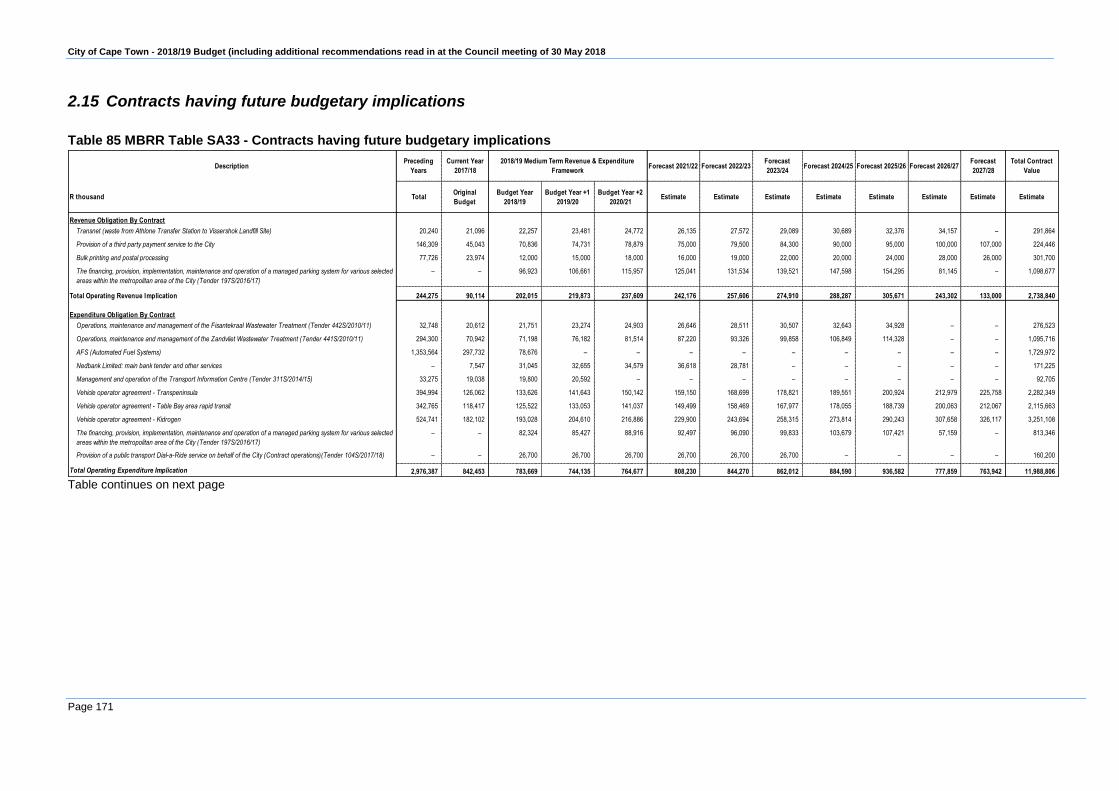
City of Cape Town - 2018/19 Budget (including additional recommendations read in at the Council meeting of 30 May 2018
Page 171
2.15 Contracts having future budgetary implications
Table 85 MBRR Table SA33 - Contracts having future budgetary implications
DescriptionPreceding
Years
Current Year
2017/18Forecast 2021/22 Forecast 2022/23
Forecast
2023/24Forecast 2024/25 Forecast 2025/26 Forecast 2026/27
Forecast
2027/28
Total Contract
Value
R thousand TotalOriginal
Budget
Budget Year
2018/19
Budget Year +1
2019/20
Budget Year +2
2020/21Estimate Estimate Estimate Estimate Estimate Estimate Estimate Estimate
Revenue Obligation By Contract
Transnet (waste from Athlone Transfer Station to Vissershok Landfill Site) 20,240 21,096 22,257 23,481 24,772 26,135 27,572 29,089 30,689 32,376 34,157 – 291,864
Provision of a third party payment service to the City 146,309 45,043 70,836 74,731 78,879 75,000 79,500 84,300 90,000 95,000 100,000 107,000 224,446
Bulk printing and postal processing 77,726 23,974 12,000 15,000 18,000 16,000 19,000 22,000 20,000 24,000 28,000 26,000 301,700
The financing, provision, implementation, maintenance and operation of a managed parking system for various selected
areas within the metropolitan area of the City (Tender 197S/2016/17)
– – 96,923 106,661 115,957 125,041 131,534 139,521 147,598 154,295 81,145 – 1,098,677
Total Operating Revenue Implication 244,275 90,114 202,015 219,873 237,609 242,176 257,606 274,910 288,287 305,671 243,302 133,000 2,738,840
Expenditure Obligation By Contract
Operations, maintenance and management of the Fisantekraal Wastewater Treatment (Tender 442S/2010/11) 32,748 20,612 21,751 23,274 24,903 26,646 28,511 30,507 32,643 34,928 – – 276,523
Operations, maintenance and management of the Zandvliet Wastewater Treatment (Tender 441S/2010/11) 294,300 70,942 71,198 76,182 81,514 87,220 93,326 99,858 106,849 114,328 – – 1,095,716
AFS (Automated Fuel Systems) 1,353,564 297,732 78,676 – – – – – – – – – 1,729,972
Nedbank Limited: main bank tender and other services – 7,547 31,045 32,655 34,579 36,618 28,781 – – – – – 171,225
Management and operation of the Transport Information Centre (Tender 311S/2014/15) 33,275 19,038 19,800 20,592 – – – – – – – – 92,705
Vehicle operator agreement - Transpeninsula 394,994 126,062 133,626 141,643 150,142 159,150 168,699 178,821 189,551 200,924 212,979 225,758 2,282,349
Vehicle operator agreement - Table Bay area rapid transit 342,765 118,417 125,522 133,053 141,037 149,499 158,469 167,977 178,055 188,739 200,063 212,067 2,115,663
Vehicle operator agreement - Kidrogen 524,741 182,102 193,028 204,610 216,886 229,900 243,694 258,315 273,814 290,243 307,658 326,117 3,251,108
The financing, provision, implementation, maintenance and operation of a managed parking system for various selected
areas within the metropolitan area of the City (Tender 197S/2016/17)
– – 82,324 85,427 88,916 92,497 96,090 99,833 103,679 107,421 57,159 – 813,346
Provision of a public transport Dial-a-Ride service on behalf of the City (Contract operations)(Tender 104S/2017/18) – – 26,700 26,700 26,700 26,700 26,700 26,700 – – – – 160,200
Total Operating Expenditure Implication 2,976,387 842,453 783,669 744,135 764,677 808,230 844,270 862,012 884,590 936,582 777,859 763,942 11,988,806
2018/19 Medium Term Revenue & Expenditure
Framework
Table continues on next page

City of Cape Town - 2018/19 Budget (including additional recommendations read in at the Council meeting of 30 May 2018
Page 172
DescriptionPreceding
Years
Current Year
2017/18
Forecast
2021/22
Forecast
2022/23
Forecast
2023/24
Forecast
2024/25
Forecast
2025/26
Forecast
2026/27
Forecast
2027/28
Total Contract
Value
R thousand TotalOriginal
Budget
Budget Year
2018/19
Budget Year
+1 2019/20
Budget Year
+2 2020/21Estimate Estimate Estimate Estimate Estimate Estimate Estimate Estimate
Capital Expenditure Obligation By Contract
Provision of professional services iro the Steenbras pumped storage main plant refurbishment - Aurecon 115 2,500 33,500 4,600 4,600 10,000 101,200 – – – – – 156,515
Increase of scope of work to include Cape Flats Wastewater Treatment Plant: provision of professional services, sludge
dewatering and sludge handling facilities at various wastewater treatment plants (WWTPS) and a mobile sludge
dewatering unit (Tender 141C/2011/12)
65,421 20,000 50,000 19,000 100,000 40,000 30,000 – – – – – 324,421
Appointment of a lead transaction advisor, project administrator and a specialist MFMA consultant to undertake work
related to alternative waste management mechanisms in ISWWS directorate (Tender 215C/2014/15)
2,000 7 40,285 30,000 60,000 104,800 120,000 – – – – – 357,092
1. Construction of new inlet works, pump stations, primary settling tanks and sludge dewatering building at Zandvliet
Wastewater Treatment Works: Civil Works (Tender 84Q/2016/17)
2. Design-build of mechanical and electrical works for the construction of primary treatment and sludge handling
facilities at Zandvliet Wastewater Treatment Works (Tender 85Q/2016/17)
3. Design-build of mechanical and electrical works for the construction of an MBR Plant and bottleneck alleviation at
Zandvliet Wastewater Treatment Works (Tender 178Q/2016/17)
4. Construction of an MBR Plant and bottleneck alleviation at Zandvliet Wastewater Treatment Works: Civil Works
(Tender 179Q/2016/17)
119,392 89,899 230,747 137,300 387,700 237,500 100,000 – – – – – 1,302,537
Philippi collector sewer (Tender 429C/2014/15) 300 3,000 71,810 54,000 41,000 – – – – – – – 170,110
Provision of professional services iro the design, tender documentation of administration, construction and supervision
of civil engineering services for Monwood (Philippi) (Tender 329C/2016/17)
– – 2,923 10,000 46,152 37,581 28,463 – – – – – 125,120
Monwabisi Park UISP phase 1 (Tender DP3042Q/2017/18) – – 2,000 3,500 78,000 73,000 68,000 53,000 77,000 54,000 58,000 – 466,500
Professional services for the preliminary investigation, design, tender documentation, administration and construction
supervision of civil engineering services for the upgrading of Enkanini Informal Settlement, Khayelitsha (Tender
288C/2016/17)
– 5,000 7,381 46,457 64,058 66,318 67,520 70,365 72,199 76,155 – – 475,453
Provision of professional services iro the Steenbras pumped storage main plant refurbishment - Aurecon 4,576 4,650 6,000 7,500 7,274 – – – – – – – 30,000
IRT - provision of professional services iro the design and construction of phase 2A infrastructure: trunk & feeder
(Tender 59C/2014/15)
24,123 33,500 24,000 30,000 – – – – – – – – 111,623
Design, supply, delivery, installation, testing and commissioning of the IRT Fare System, supply and distribution of fare
cards and provision of maintenance and other related services (AFC) (Tender 24G/2009/10)
739,308 30,593 15,000 12,000 – – – – – – – – 796,901
Provision of civil, traffic, geotechnical and electrical engineering services to plan, design and monitor integrated Human
Settlement development within the City (Tender 101C/2016/17)
454 11,074 11,271 14,495 1,858 – – – – – – – 39,151
Total Capital Expenditure Implication 955,688 200,222 494,917 368,852 790,642 569,198 515,184 123,365 149,199 130,155 58,000 – 4,355,423
Total Parent Expenditure Implication 3,932,075 1,042,675 1,278,586 1,112,987 1,555,319 1,377,429 1,359,453 985,377 1,033,789 1,066,737 835,859 763,942 16,344,230
2018/19 Medium Term Revenue &
Expenditure Framework

City of Cape Town - 2018/19 Budget (including additional recommendations read in at the Council meeting of 30 May 2018
Page 173
Table 86 – Projects having future budgetary implications
DescriptionPreceding
Years
Current Year
2017/18
Forecast
2021/22
Forecast
2022/23
Forecast
2023/24Total Contract Value
R thousand Total Adjusted BudgetBudget Year
2018/19
Budget Year +1
2019/20
Budget Year +2
2020/21Estimate Estimate Estimate Estimate
Capital Expenditure Obligation By Project
Information Systems and Technology: Dark Fibre Broadband Infrastructure CPX/0000931 753,994 259,782 253,155 260,155 260,190 222,850 222,850 271,681 2,504,656
Facilities Management: Facilities Management (FM) Structural Rehabilitation CPX/0000924 243,175 13,484 18,330 6,057 2,257 – 5,461 152,462 541,227
Property Management: Upgrading of City Hall C13.00213 27,109 23,010 2,500 5,000 4,100 10,000 – 5,400 77,119
Property Management: Upgrade of Athlone Stadium C14.00035 20,304 7,001 4,900 5,000 10,000 10,000 – 292,795 350,000
Property Management: Basement Parking and Access CPX.0004113 88,630 6,218 8,694 – – – – 17,370 120,912
Solid Waste Management: Purchase of Land Regional Landfill CPX.0003136 – – – 100,000 – – – – 100,000
Solid Waste Management: Development of the Regional Landfill Site CPX.0003137 – – – 1,500 90,000 100,000 – 80,000 271,500
Solid Waste Management: Athlone Refuse Transfer Station (ARTS): Material Recovery Facility / Mechanical
Biological Treatment (MBT)
CPX.0007847 160 600 3,400 20,000 70,000 47,000 – 8,840 150,000
Solid Waste Management: Coastal Park: Design and develop (Material Recovery Facility) CPX.0007910 – 4,000 38,500 103,500 78,000 – – 1,000 225,000
Solid Waste Management: Vissershok South: Landfill Gas Infrastructure to Flaring CPX.0007916 – 1,500 29,000 18,100 21,000 5,000 – 400 75,000
Solid Waste Management: Vissershok North: Design and develop Airs CPX.0007920 157 – 15,000 32,000 – 42,500 – 29,343 119,000
Solid Waste Management: Coastal Park: Design and develop CPX.0007924 728 2,122 3,000 45,000 10,000 25,000 – (0) 85,850
Solid Waste Management: Parow depot Upgrade CPX.0008732 2,865 27,000 6,620 – – – – 17,624 54,109
Solid Waste Management: CPTS: Transfer Station New CPX.0010025 – – – – 2,500 10,000 50,000 – 62,500
Solid Waste Management: Bellville Transfer Station (BTS): Material Recovery Facility / Mechanical Biological
Treatment (MBT)
CPX.0010026 – – – – 5,000 25,000 75,000 – 105,000
Solid Waste Management: Coastal Park: Landfill Gas Infrastructure - Beneficiation CPX.0011067 – 2,600 31,200 – – 35,000 – – 68,800
Solid Waste Management: Material Recovery Facility: Mechanical Biological Treatment (MBT) (Phase 2) CPX.0011068 – – 1,000 30,000 80,000 200,000 200,000 289,000 800,000
Solid Waste Management: New Prince George Drop-off CPX.0008859 47 3,400 26,500 25,000 7,540 – – 513 63,000
Water and Sanitation: Water Supply at Baden Powell Dr to Khayelitsha C12.86082 33 2,000 22,000 56,000 – – – 79,967 160,000
Water and Sanitation: Scottsdene Wastewater Treatment Works (WWTW) C12.86094 6,017 14,969 20,017 18,150 – – – 0 59,153
Water and Sanitation: Melkbos Wastewater Treatment Works (WWTW) -Effluent Disinfection C14.86043 4,700 1,200 12,000 30,000 – – – 11,800 59,700
Water and Sanitation: Wesfleur Wastewater Treatment Works (WWTW) - Capacity Extension C14.86044 3,500 10,000 35,000 20,000 – – – 31,500 100,000
Water and Sanitation: Main Road Clovelly Simonstown CPX.0007405 18,526 9,000 12,000 9,500 20,000 20,000 20,000 129,000 238,026
Water and Sanitation: Paardevlei Development - Bulk Water CPX.0009700 – – – 2,200 17,897 4,000 – 273,153 297,250
Water and Sanitation: Sir Lowry's Pass River Upgrade CPX.0012948 – 39,230 9,000 122,000 47,400 – – – 217,630
Water and Sanitation: Flood Alleviation - Lourens River CPX.0013019 – 10,686 10,000 10,000 15,000 100,000 100,000 – 245,686
Water and Sanitation: Borchards Quarry Wastewater Treatment Works (WWTW) CPX/0000471 176,148 95,500 59,086 63,000 – – – 9,011 402,744
Water and Sanitation: Athlone Wastewater Treatment Works (WWTW) - Capacity Extension-phase 1 CPX/0000479 6,498 6,000 10,000 39,000 128,000 195,000 50,000 337,002 771,500
Water and Sanitation: Bellville Wastewater Treatment Works (WWTW) CPX/0000512 353,328 73,578 113,700 60,000 84,805 – 5,000 0 690,411
Water and Sanitation: Bulk Water Augmentation Scheme CPX/0000524 75,314 47,977 115,500 186,200 254,050 219,000 476,900 1,331,656 2,706,597
2018/19 Medium Term Revenue & Expenditure
FrameworkProject number
Table continues on next page
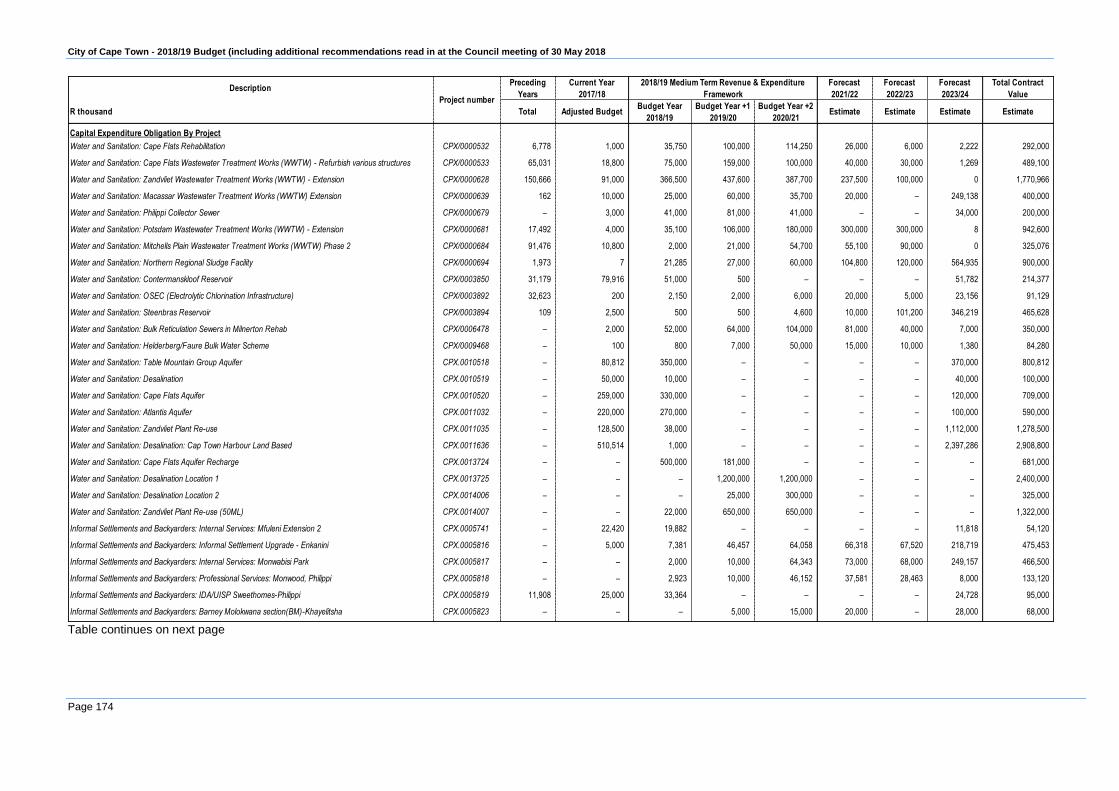
City of Cape Town - 2018/19 Budget (including additional recommendations read in at the Council meeting of 30 May 2018
Page 174
DescriptionPreceding
Years
Current Year
2017/18
Forecast
2021/22
Forecast
2022/23
Forecast
2023/24
Total Contract
Value
R thousand Total Adjusted BudgetBudget Year
2018/19
Budget Year +1
2019/20
Budget Year +2
2020/21Estimate Estimate Estimate Estimate
Capital Expenditure Obligation By Project
Water and Sanitation: Cape Flats Rehabilitation CPX/0000532 6,778 1,000 35,750 100,000 114,250 26,000 6,000 2,222 292,000
Water and Sanitation: Cape Flats Wastewater Treatment Works (WWTW) - Refurbish various structures CPX/0000533 65,031 18,800 75,000 159,000 100,000 40,000 30,000 1,269 489,100
Water and Sanitation: Zandvliet Wastewater Treatment Works (WWTW) - Extension CPX/0000628 150,666 91,000 366,500 437,600 387,700 237,500 100,000 0 1,770,966
Water and Sanitation: Macassar Wastewater Treatment Works (WWTW) Extension CPX/0000639 162 10,000 25,000 60,000 35,700 20,000 – 249,138 400,000
Water and Sanitation: Philippi Collector Sewer CPX/0000679 – 3,000 41,000 81,000 41,000 – – 34,000 200,000
Water and Sanitation: Potsdam Wastewater Treatment Works (WWTW) - Extension CPX/0000681 17,492 4,000 35,100 106,000 180,000 300,000 300,000 8 942,600
Water and Sanitation: Mitchells Plain Wastewater Treatment Works (WWTW) Phase 2 CPX/0000684 91,476 10,800 2,000 21,000 54,700 55,100 90,000 0 325,076
Water and Sanitation: Northern Regional Sludge Facility CPX/0000694 1,973 7 21,285 27,000 60,000 104,800 120,000 564,935 900,000
Water and Sanitation: Contermanskloof Reservoir CPX/0003850 31,179 79,916 51,000 500 – – – 51,782 214,377
Water and Sanitation: OSEC (Electrolytic Chlorination Infrastructure) CPX/0003892 32,623 200 2,150 2,000 6,000 20,000 5,000 23,156 91,129
Water and Sanitation: Steenbras Reservoir CPX/0003894 109 2,500 500 500 4,600 10,000 101,200 346,219 465,628
Water and Sanitation: Bulk Reticulation Sewers in Milnerton Rehab CPX/0006478 – 2,000 52,000 64,000 104,000 81,000 40,000 7,000 350,000
Water and Sanitation: Helderberg/Faure Bulk Water Scheme CPX/0009468 – 100 800 7,000 50,000 15,000 10,000 1,380 84,280
Water and Sanitation: Table Mountain Group Aquifer CPX.0010518 – 80,812 350,000 – – – – 370,000 800,812
Water and Sanitation: Desalination CPX.0010519 – 50,000 10,000 – – – – 40,000 100,000
Water and Sanitation: Cape Flats Aquifer CPX.0010520 – 259,000 330,000 – – – – 120,000 709,000
Water and Sanitation: Atlantis Aquifer CPX.0011032 – 220,000 270,000 – – – – 100,000 590,000
Water and Sanitation: Zandvliet Plant Re-use CPX.0011035 – 128,500 38,000 – – – – 1,112,000 1,278,500
Water and Sanitation: Desalination: Cap Town Harbour Land Based CPX.0011636 – 510,514 1,000 – – – – 2,397,286 2,908,800
Water and Sanitation: Cape Flats Aquifer Recharge CPX.0013724 – – 500,000 181,000 – – – – 681,000
Water and Sanitation: Desalination Location 1 CPX.0013725 – – – 1,200,000 1,200,000 – – – 2,400,000
Water and Sanitation: Desalination Location 2 CPX.0014006 – – – 25,000 300,000 – – – 325,000
Water and Sanitation: Zandvliet Plant Re-use (50ML) CPX.0014007 – – 22,000 650,000 650,000 – – – 1,322,000
Informal Settlements and Backyarders: Internal Services: Mfuleni Extension 2 CPX.0005741 – 22,420 19,882 – – – – 11,818 54,120
Informal Settlements and Backyarders: Informal Settlement Upgrade - Enkanini CPX.0005816 – 5,000 7,381 46,457 64,058 66,318 67,520 218,719 475,453
Informal Settlements and Backyarders: Internal Services: Monwabisi Park CPX.0005817 – – 2,000 10,000 64,343 73,000 68,000 249,157 466,500
Informal Settlements and Backyarders: Professional Services: Monwood, Philippi CPX.0005818 – – 2,923 10,000 46,152 37,581 28,463 8,000 133,120
Informal Settlements and Backyarders: IDA/UISP Sweethomes-Philippi CPX.0005819 11,908 25,000 33,364 – – – – 24,728 95,000
Informal Settlements and Backyarders: Barney Molokwana section(BM)-Khayelitsha CPX.0005823 – – – 5,000 15,000 20,000 – 28,000 68,000
2018/19 Medium Term Revenue & Expenditure
FrameworkProject number
Table continues on next page
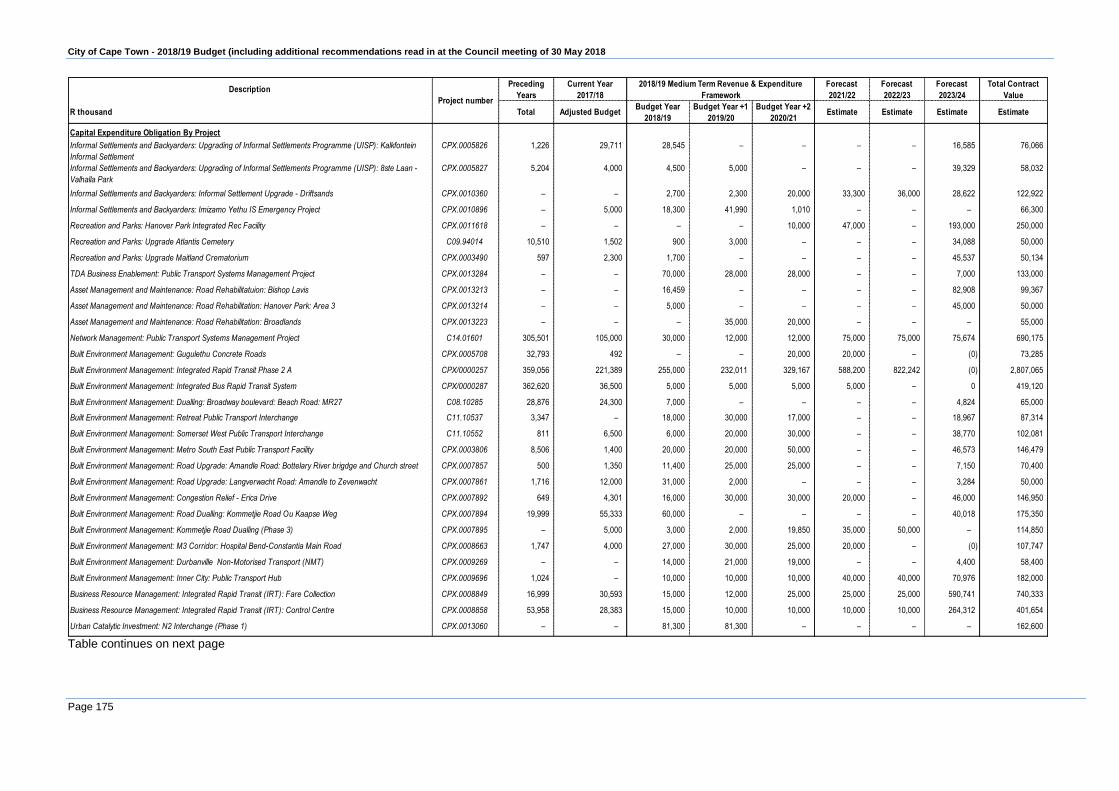
City of Cape Town - 2018/19 Budget (including additional recommendations read in at the Council meeting of 30 May 2018
Page 175
DescriptionPreceding
Years
Current Year
2017/18
Forecast
2021/22
Forecast
2022/23
Forecast
2023/24
Total Contract
Value
R thousand Total Adjusted BudgetBudget Year
2018/19
Budget Year +1
2019/20
Budget Year +2
2020/21Estimate Estimate Estimate Estimate
Capital Expenditure Obligation By Project
Informal Settlements and Backyarders: Upgrading of Informal Settlements Programme (UISP): Kalkfontein
Informal Settlement
CPX.0005826 1,226 29,711 28,545 – – – – 16,585 76,066
Informal Settlements and Backyarders: Upgrading of Informal Settlements Programme (UISP): 8ste Laan -
Valhalla Park
CPX.0005827 5,204 4,000 4,500 5,000 – – – 39,329 58,032
Informal Settlements and Backyarders: Informal Settlement Upgrade - Driftsands CPX.0010360 – – 2,700 2,300 20,000 33,300 36,000 28,622 122,922
Informal Settlements and Backyarders: Imizamo Yethu IS Emergency Project CPX.0010896 – 5,000 18,300 41,990 1,010 – – – 66,300
Recreation and Parks: Hanover Park Integrated Rec Facility CPX.0011618 – – – – 10,000 47,000 – 193,000 250,000
Recreation and Parks: Upgrade Atlantis Cemetery C09.94014 10,510 1,502 900 3,000 – – – 34,088 50,000
Recreation and Parks: Upgrade Maitland Crematorium CPX.0003490 597 2,300 1,700 – – – – 45,537 50,134
TDA Business Enablement: Public Transport Systems Management Project CPX.0013284 – – 70,000 28,000 28,000 – – 7,000 133,000
Asset Management and Maintenance: Road Rehabilitatuion: Bishop Lavis CPX.0013213 – – 16,459 – – – – 82,908 99,367
Asset Management and Maintenance: Road Rehabilitation: Hanover Park: Area 3 CPX.0013214 – – 5,000 – – – – 45,000 50,000
Asset Management and Maintenance: Road Rehabilitation: Broadlands CPX.0013223 – – – 35,000 20,000 – – – 55,000
Network Management: Public Transport Systems Management Project C14.01601 305,501 105,000 30,000 12,000 12,000 75,000 75,000 75,674 690,175
Built Environment Management: Gugulethu Concrete Roads CPX.0005708 32,793 492 – – 20,000 20,000 – (0) 73,285
Built Environment Management: Integrated Rapid Transit Phase 2 A CPX/0000257 359,056 221,389 255,000 232,011 329,167 588,200 822,242 (0) 2,807,065
Built Environment Management: Integrated Bus Rapid Transit System CPX/0000287 362,620 36,500 5,000 5,000 5,000 5,000 – 0 419,120
Built Environment Management: Dualling: Broadway boulevard: Beach Road: MR27 C08.10285 28,876 24,300 7,000 – – – – 4,824 65,000
Built Environment Management: Retreat Public Transport Interchange C11.10537 3,347 – 18,000 30,000 17,000 – – 18,967 87,314
Built Environment Management: Somerset West Public Transport Interchange C11.10552 811 6,500 6,000 20,000 30,000 – – 38,770 102,081
Built Environment Management: Metro South East Public Transport Facility CPX.0003806 8,506 1,400 20,000 20,000 50,000 – – 46,573 146,479
Built Environment Management: Road Upgrade: Amandle Road: Bottelary River brigdge and Church street CPX.0007857 500 1,350 11,400 25,000 25,000 – – 7,150 70,400
Built Environment Management: Road Upgrade: Langverwacht Road: Amandle to Zevenwacht CPX.0007861 1,716 12,000 31,000 2,000 – – – 3,284 50,000
Built Environment Management: Congestion Relief - Erica Drive CPX.0007892 649 4,301 16,000 30,000 30,000 20,000 – 46,000 146,950
Built Environment Management: Road Dualling: Kommetjie Road Ou Kaapse Weg CPX.0007894 19,999 55,333 60,000 – – – – 40,018 175,350
Built Environment Management: Kommetjie Road Dualling (Phase 3) CPX.0007895 – 5,000 3,000 2,000 19,850 35,000 50,000 – 114,850
Built Environment Management: M3 Corridor: Hospital Bend-Constantia Main Road CPX.0008663 1,747 4,000 27,000 30,000 25,000 20,000 – (0) 107,747
Built Environment Management: Durbanville Non-Motorised Transport (NMT) CPX.0009269 – – 14,000 21,000 19,000 – – 4,400 58,400
Built Environment Management: Inner City: Public Transport Hub CPX.0009696 1,024 – 10,000 10,000 10,000 40,000 40,000 70,976 182,000
Business Resource Management: Integrated Rapid Transit (IRT): Fare Collection CPX.0008849 16,999 30,593 15,000 12,000 25,000 25,000 25,000 590,741 740,333
Business Resource Management: Integrated Rapid Transit (IRT): Control Centre CPX.0008858 53,958 28,383 15,000 10,000 10,000 10,000 10,000 264,312 401,654
Urban Catalytic Investment: N2 Interchange (Phase 1) CPX.0013060 – – 81,300 81,300 – – – – 162,600
2018/19 Medium Term Revenue & Expenditure
FrameworkProject number
Table continues on next page

City of Cape Town - 2018/19 Budget (including additional recommendations read in at the Council meeting of 30 May 2018
Page 176
DescriptionPreceding
Years
Current Year
2017/18
Forecast
2021/22
Forecast
2022/23
Forecast
2023/24
Total Contract
Value
R thousand Total Adjusted BudgetBudget Year
2018/19
Budget Year +1
2019/20
Budget Year +2
2020/21Estimate Estimate Estimate Estimate
Capital Expenditure Obligation By Project
Urban Catalytic Investment: R44 Road Upgr: North and South Bound Lanes CPX.0009414 3,500 49,500 – – – – – 102,000
Human Settlement Implementation: Bardale / Fairdale: Development 4000 Units C06.41540 144,160 132 836 – – – – 2,058 147,186
Human Settlement Implementation: Delft - The Hague Housing Project C08.15508 52,947 2,000 2,000 – – – – 5,187 62,134
Human Settlement Implementation: Imizamo Yethu Housing Project (Phase 3) CPX.0003139 772 2,550 22,015 40,500 47,230 15,789 – 65,394 194,250
Human Settlement Implementation: Beacon Valley Housing Project - Mitchell CPX.0005672 – 400 18,000 25,000 42,000 – – 23,302 108,702
New Market Development: Macassar Breaking New Ground Housing Project CPX.0005674 197 250 14,000 21,638 34,350 38,011 – 11,251 119,696
Human Settlement Implementation: Forest Village Housing Project CPX.0009026 25,087 94,729 25,000 – – – – 101,270 246,087
Human Settlement Implementation: Belhar CBD Housing Development CPX.0009027 18,093 14,642 15,000 380 7,056 – – 35,000 90,172
Human Settlement Implementation: Conradie Housing Development CPX.0009028 – – 5,000 85,438 38,095 25,893 7,905 – 162,331
Human Settlement Implementation: Langa Hostels Community Rental Units Project: Special Quarters CPX.0010624 – 300 12,688 58,752 50,000 20,000 – 95,397 237,137
Human Settlement Implementation: Langa Hostels Community Rental Units Project: New Flats CPX.0010625 – 300 6,252 31,767 17,000 – – 23,055 78,374
Human Settlement Implementation: Langa Hostels Community Rental Units Project: Siyahlala CPX.0010626 – 176 5,500 11,240 41,240 6,000 – 71,057 135,214
Human Settlement Implementation: Maroela Housing Project - North CPX.0011088 – – 2,420 3,730 27,535 – – 20,000 53,685
Supply Chain Management: E-Tendering System CPX.0009401 – – 4,000 49,000 24,000 10,000 – – 87,000
Management: Safety and Security: Intergrated Contact Centre CPX.0011057 – – 46,500 33,794 3,000 3,000 – 1 86,295
Electricity Generation and Distribution: Outage Management System C12.84078 43,142 3,600 4,500 2,000 1,500 1,500 1,500 42,258 100,000
Electricity Generation and Distribution: Paardevlei Development - Electricity(Medium Voltage) CPX.0009777 – – – 14,679 113,191 84,512 – 22,618 235,000
Electricity Generation and Distribution: Retreat Depot - Replace for Muizenberg C08.84049 10,432 2,695 43,676 5,637 – – – 40,278 102,717
Electricity Generation and Distribution: Steenbras: Refurbishment of Main Plant C14.84071 5,350 4,650 43,000 302,000 302,000 – – 40,000 697,000
Electricity Generation and Distribution: Supervisory Control and Data Acquisition (SCADA) Master Station
Upgrade
C14.84080 24,773 200 200 200 200 30,000 1,000 38,427 95,000
Electricity Generation and Distribution: Bloemhof Network Control Centre CPX.0001558 12,884 88,567 9,915 – – – – 47,095 158,460
Electricity Generation and Distribution: Grassy Park Main Substation Upgrade CPX.0003579 – 42,098 1,000 – – – – 56,902 100,000
Electricity Generation and Distribution: Oakdale Switching Station Upgrade Phase 3 CPX.0003624 – – 16,000 60,000 120,000 164,000 – 90,000 450,000
Electricity Generation and Distribution: Noordhoek Low Voltage Depot CPX.0004006 1,835 2,736 32,793 – – – – 42,636 80,000
Electricity Generation and Distribution: Bellville South Main Substation Upgrade CPX.0004793 – – – – 38,096 36,849 – 20,055 95,000
Electricity Generation and Distribution: Eastridge Main Substation Upgrade CPX.0004795 – – – – 60,000 – – 20,000 80,000
Electricity Generation and Distribution: Mitchells Plain - Steenbras 132 kilovolt (kV) overhead line (OHL) CPX.0004798 – 120 46,000 – – – – 10,560 56,680
Electricity Generation and Distribution: Paardevlei Development - Electricity (High Voltage) CPX.0007547 – – – 12,200 97,600 12,200 – 178,000 300,000
Electricity Generation and Distribution: Ndabeni: Facilities Rearrangement CPX.0007552 – – – – 90,000 130,000 – 80,000 300,000
Electricity Generation and Distribution: Koeberg Road Switching Station Phase 3 CPX.0009014 – 14,500 35,800 2,243 – – – 27,457 80,000
Electricity Generation and Distribution: Morgen Gronde Switching Station CPX.0012407 – – 7,059 140,541 – – – – 147,600
2018/19 Medium Term Revenue & Expenditure
FrameworkProject number

City of Cape Town - 2018/19 Budget (including additional recommendations read in at the Council meeting of 30 May 2018
Page 177
2.16 Details of expenditure by asset class
Table 87 MBRR Table SA34a - Capital expenditure on new assets by asset class
Description 2014/15 2015/16 2016/17
R thousandAudited
Outcome
Audited
Outcome
Audited
Outcome
Original
Budget
Adjusted
Budget
Full Year
Forecast
Budget Year
2018/19
Budget Year
+1 2019/20
Budget Year
+2 2020/21
Capital expenditure on new assets by Asset Class/Sub-class
Infrastructure 1,576,886 1,778,186 1,992,367 2,671,635 3,385,556 2,285,861 3,597,926 4,663,627 5,061,633
Roads Infrastructure 616,988 665,367 897,860 956,768 648,443 828,293 643,094 705,135 717,212
Roads 616,988 665,367 897,860 956,768 648,443 828,293 643,094 705,135 717,212
Storm water Infrastructure 200 2,803 3,845 124,492 109,122 3,888 94,818 121,371 133,515
Drainage Collection 200 2,803 3,845 124,492 109,122 3,888 94,818 121,371 133,515
Electrical Infrastructure 447,696 509,555 555,112 567,420 488,776 463,321 410,532 568,545 658,971
Power Plants – – 412 – – – – – –
HV Substations 373,581 417,000 471,341 423,065 343,805 370,575 358,032 497,845 563,371
MV Networks 20,561 23,677 19,257 74,600 86,300 45,500 – 8,200 30,600
LV Networks 53,554 68,877 64,102 69,754 58,671 47,246 52,500 62,500 65,000
Water Supply Infrastructure 136,191 143,479 208,170 518,930 1,659,910 689,933 1,291,185 1,677,325 2,041,734
Reservoirs 40,359 75,016 81,564 369,977 806,481 538,448 1,139,450 225,300 321,750
Bulk Mains 31,831 25,162 99,300 32,600 133,634 100,634 52,630 80,000 90,000
Distribution 64,001 43,300 27,306 116,353 209,281 50,851 98,105 147,025 129,984
Sanitation Infrastructure 103,850 205,274 154,686 120,422 240,794 62,489 749,890 1,100,724 895,080
Pump Station 8,045 – – – – – – – –
Reticulation 95,505 193,874 151,686 114,415 111,087 61,283 156,605 212,724 182,080
Waste Water Treatment Works 300 1,400 3,000 6,007 129,707 1,207 593,285 888,000 713,000
Outfall Sewers – 10,000 – – – – – – –
Solid Waste Infrastructure 138,914 68,991 41,370 194,077 80,929 74,854 168,000 290,100 417,140
Landfill Sites 138,914 68,991 41,370 194,077 80,929 74,854 168,000 290,100 417,140
Information and Communication Infrastructure 133,046 182,718 131,324 189,528 157,583 163,082 240,406 200,427 197,980
Data Centres 133,046 182,718 131,324 189,528 157,583 163,082 240,406 200,427 197,980
Community Assets 118,178 210,769 135,831 273,094 232,407 237,749 303,007 208,624 164,952
Community Facilities 116,047 209,143 135,821 272,744 231,164 236,506 302,827 208,624 164,952
Halls – 40 – – – – – – –
Centres 5,492 4,923 – 30,181 – – 2,030 33,000 33,000
Clinics/Care Centres 8,133 13,217 25,620 41,168 36,722 33,572 49,435 19,296 30,170
Fire/Ambulance Stations – 2,000 3,905 24,436 12,660 12,660 19,436 – –
Testing Stations – 3,000 – 1,345 1,345 1,345 – – –
Museums – – – 3,000 500 500 2,500 – –
Libraries 33,562 17,534 11,634 23,410 19,746 19,746 9,505 7,375 2,375
Cemeteries/Crematoria 752 4,502 9,961 20,500 13,536 10,959 20,500 13,400 –
Public Open Space 4,969 8,091 1,982 820 832 831 220 – 100
Nature Reserves 5,685 11,412 8,984 14,843 14,423 15,093 3,701 10,707 5,907
Public Ablution Facilities 406 – – – – – – – –
Taxi Ranks/Bus Terminals 57,047 144,424 73,735 113,040 131,400 141,800 195,500 124,846 93,400
Sport and Recreation Facilities 2,131 1,626 10 350 1,243 1,243 180 – –
Indoor Facilities – 19 – – – – – – –
Outdoor Facilities 2,131 1,607 10 350 1,243 1,243 180 – –
Investment properties – – 81 – – – – – –
Revenue Generating – – 81 – – – – – –
Improved Property – – 81 – – – – – –
Other assets 59,728 145,465 220,198 282,558 215,686 219,251 220,527 196,066 171,290
Operational Buildings 45,365 100,642 216,943 216,517 202,058 205,799 166,287 68,007 51,250
Municipal Offices 22,278 44,470 172,453 186,517 162,893 161,865 26,337 16,370 5,250
Training Centres – – – – 400 400 – – –
Depots 23,087 56,173 44,490 30,000 38,765 43,534 139,950 51,637 46,000
Housing 14,364 44,823 3,255 66,041 13,628 13,452 54,240 128,060 120,040
Social Housing 14,364 44,823 3,255 66,041 13,628 13,452 54,240 128,060 120,040
Intangible Assets – 495 500 2,000 9,792 4,090 16,765 63,075 34,965
Licences and Rights – 495 500 2,000 9,792 4,090 16,765 63,075 34,965
Computer Software and Applications – 495 500 2,000 9,792 4,090 16,765 63,075 34,965
Computer Equipment 71,679 122,051 144,155 207,103 237,458 228,897 105,987 132,906 90,794
Computer Equipment 71,679 122,051 144,155 207,103 237,458 228,897 105,987 132,906 90,794
Furniture and Office Equipment 252,027 306,688 133,346 78,378 129,573 132,338 123,168 87,355 72,637
Furniture and Office Equipment 252,027 306,688 133,346 78,378 129,573 132,338 123,168 87,355 72,637
Machinery and Equipment 42,245 97,819 152,897 128,188 132,851 135,006 34,547 30,900 35,841
Machinery and Equipment 42,245 97,819 152,897 128,188 132,851 135,006 34,547 30,900 35,841
Transport Assets 349,210 105,449 62,793 51,970 193,141 193,117 108,906 51,544 37,284
Transport Assets 349,210 105,449 62,793 51,970 193,141 193,117 108,906 51,544 37,284
Land 416,784 53,319 164,323 69,570 1,700 1,950 208,000 110,000 –
Land 416,784 53,319 164,323 69,570 1,700 1,950 208,000 110,000 –
Zoo's, Marine and Non-biological Animals – – – – – – – – –
Total Capital Expenditure on new assets 2,886,738 2,820,243 3,006,491 3,764,497 4,538,164 3,438,260 4,718,832 5,544,098 5,669,396
Current Year 2017/182018/19 Medium Term Revenue &
Expenditure Framework
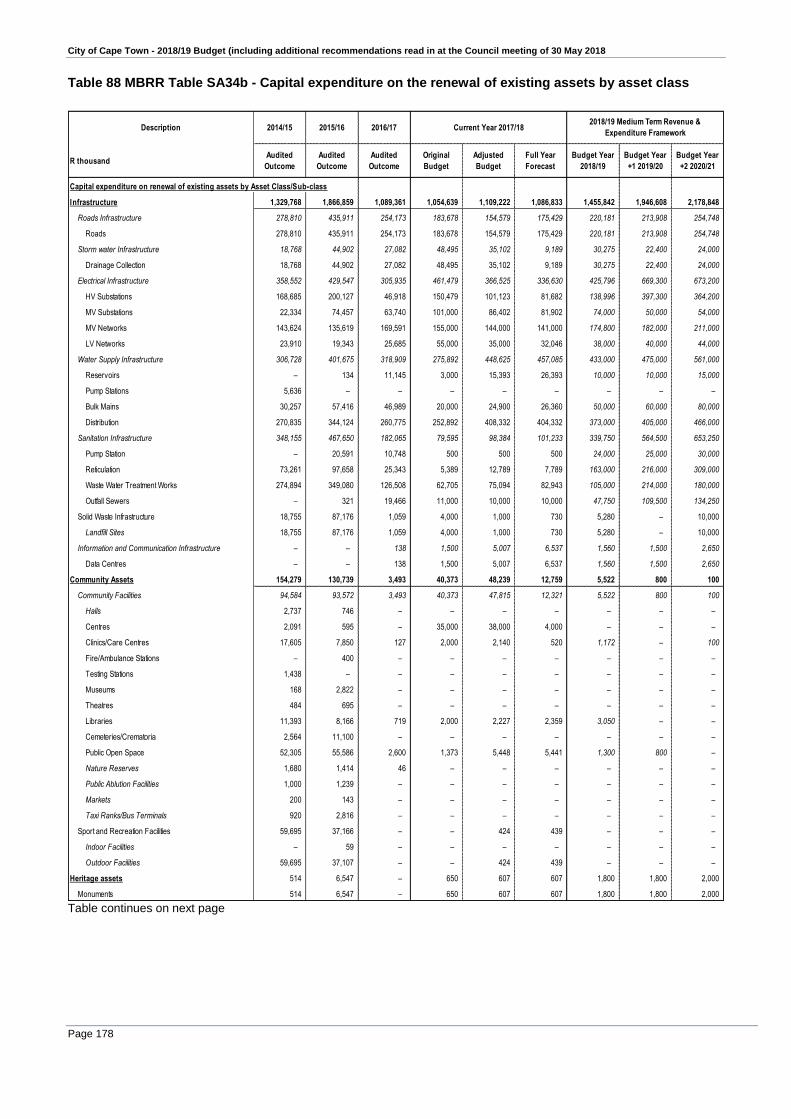
City of Cape Town - 2018/19 Budget (including additional recommendations read in at the Council meeting of 30 May 2018
Page 178
Table 88 MBRR Table SA34b - Capital expenditure on the renewal of existing assets by asset class
Description 2014/15 2015/16 2016/17
R thousandAudited
Outcome
Audited
Outcome
Audited
Outcome
Original
Budget
Adjusted
Budget
Full Year
Forecast
Budget Year
2018/19
Budget Year
+1 2019/20
Budget Year
+2 2020/21
Capital expenditure on renewal of existing assets by Asset Class/Sub-class
Infrastructure 1,329,768 1,866,859 1,089,361 1,054,639 1,109,222 1,086,833 1,455,842 1,946,608 2,178,848
Roads Infrastructure 278,810 435,911 254,173 183,678 154,579 175,429 220,181 213,908 254,748
Roads 278,810 435,911 254,173 183,678 154,579 175,429 220,181 213,908 254,748
Storm water Infrastructure 18,768 44,902 27,082 48,495 35,102 9,189 30,275 22,400 24,000
Drainage Collection 18,768 44,902 27,082 48,495 35,102 9,189 30,275 22,400 24,000
Electrical Infrastructure 358,552 429,547 305,935 461,479 366,525 336,630 425,796 669,300 673,200
HV Substations 168,685 200,127 46,918 150,479 101,123 81,682 138,996 397,300 364,200
MV Substations 22,334 74,457 63,740 101,000 86,402 81,902 74,000 50,000 54,000
MV Networks 143,624 135,619 169,591 155,000 144,000 141,000 174,800 182,000 211,000
LV Networks 23,910 19,343 25,685 55,000 35,000 32,046 38,000 40,000 44,000
Water Supply Infrastructure 306,728 401,675 318,909 275,892 448,625 457,085 433,000 475,000 561,000
Reservoirs – 134 11,145 3,000 15,393 26,393 10,000 10,000 15,000
Pump Stations 5,636 – – – – – – – –
Bulk Mains 30,257 57,416 46,989 20,000 24,900 26,360 50,000 60,000 80,000
Distribution 270,835 344,124 260,775 252,892 408,332 404,332 373,000 405,000 466,000
Sanitation Infrastructure 348,155 467,650 182,065 79,595 98,384 101,233 339,750 564,500 653,250
Pump Station – 20,591 10,748 500 500 500 24,000 25,000 30,000
Reticulation 73,261 97,658 25,343 5,389 12,789 7,789 163,000 216,000 309,000
Waste Water Treatment Works 274,894 349,080 126,508 62,705 75,094 82,943 105,000 214,000 180,000
Outfall Sewers – 321 19,466 11,000 10,000 10,000 47,750 109,500 134,250
Solid Waste Infrastructure 18,755 87,176 1,059 4,000 1,000 730 5,280 – 10,000
Landfill Sites 18,755 87,176 1,059 4,000 1,000 730 5,280 – 10,000
Information and Communication Infrastructure – – 138 1,500 5,007 6,537 1,560 1,500 2,650
Data Centres – – 138 1,500 5,007 6,537 1,560 1,500 2,650
Community Assets 154,279 130,739 3,493 40,373 48,239 12,759 5,522 800 100
Community Facilities 94,584 93,572 3,493 40,373 47,815 12,321 5,522 800 100
Halls 2,737 746 – – – – – – –
Centres 2,091 595 – 35,000 38,000 4,000 – – –
Clinics/Care Centres 17,605 7,850 127 2,000 2,140 520 1,172 – 100
Fire/Ambulance Stations – 400 – – – – – – –
Testing Stations 1,438 – – – – – – – –
Museums 168 2,822 – – – – – – –
Theatres 484 695 – – – – – – –
Libraries 11,393 8,166 719 2,000 2,227 2,359 3,050 – –
Cemeteries/Crematoria 2,564 11,100 – – – – – – –
Public Open Space 52,305 55,586 2,600 1,373 5,448 5,441 1,300 800 –
Nature Reserves 1,680 1,414 46 – – – – – –
Public Ablution Facilities 1,000 1,239 – – – – – – –
Markets 200 143 – – – – – – –
Taxi Ranks/Bus Terminals 920 2,816 – – – – – – –
Sport and Recreation Facilities 59,695 37,166 – – 424 439 – – –
Indoor Facilities – 59 – – – – – – –
Outdoor Facilities 59,695 37,107 – – 424 439 – – –
Heritage assets 514 6,547 – 650 607 607 1,800 1,800 2,000
Monuments 514 6,547 – 650 607 607 1,800 1,800 2,000
Current Year 2017/182018/19 Medium Term Revenue &
Expenditure Framework
Table continues on next page
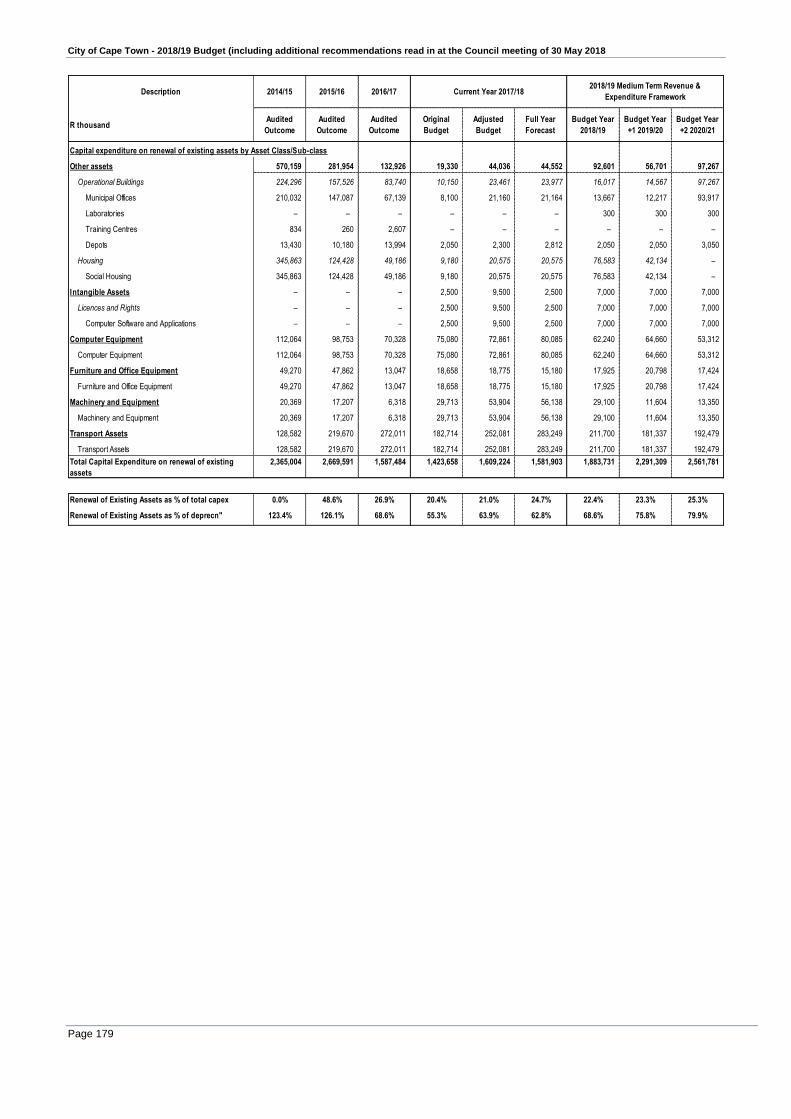
City of Cape Town - 2018/19 Budget (including additional recommendations read in at the Council meeting of 30 May 2018
Page 179
Description 2014/15 2015/16 2016/17
R thousandAudited
Outcome
Audited
Outcome
Audited
Outcome
Original
Budget
Adjusted
Budget
Full Year
Forecast
Budget Year
2018/19
Budget Year
+1 2019/20
Budget Year
+2 2020/21
Capital expenditure on renewal of existing assets by Asset Class/Sub-class
Other assets 570,159 281,954 132,926 19,330 44,036 44,552 92,601 56,701 97,267
Operational Buildings 224,296 157,526 83,740 10,150 23,461 23,977 16,017 14,567 97,267
Municipal Offices 210,032 147,087 67,139 8,100 21,160 21,164 13,667 12,217 93,917
Laboratories – – – – – – 300 300 300
Training Centres 834 260 2,607 – – – – – –
Depots 13,430 10,180 13,994 2,050 2,300 2,812 2,050 2,050 3,050
Housing 345,863 124,428 49,186 9,180 20,575 20,575 76,583 42,134 –
Social Housing 345,863 124,428 49,186 9,180 20,575 20,575 76,583 42,134 –
Intangible Assets – – – 2,500 9,500 2,500 7,000 7,000 7,000
Licences and Rights – – – 2,500 9,500 2,500 7,000 7,000 7,000
Computer Software and Applications – – – 2,500 9,500 2,500 7,000 7,000 7,000
Computer Equipment 112,064 98,753 70,328 75,080 72,861 80,085 62,240 64,660 53,312
Computer Equipment 112,064 98,753 70,328 75,080 72,861 80,085 62,240 64,660 53,312
Furniture and Office Equipment 49,270 47,862 13,047 18,658 18,775 15,180 17,925 20,798 17,424
Furniture and Office Equipment 49,270 47,862 13,047 18,658 18,775 15,180 17,925 20,798 17,424
Machinery and Equipment 20,369 17,207 6,318 29,713 53,904 56,138 29,100 11,604 13,350
Machinery and Equipment 20,369 17,207 6,318 29,713 53,904 56,138 29,100 11,604 13,350
Transport Assets 128,582 219,670 272,011 182,714 252,081 283,249 211,700 181,337 192,479
Transport Assets 128,582 219,670 272,011 182,714 252,081 283,249 211,700 181,337 192,479
Total Capital Expenditure on renewal of existing
assets
2,365,004 2,669,591 1,587,484 1,423,658 1,609,224 1,581,903 1,883,731 2,291,309 2,561,781
Renewal of Existing Assets as % of total capex 0.0% 48.6% 26.9% 20.4% 21.0% 24.7% 22.4% 23.3% 25.3%
Renewal of Existing Assets as % of deprecn" 123.4% 126.1% 68.6% 55.3% 63.9% 62.8% 68.6% 75.8% 79.9%
Current Year 2017/182018/19 Medium Term Revenue &
Expenditure Framework

City of Cape Town - 2018/19 Budget (including additional recommendations read in at the Council meeting of 30 May 2018
Page 180
Table 89 MBRR Table SA34c - Repairs and maintenance expenditure by asset class
Description 2014/15 2015/16 2016/17
R thousandAudited
Outcome
Audited
Outcome
Audited
Outcome
Original
Budget
Adjusted
Budget
Full Year
Forecast
Budget Year
2018/19
Budget Year
+1 2019/20
Budget Year
+2 2020/21
Repairs and maintenance expenditure by Asset Class/Sub-class
Infrastructure 1,962,562 1,988,379 2,045,722 2,031,486 1,926,297 1,900,997 2,161,718 2,363,252 2,573,715
Roads Infrastructure 690,603 592,642 609,310 664,923 656,419 631,419 671,164 700,536 746,421
Roads 690,603 592,642 609,310 664,923 656,419 631,419 671,164 700,536 746,421
Storm water Infrastructure – – – – – – – – –
Drainage Collection – – – – – – – – –
Electrical Infrastructure 467,531 512,940 504,116 523,507 503,480 503,180 536,787 571,679 609,122
Power Plants 17,103 17,460 21,805 18,788 18,788 18,788 22,646 24,118 25,698
HV Substations 35,135 37,971 32,077 27,853 27,614 27,914 31,262 33,294 35,475
MV Substations 307,714 353,055 364,116 366,551 360,425 360,425 393,574 419,157 446,611
LV Networks 107,579 104,453 86,118 110,315 96,653 96,053 89,305 95,109 101,339
Water Supply Infrastructure 413,630 455,983 482,019 421,887 396,382 396,382 548,620 621,440 698,473
Reservoirs 32,343 36,365 35,896 41,336 42,371 42,371 50,545 88,991 133,281
Pump Stations 14,558 26,140 31,692 46,444 49,424 49,424 71,014 75,630 80,584
Water Treatment Works 38,655 40,514 36,683 33,966 34,097 34,097 55,046 58,623 62,464
Bulk Mains 47,402 49,382 41,830 12,716 12,716 12,716 19,943 21,240 22,630
Distribution 280,674 303,581 335,918 287,425 257,774 257,774 352,072 376,957 399,515
Sanitation Infrastructure 389,040 424,040 447,780 418,866 366,166 366,166 401,043 465,225 515,041
Reticulation 292,241 319,399 326,001 291,490 238,851 238,851 270,041 312,234 358,463
Waste Water Treatment Works 86,873 94,675 114,517 116,402 116,341 116,341 119,560 140,805 143,594
Outfall Sewers 9,925 9,965 7,262 10,973 10,973 10,973 11,443 12,186 12,985
Solid Waste Infrastructure 1,758 2,774 2,497 2,303 3,850 3,850 4,104 4,371 4,657
Landfill Sites 1,758 2,774 2,497 2,303 3,850 3,850 4,104 4,371 4,657
Community Assets 319,312 386,517 496,931 548,047 485,537 487,337 344,806 367,068 391,126
Community Facilities 78,026 85,482 115,109 100,442 94,820 96,620 100,533 106,908 113,912
Halls 26,374 29,766 48,752 25,417 33,811 35,611 37,591 40,033 42,655
Centres 4,079 7,539 7,603 6,322 5,945 5,945 6,647 7,079 7,543
Clinics/Care Centres 8,681 9,511 13,326 5,921 5,919 5,919 6,494 6,917 7,369
Fire/Ambulance Stations 1,909 2,872 2,244 2,477 1,364 1,364 2,712 2,888 3,077
Testing Stations – – – – – – – – –
Libraries 17,751 14,301 16,349 32,362 20,569 20,569 24,857 26,473 28,206
Cemeteries/Crematoria 8,691 9,310 13,433 16,860 16,203 16,203 10,589 11,278 12,016
Public Open Space – – – – – – – – –
Nature Reserves 3,873 3,923 4,936 4,180 4,500 4,500 4,722 4,870 5,193
Public Ablution Facilities 6,595 7,469 7,701 6,657 6,262 6,262 6,657 7,090 7,554
Markets 74 792 765 248 248 248 264 281 300
Sport and Recreation Facilities 241,286 301,035 381,822 447,605 390,717 390,717 244,273 260,160 277,215
Indoor Facilities 182 49 1,331 5 5 5 5 6 6
Outdoor Facilities 241,104 300,986 380,490 447,600 390,712 390,712 244,268 260,154 277,208
Heritage assets 986 461 1,647 1,812 1,811 1,811 1,928 2,053 2,188
Works of Art 986 461 1,647 1,812 1,811 1,811 1,928 2,053 2,188
Investment properties 11,083 26,566 19,001 19,800 12,877 12,888 20,710 22,057 23,501
Revenue Generating 11,083 26,566 19,001 19,800 136 148 16 17 18
Improved Property 49 66 259 64 136 148 16 17 18
Non-revenue Generating – – – – 12,740 12,740 20,694 22,040 23,483
Unimproved Property – – – – 12,740 12,740 20,694 22,040 23,483
Current Year 2017/182018/19 Medium Term Revenue &
Expenditure Framework
Table continues on next page

City of Cape Town - 2018/19 Budget (including additional recommendations read in at the Council meeting of 30 May 2018
Page 181
Description 2014/15 2015/16 2016/17
R thousandAudited
Outcome
Audited
Outcome
Audited
Outcome
Original
Budget
Adjusted
Budget
Full Year
Forecast
Budget Year
2018/19
Budget Year
+1 2019/20
Budget Year
+2 2020/21
Other assets 77,511 89,710 140,548 144,517 144,999 150,183 177,353 185,650 199,609
Operational Buildings 77,511 89,710 140,548 144,517 144,999 150,183 177,353 185,650 199,609
Municipal Offices 75,490 87,508 138,744 139,025 139,684 144,867 172,345 180,316 193,926
Laboratories 1,904 2,031 1,340 1,391 1,659 1,659 1,930 2,056 2,190
Training Centres 73 166 424 624 180 180 273 290 309
Depots 44 5 40 3,477 3,477 3,477 2,805 2,987 3,183
Housing – – – – – – – – –
Social Housing – – – – – – – – –
Computer Equipment 117,859 144,340 179,935 312,785 258,652 258,662 269,549 277,899 296,120
Computer Equipment 117,859 144,340 179,935 312,785 258,652 258,662 269,549 277,899 296,120
Furniture and Office Equipment 360,714 354,833 424,463 504,006 502,156 508,910 551,321 587,095 625,455
Furniture and Office Equipment 360,714 354,833 424,463 504,006 502,156 508,910 551,321 587,095 625,455
Machinery and Equipment – – – – – – – – –
Machinery and Equipment – – – – – – – – –
Transport Assets 153,131 348,190 453,049 471,840 421,385 446,385 447,079 476,172 507,387
Transport Assets 153,131 348,190 453,049 471,840 421,385 446,385 447,079 476,172 507,387
Total Repairs and Maintenance Expenditure 3,003,158 3,338,995 3,761,297 4,034,293 3,753,714 3,767,172 3,974,465 4,281,247 4,619,102
R&M as a % of PPE 9.0% 9.1% 9.3% 9.0% 8.3% 8.3% 0.0% 8.5% 8.1%
R&M as % Operating Expenditure 11.0% 10.9% 11.4% 10.8% 10.3% 10.3% 0.0% 10.9% 10.6%
Current Year 2017/182018/19 Medium Term Revenue &
Expenditure Framework

City of Cape Town - 2018/19 Budget (including additional recommendations read in at the Council meeting of 30 May 2018
Page 182
Table 90 MBRR Table SA34d Depreciation by asset class
Description 2014/15 2015/16 2016/17
R thousandAudited
Outcome
Audited
Outcome
Audited
Outcome
Original
Budget
Adjusted
Budget
Full Year
Forecast
Budget Year
2018/19
Budget Year +1
2019/20
Budget Year +2
2020/21
Depreciation by Asset Class/Sub-class
Infrastructure 913,086 899,066 596,055 1,154,472 1,096,523 1,096,523 1,264,113 1,471,442 1,657,444
Roads Infrastructure 262,069 289,523 190,264 370,548 311,058 311,058 355,019 392,293 429,117
Roads 262,069 289,523 190,264 370,548 311,058 311,058 355,019 392,293 429,117
Storm water Infrastructure 31,452 34,550 – 45,940 43,937 43,937 53,592 52,794 53,620
Drainage Collection 31,452 34,550 – 45,940 43,937 43,937 53,592 52,794 53,620
Electrical Infrastructure 164,231 175,039 187,775 215,517 221,110 221,110 251,637 277,363 305,227
Power Plants 6,946 6,946 5,712 6,951 6,957 6,957 6,955 6,955 6,955
HV Substations 143,712 15,652 55,440 28,971 19,611 19,611 38,916 50,179 63,525
MV Substations – 32,073 116,780 36,656 42,661 42,661 44,658 46,302 47,414
MV Switching Stations 13,573 – – – – – – – –
MV Networks – 77,624 – 91,791 95,998 95,998 100,809 104,693 108,920
LV Networks – 42,744 9,844 51,147 55,883 55,883 60,299 69,233 78,414
Water Supply Infrastructure 295,920 156,288 107,575 209,628 203,579 203,579 263,049 389,234 440,975
Reservoirs 15,784 17,712 13,467 18,982 21,247 21,247 39,651 131,795 144,726
Pump Stations 2,911 2,911 1,879 3,015 4,850 4,850 4,776 4,736 4,602
Water Treatment Works 115,503 23,047 1,369 24,216 26,152 26,152 26,143 26,136 26,128
Bulk Mains 144,258 10,025 303 19,301 11,732 11,732 20,747 25,879 32,879
Distribution 17,465 102,592 90,557 144,114 139,598 139,598 171,732 200,688 232,640
Sanitation Infrastructure – 182,290 106,372 229,208 227,698 227,698 257,283 265,210 333,299
Pump Station – 3,618 – 7,336 4,151 4,151 7,239 8,269 10,330
Reticulation – 112,942 38,517 141,227 135,829 135,829 153,806 155,258 164,384
Waste Water Treatment Works – 62,922 67,350 78,017 79,206 79,206 87,779 93,247 150,181
Outfall Sewers – 2,809 505 2,628 8,512 8,512 8,460 8,437 8,403
Solid Waste Infrastructure 98,861 50,032 2,925 58,352 57,179 57,179 48,690 50,240 50,097
Landfill Sites 49,706 50,032 2,925 58,352 57,179 57,179 48,690 50,240 50,097
Waste Drop-off Points 49,155 – – – – – – – –
Rail Infrastructure 60,552 – 1,143 – – – – – –
Drainage Collection 60,552 – 1,143 – – – – – –
Information and Communication Infrastructure – 11,344 – 25,281 31,963 31,963 34,843 44,309 45,109
Data Centres – 11,344 – 25,281 31,963 31,963 34,843 44,309 45,109
Community Assets 366,621 299,983 297,765 313,120 316,116 316,116 323,437 327,696 331,354
Community Facilities 164,489 83,704 60,318 95,023 98,224 98,224 104,930 113,749 124,273
Halls 5,825 1,872 12,170 2,167 2,668 2,668 2,678 2,718 2,718
Centres 11,871 3,465 7,300 3,934 3,669 3,669 4,512 4,553 4,758
Clinics/Care Centres 3,544 4,591 3,385 5,447 5,732 5,732 5,953 8,004 9,481
Fire/Ambulance Stations 1,683 1,684 5,543 1,687 1,794 1,794 2,086 2,635 2,635
Testing Stations – 926 – 1,056 1,071 1,071 1,141 1,141 1,141
Museums 77 100 (19) 166 192 192 226 376 376
Theatres – 47 – 51 47 47 48 48 48
Libraries 3,466 3,732 24,100 5,262 5,358 5,358 5,616 6,198 6,458
Cemeteries/Crematoria 2,525 2,674 5,710 3,663 3,235 3,235 3,585 4,460 6,373
Public Open Space 21,460 10,708 – 14,025 13,563 13,563 15,663 18,491 19,895
Nature Reserves – 360 1,395 576 378 378 1,090 1,592 1,895
Public Ablution Facilities 19,501 1,737 744 1,845 1,870 1,870 2,359 2,358 2,358
Markets 2,323 2,706 (9) 1,498 1,499 1,499 1,501 1,501 1,501
Airports – 4 – 4 4 4 4 4 4
Taxi Ranks/Bus Terminals 82,240 49,097 – 53,643 57,141 57,141 58,467 59,668 64,630
Sport and Recreation Facilities 202,132 216,279 237,447 218,096 217,892 217,892 218,506 213,948 207,081
Indoor Facilities 4,080 8,633 168 8,649 8,959 8,959 8,959 8,959 8,959
Outdoor Facilities 198,052 207,646 237,279 209,447 208,933 208,933 209,547 204,988 198,122
Current Year 2017/182018/19 Medium Term Revenue & Expenditure
Framework
Table continues on next page
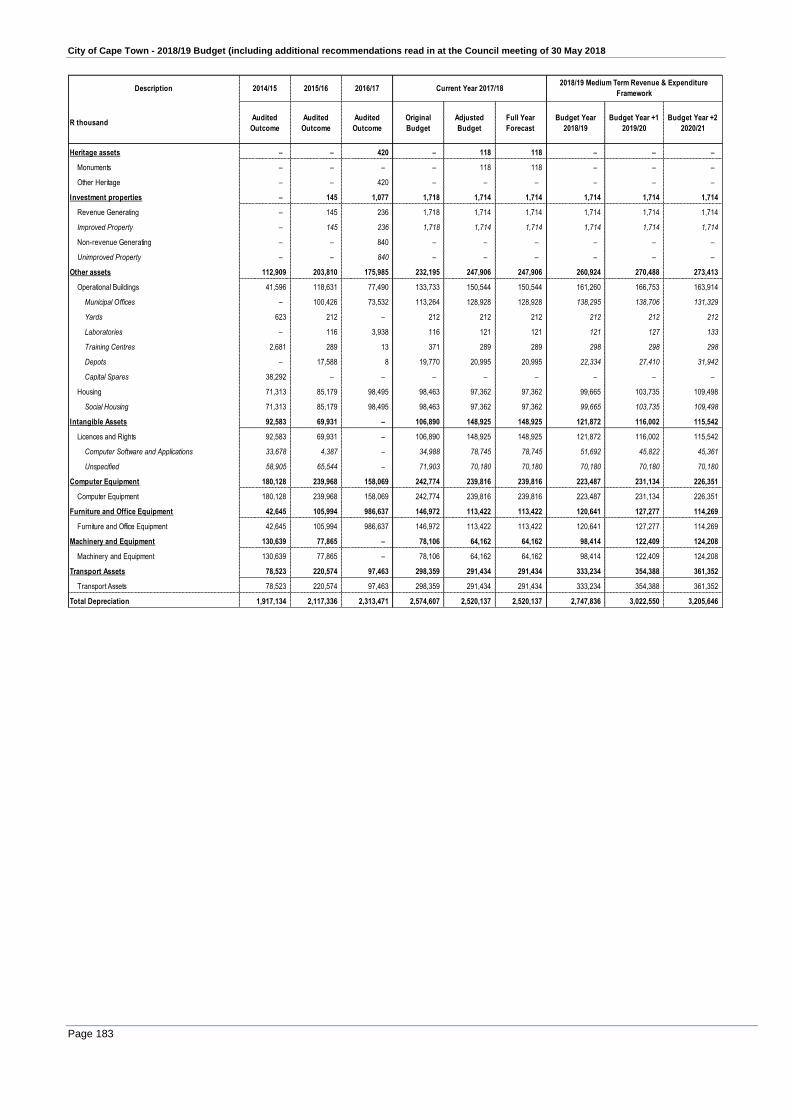
City of Cape Town - 2018/19 Budget (including additional recommendations read in at the Council meeting of 30 May 2018
Page 183
Description 2014/15 2015/16 2016/17
R thousandAudited
Outcome
Audited
Outcome
Audited
Outcome
Original
Budget
Adjusted
Budget
Full Year
Forecast
Budget Year
2018/19
Budget Year +1
2019/20
Budget Year +2
2020/21
Heritage assets – – 420 – 118 118 – – –
Monuments – – – – 118 118 – – –
Other Heritage – – 420 – – – – – –
Investment properties – 145 1,077 1,718 1,714 1,714 1,714 1,714 1,714
Revenue Generating – 145 236 1,718 1,714 1,714 1,714 1,714 1,714
Improved Property – 145 236 1,718 1,714 1,714 1,714 1,714 1,714
Non-revenue Generating – – 840 – – – – – –
Unimproved Property – – 840 – – – – – –
Other assets 112,909 203,810 175,985 232,195 247,906 247,906 260,924 270,488 273,413
Operational Buildings 41,596 118,631 77,490 133,733 150,544 150,544 161,260 166,753 163,914
Municipal Offices – 100,426 73,532 113,264 128,928 128,928 138,295 138,706 131,329
Yards 623 212 – 212 212 212 212 212 212
Laboratories – 116 3,938 116 121 121 121 127 133
Training Centres 2,681 289 13 371 289 289 298 298 298
Depots – 17,588 8 19,770 20,995 20,995 22,334 27,410 31,942
Capital Spares 38,292 – – – – – – – –
Housing 71,313 85,179 98,495 98,463 97,362 97,362 99,665 103,735 109,498
Social Housing 71,313 85,179 98,495 98,463 97,362 97,362 99,665 103,735 109,498
Intangible Assets 92,583 69,931 – 106,890 148,925 148,925 121,872 116,002 115,542
Licences and Rights 92,583 69,931 – 106,890 148,925 148,925 121,872 116,002 115,542
Computer Software and Applications 33,678 4,387 – 34,988 78,745 78,745 51,692 45,822 45,361
Unspecified 58,905 65,544 – 71,903 70,180 70,180 70,180 70,180 70,180
Computer Equipment 180,128 239,968 158,069 242,774 239,816 239,816 223,487 231,134 226,351
Computer Equipment 180,128 239,968 158,069 242,774 239,816 239,816 223,487 231,134 226,351
Furniture and Office Equipment 42,645 105,994 986,637 146,972 113,422 113,422 120,641 127,277 114,269
Furniture and Office Equipment 42,645 105,994 986,637 146,972 113,422 113,422 120,641 127,277 114,269
Machinery and Equipment 130,639 77,865 – 78,106 64,162 64,162 98,414 122,409 124,208
Machinery and Equipment 130,639 77,865 – 78,106 64,162 64,162 98,414 122,409 124,208
Transport Assets 78,523 220,574 97,463 298,359 291,434 291,434 333,234 354,388 361,352
Transport Assets 78,523 220,574 97,463 298,359 291,434 291,434 333,234 354,388 361,352
Total Depreciation 1,917,134 2,117,336 2,313,471 2,574,607 2,520,137 2,520,137 2,747,836 3,022,550 3,205,646
Current Year 2017/182018/19 Medium Term Revenue & Expenditure
Framework

City of Cape Town - 2018/19 Budget (including additional recommendations read in at the Council meeting of 30 May 2018
Page 184
Table 91 MBRR Table SA34e Capital expenditure on the upgrading of existing assets by asset class
Description 2016/17
R thousandAudited
Outcome
Original
Budget
Adjusted
Budget
Full Year
Forecast
Budget Year
2018/19
Budget Year +1
2019/20
Budget Year +2
2020/21
Capital expenditure on upgrading of existing assets by Asset Class/Sub-class
Infrastructure 859,151 1,019,065 912,774 830,129 1,247,944 1,454,202 1,453,408
Roads Infrastructure 270,595 292,589 253,066 241,689 303,053 210,632 239,813
Roads 270,595 292,589 253,066 241,689 303,053 210,632 239,813
Storm water Infrastructure 25,054 12,925 45,169 1,562 9,200 122,000 47,400
Drainage Collection 25,054 12,925 45,169 1,562 9,200 122,000 47,400
Electrical Infrastructure 208,812 86,976 114,663 113,220 142,738 145,693 232,196
HV Substations 208,812 86,976 114,663 113,220 62,338 65,293 218,796
LV Networks – – – – 80,400 80,400 13,400
Water Supply Infrastructure 52,702 106,645 97,690 93,514 36,575 37,500 25,000
Reservoirs 5,346 48,730 7,154 7,054 16,575 12,500 5,000
Distribution 47,356 57,915 90,536 86,460 20,000 25,000 20,000
Sanitation Infrastructure 288,558 494,930 376,653 367,769 674,202 846,750 875,905
Pump Station 21,495 12,000 19,680 19,680 – – –
Reticulation 57,533 69,255 82,026 71,500 7,800 12,000 –
Waste Water Treatment Works 209,530 413,675 274,946 276,589 666,402 834,750 875,905
Outfall Sewers – – – – – – –
Solid Waste Infrastructure 10,933 25,000 25,533 12,374 82,176 91,628 32,742
Landfill Sites 10,933 25,000 25,533 12,374 82,176 91,628 32,742
Information and Communication Infrastructure 2,497 – – – – – 351
Data Centres 2,497 – – – – – 351
Community Assets 205,578 218,543 187,586 186,308 238,230 186,653 177,453
Community Facilities 148,344 164,694 142,999 135,301 198,803 165,922 107,185
Halls 811 3,020 3,227 3,227 1,680 – –
Centres 1,247 8,234 4,534 4,417 8,550 11,800 5,000
Clinics/Care Centres 7,090 14,921 11,660 10,460 34,654 33,900 33,950
Fire/Ambulance Stations 4,442 1,700 – – 7,970 – –
Testing Stations 1,647 2,141 2,141 2,141 – – 2,141
Museums 3,182 3,000 3,700 2,700 2,500 – –
Theatres 133 – 67 67 – – –
Libraries 4,942 7,060 6,799 5,639 8,675 26,594 3,594
Cemeteries/Crematoria 7,749 3,200 11,855 8,493 12,800 16,000 2,000
Public Open Space 87,594 66,118 69,549 71,814 52,625 19,115 32,400
Nature Reserves 343 60 60 60 11,490 1,513 –
Public Ablution Facilities 22,990 16,000 23,010 23,010 2,500 5,000 4,100
Markets 307 80 88 88 – – –
Taxi Ranks/Bus Terminals 5,867 39,160 6,308 3,185 55,360 52,000 24,000
Sport and Recreation Facilities 57,234 53,849 44,587 51,007 39,427 20,731 70,269
Outdoor Facilities 57,234 53,849 44,587 51,007 38,467 17,731 41,209
Heritage assets 38,955 6,800 7,530 7,530 – – –
Monuments 38,955 6,800 7,530 7,530 – – –
Current Year 2017/182018/19 Medium Term Revenue & Expenditure
Framework
Table continues on next page
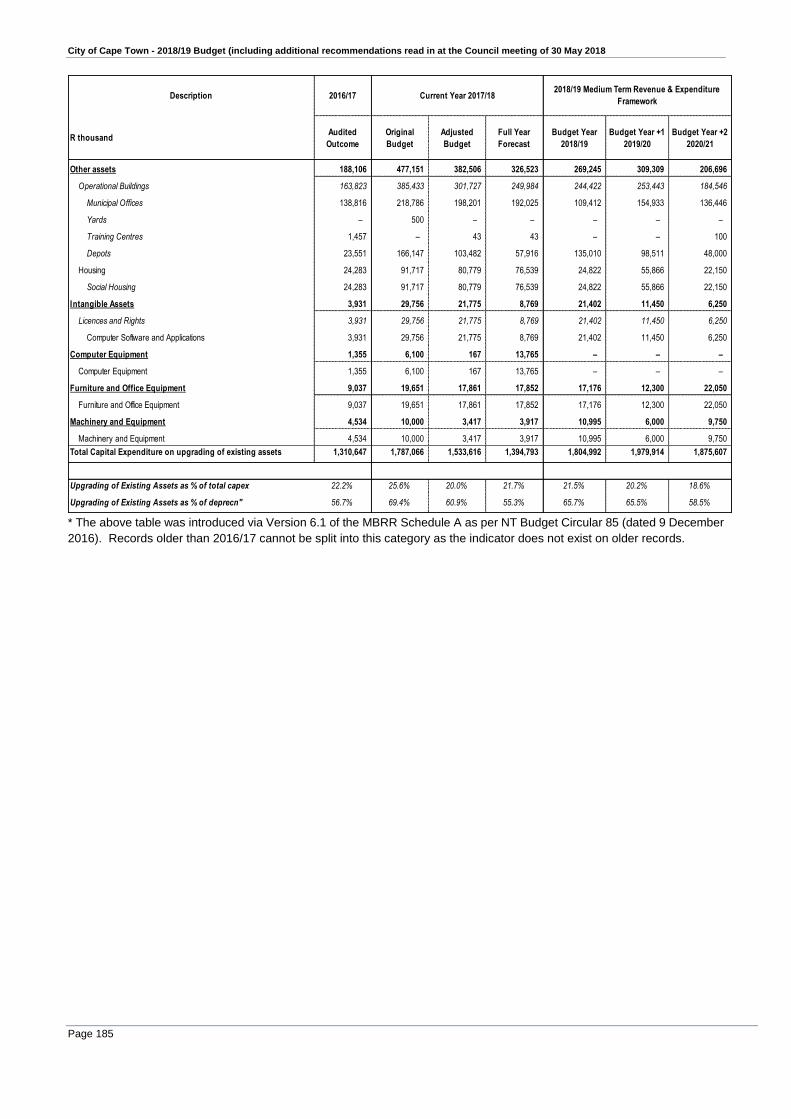
City of Cape Town - 2018/19 Budget (including additional recommendations read in at the Council meeting of 30 May 2018
Page 185
Description 2016/17
R thousandAudited
Outcome
Original
Budget
Adjusted
Budget
Full Year
Forecast
Budget Year
2018/19
Budget Year +1
2019/20
Budget Year +2
2020/21
Other assets 188,106 477,151 382,506 326,523 269,245 309,309 206,696
Operational Buildings 163,823 385,433 301,727 249,984 244,422 253,443 184,546
Municipal Offices 138,816 218,786 198,201 192,025 109,412 154,933 136,446
Yards – 500 – – – – –
Training Centres 1,457 – 43 43 – – 100
Depots 23,551 166,147 103,482 57,916 135,010 98,511 48,000
Housing 24,283 91,717 80,779 76,539 24,822 55,866 22,150
Social Housing 24,283 91,717 80,779 76,539 24,822 55,866 22,150
Intangible Assets 3,931 29,756 21,775 8,769 21,402 11,450 6,250
Licences and Rights 3,931 29,756 21,775 8,769 21,402 11,450 6,250
Computer Software and Applications 3,931 29,756 21,775 8,769 21,402 11,450 6,250
Computer Equipment 1,355 6,100 167 13,765 – – –
Computer Equipment 1,355 6,100 167 13,765 – – –
Furniture and Office Equipment 9,037 19,651 17,861 17,852 17,176 12,300 22,050
Furniture and Office Equipment 9,037 19,651 17,861 17,852 17,176 12,300 22,050
Machinery and Equipment 4,534 10,000 3,417 3,917 10,995 6,000 9,750
Machinery and Equipment 4,534 10,000 3,417 3,917 10,995 6,000 9,750
Total Capital Expenditure on upgrading of existing assets 1,310,647 1,787,066 1,533,616 1,394,793 1,804,992 1,979,914 1,875,607
Upgrading of Existing Assets as % of total capex 22.2% 25.6% 20.0% 21.7% 21.5% 20.2% 18.6%
Upgrading of Existing Assets as % of deprecn" 56.7% 69.4% 60.9% 55.3% 65.7% 65.5% 58.5%
Current Year 2017/182018/19 Medium Term Revenue & Expenditure
Framework
* The above table was introduced via Version 6.1 of the MBRR Schedule A as per NT Budget Circular 85 (dated 9 December
2016). Records older than 2016/17 cannot be split into this category as the indicator does not exist on older records.

City of Cape Town - 2018/19 Budget (including additional recommendations read in at the Council meeting of 30 May 2018
Page 186
2.17 Details of capital expenditure
Table 92 MBRR Table SA35 - Future financial implication of the capital budget
Vote Description
R thousand
Budget Year
2018/19
Budget Year +1
2019/20
Budget Year +2
2020/21
Forecast
2021/22
Forecast
2022/23
Forecast
2023/24
Present
value
Capital expenditure
Vote 1 - Area-Based Service Delivery 13,110 82,870 74,870 51,990 – – –
Vote 2 - Assets & Facilities Management 413,287 301,701 91,372 257,729 227,562 – –
Vote 3 - City Manager 735 735 760 222 299 – –
Vote 4 - Corporate Services 354,597 342,571 336,546 295,206 295,109 – –
Vote 5 - Energy 1,113,506 1,427,000 1,741,137 1,558,971 1,322,339 – –
Vote 6 - Finance 20,549 65,419 35,411 23,661 12,301 – –
Vote 7 - Informal Settlements, Water & Waste Services 4,206,581 5,681,026 5,968,036 6,119,530 5,985,035 – –
Vote 8 - Safety & Security 196,078 79,515 42,115 46,027 33,386 – –
Vote 9 - Social Services 315,508 238,127 215,704 356,207 185,509 – –
Vote 10 - Transport & Urban Development Authority 1,773,606 1,596,358 1,600,833 2,376 2,633 – –
Total Capital Expenditure 8,407,556 9,815,321 10,106,785 10,887,304 9,980,179 – –
Future operational costs by vote
Vote 1 - Area-Based Service Delivery 13,608 15,582 18,173 19,538 20,311 21,487 –
Vote 2 - Assets & Facilities Management 335,096 408,326 474,803 512,340 552,057 597,031 –
Vote 3 - City Manager 183 183 194 209 225 242 –
Vote 4 - Corporate Services 310,240 389,061 438,152 474,388 513,685 455,866 –
Vote 5 - Energy 384,434 418,843 451,795 456,192 478,453 512,305 –
Vote 6 - Finance 598,293 766,571 919,451 1,001,641 1,091,278 1,189,044 –
Vote 7 - Informal Settlements, Water & Waste Services 1,969,213 2,126,612 1,274,119 1,381,488 1,360,437 1,383,182 –
Vote 8 - Safety & Security 673,843 938,621 1,166,429 1,272,752 1,389,578 1,512,824 –
Vote 9 - Social Services 192,641 219,092 228,590 240,762 258,088 272,817 –
Vote 10 - Transport & Urban Development Authority 68,949 94,187 115,112 125,665 137,194 149,790 –
Total future operational costs 5,477,355 5,670,371 6,226,619 6,693,970 7,097,728 7,489,485 –
Future revenue by source
Property rates – – – – – – –
Service charges - electricity revenue – – – – – – –
Service charges - water revenue – – – – – – –
Service charges - sanitation revenue – – – – – – –
Service charges - refuse revenue – – – – – – –
Service charges - other – – – – – – –
Rental of facilities and equipment – – – – – – –
Total future revenue – – – – – – –
Net Financial Implications 13,884,911 15,485,692 16,333,403 17,581,274 17,077,906 7,489,485 –
2018/19 Medium Term Revenue & Expenditure
FrameworkForecasts

City of Cape Town - 2018/19 Budget (including additional recommendations read in at the Council meeting of 30 May 2018
Page 187
Table 93 MBRR Table SA37 - Projects delayed from previous financial year/s
R thousand
FunctionOriginal
Budget
Full Year
Forecast
Budget Year
2018/19
Budget Year
+1 2019/20
Budget Year
+2 2020/21
Assets and Facilities Management Facilities Management: Corporate headquarters (CHQ) Ablution
Facilities Upgrade
CPX.0007950 Upgrade 09 04 1.1 Operational Buildings Municipal Offices Corp Inf 18.5250189 -34.1411561 2017/18 16,280 230 6,648 – –
Assets and Facilities Management Facilities Management: Corporate headquarters (CHQ) New
entrance
CPX.0007951 Upgrade 09 04 1.1 Operational Buildings Municipal Offices Corp Inf 18.4282124 -33.9207513 2017/18 3,220 – 2,644 – –
Corporate Services Information Systems and Technology: Core and local fibre routes CPX.0007936 New 06 03 1.2 Information and Communication
Infrastructure
Data Centres Citywide 18.5250189 -34.1411561 2017/18 100,054 57,397 5,406 – –
Corporate Services Information Systems and Technology: High-site upgrades and
new infrastructur
CPX.0007939 New 06 03 1.2 Information and Communication
Infrastructure
Data Centres Citywide 18.5250189 -34.1411561 2017/18 10,913 775 13,577 – –
Energy Electricity Generation and Distribution: 66kV overhead line (OHL)
Refurb (shield/earth wires)
C08.84051 Renewal 09 04 5.1 Electrical Infrastructure HV Substations Citywide 18.658105 -33.9017093 2017/18 1,400 40 1,400 – –
Energy Electricity Generation and Distribution: Blue Downs Streetlighting
Depot
C14.84072 New 09 04 5.1 Operational Buildings Depots 17 18.7024922 -34.0087059 2017/18 22,535 47 28,105 – –
Energy Electricity Generation and Distribution: Grassy Park Main
Substation Upgrade
CPX.0003579 Upgrade 06 03 5.1 Electrical Infrastructure HV Substations 65 18.5037753 -34.0330035 2017/18 48,500 40,917 1,000 – –
Energy Electricity Generation and Distribution: Hout Bay LV Depot C13.84075 New 09 04 5.1 Operational Buildings Depots 74 18.3443717 -34.0539782 2017/18 22,003 3,401 28,169 – –
Energy Electricity Generation and Distribution: Mitchells Plain -
Steenbras 132 kV overhead line (OHL)
CPX.0004798 New 06 03 5.1 Electrical Infrastructure HV Substations Citywide 18.5250189 -34.1411561 2017/18 10,685 0 46,000 – –
Energy Electricity Generation and Distribution: New water supply system:
Steenbras
CPX.0007507 New 06 02 5.1 Electrical Infrastructure HV Substations 100 18.8967752 -34.1528389 2017/18 5,600 480 2,600 – –
Energy Electricity Generation and Distribution: Newfields Transformer
Replacement
CPX.0009507 Renewal 06 03 5.1 Electrical Infrastructure HV Substations 46 18.537812 -33.9879948 2017/18 32,024 28,885 1,496 – –
Energy Electricity Generation and Distribution: Noordhoek LV Depot CPX.0004006 New 09 04 5.1 Electrical Infrastructure HV Substations 64 18.4101318 -34.125418 2017/18 25,987 1,240 32,793 – –
Energy Electricity Generation and Distribution: Steenbras: Reline Steel
Penstock
C15.84070 Renewal 06 02 5.1 Electrical Infrastructure HV Substations 100 18.9009 -34.1590199 2017/18 2,500 – 15,000 – –
Finance Supply Chain Management: E-Tendering System CPX.0009401 New 09 04 5.1 Licences and Rights Computer Software and
Applications
Corp Inf 18.5250189 -34.1411561 2017/18 2,000 – 2,000 – –
Informal Settlements, Water and
Waste Services
Informal Settlements and Backyarders: Backyard Water
Dispensing and Management
CPX.0007285 New 08 01 3.2 Various Various Citywide 18.5250189 -34.1411561 2017/18 15,242 10,313 10,242 – –
Informal Settlements, Water and
Waste Services
Informal Settlements and Backyarders: IDA/UISP Sweethomes-
Philippi
CPX.0005819 New 08 01 3.2 Various Various 33 18.5624822 -34.007469 2017/18 35,000 25,000 33,364 – –
Informal Settlements, Water and
Waste Services
Informal Settlements and Backyarders: UISP: Kalkfontein
Informal Settlement
CPX.0005826 New 08 01 3.2 Various Various 19 18.6633148 -33.9460298 2017/18 38,000 26,211 28,545 – –
Informal Settlements, Water and
Waste Services
Solid Waste Management: Hillstar Workshop Upgrade CPX.0008734 Upgrade 06 01 3.1 Operational Buildings Depots 63 18.5008064 -34.007691 2017/18 15,600 2,000 4,200 – –
Informal Settlements, Water and
Waste Services
Solid Waste Management: Maitland Specialised Equip Depot
Upgrade
CPX.0008733 Upgrade 06 01 3.1 Operational Buildings Depots 53 18.488551 -33.9319191 2017/18 32,500 4,500 11,500 – –
Informal Settlements, Water and
Waste Services
Solid Waste Management: New Prince George Drop-off CPX.0008859 New 06 03 1.1 Solid Waste Infrastructure Landfill Sites 66 18.4923304 -34.0367383 2017/18 12,300 5,300 16,500 – –
Informal Settlements, Water and
Waste Services
Solid Waste Management: Parow depot Upgrade CPX.0008732 Upgrade 06 01 3.1 Operational Buildings Depots 2 18.5779928 -33.8936905 2017/18 36,206 3,000 6,620 – –
Informal Settlements, Water and
Waste Services
Solid Waste Management: Schaapkraal Depot Upgrade CPX.0008984 Upgrade 06 01 3.1 Operational Buildings Depots 43 18.5338673 -34.0364913 2017/18 5,640 1,000 4,800 – –
Informal Settlements, Water and
Waste Services
Solid Waste Management: Vissershok South:Refurbishment of
herita
CPX.0007919 Renewal 06 03 1.1 Solid Waste Infrastructure Landfill Sites 104 18.5435116 -33.7775477 2017/18 4,000 730 5,280 – –
Informal Settlements, Water and
Waste Services
Water and Sanitation: Digtebij sewer Installation CPX.0009389 Renewal 06 03 1.1 Sanitation Infrastructure Reticulation 8 18.6748848 -33.9197662 2017/18 1,600 – 1,600 – –
Informal Settlements, Water and
Waste Services
Water and Sanitation: Network Replacement: Gugulethu 150mm
(D5,7&8)
CPX.0008011 Renewal 06 03 1.1 Water Supply Infrastructure Distribution 42 18.5250189 -34.1411561 2017/18 10,000 3,340 4,000 – –
Informal Settlements, Water and
Waste Services
Water and Sanitation: Wesfleur Wastewater Treatment Works
(WWTW) - Capacity Extension
C14.86044 Upgrade 06 03 1.1 Sanitation Infrastructure Waste Water Treatment Works 29 18.47994 -33.5630671 2017/18 20,000 10,000 35,000 – –
Previous target
year to
complete
Current Year 2017/182018/19 Medium Term Revenue &
Expenditure FrameworkProject name Project number Type
MTSF
Service
Outcome
IUDF Asset Class Asset Sub-ClassWard
Location
GPS
Longitude
GPS
Lattitude
Own
Strategic
Objectives
Table continues on next page
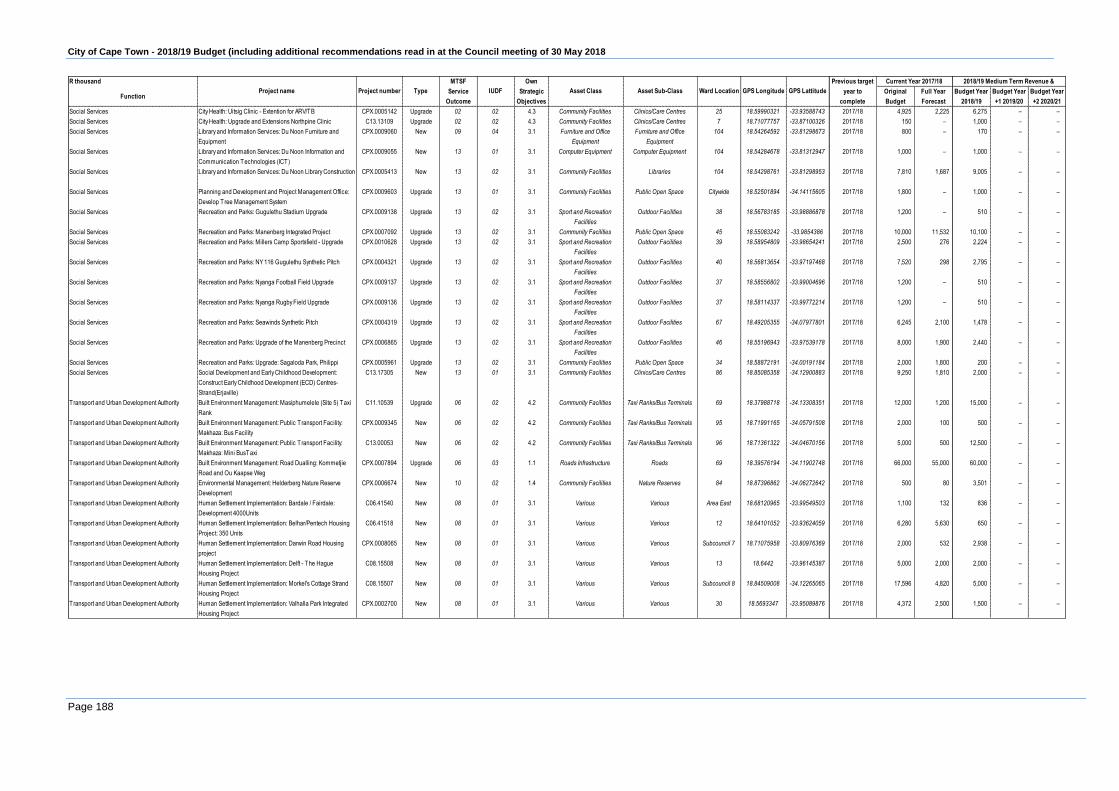
City of Cape Town - 2018/19 Budget (including additional recommendations read in at the Council meeting of 30 May 2018
Page 188
R thousand
FunctionOriginal
Budget
Full Year
Forecast
Budget Year
2018/19
Budget Year
+1 2019/20
Budget Year
+2 2020/21
Social Services City Health: Uitsig Clinic - Extention for ARV/TB CPX.0005142 Upgrade 02 02 4.3 Community Facilities Clinics/Care Centres 25 18.59990321 -33.93588743 2017/18 4,925 2,225 6,275 – –
Social Services City Health: Upgrade and Extensions Northpine Clinic C13.13109 Upgrade 02 02 4.3 Community Facilities Clinics/Care Centres 7 18.71077757 -33.87100326 2017/18 150 – 1,000 – –
Social Services Library and Information Services: Du Noon Furniture and
Equipment
CPX.0009060 New 09 04 3.1 Furniture and Office
Equipment
Furniture and Office
Equipment
104 18.54264592 -33.81298673 2017/18 800 – 170 – –
Social Services Library and Information Services: Du Noon Information and
Communication Technologies (ICT)
CPX.0009055 New 13 01 3.1 Computer Equipment Computer Equipment 104 18.54284678 -33.81312947 2017/18 1,000 – 1,000 – –
Social Services Library and Information Services: Du Noon Library Construction CPX.0005413 New 13 02 3.1 Community Facilities Libraries 104 18.54298761 -33.81298953 2017/18 7,810 1,687 9,005 – –
Social Services Planning and Development and Project Management Office:
Develop Tree Management System
CPX.0009603 Upgrade 13 01 3.1 Community Facilities Public Open Space Citywide 18.52501894 -34.14115605 2017/18 1,800 – 1,000 – –
Social Services Recreation and Parks: Gugulethu Stadium Upgrade CPX.0009138 Upgrade 13 02 3.1 Sport and Recreation
Facilities
Outdoor Facilities 38 18.56783185 -33.98886878 2017/18 1,200 – 510 – –
Social Services Recreation and Parks: Manenberg Integrated Project CPX.0007092 Upgrade 13 02 3.1 Community Facilities Public Open Space 45 18.55083242 -33.9854386 2017/18 10,000 11,532 10,100 – –
Social Services Recreation and Parks: Millers Camp Sportsfield - Upgrade CPX.0010628 Upgrade 13 02 3.1 Sport and Recreation
Facilities
Outdoor Facilities 39 18.58954809 -33.98654241 2017/18 2,500 276 2,224 – –
Social Services Recreation and Parks: NY 116 Gugulethu Synthetic Pitch CPX.0004321 Upgrade 13 02 3.1 Sport and Recreation
Facilities
Outdoor Facilities 40 18.56813654 -33.97197468 2017/18 7,520 298 2,795 – –
Social Services Recreation and Parks: Nyanga Football Field Upgrade CPX.0009137 Upgrade 13 02 3.1 Sport and Recreation
Facilities
Outdoor Facilities 37 18.58556802 -33.99004696 2017/18 1,200 – 510 – –
Social Services Recreation and Parks: Nyanga Rugby Field Upgrade CPX.0009136 Upgrade 13 02 3.1 Sport and Recreation
Facilities
Outdoor Facilities 37 18.58114337 -33.99772214 2017/18 1,200 – 510 – –
Social Services Recreation and Parks: Seawinds Synthetic Pitch CPX.0004319 Upgrade 13 02 3.1 Sport and Recreation
Facilities
Outdoor Facilities 67 18.49205355 -34.07977801 2017/18 6,245 2,100 1,478 – –
Social Services Recreation and Parks: Upgrade of the Manenberg Precinct CPX.0006865 Upgrade 13 02 3.1 Sport and Recreation
Facilities
Outdoor Facilities 46 18.55196943 -33.97539178 2017/18 8,000 1,900 2,440 – –
Social Services Recreation and Parks: Upgrade: Sagaloda Park, Philippi CPX.0005961 Upgrade 13 02 3.1 Community Facilities Public Open Space 34 18.58872191 -34.00191184 2017/18 2,000 1,800 200 – –
Social Services Social Development and Early Childhood Development:
Construct Early Childhood Development (ECD) Centres-
Strand(Erjaville)
C13.17305 New 13 01 3.1 Community Facilities Clinics/Care Centres 86 18.85085358 -34.12900883 2017/18 9,250 1,810 2,000 – –
T ransport and Urban Development Authority Built Environment Management: Masiphumelele (Site 5) Taxi
Rank
C11.10539 Upgrade 06 02 4.2 Community Facilities Taxi Ranks/Bus Terminals 69 18.37988718 -34.13308351 2017/18 12,000 1,200 15,000 – –
T ransport and Urban Development Authority Built Environment Management: Public Transport Facility:
Makhaza: Bus Facility
CPX.0009345 New 06 02 4.2 Community Facilities Taxi Ranks/Bus Terminals 95 18.71991165 -34.05791508 2017/18 2,000 100 500 – –
T ransport and Urban Development Authority Built Environment Management: Public Transport Facility:
Makhaza: Mini BusTaxi
C13.00053 New 06 02 4.2 Community Facilities Taxi Ranks/Bus Terminals 96 18.71361322 -34.04670156 2017/18 5,000 500 12,500 – –
T ransport and Urban Development Authority Built Environment Management: Road Dualling: Kommetjie
Road and Ou Kaapse Weg
CPX.0007894 Upgrade 06 03 1.1 Roads Infrastructure Roads 69 18.39576194 -34.11902748 2017/18 66,000 55,000 60,000 – –
T ransport and Urban Development Authority Environmental Management: Helderberg Nature Reserve
Development
CPX.0006674 New 10 02 1.4 Community Facilities Nature Reserves 84 18.87396862 -34.06272642 2017/18 500 80 3,501 – –
T ransport and Urban Development Authority Human Settlement Implementation: Bardale / Fairdale:
Development 4000Units
C06.41540 New 08 01 3.1 Various Various Area East 18.68120965 -33.99549503 2017/18 1,100 132 836 – –
T ransport and Urban Development Authority Human Settlement Implementation: Belhar/Pentech Housing
Project: 350 Units
C06.41518 New 08 01 3.1 Various Various 12 18.64101052 -33.93624059 2017/18 6,280 5,630 650 – –
T ransport and Urban Development Authority Human Settlement Implementation: Darwin Road Housing
project
CPX.0008065 New 08 01 3.1 Various Various Subcouncil 7 18.71075958 -33.80976369 2017/18 2,000 532 2,938 – –
T ransport and Urban Development Authority Human Settlement Implementation: Delft - The Hague
Housing Project
C08.15508 New 08 01 3.1 Various Various 13 18.6442 -33.96145387 2017/18 5,000 2,000 2,000 – –
T ransport and Urban Development Authority Human Settlement Implementation: Morkel's Cottage Strand
Housing Project
C08.15507 New 08 01 3.1 Various Various Subcouncil 8 18.84509008 -34.12265065 2017/18 17,596 4,820 5,000 – –
T ransport and Urban Development Authority Human Settlement Implementation: Valhalla Park Integrated
Housing Project
CPX.0002700 New 08 01 3.1 Various Various 30 18.5693347 -33.95089876 2017/18 4,372 2,500 1,500 – –
Own
Strategic
Objectives
Project name Project number Type
MTSF
Service
Outcome
IUDF
Current Year 2017/18 2018/19 Medium Term Revenue &
Asset Class Asset Sub-Class Ward Location GPS Longitude GPS Lattitude
Previous target
year to
complete

City of Cape Town - 2018/19 Budget (including additional recommendations read in at the Council meeting of 30 May 2018
Page 189
2.18 Legislation compliance status
Compliance with the MFMA implementation requirements has been substantially adhered to through the following activities:
Budget and Treasury Office A budget office and Treasury office was established in accordance with the MFMA.
Budgeting The annual budget is prepared in accordance with the requirements prescribed by National Treasury, MFMA, MBRR and mSCOA regulations.
In Year Reporting Fully compliant with regards to monthly and quarterly MBRR reporting to National Treasury.
Annual Report The annual report is prepared in accordance with the MFMA and National Treasury requirements.
Municipal Entities The City currently has only two entities i.e. the Cape Town International Convention Centre (CTICC) and the Cape Town Stadium (CTS).
Internship Programme
The CFO has introduced an organised professional training and work experience program (Finance
Graduate Development Program or FGDP) intended to standardise the current diverse training
options by providing training and exposure to qualifying officials and/or suitably qualified external
applicants and/or suitably qualified bursars (Bachelor of Commerce or equivalent degree), who
meet the criteria and who are aspiring to become local government accountants subject to a
recruitment and selection process. The National Treasury Municipal Finance Management
Internship Programme (NTMFMIP) has been merged with the FGDP. The City is funding five of
the interns on the FGDP, whilst NT is funding an additional three interns. All the interns that were
previously on the NTMFIP have been appointed within the City.

City of Cape Town - 2018/19 Budget (including additional recommendations read in at the Council meeting of 30 May 2018
Page 190
2.19 Other supporting documents
Table 94 MBRR Table SA1 - Supporting detail to budgeted financial performance
2014/15 2015/16 2016/17
R thousand
REVENUE ITEMS:
Property rates
Total Property Rates 7,178,381 7,916,322 9,332,946 9,959,921 9,972,855 9,972,855 10,765,882 11,787,353 12,805,777
less Revenue Foregone (exemptions, reductions and rebates and impermissable
values in excess of section 17 of MPRA)
1,159,647 1,171,275 1,227,820 1,297,571 1,277,924 1,277,924 1,403,930 1,539,066 1,674,064
Net Property Rates 6,018,735 6,745,047 8,105,126 8,662,350 8,694,931 8,694,931 9,361,952 10,248,287 11,131,713
Service charges - electricity revenue
Total Service charges - electricity revenue 10,131,675 11,380,039 11,924,252 12,024,300 12,024,259 12,024,259 12,752,041 13,679,733 15,025,877
less Revenue Foregone (in excess of 50 kwh per indigent household per month) – – – – –
less Cost of Free Basis Services (50 kwh per indigent household per
month)
149,860 177,255 160,638 81,713 81,713 81,713 160,638 160,638 160,638
Net Service charges - electricity revenue 9,981,814 11,202,784 11,763,615 11,942,587 11,942,546 11,942,546 12,591,403 13,519,095 14,865,239
Service charges - water revenue
Total Service charges - water revenue 2,537,826 3,203,133 3,831,925 4,483,436 3,204,778 3,204,778 4,219,110 5,980,116 7,055,087
less Revenue Foregone (in excess of 6 kilolitres per indigent household per month) 159,031 235,730 235,730 235,730 276,152 403,929 492,955
less Cost of Free Basis Services (6 kilolitres per indigent household per
month)
– 202,773 212,041 314,306 314,306 314,306 368,203 538,572 657,273
Net Service charges - water revenue 2,537,826 3,000,361 3,460,853 3,933,401 2,654,743 2,654,743 3,574,755 5,037,616 5,904,860
Service charges - sanitation revenue
Total Service charges - sanitation revenue 1,337,666 1,690,233 1,882,797 2,404,216 1,833,466 1,833,466 2,219,184 3,074,617 3,618,200
less Revenue Foregone (in excess of free sanitation service to indigent households) 107,796 133,691 133,691 133,691 174,916 235,559 287,476
less Cost of Free Basis Services (free sanitation service to indigent
households)
– 141,824 143,728 178,254 178,254 178,254 233,221 314,079 383,302
Net Service charges - sanitation revenue 1,337,666 1,548,409 1,631,273 2,092,272 1,521,522 1,521,522 1,811,048 2,524,979 2,947,422
Service charges - refuse revenue
Total refuse removal revenue 1,208,208 1,323,896 1,426,179 1,618,592 1,341,882 1,341,882 1,493,987 1,639,882 1,810,974
Total landfill revenue – – – – –
less Revenue Foregone (in excess of one removal a week to indigent
households) – – – – – – – – –
less Cost of Free Basis Services (removed once a week to indigent
households) 227,951 234,084 235,401 276,709 276,709 276,709 291,928 307,984 324,924
Net Service charges - refuse revenue 980,257 1,089,812 1,190,778 1,341,882 1,065,173 1,065,173 1,202,059 1,331,897 1,486,051
Other Revenue by source – – – – – –
Fuel Levy 2,002,938 2,060,211 2,197,740 – – – –
Other Revenue 381,213 320,278 411,300 709,425 719,686 719,686 773,871 816,747 862,106
Total 'Other' Revenue 2,384,151 2,380,489 2,609,040 709,425 719,686 719,686 773,871 816,747 862,106
DescriptionCurrent Year 2017/18
2018/19 Medium Term Revenue & Expenditure
Framework
Audited
Outcome
Audited
Outcome
Audited
Outcome
Original
Budget
Adjusted
Budget
Full Year
Forecast
Budget Year
2018/19
Budget Year +1
2019/20
Budget Year +2
2020/21
Table continues on next page
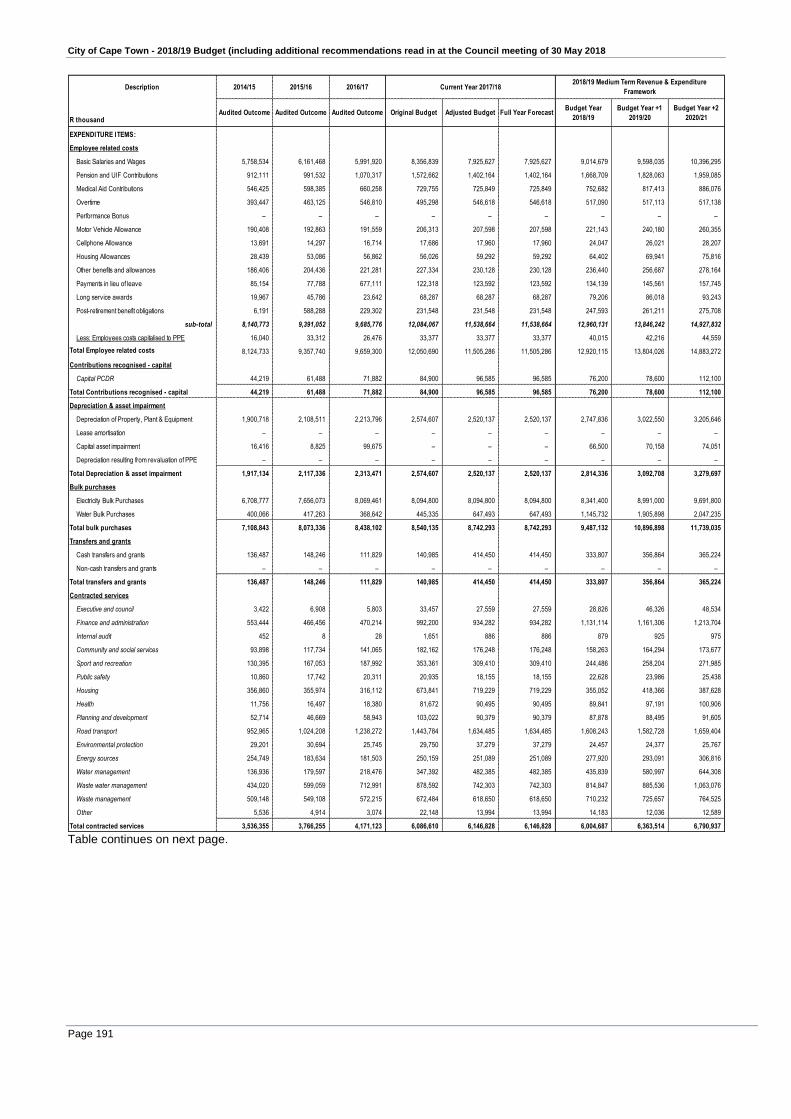
City of Cape Town - 2018/19 Budget (including additional recommendations read in at the Council meeting of 30 May 2018
Page 191
Description 2014/15 2015/16 2016/17
R thousand
EXPENDITURE ITEMS:
Employee related costs
Basic Salaries and Wages 5,758,534 6,161,468 5,991,920 8,356,839 7,925,627 7,925,627 9,014,679 9,598,035 10,396,295
Pension and UIF Contributions 912,111 991,532 1,070,317 1,572,662 1,402,164 1,402,164 1,668,709 1,828,063 1,959,085
Medical Aid Contributions 546,425 598,385 660,258 729,755 725,849 725,849 752,682 817,413 886,076
Overtime 393,447 463,125 546,810 495,298 546,618 546,618 517,090 517,113 517,138
Performance Bonus – – – – – – – – –
Motor Vehicle Allowance 190,408 192,863 191,559 206,313 207,598 207,598 221,143 240,180 260,355
Cellphone Allowance 13,691 14,297 16,714 17,686 17,960 17,960 24,047 26,021 28,207
Housing Allowances 28,439 53,086 56,862 56,026 59,292 59,292 64,402 69,941 75,816
Other benefits and allowances 186,406 204,436 221,281 227,334 230,128 230,128 236,440 256,687 278,164
Payments in lieu of leave 85,154 77,788 677,111 122,318 123,592 123,592 134,139 145,561 157,745
Long service awards 19,967 45,786 23,642 68,287 68,287 68,287 79,206 86,018 93,243
Post-retirement benefit obligations 6,191 588,288 229,302 231,548 231,548 231,548 247,593 261,211 275,708
sub-total 8,140,773 9,391,052 9,685,776 12,084,067 11,538,664 11,538,664 12,960,131 13,846,242 14,927,832
Less: Employees costs capitalised to PPE 16,040 33,312 26,476 33,377 33,377 33,377 40,015 42,216 44,559
Total Employee related costs 8,124,733 9,357,740 9,659,300 12,050,690 11,505,286 11,505,286 12,920,115 13,804,026 14,883,272
Contributions recognised - capital
Capital PCDR 44,219 61,488 71,882 84,900 96,585 96,585 76,200 78,600 112,100
Total Contributions recognised - capital 44,219 61,488 71,882 84,900 96,585 96,585 76,200 78,600 112,100
Depreciation & asset impairment
Depreciation of Property, Plant & Equipment 1,900,718 2,108,511 2,213,796 2,574,607 2,520,137 2,520,137 2,747,836 3,022,550 3,205,646
Lease amortisation – – – – – – – – –
Capital asset impairment 16,416 8,825 99,675 – – – 66,500 70,158 74,051
Depreciation resulting from revaluation of PPE – – – – – – – – –
Total Depreciation & asset impairment 1,917,134 2,117,336 2,313,471 2,574,607 2,520,137 2,520,137 2,814,336 3,092,708 3,279,697
Bulk purchases
Electricity Bulk Purchases 6,708,777 7,656,073 8,069,461 8,094,800 8,094,800 8,094,800 8,341,400 8,991,000 9,691,800
Water Bulk Purchases 400,066 417,263 368,642 445,335 647,493 647,493 1,145,732 1,905,898 2,047,235
Total bulk purchases 7,108,843 8,073,336 8,438,102 8,540,135 8,742,293 8,742,293 9,487,132 10,896,898 11,739,035
Transfers and grants
Cash transfers and grants 136,487 148,246 111,829 140,985 414,450 414,450 333,807 356,864 365,224
Non-cash transfers and grants – – – – – – – – –
Total transfers and grants 136,487 148,246 111,829 140,985 414,450 414,450 333,807 356,864 365,224
Contracted services
Executive and council 3,422 6,908 5,803 33,457 27,559 27,559 28,826 46,326 48,534
Finance and administration 553,444 466,456 470,214 992,200 934,282 934,282 1,131,114 1,161,306 1,213,704
Internal audit 452 8 28 1,651 886 886 879 925 975
Community and social services 93,898 117,734 141,065 182,162 176,248 176,248 158,263 164,294 173,677
Sport and recreation 130,395 167,053 187,992 353,361 309,410 309,410 244,486 258,204 271,985
Public safety 10,860 17,742 20,311 20,935 18,155 18,155 22,628 23,986 25,438
Housing 356,860 355,974 316,112 673,841 719,229 719,229 355,052 418,366 387,628
Health 11,756 16,497 18,380 81,672 90,495 90,495 89,841 97,191 100,906
Planning and development 52,714 46,669 58,943 103,022 90,379 90,379 87,878 88,495 91,605
Road transport 952,965 1,024,208 1,238,272 1,443,784 1,634,485 1,634,485 1,608,243 1,582,728 1,659,404
Environmental protection 29,201 30,694 25,745 29,750 37,279 37,279 24,457 24,377 25,767
Energy sources 254,749 183,634 181,503 250,159 251,089 251,089 277,920 293,091 306,816
Water management 136,936 179,597 218,476 347,392 482,385 482,385 435,839 580,997 644,308
Waste water management 434,020 599,059 712,991 878,592 742,303 742,303 814,847 885,536 1,063,076
Waste management 509,148 549,108 572,215 672,484 618,650 618,650 710,232 725,657 764,525
Other 5,536 4,914 3,074 22,148 13,994 13,994 14,183 12,036 12,589
Total contracted services 3,536,355 3,766,255 4,171,123 6,086,610 6,146,828 6,146,828 6,004,687 6,363,514 6,790,937
Current Year 2017/182018/19 Medium Term Revenue & Expenditure
Framework
Budget Year
2018/19
Budget Year +1
2019/20
Budget Year +2
2020/21Audited Outcome Audited Outcome Audited Outcome Original Budget Adjusted Budget Full Year Forecast
Table continues on next page.

City of Cape Town - 2018/19 Budget (including additional recommendations read in at the Council meeting of 30 May 2018
Page 192
Description 2014/15 2015/16 2016/17
R thousand
Other Expenditure By Type
Collection costs 172,518 187,416 198,278 192,487 192,158 192,158 205,450 216,769 228,802
Contributions to 'other' provisions (41,511) (26,991) (19,194) 43,962 49,462 49,462 41,963 44,271 46,729
Consultant fees 108,473 – – – – – – – –
Audit fees 13,241 13,554 13,183 19,834 17,734 17,734 18,709 19,738 20,834
General expenses 2,441,426 2,708,983 3,054,138 1,164,481 580,228 580,228 489,559 554,770 584,916
Communications Publicity & 37,235 – – – – – – – –
Computer Services & Softwar 43,411 – – – – – – – –
Legal Fees & Expenses 51,684 – – – – – – – –
Advertising 26,467 – – – – – – – –
Advertising - Corporate and Municipal Ac – 60,613 29,074 37,067 31,888 31,888 33,938 35,398 37,363
Bank Charges & Services 5,215 5,231 7,747 22,723 17,130 17,130 31,032 32,739 34,556
Computer Network Extensions – 14,337 11,162 13,252 17,350 17,350 14,763 18,740 19,780
Electricity 112,903 122,551 133,287 166,837 152,281 152,281 186,731 201,314 217,842
Eskom Connection Fees – 6,152 2,840 32,314 54,700 54,700 28,667 65,695 65,695
Fire & Allied Peril Claims 7,066 12,964 5,866 8,522 9,641 9,641 10,383 10,954 11,562
Hire Charges : Wet Fuel - Non Vatable – 205 16,964 11,388 12,374 12,374 12,792 13,497 14,328
Indigent Relief : Electricity - Eskom Re-imbursement 55,387 62,520 70,556 78,074 78,074 78,074 75,795 82,617 90,052
Insurance : Non GIF 4,862 7,711 10,200 22,085 11,353 11,353 13,243 11,519 12,158
Insurance Claims : Medical Expenses 11,993 10,856 14,550 12,976 13,940 13,940 13,312 14,044 14,823
Insurance Claims : Motor Claims 14,803 18,557 17,169 16,119 14,858 14,858 16,003 16,883 17,820
Learnerships 515 1,625 1,513 1,584 2,084 2,084 10,996 11,601 12,245
Licenses & Permits 106,192 – – – – – – – –
Membership Fees: Professional 13,019 12,519 14,292 16,502 15,917 15,917 16,945 17,877 18,869
Minor Tools , Equipment & Other 43,674 56,578 – – – – – – –
Motor vehicle License and registration – 16,364 17,905 14,821 18,589 18,589 19,370 20,434 21,568
Postage & Courier 31,031 35,198 37,578 36,388 36,113 36,113 37,178 39,222 41,399
Premiums : Unicity Insurance Program 34,983 32,985 33,245 48,115 48,115 48,115 51,820 55,706 59,912
Skills Development Levy 67,566 73,680 79,809 80,967 81,610 81,610 81,214 85,837 90,601
Software Licences - Upgrade/Protection – 105,069 90,053 165,673 159,703 159,703 168,575 177,847 187,717
Special Rating Areas 130,146 146,126 164,182 192,953 192,953 192,953 209,220 220,727 232,977
Specialised Information Technology servi 25 164,382 195,312 255,536 150,827 150,827 76,265 98,481 103,947
Subsidy on Homeowners Redemption 23,997 30,540 (8,672) 17,080 17,080 17,080 – 17,637 18,616
Telecommunication : Cell Phone Subscript 6,142 8,394 18,526 10,739 12,483 12,483 13,030 13,746 14,509
Telecommunication Lines – 66,475 53,256 38,077 49,056 49,056 50,254 36,916 38,965
Telecommunication Services 78,643 5,296 10,233 21,700 11,004 11,004 15,075 15,904 16,786
Testing, Sampling and Monitoring 25,298 – – – – – – – –
Training 52,300 63,618 73,196 95,066 65,296 65,296 97,434 102,688 108,385
Training - Co Op Students 11,659 9,193 11,969 10,701 15,276 15,276 14,439 15,233 16,079
Training Programmes 8,283 13,830 14,474 14,342 11,591 11,591 13,945 14,712 15,529
Uniform & Protective Clothing 61,673 74,408 80,325 85,851 86,268 86,268 97,569 102,205 107,877
Vehicle Tracking – 4,605 8,869 11,663 13,984 13,984 14,098 14,876 15,702
Water Research Levy 17,464 13,909 24,902 19,111 19,111 19,111 20,448 21,675 22,976
Total 'Other' Expenditure 3,777,783 4,139,457 4,486,789 2,978,990 2,260,231 2,260,231 2,200,213 2,422,275 2,561,922
Repairs and Maintenance by Expenditure Item
Employee related costs 1,187,006 1,262,852 1,271,125 1,430,455 1,341,534 1,341,534 1,300,132 1,384,643 1,475,335
Other materials 46,996 45,260 276,260 276,952 284,552 284,015 325,242 346,219 368,896
Contracted Services 1,450,264 1,660,202 2,010,873 2,070,347 1,942,034 1,951,800 2,173,011 2,362,911 2,575,141
Other Expenditure 318,892 370,681 203,039 256,538 185,594 189,824 176,078 187,473 199,729
Total Repairs and Maintenance Expenditure 3,003,158 3,338,995 3,761,297 4,034,293 3,753,714 3,767,172 3,974,465 4,281,247 4,619,102
Budget Year
+1 2019/20
Budget Year
+2 2020/21
Current Year 2017/182018/19 Medium Term Revenue & Expenditure
Framework
Audited
Outcome
Audited
Outcome
Audited
Outcome
Original
Budget
Adjusted
Budget
Full Year
Forecast
Budget Year
2018/19

City of Cape Town - 2018/19 Budget (including additional recommendations read in at the Council meeting of 30 May 2018
Page 193
Table 95 MBRR Table SA2 - Matrix financial performance budget (revenue source / expenditure type and department)
Description
R thousand
Revenue By Source
Property rates 215,691 – – – – 9,146,261 – – – – 9,361,952
Service charges - electricity revenue – – – – 12,591,403 – – – 41 – 12,591,444
Service charges - water revenue – 532 – – – – 3,574,755 – – – 3,575,287
Service charges - sanitation revenue – – – – – – 1,811,048 – – – 1,811,048
Service charges - refuse revenue – – – – – (280,000) 1,482,059 – – – 1,202,059
Service charges - other – – – – – – – – – – –
Rental of facilities and equipment – 350,315 – 78 975 2 137 283 22,069 7,404 381,262
Interest earned - external investments – 100 – – – 936,313 – – – 100 936,513
Interest earned - outstanding debtors 0 10,135 – 31 25,800 113,773 190,017 1,192 – 22 340,970
Dividends received – – – – – – – – – – –
Fines, penalties and forfeits – – – – – 469 195 1,273,476 3,703 2,317 1,280,160
Licences and permits – – – – – – 610 31,060 1,389 12,992 46,050
Agency services – – – – – 189,464 – 12,259 – – 201,723
Other revenue 2,346 20,566 11 55,371 98,805 60,506 53,013 12,950 53,404 416,898 773,871
Transfers and subsidies 886 3,000 – 27,707 4,567 5,184,897 40,424 27,678 718,264 796,184 6,803,608
Gains on disposal of PPE – 35,870 – – 2,500 – 3,000 – – 2,500 43,870
Total Revenue (excluding capital transfers and
contributions)
218,923 420,518 11 83,187 12,724,050 15,351,686 7,155,257 1,358,899 798,869 1,238,417 39,349,818
Total
Vote 1 - Area-
Based Service
Delivery
Vote 2 - Assets
& Facilities
Management
Vote 3 - City
Manager
Vote 4 -
Corporate
Services
Vote 5 - Energy Vote 6 - Finance
Vote 7 -
Informal
Settlements,
Water & Waste
Services
Vote 8 - Safety
& Security
Vote 9 - Social
Services
Vote 10 -
Transport &
Urban
Development
Authority
Table continues on next page

City of Cape Town - 2018/19 Budget (including additional recommendations read in at the Council meeting of 30 May 2018
Page 194
Description
R thousand
Expenditure By Type
Employee related costs 254,005 661,574 138,463 1,109,459 1,203,294 953,526 3,084,125 1,924,938 2,283,023 1,307,709 12,920,115
Remuneration of councillors – – – 169,640 – – – – – – 169,640
Debt impairment 6,471 152,024 – – 128,522 370,028 1,395,174 936,732 – – 2,988,951
Depreciation & asset impairment 10,604 201,125 1,218 187,808 353,185 208,051 827,690 88,931 146,559 789,166 2,814,336
Finance charges – – – – – 1,046,917 41,219 – 1,075 74 1,089,285
Bulk purchases – – – – 8,341,400 – 1,145,732 – – – 9,487,132
Other materials 5,050 44,111 989 26,693 134,931 14,403 521,351 56,027 384,923 66,806 1,255,285
Contracted services 60,563 481,131 1,416 190,735 315,872 77,404 2,084,831 103,655 671,822 2,017,258 6,004,687
Transfers and subsidies 8,450 – – 84,285 – 70,160 – 42,015 15,568 113,329 333,807
Other expenditure 231,353 117,553 18,533 415,762 196,586 406,406 421,524 164,385 114,423 113,688 2,200,213
Loss on disposal of PPE 3 29 – 81 194 – 119 47 15 – 488
Total Expenditure 576,498 1,657,547 160,619 2,184,462 10,673,982 3,146,896 9,521,764 3,316,731 3,617,408 4,408,030 39,263,938
Surplus/(Deficit) (357,575) (1,237,029) (160,609) (2,101,275) 2,050,068 12,204,790 (2,366,507) (1,957,832) (2,818,539) (3,169,613) 85,879
Transfers and subsidies - capital (monetary allocations) (National / Provincial
and District) 150 – – 1,000 116,709 600 738,207 – 120,082 1,091,147 2,067,896
Transfers and subsidies - capital (monetary allocations) (National / Provincial
Departmental Agencies, Households, Non-profit Institutions, Private Enterprises,
Public Corporatons, Higher Educational Institutions)
– – – – 44,200 – 12,000 – – 20,000 76,200
Transfers and subsidies - capital (in-kind - all) – – – – – – – – – – –
Surplus/(Deficit) after capital transfers & contributions (357,425) (1,237,029) (160,609) (2,100,275) 2,210,977 12,205,390 (1,616,300) (1,957,832) (2,698,457) (2,058,466) 2,229,975
Total
Vote 1 - Area-
Based Service
Delivery
Vote 2 - Assets &
Facilities
Management
Vote 3 - City
Manager
Vote 4 -
Corporate
Services
Vote 5 - Energy Vote 6 - Finance
Vote 7 - Informal
Settlements,
Water & Waste
Services
Vote 8 - Safety &
Security
Vote 9 - Social
Services
Vote 10 -
Transport &
Urban
Development
Authority
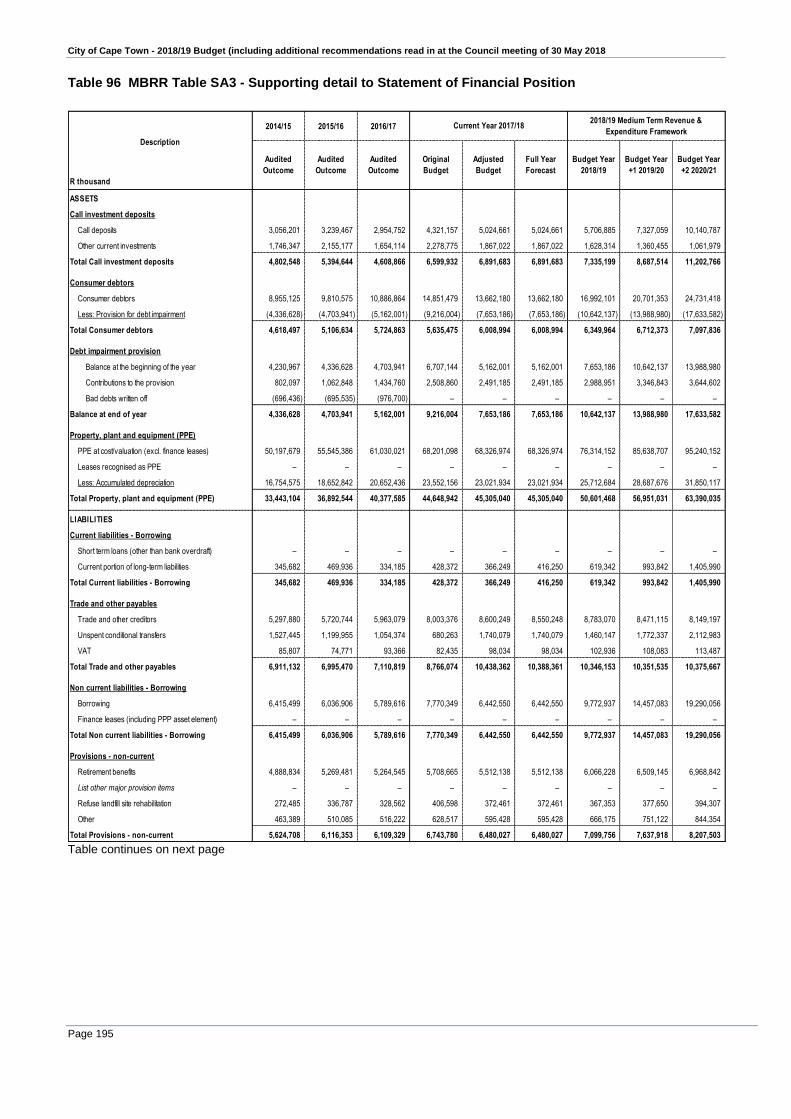
City of Cape Town - 2018/19 Budget (including additional recommendations read in at the Council meeting of 30 May 2018
Page 195
Table 96 MBRR Table SA3 - Supporting detail to Statement of Financial Position
2014/15 2015/16 2016/17
R thousand
ASSETS
Call investment deposits
Call deposits 3,056,201 3,239,467 2,954,752 4,321,157 5,024,661 5,024,661 5,706,885 7,327,059 10,140,787
Other current investments 1,746,347 2,155,177 1,654,114 2,278,775 1,867,022 1,867,022 1,628,314 1,360,455 1,061,979
Total Call investment deposits 4,802,548 5,394,644 4,608,866 6,599,932 6,891,683 6,891,683 7,335,199 8,687,514 11,202,766
Consumer debtors
Consumer debtors 8,955,125 9,810,575 10,886,864 14,851,479 13,662,180 13,662,180 16,992,101 20,701,353 24,731,418
Less: Provision for debt impairment (4,336,628) (4,703,941) (5,162,001) (9,216,004) (7,653,186) (7,653,186) (10,642,137) (13,988,980) (17,633,582)
Total Consumer debtors 4,618,497 5,106,634 5,724,863 5,635,475 6,008,994 6,008,994 6,349,964 6,712,373 7,097,836
Debt impairment provision
Balance at the beginning of the year 4,230,967 4,336,628 4,703,941 6,707,144 5,162,001 5,162,001 7,653,186 10,642,137 13,988,980
Contributions to the provision 802,097 1,062,848 1,434,760 2,508,860 2,491,185 2,491,185 2,988,951 3,346,843 3,644,602
Bad debts written off (696,436) (695,535) (976,700) – – – – – –
Balance at end of year 4,336,628 4,703,941 5,162,001 9,216,004 7,653,186 7,653,186 10,642,137 13,988,980 17,633,582
Property, plant and equipment (PPE)
PPE at cost/valuation (excl. finance leases) 50,197,679 55,545,386 61,030,021 68,201,098 68,326,974 68,326,974 76,314,152 85,638,707 95,240,152
Leases recognised as PPE – – – – – – – – –
Less: Accumulated depreciation 16,754,575 18,652,842 20,652,436 23,552,156 23,021,934 23,021,934 25,712,684 28,687,676 31,850,117
Total Property, plant and equipment (PPE) 33,443,104 36,892,544 40,377,585 44,648,942 45,305,040 45,305,040 50,601,468 56,951,031 63,390,035
LIABILITIES
Current liabilities - Borrowing
Short term loans (other than bank overdraft) – – – – – – – – –
Current portion of long-term liabilities 345,682 469,936 334,185 428,372 366,249 416,250 619,342 993,842 1,405,990
Total Current liabilities - Borrowing 345,682 469,936 334,185 428,372 366,249 416,250 619,342 993,842 1,405,990
Trade and other payables
Trade and other creditors 5,297,880 5,720,744 5,963,079 8,003,376 8,600,249 8,550,248 8,783,070 8,471,115 8,149,197
Unspent conditional transfers 1,527,445 1,199,955 1,054,374 680,263 1,740,079 1,740,079 1,460,147 1,772,337 2,112,983
VAT 85,807 74,771 93,366 82,435 98,034 98,034 102,936 108,083 113,487
Total Trade and other payables 6,911,132 6,995,470 7,110,819 8,766,074 10,438,362 10,388,361 10,346,153 10,351,535 10,375,667
Non current liabilities - Borrowing
Borrowing 6,415,499 6,036,906 5,789,616 7,770,349 6,442,550 6,442,550 9,772,937 14,457,083 19,290,056
Finance leases (including PPP asset element) – – – – – – – – –
Total Non current liabilities - Borrowing 6,415,499 6,036,906 5,789,616 7,770,349 6,442,550 6,442,550 9,772,937 14,457,083 19,290,056
Provisions - non-current
Retirement benefits 4,888,834 5,269,481 5,264,545 5,708,665 5,512,138 5,512,138 6,066,228 6,509,145 6,968,842
List other major provision items – – – – – – – – –
Refuse landfill site rehabilitation 272,485 336,787 328,562 406,598 372,461 372,461 367,353 377,650 394,307
Other 463,389 510,085 516,222 628,517 595,428 595,428 666,175 751,122 844,354
Total Provisions - non-current 5,624,708 6,116,353 6,109,329 6,743,780 6,480,027 6,480,027 7,099,756 7,637,918 8,207,503
Description
Current Year 2017/182018/19 Medium Term Revenue &
Expenditure Framework
Audited
Outcome
Audited
Outcome
Audited
Outcome
Original
Budget
Adjusted
Budget
Full Year
Forecast
Budget Year
2018/19
Budget Year
+1 2019/20
Budget Year
+2 2020/21
Table continues on next page

City of Cape Town - 2018/19 Budget (including additional recommendations read in at the Council meeting of 30 May 2018
Page 196
2014/15 2015/16 2016/17
R thousand
CHANGES IN NET ASSETS
Accumulated Surplus/(Deficit)
Accumulated Surplus/(Deficit) - opening balance 21,962,021 25,771,287 29,846,771 32,160,660 34,382,649 34,382,649 37,278,269 39,405,832 41,245,471
GRAP adjustments – – – – – – – – –
Restated balance 21,962,021 25,771,287 29,846,771 32,160,660 34,382,649 34,382,649 37,278,269 39,405,832 41,245,471
Surplus/(Deficit) 4,379,616 4,289,654 5,304,628 3,003,710 2,446,155 2,446,155 2,229,975 2,762,119 3,842,238
Appropriations to Reserves (1,084,623) (918,375) (1,612,627) (1,113) (9,797) (9,797) (131,914) (923,006) (1,517,714)
Transfers from Reserves 514,275 704,204 843,877 178,467 459,261 459,261 29,503 526 –
Depreciation offsets – – – – – – – – –
Other adjustments – – – – – – – – –
Accumulated Surplus/(Deficit) 25,771,289 29,846,770 34,382,649 35,341,724 37,278,268 37,278,268 39,405,832 41,245,471 43,569,995
Reserves
Housing Development Fund 396,385 340,096 331,568 204,867 354,045 354,045 324,542 340,515 377,168
Capital replacement 1,865,119 2,119,182 2,880,321 2,042,114 2,398,582 2,398,582 2,529,893 3,436,926 4,916,900
Self-insurance 528,760 545,157 561,296 546,259 571,093 571,093 571,697 571,171 572,259
Other reserves – – – – – – – – –
Revaluation – – – – – – – – –
Total Reserves 2,790,264 3,004,435 3,773,185 2,793,239 3,323,721 3,323,721 3,426,132 4,348,613 5,866,327
TOTAL COMMUNITY WEALTH/EQUITY 28,561,553 32,851,205 38,155,834 38,134,963 40,601,989 40,601,989 42,831,965 45,594,083 49,436,322
DescriptionCurrent Year 2017/18
2018/19 Medium Term Revenue &
Expenditure Framework
Audited
Outcome
Audited
Outcome
Audited
Outcome
Original
Budget
Adjusted
Budget
Full Year
Forecast
Budget Year
2018/19
Budget Year
+1 2019/20
Budget Year
+2 2020/21

City of Cape Town - 2018/19 Budget (including additional recommendations read in at the Council meeting of 30 May 2018
Page 197
Table 97 MBRR Table SA9 - Social, economic and demographic statistics and assumptions 2014/15 2015/16 2016/17 Current Year
2017/18
Outcome Outcome Outcome Original Budget Budget Year
2018/19
Budget Year +1
2019/20
Budget Year +2
2020/21
Demographics
Population StatsSA Census, Community Survey
& Mid-year estimates
2,893,249 3,497,097 3,740,025 4,023,510 4,097,987 4,174,510 4,254,946 4,339,070 – –
Females aged 5 - 14 StatsSA Census, Community Survey
& Mid-year estimates
260,241 287,307 275,909 323,307 335,251 347,747 358,580 365,923 – –
Males aged 5 - 14 StatsSA Census, Community Survey
& Mid-year estimates
257,985 284,101 282,124 327,769 340,274 352,594 363,225 370,510 – –
Females aged 15 - 34 StatsSA Census, Community Survey
& Mid-year estimates
571,867 653,762 706,732 722,922 725,663 726,754 727,513 730,169 – –
Males aged 15 - 34 StatsSA Census, Community Survey
& Mid-year estimates
539,939 631,811 707,488 714,730 718,676 721,700 724,087 727,967 – –
Unemployment StatsSA Census & QLFS 29.20% 24.50% 23.90% 24.24% 21.60% 23.17% 22.45% NA –
Monthly household income (no. of
households)
No income StatsSA Census 101,953 52,446 146,517 NA NA NA NA NA – –
R1 - R1 600 StatsSA Census 200,414 144,873 185,068 NA NA NA NA NA – –
R1 601 - R3 200 StatsSA Census 130,846 122,611 170,824 NA NA NA NA NA – –
R3 201 - R6 400 StatsSA Census 133,588 121,268 154,427 NA NA NA NA NA – –
R6 401 - R12 800 StatsSA Census 109,609 103,587 139,348 NA NA NA NA NA – –
R12 801 - R25 600 StatsSA Census 67,529 87,974 126,625 NA NA NA NA NA – –
R25 601 - R51 200 StatsSA Census 23,091 52,892 92,860 NA NA NA NA NA – –
R52 201 - R102 400 StatsSA Census 5,470 18,249 38,018 NA NA NA NA NA – –
R102 401 - R204 800 StatsSA Census 3,028 5,355 9,749 NA NA NA NA NA – –
R204 801 - R409 600 StatsSA Census 1,861 3,429 5,066 NA NA NA NA NA – –
Unspecified – 189,593 73 NA NA NA NA NA – –
Poverty profiles (no. of households)
< R2 060 per household per month - - - NA NA NA NA NA – –
Insert description - - - 231,793 232,569 213,424 128,663 - – –
Household/demographics
Number of people in municipal area StatsSA Census, Community Survey
& Mid-year estimates
2,893,249 3,497,097 3,740,025 4,023,510 4,097,987 4,174,510 4,254,946 4,339,070 – –
Number of poor people in municipal area StatsSA Census, estimates 1,124,687 1,240,002 1,758,442 NA NA NA NA NA – –
Number of households in municipal area StatsSA Census, estimates 777,390 902,275 1,068,575 1,211,901 1,257,051 1,304,534 1,329,671 1,355,959 – –
Number of poor households in municipal area StatsSA Census, Indigent
households for 2014/15 to 2017/18
302,193 319,930 502,409 231,793 232,569 213,424 128,663 - – –
Definition of poor household (R per month) Household
Income < R1608
Household
income < R3201
Household
income < R3201
Indigent
households
Indigent
households
Indigent
households
Indigent
households
- - -
Housing statistics
Formal StatsSA Census & Community
Survey, estimates
619,691 758,159 846,026 976,206 1,018,351 1,062,812 1,083,290 1,104,708 - -
Informal StatsSA Census & Community
Survey, estimates
157,699 144,116 222,549 235,694 238,700 241,723 246,380 251,251 - -
Total number of households 777,390 902,275 1,068,575 1,211,901 1,257,051 1,304,534 1,329,671 1,355,959 - -
Dwellings provided by municipality - - - 3,372 3,319 4,839 - - - -
Dwellings provided by province/s - - - - - - - - - -
Dwellings provided by private sector - - - 8,659 9,968 13,693 - - - -
Total new housing dwellings - - - 12,031 13,287 18,532 - - - -
Economic
Inflation/inflation outlook (CPIX) - - - 5.1% 5.6% 6.10% 5.7% 5.5% 5.5% 5.6%
Interest rate - borrowing - - - 11.0% 12.0% 11.0% 12.0% 11.0% 11.0% 11.0%
Interest rate - investment - - - 5.5% 6.5% 6.5% 7.0% 7.0% 7.0% 7.0%
Remuneration increases - - - 6.8% 7.0% 6.00% 7.4% 7.1% 6.6% 6.4%
Consumption growth (electricity) - - - -0.4% -1.4% -1.00% -1.0% -2.7% -2.0% -2.0%
Consumption growth (water) - - - - 1.0% -12.80% -26.8% 0.0% 0.0% 0.0%
Collection rates
Property tax/service charges - - - 96.3% 96.7% 96.4% 96.0% 96.0% 96.0% 96.0%
Rental of facilities & equipment - - - 61.8% 73.6% 67.6% 68.4% 67.5% 67.5% 67.5%
Interest - external investments - - - 100.0% 100.0% 100.0% 100.0% 100.0% 100.0% 100.0%
Interest - debtors - - - 96.4% 96.8% 96.6% 96.1% 96.1% 96.1% 96.1%
Revenue from agency services - - - 100.0% 100.0% 100.0% 100.0% 100.0% 100.0% 100.0%
2018/19 Medium Term Revenue & Expenditure
FrameworkDescription of economic indicator Basis of calculation 2001 Census 2007 Survey 2011 Census
*NA = not available
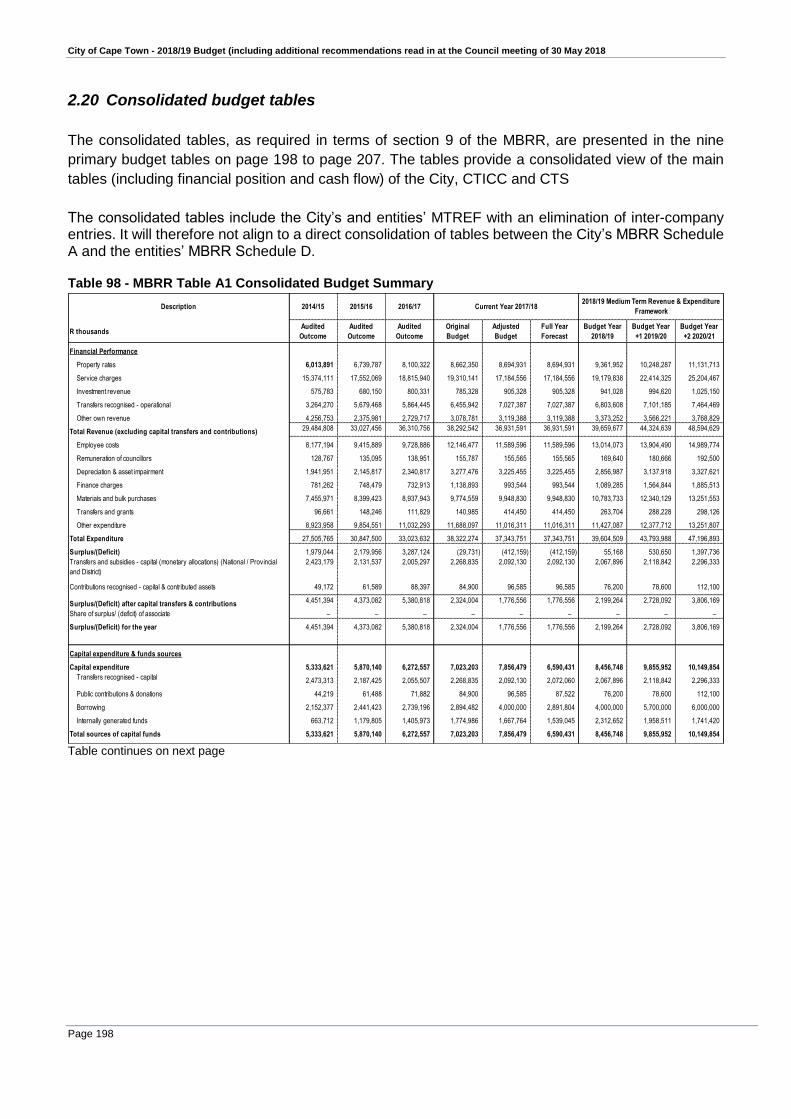
City of Cape Town - 2018/19 Budget (including additional recommendations read in at the Council meeting of 30 May 2018
Page 198
2.20 Consolidated budget tables
The consolidated tables, as required in terms of section 9 of the MBRR, are presented in the nine
primary budget tables on page 198 to page 207. The tables provide a consolidated view of the main
tables (including financial position and cash flow) of the City, CTICC and CTS
The consolidated tables include the City’s and entities’ MTREF with an elimination of inter-company entries. It will therefore not align to a direct consolidation of tables between the City’s MBRR Schedule A and the entities’ MBRR Schedule D.
Table 98 - MBRR Table A1 Consolidated Budget Summary
Table continues on next page
Description 2014/15 2015/16 2016/17
R thousandsAudited
Outcome
Audited
Outcome
Audited
Outcome
Original
Budget
Adjusted
Budget
Full Year
Forecast
Budget Year
2018/19
Budget Year
+1 2019/20
Budget Year
+2 2020/21
Financial Performance
Property rates 6,013,891 6,739,787 8,100,322 8,662,350 8,694,931 8,694,931 9,361,952 10,248,287 11,131,713
Service charges 15,374,111 17,552,069 18,815,940 19,310,141 17,184,556 17,184,556 19,179,838 22,414,325 25,204,467
Investment revenue 575,783 680,150 800,331 785,328 905,328 905,328 941,028 994,620 1,025,150
Transfers recognised - operational 3,264,270 5,679,468 5,864,445 6,455,942 7,027,387 7,027,387 6,803,608 7,101,185 7,464,469
Other own revenue 4,256,753 2,375,981 2,729,717 3,078,781 3,119,388 3,119,388 3,373,252 3,566,221 3,768,829
Total Revenue (excluding capital transfers and contributions) 29,484,808 33,027,456 36,310,756 38,292,542 36,931,591 36,931,591 39,659,677 44,324,639 48,594,629
Employee costs 8,177,194 9,415,889 9,728,886 12,146,477 11,589,596 11,589,596 13,014,073 13,904,490 14,989,774
Remuneration of councillors 128,767 135,095 138,951 155,787 155,565 155,565 169,640 180,666 192,500
Depreciation & asset impairment 1,941,951 2,145,817 2,340,817 3,277,476 3,225,455 3,225,455 2,856,987 3,137,918 3,327,621
Finance charges 781,262 748,479 732,913 1,138,893 993,544 993,544 1,089,285 1,564,844 1,885,513
Materials and bulk purchases 7,455,971 8,399,423 8,937,943 9,774,559 9,948,830 9,948,830 10,783,733 12,340,129 13,251,553
Transfers and grants 96,661 148,246 111,829 140,985 414,450 414,450 263,704 288,228 298,126
Other expenditure 8,923,958 9,854,551 11,032,293 11,688,097 11,016,311 11,016,311 11,427,087 12,377,712 13,251,807
Total Expenditure 27,505,765 30,847,500 33,023,632 38,322,274 37,343,751 37,343,751 39,604,509 43,793,988 47,196,893
Surplus/(Deficit) 1,979,044 2,179,956 3,287,124 (29,731) (412,159) (412,159) 55,168 530,650 1,397,736
Transfers and subsidies - capital (monetary allocations) (National / Provincial
and District)
2,423,179 2,131,537 2,005,297 2,268,835 2,092,130 2,092,130 2,067,896 2,118,842 2,296,333
Contributions recognised - capital & contributed assets 49,172 61,589 88,397 84,900 96,585 96,585 76,200 78,600 112,100
Surplus/(Deficit) after capital transfers & contributions 4,451,394 4,373,082 5,380,818 2,324,004 1,776,556 1,776,556 2,199,264 2,728,092 3,806,169
Share of surplus/ (deficit) of associate – – – – – – – – –
Surplus/(Deficit) for the year 4,451,394 4,373,082 5,380,818 2,324,004 1,776,556 1,776,556 2,199,264 2,728,092 3,806,169
Capital expenditure & funds sources
Capital expenditure 5,333,621 5,870,140 6,272,557 7,023,203 7,856,479 6,590,431 8,456,748 9,855,952 10,149,854
Transfers recognised - capital 2,473,313 2,187,425 2,055,507 2,268,835 2,092,130 2,072,060 2,067,896 2,118,842 2,296,333
Public contributions & donations 44,219 61,488 71,882 84,900 96,585 87,522 76,200 78,600 112,100
Borrowing 2,152,377 2,441,423 2,739,196 2,894,482 4,000,000 2,891,804 4,000,000 5,700,000 6,000,000
Internally generated funds 663,712 1,179,805 1,405,973 1,774,986 1,667,764 1,539,045 2,312,652 1,958,511 1,741,420
Total sources of capital funds 5,333,621 5,870,140 6,272,557 7,023,203 7,856,479 6,590,431 8,456,748 9,855,952 10,149,854
Current Year 2017/182018/19 Medium Term Revenue & Expenditure
Framework
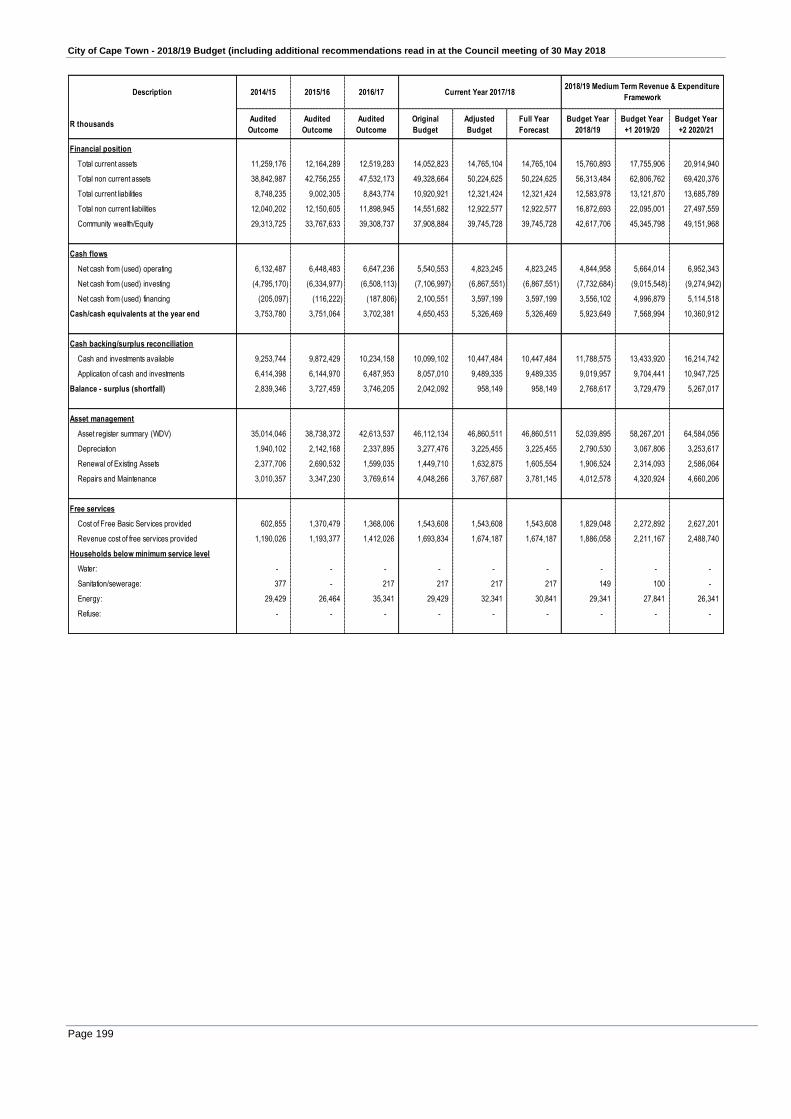
City of Cape Town - 2018/19 Budget (including additional recommendations read in at the Council meeting of 30 May 2018
Page 199
Description 2014/15 2015/16 2016/17
R thousandsAudited
Outcome
Audited
Outcome
Audited
Outcome
Original
Budget
Adjusted
Budget
Full Year
Forecast
Budget Year
2018/19
Budget Year
+1 2019/20
Budget Year
+2 2020/21
Financial position
Total current assets 11,259,176 12,164,289 12,519,283 14,052,823 14,765,104 14,765,104 15,760,893 17,755,906 20,914,940
Total non current assets 38,842,987 42,756,255 47,532,173 49,328,664 50,224,625 50,224,625 56,313,484 62,806,762 69,420,376
Total current liabilities 8,748,235 9,002,305 8,843,774 10,920,921 12,321,424 12,321,424 12,583,978 13,121,870 13,685,789
Total non current liabilities 12,040,202 12,150,605 11,898,945 14,551,682 12,922,577 12,922,577 16,872,693 22,095,001 27,497,559
Community wealth/Equity 29,313,725 33,767,633 39,308,737 37,908,884 39,745,728 39,745,728 42,617,706 45,345,798 49,151,968
Cash flows
Net cash from (used) operating 6,132,487 6,448,483 6,647,236 5,540,553 4,823,245 4,823,245 4,844,958 5,664,014 6,952,343
Net cash from (used) investing (4,795,170) (6,334,977) (6,508,113) (7,106,997) (6,867,551) (6,867,551) (7,732,684) (9,015,548) (9,274,942)
Net cash from (used) financing (205,097) (116,222) (187,806) 2,100,551 3,597,199 3,597,199 3,556,102 4,996,879 5,114,518
Cash/cash equivalents at the year end 3,753,780 3,751,064 3,702,381 4,650,453 5,326,469 5,326,469 5,923,649 7,568,994 10,360,912
Cash backing/surplus reconciliation
Cash and investments available 9,253,744 9,872,429 10,234,158 10,099,102 10,447,484 10,447,484 11,788,575 13,433,920 16,214,742
Application of cash and investments 6,414,398 6,144,970 6,487,953 8,057,010 9,489,335 9,489,335 9,019,957 9,704,441 10,947,725
Balance - surplus (shortfall) 2,839,346 3,727,459 3,746,205 2,042,092 958,149 958,149 2,768,617 3,729,479 5,267,017
Asset management
Asset register summary (WDV) 35,014,046 38,738,372 42,613,537 46,112,134 46,860,511 46,860,511 52,039,895 58,267,201 64,584,056
Depreciation 1,940,102 2,142,168 2,337,895 3,277,476 3,225,455 3,225,455 2,790,530 3,067,806 3,253,617
Renewal of Existing Assets 2,377,706 2,690,532 1,599,035 1,449,710 1,632,875 1,605,554 1,906,524 2,314,093 2,586,064
Repairs and Maintenance 3,010,357 3,347,230 3,769,614 4,048,266 3,767,687 3,781,145 4,012,578 4,320,924 4,660,206
Free services
Cost of Free Basic Services provided 602,855 1,370,479 1,368,006 1,543,608 1,543,608 1,543,608 1,829,048 2,272,892 2,627,201
Revenue cost of free services provided 1,190,026 1,193,377 1,412,026 1,693,834 1,674,187 1,674,187 1,886,058 2,211,167 2,488,740
Households below minimum service level
Water: - - - - - - - - -
Sanitation/sewerage: 377 - 217 217 217 217 149 100 -
Energy: 29,429 26,464 35,341 29,429 32,341 30,841 29,341 27,841 26,341
Refuse: - - - - - - - - -
Current Year 2017/182018/19 Medium Term Revenue & Expenditure
Framework

City of Cape Town - 2018/19 Budget (including additional recommendations read in at the Council meeting of 30 May 2018
Page 200
Table 99 - MBRR Table A2 Consolidated Budgeted Financial Performance (revenue and expenditure by
standard classification)
Functional Classification Description 2014/15 2015/16 2016/17
R thousandAudited
Outcome
Audited
Outcome
Audited
Outcome
Original
Budget
Adjusted
Budget
Full Year
Forecast
Budget Year
2018/19
Budget Year
+1 2019/20
Budget Year
+2 2020/21
Revenue - Functional
Governance and administration 10,940,599 12,273,882 14,067,960 14,882,934 13,780,250 13,780,250 14,763,272 15,859,595 17,092,197
Executive and council 1,594 2,082 1,400 3,126 3,594 3,594 3,240 3,362 3,491
Finance and administration 10,938,999 12,271,777 14,066,558 14,879,801 13,776,649 13,776,649 14,760,024 15,856,224 17,088,697
Internal audit 6 22 2 8 8 8 8 9 9
Community and public safety 2,097,502 1,679,540 1,833,039 1,956,529 2,251,355 2,251,355 1,880,561 2,118,445 2,188,559
Community and social services 130,446 107,248 105,403 120,972 122,745 122,745 130,825 157,880 133,134
Sport and recreation 87,643 81,245 106,473 114,329 108,000 108,000 110,050 81,788 92,794
Public safety 16,159 21,416 24,889 22,293 23,253 23,253 11,726 12,371 13,057
Housing 1,620,155 1,203,137 1,279,471 1,328,591 1,614,260 1,614,260 1,211,961 1,416,120 1,454,192
Health 243,098 266,493 316,802 370,343 383,097 383,097 415,999 450,285 495,382
Economic and environmental services 3,041,372 3,224,167 3,237,399 3,224,458 3,253,017 3,253,017 3,188,342 3,146,271 3,355,662
Planning and development 252,950 286,798 324,404 342,034 348,279 348,279 369,522 425,592 444,155
Road transport 2,756,753 2,929,763 2,896,258 2,880,418 2,895,661 2,895,661 2,805,489 2,717,202 2,907,837
Environmental protection 31,669 7,606 16,736 2,006 9,077 9,077 13,331 3,477 3,670
Trading services 15,644,415 17,795,649 19,018,621 20,291,096 19,567,466 19,567,466 21,673,945 25,084,399 28,034,494
Energy sources 10,378,888 11,528,353 12,083,270 12,256,796 12,501,302 12,501,302 13,086,625 14,128,383 15,609,846
Water management 2,688,866 3,170,901 3,659,066 4,123,369 3,706,612 3,706,612 4,650,411 6,209,664 7,055,121
Waste water management 1,526,954 1,985,565 2,059,709 2,547,543 1,881,556 1,881,556 2,311,354 2,953,561 3,381,843
Waste management 1,049,707 1,110,831 1,216,576 1,363,387 1,477,996 1,477,996 1,625,554 1,792,791 1,987,684
Other 233,270 247,344 247,430 291,260 268,218 268,218 297,653 313,370 332,150
Total Revenue - Functional 31,957,159 35,220,581 38,404,450 40,646,277 39,120,306 39,120,306 41,803,773 46,522,080 51,003,062
Expenditure - Functional
Governance and administration 5,488,608 6,225,165 6,346,285 8,555,468 7,368,855 7,368,855 8,518,224 9,511,725 10,359,133
Executive and council 323,129 354,957 359,348 443,599 415,825 415,825 450,141 493,578 526,864
Finance and administration 5,132,477 5,835,760 5,949,697 8,061,222 6,906,787 6,906,787 8,016,966 8,962,807 9,772,393
Internal audit 33,002 34,447 37,240 50,646 46,242 46,242 51,116 55,340 59,876
Community and public safety 4,075,408 4,483,761 4,789,295 5,318,902 5,436,189 5,436,189 5,120,605 5,611,271 5,935,491
Community and social services 656,622 766,084 847,987 931,712 892,180 892,180 894,025 953,313 1,021,370
Sport and recreation 1,024,976 1,094,127 1,088,040 1,212,821 1,129,103 1,129,103 1,192,887 1,251,561 1,303,238
Public safety 451,176 503,975 508,298 600,875 580,975 580,975 615,325 661,420 709,746
Housing 1,133,758 1,248,627 1,340,014 1,498,847 1,747,402 1,747,402 1,239,650 1,463,475 1,509,754
Health 808,876 870,948 1,004,957 1,074,647 1,086,529 1,086,529 1,178,718 1,281,503 1,391,383
Economic and environmental services 4,839,805 5,162,054 5,679,268 6,351,817 6,390,777 6,390,777 6,551,208 6,937,927 7,341,687
Planning and development 730,833 751,118 783,735 1,042,789 973,522 973,522 1,060,433 1,212,459 1,297,413
Road transport 4,000,649 4,296,999 4,779,345 5,186,569 5,284,417 5,284,417 5,353,664 5,598,973 5,908,428
Environmental protection 108,322 113,937 116,188 122,458 132,837 132,837 137,111 126,495 135,846
Trading services 12,853,133 14,670,858 15,886,413 17,026,865 17,120,492 17,120,492 18,995,590 21,292,141 23,092,626
Energy sources 8,109,987 9,162,229 9,573,670 9,929,327 9,915,015 9,915,015 10,321,587 11,164,578 12,017,986
Water management 2,236,997 2,573,197 3,067,944 3,225,897 3,762,940 3,762,940 4,823,188 5,956,992 6,416,993
Waste water management 1,211,007 1,475,444 1,643,752 1,990,882 1,650,532 1,650,532 1,935,220 2,137,441 2,497,902
Waste management 1,295,142 1,459,987 1,601,046 1,880,759 1,792,006 1,792,006 1,915,595 2,033,130 2,159,745
Other 248,810 305,661 322,371 1,069,221 1,027,438 1,027,438 418,882 440,925 467,956
Total Expenditure - Functional 27,505,765 30,847,500 33,023,632 38,322,274 37,343,751 37,343,751 39,604,509 43,793,988 47,196,893
Surplus/(Deficit) for the year 4,451,394 4,373,082 5,380,818 2,324,004 1,776,556 1,776,556 2,199,264 2,728,092 3,806,169
Current Year 2017/182018/19 Medium Term Revenue & Expenditure
Framework

City of Cape Town - 2018/19 Budget (including additional recommendations read in at the Council meeting of 30 May 2018
Page 201
Table 100 - MBBR Table A3 Consolidated Budgeted Financial Performance (revenue and expenditure by
municipal vote)
Vote Description 2014/15 2015/16 2016/17
R thousandAudited
Outcome
Audited
Outcome
Audited
Outcome
Original
Budget
Adjusted
Budget
Full Year
Forecast
Budget Year
2018/19
Budget Year
+1 2019/20
Budget Year
+2 2020/21
Revenue by Vote
Vote 1 - Area-Based Service Delivery 146,024 158,679 176,748 204,290 204,758 204,758 219,073 266,265 279,031
Vote 2 - Assets & Facilities Management 707,549 572,111 414,050 453,587 405,335 405,335 420,518 457,115 504,872
Vote 3 - City Manager 9 18 15 10 10 10 11 11 12
Vote 4 - Corporate Services 63,595 57,444 65,608 71,387 82,512 82,512 84,187 86,551 77,781
Vote 5 - Energy 10,380,957 11,527,694 12,083,675 12,256,918 12,262,712 12,262,712 12,884,959 13,870,807 15,329,083
Vote 6 - Finance 10,384,444 11,684,796 13,560,991 14,307,250 13,768,109 13,768,109 15,352,286 16,591,587 17,872,725
Vote 7 - Informal Settlements, Water & Waste Services 5,376,022 6,348,843 7,044,676 8,212,622 7,030,064 7,030,064 7,905,464 10,215,863 11,657,882
Vote 8 - Safety & Security 1,124,039 1,236,741 1,402,527 1,267,627 1,279,774 1,279,774 1,358,899 1,424,492 1,491,649
Vote 9 - Social Services 695,506 696,021 790,612 904,664 893,857 893,857 918,952 957,304 1,058,109
Vote 10 - Transport & Urban Development Authority 2,852,348 2,694,231 2,621,074 2,683,471 2,888,198 2,888,198 2,349,564 2,320,567 2,380,282
Vote 11 - Cape Town International Convention Centre 226,666 244,005 244,473 284,451 261,409 261,409 291,129 308,597 327,113
Vote 12 - Cape Town Stadium Entity – – – – 43,568 43,568 18,731 22,921 24,524
Total Revenue by Vote 31,957,159 35,220,581 38,404,450 40,646,277 39,120,306 39,120,306 41,803,773 46,522,080 51,003,062
Expenditure by Vote to be appropriated
Vote 1 - Area-Based Service Delivery 358,391 393,434 412,259 547,009 524,668 524,668 576,498 621,100 662,085
Vote 2 - Assets & Facilities Management 1,440,741 1,487,231 1,564,514 1,851,509 1,443,741 1,443,741 1,657,547 1,809,419 1,944,357
Vote 3 - City Manager 90,451 98,354 101,816 133,896 123,744 123,744 160,619 173,444 187,114
Vote 4 - Corporate Services 1,569,098 1,657,814 1,763,889 2,187,517 2,017,133 2,017,133 2,184,462 2,338,830 2,483,400
Vote 5 - Energy 8,401,044 9,468,163 9,885,010 10,355,750 10,216,736 10,216,736 10,673,982 11,539,870 12,415,273
Vote 6 - Finance 2,084,867 2,542,752 2,396,354 3,370,596 2,855,498 2,855,498 3,146,896 3,756,426 4,212,187
Vote 7 - Informal Settlements, Water & Waste Services 5,185,428 5,973,003 6,807,396 7,739,299 7,933,366 7,933,366 9,521,764 11,037,059 12,060,950
Vote 8 - Safety & Security 2,323,967 2,667,773 2,839,108 3,148,512 3,073,273 3,073,273 3,316,731 3,570,156 3,796,417
Vote 9 - Social Services 2,458,026 2,682,700 2,950,086 3,463,150 3,316,242 3,316,242 3,617,408 4,003,640 4,305,882
Vote 10 - Transport & Urban Development Authority 3,427,803 3,699,530 4,116,187 4,560,879 4,864,774 4,864,774 4,408,030 4,578,499 4,741,522
Vote 11 - Cape Town International Convention Centre 165,947 176,745 187,013 964,158 931,008 931,008 321,840 342,624 363,182
Vote 12 - Cape Town Stadium Entity – – – – 43,568 43,568 18,731 22,921 24,524
Total Expenditure by Vote 27,505,765 30,847,500 33,023,632 38,322,274 37,343,751 37,343,751 39,604,509 43,793,988 47,196,893
Surplus/(Deficit) for the year 4,451,394 4,373,082 5,380,818 2,324,004 1,776,556 1,776,556 2,199,264 2,728,092 3,806,169
Current Year 2017/182018/19 Medium Term Revenue & Expenditure
Framework
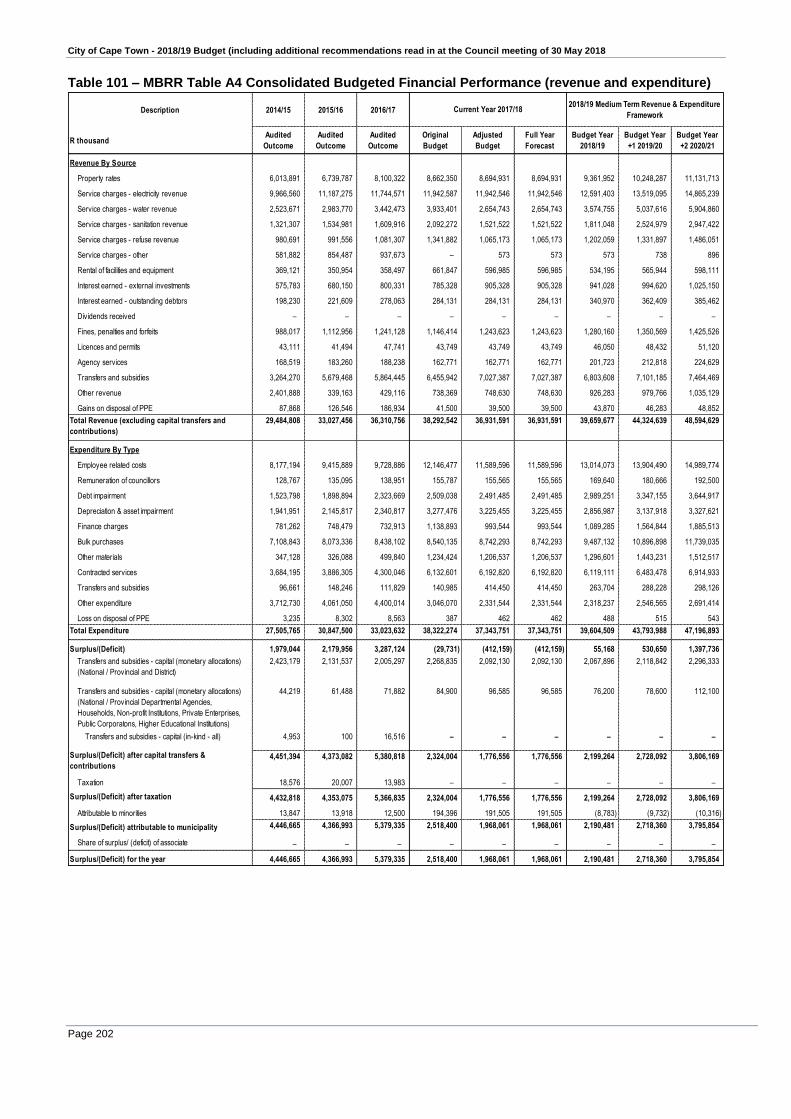
City of Cape Town - 2018/19 Budget (including additional recommendations read in at the Council meeting of 30 May 2018
Page 202
Table 101 – MBRR Table A4 Consolidated Budgeted Financial Performance (revenue and expenditure)
Description 2014/15 2015/16 2016/17
R thousandAudited
Outcome
Audited
Outcome
Audited
Outcome
Original
Budget
Adjusted
Budget
Full Year
Forecast
Budget Year
2018/19
Budget Year
+1 2019/20
Budget Year
+2 2020/21
Revenue By Source
Property rates 6,013,891 6,739,787 8,100,322 8,662,350 8,694,931 8,694,931 9,361,952 10,248,287 11,131,713
Service charges - electricity revenue 9,966,560 11,187,275 11,744,571 11,942,587 11,942,546 11,942,546 12,591,403 13,519,095 14,865,239
Service charges - water revenue 2,523,671 2,983,770 3,442,473 3,933,401 2,654,743 2,654,743 3,574,755 5,037,616 5,904,860
Service charges - sanitation revenue 1,321,307 1,534,981 1,609,916 2,092,272 1,521,522 1,521,522 1,811,048 2,524,979 2,947,422
Service charges - refuse revenue 980,691 991,556 1,081,307 1,341,882 1,065,173 1,065,173 1,202,059 1,331,897 1,486,051
Service charges - other 581,882 854,487 937,673 – 573 573 573 738 896
Rental of facilities and equipment 369,121 350,954 358,497 661,847 596,985 596,985 534,195 565,944 598,111
Interest earned - external investments 575,783 680,150 800,331 785,328 905,328 905,328 941,028 994,620 1,025,150
Interest earned - outstanding debtors 198,230 221,609 278,063 284,131 284,131 284,131 340,970 362,409 385,462
Dividends received – – – – – – – – –
Fines, penalties and forfeits 988,017 1,112,956 1,241,128 1,146,414 1,243,623 1,243,623 1,280,160 1,350,569 1,425,526
Licences and permits 43,111 41,494 47,741 43,749 43,749 43,749 46,050 48,432 51,120
Agency services 168,519 183,260 188,238 162,771 162,771 162,771 201,723 212,818 224,629
Transfers and subsidies 3,264,270 5,679,468 5,864,445 6,455,942 7,027,387 7,027,387 6,803,608 7,101,185 7,464,469
Other revenue 2,401,888 339,163 429,116 738,369 748,630 748,630 926,283 979,766 1,035,129
Gains on disposal of PPE 87,868 126,546 186,934 41,500 39,500 39,500 43,870 46,283 48,852
Total Revenue (excluding capital transfers and
contributions)
29,484,808 33,027,456 36,310,756 38,292,542 36,931,591 36,931,591 39,659,677 44,324,639 48,594,629
Expenditure By Type
Employee related costs 8,177,194 9,415,889 9,728,886 12,146,477 11,589,596 11,589,596 13,014,073 13,904,490 14,989,774
Remuneration of councillors 128,767 135,095 138,951 155,787 155,565 155,565 169,640 180,666 192,500
Debt impairment 1,523,798 1,898,894 2,323,669 2,509,038 2,491,485 2,491,485 2,989,251 3,347,155 3,644,917
Depreciation & asset impairment 1,941,951 2,145,817 2,340,817 3,277,476 3,225,455 3,225,455 2,856,987 3,137,918 3,327,621
Finance charges 781,262 748,479 732,913 1,138,893 993,544 993,544 1,089,285 1,564,844 1,885,513
Bulk purchases 7,108,843 8,073,336 8,438,102 8,540,135 8,742,293 8,742,293 9,487,132 10,896,898 11,739,035
Other materials 347,128 326,088 499,840 1,234,424 1,206,537 1,206,537 1,296,601 1,443,231 1,512,517
Contracted services 3,684,195 3,886,305 4,300,046 6,132,601 6,192,820 6,192,820 6,119,111 6,483,478 6,914,933
Transfers and subsidies 96,661 148,246 111,829 140,985 414,450 414,450 263,704 288,228 298,126
Other expenditure 3,712,730 4,061,050 4,400,014 3,046,070 2,331,544 2,331,544 2,318,237 2,546,565 2,691,414
Loss on disposal of PPE 3,235 8,302 8,563 387 462 462 488 515 543
Total Expenditure 27,505,765 30,847,500 33,023,632 38,322,274 37,343,751 37,343,751 39,604,509 43,793,988 47,196,893
Surplus/(Deficit) 1,979,044 2,179,956 3,287,124 (29,731) (412,159) (412,159) 55,168 530,650 1,397,736
Transfers and subsidies - capital (monetary allocations)
(National / Provincial and District)
2,423,179 2,131,537 2,005,297 2,268,835 2,092,130 2,092,130 2,067,896 2,118,842 2,296,333
Transfers and subsidies - capital (monetary allocations)
(National / Provincial Departmental Agencies,
Households, Non-profit Institutions, Private Enterprises,
Public Corporatons, Higher Educational Institutions)
44,219 61,488 71,882 84,900 96,585 96,585 76,200 78,600 112,100
Transfers and subsidies - capital (in-kind - all) 4,953 100 16,516 – – – – – –
Surplus/(Deficit) after capital transfers &
contributions4,451,394 4,373,082 5,380,818 2,324,004 1,776,556 1,776,556 2,199,264 2,728,092 3,806,169
Taxation 18,576 20,007 13,983 – – – – – –
Surplus/(Deficit) after taxation 4,432,818 4,353,075 5,366,835 2,324,004 1,776,556 1,776,556 2,199,264 2,728,092 3,806,169
Attributable to minorities 13,847 13,918 12,500 194,396 191,505 191,505 (8,783) (9,732) (10,316)
Surplus/(Deficit) attributable to municipality 4,446,665 4,366,993 5,379,335 2,518,400 1,968,061 1,968,061 2,190,481 2,718,360 3,795,854
Share of surplus/ (deficit) of associate – – – – – – – – –
Surplus/(Deficit) for the year 4,446,665 4,366,993 5,379,335 2,518,400 1,968,061 1,968,061 2,190,481 2,718,360 3,795,854
Current Year 2017/182018/19 Medium Term Revenue & Expenditure
Framework

City of Cape Town - 2018/19 Budget (including additional recommendations read in at the Council meeting of 30 May 2018
Page 203
Table 102 – MBRR Table A5 Consolidated Budgeted Capital Expenditure by vote, standard classification
and funding
Vote Description 2014/15 2015/16 2016/17
R thousandAudited
Outcome
Audited
Outcome
Audited
Outcome
Original
Budget
Adjusted
Budget
Full Year
Forecast
Budget Year
2018/19
Budget Year
+1 2019/20
Budget Year
+2 2020/21
Capital expenditure - Vote
Multi-year expenditure to be appropriated
Vote 1 - Area-Based Service Delivery 6,981 11,287 12,384 39,430 19,648 19,576 13,110 82,870 74,870
Vote 2 - Assets & Facilities Management 505,910 289,059 358,089 394,119 430,422 424,688 413,287 301,701 91,372
Vote 3 - City Manager 763 816 997 2,404 2,523 2,224 735 735 760
Vote 4 - Corporate Services 323,414 337,912 266,229 366,613 379,349 378,041 354,597 342,571 336,546
Vote 5 - Energy 952,415 1,090,855 1,248,887 1,292,814 1,177,050 1,103,282 1,113,506 1,427,000 1,741,137
Vote 6 - Finance 43,231 38,133 23,989 18,036 14,610 14,444 20,549 65,419 35,411
Vote 7 - Informal Settlements, Water & Waste Services 1,291,505 1,698,228 1,828,616 2,445,238 3,654,940 2,514,629 4,206,581 5,681,026 5,968,036
Vote 8 - Safety & Security 83,097 152,051 114,835 191,120 160,128 160,040 196,078 79,515 42,115
Vote 9 - Social Services 243,995 229,454 243,940 283,413 279,906 276,641 315,508 238,127 215,704
Vote 10 - Transport & Urban Development Authority 1,800,430 1,642,040 1,806,655 1,942,035 1,562,428 1,521,389 1,773,606 1,596,358 1,600,833
Vote 11 - Cape Town International Convention Centre 81,879 380,306 367,936 47,982 175,476 175,476 49,193 40,631 43,069
Vote 12 - Cape Town Stadium Entity – – – – – – – – –
Total Capital Expenditure - Vote 5,333,621 5,870,140 6,272,557 7,023,203 7,856,479 6,590,431 8,456,748 9,855,952 10,149,854
Capital Expenditure - Functional
Governance and administration 626,449 750,055 1,073,026 1,244,434 1,206,296 1,226,746 986,516 827,799 856,764
Executive and council 4,227 19,672 9,164 3,594 4,725 4,655 4,380 5,180 3,480
Finance and administration 622,098 730,250 1,063,731 1,239,881 1,200,612 1,221,411 982,005 822,487 853,224
Internal audit 124 133 131 959 959 680 131 131 60
Community and public safety 1,258,375 640,879 773,993 955,697 808,387 781,182 1,082,792 1,006,810 880,569
Community and social services 132,294 160,898 127,329 151,270 143,487 133,263 97,129 107,017 66,323
Sport and recreation 123,797 113,637 127,927 105,711 113,891 103,414 84,261 23,766 26,178
Public safety 20,011 12,272 18,865 46,799 20,354 20,354 35,064 7,659 7,659
Housing 962,099 336,949 476,876 606,733 488,196 479,769 794,497 817,971 732,913
Health 20,173 17,122 22,996 45,183 42,460 44,381 71,841 50,396 47,496
Economic and environmental services 1,317,978 1,576,687 1,578,032 1,662,703 1,442,449 1,404,040 1,389,642 1,211,925 1,197,686
Planning and development 59,335 66,962 70,697 44,786 37,512 37,239 39,904 76,795 96,723
Road transport 1,247,713 1,492,691 1,495,384 1,599,888 1,387,328 1,348,526 1,331,443 1,120,251 1,094,021
Environmental protection 10,930 17,034 11,951 18,028 17,608 18,275 18,294 14,880 6,942
Trading services 2,046,941 2,521,327 2,474,957 3,104,956 4,216,440 2,995,557 4,939,787 6,761,392 7,166,070
Energy sources 920,376 1,050,923 1,131,636 1,183,872 1,065,474 995,023 1,071,737 1,422,800 1,643,542
Water management 509,417 641,907 608,426 853,967 2,301,319 1,251,039 2,366,730 3,097,400 3,297,047
Waste water management 460,858 680,773 659,092 684,576 658,872 623,226 1,135,113 1,673,849 1,716,148
Waste management 156,289 147,724 75,803 382,541 190,776 126,269 366,207 567,344 509,333
Other 83,878 381,192 372,549 55,414 182,907 182,906 58,011 48,026 48,764
Total Capital Expenditure - Functional 5,333,621 5,870,140 6,272,557 7,023,203 7,856,479 6,590,431 8,456,748 9,855,952 10,149,854
Funded by:
National Government 2,189,129 2,030,362 2,009,376 2,189,832 2,057,467 2,037,622 2,015,146 1,993,692 2,138,633
Provincial Government 282,292 156,729 46,130 79,002 34,663 34,439 52,750 125,150 157,700
District Municipality – – – – – – – – –
Other transfers and grants 1,892 333 – – – – – – –
Transfers recognised - capital 2,473,313 2,187,425 2,055,507 2,268,835 2,092,130 2,072,060 2,067,896 2,118,842 2,296,333
Public contributions & donations 44,219 61,488 71,882 84,900 96,585 87,522 76,200 78,600 112,100
Borrowing 2,152,377 2,441,423 2,739,196 2,894,482 4,000,000 2,891,804 4,000,000 5,700,000 6,000,000
Internally generated funds 663,712 1,179,805 1,405,973 1,774,986 1,667,764 1,539,045 2,312,652 1,958,511 1,741,420
Total Capital Funding 5,333,621 5,870,140 6,272,557 7,023,203 7,856,479 6,590,431 8,456,748 9,855,952 10,149,854
Current Year 2017/182018/19 Medium Term Revenue & Expenditure
Framework
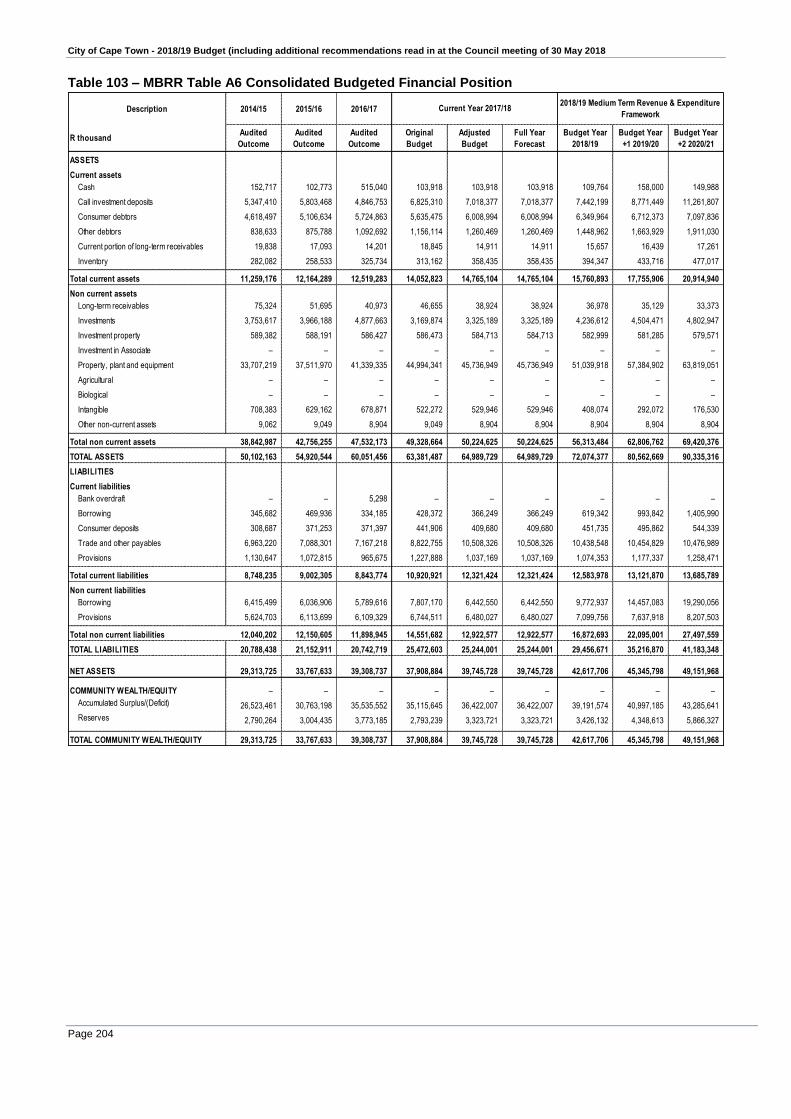
City of Cape Town - 2018/19 Budget (including additional recommendations read in at the Council meeting of 30 May 2018
Page 204
Table 103 – MBRR Table A6 Consolidated Budgeted Financial Position
Description 2014/15 2015/16 2016/17
R thousandAudited
Outcome
Audited
Outcome
Audited
Outcome
Original
Budget
Adjusted
Budget
Full Year
Forecast
Budget Year
2018/19
Budget Year
+1 2019/20
Budget Year
+2 2020/21
ASSETS
Current assets
Cash 152,717 102,773 515,040 103,918 103,918 103,918 109,764 158,000 149,988
Call investment deposits 5,347,410 5,803,468 4,846,753 6,825,310 7,018,377 7,018,377 7,442,199 8,771,449 11,261,807
Consumer debtors 4,618,497 5,106,634 5,724,863 5,635,475 6,008,994 6,008,994 6,349,964 6,712,373 7,097,836
Other debtors 838,633 875,788 1,092,692 1,156,114 1,260,469 1,260,469 1,448,962 1,663,929 1,911,030
Current portion of long-term receivables 19,838 17,093 14,201 18,845 14,911 14,911 15,657 16,439 17,261
Inventory 282,082 258,533 325,734 313,162 358,435 358,435 394,347 433,716 477,017
Total current assets 11,259,176 12,164,289 12,519,283 14,052,823 14,765,104 14,765,104 15,760,893 17,755,906 20,914,940
Non current assets
Long-term receivables 75,324 51,695 40,973 46,655 38,924 38,924 36,978 35,129 33,373
Investments 3,753,617 3,966,188 4,877,663 3,169,874 3,325,189 3,325,189 4,236,612 4,504,471 4,802,947
Investment property 589,382 588,191 586,427 586,473 584,713 584,713 582,999 581,285 579,571
Investment in Associate – – – – – – – – –
Property, plant and equipment 33,707,219 37,511,970 41,339,335 44,994,341 45,736,949 45,736,949 51,039,918 57,384,902 63,819,051
Agricultural – – – – – – – – –
Biological – – – – – – – – –
Intangible 708,383 629,162 678,871 522,272 529,946 529,946 408,074 292,072 176,530
Other non-current assets 9,062 9,049 8,904 9,049 8,904 8,904 8,904 8,904 8,904
Total non current assets 38,842,987 42,756,255 47,532,173 49,328,664 50,224,625 50,224,625 56,313,484 62,806,762 69,420,376
TOTAL ASSETS 50,102,163 54,920,544 60,051,456 63,381,487 64,989,729 64,989,729 72,074,377 80,562,669 90,335,316
LIABILITIES
Current liabilities
Bank overdraft – – 5,298 – – – – – –
Borrowing 345,682 469,936 334,185 428,372 366,249 366,249 619,342 993,842 1,405,990
Consumer deposits 308,687 371,253 371,397 441,906 409,680 409,680 451,735 495,862 544,339
Trade and other payables 6,963,220 7,088,301 7,167,218 8,822,755 10,508,326 10,508,326 10,438,548 10,454,829 10,476,989
Provisions 1,130,647 1,072,815 965,675 1,227,888 1,037,169 1,037,169 1,074,353 1,177,337 1,258,471
Total current liabilities 8,748,235 9,002,305 8,843,774 10,920,921 12,321,424 12,321,424 12,583,978 13,121,870 13,685,789
Non current liabilities
Borrowing 6,415,499 6,036,906 5,789,616 7,807,170 6,442,550 6,442,550 9,772,937 14,457,083 19,290,056
Provisions 5,624,703 6,113,699 6,109,329 6,744,511 6,480,027 6,480,027 7,099,756 7,637,918 8,207,503
Total non current liabilities 12,040,202 12,150,605 11,898,945 14,551,682 12,922,577 12,922,577 16,872,693 22,095,001 27,497,559
TOTAL LIABILITIES 20,788,438 21,152,911 20,742,719 25,472,603 25,244,001 25,244,001 29,456,671 35,216,870 41,183,348
NET ASSETS 29,313,725 33,767,633 39,308,737 37,908,884 39,745,728 39,745,728 42,617,706 45,345,798 49,151,968
COMMUNITY WEALTH/EQUITY – – – – – – – – –
Accumulated Surplus/(Deficit) 26,523,461 30,763,198 35,535,552 35,115,645 36,422,007 36,422,007 39,191,574 40,997,185 43,285,641
Reserves 2,790,264 3,004,435 3,773,185 2,793,239 3,323,721 3,323,721 3,426,132 4,348,613 5,866,327
TOTAL COMMUNITY WEALTH/EQUITY 29,313,725 33,767,633 39,308,737 37,908,884 39,745,728 39,745,728 42,617,706 45,345,798 49,151,968
Current Year 2017/182018/19 Medium Term Revenue & Expenditure
Framework

City of Cape Town - 2018/19 Budget (including additional recommendations read in at the Council meeting of 30 May 2018
Page 205
Table 104 – MBRR Table A7 Consolidated Budgeted Cash Flows
Description 2014/15 2015/16 2016/17
R thousandAudited
Outcome
Audited
Outcome
Audited
Outcome
Original
Budget
Adjusted
Budget
Full Year
Forecast
Budget Year
2018/19
Budget Year
+1 2019/20
Budget Year
+2 2020/21
CASH FLOW FROM OPERATING ACTIVITIES
Receipts
Property rates 6,018,735 6,745,047 8,105,126 8,344,028 8,127,674 8,127,674 8,968,987 9,795,009 10,630,877
Service charges 15,197,370 17,363,596 18,619,105 17,459,005 16,131,887 16,131,887 17,623,043 20,622,691 23,212,475
Other revenue 2,074,028 1,586,839 812,372 1,625,994 1,922,033 1,922,033 4,504,876 4,694,192 4,927,937
Government - operating 3,251,460 3,589,931 3,633,883 6,455,942 7,027,387 7,027,387 4,315,632 4,530,231 4,785,329
Government - capital 2,423,179 2,131,537 2,014,869 2,353,735 2,188,715 2,188,715 2,067,896 2,118,842 2,296,333
Interest 766,135 876,689 1,028,647 785,328 905,328 905,328 941,028 994,620 1,025,150
Payments
Suppliers and employees (22,752,383) (25,009,604) (26,788,771) (30,357,016) (30,546,353) (30,546,353) (32,261,821) (35,316,650) (37,893,706)
Finance charges (709,550) (687,305) (666,166) (985,478) (933,427) (933,427) (980,877) (1,418,058) (1,666,828)
Transfers and Grants (136,487) (148,246) (111,829) (140,985) – – (333,807) (356,864) (365,224)
NET CASH FROM/(USED) OPERATING ACTIVITIES 6,132,487 6,448,483 6,647,236 5,540,553 4,823,245 4,823,245 4,844,958 5,664,014 6,952,343
CASH FLOWS FROM INVESTING ACTIVITIES
Receipts
Proceeds on disposal of PPE 91,419 130,189 198,742 41,500 39,500 39,500 120,070 124,883 160,952
Decrease (Increase) in non-current debtors – – – – – – – – –
Decrease (increase) other non-current receivables 28,800 26,374 13,614 2,456 10,186 10,186 1,946 1,849 1,756
Decrease (increase) in non-current investments 366,983 (621,401) (410,412) (212,908) (212,908) (212,908) (238,708) (267,859) (298,475)
Payments
Capital assets (5,282,372) (5,870,139) (6,310,057) (6,938,045) (6,704,329) (6,704,329) (7,615,993) (8,874,420) (9,139,175)
NET CASH FROM/(USED) INVESTING ACTIVITIES (4,795,170) (6,334,977) (6,508,113) (7,106,997) (6,867,551) (6,867,551) (7,732,684) (9,015,548) (9,274,942)
CASH FLOWS FROM FINANCING ACTIVITIES
Receipts
Short term loans – – – – – – – – –
Borrowing long term/refinancing 202,715 117,000 193,000 2,500,000 4,000,000 4,000,000 4,000,000 5,700,000 6,000,000
Increase (decrease) in consumer deposits (97,959) 52,375 27,077 35,710 29,785 29,785 38,688 42,557 46,813
Payments
Repayment of borrowing (309,852) (285,597) (407,883) (435,159) (432,586) (432,586) (482,586) (745,678) (932,295)
NET CASH FROM/(USED) FINANCING ACTIVITIES (205,097) (116,222) (187,806) 2,100,551 3,597,199 3,597,199 3,556,102 4,996,879 5,114,518
NET INCREASE/ (DECREASE) IN CASH HELD 1,132,221 (2,716) (48,683) 534,106 1,552,893 1,552,893 668,375 1,645,345 2,791,918
Cash/cash equivalents at the year begin: 2,621,558 3,753,780 3,751,064 4,116,346 3,773,576 3,773,576 5,255,273 5,923,649 7,568,994
Cash/cash equivalents at the year end: 3,753,780 3,751,064 3,702,381 4,650,453 5,326,469 5,326,469 5,923,649 7,568,994 10,360,912
Current Year 2017/182018/19 Medium Term Revenue & Expenditure
Framework

City of Cape Town - 2018/19 Budget (including additional recommendations read in at the Council meeting of 30 May 2018
Page 206
Table 105 – MBRR Table A8 Consolidated Cash backed reserves/accumulated surplus reconciliation
Description 2014/15 2015/16 2016/17
R thousandAudited
Outcome
Audited
Outcome
Audited
Outcome
Original
Budget
Adjusted
Budget
Full Year
Forecast
Budget Year
2018/19
Budget Year
+1 2019/20
Budget Year
+2 2020/21
Cash and investments available
Cash/cash equivalents at the year end 3,753,780 3,751,064 3,702,381 4,650,453 5,326,469 5,326,469 5,923,649 7,568,994 10,360,912
Other current investments > 90 days 1,746,347 2,155,177 1,654,114 2,278,775 1,795,826 1,795,826 1,628,314 1,360,455 1,050,883
Non current assets - Investments 3,753,617 3,966,188 4,877,663 3,169,874 3,325,189 3,325,189 4,236,612 4,504,471 4,802,947
Cash and investments available: 9,253,744 9,872,429 10,234,158 10,099,102 10,447,484 10,447,484 11,788,575 13,433,920 16,214,742
Application of cash and investments
Unspent conditional transfers 1,527,445 1,199,955 1,054,374 680,263 1,740,079 1,740,079 1,460,147 1,772,337 2,112,983
Unspent borrowing – – – – – – – – –
Statutory requirements – – – – – – – – –
Other working capital requirements 308,212 (28,249) (391,475) 2,011,436 2,062,846 2,062,846 1,229,923 411,876 (501,675)
Other provisions – – – – – – 400,000 400,000 400,000
Long term investments committed 1,788,477 1,968,829 2,051,869 2,265,047 2,265,047 2,265,047 2,503,755 2,771,615 3,070,090
Reserves to be backed by cash/investments 2,790,264 3,004,435 3,773,185 3,100,264 3,421,363 3,421,363 3,426,132 4,348,613 5,866,327
Total Application of cash and investments: 6,414,398 6,144,970 6,487,953 8,057,010 9,489,335 9,489,335 9,019,957 9,704,441 10,947,725
Surplus(shortfall) 2,839,346 3,727,459 3,746,205 2,042,092 958,149 958,149 2,768,617 3,729,479 5,267,017
Current Year 2017/182018/19 Medium Term Revenue & Expenditure
Framework
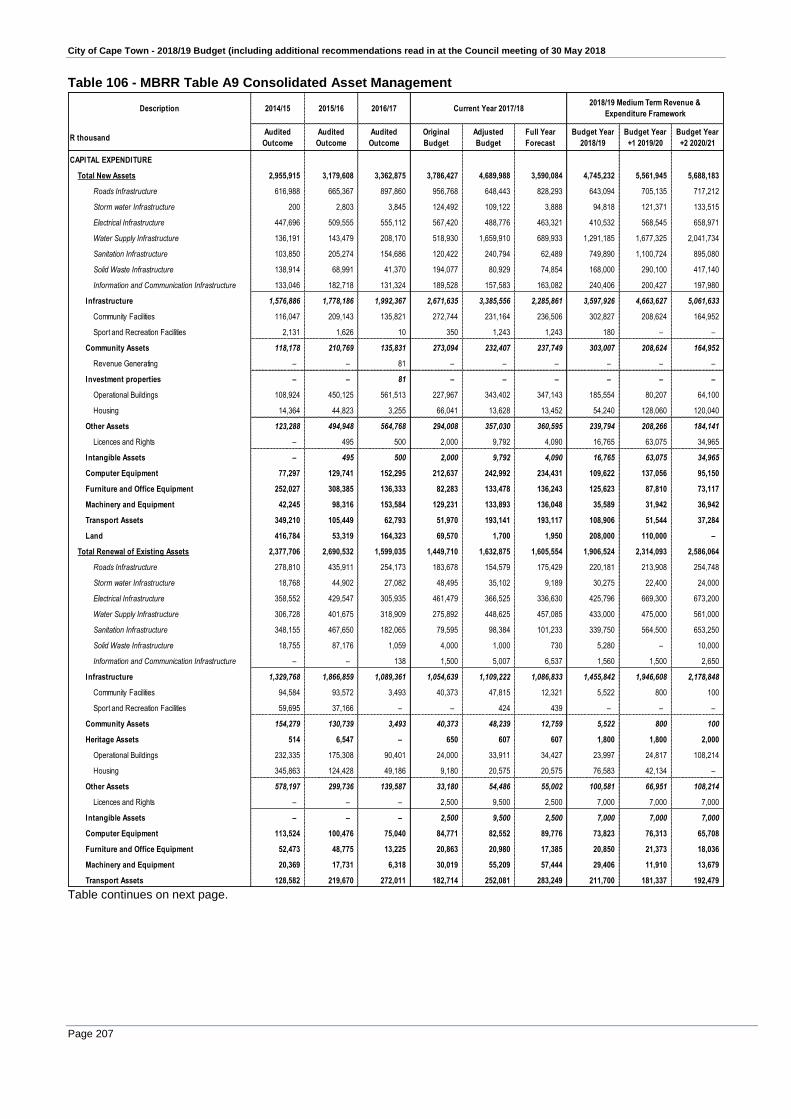
City of Cape Town - 2018/19 Budget (including additional recommendations read in at the Council meeting of 30 May 2018
Page 207
Table 106 - MBRR Table A9 Consolidated Asset Management
Table continues on next page.
Description 2014/15 2015/16 2016/17
R thousandAudited
Outcome
Audited
Outcome
Audited
Outcome
Original
Budget
Adjusted
Budget
Full Year
Forecast
Budget Year
2018/19
Budget Year
+1 2019/20
Budget Year
+2 2020/21
CAPITAL EXPENDITURE
Total New Assets 2,955,915 3,179,608 3,362,875 3,786,427 4,689,988 3,590,084 4,745,232 5,561,945 5,688,183
Roads Infrastructure 616,988 665,367 897,860 956,768 648,443 828,293 643,094 705,135 717,212
Storm water Infrastructure 200 2,803 3,845 124,492 109,122 3,888 94,818 121,371 133,515
Electrical Infrastructure 447,696 509,555 555,112 567,420 488,776 463,321 410,532 568,545 658,971
Water Supply Infrastructure 136,191 143,479 208,170 518,930 1,659,910 689,933 1,291,185 1,677,325 2,041,734
Sanitation Infrastructure 103,850 205,274 154,686 120,422 240,794 62,489 749,890 1,100,724 895,080
Solid Waste Infrastructure 138,914 68,991 41,370 194,077 80,929 74,854 168,000 290,100 417,140
Information and Communication Infrastructure 133,046 182,718 131,324 189,528 157,583 163,082 240,406 200,427 197,980
Infrastructure 1,576,886 1,778,186 1,992,367 2,671,635 3,385,556 2,285,861 3,597,926 4,663,627 5,061,633
Community Facilities 116,047 209,143 135,821 272,744 231,164 236,506 302,827 208,624 164,952
Sport and Recreation Facilities 2,131 1,626 10 350 1,243 1,243 180 – –
Community Assets 118,178 210,769 135,831 273,094 232,407 237,749 303,007 208,624 164,952
Revenue Generating – – 81 – – – – – –
Investment properties – – 81 – – – – – –
Operational Buildings 108,924 450,125 561,513 227,967 343,402 347,143 185,554 80,207 64,100
Housing 14,364 44,823 3,255 66,041 13,628 13,452 54,240 128,060 120,040
Other Assets 123,288 494,948 564,768 294,008 357,030 360,595 239,794 208,266 184,141
Licences and Rights – 495 500 2,000 9,792 4,090 16,765 63,075 34,965
Intangible Assets – 495 500 2,000 9,792 4,090 16,765 63,075 34,965
Computer Equipment 77,297 129,741 152,295 212,637 242,992 234,431 109,622 137,056 95,150
Furniture and Office Equipment 252,027 308,385 136,333 82,283 133,478 136,243 125,623 87,810 73,117
Machinery and Equipment 42,245 98,316 153,584 129,231 133,893 136,048 35,589 31,942 36,942
Transport Assets 349,210 105,449 62,793 51,970 193,141 193,117 108,906 51,544 37,284
Land 416,784 53,319 164,323 69,570 1,700 1,950 208,000 110,000 –
Total Renewal of Existing Assets 2,377,706 2,690,532 1,599,035 1,449,710 1,632,875 1,605,554 1,906,524 2,314,093 2,586,064
Roads Infrastructure 278,810 435,911 254,173 183,678 154,579 175,429 220,181 213,908 254,748
Storm water Infrastructure 18,768 44,902 27,082 48,495 35,102 9,189 30,275 22,400 24,000
Electrical Infrastructure 358,552 429,547 305,935 461,479 366,525 336,630 425,796 669,300 673,200
Water Supply Infrastructure 306,728 401,675 318,909 275,892 448,625 457,085 433,000 475,000 561,000
Sanitation Infrastructure 348,155 467,650 182,065 79,595 98,384 101,233 339,750 564,500 653,250
Solid Waste Infrastructure 18,755 87,176 1,059 4,000 1,000 730 5,280 – 10,000
Information and Communication Infrastructure – – 138 1,500 5,007 6,537 1,560 1,500 2,650
Infrastructure 1,329,768 1,866,859 1,089,361 1,054,639 1,109,222 1,086,833 1,455,842 1,946,608 2,178,848
Community Facilities 94,584 93,572 3,493 40,373 47,815 12,321 5,522 800 100
Sport and Recreation Facilities 59,695 37,166 – – 424 439 – – –
Community Assets 154,279 130,739 3,493 40,373 48,239 12,759 5,522 800 100
Heritage Assets 514 6,547 – 650 607 607 1,800 1,800 2,000
Operational Buildings 232,335 175,308 90,401 24,000 33,911 34,427 23,997 24,817 108,214
Housing 345,863 124,428 49,186 9,180 20,575 20,575 76,583 42,134 –
Other Assets 578,197 299,736 139,587 33,180 54,486 55,002 100,581 66,951 108,214
Licences and Rights – – – 2,500 9,500 2,500 7,000 7,000 7,000
Intangible Assets – – – 2,500 9,500 2,500 7,000 7,000 7,000
Computer Equipment 113,524 100,476 75,040 84,771 82,552 89,776 73,823 76,313 65,708
Furniture and Office Equipment 52,473 48,775 13,225 20,863 20,980 17,385 20,850 21,373 18,036
Machinery and Equipment 20,369 17,731 6,318 30,019 55,209 57,444 29,406 11,910 13,679
Transport Assets 128,582 219,670 272,011 182,714 252,081 283,249 211,700 181,337 192,479
Current Year 2017/182018/19 Medium Term Revenue &
Expenditure Framework

City of Cape Town - 2018/19 Budget (including additional recommendations read in at the Council meeting of 30 May 2018
Page 208
Table continues on next page
Description 2014/15 2015/16 2016/17
R thousandAudited
Outcome
Audited
Outcome
Audited
Outcome
Original
Budget
Adjusted
Budget
Full Year
Forecast
Budget Year
2018/19
Budget Year
+1 2019/20
Budget Year
+2 2020/21
CAPITAL EXPENDITURE
Total Upgrading of Existing Assets – – 1,310,647 1,787,066 1,533,616 1,394,793 1,804,992 1,979,914 1,875,607
Roads Infrastructure – – 270,595 292,589 253,066 241,689 303,053 210,632 239,813
Storm water Infrastructure – – 25,054 12,925 45,169 1,562 9,200 122,000 47,400
Electrical Infrastructure – – 208,812 86,976 114,663 113,220 142,738 145,693 232,196
Water Supply Infrastructure – – 52,702 106,645 97,690 93,514 36,575 37,500 25,000
Sanitation Infrastructure – – 288,558 494,930 376,653 367,769 674,202 846,750 875,905
Solid Waste Infrastructure – – 10,933 25,000 25,533 12,374 82,176 91,628 32,742
Information and Communication Infrastructure – – 2,497 – – – – – 351
Infrastructure – – 859,151 1,019,065 912,774 830,129 1,247,944 1,454,202 1,453,408
Community Facilities – – 148,344 164,694 142,999 135,301 198,803 165,922 107,185
Sport and Recreation Facilities – – 57,234 53,849 44,587 51,007 39,427 20,731 70,269
Community Assets – – 205,578 218,543 187,586 186,308 238,230 186,653 177,453
Heritage Assets – – 38,955 6,800 7,530 7,530 – – –
Operational Buildings – – 163,823 385,433 301,727 249,984 244,422 253,443 184,546
Housing – – 24,283 91,717 80,779 76,539 24,822 55,866 22,150
Other Assets – – 188,106 477,151 382,506 326,523 269,245 309,309 206,696
Licences and Rights – – 3,931 29,756 21,775 8,769 21,402 11,450 6,250
Intangible Assets – – 3,931 29,756 21,775 8,769 21,402 11,450 6,250
Computer Equipment – – 1,355 6,100 167 13,765 – – –
Furniture and Office Equipment – – 9,037 19,651 17,861 17,852 17,176 12,300 22,050
Machinery and Equipment – – 4,534 10,000 3,417 3,917 10,995 6,000 9,750
Total Capital Expenditure
Roads Infrastructure 895,797 1,101,277 1,422,628 1,433,035 1,056,088 1,245,411 1,166,328 1,129,675 1,211,774
Storm water Infrastructure 18,968 47,705 55,981 185,912 189,393 14,640 134,293 265,771 204,915
Electrical Infrastructure 806,249 939,102 1,069,858 1,115,875 969,964 913,171 979,066 1,383,538 1,564,367
Water Supply Infrastructure 442,919 545,153 579,781 901,467 2,206,225 1,240,532 1,760,760 2,189,825 2,627,734
Sanitation Infrastructure 452,005 672,924 625,309 694,946 715,830 531,491 1,763,843 2,511,974 2,424,235
Solid Waste Infrastructure 157,670 156,167 53,361 223,077 107,461 87,958 255,456 381,728 459,882
Rail Infrastructure – – – – – – – – –
Coastal Infrastructure – – – – – – – – –
Information and Communication Infrastructure 133,046 182,718 133,959 191,028 162,590 169,619 241,966 201,927 200,981
Infrastructure 2,906,654 3,645,045 3,940,879 4,745,340 5,407,552 4,202,823 6,301,712 8,064,438 8,693,889
Community Facilities 210,631 302,715 287,658 477,810 421,979 384,129 507,152 375,346 272,237
Sport and Recreation Facilities 61,826 38,793 57,244 54,199 46,253 52,688 39,607 20,731 70,269
Community Assets 272,457 341,508 344,901 532,010 468,232 436,816 546,759 396,077 342,506
Heritage Assets 514 6,547 38,955 7,450 8,137 8,137 1,800 1,800 2,000
Revenue Generating – – 81 – – – – – –
Investment properties – – 81 – – – – – –
Operational Buildings 341,259 625,433 815,737 637,400 679,039 631,554 453,973 358,467 356,860
Housing 360,226 169,251 76,724 166,938 114,982 110,566 155,646 226,060 142,190
Other Assets 701,485 794,683 892,461 804,339 794,021 742,119 609,619 584,526 499,050
Licences and Rights – 495 4,431 34,256 41,067 15,359 45,167 81,525 48,215
Intangible Assets – 495 4,431 34,256 41,067 15,359 45,167 81,525 48,215
Computer Equipment 190,821 230,218 228,690 303,508 325,710 337,971 183,445 213,370 160,858
Furniture and Office Equipment 304,500 357,160 158,595 122,797 172,319 171,480 163,649 121,483 113,203
Machinery and Equipment 62,614 116,047 164,437 169,250 192,520 197,409 75,990 49,852 60,370
Transport Assets 477,791 325,119 334,804 234,684 445,222 476,366 320,606 232,881 229,762
Land 416,784 53,319 164,323 69,570 1,700 1,950 208,000 110,000 –
TOTAL CAPITAL EXPENDITURE - Asset class 5,333,621 5,870,140 6,272,557 7,023,203 7,856,479 6,590,431 8,456,748 9,855,952 10,149,854
Current Year 2017/182018/19 Medium Term Revenue &
Expenditure Framework

City of Cape Town - 2018/19 Budget (including additional recommendations read in at the Council meeting of 30 May 2018
Page 209
Table continues on next page
Description 2014/15 2015/16 2016/17
R thousandAudited
Outcome
Audited
Outcome
Audited
Outcome
Original
Budget
Adjusted
Budget
Full Year
Forecast
Budget Year
2018/19
Budget Year
+1 2019/20
Budget Year
+2 2020/21
ASSET REGISTER SUMMARY - PPE (WDV)
Roads Infrastructure 5,407,043 5,801,545 7,848,021 7,350,826 8,662,678 8,662,678 9,415,671 10,096,569 10,818,637
Storm water Infrastructure 620,126 673,066 734,352 994,374 870,338 870,338 944,325 1,144,013 1,285,062
Electrical Infrastructure 5,309,846 6,128,665 6,941,124 7,786,614 7,649,556 7,649,556 8,328,033 9,365,031 10,545,953
Water Supply Infrastructure 1,943,653 2,286,374 2,640,397 3,312,937 4,532,731 4,532,731 5,942,405 7,633,504 9,688,877
Sanitation Infrastructure 2,182,565 2,629,979 2,876,204 3,542,502 3,206,469 3,206,469 4,624,837 6,746,001 8,715,726
Solid Waste Infrastructure 496,906 724,955 744,567 937,173 780,119 780,119 974,112 1,286,514 1,673,305
Rail Infrastructure – – – – – – – – –
Coastal Infrastructure – – – – – – – – –
Information and Communication Infrastructure 2,435,659 3,054,072 3,815,860 3,200,737 3,938,357 3,938,357 4,133,382 4,280,904 4,426,728
Infrastructure 18,395,798 21,298,655 25,600,525 27,125,163 29,640,250 29,640,250 34,362,764 40,552,537 47,154,288
Community Facilities 2,487,054 2,570,657 4,154,769 2,491,982 4,464,953 4,464,953 4,843,527 5,088,067 5,224,319
Sport and Recreation Facilities 4,136,786 3,916,192 3,792,476 3,807,667 3,617,884 3,617,884 3,437,004 3,242,751 3,102,425
Community Assets 6,623,840 6,486,848 7,947,245 6,299,648 8,082,837 8,082,837 8,280,531 8,330,817 8,326,744
Heritage Assets 9,062 9,049 8,904 9,049 8,904 8,904 8,904 8,904 8,904
Revenue Generating 40,633 69,959 68,247 68,242 66,533 66,533 64,819 63,106 61,392
Non-revenue Generating 548,749 518,232 518,180 518,232 518,180 518,180 518,180 518,180 518,180
Investment properties 589,382 588,191 586,427 586,474 584,713 584,713 582,999 581,286 579,572
Operational Buildings 2,502,465 3,683,319 1,618,193 4,187,727 1,448,116 1,448,116 1,700,524 1,852,172 1,998,723
Housing 1,736,863 1,993,969 2,132,053 2,135,419 2,143,924 2,143,924 2,192,123 2,303,145 2,328,727
Other Assets 4,239,328 5,677,288 3,750,245 6,323,146 3,592,040 3,592,040 3,892,647 4,155,317 4,327,450
Licences and Rights 708,383 629,162 678,871 522,272 529,946 529,946 450,982 412,429 342,691
Intangible Assets 708,383 629,162 678,871 522,272 529,946 529,946 450,982 412,429 342,691
Computer Equipment 626,814 600,944 591,849 902,893 682,068 682,068 618,390 575,530 486,971
Furniture and Office Equipment 364,513 377,007 371,021 527,895 417,541 417,541 446,527 429,368 421,686
Machinery and Equipment 253,587 256,778 643,105 478,501 876,431 876,431 847,927 771,597 703,464
Transport Assets 1,939,877 2,040,575 1,440,265 2,272,442 1,449,002 1,449,002 1,420,343 1,287,193 1,144,115
Land 1,263,463 773,875 995,081 1,064,651 996,781 996,781 1,127,881 1,162,223 1,088,172
TOTAL ASSET REGISTER SUMMARY - PPE (WDV) 35,014,046 38,738,372 42,613,537 46,112,134 46,860,511 46,860,511 52,039,895 58,267,201 64,584,056
Current Year 2017/182018/19 Medium Term Revenue &
Expenditure Framework

City of Cape Town - 2018/19 Budget (including additional recommendations read in at the Council meeting of 30 May 2018
Page 210
*The section on ‘Upgrading of Existing Assets’ in table A9 was introduced via Version 6.1 of the MBRR Schedule
A - refer NT Budget Circular 85 (dated 9 December 2016). Records older than 2016/17 cannot be split into this
category as the indicator does not exist on older records.
Description 2014/15 2015/16 2016/17
R thousandAudited
Outcome
Audited
Outcome
Audited
Outcome
Original
Budget
Adjusted
Budget
Full Year
Forecast
Budget Year
2018/19
Budget Year
+1 2019/20
Budget Year
+2 2020/21
EXPENDITURE OTHER ITEMS
Depreciation 1,940,102 2,142,168 2,337,895 3,277,476 3,225,455 3,225,455 2,790,530 3,067,806 3,253,617
Repairs and Maintenance by Asset Class 3,010,357 3,347,230 3,769,614 4,048,266 3,767,687 3,781,145 4,012,578 4,320,924 4,660,206
Roads Infrastructure 690,603 592,642 609,310 664,923 656,419 631,419 671,164 700,536 746,421
Storm water Infrastructure – – – – – – – – –
Electrical Infrastructure 467,531 512,940 504,116 523,507 503,480 503,180 536,787 571,679 609,122
Water Supply Infrastructure 413,630 455,983 482,019 421,887 396,382 396,382 548,620 621,440 698,473
Sanitation Infrastructure 389,040 424,040 447,780 418,866 366,166 366,166 401,043 465,225 515,041
Solid Waste Infrastructure 1,758 2,774 2,497 2,303 3,850 3,850 4,104 4,371 4,657
Infrastructure 1,962,562 1,988,379 2,045,722 2,031,486 1,926,297 1,900,997 2,161,718 2,363,252 2,573,715
Community Facilities 78,026 85,482 115,109 100,442 94,820 96,620 100,533 106,908 113,912
Sport and Recreation Facilities 241,286 301,035 381,822 447,605 390,717 390,717 264,926 281,329 298,702
Community Assets 319,312 386,517 496,931 548,047 485,537 487,337 365,459 388,238 412,614
Heritage Assets 986 461 1,647 1,812 1,811 1,811 1,928 2,053 2,188
Revenue Generating 11,083 26,566 19,001 64 136 148 16 17 18
Non-revenue Generating – – – 19,735 12,740 12,740 20,694 22,040 23,483
Investment properties 11,083 26,566 19,001 19,800 12,877 12,888 20,710 22,057 23,501
Operational Buildings 84,710 97,945 148,865 144,517 144,999 150,183 194,813 204,157 219,227
Housing – – – – – – – – –
Other Assets 84,710 97,945 148,865 144,517 144,999 150,183 194,813 204,157 219,227
Computer Equipment 117,859 144,340 179,935 312,785 258,652 258,662 269,549 277,899 296,120
Furniture and Office Equipment 360,714 354,833 424,463 517,979 516,129 522,882 551,321 587,095 625,455
Machinery and Equipment – – – – – – – – –
Transport Assets 153,131 348,190 453,049 471,840 421,385 446,385 447,079 476,172 507,387
TOTAL EXPENDITURE OTHER ITEMS 4,950,459 5,489,398 6,107,509 7,325,741 6,993,142 7,006,600 6,803,107 7,388,730 7,913,824
Renewal and upgrading of Existing Assets as % of total capex 44.6% 45.8% 46.4% 46.1% 40.3% 45.5% 43.9% 43.6% 44.0%
Renewal and upgrading of Existing Assets as % of deprecn 122.6% 125.6% 124.5% 98.8% 98.2% 93.0% 133.0% 140.0% 137.1%
R&M as a % of PPE 8.9% 8.9% 9.1% 9.0% 8.2% 8.3% 7.9% 7.5% 7.3%
Renewal and upgrading and R&M as a % of PPE 15.0% 16.0% 16.0% 16.0% 15.0% 14.0% 15.0% 15.0% 14.0%
Current Year 2017/182018/19 Medium Term Revenue &
Expenditure Framework
City of Cape Town - 2018/19 Budget (including additional recommendations read in at the Council meeting of 30 May 2018
Page 211
2.21 Municipal manager’s quality certificate
I, LUNGELO MBANDAZAYO, municipal manager of CITY OF CAPE TOWN, hereby certify that the
annual budget and supporting documentation have been prepared in accordance with the Municipal
Finance Management Act, and that the annual budget and supporting documents are consistent with
the Integrated Development Plan of the municipality.
Signature ______________________________
Date ______________________________
City of Cape Town - 2018/19 Budget (including additional recommendations read in at the Council meeting of 30 May 2018
Page 212
2.22 Additional Recommendations read in at the Special Council meeting on 30 May 2018
1. Amendment (Reduction) of Film Tariffs – Safety & Security It is recommended that: (a) 2018/19 Film tariffs to remain the same as the 2017/18 financial year’s tariffs. The
impact of the unchanged film tariff will be absorbed by an increase on Fire fees revenue (profit centre P18060021, profit element 811700) in the 2018/19 Operating Budget.
(b) the relevant legislated MBRR Schedule A tables and tariff book be amended after Council approval, before the submission of the 2018/19 Budget to National Treasury.
2. Amendment to Capital Budget Project – Assets & Facilities Management It is therefore recommended that: a) Appropriating further allocations of R11 065 152 and R7 227 923 to the 2018/19
Capital Budget on Approval Object CPX/0000923 FM Infrastructure, within the Assets and Facilities Management Directorate, funded from Revenue in the 2018/19 and 2019/20 financial years, respectively.
b) the relevant legislated MBRR Schedule A tables be amended after Council approval, before the submission of the 2018/19 Budget to National Treasury.
3. Amendment to budget tables to include organisational structure change serving
before Council - Finance
It is recommended that: (a) Subject to Council’s consideration and subsequent approval of item C 22/05/18
dealing with the ALMALGAMATION OF THE VACANT EXECUTIVE DIRECTOR: CORPORATE SERVICES AND EXECUTIVE DIRECTOR: STRATEGIC GOVERNANCE POSITIONS at the Council meeting on 31 May 2018, the relevant legislated MBRR Schedule A tables contained in item SPC04/05/18 BUDGET 2018/19 TO 2020/21 be amended after Council approval, before the submission of the 2018/19 Budget to National Treasury
4. Addition to General Tariff Policy and Water & Sanitation Tariffs – Informal
Settlements. Water & Waste Services
It is recommended that:
(a) the following paragraph be added as 8.6 of the General Tariff Policy: 8.6 - Cluster Development Properties registered in the name of a SHRA-accredited
Social Housing Institution and, registered as City Partners – Full and Conditional may be granted access to:

City of Cape Town - 2018/19 Budget (including additional recommendations read in at the Council meeting of 30 May 2018
Page 213
- Water to a maximum of 6 000 liters per qualifying unit per month at R Nil.
- Sanitation to a maximum of 4 200 liters per qualifying unit per months at R Nil.
In order to qualify, accredited Social Housing Institution and, registered as City Partners – Full and Conditional must supply documentation of units where:
- The municipal valuation of the property is R400 000 or less.
- The household income is R4 000 per month or less.
Institutions must apply on an annual basis and provide the property value and household income to the satisfaction of the Director: Revenue and the Director: Water and Sanitation. Single Residential and Non-Residential Properties of such institutions will not qualify in terms of this paragraph
(b) That the tariff schedules be amended as follows: The inclusion of an additional category of “Domestic Cluster – Social Housing Institutions – City Partners” in all the Water and Sanitation Level 1 to Level 7 restriction tariffs be approved;
(c) The steps for tariffs for “Domestic Cluster – Social Housing Institutions – City Partners”
category within each restriction level be in line with the “Domestic Cluster Non-Indigent” category except Step 1 to be R Nil.
(d) the relevant legislated MBRR Schedule A tables and tariff book be amended after
Council approval, before the submission of the 2018/19 Budget to National Treasury.
5. Amendment (reduction) to Parking Fees - Transport & Urban Development Authority
It is recommended that: (a) the proposed inflation-linked increase on Parking Fees tariff be suspended until such
time as the new parking system is implemented and the 2018/19 Parking tariffs to remain the same as the 2017/18 financial year’s tariffs. The impact of the unchanged Parking Fees tariff will be absorbed by a reduction of on both revenue and expenditure as follows:
i. Parking Fees Revenue (profit centre P19070022, profit element 812300) -
R82,704,667
ii. Advisory Services – Project Management (cost centre 190070022, cost element 452070 in the 2018/19 Operating Budget – R82,704,667
(b) the relevant legislated MBRR Schedule A tables and tariff book be amended after
Council approval, before the submission of the 2018/19 Budget to National Treasury.

City of Cape Town - 2018/19 Budget (including additional recommendations read in at the Council meeting of 30 May 2018
Page 214
6. Amendment to Capital projects – Paardevlei Transport & Urban Development Authority and Informal Settlements. Water & Waste Services
It is recommended that: (a) The following amendments be included in respect of projects relating to the Paardevlei
development, to bring the 2018/19 budgetary provisions in line with the latest implementation plans:
(b) That the relevant legislated MBRR Schedule A tables be amended after Council approval, before the submission of the 2018/19 Budget to National Treasury.