Embed Size (px)
Citation preview

2670 Chem. Commun., 2011, 47, 2670–2672 This journal is c The Royal Society of Chemistry 2011
Cite this: Chem. Commun., 2011, 47, 2670–2672
Quininium mandelates—a systematic study of chiral discrimination in
crystals of diastereomeric saltsw
Nikoletta B. Bathori,*aLuigi R. Nassimbeni
aand Clive L. Oliver
b
Received 7th October 2010, Accepted 10th December 2010
DOI: 10.1039/c0cc04279j
The selectivity profile for the resolution of mandelic acid by
quinine is dominated by structures comprising (QUIN+)-
(MAND�) salts with Z0 = 3 which contain (R)-, (R)- and
(S)-mandelate anions.
The resolution of racemic modifications by a chiral resolving
agent is generally achieved either by diastereomer salt formation
or by inclusion with a chiral host compound. The former
method is the most common, and has been reviewed.1
The cinchona alkaloids, of which quinine is the most
abundant, have been used extensively as resolving agents for
acids1,2 and the pairs quinine/quinidine and cinchonidine/
cinchonine have been described as ‘‘quasi-enantiomeric’’.3
Larsen4,5 has described the structures of the salts formed by
cinchonine and cinchonidine with both (R)- and (S)-mandelic
acids. She concluded that cinchoninium (R)-mandelate is the less
soluble salt and its structure displays disorder in the –CH=CH2
moiety. In contrast, cinchonidinium-(S)-mandelate is the less
soluble salt. The thermal and solubility parameters of the four
salts were reconciled with their crystal structures and it was
noted that the packing of the cinchonidinium salts was
significantly different from their corresponding cinchoninium
salts.
We have taken a somewhat different approach to the question
of enantiomeric resolution in order to understand the mechanism
of the molecular recognition that drives the differentiation of the
resolving agent for one particular enantiomer. We have thus set
up a series of competition experiments where the resolving agent,
quinine (QUIN) was exposed to mixtures of mandelic acid, where
the mole fraction of the starting mixture was varied systematically.
The ensuing solutions were allowed to crystallise and the mole
fraction of the entrapped enantiomer was measured by analysing
the crystal structure. This is an extension of the technique
employed to measure the selectivity profile of a given host
compound (H) towards a pair of guests A and B, whereby H is
dissolved in a series of solutions where the mole fractionXA varies
in steps from 0 to 1. The resulting crystals are analysed, yielding
mole fractions of A as ZA. The selectivity coefficient at each point
is then defined as
KA:B = (KB:A)�1 = ZA/ZB � XB/XA ; (XA + XB = 1)
and is a measure of the discrimination of the host for a given
guest. In our case the two guests are replaced by (R)- and
(S)-mandelic acids.
The crystals were grown by slow evaporation from solution
containing 1 mmol of quinine (QUIN) and 1 mmol of
mandelic acid (MAND) in 20 mL of ethanol. The mole
fraction of the (R)-mandelic acid in the starting solution was
varied systematically as XR (%) = 15, 30, 70 and 100. The
crystals were analysed by X-ray diffraction and the crystallo-
graphic data are summarised in the ESIw in Table 1S.zRefinement revealed that all structures are salts of quininium
cations and mandelate anions (Scheme 1). In all cases we
checked that the structure of the single crystals was representative
of the bulk by measuring the X-ray powder patterns.
The (QUIN+)(15R-MAND�) structure (1) crystallises in
P212121 with Z0 = 1 and only the (S)-mandelate ion was
captured, and is essentially the same as that published by
Gjerlov and Larsen6 (data at 122 K). However, our data were
collected at 173 K because prior data collections for the other
structures in this study were performed at this temperature.
The metrics of the hydrogen bonds for this and the subsequent
structures are reported in Table 2S.wThe (QUIN+)(30R-MAND�) structure (2) crystallises in
the space group P21 with Z0 = 3. There are thus three pairs of
ions in the asymmetric unit. The (QUIN+)(MAND�) ion
pairs are labelled A, B and C, and the configurations of the
Scheme 1
a Centre for Crystal Engineering, Department of Chemistry,Cape Peninsula University of Technology, P.O. Box 652,Cape Town, 8000, South Africa. E-mail: [email protected];Fax: +27 21 460 3854; Tel: +27 21 460 8354
bCentre for Supramolecular Chemistry Research,Department of Chemistry, University of Cape Town, South Africa
w Electronic supplementary information (ESI) available: X-Ray datacollection and structure refinement details,9 crystallographic informationof structures 1–5, hydrogen bond parameters, torsion angles. CCDC795245–795249. For ESI and crystallographic data in CIF or otherelectronic format see DOI: 10.1039/c0cc04279j
ChemComm Dynamic Article Links
www.rsc.org/chemcomm COMMUNICATION
Dow
nloa
ded
by U
nive
rsity
of
Bri
stol
on
01 M
arch
201
2Pu
blis
hed
on 1
2 Ja
nuar
y 20
11 o
n ht
tp://
pubs
.rsc
.org
| do
i:10.
1039
/C0C
C04
279J
View Online / Journal Homepage / Table of Contents for this issue
This journal is c The Royal Society of Chemistry 2011 Chem. Commun., 2011, 47, 2670–2672 2671
mandelate anions are (R), (R) and (S), respectively. The
mole fraction of the (R)-mandelate in this crystal is thus
ZR (%) = 67.
The (QUIN+)(50R-MAND�) structure (3) is similar to
structure 2 in that it has comparable unit cell parameters and
Z0 = 3. However the ‘C’ mandelate ion is partly disordered, and
careful refinement showed that both (R) and (S) anions are
located on this site, with occupancies of 18% and 82%,
respectively. The overall mole fraction ZR for this structure is
therefore 72.6%. An analogous situation is exhibited by the
(QUIN+)(70R-MAND�) structure (4), yielding ZR = 77.0%.
We had considerable difficulties in growing suitable crystals of
the (QUIN+)(100R-MAND�) salt (5). Using pure ethanol as the
solvent and varying the initial concentrations and cooling
conditions yielded poor quality crystals with large mosaic spreads.
We repeated the crystallisation in a variety of solvents, namely
methanol, acetonitrile, ethylacetate, dichloromethane, acetone,
iso-propanol, benzene, methyl-ethylketone and 1 : 1 (v/v) water
mixtures of these when possible. More than thirty different
crystallisations were attempted. The optimal results were obtained
with an ethanol/water mixture (v/v= 5 : 1). The crystal which we
eventually employed had high mosaic spread and was
subjected to a long intensity data collection. (For details see ESI.w)The resulting structure is similar to the previous three, in that it
crystallises in P21 with Z0 = 3.
The selectivity diagram for the quinine–mandelic acid
system is shown in Fig. 1. Structure 1 contains only the
(S)-enantiomer of the mandelate anion. Structures 2–5 are
similar, in that they all crystallise in the space group P21with Z0 = 3, have similar unit cell dimensions and contain
ZR varying from 0.67–1. Each salt pair stabilised by
(QUIN)N+–H� � ��OOC(MAND) hydrogen bonds with
N� � �O distances varying from 2.56–2.79 A.
We may regard structure 2 as representative of structures
3 and 4 as they all contain the (R)-, (R)- and (S)-mandelate
anions on the same site. It is therefore instructive to compare
structure 2 with structure 5 which contains only (R)-mandelates.
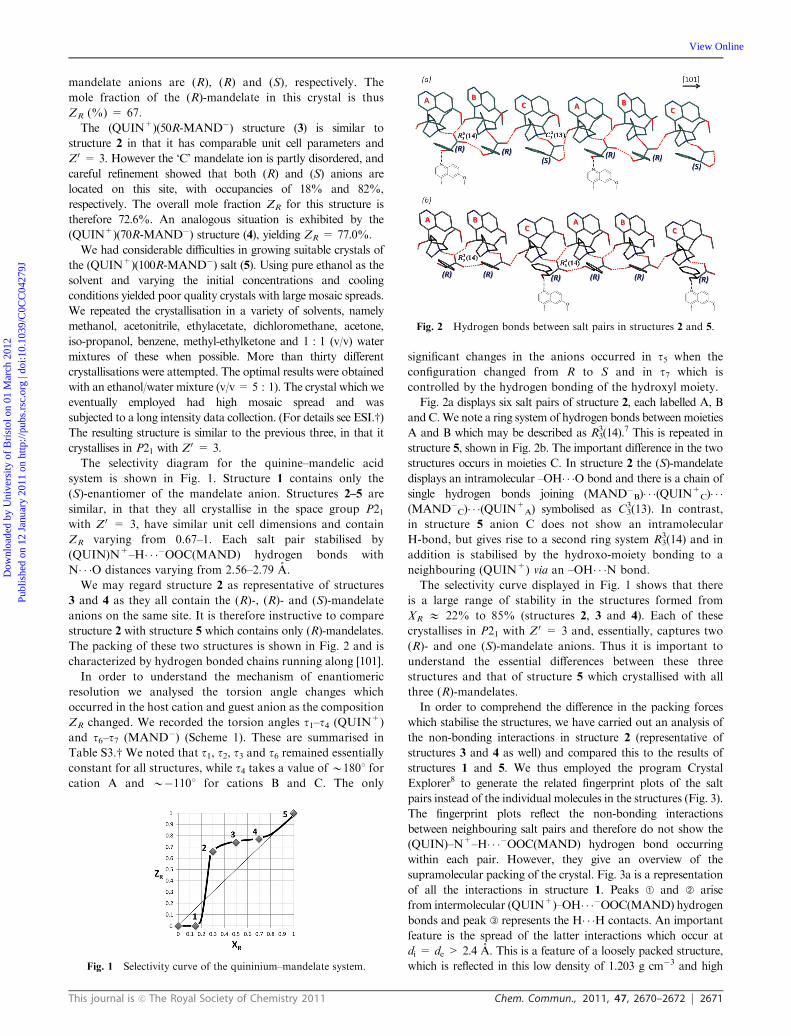
The packing of these two structures is shown in Fig. 2 and is
characterized by hydrogen bonded chains running along [101].
In order to understand the mechanism of enantiomeric
resolution we analysed the torsion angle changes which
occurred in the host cation and guest anion as the composition
ZR changed. We recorded the torsion angles t1–t4 (QUIN+)
and t6–t7 (MAND�) (Scheme 1). These are summarised in
Table S3.w We noted that t1, t2, t3 and t6 remained essentially
constant for all structures, while t4 takes a value of B1801 for
cation A and B�1101 for cations B and C. The only
significant changes in the anions occurred in t5 when the
configuration changed from R to S and in t7 which is
controlled by the hydrogen bonding of the hydroxyl moiety.
Fig. 2a displays six salt pairs of structure 2, each labelled A, B
andC.We note a ring system of hydrogen bonds betweenmoieties
A and B which may be described as R33(14).
7 This is repeated in
structure 5, shown in Fig. 2b. The important difference in the two
structures occurs in moieties C. In structure 2 the (S)-mandelate
displays an intramolecular –OH� � �O bond and there is a chain of
single hydrogen bonds joining (MAND�B)� � �(QUIN+C)� � �
(MAND�C)� � �(QUIN+A) symbolised as C3
3(13). In contrast,
in structure 5 anion C does not show an intramolecular
H-bond, but gives rise to a second ring system R33(14) and in
addition is stabilised by the hydroxo-moiety bonding to a
neighbouring (QUIN+) via an –OH� � �N bond.
The selectivity curve displayed in Fig. 1 shows that there
is a large range of stability in the structures formed from
XR E 22% to 85% (structures 2, 3 and 4). Each of these
crystallises in P21 with Z0 = 3 and, essentially, captures two
(R)- and one (S)-mandelate anions. Thus it is important to
understand the essential differences between these three
structures and that of structure 5 which crystallised with all
three (R)-mandelates.
In order to comprehend the difference in the packing forces
which stabilise the structures, we have carried out an analysis of
the non-bonding interactions in structure 2 (representative of
structures 3 and 4 as well) and compared this to the results of
structures 1 and 5. We thus employed the program Crystal
Explorer8 to generate the related fingerprint plots of the salt
pairs instead of the individual molecules in the structures (Fig. 3).
The fingerprint plots reflect the non-bonding interactions
between neighbouring salt pairs and therefore do not show the
(QUIN)–N+–H� � ��OOC(MAND) hydrogen bond occurring
within each pair. However, they give an overview of the
supramolecular packing of the crystal. Fig. 3a is a representation
of all the interactions in structure 1. Peaks A and B arise
from intermolecular (QUIN+)–OH� � ��OOC(MAND) hydrogen
bonds and peak C represents the H� � �H contacts. An important
feature is the spread of the latter interactions which occur at
di = de > 2.4 A. This is a feature of a loosely packed structure,
which is reflected in this low density of 1.203 g cm�3 and highFig. 1 Selectivity curve of the quininium–mandelate system.
Fig. 2 Hydrogen bonds between salt pairs in structures 2 and 5.
Dow
nloa
ded
by U
nive
rsity
of
Bri
stol
on
01 M
arch
201
2Pu
blis
hed
on 1
2 Ja
nuar
y 20
11 o
n ht
tp://
pubs
.rsc
.org
| do
i:10.
1039
/C0C
C04
279J
View Online

2672 Chem. Commun., 2011, 47, 2670–2672 This journal is c The Royal Society of Chemistry 2011
value of the volume/non-hydrogen atom of 18.79 A3. In contrast
structures 2 to 5 are packed more efficiently and have densities
varying from 1.316 to 1.340 g cm�3 and corresponding vo-
lume/non-H atom varying from 17.17 to 16.87 A3. Fig. 3b and
c shows the fingerprint plot for the salt pairs A, B and C of
structures 2 and 5. The plots for the A pairs are similar but we
note significant differences in the plots for the B and C pairs.
In particular peaks A and B of the B and C pairs of structure 2
arise from (QUIN+)–OH� � ��OOC(MAND) hydrogen bonds.
These are strong interactions in which the H� � �O distances are
B1.65 A. The corresponding peaks in structure 5 are different,
in that for salt pair B, peak A due to a (QUIN+)–OH� � ��OOC(MAND) interaction is weaker with H� � �O E 1.77 A
and peak B is weaker, more diffuse and is due to a bifurcated
(QUIN+)–OH� � ��OOC(MAND) hydrogen bond. In structure 5,
pair C, we note a diffuse peak A due to a weak
(QUIN+)–OH� � ��OOC(MAND) interaction and a peak B
which arises from two distinct interactions, namely
(QUIN)–OH� � ��OOC(MAND) and (MAND�)–OH� � �N(QUIN+) hydrogen bond, both being weak interactions.
This shows that there are stronger intermolecular forces stabilising
structure 2 in comparison with those of structure 5. We propose
that these are the forces responsible for the greater stability of
structure 2 and this explains themechanism of resolution, whereby
the structures with [(R), (R), (S)-mandelates] are obtained over a
large range of the selectivity profile.
We conclude that the resolution of mandelic acid by quinine
is driven by intermolecular hydrogen bonds and concomitant
changes in some torsion angles of the (QUIN+) and
(MAND�) ions. These give rise to stable structures of three
salt pairs in the crystallographic asymmetric unit containing
(R)-, (R)- and (S)-mandelate anions, and dominate a large
range of the selectivity profile.
Notes and references
z Crystal data for 1: C28H32N2O5, M = 476.56, orthorhombic, P212121,a= 22.5852(4) A, b= 22.5852(4) A, c= 7.5192(3) A, a= b= g= 901,V=2630.7(13) A3,T=173(2) K,Z=4, 3704 out of 4832 with I>2s(I),R1 = 0.0514 (I > 2s(I)), wR2 = 0.1316 (all data). Crystal data for 2:
C28H32N2O5, M = 476.56, monoclinic, P21, a = 10.4121(14) A, b =18.574(3) A, c = 19.070(3) A, b = 102.635(3)1, V = 3598.6(8) A3, T =173(2) K, Z = 6, 12026 out of 19779 with I > 2s(I), R1 = 0.0461(I > 2s(I)), wR2 = 0.1273 (all data). Crystal data for 3: C28H32N2O5,M = 476.56, monoclinic, P21, a = 10.381(3) A, b = 18.456(5) A,c = 19.036(5) A, b = 102.557(5)1, V = 3559.7(18) A3, T = 173(2) K,Z = 6, 12252 out of 42152 with I > 2s(I), R1 = 0.0519 (I > 2s(I)),wR2 = 0.1239 (all data). Crystal data for 4: C28H32N2O5, M = 476.56,monoclinic, P21, a = 10.4377(14) A, b = 18.501(2) A, c = 19.116(2) A,b = 102.318(2)1, V = 3606.5(8) A3, T = 173(2) K, Z = 6, 11667 out of47197 with I > 2s(I), R1 = 0.0362 (I > 2s(I)), wR2 = 0.0855 (all data).Crystal data for 5: C28H32N2O5, M = 476.56, monoclinic, P21, a =10.415(2) A, b = 18.416(4) A, c = 18.845(4) A, b = 101.431(7)1, V =3542.8(14) A3, T = 173(2) K, Z= 6, 12740 out of 28583 with I> 2s(I),R1 = 0.0556 (I>2s(I)), wR2 = 0.1437 (all data). CCDC 795245–795249.
1 Optical resolution via diastereomeric salt formation, ed. D. Kozma,CRC Press, New York, 2002.
2 (a) S. H. Wilen and E. L. Eliel, Tables of resolving agents and opticalresolution, Univ. of Notre Dame Press, Notre Dame London, 1971;(b) J. Jacques, A. Collet and S. H. Wilen, Enantiomers, Racemates andResolutions., Krieger Publishing Company, Malabar, Florida, 1994.
3 R. B. Woodward, P. M. Cava, W. D. Ollis, A. Hunger,H. U. Daeniker and K. Schenker, Tetrahedron, 1963, 19, 247.
4 S. Larsen, H. Lopez de Diego and D. Kozma, Acta Crystallogr.,Sect. B: Struct. Sci., 1993, 49, 310–316.
5 A. Gjerlov and S. Larsen, Acta Crystallogr., Sect. B: Struct. Sci.,1997, 53, 708–718.
6 A. Gjerlov and S. Larsen, Acta Crystallogr., Sect. C: Cryst. Struct.Commun., 1997, 53, 1505–1508.
7 S. Eppel and J. Bernstein, Acta Crystallogr., Sect. B: Struct. Sci.,2008, 64, 50–56.
8 (a) J. J. McKinnon, M. A. Spackman and A. S. Mitchell, ActaCrystallogr., Sect. B: Struct. Sci., 2004, 60, 627; (b) M. A. Spackmanand J. J. McKinnon, CrystEngComm, 2002, 4, 378.
9 BrukerAPEX2. Version 1.0–27., Bruker AXS Inc., Madison,Wisconsin, USA, 2005; Z. Otwinowski and W. Minor, inInternational Tables for Crystallography, Vol. F, ed.M. G. Rossman and E. Arnold, Kluwer, Dordrecht, 2000; Bruker,SAINT-Plus (including XPREP). Version 7.12., Bruker AXS Inc.,Madison, Wisconsin, USA, 2004; Bruker, XPREP2. Version 6.14.,Bruker AXS Inc., Madison, Wisconsin, USA, 2003;G. M. Sheldrick, SHELXS-97 and SHELXL-97 Programs forcrystal structure determination and refinement, University ofGottingen, 1997; L. J. Barbour, J. Supramol. Chem., 2001, 1,189–191; A. L. Spek, PLATON, A Multipurpose CrystallographicTool, Utrecht University, Utrecht, The Netherlands, 2008;G. M. Sheldrick, CELL_NOW Version 2008-2, Index Twins andOther Problem Crystals, University of Gottingen, 2008.
Fig. 3 Fingerprint plots of ion pairs in structures 1, 2 and 5.
Dow
nloa
ded
by U
nive
rsity
of
Bri
stol
on
01 M
arch
201
2Pu
blis
hed
on 1
2 Ja
nuar
y 20
11 o
n ht
tp://
pubs
.rsc
.org
| do
i:10.
1039
/C0C
C04
279J
View Online