Embed Size (px)
Citation preview
© 2015. Published by The Company of Biologists Ltd.
Ciliary Adenylyl Cyclases control the Hedgehog pathway
Laura Vuolo, Antonio Herrera, Blanca Torroba, Anghara Menendez and Sebastian
Pons*
Instituto de Biología Molecular de Barcelona (CSIC), Parc Científic de Barcelona,
Baldiri Reixac 10-12, Barcelona 08028, Spain. Tlf: 34-934031103
Correspondence author: Sebastian Pons, Instituto de Biología Molecular de
Barcelona, (CSIC), Parc Científic de Barcelona, Baldiri Reixac 10-12, Barcelona 08028,
Spain.
Jour
nal o
f Cel
l Sci
ence
Acc
epte
d m
anus
crip
t
JCS Advance Online Article. Posted on 19 June 2015

SUMMARY
Protein kinase A (PKA) accumulates at the base of the cilium where it negatively
regulates the Hedgehog (Hh) pathway. Although PKA activity is essentially controlled
by the cAMP produced by Adenylyl Cyclases (AC), the influence of these enzymes on
the Hh pathway remains unclear. Here we show that AC5 and AC6 are the two isoforms
most strongly expressed in cerebellar granular neuron precursors (CGNPs) and that that
while over-expression of AC5 and AC6 represses the Hh pathway, their knockdown
results in the activation of this pathway in CGNPs and in the embryonic neural tube
(NT). Indeed, AC5 and AC6 concentrate in the primary cilium, and mutation of a
previously undescribed cilium targeting motif in AC5 suppresses its ciliary location, as
well as its capacity to inhibit Hh signalling. Stimulatory and inhibitory Gα proteins, that
are engaged by the G protein coupled receptors (GPCRs), control AC5 and AC6 activity
and regulate Hh pathway in CGNPs and NT. Therefore, we propose that the activity of
different ciliary GPCRs converge on AC5 and AC6 to control PKA activity and hence
the Hh pathway.
Jour
nal o
f Cel
l Sci
ence
Acc
epte
d m
anus
crip
t

INTRODUCTION
Sonic hedgehog (Shh) belongs to the Hedgehog (Hh) family of secreted signalling
proteins. Shh activity is crucial during the development of the nervous system to control
the proliferation and the dorso-ventral patterning of the neural tube (NT: (Dessaud et al.,
2008; Le Dreau and Marti, 2012), and for the clonal expansion of cerebellar granular
cell precursors (CGNPs: (Dahmane and Ruiz i Altaba, 1999; Wechsler-Reya and Scott,
1999). In vertebrates, most of the Hh signalling pathway components are located at or in
the proximity of the primary cilium, and the integrity of this organelle is an absolute
requirement for correct Hh signalling (Briscoe and Therond, 2013). Indeed, in the
absence of Hh, the 12-pass transmembrane protein that receives Hh ligands, Patched 1
(Ptch1), is concentrated in and around the primary cilium (Rohatgi et al., 2007).
However, upon Hh binding Pthch1 is excluded from the cilium and the G protein-
coupled receptor (GPCR) Smoothened (Smo) concentrates there (Corbit et al., 2005).
Gli proteins are the only known transcriptional effectors of the Hh pathway and the
activity of the pathway is fully dependent on the balance between activator and
repressor forms of Gli 2/3. In addition, protein kinase A (PKA), the main repressor of
the Hh pathway, also accumulates at the base of the cilium (Barzi et al., 2010), where
activation by cAMP induces repression driven by Gli2/3 (Wang et al., 2000; Tempe et
al., 2006; Tuson et al., 2011). Although the activity of PKA is basically regulated by
cAMP, it remains unclear to what extent the adenylyl cyclases (ACs) that produce
cAMP from ATP influence the Hh pathway.
ACs are currently grouped into six classes that can be distinguished on the basis of their
sequence. All ACs found in Metazoans belong to Class III ACs, while in mammals,
Class III ACs can be further divided into membrane-bound ACs (type 1 to type 9) and
soluble ACs (sACs: (Linder, 2006). These nine membrane-bound ACs are controlled by
a complex set of factors, including heterotrimeric G-proteins. Stimulatory G-proteins
(Gαs) activate all nine AC isoforms to some extent, while inhibitory G-proteins (Gαi)
only inhibit AC1, AC5 and AC6 (Linder, 2006; Sadana and Dessauer, 2009). Smo is a
fully competent activator of Gαi proteins (Shen et al., 2013) and in Drosophila, Smo
acts as a canonical GPCR that signals through Gαi in order to regulate the Hh pathway
(Ogden et al., 2008). Moreover, in rat CGNPs simultaneous knockdown of Gαi2 and
Gαi3 hinders dramatically the proliferation of these cells induced by Shh (Barzi et al.,
Jour
nal o
f Cel
l Sci
ence
Acc
epte
d m
anus
crip
t

2011). On the other hand, GPR161, an orphan GPCR that engages Gαs, exerts negative
effects on the Hh pathway (Mukhopadhyay et al., 2013). Furthermore, targeted knock-
out of GNAS, the gene that encodes Gαs, causes medulloblastoma-like tumours in
mouse cerebellum (He et al., 2014).
In this work we show that AC5 and AC6 are the two AC isoforms most strongly
expressed in two well established Shh-target tissues: CGNPs and the embryonic NT.
We also show that while over-expression of AC5 and AC6 represses the Hh pathway,
their knockdown results in consistent activation of the Hh pathway, both in CGNPs and
the NT. In addition, we show that AC5 and AC6 concentrate in the primary cilium and
that the mutations of a previously undescribed motif in AC5 suppress its targeting to the
cilium and its capacity to inhibit the Hh pathway. Finally, we demonstrate that as in
CGNPs, the Hh pathway is positively and negatively regulated by Gαi and Gαs in the
NT, respectively. Therefore, we propose that the activity of different ciliary GPCRs
converge on AC5 and AC6 to control PKA activity and hence, the Hh pathway.
RESULTS
Different AC isoforms are expressed in the developing external germinative layer
of the cerebellum
The proliferation of CGNPs in the external germinative layer (EGL) of the cerebellum
(Fig. 1A) depends entirely on Shh activity and consequently, this tissue has proved to be
an excellent model to study the regulation of the Hh pathway. Conveniently, CGNPs
can be easily purified and cultured (Rios et al., 2004). When we studied the expression
of the nine membrane-bound AC isoforms in purified mouse CGNPs by qt-PCR, AC5
and AC6 were the most strongly expressed isoforms, followed by AC3 and AC1,
whereas AC2, AC4, AC7, AC8 and AC9 were only weakly expressed (Fig.1B). In fact,
AC3, AC5 and AC6 were also the most strongly expressed isoforms in the cerebellar
EGL when studied by “in situ” hybridization (ISH). It is worth noting that AC6 was the
only AC isoform that in cerebellum was almost exclusively expressed in the EGL.
Jour
nal o
f Cel
l Sci
ence
Acc
epte
d m
anus
crip
t

The proliferation of CGNPs induced by Shh is inhibited by AC3, AC5 and AC6
but not by AC1
Forskolin is an allosteric activator of ACs and DBA is a cAMP analogue, both of which
were reported to inhibit Hh pathway (Dahmane and Ruiz i Altaba, 1999; Wechsler-Reya
and Scott, 1999; Rios et al., 2004). Since the effect of AC expression on the Hh
pathway had not been assessed previously, we measured the proliferation of CGNPs
expressing AC1, AC3, AC5 or AC6 that was induced by Shh. Notably, we found that
Shh-induced proliferation was significantly reduced in CGNPs expressing AC3, AC5
and AC6 but not in those expressing AC1, as reflected by either [3H]-thymidine (Fig.
1D) or BrdU (Fig. 1E) incorporation. Indeed, similar results were obtained when the Hh
pathway was activated by transfecting CGNPs with a constitutively active form of Smo,
SmoM2 (Fig. 1F, G). In addition, the endogenous expression of Gli1 (a direct target of
the pathway) was significantly diminished in cultured CGNPs grown in the presence of
Shh when they expressed AC3, AC5 and AC6 but not AC1 (Fig. 1H). In fact, the effect
of AC5 expression could be reverted by a dominant negative form of PKA but not by
SmoM2, confirming that the activity of ACs lies between Smo and PKA in the Hh
pathway (Fig. 1I).
Suppression of the Shh pathway by ACs is mediated by Gli3 in CGNPs
To further understand how ACs regulate the Hh pathway we used the GBS-Luc
construct, a Luciferase reporter driven by a Gli binding site (GBS). None of the ACs,
nor an active form of PKAα catalytic subunit (PKACαQR) used as control, reduced
GBS-Luc activity when the pathway was activated by Gli1 or Gli2 transfection (Fig.1J,
K). Rather, and perhaps paradoxically, AC5, AC6 and PKACαQR increased Gli2
stimulated GBS-Luc activity (Fig. 1K). Alternatively, while Gli3 only mildly activated
luciferase expression when compared to Gli1 or Gli2, this activation was significantly
dampened by AC3, AC5, AC6 and PKACαQR (Fig. 1L). Moreover, if Gli3 was co-
expressed with Gli1 the suppression of GBS-Luc activity induced by ACs, and
especially by PKACαQR, was significantly stronger (Fig. 1M). In addition we confirmed
that the formation of the repressor form of Gli3 was reduced by SmoM2 and increased
by AC5 or PKACαQR (Fig. S1A). These data are in agreement with the elevated
capacity of Gli3 to drive Hh pathway inhibition compared to Gli1 or Gli2 (Pan et al.,
Jour
nal o
f Cel
l Sci
ence
Acc
epte
d m
anus
crip
t
2006). Thus, together these results indicate that AC3, AC5 and AC6 but not AC1 can
antagonize Hh signalling in CGNPs, possibly by modulating Gli activity.
ACs must be localized to cilia to regulate Hh pathway
Although cAMP is a fully diffusible metabolite, its activity is largely constricted by
phosphodiesterases. Thus, as PKA regulates the Hh pathway from the base of the cilium
(Barzi et al., 2010; Tuson et al., 2011), a ciliary or peri-ciliary distribution of the ACs
regulating PKA would also be expected. AC3 has previously been shown to accumulate
at the primary cilium in CGNPs (Barzi et al., 2010), however whether it regulates the
Hh pathway was not known. To address this issue, we transfected CGNPs with HA-
tagged constructs encoding the different AC isoforms endogenously expressed in these
cells (AC1, AC3, AC5 and AC6), and we found AC3, AC5 and AC6 but not AC1 at the
cilium (Fig. 2A). Additionally, using an antibody that detected AC5 and AC6 with
similar affinity but that does not cross-react with AC3 (Fig. S1B), we confirmed that
endogenous AC5/6 can be found at the cilia of CGNPs and of NIH-3T cells (Fig. 2B).
AC1 was the only AC isoform that did not diminish Shh induced proliferation of
CGNPs (Fig. 1D, E), therefore a direct relationship between a ciliary localization and
the capacity to repress the Hh pathway was plausible. To study this issue further, we
evaluated the possibility that ciliary localization motifs could exist in AC5 by aligning
this molecule with other ciliary proteins. Notably, we observed that mutating a WR
motif that is also present in Smo (Corbit et al., 2005), involving amino acids 76 and 77
of the rabbit sequence (Fig. 2C), disrupted the distribution of AC5 at the cilium (Fig.
2D). Moreover, while the catalytic activity of the AC5WR76-77AA mutant was preserved,
(Fig. S1C,D), it no longer repressed Shh induced proliferation of CGNPs (Fig. 2E,F).
Expression of AC5 and AC6 represses the Hh pathway in the developing chicken
NT
It has been reported that activators of the Hh pathway like GliA or dnPKA induce
overgrowth of neuroepithelial cells and a ventralization of the developing NT, whereas
repressors like Gli3R reduced cell proliferation and induce dorsalization (Epstein et al.,
1996; Stamataki et al., 2005; Cayuso et al., 2006; Dessaud et al., 2008). Using “in ovo”
electroporation and fluorescent cell sorting we studied the expression of endogenous
AC1,AC3, AC5 and AC6 in the neuroblasts of HH-12 chicken NT 12 hpe (hours post-
Jour
nal o
f Cel
l Sci
ence
Acc
epte
d m
anus
crip
t

electroporation) by RT-PCR, notably as in CGNPs AC5 and AC6 were the two isoform
most highly expressed in the neuroblasts of chicken NT (Fig. 3A). Thus we studied the
effect of AC3, AC5 and AC6 over expression on the different effects of Shh in the
developing chicken NT. First, we observed that AC5 or AC6 expression but not that of
AC3 significantly reduced cell proliferation in HH-12 stage chicken embryo NTs 16
hpe this decrease being most prominent in the ventral part of the tube (Fig. 3B-D). It is
worth noting the strong anti-proliferative and pro-differentiative effect developed by the
active form of PKA (PKACαQR) used as a positive control, it prevents any proliferative
activity between transfection and fixation, enormously reducing the total number of
GFP+ cells (Barzi et al., 2010). In accordance, FACS cell cycle analysis revealed a
reduction in the number of cells in the S and M phases of the cell cycle in NTs
transfected with AC5, and it was noteworthy that the distribution of cell cycle phases in
NTs expressing AC5 was very similar to NTs transfected with Gli3R (a Gli3 mutant
lacking the transactivation domain) plus Bcl2, this construct combination was
previously reported to block most Shh dependent signals without inducing apoptosis in
the NT (Cayuso et al., 2006; Pedersen and Rosenbaum, 2008) (Fig. 3E). Shh also
induces the differentiation of motoneurons in the developing NT (Marti et al., 1995),
stimulating the proliferation and survival of motoneuron precursors (Olig2+: (Cayuso et
al., 2006). AC5 or AC6 expression but not that of AC3, significantly reduced the
number of Olig2+ cells 16 hpe (Fig. 3F, G). Moreover, co-electroporation of ACs with a
reporter of Hh pathway activation (8XGBS-RFP), demonstrated that the Hh pathway
was activated in fewer cells expressing AC5 and AC6 but not in those expressing AC3
(Fig. 3H, I), a similar result was obtained using the original luciferase expressing vector
GBS-LUC (Fig. S1E). These results demonstrate that like in CGNPs, the activity of
AC5 and AC6 can suppress the Hh pathway in the NT, whereas AC3 expression had
some mild effects on occasions but these effects were never significant in the NT.
Knockdown of ACs activate Hh pathway
We next wondered whether suppression of ACs was sufficient to stimulate the Hh
pathway and hence, we cloned short hairpin inhibitory RNAs (shRNA) that target
mouse AC3, AC5 or AC6 into the pSHIN vector and probed their effects in CGNP
proliferation assays (the sequences targeted and shRNA efficiency are shown in Table
S1 and Fig. S1F, respectively). Most of the shRNAs designed against AC5 and AC6 but
Jour
nal o
f Cel
l Sci
ence
Acc
epte
d m
anus
crip
t

not those against AC3, significantly increased the proliferation of CGNPs both in the
presence or absence of low doses of Shh (0.3 µg/ml: Fig. 4A), an effect that was not
evident at saturating concentration of Shh (not shown). We also studied how AC
knockdown affected the Hh pathway during NT development using “in ovo”
electroporation of luciferase (Fig. 4B) and RFP (Fig. 4C,D) reporters of Gli activity to
test selected chicken shRNAs targeting AC3, AC5 or AC6 (targeted sequences and
shRNA efficiency are shown in Table S1 and Fig. S1G, respectively). Notably we found
that the Hh pathway was activated significantly by AC5 and AC6 knockdown but not
by the knockdown of AC3. In addition, the combined suppression of AC5 and AC6
induced further activation of this pathway over and above the knockdown of each
enzyme alone. By contrast, combining the knockdown of AC3 and AC5 activated the
Hh pathway to a similar extent as the knockdown of AC5 alone (Fig. 4 B-D). As a
further control to the empty vector, the effects of a shRNA with very mild activity
(shAC6.2) was also evaluated in these experiments. It is worth noting that the
stimulatory effect of AC5 and AC6 shRNAs was in all cases reverted by the
overexpression AC5 and/or AC6 (not shown). Thus, these results further support the
repression of the Hh pathway in CGNPs and NT through the activity of the ciliary
located AC5 and AC6.
The Hh pathway is repressed by Gαs and activated by Gαi in the developing NT
The proliferation of CGNPs carrying GTPase deficient mutants of Gαi 2 and 3 (Gαi 3QL,
remains active longer) is significantly enhanced when they are grown in the presence of
sub-proliferative doses of Shh. Moreover, the proliferation of CGNPs induced by either
Shh or SmoM2 is strongly inhibited by the simultaneous knockdown of Gαi 2 and Gαi 3
(Barzi et al., 2011). Conversely, Gαs acts as a tumour suppressor for medulloblastoma
and its expression strongly represses CGNP growth (He et al., 2014). Here, we have
shown that AC5 and AC6 are the most abundant AC isoforms in CGNPs, and that in
both CGNPs and the chicken NT these ACs exert a relevant effect on the Hh pathway.
Additionally, AC5 and AC6 are among the few ACs isoforms that can be
simultaneously regulated by Gαs and Gαi proteins (Linder, 2006). However, it was not
clear whether Gα proteins regulate the Hh pathway during NT development. We found
that like SmoM2, Gαi 3QL expression increased the number of Olig2+ cells, as well as
inducing the expression of Nkx2.2 and Olig2 in cells lying dorsally to their normal
Jour
nal o
f Cel
l Sci
ence
Acc
epte
d m
anus
crip
t

domains (Fig. 5A, B, E). Conversely, expression of GαsRC in HH12 chicken NTs (a
GTPase deficient mutant of Gαs) greatly reduced the number of neuroblasts that
expressed the Nkx2.2 and Olig2 ventral markers, with Pax7+ cells (a dorsal marker)
occupying most of the NT (Fig. 5A, B, E). Notably, the dorsalization of the NT induced
by GαsRC could be reverted by SmoM2 or Gαi 3QL expression, with the maximal
ventralization of this tissue observed upon co-expression of SmoM2 and Gαi3QL (Fig.
5C, D, E).
To obtain more quantitative data on Hh pathway activation in each situation, we used
the GBS-Luc reporter and we found that the effects caused by the expression of GαsRC
and Gαi3QL on NT patterning were correlated with the levels of Hh pathway activation
in the transfected cells. Thus, the results presented here demonstrate that in CGNPs and
in the chicken NT, the Hh pathway is controlled by ciliary AC5 and AC6, and we
present strong evidence suggesting that its activation depends on the associated Gαs/Gαi
equilibrium.
Jour
nal o
f Cel
l Sci
ence
Acc
epte
d m
anus
crip
t

DISCUSSION
Cilium Adenylyl cyclases regulate Hh pathway
In this study, we have investigated the relationship between the PKA and Hh signalling
pathways in two tissues in which the latter plays a fundamental role. It has previously
been shown that there is an expansion of Shh-dependent ventral cell types in the
developing neural tube of PKA-deficient mouse embryos (PKACα-/- PKACβ-/+ or
PKACα-/+ PKACβ-/-: (Huang et al., 2002), whereas the neural tube remains open in mice
without any catalytic PKA activity (PKACα-/- PKACβ-/-) and the strong expansion of
ventral progenitors is coupled to an absence of dorsal interneuron progenitors (Tuson et
al., 2011). Indeed, this phenotype of PKA-null mice is very similar to that of pthc1and
Sufu null mice. Thus, the total absence of PKA activity fully emulates maximal
activation of the Hh pathway. PKA appears to repress the Hh pathway through two
main mechanisms: by preventing Gli2 activation and promoting Gli3 repressor
formation. The relevance of each of these mechanisms for Hh activity varies in the
different Hh target tissues, whereby PKA repression of ventral progenitors in the NT
seems to be mediated by the inhibition of Gli2 activation (Tuson et al., 2011), yet in
tissues like the limb-bud, Hh repression is mainly achieved by PKA-induced production
of the Gli3 repressor (te Welscher et al., 2002).
In recent years, compelling evidence has accumulated that the vertebrate Hh pathway
fully depends on the integrity of the primary cilium, where activator and repressor
forms of Gli transcription factors are generated. Although neither the chronology nor
the morphological aspects of the process are as yet clear, a common argument in all the
models proposed is the central role played by the pool of PKA located at the cilium base
(Tuson et al., 2011; Nozawa et al., 2013; Mukhopadhyay and Rohatgi, 2014). Hence, it
would seem that the ciliary components of the Hh pathway exert a tight control over the
activation status of this PKA pool. Although the location of PKA at the cilium base is
controlled by the A-kinase anchoring proteins (AKAPs: (McConnachie et al., 2006;
Barzi et al., 2010), its activity is fundamentally controlled by cAMP levels. While
cAMP is fully diffusible, the range at which it effectively regulates PKA activity is
largely narrowed down by dilution and phosphodiesterase activity. However, the
volume of the cilium is negligible compared to the total cell volume and thus, cAMP
can be produced at very high molar concentrations in the cilium where it can control the
PKA pool at its base without producing any measurable effects on other PKA pools.
Jour
nal o
f Cel
l Sci
ence
Acc
epte
d m
anus
crip
t

Accordingly, we hypothesized that the ACs regulating PKA activity at the cilium base,
and therefore controlling the Hh pathway, should be located at the cilium.
Based on pharmacological data, it has long been assumed that ACs worked as inhibitors
of the Hh pathway, although no direct evidence has been available to date. Here, we
have shown that among those AC isoforms expressed at a reasonable level in CGNPs
(AC1, AC3, AC5 and AC6), only the isoforms that concentrate in the cilium (AC3,
AC5 and AC6) inhibit the proliferation of these cells induced by Shh. Although not
demonstrative, these results encouraged us to further confirm our hypothesis and thus,
by comparing the sequences of AC5 and AC6 with those of other ciliary proteins,
including Smo, we found several putative ciliary location motifs in the AC5 sequence.
Notably, we found a WR motive in AC5, that although it was not located close to a
transmembrane domain as in Smo or ODR-10, the mutation of which not only inhibited
its ciliary localisation but also, it abrogated its anti-proliferative effect. Since the mutant
AC5 still induced the phosphorylation of cytoplasmic and nuclear PKA substrates to a
similar extent as the wild type AC5, ACs apparently need to be confined to the cilium to
regulate the Hh pathway.
To expand the relevance of our observations, we extended our study to the developing
chicken NT. Notably, in this structure the expression AC5 and AC6 significantly
reduced different Shh dependent parameters, such as cell proliferation, Olig2 expression
and the activity of the endogenous Hh pathway (as measured with a GBS-RFP reporter).
These results demonstrated that ciliary ACs could inhibit the Hh pathway in different
Hh target tissues. Moreover, knockdown experiments demonstrated that AC5 and AC6
but not AC3 are active repressors of the Hh pathway in both CGNPs and the NT,
supporting an inhibitory role of ciliary ACs on the Hh pathway. We measured cell
proliferation in CGNPs as we believe it to be the best measure of sustained Hh pathway
activation in these cells, ensuring their health and viability. Alternatively, we used
reporters of Gli activity to study the effect of AC suppression in the NT. While the
results obtained by these two methods were very similar, the RFP reporter demonstrated
that AC5 and AC6 knockdown (like the over expression of a dominant negative form of
PKA) not only increased the activity of this pathway in the endogenous (ventral)
domain but it was also ectopically activated at any dorso-ventral level. These results
indicate that AC5 and AC6 actively repress Hh pathway activation in both CGNPs and
the NT.
Jour
nal o
f Cel
l Sci
ence
Acc
epte
d m
anus
crip
t

It is worth noting that the AC5 and AC6 double knockdown activated the pathway more
strongly than the individual knockdowns alone, almost to the level of the dominant
negative PKA. Hence, it would appear that both AC5 and AC6 contribute to Hh
pathway silencing. Although we cannot exclude the contribution of other ACs to this
effect, AC5 and AC6 seem to be the principal effectors involved. In this regard,
although AC3 overexpression effectively suppressed Shh induced proliferation in
CGNPs, the differences observed when AC3 was overexpressed in the NT or when it
was knocked-down were never significant. We know that AC3 is endogenously
expressed and located in the cilia in both CGNPs and NT, yet it is more weakly
expressed than AC5 and AC6 in both tissues (not shown), which could explain the
milder effect of AC3 knockdown but not the lack of effect when AC3 is overexpressed
in the NT. Thus, further studies will be necessary to determine whether AC3 is in fact
less effective than AC5 and AC6 in repressing the Hh pathway.
Control of AC5/6 by heterotrimeric Gα proteins
Although ACs have been reported to be modulated by an extensive list of signalling
molecules (Linder, 2006), regulation by stimulatory (Gαs) and inhibitory (Gαi) α
subunits of hetero-trimeric G proteins occupies a prominent position. Notably, the two
AC isoforms that proved to exert the most relevant effect on the Hh pathway, AC5 and
AC6, are also among the few that can be regulated by both stimulatory and inhibitory G
proteins. In fact, Gαi inhibits AC5 and AC6 but only when these molecules have been
previously activated by Gαs (Sadana and Dessauer, 2009). Since the initial studies
showing that pertussis toxin can inhibit Gαi and induce a phenotype resembling Hh
deficiency in zebrafish (Hammerschmidt and McMahon, 1998), there is much more
evidence that Gαi proteins influence the activity of the Hh pathway (Riobo et al., 2006;
Ogden et al., 2008; Barzi et al., 2011; Shen et al., 2013). Nevertheless, it must be
recognized that other studies failed to implicate Gαi in Hh signalling (Lum et al., 2003;
Low et al., 2008). Moreover, Gpr161, a GPCR that signals through Gαs, was recently
shown to be excluded from the cilium upon activation of the Hh pathway, and there are
signs of increased Hh activity in Gpr161 null mice (Mukhopadhyay et al., 2013). In
addition, Gαs suppression was reported to induce medulloblastoma-like tumours in mice
(He et al., 2014). However, it is noteworthy that the phenotype associated with Hh
activation in Gpr161 null mice was very mild compared to that in Gαs null mice, in
Jour
nal o
f Cel
l Sci
ence
Acc
epte
d m
anus
crip
t

which the neural tube undergoes very intense ventralization, similar to that in PKA null
mice (Hwang and Mukhopadhyay, 2015). Thus, as the activity of Gαs seems to be
crucial to maintain the pathway off in the absence of Hh, additional mechanisms besides
the exclusion of Gpr161from the cilium seem to be required to counteract Gαs upon Hh
pathway activation.
We previously reported that Gαi3QL stimulated the proliferation of CGNPs
cooperatively with Shh and indeed, combined knockdown of Gαi2 and Gαi3, the two
Gαi subunits located at the cilium, significantly reduced Shh induced proliferation in
these cells (Barzi et al., 2011). Here we show that in contrast to GαsRC, which induces
the complete dorsalization of the chicken NT, Gαi3QL expression not only increases the
number of Olig2+ cells but also, it extends the Olig2 domain dorsally with a
concomitant reduction in the Pax7 territory, similar to the effects of SmoM2. In
addition, the extent to which Gαi3QL and SmoM2 revert the effect of Gαs
RC was very
similar. Notably, the effects on NT patterning were in all cases correlated to the
different extent of Hh activation evident through the GBS-Luc reporter. It is worth
noting that like the results obtained previously in CGNPs (Barzi et al., 2011), we
observed significant cooperation between Gαi3QL and SmoM2 in terms of GBS
activation in the NT, which is coherent with the fact that Gαi3QL must still be engaged
by a GPCR to be active. Conversely, no effect on NT pattering was associated with
Gαi2QL expression (Low et al., 2008), although it must be acknowledged that Gαi plays
important roles in cell polarity, and in mitotic spindle orientation and cell division
(Siller and Doe, 2009; McCaffrey and Macara, 2011). In fact, there are evident signs of
cell depolarization and cell death in Gαi2QL transfected NTs (Low et al., 2008).
Therefore, the lack of effects on patterning reported upon Gαi2QL expression should be
interpreted with caution. So far we are not able to confirm whether Gαi is part of the Hh
pathway in the NT, as observed in CGNPs, nor if it is directly activated by Smo or by
another GPCR activated by it. However, our results clearly support the plausibility of
considering Gαi to be being part of the Hh pathway in the NT.
Jour
nal o
f Cel
l Sci
ence
Acc
epte
d m
anus
crip
t

MATERIALS AND METHODS
Antibodies and chemicals
The different antibodies used in this study were: mouse monoclonal antibodies against
Gli1 (Cell Signaling, MAB2643), Nkx2.2 (DSHB, 74.5A5), Pax7 (DSHB), α-Tubulin
(Sigma, T6199), ac-Tubulin (Sigma, 6-11B-1), FoxA2 (DSHB, 4c7); a rat monoclonal
antibody against BrdU (AbD-Serotec, BU1/75); rabbit polyclonal antisera against
phospho-(S/T)-PKA substrates (PKA-PS; Cell signalling 9621), Olig2 (Millipore,
AB9610), AC3 (Santa Cruz, Sc588), AC5/6 (Santa Cruz SC-590), GFP, RFP, FLAG,
and HA antibodies (produced in-house).
Alexa and peroxidase labelled secondary antibodies were obtained from Molecular
Probes and Pierce, respectively, while BrdU was purchased from Sigma and
Rhodamine-Phalloidin from Invitrogen.
DNA constructs
The bovine ADCY1 cDNA was obtained from Xavier Nicol, rat ADCY3 from Guy Chiu-
Kai Chan, rabbit ADCY5 from Joachim Schultz, human ADCY6 from Rennolds Ostrom,
human SmoM2 from Frederic J. Sauvage, and rat Gnas and GnasR201C from Natalia
Riobo. Gli3R is a deleted form of human Gli3 encoding amino acids 1-768 (Gli3R)
(Persson et al., 2002). The luciferase reporter was provided by Yongbin Chen and the
RFP Gli binding site (GBS) reporter was produced in our lab. All the constructs were
cloned into pCIG, an EGFP expressing bicistronic vector. Site directed mutagenesis,
and the addition of HA and FLAG tags was achieved by PCR. By contrast, short hairpin
inhibitory RNAs (shRNA) were cloned into pSHIN (a GFP expressing evolution of
pSUPER). The shRNA constructs where electroporated in CGNPs with the
Microporator MP-100 (see below) using 10 µg of DNA per 3x10⁶ cells in 100 µl of
transfection solution. In the NT the shRNA constructs were diluted at 1 µg/µl and
approximately 1µl was used for each chicken NT electroporation. The list of sequences
targeted by the shRNAs and all the primers used for RT-PCR are shown in the Table
S1.
Jour
nal o
f Cel
l Sci
ence
Acc
epte
d m
anus
crip
t
CGNP cultures and transfection
Cerebellar cultures were prepared using a modification of the Papain method, as
described previously (Rios et al., 2004). For transient-transfections, freshly isolated
cells were electroporated in suspension and plated on poly-L-Lysine plus laminin coated
dishes in Neurobasal plus B-27 media (Invitrogen) supplemented with KCl (25 mM),
glutamine (1 mM) and Shh (3 µg/ml). After 24 hours, the media was replaced by fresh
media containing the corresponding treatments, considering this moment as time 0.
Electroporation was performed using the Microporator MP-100 (Digital Bio, Seoul,
Korea) according to the manufacturer’s instructions, with a single pulse of 1700 V for
20 milliseconds. The NIH-3T3 and HEK293 cell lines were grown in DMEM
containing 10% FBS.
Chick embryo in ovo electroporation
White-Leghorn chick embryos were staged according to Hamburger and Hamilton (HH)
(Hamburger and Hamilton, 1992), and electroporated with column purified plasmid
DNA (1-2 µg/ml) in H2O containing Fast Green (50ng/ml). Transfected embryos were
allowed to develop to the stages specified before they were processed as indicated.
In situ hybridization
The cerebellum from P7 mice was fixed overnight in 4% paraformaldehyde and washed
3 times for 10 minutes with PBT (DEPC-PBS 1x, 0.1% Triton). The tissue was
embedded in Sacarose10%/Agarose5% and vibratome sections (50 μm, Leica) were
obtained and dehydrated with increasing concentrations of methanol/PBT (25%,
50%,75% and 100%). Hybridization was performed at 70 ºC using standard procedures
and the probe distribution was detected with alkaline phosphatase-coupled anti-
digoxigenin Fab fragments (Boehringer Mannheim). RNA probes were produced from
the corresponding cDNA sequences cloned in Bluescript-II-KS with the T7 polymerase.
Jour
nal o
f Cel
l Sci
ence
Acc
epte
d m
anus
crip
t

CGNP proliferation assays - [3H]-thymidine or BrdU incorporation
Electroporated cells were plated for 24 hours and then given a 4 hour pulse of either
[3H]-thymidine (1µCi each well, from Amersham, Buckinghamshire, UK) or BrdU
(5µg/ml). The cells that received [3H]-thymidine were then lysed in SDS (0.04%) and
proliferation was measured in a Wallac scintillation counter (Wallac-Perkin Elmer,
Quebec, Canada). The BrdU labeled cells were fixed and immunostained with an
antibody against BrdU, and cell proliferation was calculated as the proportion of the
transfected population (GFP expressing cells) that incorporated BrdU.
Fluorescence Associated Cell Sorting (FACS)
HH-12 chicken embryos were electroporated with the different constructs cloned in
pCIG and 24 hpe, a single cell suspension was obtained by digestion for 10-15 min with
Trypsin-EDTA (Sigma). At least three independent experiments were analyzed by
FACS (6 embryos in each experimental condition). Hoechst and GFP fluorescence was
determined by flow cytometry in a MoFlo cytometer (DakoCytomation, Fort Collins,
Colorado, USA), and the cellular DNA content was analysed (Ploidy analysis) in single
fluorescence histograms using Multicycle software (Phoenix Flow Systems, San Diego,
CA).
Immunohistochemistry and BrdU incorporation in chicken embryos
Embryos were fixed in 4% paraformaldehyde for 2 hours at 4 °C and immunostaining
was performed on vibratome (40 µm) sections following standard procedures. BrdU
(~1µl at 0.5 µg/µl) was injected into the NT lumen 4h prior to fixation and transverse
sections of the NT were then stained with antibodies against BrdU (proliferation, Red),
GFP (transfection, Green) and DAPI (nucleus, Blue). The total number of GFP+
(transfected cells) and the number of GFP/ BrdU double labelled cells (transfected that
incorporated BrdU) were counted for each slice and the percentage BrdU positive
among the transfected population calculated. The percentage was calculated separately
for the dorsal and ventral NT.L To detect BrdU, sections were incubated in 2N HCl for
30 minutes and then rinsed with 0.1M Na2B4O7 (pH 8.5). After washing in PBS-0.1%
Triton, the sections were incubated with the appropriate primary antibodies, the binding
of which was detected with Alexa conjugated secondary antibodies. After staining, the
Jour
nal o
f Cel
l Sci
ence
Acc
epte
d m
anus
crip
t

sections were mounted and examined on a Leica SP5 confocal microscope.
Immunoblotting
For immunobloting transfected cells were dissolved in 1x SDS Laemmli sample buffer
(5 embryos per condition) and after sonication, the insoluble material was removed by
centrifugation. Samples were resolved by 8% SDS-PAGE, transferred to nitrocellulose
membranes, blocked with 8% non-fat dry milk in TTBS (150 mM NaCl, 0.05% Tween-
20 and 20 mM Tris-HCl [pH 7.4]) and the membranes were probed with the primary
antibodies. Antibody binding to the blots was detected using protein A/G-coupled
peroxidase that was visualized with the ECL system and captured with a Versadoc
Imaging System (Bio-Rad), or with Alexa-labelled secondary antibodies that were
visualized with the Odyssey Infrared Imaging System (LI-COR). The expression was
quantified with Quantity One software (Bio-Rad) and the molecular weights of the
proteins estimated using Bio-Rad Precision Molecular Weight Markers.
Luciferase-reporter assay of Gli activity
CGNPs cultures or HH12 chicken embryos were electroporated with the DNAs
indicated together with a GBS-Luciferase reporter construct containing 8 synthetic Gli
binding sites (GBS-Luc) and a CMV driven renilla-construct (Promega) for
electroporation normalization. Total CGNPs cultures or GFP-positive NTs were
dissected out at 48 hpe and homogenized in Passive Lysis Buffer. Firefly-and renilla-
luciferase activity was measured with the Dual Luciferase Reporter Assay System
(Promega).
Quantitative fluorescence image analysis
PKA activity was evaluated using an antibody raised against phosphorylated PKA-
targets, as reported previously (Barzi et al., 2010; He et al., 2014). The relative amount
of phospho-Ser/Thr-PKA substrates (PKA-PS) was compared between HEK-293 cells
transfected with either wild type AC5 or the mutant AC5WR76-77AA. Confocal images
were acquired with a laser-scanning confocal microscope (Sp5: Leica). Maximum
projections of 3 consecutive confocal sections (2 µm total Z) were quantified with
ImageJ software (National Institutes of Health), converting all images into 32 bits and
Jour
nal o
f Cel
l Sci
ence
Acc
epte
d m
anus
crip
t

subtracting the background using the original thresholds set with the background as
NaN (not a number). Finally, the mean grey value was quantified from an area
containing the entire cell. The ratio between GFP (transfection level) and PKA-PS was
calculated for each cell.
Jour
nal o
f Cel
l Sci
ence
Acc
epte
d m
anus
crip
t

ACKNOWLEDGMENTS
Monoclonal antibodies were obtained from the Developmental Studies Hybridoma
Bank, developed under the auspices of the NICHD and maintained by The University of
Iowa (Department of Biological Sciences, Iowa City, IA 52242). This work was
supported by grants to S.P. (BFU2008-02424/BFI, BFU2011-24099 and
SGR200821A333).
Jour
nal o
f Cel
l Sci
ence
Acc
epte
d m
anus
crip
t

Figures
Figure 1. AC isoforms expressed by CGNPs inhibit the Hh pathway. (A,B)
Expression of the different membrane-bound ACs in CGNPs purified from the P7
mouse cerebellum as evaluated by RT-PCR. (C) Expression of the same ACs (except
AC4) studied by In situ Hybridization. The red arrowheads indicate the position of the
Purkinje cell layer and the relative position of each cell layer in the P7 cerebellum is
shown (oEGL, iEGL = outer and inner External Germinative Layer; PCL=Purkinje Cell
Layer; IGL= Internal Granular Layer). (D,E) Proliferation of CGNPs studied by [3H]-
thymidine or BrdU incorporation (a pulse for the last 4h in culture) in cultures
transfected with AC1, 3, 5 or 6 and grown for 24h in the presence of 3µg/ml of Shh.
(F,G) Experiment similar to the previous one but in this case CGNP proliferation was
induced by transfecting a constitute-active form of Smo (SmoM2). For BrdU
incorporation, the bars represent the percentage of the transfected population (GFP) that
incorporated BrdU. (H) Gli1 in Western Blots of CGNP cultures transfected for 24h
with different AC isoforms. (I) Effect of the expression of AC5 on CGNPs in culture
where proliferation was induced by the expression of SmoM2, dnPKA or the addition of
Jour
nal o
f Cel
l Sci
ence
Acc
epte
d m
anus
crip
t

Shh (3 µg/ml). (J-M) GBS (Gli binding site) dependent luciferase activity was studied
in CGNP cultures transfected for 24h with Gli1, Gli2, Gli3 or combined Gli1-Gli3 and
the different AC isoforms. A constitutive-active form of PKA (PKACαQR) was used as a
positive control. All the bar graphs in this figure show the mean ± standard deviation
(s.d.) of at least three independent experiments. The total number of cells counted for
each data point in panels E, G and I is indicated inside each bar. Significant differences
were tested by one-way ANOVA followed by the Tukey’s test: * = P<0.05, ** =
P<0.01, *** = P<0.001. Scale bar represents 50 µm.
Jour
nal o
f Cel
l Sci
ence
Acc
epte
d m
anus
crip
t

Figure 2. ACs require ciliary localization to regulate the Hh pathway. (A)
CGNP cultures were transfected for 24h with HA-tagged constructs of AC1, 3, 5 or 6
cloned in PCIG, a nuclear-GFP-expressing bicistronic vector. The cells were stained
with anti-Acetylated Tubulin (cilium marker, Red), anti-HA (Green) and anti-GFP
(transfection, Blue). AC3, 5 and 6 but not AC1 accumulated in the cilium. (B)
Endogenous expression of AC5 and/or AC6 (Green) was detected in the cilium of
CGNPs and NIH3T3 cells with an antibody that detects both molecules with similar
affinity (see Fig. S1B). Acetylated Tubulin (Red) and DAPI (Blue) were used as
markers of the cilium and nucleus, respectively. (C) The chart shows inter-species
sequence conservation and intramolecular location of a putative AC5 ciliary location
motif. The motif was predicted through multiple alignment of AC5 with other similar
ciliary proteins. (D) Mutation of amino acids 76-77 of AC5 to AA (AC5WR76-77AA·HA)
impaired its ciliary location in NIH-3T3 cells. Cultures were stained with anti-
AcTubulin (Red), anti-HA (Green) anti-GFP (Purple) and DAPI (Blue). The boxed
areas are amplified on the right of the panel, showing only HA staining. (E,F) Shh
induced proliferation of CGNPs was not inhibited by transfection with the AC5WR76-77AA
mutant as assessed by [3H]-thymidine or BrdU incorporation. All the bar graphs in this
figure show the mean ± s.d. of at least three independent experiments. The total number
Jour
nal o
f Cel
l Sci
ence
Acc
epte
d m
anus
crip
t

of cells counted for each data point in panels F is indicated inside each bar. Significant
differences were assessed by one-way ANOVA followed by the Tukey’s test: * =
P<0.05, *** = P<0.001. Scale bar represents 10 µm.
Jour
nal o
f Cel
l Sci
ence
Acc
epte
d m
anus
crip
t

Figure 3. Expression of AC5 and AC6 represses the Hh pathway in the developing
chicken NT. (A-D) HH-12 chicken NTs were electroporated with different constructs
cloned in pCIG and they were left to develop for 16h. BrdU (~1µl at 0.5 µg/µl) was
injected into the NT lumen 4h prior to fixation and transverse sections of the NT were
then stained with antibodies against BrdU (proliferation, Red), GFP (transfection,
Green) and DAPI (nucleus, Blue). The percentage of BrdU+ cells among the transfected
population was calculated separately for the dorsal and ventral NT. PKACαQR was used
as a positive control. (E) In an experiment similar to the previous one, the cell cycle
phase distribution was studied in the population of transfected cells (GFP+) by FACS
analysis, and the Gli3R/Bcl2 combination was used as a positive control. (F-G) The
expression of Olig2 (a marker of motoneuron precursors, Red) was studied in HH12
chicken NTs 16 hpe with AC3, 5 or 6 (Green). The number of Olig2+ cells in the
electroporated side (EP) was compared in each case to the non-electroporated side
(NEP). (H-I) HH12 chicken NTs were transfected for 16h with AC3, 5 or 6 cloned in
pCIG (Green) together with pGBSRED, a RFP-expressing reporter of Hh pathway
activity (Red). The percentage of RFP+ cells among the transfected population is shown
in the bar graph. All the bar graphs in this figure show the mean ± s.d. of at least three
Jour
nal o
f Cel
l Sci
ence
Acc
epte
d m
anus
crip
t

independent experiments. The total number of cells counted in each data point in panels
C,D,F and I is indicated inside each bar. Significant differences were assessed by one-
way ANOVA followed by the Tukey’s test: * = P<0.05, *** = P<0.001. Scale bar
represents 50 µm.
Jour
nal o
f Cel
l Sci
ence
Acc
epte
d m
anus
crip
t

Figure 4. AC Knockdown activates the Hh pathway. (A) Mouse CGNP cultures
grown in the presence or absence of low doses of Shh (0.3 µg/ml), were transfected for
24h with pSHIN expressing different short hairpin molecules directed against mouse
AC3, 5 or 6. [3H]-thymidine incorporation in the last 4h of cultures was used to study
cell proliferation. (B) HH-12 chicken NTs were transfected for 16h with pSHIN
expressing selected short hairpin molecules directed against AC3, 5 or 6, or a
combination of these, together with the pGBSLUC Luciferase reporter of Hh pathway
activity. The efficiency of the different shRNAs is shown in Fig. S1F and G. (C-D) As
in B but using pGBSRED as the reporter. The dnPKA construct was used as a positive
control of Hh pathway activation. The percentage of transfected cells that are RFP+ is
shown in the bar graph. All the bar graphs in this figure show the mean ± s.d. of at least
three independent experiments. The total number of cells counted in each data point in
panel D is indicated inside each bar. Significant differences were assessed by one-way
ANOVA followed by the Tukey’s test: * = P<0.05, *** = P<0.001. Scale bar represents
50 µm.
Jour
nal o
f Cel
l Sci
ence
Acc
epte
d m
anus
crip
t
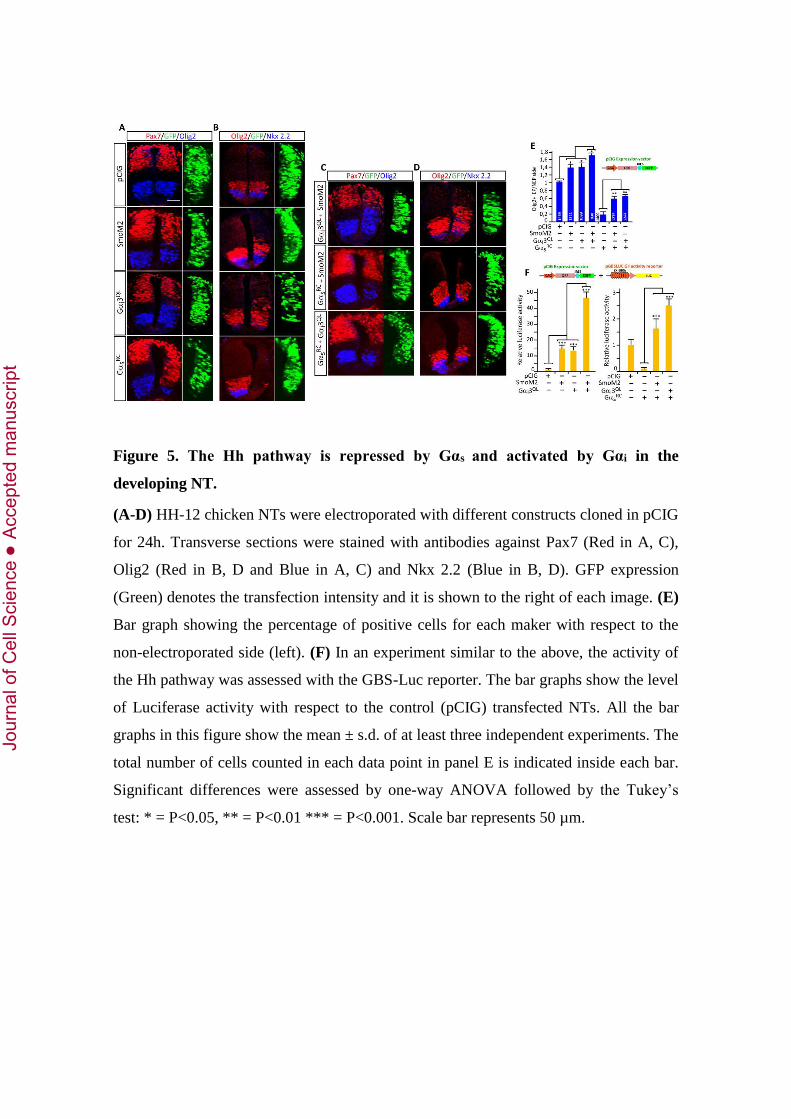
Figure 5. The Hh pathway is repressed by Gαs and activated by Gαi in the
developing NT.
(A-D) HH-12 chicken NTs were electroporated with different constructs cloned in pCIG
for 24h. Transverse sections were stained with antibodies against Pax7 (Red in A, C),
Olig2 (Red in B, D and Blue in A, C) and Nkx 2.2 (Blue in B, D). GFP expression
(Green) denotes the transfection intensity and it is shown to the right of each image. (E)
Bar graph showing the percentage of positive cells for each maker with respect to the
non-electroporated side (left). (F) In an experiment similar to the above, the activity of
the Hh pathway was assessed with the GBS-Luc reporter. The bar graphs show the level
of Luciferase activity with respect to the control (pCIG) transfected NTs. All the bar
graphs in this figure show the mean ± s.d. of at least three independent experiments. The
total number of cells counted in each data point in panel E is indicated inside each bar.
Significant differences were assessed by one-way ANOVA followed by the Tukey’s
test: * = P<0.05, ** = P<0.01 *** = P<0.001. Scale bar represents 50 µm.
Jour
nal o
f Cel
l Sci
ence
Acc
epte
d m
anus
crip
t

REFERENCES
Barzi, M., Kostrz, D., Menendez, A. and Pons, S. (2011). Sonic Hedgehog-induced proliferation requires specific Galpha inhibitory proteins. The Journal of biological chemistry 286, 8067-8074. Barzi, M., Berenguer, J., Menendez, A., Alvarez-Rodriguez, R. and Pons, S. (2010). Sonic-hedgehog-mediated proliferation requires the localization of PKA to the cilium base. J.Cell Sci. 123, 62-69. Briscoe, J. and Therond, P. P. (2013). The mechanisms of Hedgehog signalling and its roles in development and disease. Nature reviews. Molecular cell biology 14, 416-429. Cayuso, J., Ulloa, F., Cox, B., Briscoe, J. and Marti, E. (2006). The Sonic hedgehog pathway independently controls the patterning, proliferation and survival of neuroepithelial cells by regulating Gli activity. Development 133, 517-528. Corbit, K. C., Aanstad, P., Singla, V., Norman, A. R., Stainier, D. Y. and Reiter, J. F. (2005). Vertebrate Smoothened functions at the primary cilium. Nature 437, 1018-1021. Dahmane, N. and Ruiz i Altaba, A. (1999). Sonic hedgehog regulates the growth and patterning of the cerebellum. Development 126, 3089-3100. Dessaud, E., McMahon, A. P. and Briscoe, J. (2008). Pattern formation in the vertebrate neural tube: a sonic hedgehog morphogen-regulated transcriptional network. Development 135, 2489-2503. Epstein, D. J., Marti, E., Scott, M. P. and McMahon, A. P. (1996). Antagonizing cAMP-dependent protein kinase A in the dorsal CNS activates a conserved Sonic hedgehog signaling pathway. Development 122, 2885-2894. Hamburger, V. and Hamilton, H. L. (1992). A series of normal stages in the development of the chick embryo. 1951. Developmental dynamics : an official publication of the American Association of Anatomists 195, 231-272. Hammerschmidt, M. and McMahon, A. P. (1998). The effect of pertussis toxin on zebrafish development: a possible role for inhibitory G-proteins in hedgehog signaling. Dev.Biol. 194, 166-171. He, X., Zhang, L., Chen, Y., Remke, M., Shih, D., Lu, F., Wang, H., Deng, Y., Yu, Y., Xia, Y. et al. (2014). The G protein alpha subunit Galpha is a tumor suppressor in Sonic hedgehog-driven medulloblastoma. Nature medicine. Huang, Y., Roelink, H. and McKnight, G. S. (2002). Protein kinase A deficiency causes axially localized neural tube defects in mice. The Journal of biological chemistry 277, 19889-19896. Hwang, S. H. and Mukhopadhyay, S. (2015). G-protein-coupled receptors and localized signaling in the primary cilium during ventral neural tube patterning. Birth defects research. Part A, Clinical and molecular teratology 103, 12-19. Le Dreau, G. and Marti, E. (2012). Dorsal-ventral patterning of the neural tube: a tale of three signals. Developmental neurobiology 72, 1471-1481. Linder, J. U. (2006). Class III adenylyl cyclases: molecular mechanisms of catalysis and regulation. Cellular and molecular life sciences : CMLS 63, 1736-1751. Low, W. C., Wang, C., Pan, Y., Huang, X. Y., Chen, J. K. and Wang, B. (2008). The decoupling of Smoothened from Galphai proteins has little effect on Gli3 protein processing and Hedgehog-regulated chick neural tube patterning. Dev.Biol. 321, 188-196. Lum, L., Yao, S., Mozer, B., Rovescalli, A., Von Kessler, D., Nirenberg, M. and Beachy, P. A. (2003). Identification of Hedgehog pathway components by RNAi in Drosophila cultured cells. Science 299, 2039-2045. Marti, E., Bumcrot, D. A., Takada, R. and McMahon, A. P. (1995). Requirement of 19K form of Sonic hedgehog for induction of distinct ventral cell types in CNS explants. Nature 375, 322-325. McCaffrey, L. M. and Macara, I. G. (2011). Epithelial organization, cell polarity and tumorigenesis. Trends in cell biology 21, 727-735.
Jour
nal o
f Cel
l Sci
ence
Acc
epte
d m
anus
crip
t

McConnachie, G., Langeberg, L. K. and Scott, J. D. (2006). AKAP signaling complexes: getting to the heart of the matter. Trends Mol.Med. 12, 317-323. Mukhopadhyay, S. and Rohatgi, R. (2014). G-protein-coupled receptors, Hedgehog signaling and primary cilia. Seminars in cell & developmental biology 33C, 63-72. Mukhopadhyay, S., Wen, X., Ratti, N., Loktev, A., Rangell, L., Scales, S. J. and Jackson, P. K. (2013). The ciliary G-protein-coupled receptor Gpr161 negatively regulates the Sonic hedgehog pathway via cAMP signaling. Cell 152, 210-223. Nozawa, Y. I., Lin, C. and Chuang, P. T. (2013). Hedgehog signaling from the primary cilium to the nucleus: an emerging picture of ciliary localization, trafficking and transduction. Current opinion in genetics & development 23, 429-437. Ogden, S. K., Fei, D. L., Schilling, N. S., Ahmed, Y. F., Hwa, J. and Robbins, D. J. (2008). G protein Galphai functions immediately downstream of Smoothened in Hedgehog signalling. Nature 456, 967-970. Pan, Y., Bai, C. B., Joyner, A. L. and Wang, B. (2006). Sonic hedgehog signaling regulates Gli2 transcriptional activity by suppressing its processing and degradation. Mol.Cell Biol. 26, 3365-3377. Pedersen, L. B. and Rosenbaum, J. L. (2008). Intraflagellar transport (IFT) role in ciliary assembly, resorption and signalling. Curr.Top.Dev.Biol. 85, 23-61. Persson, M., Stamataki, D., te Welscher, P., Andersson, E., Bose, J., Ruther, U., Ericson, J. and Briscoe, J. (2002). Dorsal-ventral patterning of the spinal cord requires Gli3 transcriptional repressor activity. Genes & development 16, 2865-2878. Riobo, N. A., Saucy, B., Dilizio, C. and Manning, D. R. (2006). Activation of heterotrimeric G proteins by Smoothened. Proc.Natl.Acad.Sci.U.S.A 103, 12607-12612. Rios, I., Alvarez-Rodriguez, R., Marti, E. and Pons, S. (2004). Bmp2 antagonizes sonic hedgehog-mediated proliferation of cerebellar granule neurones through Smad5 signalling. In Development, vol. 131, pp. 3159-3168. Rohatgi, R., Milenkovic, L. and Scott, M. P. (2007). Patched1 regulates hedgehog signaling at the primary cilium. Science 317, 372-376. Sadana, R. and Dessauer, C. W. (2009). Physiological roles for G protein-regulated adenylyl cyclase isoforms: insights from knockout and overexpression studies. Neuro-Signals 17, 5-22. Shen, F., Cheng, L., Douglas, A. E., Riobo, N. A. and Manning, D. R. (2013). Smoothened is a fully competent activator of the heterotrimeric G protein G(i). Molecular pharmacology 83, 691-697. Siller, K. H. and Doe, C. Q. (2009). Spindle orientation during asymmetric cell division. Nature cell biology 11, 365-374. Stamataki, D., Ulloa, F., Tsoni, S. V., Mynett, A. and Briscoe, J. (2005). A gradient of Gli activity mediates graded Sonic Hedgehog signaling in the neural tube. Genes & development 19, 626-641. te Welscher, P., Zuniga, A., Kuijper, S., Drenth, T., Goedemans, H. J., Meijlink, F. and Zeller, R. (2002). Progression of vertebrate limb development through SHH-mediated counteraction of GLI3. Science 298, 827-830. Tempe, D., Casas, M., Karaz, S., Blanchet-Tournier, M. F. and Concordet, J. P. (2006). Multisite protein kinase A and glycogen synthase kinase 3beta phosphorylation leads to Gli3 ubiquitination by SCFbetaTrCP. Mol.Cell Biol. 26, 4316-4326. Tuson, M., He, M. and Anderson, K. V. (2011). Protein kinase A acts at the basal body of the primary cilium to prevent Gli2 activation and ventralization of the mouse neural tube. Development 138, 4921-4930. Wang, B., Fallon, J. F. and Beachy, P. A. (2000). Hedgehog-regulated processing of Gli3 produces an anterior/posterior repressor gradient in the developing vertebrate limb. Cell 100, 423-434. Wechsler-Reya, R. J. and Scott, M. P. (1999). Control of neuronal precursor proliferation in the cerebellum by Sonic Hedgehog. Neuron 22, 103-114.
Jour
nal o
f Cel
l Sci
ence
Acc
epte
d m
anus
crip
t