Embed Size (px)
Citation preview
Drug and Alcohol Dependence, 23 09891165- 170 Elsevier Scientific Publishers Ireland Ltd.
165
Chronic ingestion of ethanol increases stimulation-induced voluntary activity in the rat
Leigh C. Ward” and Luke C. Jonesb
“Alcohol Research Unit and bDepartment of Social and Preventative Medicine, University of Queensland, St Lucia, QLD 4067 (Aus tralial
(Received November 8th. 19881
Acute exposure of an animal to ethanol has a biphasic effect on activity; at low doses incurring stimulation of locomotor
activity whilst at higher doses eliciting a depression in activity level. The present study reports the effect of short-term (10
days) exposure to ethanol on running wheel activity in female Wistar rats. Ethanol treatment (3 g/100 ml in drinking water)
increased significantly the rate of accumulation of total distance run but not the daily rate of running when compared to con-
trol animals. This increase was attributable to an increased rate of running stimulated by daily feeding and handling by the
experimenter.
Key words: ethanol; rats, motor activity; running wheel
Introduction
It has been well documented that ethanol administered acutely to animals has a biphasic effect upon a number of aspects of animal behaviour [l], including locomotor activity [2,3]. At high, but non-narcotic doses 04 g/kg), ethanol elicits a decrease in the magnitude or frequency of a behaviour pattern, for example, operant response for food [4 - 71 or spontaneous motor activity [4,5]. This effect has been observed in a variety of species and for a vari- ety of behaviour patterns and appears to be a dose-dependent phenomenon [3 - 111. However, some eg. [6,7,12] but not all [13] studies have demonstrated that at low doses of ethanol (< 2.5 g/kg) an increase in locomotor activity can occur. The stimulatory effect of acute low doses of ethanol appears to be markedly influenced by species [3,8,11], strain [14,15] and age of ani- mal [16], ethanol dose, both magnitude and time of administration, [13,17] and the form of test used [18]. The mechanism of action of ethanol in stimulating activity is not known, although a
number of studies, see [19], have implicated a catecholamine-mediated process.
The longer-term effects of ethanol have been less well studied and have produced conflicting results. Masur and co-workers [20] demon- strated that mice treated chronically with ethanol (1 - 4 g/kg) for between 15 and 60 days showed an increase in locomotor activity, as measured by spontaneous movement within the cage, when subsequently challenged with an acute dose of ethanol. A later study by these workers [ll] confirmed these results in mice, but failed to demonstrate a similar response in rats. These observations of Masur et al. [11,20] are supported by those of Crabbe et al. [2], but not by those of Tabakoff and Kiianmaa [21]. It should be noted that in these studies locomotor activity was measured over short periods of time at irregular intervals during the treat- ment period.
Although the level of a voluntary locomotor activity such as wheel running can be readily determined continuously over prolonged peri- ods [22], application of this approach to the
0376-8716/89/$03.50 0 1989 Elsevier Scientific Publishers Ireland Ltd.
Printed and Published in Ireland

166
study of the effects of ethanol has been limited. A biphasie response similar to that noted above has been reported [8] for running wheel activity (measured over 10 min) in Mongolian gerbils receiving acute doses of ethanol in the range 0.8-2.4 g/kg, but not in rats (measured over 60 mini [3]. Miller et al. [23] found that male rats fed chronically upon a liquid diet containing 35% of calories as ethanol had impaired activ- ity levels when measured under brief (3 by 2 minute periods) forced running conditions on a moving belt apparatus. In contrast when administered chronically, ethanol had no signif- icant effect upon prolonged voluntary wheel- running by male Sprague- Dawley rats over an 8-week period during which ethanol intake was progressively increased from 0 to 35% of calories [24].
Interpretation of these data is difficult. Forced running is an unreliable indicator of an animal’s propensity for activity and Spraque- Dawley rats have been reported to exhibit highly variable rates of running between individuals [25,26], whilst measures of activity levels over brief periods and their aggregation to provide 24-h data may exacerbate Type II error rates [27]. Furthermore, exposure to high and constantly changing doses of ethanol pro- vide a variable profile of ethanol concentrations in the blood and falling blood ethanol levels have been suggested to cause enhanced irrita- bility in mice since aggression is highest after blood ethanol levels have peaked and begun to decline [28]. Such a mechanism may account for the biphasic effect of ethanol on locomotor activity. However, study of the effect of low doses of ethanol and measurement of activity levels with high resolution over prolonged peri- ods is required to test this hypothesis.
The purpose of the present study was to determine the effect of short-term (2 weeks) administration of a low dose of ethanol (3 g/100 ml) upon patterns of voluntary wheel-running by female Wistar strain rats.
Materials and methods
Experimental animals and housing Wistar-strain rats, weighing between 175
and 195 g, from an outbred colony at the Cen- tral Animal Breeding House, University of Queensland were used. Animals were non-litter mate females maintained from weaning on a commercial rodent pellet diet (Barastok Pty. Ltd., Brisbane, Australia). Animals were housed in plastic rodent cages in groups of four with free access to food and water prior to each experimental trial. Environmental conditions in the animal house were 12 h light/l2 h dark (light from 0700 to 1900 hl and 24 + 2 “C.
Cages and running wheels Wahmann-style running wheels were used
consisting of a rectangular (200 x 140 x 140 mm) steel mesh cage, fitted with a food hopper and water bottle, attached to a back plate sup- porting a 340 mm diameter running wheel. Access to the wheel from the cage was via a 60 mm diameter hole in the back-plate which could be closed by a shutter. The wheels were fitted with friction clamps on the axles so that the force required to rotate the wheel could be adjusted to be the same for all wheels (83 Nml. Wheel revolutions were recorded using a microcomputer-based data logging system described elsewhere (Johnson H.R. et al., submitted).
Experimental protocol
At the commencement of the experimental trial period rats were weighed and randomly assigned to the six different treatment groups, eight animals per group: 6 and ii), control ani- mals, with and without wheel access; (iii and iv), ethanol-fed, with and without wheel access and lv and vi), glucose-fed, with and without wheel access. The animals were allowed 24 h-access to 50 g food each day and access to water ad libi- turn (groups i and ii); or ethanol solution (3 g/100 ml, groups iii and iv); or glucose solution (2 gl 100 ml, groups v and vi). The concentration of glucose was determined from preliminary experiments to yield a similar caloric intake to that of ethanol. In order to overcome the natu- ral aversity of the rat to oral ingestion of ethanol [29] and to encourage its consumption the ethanol solution was sweetened with 50 mg sodium cyclamate and 5 mg sodium saccharin

per 100 ml [30]. The drinking fluids were sup- plied from bottles fitted with ball-bearing- sealed nipple feeders to minimise spillage and loss of ethanol by evaporation (< 5%). Rats were housed individually in the running wheel cages. Following a four-day adaptation period the animals were studied for a further 10 days. During this time continuous wheel access was allowed for half the animals in each dietary treatment. All animals were weighed and food and drinking fluid replaced at the same time each day commencing 1 h after the start of the light period (0800 hl and finishing approxi- mately 0830 h. In order to minimise disturbance to the animals, entry to the animal house was restricted to this time only.
On the final day of the experimental period blood ethanol concentrations of the ethanol-fed animals were determined in heparinized plasma samples from blood obtained via cardiac puncture of rats anaesthetized with ether. Blood samples were obtained between 30 and 60 min following the start of the light period. Ethanol concentrations were determined according to the method of Lundquist [31].
Analysis of data Data are presented as mean f standard
error of the mean and were analysed by ANO- VAR and the significance of differences by the Scheffe test [27]. Differences in the rate of increase in wheel running with time was
167
analysed by fitting the data by non-linear regression to a polynomial function [32] and subsequent comparison by ANOVAR of the rate constants of the fitted equations.
Results and discussion
The mean daily food intakes of the six groups of rats are presented in Table I. Irrespective of dietary treatment regime, food intakes of wheel running-rats were not signifi- cantly different from those of corresponding sedentary animals. Duration of wheel running also did not affect food intake, there being no significant change in intake within a treatment group over the lo-day wheel access period. The food intakes of the glucose-fed and ethanol-fed animals, both wheel-runners and sedentary, were, however, greater (range 7-26%) than those of corresponding non-supplemented con- trol rats. These differences were significant (P < 0.011 for all comparison pairs with the exception of ethanol-fed plus wheel versus con- trol plus wheel. These differences were also reflected in the significantly higher P < 0.001) total daily caloric intakes of these animals. The contributions of the dietary supplements to total caloric intakes were similar for both ethanol-fed and glucose-fed and were signifi- cantly decreased by wheel running for the ethanol-fed rats only (16% decrease, P < 0.05).
Fluid intake was significantly P < 0.0011
Table I. Effect of wheel-running, glucose and ethanol feeding upon nutritional parameters of female Wistar rats.
Dietary treatment Glucose-fed Ethanol-fed Control-fed
-
Wheel access + - + - + -
Food intake (g) 17.3 2 0.4” 18.1 f. 0.5’ 16.0 f 0.7 18.1 r 0.3’ 14.9 2 0.5b 14.3 f O.Ob - Fluid intake (ml) 62.8 f 5.4 63.4 + 3.2 24 g f 1 ~.d
84:6 + 3:6’ 33 9
’ * 1 O”,d
91.4 & 1:4. 36.4 f 8.1d 20.8 2 0.5d,e
Caloric intake (Total kcal) 86.8 + 3.5’ 90.4 & 3.1’ 70.5 f 2.2* 68.1 -c 1.7d Ethanol intake (kcal) _ _ 5.4 f 0.3’ 7.3 + 0.2” _ _
(O/o of total kcal) - - 6.8 f 0.4’ 8.1 f 0.2” Glucose intake (kcal) 5.0 f 0.4 5.5 + 0.3 - _ - _
(O/o of total kcal) 5.9 + 0.4 6.0 ? 0.3 - - _ _
Growth rate (g/d) 1.2 f 0.3 1.6 f 0.3 1.4 * 0.2 1.8 f 0.2 2.2 f 0.8 1.4 f 0.2
Data are presented as mean f S.E. [8]. Significance of difference within feeding treatments: i vs ii, P < 0.05; iii vs iv, P < 0.001. Significance of difference between feeding treatments: a vs b and d vs e, P < 0.01; c vs d, P < 0.001.

168
increased by addition of both glucose (23%) and sweetened ethanol (63%) when compared with pure water for the non-running rats. Wheel running had a mixed effect depending upon the dietary regime. There was no significant effect of wheel running upon intake of the glucose solution; a significant decrease (26%, P < 0.001) in the ethanol-fed group; and a large (75%) but non-significant difference within the control rats receiving pure water. For both running and sedentary rats intake of glucose solution was significantly greater (60% and 68%, respectively, P < 0.01) than that of cor- responding ethanol-fed rats.
All animals increased their bodyweight over the experimental period, daily growth rates ranging between 1.2 and 2.0 g/day. Differences in growth rate were not significant between groups.
The concentration of ethanol in plasma of the ethanol-fed rats on the last day of the trial var- ied widely, ranging from 10.8 mM to 59.2 mM (mean 13.75 mM) and were not significantly dif- ferent between running and non-running animals.
The activity levels of the three groups of wheel-running rats are presented in Fig. 1. Daily activity level (expressed as total distance run) increased for all groups of rats over the lo- day period (Fig. la). Owing to a considerable variation in activity between rats within a group, and to a lesser extent from day to day for individual rats, no consistently significant differences in the daily level of running between the three groups were discernable. The rate of increase in the cumulative total distance run (Fig. lb) was, however, significantly greater (243 + 9 mdm2, P < 0.01) for the ethanol-fed rats than that of either the glucose-fed or control rats (203 + 8 and 184 + 4 mdV2 respectively).
In the present work, the reciprocal effects of either glucose - the sweetener commonly mixed with ethanol - or artificially sweetened ethanol (with sodium cyclamate and saccharin) and wheel running were assessed. Glucose was found to have no significant effect on wheel running. Wheel running, however, significantly
0 r T al
b
I
5
Days
10
Fig. 1. “Distance (metres) run daily by control rats (WI, glucose-fed rats (A) and ethanol-fed rats (0 1. Tumulative distance (metres) run by control rats (W, glucose-fed rats (A) and ethanol-fed rats (0 1. Data are presented as mean f S.E. [8].
increased glucose consumption and food intake in glucose-fed rats. In contrast, sweetened ethanol increased the rate of accumulated wheel running, while wheel running reduced ethanol consumption. Thus it would appear that employing glucose as the ethanol vehicle risks confounding the appetite/activity interaction.
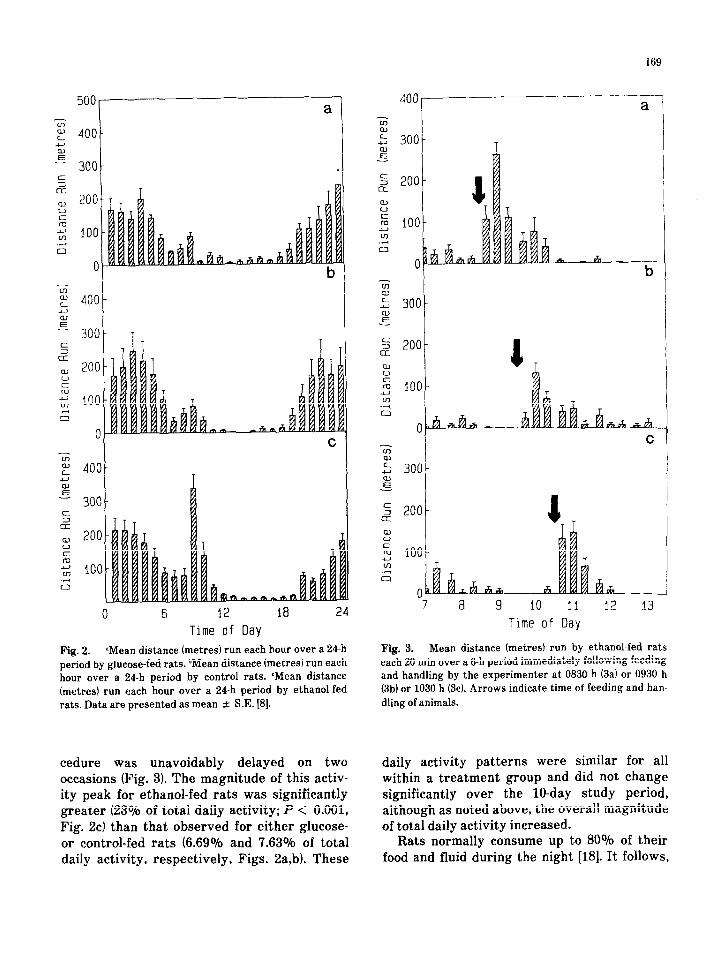
Consistent with the finding of others, we observed a nocturnal running preference. The pattern of running for an individual 24 h-period was characterised by high levels of activity throughout the dark period with a maximum at approximately the mid-point (0200 to 03001 and falling to a nadir during the light period. (Fig. 21. Of particular interest was the observation that wheel running peaked in the ethanol-fed group during and immediately after feeding and handling by the experimenter as demon- strated clearly when the feeding/handling pro-
169
a
c
E 200
g 100 0
0
: 4001 42 I
-z p 400. -e,
E 300- c
% 200- l-l
g loo- 0
0 12 1% 24 6 Time of Day
9 10 11 12 13 Time of Day
Fig. 2. “Mean distance (metres) run each hour over a 24-h Fig. 3. Mean distance (metresj run by ethanol-fed rats
period by glucose-fed rats. bMean distance (metres) run each each 20 min over a 6-h period immediately following feeding
hour over a 24-h period by control rats. ‘Mean distance and handling by the experimenter at 0830 h (3a) or 0930 h
(metres) run each hour over a 24-h period by ethanol-fed (3b) or 1030 h (3~). Arrows indicate time of feeding and han-
rats. Data are presented as mean 2 S.E. [8]. dling of animals.
cedure was unavoidably delayed on two occasions (Fig. 31. The magnitude of this activ- ity peak for ethanol-fed rats was significantly greater (23% of total daily activity; P < 0.001, Fig. 2c) than that observed for either glucose- or control-fed rats (6.690/b and 7.63% of total daily activity, respectively, Figs. 2a,bl. These
_ -z z 300 .E
daily activity patterns were similar for all within a treatment group and did not change significantly over the lo-day study period, although as noted above, the overall magnitude of total daily activity increased.
Rats normally consume up to 80% of their food and fluid during the night [l%]. It follows,
170
therefore, that if that fluid were ethanol, then blood ethanol levels would be falling during the early diurnal hours, a conclusion supported by the observation of highly variable blood ethanol concentrations at this time. It has been sug- gested that falling blood ethanol levels are accompanied by heightened irritability [28]; a manifestation of the anxiolytic effects of ethanol [33]. Handling during this period appears to provoke activity, and this could influence results in studies employing only brief activity measures.
Acknowledgement
The authors wish to thank Mr. S. Mason for performing the blood ethanol assays.
References
7
8
9 10
L.A. Pohorecky, Biobehav. Rev., l(1977) 231. J.C. Crabbe et al. J. Comp. Physiol. Psych., 96 (1982) 440. P.M. Duncan and M. Baez, Pharmacol. Biochem. Behav., 15 (1981) 819. P.M. Duncan and N.J. Cook, Psychopharmacology, 74 (1981) 256. I. Todzy, H. Coper and M. Fernandos, Psychopharma- cology, 59 (1978) 143. G.D. Frye and G.R. Breese, Psychopharmacology, 75 (1981) 372. J.A. Matchett and C.K. Eriksson, Psychopharma- cology, 52 (1977) 201. T.F. Pettijohn, Pharmacol. Biochem. Behav., 10 (1979) 339. J.E. Barrett, J. Pharmacol. Exp. Ther., 196 (1976) 605. M.L. Healy and L.A. Dykstra, Pharmacol. Biochem. Behav., 13 (1980) 349.
11
12
13
14
15
16
17 18 19
20
21
22
23 24 25
26 27
28
29
30 31
32
33
J. Masur, M.L. 0. De Souza and A.P. Zwicker, Pharma- col. Biochem. Behav., 24 (1986) 1225. R. Smoothy and M.S. Berry, Psychopharmacology, 85 (1985) 57. J.G. Linakis and C.L. Cunningham, Psychopharma- cology, 64 (1979) 61. C.L. Randall et al. Pharmacol. Biochem. Behav., 3 (1975) 533. C.K. Erikson and A. Kochlar, Alcoholism: Clin. Exp. Res., 9 (1985) 310. R. Lamble and U. Rydberg, Acta Pharmacol. Toxicol., 50 (1982) 246. K.M. Phillips, Physiol. Behav., 20 (1982) 785. T. Ljunberg, Pharmacol. Biochem. Behav., 8 (1978) 191. M.K. Ticku and S.K. Kulkarni, Pharmacol. Biochem. Behav., 30 (1988) 501. J. Masur and R. Boerngen, Pharmacol. Biochem. Behav., 13 (1980) 777. B. Tabakoff and K. Kiianmaa, Pharmacol. Biochem. Behav., 17 (1982) 1073. S.A. Barnett, The Rat. A Study in Behavior. Austra- lian National Univeristy Press, Canberra, 1976, pp. 318. S.S. Miller et al. Psychopharmacology, 68 (1980) 55. S.I. Barr, Pharmacol. Biochem. Behav., 29 (1988) 667. B.C. Shyu, S.A. Anderson and P. Thoren, Acta Physiol. Stand., 1210984) 103. J.C. Russell et al. J. Appl. Physiol., 63 (1987) 2549. D. Colquhoun, Lectures in Biostatistics, Clarendon Press, Oxford, 1971 pp. 425. D.M. Maier and L.A. Pophorecky, Agressive Behav., 13 (1987) 259. T.J. Cicero et al. (Eds.), Animal Models in Alcohol Research, Academic Press, New York, 1980 p. 99. J.F. Nash and R.P. Maikel, Life Sci., 37 (1985) 757. F. Lundquist, in: Glick (Ed.), Methods of Biochemical Analysis, Vol. VII, Academic Press, New York, 1959, p. 217. Graphpad. (1987) IS1 Software, Institute for Scientific Information, Philadelphia, Ch. 6. M.J. Durcan and G. Lister, Psychopharmacology, 96 (1988) 67.