Embed Size (px)
Citation preview
June 1987 Vol. 28 /6
Investigative Ophthalmology & Visual Science
A Journal of Basic and Clinical Research
Articles
Chronic Glaucoma Selectively Damages Large Optic Nerve Fibers
Horry A. Quigley, Ralph M. Sanchez, Gregory R. Dunkelberger, Nancy L. L'Hernault, and Thomas A. Baginski
To determine whether glaucoma selectively injures a particular size of optic nerve fiber (and its cell body), we induced chronic experimental glaucoma in one eye each of ten monkeys. With automated image analysis, the number and diameter of optic nerve fibers were compared between each glaucomatous eye and its normal fellow eye. Fibers larger than the normal mean diameter atrophied more rapidly in glaucomatous eyes, though no fiber size was spared from damage. The mean fiber diameter for glaucomatous eyes was 0.74 jim, significantly lower than the mean for ten fellow eyes, 0.85 /im (P < 0.005). There was preferentially greater atrophy of fibers of all sizes in the superior and inferior peripheral nerve sectors, as seen in human eyes with glaucoma. The more rapid atrophy of larger fibers appeared to result from two causes. The areas that suffer most rapid loss of fibers in experimental glaucoma normally contain a high proportion of larger diameter fibers. Furthermore, larger fibers were lost preferentially even in areas of the optic nerve with mild damage, indicating their inherent susceptibility to injury by glaucoma. The tendency for large fibers to be lost in glaucoma has implications for future improvements in testing for early glaucoma damage. Invest Ophthalmol Vis Sci 28:913-920,1987
The early phase of visual loss in chronic glaucoma is unnoticed by the patient and poorly detected by present clinical tests. Recent information suggests that considerable numbers of optic nerve fibers are lost before recognition of damage.1 Newer methods of automated visual field testing have, no doubt, improved the overall level of psychophysical testing being performed on the glaucoma population. However, it is as yet unclear whether they actually detect glaucoma damage substantially earlier than previous, manual methods using essentially the same testing paradigm.2
This study examines whether chronic elevated intraocular pressure (IOP) selectively injures optic nerve fibers of any particular size. Retinal ganglion cells of different sizes have different functional prop-
From the Glaucoma Service, Wilmer Institute, Johns Hopkins University School of Medicine, Baltimore, Maryland.
Supported in part by PHS Research Grants EY 02120 (Dr. Quigley), EY 01765 (Core Facility Grant, Wilmer Institute) from the National Eye Institute, National Institutes of Health, Bethesda, Maryland, and by unrestricted funds from National Glaucoma Research, American Health Assistance Foundation, Washington, D.C.
Submitted for publication: October 9, 1986. Reprint requests: Dr. Quigley, Maumenee B-l 10, Wilmer Insti
tute, Johns Hopkins Hospital, Baltimore, MD 21205.
erties. If glaucoma injures one size of ganglion cell preferentially, it would have implications for improved clinical testing of early glaucoma damage. Chronic experimental glaucoma was produced in one eye of macaque monkeys and the optic nerve fiber size distribution was compared to that in the normal fellow eyes.
Materials and Methods
Chronic experimental glaucoma was induced3 in one eye of ten cynomolgus monkeys (Macaca fas-cicularis). These animals have retinal and optic nerve anatomy that is nearly identical to human eyes, and the experimental glaucoma shares many features of human glaucomatous optic neuropathy.4-6 The significant advantages of the non-human primate system include the ability to obtain perfect tissue fixation and the direct comparison of a glaucomatous nerve to a normal one in the same animal. These substantially increase the sensitivity of the method. The experiments carried out here adhered to the ARVO Resolution on the Use of Animals in Research. At no time was any animal blinded or in pain. The procedures were specifically approved by the Animal Care Committee of the Johns Hopkins School of Medicine.
913 Downloaded From: http://iovs.arvojournals.org/pdfaccess.ashx?url=/data/journals/iovs/933365/ on 04/01/2018

914 INVESTIGATIVE OPHTHALMOLOGY b VISUAL SCIENCE / June 1987 Vol. 28
1.00 | •-
o
AT
(T
ir. UJ I±J
2
< Q
rr UJ CD u. -I
< 2 ft z < o o 3 < - I
o
0.98 0.96
0 9 4
0.92
0 9 0
0.88
0 8 6
0.84
0.82 0.80
0.78 0.76
0.74 0.72 0.70
0 0 2 0.4 Q6 0.8 1.0 PROPORTION OF FIBERS REMAINING
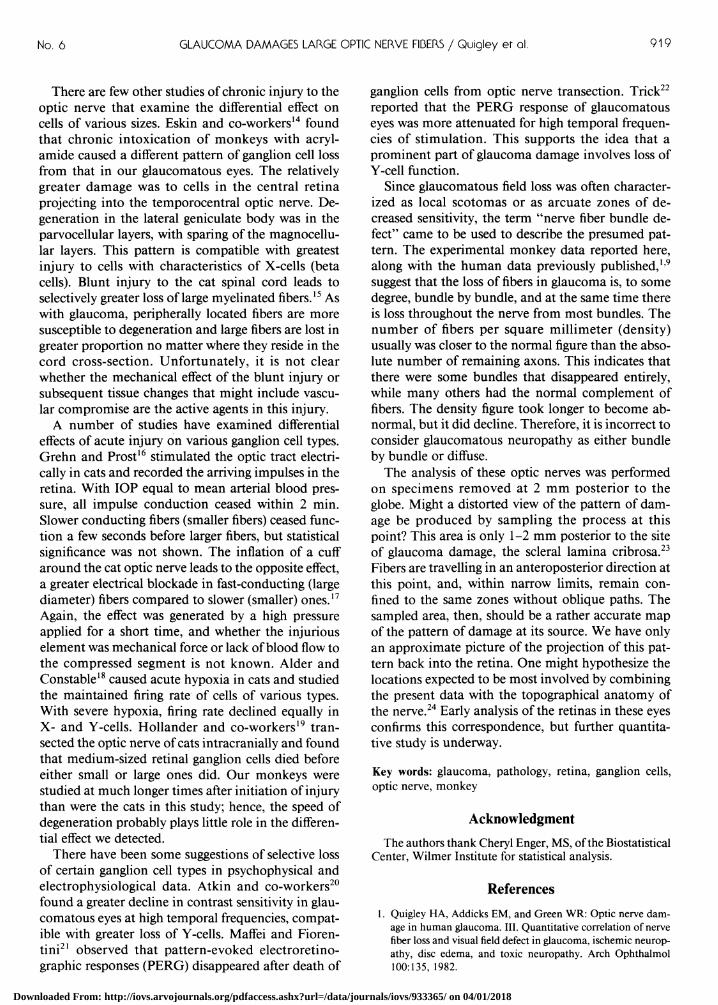
Fig. 1. The more fibers were lost from a glaucoma nerve, the greater was the proportionate loss of larger fibers. In this graph, the ratio between glaucomatous eyes and their fellow normal eyes is plotted for fiber diameter (y axis) versus remaining number of fibers (x axis). The correlation coefficient indicates that there is a significant relationship (r = 0.75, P < 0.01).
Experimental glaucoma was induced by argon laser treatment of the trabecular meshwork under keta-mine hydrochloride sedation and intravenous sodium pentobarbital anesthesia.3 The duration of IOP elevation was from 6 to 16 months, with mean IOP varying from 25 to 40 mm Hg. IOP was measured under ketamine sedation and topical proparacaine hydrochloride anesthesia using both a slit-lamp mounted applanation tonometer and a manometri-cally calibrated pneumatonograph. The clinical stage of optic nerve damage was judged by stereoscopic ophthalmoscopy and fundus photography on color film and in red-free light on black and white film.
Animals were sacrificed under intravenous sodium pentobarbital anesthesia. Exsanguination was carried out by opening the right heart after cannulation of the abdominal aorta. Fixation was achieved by sequential perfusion of paraformaldehyde and glutaralde-hyde at low concentration (1% and 1.5%) followed by higher concentration (4% and 5%, respectively). The optic nerve was marked with one razor slice at the 12 o'clock position prior to removal of a nerve cross-section 2 mm posterior to the globe. Two further razor slices were then made into the nasal side of each cross-sectional piece, so that the orientation would be preserved in subsequent epoxy-embedded thick sections.
One-micron sections stained with paraphenylene-diamine were photographed and printed on 16 X 20 in paper. Using the razor slices for orientation, we divided the nerves into 16 segments of approximately equal area. The area of nerve tissue contained within each segment was measured by planimetry. In each of
the 16 segments, at least 4 photomicrographs were taken and printed. These were placed in a Zeiss IBAS image analysis system (Carl Zeiss, Thornwood, NY) to count the number of axonal fibers per square millimeter. In addition, each myelinated fiber was analysed by an algorithm that determined its center of gravity and drew 32 radii to the inner edge of the myelin sheath. The smallest of these radii was multiplied by two and was denoted the minimum diameter. This system compensates for the unavoidable oblique sectioning of fibers. Fiber diameters were separated into bins separated by 0.1 /im. No attempt was made to correct for shrinkage due to fixation or sectioning.
Results
The ten monkeys exhibited a range of optic nerve damage caused by elevated IOP. In order to assess the level of damage, the normal variation in the number of optic nerve fibers counted by our system must be considered.7 Normal fiber number is approximately 1.2 million with a standard deviation of 0.2 million. Thus, a glaucomatous eye must show a 32% decrease in fiber number for there to be a statistically significant loss (P < 0.05). Two monkeys had nerve fiber number estimates within two standard deviations of normal. The first of these (M645) had only 6 months of IOP elevation to an average of 25 mm Hg. There was no charge in cup/disc ratio nor any detectable change in nerve fiber appearance in this eye. The other eye had a slight enlargement of cup/disc ratio during 7 months of an average IOP of 31 mm Hg, but no definite atrophy of nerve fiber layer was seen. The remaining eight monkeys exhibited varying degrees of loss of fibers that exceeded normal variation at a 2.5% confidence limit (one-tailed, t distribution). In each of these eyes, the cup/disc ratio clearly became larger than its pre-treatment size and there was definite loss of the nerve fiber layer striations. The mean fiber diameter for the whole optic nerve was estimated from the sampled axons in each eye, and a ratio was calculated between the glaucomatous and the normal eye of each animal (Table 1). In every case, this fiber diameter ratio was equal to or less than 1. This means that the glaucomatous eye had either the same or a lower mean fiber diameter than the normal eye. The mean fiber diameter for the ten glaucomatous eyes was significantly lower (0.74 ± 0.06 Mm) than the mean of their ten fellow normal eyes (0.85 ± 0.10 nm; paired t-test, P < 0.005). Furthermore, the differences in mean diameter between the glaucomatous nerve and the fellow normal nerve increased with increasing loss of fibers (Fig. 1).
Another method to illustrate the difference be-
Downloaded From: http://iovs.arvojournals.org/pdfaccess.ashx?url=/data/journals/iovs/933365/ on 04/01/2018

No. 6 GLAUCOMA DAMAGES LARGE OPTIC NERVE FIBERS / Quigley er ol. 915
Table 1. Optic nerve fiber data
Density Fiber number Diameter
Normals (N = 16) Monkey eye
224,719 ±30,686 G/N
1,246,926 ±230,492 G/N
0.830 ± 0.089 G/N
M645
M643
M624
M616
M644
M504
M626
M549
M620
M622
G N
G N
G N
G N
G N
G N
G N
G N
G N
G N
217,440 192,167
221,444 267,125
229,513 236,585
218,100 258,400
165,502 239,335
159,300 274,467
142,900 217,300
63,922 213,538
107,494 228,190
72,056 154,613
1.13
0.83
0.97
0.84
0.69
0.58
0.66
0.30
0.47
0.47
1,322,315 1,410,119
1,231,559 1,305,894
824,294 1,160,735
679,800 1,038,400
739,579 1,430,819
691,776 1,351,172
507,500 1,096,400
164,092 1,020,389
134,743 1,691,273
23,699 845,900
0.94
0.94
0.71
0.65
0.52
0.51
0.46
0.16
0.08
0.03
0.793 0.929
0.856 0.848
0.729 0.754
0.673 0.678
0.722 0.833
0.813 0.863
0.653 0.737
0.737 0.996
0.721 0.896
0.740 0.955
0.85
1.01
0.97
0.99
0.87
0.94
0.89
0.74
0.80
0.78
Units: density = axons/mm2; diameter = microns. G = glaucoma eye; N : normal eye; G/N = ratio of glaucoma to normal eye. Normal data given as
mean ± standard deviation.
tween the fiber distributions of glaucomatous and fellow eyes is to examine graphs of their fiber size distributions. In an example with no definite fiber loss, the distributions were nearly superimposable (Fig. 2). A glaucomatous eye with 50% loss of fibers had relative preservation of smaller diameter fibers and proportionately greater loss of those larger than the mean size (Fig. 3). This was confirmed by a chi-square test for linear trend (1 degree of freedom, P < 0.0001). The relative loss of fibers of various sizes must be examined, however, at each stage of optic nerve damage. This is most easily done by calculating the ratio of fibers in each glaucomatous and normal eye pair for diameters from 0.25 to 1.75 /mi. In doing so, three patterns were detected (Fig. 4). In animals with minimal atrophy, the ratio was nearly equal to 1 across all fiber sizes. Note that there was no tendency for all fibers to become smaller prior to loss of a significant number. If this were the case, the eyes with minimal or no loss would have ratios greater than 1 in size groups smaller than the original mean, and less than 1 in larger size groups. The second pattern (Fig. 4) pertained to most of the nerves, but was particularly well-illustrated by those with half of the nerve fibers destroyed. The ratio was much closer to 1 for
the smaller fibers than for larger fibers. Finally, in nerves with few fibers left, all fiber sizes had equally low ratios, simply because most fibers were gone.
In order to compare all ten animals in terms of ratios of various fiber sizes, the curves just shown were standardized. For each fiber size group, the ratio of fibers surviving (number of fibers of that size in the glaucomatous eye divided by number of fibers in the normal eye) was divided by the mean ratio between glaucomatous and normal fibers of all sizes for that nerve. For example, 75% of the fibers might remain in a small fiber size group, but overall the entire glaucomatous nerve had only 25% of the normal number. The standardization would give a ratio of 3 (75/25). This procedure was necessary only to allow direct comparison of the relative loss of fibers in all ten nerves. The ten curves so constructed were averaged to give Figure 5. The slope of the data clearly indicates a greater preservation of smaller compared to larger fibers, despite our inclusion of the nerves at the best- and worst-preserved ends of the spectrum (P < 0.001, regression analysis). Fibers with diameters from 0.35 to 0.75 /mi survived better (mean standardized ratio = 1.30 ± 0.37) compared to fibers with diameters from 0.85 to 1.25 /tm (mean standardized
Downloaded From: http://iovs.arvojournals.org/pdfaccess.ashx?url=/data/journals/iovs/933365/ on 04/01/2018
916 INVESTIGATIVE OPHTHALMOLOGY & VISUAL SCIENCE / June 1987 Vol. 28
160
Th
ou
sa
nd
s)
O O
O
NU
MB
ER
(
0)
OD
o
o
or UJ go 40 u.
20
r 7 II
li ll It I
i I
1 ll
li i
I
_ _ / i i l
\ NORMAL \ GLAUCOMA
\\
\\ \ \
0.05 0.25 0.45 0.65 Q85 1.05 1.25 FIBER DIAMETER,MICRONS
1.45 165 1.85
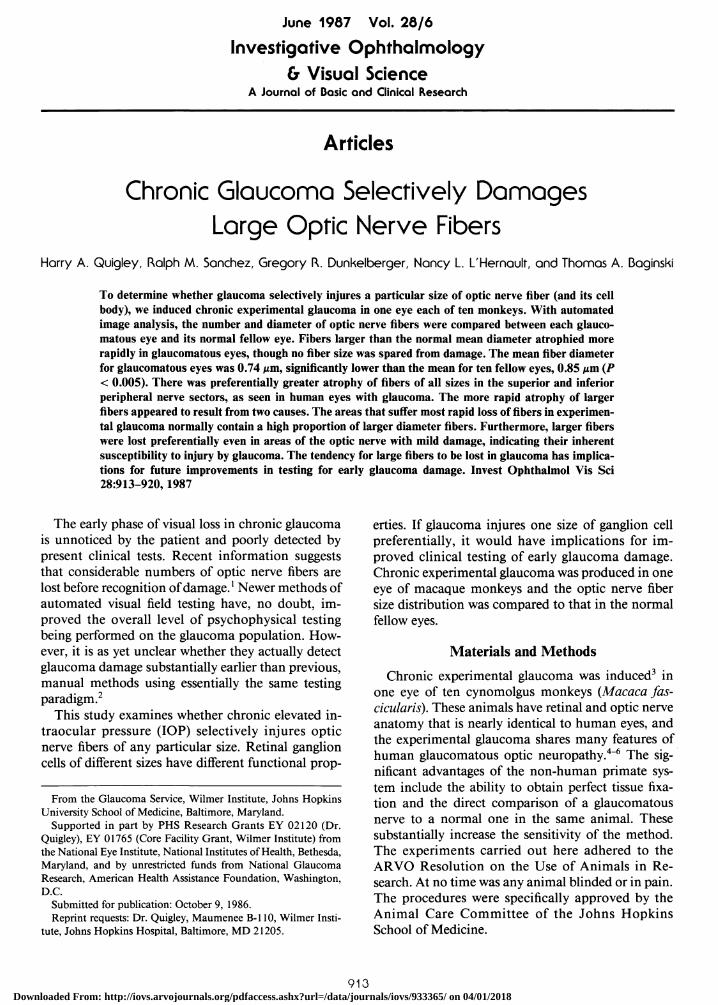
Fig. 2. The two curves show the distribution of fiber size in a glaucomatous eye without definite damage and its fellow normal eye. The curves are essentially superimposable, indicating that fibers do not shrink prior to dying (M643).
ratio = 0.80 ± 0.10; n = 10 in each group, P < 0.001, two-tailed t-test).
Differences in the rate of atrophy could be observed by examining some representative fiber diameter groups. The normal monkey fiber size distribution has peaks at 0.55, 0.85, and 1.55 /im.7 While these are not definitely proven to represent distinct populations of fibers, every normal nerve exhibits peaks at these points. The ratio between glaucomatous and normal nerves was calculated for these three diameter groups. The smallest group (0.55 iim) had the highest ratio (least fiber loss) in the six animals with mild or moderate atrophy (P < 0.05, two-tailed t-test). The medium and large fiber groups showed lower ratios (greater relative loss), though they were not statistically different from each other (P < 0.05).
The superior and inferior poles of the human optic nerve lose fibers at a greater rate than the temporal
0.05 0.25 0.45 0.65 0.85 1.05 1.25 1.45 FIBER DIAMETER, MICRONS
1.65 1.85
Fig. 3. The fiber size distribution in a moderately damaged glaucomatous nerve and its normal fellow eye. The curves differ when chi-square testing compares their size groups (P < 0.001,16 degrees of freedom). Most of the difference is due to a greater number of larger fibers lost in the glaucomatous nerve (P < 0.0001, chi-square test for trend, 1 degree of freedom).
.65 .85 1.05 FIBER DIAMETER, MICRONS
Fig. 4. The ratio between glaucoma and normal fiber number in each fiber size group from 0.25 to 1.45 fim for five different monkeys. The undamaged monkey (M643) shows a nearly straight line close to a ratio of 1. The bottom animal (M620) had severe loss of nearly every fiber size. In the three animals with intermediate loss (M504b, M626, M549b) there is an obvious trend toward a higher ratio (greater preservation) of smaller fibers compared to larger
and nasal nerve in chronic glaucoma.1 The monkey model system followed this pattern in non-quantitative analysis.6 The ten nerves studied here confirm quantitatively that monkey nerves lose fibers preferentially at the vertical poles of the nerve head. The nerve was divided into 16 segments to compare the survival of fibers of each size regionally (Fig. 6). The ratio of fibers in the glaucomatous and the normal
25 .45 .65 .85 1.05 1.25 1.45 FIBER DIAMETER, MICRONS
1.65 1.85
Fig. 5. The graph shows the ratio of fibers in ten glaucomatous nerves compared to their ten normal fellow eyes plotted for fiber size groups from 0.25 to 1.85 fim diameter. For each glaucoma/ normal pair, the actual ratio of fibers for each size was divided by the average ratio of fibers of all sizes for that nerve. By this standardization, all ten glaucoma/normal pairs can be compared in terms of the relative preservation of fibers of different sizes (see text). The curve is the mean ratio for the ten animals with one standard deviation shown. Where the ratio is greater than 1, fibers were relatively more preserved than average for all fiber sizes. It can be seen that fibers smaller than the normal mean size of 0.8 pm survived better (ratio > 1), while fibers larger than the mean fared worse (ratio < 1). Regression analysis shows a significant relationship of fiber size to survival (slope = -0.56, r = 0.87, P < 0.001).
Downloaded From: http://iovs.arvojournals.org/pdfaccess.ashx?url=/data/journals/iovs/933365/ on 04/01/2018
No. 6 GLAUCOMA DAMAGES LARGE OPTIC NERVE FIBERS / Quigley er ol. 917
MOST DAMAGE
S
LEAST DAMAGE
S
N T N T
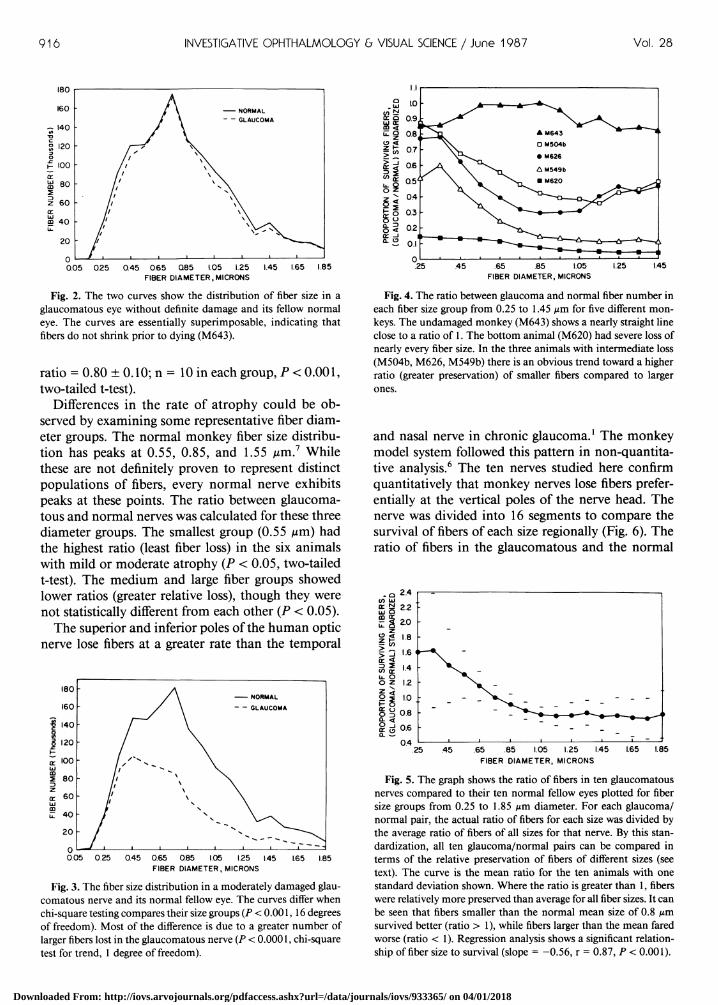
Fig. 6. In every glaucomatous nerve, the degree of fiber number loss was estimated by comparing to the fiber number in the fellow eye in that segment. Then, the four segments (out of 16) that showed the greatest fiber loss were totalled for all ten nerves. The darkest shading was placed in the segment that consistently had the greatest damage (among the worst damage group at left), or the least damage (at right). The most damage was consistently in segment Ep, inferonasally, followed closely by Hp and Fp. All of the segments that exhibited most damage were in the periphery of the nerve. By contrast, the best-preserved segments were found in the central—temporal nerve, the most consistently spared being Be, followed by Cc and Dc. Interestingly, segment Dp was among the most injured in three nerves and among the least injured in three. This was the only segment in which such ambiguity occurred.
nerve varied regionally to a considerable degree. For example, in M644, the glaucomatous eye had, overall, 52% of the fibers found in its normal fellow eye. Yet, some segments of that nerve had only 24% of the normal number, while the best-preserved segments had 85% of normal fibers. In all ten nerves, the 16 segments were ranked by the proportion of surviving fibers. The positions of the segments that were most commonly among the four worst-preserved and among the four best-preserved are shown in Figure 6. The three best-preserved segments were in the center of the nerve, temporally. The three segments that fared worst were peripheral ones, in the superior and inferior nasal nerve. Two segments deserve special mention. The zone at the inferior, peripheral, nasal pole (Ep) was substantially more likely to be damaged than any other spot in the nerve. The segment just adjacent to it on the temporal side of the nerve periphery (Dp) was one of the four worst-preserved in three nerves, but one of the four best-preserved in three nerves. No other segment shared this dichotomy.
Finally, the survival of fibers of various sizes was studied in each of the 16 segments of the nerve cross-section. Again, a ratio for each fiber diameter was made by dividing the number of fibers in the glaucomatous nerve by the number of fibers of that size in
its normal, fellow nerve. Then, these ratios were standardized by dividing each ratio by the ratio of fibers of all sizes in the glaucomatous eye by its fellow eye. Again, this was done only to allow comparison of the relative survival of various-sized fibers in nerves with a variety of degrees of damage. In all ten nerves, the survival of fibers of each size was compared between the three best-preserved segments (Be, Cc, Dc) and the three worst-preserved segments (Ep, Fp, Hp). Larger fibers were more likely to be lost than smaller ones in both the best- and worst-preserved areas of the nerve (Fig. 7).
When the density of fibers (fibers per square millimeter) was compared to the number of fibers, glaucomatous nerves did not lose fibers randomly from all neural bundles equally (Table 1). At each level of atrophy, the absolute number of fibers lost was greater than the loss of fiber density. This indicates that some bundles were being damaged to a much greater extent than others. If the loss of fibers were perfectly random throughout the nerve, then the density and the absolute number would always decline in the same proportion. But, density remained closer to normal than absolute number, indicating a tendency for whole bundles to be lost with relative preservation of the remaining bundles intact. For example, in nerves with 90% fiber atrophy, density
Downloaded From: http://iovs.arvojournals.org/pdfaccess.ashx?url=/data/journals/iovs/933365/ on 04/01/2018

918 INVESTIGATIVE OPHTHALMOLOGY & VISUAL SCIENCE / June 1987 Vol. 28
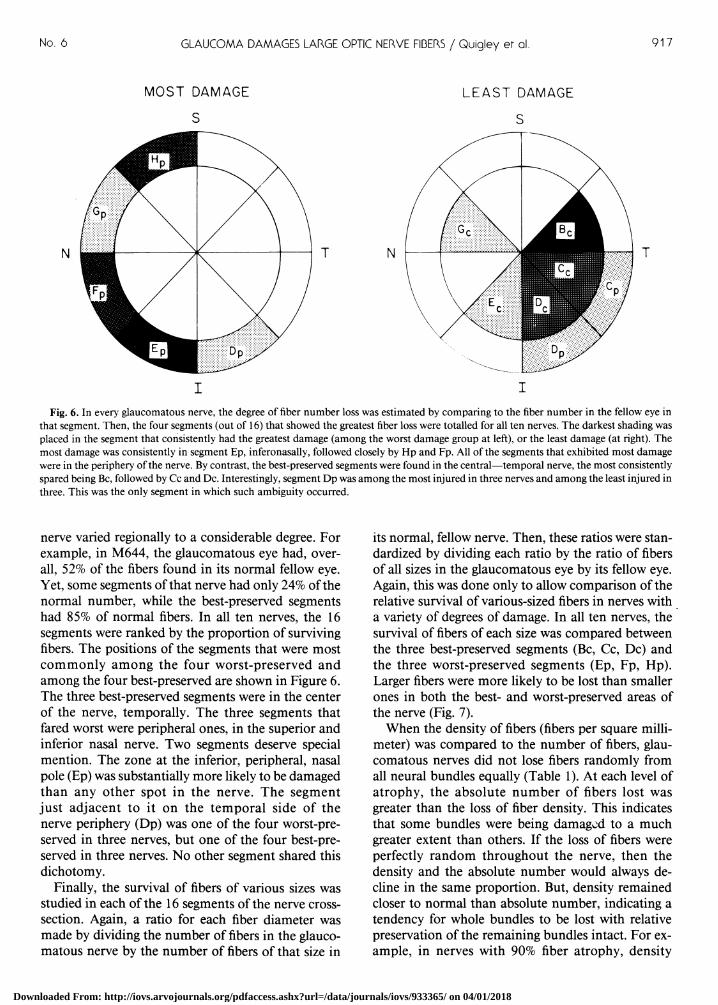
0.25 0.45 0.65 0.85 I.05 125 I.45 FIBER DIAMETER, MICRONS
Fig. 7. As in Figure 5, these data compare the glaucoma/normal ratio of fibers remaining to the fiber diameter. Again, the fiber ratio has been standardized by dividing it by the ratio for all surviving fibers in that nerve. The two curves are selected portions of all ten nerves, the three least damaged nerve segments (Be, Cc, and Dc) and the three most damaged segments (Ep, Fp, and Hp) (see Fig. 6). It is clear that fibers in the small diameter groups have ratios greater than 1, indicating that they are relatively more preserved than the average for all fibers, while the larger fibers survive less well (have ratios generally less than 1). However, it is noteworthy that there is no difference between the least damaged and the most damaged segments in this susceptibility of large fibers to injury (the best-fit regression line for each is nearly superimposable [not shown]). This means that large fibers have an inherently greater tendency to be lost in glaucoma regardless of their position in the nerve.
(fibers per square millimeter) in the remaining bundles was a remarkable 47% of normal.
Discussion
The mean fiber diameter of monkey optic nerves with chronic experimental glaucoma is lower than in normal fellow eyes. Glaucomatous damage might cause many axons to become smaller in diameter at initial injury, before they atrophy. Injured fibers in some peripheral nerves shrink in caliber.8 If all fibers became smaller prior to death, then nerves with minor damage would show decreases in mean fiber diameter. Three of our four glaucomatous nerves with the least fiber atrophy were not different from their normal fellow nerves in mean fiber diameter. A tendency to shrinkage prior to cell death would cause a shift toward the smaller diameter groups in the size distribution graphs; this did not occur. One must conclude, then, that any pre-mortem decreases in axon caliber were too small to be detected and were not responsible for the decline in mean fiber diameter in glaucomatous nerves.
Fibers in monkey optic nerves that are larger than the mean diameter are clearly more susceptible to loss due to chronic experimental glaucoma than the smaller axons. This selectivity appears to be due to two factors. First, as described in a previous report,7
larger fibers are found in greater proportion in the periphery of the nerve, and in the nasal compared to
the temporal nerve. These areas have a preferentially greater fiber atrophy in the glaucomatous monkey and human nerve1'9 (Fig. 6). The relative susceptibility to damage of the upper and lower poles of the nerve head may be caused by the comparatively weak supporting connective tissues of these zones.1011
However, if the regional nerve head anatomy were the only explanation for the selective loss of larger fibers, then larger fibers that reside in comparatively safe areas of the nerve head should survive as well as smaller axons in those areas. This is not the case. In both the most susceptible and the least susceptible nerve head zone, the relatively greater loss of larger fibers is seen. Hence, the inherently greater damage to large fibers derives from two factors: they tolerate the insult resulting from elevated IOP less well and they are proportionately more numerous in the most susceptible portions of the nerve head.
If the type of retinal ganglion cell that is most susceptible to glaucoma damage could be specified, better psychophysical testing could be planned. Axon diameter is only one characteristic of retinal ganglion cells. Axon size and ganglion cell body size are directly related. It is justified to conclude that many ganglion cells in the groups larger than the mean size are killed earlier by glaucomatous injury. This corroborates the data of a preliminary report in which there was selectively greater loss of input to the mag-nocellular layers of the dorsal lateral geniculate body by ganglion cells in experimentally glaucomatous monkeys.12 These large cell layers of the geniculate receive predominate input from large retinal ganglion cells.
The division of ganglion cells into sub-types is based on considerable information about cat ganglion cells, and much of this appears applicable to monkey eyes. Three major groupings, W-, X-, and Y-cells are generally acknowledged.13 The Y-cells are the largest in axon and cell body, and project predominately to the magnocellular geniculate layers. Our data suggest that this group is one of the most susceptible to injury in the experimental glaucoma model. Y-cells are a minority (10%) of ganglion cells in cat and monkey eyes; hence even loss of all typical Y-cells would not account for the shift in mean diameter and size distribution curves seen in the glaucomatous eyes. Our data do not yet allow determination of which fibers are the very first to atrophy. At the earliest point with detectable fiber loss, many fibers above the mean size have disappeared. As further damage occurs, the fibers that die are more often the larger rather than the smaller remaining ones. In order to determine what cell types this involves, further study of ganglion cell morphology and central nervous system connections is underway in monkey and human glaucoma eyes.
Downloaded From: http://iovs.arvojournals.org/pdfaccess.ashx?url=/data/journals/iovs/933365/ on 04/01/2018
No. 6 GLAUCOMA DAMAGES LARGE OPTIC NERVE FIBERS / Quigley er ol. 919
There are few other studies of chronic injury to the optic nerve that examine the differential effect on cells of various sizes. Eskin and co-workers14 found that chronic intoxication of monkeys with acryl-amide caused a different pattern of ganglion cell loss from that in our glaucomatous eyes. The relatively greater damage was to cells in the central retina projecting into the temporocentral optic nerve. Degeneration in the lateral geniculate body was in the parvocellular layers, with sparing of the magnocellu-lar layers. This pattern is compatible with greatest injury to cells with characteristics of X-cells (beta cells). Blunt injury to the cat spinal cord leads to selectively greater loss of large myelinated fibers.15 As with glaucoma, peripherally located fibers are more susceptible to degeneration and large fibers are lost in greater proportion no matter where they reside in the cord cross-section. Unfortunately, it is not clear whether the mechanical effect of the blunt injury or subsequent tissue changes that might include vascular compromise are the active agents in this injury.
A number of studies have examined differential effects of acute injury on various ganglion cell types. Grehn and Prost16 stimulated the optic tract electrically in cats and recorded the arriving impulses in the retina. With IOP equal to mean arterial blood pressure, all impulse conduction ceased within 2 min. Slower conducting fibers (smaller fibers) ceased function a few seconds before larger fibers, but statistical significance was not shown. The inflation of a cuff around the cat optic nerve leads to the opposite effect, a greater electrical blockade in fast-conducting (large diameter) fibers compared to slower (smaller) ones.17
Again, the effect was generated by a high pressure applied for a short time, and whether the injurious element was mechanical force or lack of blood flow to the compressed segment is not known. Alder and Constable18 caused acute hypoxia in cats and studied the maintained firing rate of cells of various types. With severe hypoxia, firing rate declined equally in X- and Y-cells. Hollander and co-workers19 transected the optic nerve of cats intracranially and found that medium-sized retinal ganglion cells died before either small or large ones did. Our monkeys were studied at much longer times after initiation of injury than were the cats in this study; hence, the speed of degeneration probably plays little role in the differential effect we detected.
There have been some suggestions of selective loss of certain ganglion cell types in psychophysical and electrophysiological data. Atkin and co-workers20
found a greater decline in contrast sensitivity in glaucomatous eyes at high temporal frequencies, compatible with greater loss of Y-cells. Maffei and Fioren-tini21 observed that pattern-evoked electroretino-graphic responses (PERG) disappeared after death of
ganglion cells from optic nerve transection. Trick22
reported that the PERG response of glaucomatous eyes was more attenuated for high temporal frequencies of stimulation. This supports the idea that a prominent part of glaucoma damage involves loss of Y-cell function.
Since glaucomatous field loss was often characterized as local scotomas or as arcuate zones of decreased sensitivity, the term "nerve fiber bundle defect" came to be used to describe the presumed pattern. The experimental monkey data reported here, along with the human data previously published,1'9
suggest that the loss of fibers in glaucoma is, to some degree, bundle by bundle, and at the same time there is loss throughout the nerve from most bundles. The number of fibers per square millimeter (density) usually was closer to the normal figure than the absolute number of remaining axons. This indicates that there were some bundles that disappeared entirely, while many others had the normal complement of fibers. The density figure took longer to become abnormal, but it did decline. Therefore, it is incorrect to consider glaucomatous neuropathy as either bundle by bundle or diffuse.
The analysis of these optic nerves was performed on specimens removed at 2 mm posterior to the globe. Might a distorted view of the pattern of damage be produced by sampling the process at this point? This area is only 1-2 mm posterior to the site of glaucoma damage, the scleral lamina cribrosa.23
Fibers are travelling in an anteroposterior direction at this point, and, within narrow limits, remain confined to the same zones without oblique paths. The sampled area, then, should be a rather accurate map of the pattern of damage at its source. We have only an approximate picture of the projection of this pattern back into the retina. One might hypothesize the locations expected to be most involved by combining the present data with the topographical anatomy of the nerve.24 Early analysis of the retinas in these eyes confirms this correspondence, but further quantitative study is underway.
Key words: glaucoma, pathology, retina, ganglion cells, optic nerve, monkey
Acknowledgment
The authors thank Cheryl Enger, MS, of the Biostatistical Center, Wilmer Institute for statistical analysis.
References
1. Quigley HA, Addicks EM, and Green WR: Optic nerve damage in human glaucoma. III. Quantitative correlation of nerve fiber loss and visual field defect in glaucoma, ischemic neuropathy, disc edema, and toxic neuropathy. Arch Ophthalmol 100:135, 1982.
Downloaded From: http://iovs.arvojournals.org/pdfaccess.ashx?url=/data/journals/iovs/933365/ on 04/01/2018

920 INVESTIGATIVE OPHTHALMOLOGY G VISUAL SCIENCE / June 1987 Vol. 28
2. Katz J and Sommer A: The similarities between the visual fields of ocular hypertensive and normal eyes. Arch Ophthalmol 104:1648, 1986.
3. Quigley HA and Hohman RM: Laser energy levels for trabecular meshwork damage in the primate eye. Invest Ophthalmol VisSci 104:1648, 1986.
4. Gaasterland D, Tanishima T, and Kuwabura T: Axoplasmic flow during chronic experimental glaucoma. I. Light and electron microscopic studies of the monkey optic nervehead during development of glaucomatous cupping. Invest Ophthalmol VisSci 17:838, 1978.
5. Radius RL and Pederson JE: Laser-induced primate glaucoma. II. Histopathology. Arch Ophthalmol 102:1693, 1984.
6. Quigley HA, Hohman RM, Addicks EM, and Green WR: Blood vessels of the optic disk in chronic glaucoma. Invest Ophthalmol Vis Sci 25:918, 1984.
7. Sanchez RM, Dunkelberger GR, and Quigley HA: The number and diameter distribution of axons in the monkey optic nerve. Invest Ophthalmol Vis Sci 27:1342, 1986.
8. Hoffman PN, Griffin JW, and Price DL: Control of axonal caliber by neurofilament transport. J Cell Biol 99:705, 1984.
9. Quigley HA, Hohman RM, Addicks EM, Massof RS, and Green WR: Morphologic changes in the lamina cribrosa correlated with neural loss in open-angle glaucoma. Am J Ophthalmol 95:673, 1983.
10. Quigley HA and Addicks EM: Regional differences in the structure of the lamina cribrosa and their relation to glaucomatous optic nerve damage. Arch Ophthalmol 99:137, 1981.
11. Radius RL and Gonzales M: Anatomy at the lamina cribrosa in human eyes. Arch Ophthalmol 99:2159, 1981.
12. Quigley HA and Hendrickson A: Chronic experimental glaucoma in primates: Blood flow study with iodoantipyrine and pattern of selective ganglion cell loss. ARVO Abstracts. Invest Ophthalmol Vis Sci 25(Suppl):225, 1984.
13. Enroth-Cugell C and Robson J: Functional characteristics and diversity of cat retinal ganglion cells: Basic characteristics and
quantitative description. Invest Ophthalmol Vis Sci 25:250, 1984.
14. Eskin TA, Lapham LW, Maurissen JPJ, and Merigan WH: Arcylamide effects on the macaque visual system. II. Retino-geniculate morphology. Invest Ophthalmol Vis Sci 26:317, 1985.
15. Blight AR: Cellular morphology of chronic spinal cord injury in the cat: analysis of myelinated axons by line-sampling. Neuroscience 10:521, 1983.
16. Grehn F and Prost M: Function of retinal nerve fibers depends on perfusion pressure: Neurophysiology investigations during acute intraocular pressure elevation. Invest Ophthalmol Vis Sci 24:347, 1983.
17. Burke W, Burne JA, and Martin PR: Selective block of Y optic nerve fibres in the cat and the occurrence of inhibition in the lateral geniculate nucleus. J Physiol 364:81, 1985.
18. Alder VA and Constable IJ: Effect of hypoxia on the maintained firing rate of retinal ganglion cells. Invest Ophthalmol Vis Sci 21:450, 1981.
19. Hollander H, Bisti S, Maffei L, and Hebel R: Electroretino-graphic responses and retrograde changes in retinal morphology after intracranial optic nerve section: A quantitative analysis in the cat. Exp Brain Res 55:483, 1984.
20. Atkin A, Bodis-Wollner I, Wolkstein, M, Moss A, and Podos SM: Abnormalities of central contrast sensitivity in glaucoma. Am J Ophthalmol 88:205, 1979.
21. Maffei L and Fiorentini A: Electroretinographic responses to alternating gratings before and after section of the optic nerve. Science 211:953, 1981.
22. Trick GL: Retinal potentials in patients with primary open-angle glaucoma: physiological evidence for temporal frequency tuning defects. Invest Ophthalmol Vis Sci 26:1750, 1985.
23. Quigley HA, Addicks EM, Green WR, and Maumenee AE: Optic nerve damage in human glaucoma. II. The site of injury and susceptibility to damage. Arch Ophthalmol 99:635, 1981.
24. Hoyt WF and Luis O: Visual fiber anatomy in the infragenic-ulate pathway of the primate. Arch Ophthalmol 68:94, 1962.
Erratum
C. David B. Bridges, Richard A. Alvarez, Shao-Ling Fong, Gregory I. Liou, and Robert J. Ulshafer: Rhodopsin, Vitamin A, and Interstitial Retinol-Binding Protein in the rd Chicken. Invest Ophthalmol Vis Sci 28:613, 1987.
The version of Figure 5 that appeared in the above paper had been altered by the publishers. The correct Figure 5 is shown below.
Downloaded From: http://iovs.arvojournals.org/pdfaccess.ashx?url=/data/journals/iovs/933365/ on 04/01/2018