Embed Size (px)
Citation preview
Low-dose cyclophosphamide selectively expands resident anti-tumor T-
cells allowing in situ control of colorectal cancer
Martin Scurr1, Tom Pembroke1, Anja Bloom1, David Roberts1, Amanda Thomson1, Kathryn
Smart1, Hayley Bridgeman1, Richard Adams2, Alison Brewster2, Robert Jones2, Sarah
Gwynne3, Daniel Blount4, Richard Harrop4, Robert Hills5, Awen Gallimore1 and Andrew
Godkin1, 6 *.
1 Division of Infection & Immunity, Henry Wellcome Building, Cardiff University, Cardiff, UK. 2 Velindre NHS Trust, Whitchurch, Cardiff, UK. 3 South West Wales Cancer Centre, Swansea, UK. 4 Oxford BioMedica plc., Oxford, UK 5 Cancer Trials Unit (Translational Statistics), Cardiff University, Cardiff, UK. 6 Dept. of Gastroenterology & Hepatology, University Hospital of Wales, Heath Park, Cardiff, UK.
* Corresponding Author: Division of Infection and Immunity, Henry Wellcome Building, Health Park, Cardiff. CF14 4XN. Tel: +442920687129 Email: [email protected]
Keywords: Cyclophosphamide, colorectal cancer, regulatory T-cells.
Running Head: Immunotherapeutic benefit of cyclophosphamide for bowel cancer
Word Count: 4786
Conflict of Interest Statement: The authors have declared that no conflict of interest exists. This work was funded by Cancer Research Wales, the CRUK supported ECMC (Experimental Cancer Medicine Centre), and the Institute for Cancer Vaccines & Immunotherapy.
Abbreviations Used: b.d., bis die (twice-a-day); CPM, cyclophosphamide; ELISpot, enzyme-linked immunospot; FACS, fluorescence-activated cell sorting; Fluorospot, fluorescent
immunospot; Foxp3, Forkhead box p3; IFN-, Interferon-; mCRC, metastatic colorectal cancer; MDSC, myeloid-derived suppressor cell; PBMC, peripheral blood mononuclear cell; PPD, purified protein derivative; SEM, standard error of the mean; SFC, spot-forming cell; TAA, tumor-associated antigen; Treg, regulatory T-cell; TD, treatment day.
2
Translational Relevance
Foxp3+ regulatory T-cells (Treg) are enriched within colorectal cancer (CRC). Whilst some
studies have identified a survival advantage in patients with increased Treg numbers within
tumors, depletion of these cells both in vitro and in animal models results in enhanced anti-
tumor T-cell responses and better tumor control. Oral low-dose CPM has previously been
noted to effectively deplete Treg, but its effects have not been evaluated in the setting of a
controlled, randomized trial. Here, we present a comprehensive profile of peripheral
lymphocyte populations in metastatic CRC patients enrolled onto a randomized phase I/II trial
of low-dose CPM. We demonstrate that CPM depletes Treg, B- and NK-cell populations, with
coincidental increases in polyfuntional tumor-specific T cells. Patients identified as having an
increased anti-tumor immune response exhibited significantly longer progression-free
survival. Hence CPM has a clear impact on CRC patients, warranting further investigation in
patients with earlier stage disease to prevent relapse following primary resection.
3
ABSTRACT
Purpose: Anti-cancer T-cell responses can control tumors, but immune-suppressive
mechanisms in vivo prevent their function. The role of Foxp3+ regulatory T-cells (Treg) in
metastatic colorectal cancer (mCRC) is unclear. We have previously shown depletion of Treg
enhances CRC-specific effector T-cell responses. Low dose cyclophosphamide (CPM)
targets Treg in animal models and some human studies, however the effect of CPM in mCRC
was unknown.
Experimental Design: Fifty-five mCRC patients were enrolled onto a phase I/II trial and
randomized to receive two week-long courses of low-dose (50mg b.d.) CPM or not. The
absolute number, phenotype and anti-tumor function of peripheral blood-derived lymphocyte
subsets were monitored throughout the course of treatment, along with 18-month follow-up.
Results: Initially CPM reduced proliferation in all lymphocyte subsets, however, a rapid
mobilization of effector T-cells overcame this decrease, leading to increased absolute T-cell
numbers. In contrast, a reduction in proportional and absolute Treg, B-cell and NK-cell
numbers occurred. The expansion and subsequent activation of effector T-cells was focused
on tumor-specific T-cells, producing both granzyme-B and IFN-. CPM-treated patients
demonstrating the most enhanced IFN-+ tumor-specific T-cell responses exhibited a
significant delay in tumor progression (HR=0.29, 95% CI 0.12-0.69, P=0.0047), compared to
non-responders and no-treatment controls.
Conclusions: CPM-induced Treg-depletion is mirrored by a striking boost to anti-tumor
immunity. This study provides the first direct evidence of the benefit of naturally primed T-
cells in mCRC patients. Our results also support the concept that non-mutated self-antigens
can act as useful targets for immunotherapies.
INTRODUCTION
4
Despite recent advances, metastatic colorectal cancer (mCRC) remains the second leading
cause of death from cancer in the United Kingdom (1) (1). The current care of patients
revolves around excision of the tumor, histopathological tumor staging, and adjuvant 5-
fluorouracil (or capecitabine) based treatment, or as palliative chemotherapy for patients with
advanced metastatic disease. Chemotherapy has a significant morbidity (and even mortality)
associated with its use, and ~40% of patients with “curative” treatment relapse and succumb
to the cancer. Hence the drive to develop less toxic and more targeted therapies.
Correctly harnessing a patient’s immune system to target and kill cancerous cells has
enormous potential but has thus far proven challenging, with immune-based therapies for
CRC in particular lacking in efficacy (2). One potential obstacle to achieving objective anti-
tumor responses is the suppression of tumor-specific T-cells by Foxp3+ regulatory T-cells
(Treg) (3,4). Cancer-bearing individuals have increased frequencies of Treg, both in
peripheral blood, and enriched within the tumor microenvironment (5). We have previously
shown that CRC can drive this expansion of Treg that control anti-tumor immune responses
(6-10). Specifically, when peripheral blood-derived Foxp3+ Treg from CRC patients are
depleted in vitro, a resulting enhancement of tumor-antigen (5T4, CEA)-specific IFN-+
responses is found (11,12).
The utilization of metronomic low-dose cyclophosphamide (CPM) was initially
proposed as a salvage therapy in end-stage cancer patients, aimed at inhibiting tumor
angiogenesis (13-15), although the immunomodulatory effects of CPM had been noted
decades earlier in animal models (16,17). Currently, there is a revived interest in using CPM
for the purpose of depleting Treg in humans ((8,18) and reviewed in (19)). Foxp3+ Treg are
thought to be more susceptible to the toxic effects of CPM due to their low levels of
intracellular ATP and glutathione, relative to other T-cells (20); glutathione is required to
counteract the toxic effects of CPM on cellular DNA, thus giving effector Foxp3- T-cell
5
populations a survival advantage. Profound effects on other immune cell types, including NK
cells (21), dendritic cells (22) and MDSCs (23) have also been noted. However, at least one
group did not observe Treg depletion using a low-dose metronomic dosing regimen (24), and
a lack of consensus exists due to the concurrent use of other immune-potentiating therapies;
the heterogeneous methods used to identify Treg; the study days on which immunological
responses were monitored; and the cohorts of cancer patients studied. In addition, many
groups administer low doses of CPM intravenously, and differential pharmacodynamic effects
with regards to Treg depletion (possibly due to the amount and bioavailability of CPM
administered) are apparent, when compared to oral dosing (21,25).
Here, we sought to determine the effect of oral metronomic low-dose CPM on
lymphocyte subsets in patients with metastatic colorectal malignancy, as part of a
randomized phase I/II clinical trial. A key objective was to identify whether CPM treatment
induced oncofetal antigen (5T4)-specific lymphocyte responses; the secondary objectives
included measurements of the effects of CPM on T-cell subsets (i.e. number, phenotype and
function) and tumor progression.
6
PATIENTS AND METHODS
Patients
55 subjects with inoperable mCRC were enrolled on to the phase I/II clinical trial, TaCTiCC
(TroVax® and Cyclophosphamide Treatment in Colorectal Cancer; EudraCT: 2010-024380-
41) (38). Patients had to show evidence of responding or stable disease within 4-weeks of
trial entry, as demonstrated by CT scan in comparison to pre-treatment CT scan using
RECIST criteria to measure quantitative tumor burden. Additional inclusion criteria included
age ≥18 years, WHO performance status 0-2, lymphocyte count ≥500/l, neutrophil count
>1200/l and platelet count >100,000/l. Key exclusion criteria included life expectancy <3
months or patient relapse / evidence of active malignancy, bilirubin level >50mol/L,
completion of first-line chemotherapy less than 2 weeks from start of treatment, clinically
apparent / active autoimmune disease or those receiving immunosuppressants. All patients
gave informed consent personally.
Study Design & Treatment
This trial was a randomized, open-label study carried out from September 2012 to May 2016.
Randomization was undertaken at the Clinical Trials Office, University Hospital of Wales,
using an un-stratified balanced block design, with the outcome communicated to the
attending physician immediately upon randomization. Patient characteristics are shown in
Table 1. Upon enrolment, 27 patients were randomized to a cyclophosphamide group, and
28 were randomized to a no treatment control group. One patient from the watch and wait
group withdrew consent before receiving allocated intervention, and two patients were later
found to have had a curative procedure pre-enrolment, thus 25 patients were analyzed from
this group and reported in this manuscript, as shown in the CONSORT flow diagram
(Supplementary Figure 6).
7
Orally administered 50mg CPM was taken twice a day on treatment days 1-7 and 15-
21; no CPM was taken on treatment days 8-14 or 22-106, or until patient relapsed. Peripheral
blood samples (10-40mls) were taken at regular intervals during therapy, as shown in the
schematic (Figure 1A). Bloods were consequently taken at treatment days 29, 43, 64, 78 and
106. All patients were clinically examined throughout the trial, with progression-free survival
monitored.
Lymphocyte Purification and Culture
Peripheral blood samples were collected in 10ml lithium heparin tubes (BD Biosciences).
Peripheral blood mononuclear cells (PBMCs) were isolated by centrifugation of heparinized
blood over Lymphoprep (Axis-Shield). Cells were then washed and re-suspended in
advanced RPMI (Life Technologies) supplemented with 5% batch-tested, pooled human AB
serum (Welsh Blood Service), L-glutamine and penicillin / streptomycin. PBMC were plated in
96-well plates (Nunc) and cultured in triplicate wells with specific antigens for 14 days,
supplemented with 10l CellKine media (Helvetica Healthcare) on day 3 and fresh media
containing 20 IU/ml IL-2 on days 7 and 10.
Antigens
Forty-one 20mer peptides overlapping by 10 amino acids covering the entire human 5T4
protein were synthesized by Fmoc chemistry to >95% purity (GL Biochem, Shanghai, China).
The peptides were divided into 13 pools (Supplementary Figure 4). Whole 5T4 protein was
produced as previously described (39). The recall antigen PPD (Purified Protein Derivative)
(Statens Serum Institut, Denmark) and the T-cell mitogen PHA (Sigma) were used as positive
controls. All antigens were used at a final concentration of 5 g/ml.
ELISpot Assays
8
Polymer-backed 96-well filtration plates (MAIPS4510; Merck Millipore) were used for all
ELISpot assays. Antibodies and alkaline phosphatase substrate kits were obtained from
Mabtech. The concentrations of antibodies used and washing steps were according to the
manufacturer’s instructions; all antibody incubations were with 50l / well. Cells were pooled
from triplicate wells in identical culture conditions, washed, re-suspended and counted before
being plated with or without the corresponding 5T4 peptide pool for direct comparison. The
plate was incubated at 37oC, 5% CO2 for 24 hours. Cytokine-producing T-cells were
enumerated at the single-cell level by counting the number of spots per well using an
automated ELISpot plate reader (ImmunoSpot® S6 Ultra; CTL Europe GmbH). Positive
responses were identified as having at least 20 spot-forming cells (SFC) per 105 cultured
cells, and at least double the number of spots above background.
FluoroSpot Assays
PVDF 96-well filtration plates designed for low-autofluorescence (IPFL; Millipore) were used
for all fluorospot assays. Antibodies to IFN- and granzyme B, and fluorescence enhancer
kits were obtained from CTL Europe. All antibody incubations were with 100l / well. Frozen
PBMC were thawed and rested overnight in RPMI + 5% AB serum. Cells were then washed,
plated, and stimulated with 5 g/ml antigen in duplicate wells. Plates were incubated at 37C,
5% CO2 for 24 hours. Cytokine-producing T-cells were enumerated using Smart CountTM
settings on an automated fluorospot plate reader (ImmunoSpot® S6 Ultra; CTL Europe
GmbH), allowing for an assessment of single and dual-cytokine producing cells. Positive
responses were identified as having at least 5 SFC/2x105 PBMC, and at least double that of
the negative (no antigen) control.
Flow Cytometry
9
A no-wash, single platform approach was utilized to perform T-cell and NK-cell counts. 3l of
CD3-APC (Miltenyi-Biotec), CD4-PE (BioLegend), CD8-PerCPCy5.5 (BioLegend), CD19-
FITC (BioLegend) and CD56-Brilliant Violet-421 (BD) antibodies were added to a FACS tube,
followed by 50l of whole heparinized blood using a reverse pipetting technique. Samples
were left at 4C for 30 minutes, before addition of 450l red blood cell lysis buffer
(BioLegend). After 10 minutes, 50l of CountBrightTM Absolute Counting Beads (Life
Technologies) were reverse pipetted into the lysed blood sample before acquisition on a
FACSCanto II (BD). Forward scatter and side scatter threshold parameters were set on the
instrument to exclude debris and a minimum of 5000 beads were collected. FACS samples
were analyzed on FlowJo version 10 (TreeStar), and cell counts calculated based on number
of gated events (i.e. cells) divided by number of gated beads in sample, multiplied by number
of beads/l in CountBrightTM vial.
To analyze phenotypic markers expressed on freshly isolated peripheral blood
mononuclear cell-subsets, two panels were devised; a regulatory T-cell panel consisted of
CD4-APCh7 (BD), CD25-Brilliant Violet-421 (BioLegend), Foxp3-APC (eBioscience), Helios-
FITC (BioLegend), Ki67-PE (BioLegend), HLA-DR-PECy7 (BioLegend) and ICOS-
PerCPCy5.5 (BioLegend) antibodies. The second panel, to study cytotoxic lymphocytes,
consisted of CD3-APCh7 (BD), CD56-Brilliant Violet-421 (BD), CD8-PerCPCy5.5
(BioLegend), Perforin-FITC (BioLegend), Granzyme B-Alexa Fluor 647 (BioLegend), HLA-
DR-PECy7 (BioLegend) and Ki67-PE (BioLegend) antibodies. Live/Dead-Aqua (Life
Technologies) was used in both panels to exclude dead cells. Surface staining was
performed in phosphate buffered saline (PBS), 2.5% fetal calf serum (FCS) and 5mM EDTA;
intracellular staining was performed in permeabilization buffer plus 2% normal rat serum.
Samples were acquired on a FACSCanto II (BD) and data analyzed using FlowJo version 10
(TreeStar).
10
Statistics
Follow-up is complete to Dec 13, 2016, by which point all patients had progressed or were
receiving other treatments. All analyses were performed on an intention-to-treat basis with
patients ineligible for the trial excluded. Datasets were tested for normality, and appropriate
tests were used to compare patient immune responses at specified time-points during the
trial (non-parametric: Wilcoxon signed rank test, parametric: paired T-test). Error bars
represent mean ± standard error of the mean. PFS was analyzed using log-rank tests and
displayed using Kaplan–Meier plots. A P-value less than 0.05 was considered statistically
significant and all tests of significance were 2-sided. Analyses were performed using SAS
v9.4 and GraphPad Prism v7.
Study Approval
Results reported in this manuscript are derived from a clinical trial approved by the Cardiff
and Vale Ethics committee and the Gene Therapy Advisory Committee (GTAC 175). All
patients gave full written, informed consent personally prior to inclusion on the trial.
Trial Registration
ISRCTN registry number: ISRCTN54669986. UK Clinical Research Network Study number:
13014. European Union Drug Regulating Authorities Clinical Trial Number: 2010-024380-41.
11
RESULTS
Patient Baseline Characteristics
One patient from the no treatment group withdrew consent before receiving the
allocated intervention, and two further patients from this group were later found to have
undergone a curative procedure pre-enrolment. These three patients were not included in the
analyses of immune responses and progression-free survival (PFS), however an additional
patient was recruited to this group and was included in the analyses, hence 52 patients could
be evaluated. All mCRC patients presented with stable metastatic disease in at least one
location, primarily liver, lung and peritoneal metastases; further baseline characteristics of the
patients randomized to each group are shown (Table 1).
Effects of CPM on T-cell and NK cell activation and frequency
Over the 22-day course of low-dose cyclophosphamide treatment, 40ml blood
samples were collected at days 1, 8, 15 and 22 for analysis of 5T4-specific T-cell and
antibody responses, and 10ml blood samples collected at days 1, 4, 8, 15, 18 and 22 to
analyze phenotype and function of lymphocytes. 40ml blood samples were taken from control
patients at treatment days 1 and 22, as shown in the treatment overview (Figure 1A).
The regulatory T-cell proportion was identified by FACS, first gating on live
lymphocytes, then drawing a quadrant to distinguish CD4+Foxp3+ from CD4+Foxp3- T-cells, a
representative example of which is shown (Figure 1B). There was a significant decrease in
the proportion of CD4+ T-cells expressing Foxp3 at treatment day 4 in comparison to baseline
(TD1 mean 11.54 ±1.25% vs. TD4 10.24 ±1.03%, P=0.0002), however this quickly recovered
to baseline levels by treatment day 8 (Figures 1B-C). A smaller proportional reduction was
also noted at treatment day 18, although this did not reach significance. Whilst the reduction
on Treg proportion was transient, a more sustained decrease in absolute Treg number was
12
observed. Peripheral Treg numbers significantly decreased by treatment days 15 (TD1 mean
60.54 ±5.58 cells / μL vs. TD15 52.15 ±5.21, P=0.018) and 18 (TD1 mean 60.54 ±5.58 cells /
μL vs. TD18 49.77±5.78, P=0.0089) before starting to recover towards pre-treatment numbers
at day 22 (Figure 1D).
The proportion of Foxp3+CD4+ Treg expressing Helios, a putative marker of thymically-
derived Treg (26), was measured. A representative example of the gating, and reduced
Helios proportion at TD4, is shown (Supplementary Figure 1A). The proportion of Helios+
Treg dipped between TD1-4 (TD1 mean 75.1±1.40% vs. TD4 73.71±1.35, P=0.30) and then
dipped more significantly at TD15-18 (TD15 77.68±1.41% vs. TD18 74.30±1.45, P=0.0001;
Figure 1E). Each of these dips in Helios+ T-cells were followed temporally 4 days later by a
similar significant dipping in the proportions of proliferating Treg, as demonstrated by Ki67
staining (TD1 17.27±1.46% vs. TD8 14.49±1.26%, P=0.0048; TD15 18.64±1.37% vs. TD22
15.96±1.17%, P=0.043) (Figure 1F). These results corroborate a previous report implicating
Helios as a marker of activated, proliferating Treg (27). Indeed, it seems clear that CPM is
targeting these activated Treg, as both the proportional reduction and depletion of Treg
correlates with the pre-treatment proportions of Helios+ (data not shown) or Ki67+ Treg
(Figures 1G and 1H). These data demonstrate an enhanced susceptibility of actively
proliferating Treg cells to the cytotoxic effects of CPM.
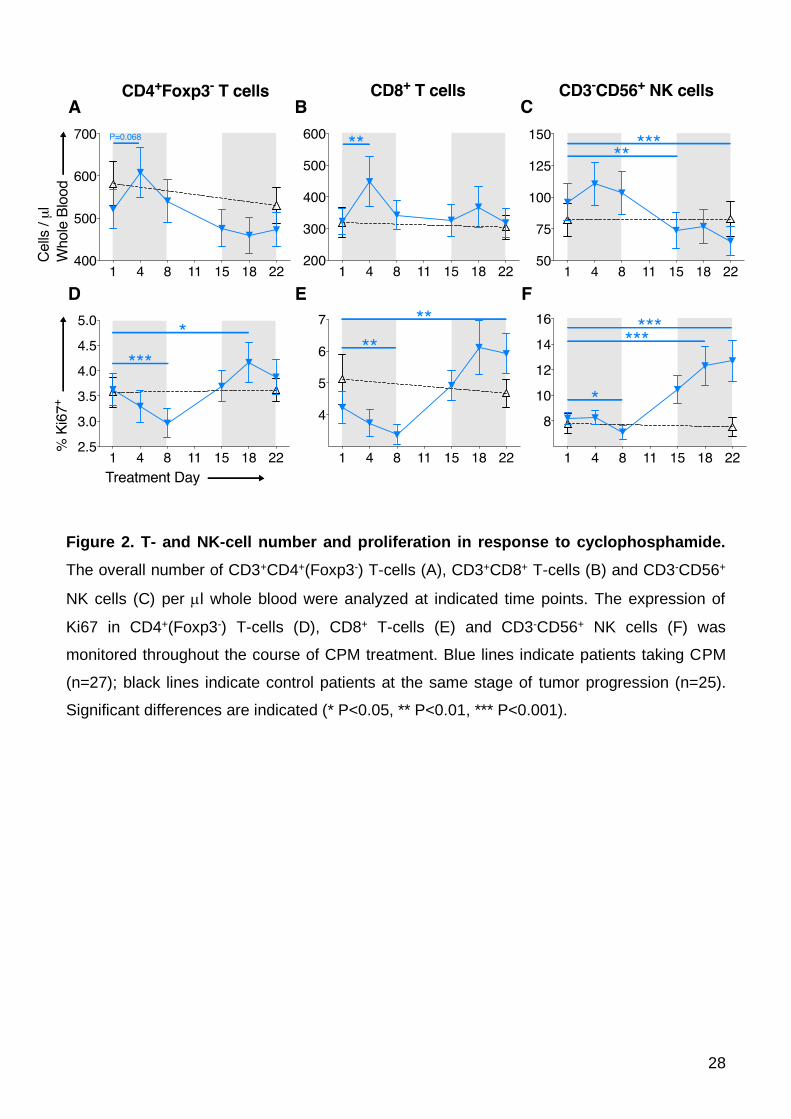
The relationship between the proportion (percentage) of Ki67+ cells in blood and
absolute cell numbers is more complex for CD3+CD4+(Foxp3-) T-cells, CD3+CD8+ T-cells,
NK-cells and B-cells. During the first cycle of CPM in week one, all populations except B-cells
show an increase in blood cell numbers (Figure 2A-C and Supplementary Figure 2), this rise
being most marked for CD3+CD8+ T-cells (TD1 mean 331.6±41.5 cells/μL vs. TD4
457.5±81.39, P=0.0039; Figure 2B); this corresponded with a fall in Ki67 expression in all
lymphocyte populations (Figure 2D-F). This inverse relationship is different to that observed
13
within the Treg population and indicates mobilization into blood from a reservoir occurs early
for this rapid increase in cell numbers. These numbers quickly returned to baseline, and this
inverse effect was not repeated in the second cycle of CPM as the %Ki67 expression now
increased for all three cell populations (in contrast to Treg where %Ki67 expression falls
during second CPM cycle), although with little effect on overall cell numbers. Given that Treg
numbers remained stable but CD4+Foxp3- T-cell numbers increase at TD4, this contributes to
the proportional reduction in Treg as described above.
Whilst effector T-cell numbers remained relatively stable from treatment day 8
onwards, the numbers of peripheral CD3-CD56+ NK-cells steadily decreased after the first
week (TD1 mean 97.0±15.1 cells/μL vs. TD15 73.5±14.8, P=0.0036, vs. TD18 77.4±14.3,
P=0.03, vs. TD22 63.9±11.9, P=0.0003; Figure 2C). Overall, these data mirror the time-points
at which significant depletion of Treg numbers was also observed; hence, CPM does not
appear to only selectively deplete Treg. A similar profile was noted amongst B cells, with
significant depletions by TD18 (TD1 mean 134.5±37.8 cells/μL vs. TD18 82.1±23.1, P=0.036;
Supplementary Figure 2).
As mentioned above, the proportion of potentially proliferative Ki67+ T- and NK-cells all
significantly decreased during the first CPM treatment week, but then reversed and
dramatically increased from day 8 and continued to increase into the second cycle of CPM
(TD15-22) (Figures 2D-F), with significant increases in %Ki67 seen in CD4+Foxp3- T-cells
(TD1 mean 3.68 ±0.34% vs. TD18 4.28% ±0.43, P=0.045; Figure 2D); CD8+ T-cells (TD1
mean 4.22 ±0.51% vs. TD22 5.92 ±0.63, P=0.0012; Figure 2E) and NK cells (TD1 mean 8.22
±0.48% vs. TD22 12.70 ±1.58, P=0.001; Figure 2F). This effect was observed in 23/27
patients and is mirrored by the absolute reduction in Treg numbers at TD15-22 (Figure 1D),
raising the possibility that Treg are controlling homeostatic proliferation / activation of these
other cell populations. The striking increases in %Ki67 corresponded to T-cell activation
14
demonstrated by increased expression of HLA-DR, ICOS and CD25 (Supplementary Figure
3).
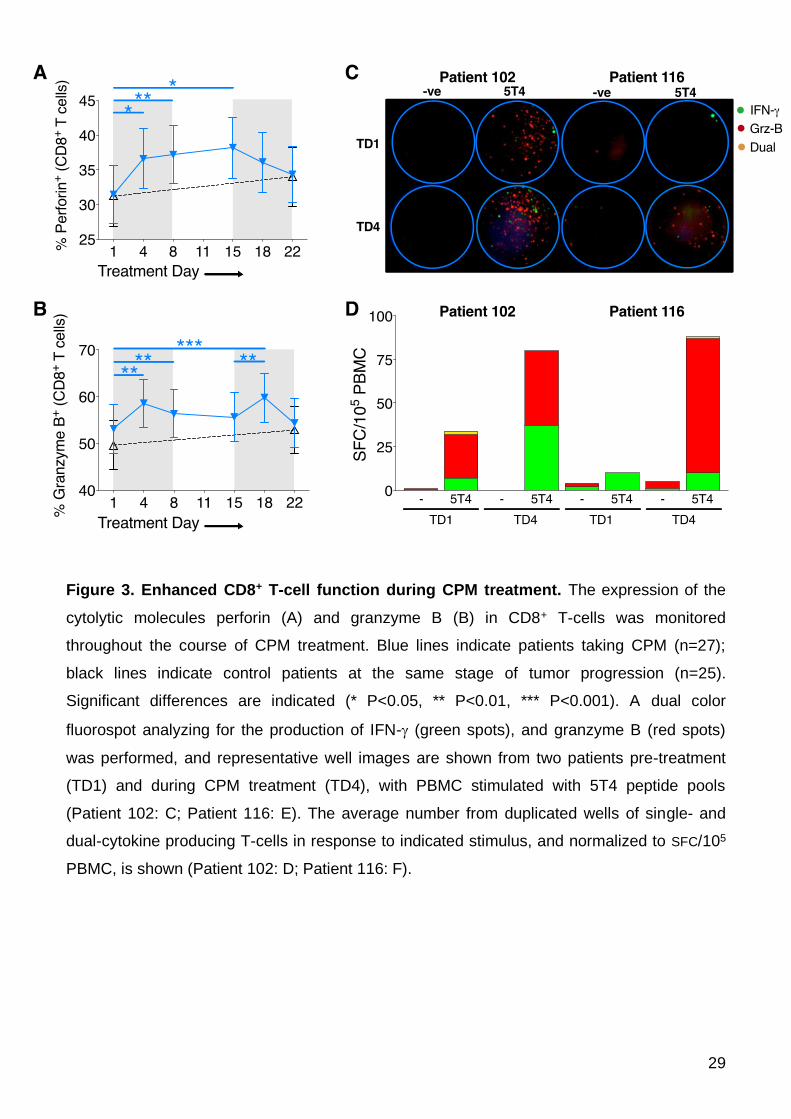
Increased lymphocyte cytotoxicity with CPM treatment
CPM treatment leads to a marked expansion of CD8+ T-cells. To explore the impact of
this treatment on the function of these cytotoxic T-cells, we measured the cytolytic potential
of peripheral CD8+ T-cells by intracellular perforin and granzyme-B, both of which play a
major role in cell-mediated cytotoxicity of cancer cells (28). Corresponding with increased
number, proliferation and activation of CD8+ T-cells, the intracellular expression of both
molecules significantly increased during CPM treatment, an effect noted for the majority
(24/27) of patients taking CPM (perforin TD1 mean 32.31 ±4.44% vs. TD8 38.54 ±4.40%,
P=0.0071; Figure 3A, and granzyme-B TD1 mean 53.37±5.38% vs. TD8 56.83±5.32% ,
P=0.0084, vs. TD18 60.63±5.35%, P=0.0009; Figure 3B); representative examples of FACS
staining are shown (Supplementary Figures 1B and 1C). A similar increase in cytotoxicity
potential (i.e. expression of granzyme-B / perforin) was found in NK-cells, an effect of CPM
not previously described (data not shown).
To assess whether the increased intracellular expression translated to an increase in
functional cytotoxicity i.e. actual release of granzme-B, PBMC from patients, identified as
having an increased expression of granzyme-B at TD4, were stimulated ex vivo with a
peptide library covering the tumor antigen 5T4, in a fluorospot assay. This dual color
(analyte) assay determined the production of the TH1 cytokines IFN- (represented as green
spots) alongside granzyme B (represented as red spots), allowing for cells with multi-
functionality to be enumerated. Representative fluorospot well images for two patients are
shown (Figure 3C). The number of T-cells producing granzyme-B per 105 PBMC, either alone
or in combination with IFN-, increased markedly in both patients whilst taking CPM (Figure
15
3D). These data reveal effector anti-tumor TH1 function and cytolytic capability increases
within a very short time frame after commencing CPM.
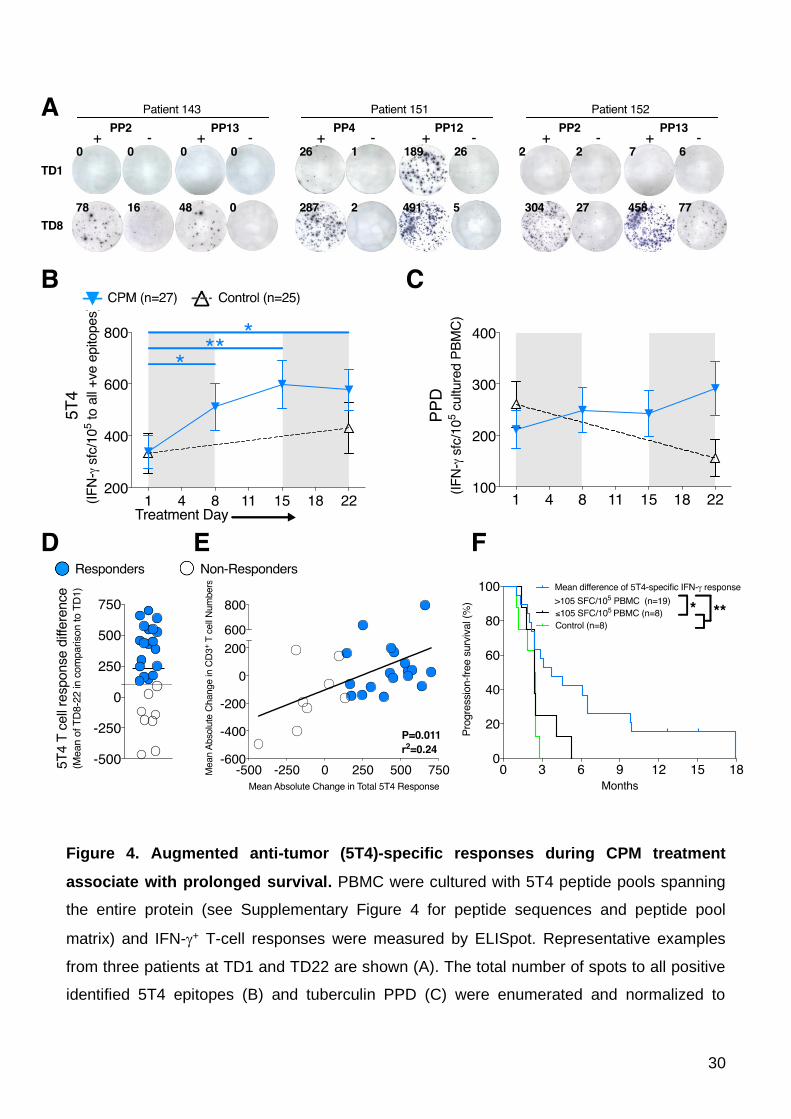
Augmented Anti-5T4 T-cell Responses During CPM Treatment Correlate with
Prolonged Progression Free Survival
TH1-type (IFN-)-producing T-cells are thought to be important mediators of beneficial
anti-tumor immune responses (12). The oncofetal antigen 5T4 has been proposed as a target
antigen given its expression on the majority of gastrointestinal adenocarcinomas, and the
ability of 5T4-specific T-cells to recognize and kill 5T4-expressing tumor cells (29). We have
also found anti-5T4 CD4+ T-cell responses are associated with control of CRC, and are in
turn regulated by tumor-driven Treg (6,8). CPM led to specific increases in T-cell responses
to 5T4 in CRC patients. Positive 5T4 peptide epitopes were identified using a peptide pool
matrix system (Supplementary Figures 4A and 4B). Example ELISpot well images from three
patients (143, 151 and 152) taking CPM demonstrate how a negative response at TD1 to 5T4
peptide pools became highly positive by TD8, indicative of a de novo or unmasked response
to single 5T4 epitopes (Figure 4A). Significant increases in the overall magnitude of anti-5T4
T-cell responses were generated peaking at day 15 (TD1 331.9 ±65.1 SFC/105 vs. TD15
630.9 ±95.7, P=0.0013; numbers reflect cognate T-cell responses as measured by the
number of 5T4-specific IFN- spot forming T-cells i.e. SFC/105 cultured PBMCs; Figure 4B). In
patients followed up for a further 3 months after CPM treatment, who were taking no other
medication (schematic shown; Supplementary Figure 5A), CPM-induced 5T4-specific T-cell
responses remained at a high level until treatment day 43; following this, responses returned
to their base-line levels throughout the rest of the trial (Supplementary Figure 5B). There was
no evidence of immunocompromise in the patient groups (i.e. controls and CPM treated
subjects) despite the advanced nature of the tumors. T-cells were responsive to control
antigens such as tuberculin PPD (Figure 4C) and influenza haemagglutinin (data not shown).
16
Overall, 19 out of 27 patients responded to CPM with a mean increase (at TD8, 15
and 22) in total 5T4 T-cell responses above the lower 95% CI of 105 IFN-+ SFC/105 cultured
PBMC (Figure 4D), and the magnitude of this response was so large that on an intention to
treat basis, these increased responses remain highly significant even when including the
non-responders in the analysis (Figure 4B). Consistent increased anti-5T4 T-cell responses
significantly correlated with mean increases in CD3+ T-cell numbers during the course of
treatment, whereby those patients with a tendency for lymphodepletion during CPM
treatment failed to mount robust anti-5T4 immune responses (P=0.011; Figure 4E).
We next looked at how patients responding to CPM treatment with increased 5T4-
specific immune responses fared clinically compared to subjects who did not respond to CPM
or who were randomized to the control group. Disease progression was assessed by
radiological progression of the tumor or metastases; increase in tumor markers; or clinical
deterioration. Eight patients randomized to CPM failed to respond (black circles, Figure 4D
and E). Progression free survival of both groups was assessed, based on the time taken from
study enrolment to evidence of tumor progression, as assessed clinically, or from radiological
progression (30); the Kaplan-Meier curves are shown (Figure 4F). A significant difference
was found between CPM responders and non-responders plus eight control mCRC patients
not taking CPM or any other treatment (HR=0.29, 95% CI 0.12-0.69, P=0.0047; Figure 4F).
Median time-to-progression of patients responding to CPM in this manner was 3.7 months
versus 2.4 months for non-responders / controls.
In summary, the most striking effects of CPM therapy given to individuals with
inoperable mCRC, in terms of prolonging PFS, are seen when anti-tumor T-cell immune
responses are induced via depletion of circulating Treg.
17
DISCUSSION
The clinical effectiveness of cancer immunotherapy is reliant upon a number of factors that
allow an immune response to overcome the tumor. A major reason for failure in spite of the
presence of anti-tumor responses is the existence of tumor-driven immunosuppressive
mechanisms, mediated, at least in part, by Foxp3+ Treg. Cyclophosphamide has been used
in pre-clinical and clinical studies(19), with it being examined for its immunological effects at
both high and low doses. Whilst metronomic low-doses for cancer immunotherapy have been
infrequently used, there are reports demonstrating prolonged Treg reduction (21,31). One
non-randomized, retrospective study identified a possible small survival benefit in metastatic
cancer patients when using low-dose CPM (32). However, these studies highlighted the need
for in-depth characterization of CPM on immunological findings, to optimize anti-tumor
immunity in potential combination with other treatments.
Following initial CPM administration to mCRC patients, we demonstrated a short
duration in the reduction in Treg proportion and overall Treg number. CPM acts very rapidly,
within days (potentially hours): the first measurement on day 4 of treatment revealed CPM
had induced numerous immunological perturbations, including significantly increased T-cell
numbers resulting in fluctuations of CD4:CD8 T-cell ratio; enhanced CD8+ T-cell cytolytic
function; and decreased expression of activation markers in Foxp3+ Treg. Despite such
pronounced immunological changes observed, nearly all patients taking CPM did not report
any side effects during treatment (one patient experienced nausea). Whilst our understanding
of the pharmacodynamics of CPM with regards to its effect on lymphocytes remains
incomplete, it appears that CPM targets lymphocytes with greatest proliferative potential first,
given the quite drastic reductions in Helios+Ki67+ Foxp3+ Treg seen almost unanimously
amongst the trial participants. Indeed, patients with a higher pre-treatment expression of
Helios (described as a marker of Treg activation and proliferation (27)) or %Ki67-expressing
18
Treg, exhibited a greater degree of proportional Treg reduction and absolute Treg depletion
during CPM treatment. At the same time-points (TD15-18), significant depletions of CD56+
NK-cells and B-cells were also observed. It should be noted that amongst lymphocytes, NK-
cells, B-cells and Treg are highly dynamic proliferative populations in vivo, and homeostatic
turnover is more rapid than for CD4 and CD8 effector T-cell populations (33-35). Thus,
lymphocyte subsets with a relatively high proliferative capacity were more readily targeted by
CPM. In this case however, reductions in absolute numbers of NK-cells or B-cells in the
periphery did not appear to influence patient outcome, and NK-cell phenotype and cytolytic
potential was actually augmented by CPM (data not shown).
Evidence for actual killing of Foxp3+ Treg remains elusive; however from our
experiments and previous reports (31), we hypothesize that CPM blocks activation and
proliferation of Treg, thus resulting in the increased effector T-cell numbers seen in vivo and
enhanced cytolytic T-cell functions ex vivo during treatment. In support of this, there is
evidence indicating that reduced activation of Foxp3+ Treg, as shown here during CPM
treatment, leads to heightened immune responses via localized Treg : effector T-cell ratio
imbalances (36). However, many of the effects seen on Treg were transient and the Treg
proportion rebounds during treatment. This could be an effort to maintain peripheral
homeostasis in the face of reduced Treg functionality. It could also be the result of T-cells
initially being released at a greater rate from lymphoid organs (at TD1-4), before trafficking
out from the periphery (at TD5-8) and into secondary lymphoid tissues or, potentially, tumors,
as demonstrated when CPM is administered in mouse tumor models (22). Absolute Treg
number only significantly reduced, i.e. depleted, at treatment days 15 and 18 before
recovering, revealing the biphasic nature of Treg responsiveness to CPM and highlighting the
importance of multiple immunological measurements throughout the treatment course.
19
The boosting of anti-tumor immunity by CPM is known to extend beyond Treg
depletion; in a mouse model of colon carcinoma, not only were significant effects on dendritic
cell homeostasis also noted, but enhanced anti-tumor responses mediated by CD8+ T-cells
were found after CPM administration, despite only transient Treg depletions (22). This is in
stark contrast to a murine melanoma model, whereby perforin is down-regulated in CD8+
TILs in mice receiving 2.5mg CPM (23). Here, we identified that the cytolytic potential and
function of CD8+ T-cells increased markedly during CPM treatment in the majority of patients.
Indeed, utilizing a dual-color fluorospot assay, we were able to measure increased numbers
of granzyme-B-producing 5T4-specific T-cells just 4 days into CPM treatment. These
augmented responses result from enhanced functionality of T-cells, since single- and dual-
IFN- and granzyme B-producing T-cell responses also increased in response to the T-cell
mitogen PHA (data not shown). However, given there was no increase in T-cell responses to
the control antigens, in contrast to the striking increase in responses directed against 5T4,
this is indicative of immunosuppression specifically targeting anti-tumor immune responses.
Although many of the immunological readouts returned to baseline by treatment day 8,
crucially the anti-tumor immune response mediated by IFN--producing 5T4-specific T-cells
was significantly enhanced over a more prolonged time period for the majority of patients,
again indicative of reduced functional capacity of Treg and augmented effector T-cell
responses. The production of IFN- by the host plays a crucial role in the ultimate success of
therapy, and has a direct role in inducing permanent senescence of tumor cells (37). Here,
the critical readout of whether such responses are beneficial is seen in prolonged
progression free survival of the patients, whereby those patients mounting increased anti-5T4
IFN-+ T-cell responses over the course of treatment had a significantly better clinical
response in comparison to patients not responding to CPM or those receiving no treatment.
This data demonstrates the power of a targeted, TH1-based immune response to an antigen
20
expressed on tumor cells, given that IFN- responses to the irrelevant recall antigens had no
effect on survival.
Low-dose CPM appears to be a safe and beneficial drug for end-stage mCRC patients
with disseminated disease. Our on-going studies aim to evaluate its usefulness in boosting
the immunotherapeutic potential of anti-cancer vaccination with a 5T4-containing pox-virus.
21
Author Contributors
MS, RiH, RoH, AwG and AnG designed the study. MS, TP, DR, RA, AlB, RJ, SG and AnG
did the study procedures. MS, AnB, DR, AT, KS and HB performed IFN- ELISpot and flow
cytometry. DB and RiH performed 5T4 ELISAs. MS, TP, AnB, DR, AT, DB and RiH collected
data. MS and RoH managed data. MS, TP, RiH, RoH, AwG and AnG interpreted data. RoH
did statistical analysis. MS, RoH and AnG wrote the report. MS, TP, AnB, DR, AT, KS, HB,
RA, AlB, RJ, SG, DB, RiH, RoH, AwG and AnG reviewed the report.
Acknowledgments
We thank Georgina Radford, Marcia Short, Helen Maule, Joanne Bagshawe and Laura North
for collecting patient blood samples for use on this study, Helen Clark and Catherine
Johnston for administrative and data assistance, and the patients and their families for their
involvement on this study. We are also grateful for the support from the Clinical Research
Facility (Cardiff and Vale University Health Board).
Funding
This trial was funded by Cancer Research Wales, the Institute for Cancer Vaccines &
Immunotherapy, and the CRUK supported ECMC (Experimental Cancer Medicine Centre).
Additional support was provided by the Cardiff & Vale University Health Board Research &
Development, the Wales Cancer Research Centre, CRUK (C16731/A21200) and a Wellcome
Trust university award (Awen Gallimore, 086983/Z/08/Z). Tom Pembroke is supported by
educational grants from the Welsh Assembly Government, the Wellcome Trust and the
Academy of Medical Sciences.
22
REFERENCES
1. Cancer Research UK (2014). Cancer Statistics Report: Cancer Mortality in the UK in 2012.
2. Kroemer G, Galluzzi L, Zitvogel L, Fridman WH. Colorectal cancer: the first neoplasia found to be under immunosurveillance and the last one to respond to immunotherapy?
Oncoimmunology 2015;4:e1058597 3. Nishikawa H, Sakaguchi S. Regulatory T cells in tumor immunity. Int J Cancer
2010;127:759-67 4. Whiteside TL. What are regulatory T cells (Treg) regulating in cancer and why? Semin
Cancer Biol 2012 5. Betts GJ, Clarke SL, Richards HE, Godkin AJ, Gallimore AM. Regulating the immune
response to tumours. Adv Drug Deliv Rev 2006;58:948-61 6. Betts G, Jones E, Junaid S, El-Shanawany T, Scurr M, Mizen P, et al. Suppression of
tumour-specific CD4+ T cells by regulatory T cells is associated with progression of
human colorectal cancer. Gut 2012;61:1163-71 7. Clarke SL, Betts GJ, Plant A, Wright KL, El-Shanawany TM, Harrop R, et al.
CD4+CD25+FOXP3+ regulatory T cells suppress anti-tumor immune responses in
patients with colorectal cancer. PLoS One 2006;1:e129 8. Scurr M, Bloom A, Pembroke T, Srinivasan R, Brown C, Smart K, et al. Escalating
regulation of 5T4-specific IFN-gamma CD4 T cells distinguishes colorectal cancer patients from healthy controls and provides a target for therapy. Cancer immunology
research 2013;1 9. Scurr M, Gallimore A, Godkin A. T cell subsets and colorectal cancer: discerning the
good from the bad. Cellular immunology 2012;279:21-4 10. Scurr M, Ladell K, Besneux M, Christian A, Hockey T, Smart K, et al. Highly prevalent
colorectal cancer-infiltrating LAP(+) Foxp3(-) T cells exhibit more potent immunosuppressive activity than Foxp3(+) regulatory T cells. Mucosal immunology
2014;7:428-39 11. Weide B, Zelba H, Derhovanessian E, Pflugfelder A, Eigentler TK, Di Giacomo AM, et
al. Functional T cells targeting NY-ESO-1 or Melan-A are predictive for survival of
patients with distant melanoma metastasis. J Clin Oncol 2012;30:1835-41 12. Scurr MJ, Brown CM, Costa Bento DF, Betts GJ, Rees BI, Hills RK, et al. Assessing
the prognostic value of preoperative carcinoembryonic antigen-specific T-cell
responses in colorectal cancer. J Natl Cancer Inst 2015;107 13. Browder T, Butterfield CE, Kraling BM, Shi B, Marshall B, O'Reilly MS, et al.
Antiangiogenic scheduling of chemotherapy improves efficacy against experimental
drug-resistant cancer. Cancer Res 2000;60:1878-86 14. Glode LM, Barqawi A, Crighton F, Crawford ED, Kerbel R. Metronomic therapy with
cyclophosphamide and dexamethasone for prostate carcinoma. Cancer
2003;98:1643-8 15. Gasparini G. Metronomic scheduling: the future of chemotherapy? Lancet Oncol
2001;2:733-40 16. Polak L, Turk JL. Reversal of immunological tolerance by cyclophosphamide through
inhibition of suppressor cell activity. Nature 1974;249:654-6 17. Awwad M, North RJ. Cyclophosphamide (Cy)-facilitated adoptive immunotherapy of a
Cy-resistant tumour. Evidence that Cy permits the expression of adoptive T-cell mediated immunity by removing suppressor T cells rather than by reducing tumour
burden. Immunology 1988;65:87-92
23
18. Ge Y, Domschke C, Stoiber N, Schott S, Heil J, Rom J, et al. Metronomic cyclophosphamide treatment in metastasized breast cancer patients: immunological
effects and clinical outcome. Cancer Immunol Immunother 2012;61:353-62 19. Le DT, Jaffee EM. Regulatory T-cell modulation using cyclophosphamide in vaccine
approaches: a current perspective. Cancer Res 2012;72:3439-44 20. Zhao J, Cao Y, Lei Z, Yang Z, Zhang B, Huang B. Selective depletion of
CD4+CD25+Foxp3+ regulatory T cells by low-dose cyclophosphamide is explained by
reduced intracellular ATP levels. Cancer Res 2010;70:4850-8 21. Ghiringhelli F, Menard C, Puig PE, Ladoire S, Roux S, Martin F, et al. Metronomic
cyclophosphamide regimen selectively depletes CD4+CD25+ regulatory T cells and restores T and NK effector functions in end stage cancer patients. Cancer Immunol
Immunother 2007;56:641-8 22. Radojcic V, Bezak KB, Skarica M, Pletneva MA, Yoshimura K, Schulick RD, et al.
Cyclophosphamide resets dendritic cell homeostasis and enhances antitumor immunity through effects that extend beyond regulatory T cell elimination. Cancer
Immunol Immunother 2010;59:137-48 23. Sevko A, Sade-Feldman M, Kanterman J, Michels T, Falk CS, Umansky L, et al.
Cyclophosphamide promotes chronic inflammation-dependent immunosuppression and prevents antitumor response in melanoma. The Journal of investigative
dermatology 2013;133:1610-9 24. Ellebaek E, Engell-Noerregaard L, Iversen TZ, Froesig TM, Munir S, Hadrup SR, et al.
Metastatic melanoma patients treated with dendritic cell vaccination, Interleukin-2 and metronomic cyclophosphamide: results from a phase II trial. Cancer Immunol
Immunother 2012;61:1791-804 25. Walter S, Weinschenk T, Stenzl A, Zdrojowy R, Pluzanska A, Szczylik C, et al.
Multipeptide immune response to cancer vaccine IMA901 after single-dose
cyclophosphamide associates with longer patient survival. Nat Med 2012;18:1254-61 26. Thornton AM, Korty PE, Tran DQ, Wohlfert EA, Murray PE, Belkaid Y, et al.
Expression of Helios, an Ikaros transcription factor family member, differentiates thymic-derived from peripherally induced Foxp3+ T regulatory cells. J Immunol
2010;184:3433-41 27. Akimova T, Beier UH, Wang L, Levine MH, Hancock WW. Helios expression is a
marker of T cell activation and proliferation. PLoS One 2011;6:e24226 28. Cullen SP, Brunet M, Martin SJ. Granzymes in cancer and immunity. Cell Death Differ
2010;17:616-23 29. Al-Taei S, Salimu J, Lester JF, Linnane S, Goonewardena M, Harrop R, et al.
Overexpression and potential targeting of the oncofoetal antigen 5T4 in malignant
pleural mesothelioma. Lung Cancer 2012;77:312-8 30. Eisenhauer EA, Therasse P, Bogaerts J, Schwartz LH, Sargent D, Ford R, et al. New
response evaluation criteria in solid tumours: revised RECIST guideline (version 1.1).
Eur J Cancer 2009;45:228-47 31. Lutsiak ME, Semnani RT, De Pascalis R, Kashmiri SV, Schlom J, Sabzevari H.
Inhibition of CD4(+)25+ T regulatory cell function implicated in enhanced immune
response by low-dose cyclophosphamide. Blood 2005;105:2862-8 32. Cerullo V, Diaconu I, Kangasniemi L, Rajecki M, Escutenaire S, Koski A, et al.
Immunological effects of low-dose cyclophosphamide in cancer patients treated with
oncolytic adenovirus. Mol Ther 2011;19:1737-46 33. Lutz CT, Karapetyan A, Al-Attar A, Shelton BJ, Holt KJ, Tucker JH, et al. Human NK
cells proliferate and die in vivo more rapidly than T cells in healthy young and elderly
adults. J Immunol 2011;186:4590-8
24
34. Pierson W, Cauwe B, Policheni A, Schlenner SM, Franckaert D, Berges J, et al. Antiapoptotic Mcl-1 is critical for the survival and niche-filling capacity of Foxp3(+)
regulatory T cells. Nat Immunol 2013;14:959-65 35. Vukmanovic-Stejic M, Zhang Y, Cook JE, Fletcher JM, McQuaid A, Masters JE, et al.
Human CD4+ CD25hi Foxp3+ regulatory T cells are derived by rapid turnover of
memory populations in vivo. J Clin Invest 2006;116:2423-33 36. Tang Q, Adams JY, Penaranda C, Melli K, Piaggio E, Sgouroudis E, et al. Central role
of defective interleukin-2 production in the triggering of islet autoimmune destruction.
Immunity 2008;28:687-97 37. Braumuller H, Wieder T, Brenner E, Assmann S, Hahn M, Alkhaled M, et al. T-helper-
1-cell cytokines drive cancer into senescence. Nature 2013;494:361-5 38. ISRCTN. 2012 TroVax® And Cyclophosphamide Treatment In Colorectal Cancer.
<http://www.controlled-trials.com/ISRCTN54669986>. 39. Harrop R, Ryan MG, Myers KA, Redchenko I, Kingsman SM, Carroll MW. Active
treatment of murine tumors with a highly attenuated vaccinia virus expressing the tumor associated antigen 5T4 (TroVax) is CD4+ T cell dependent and antibody
mediated. Cancer Immunol Immunother 2006;55:1081-90
25
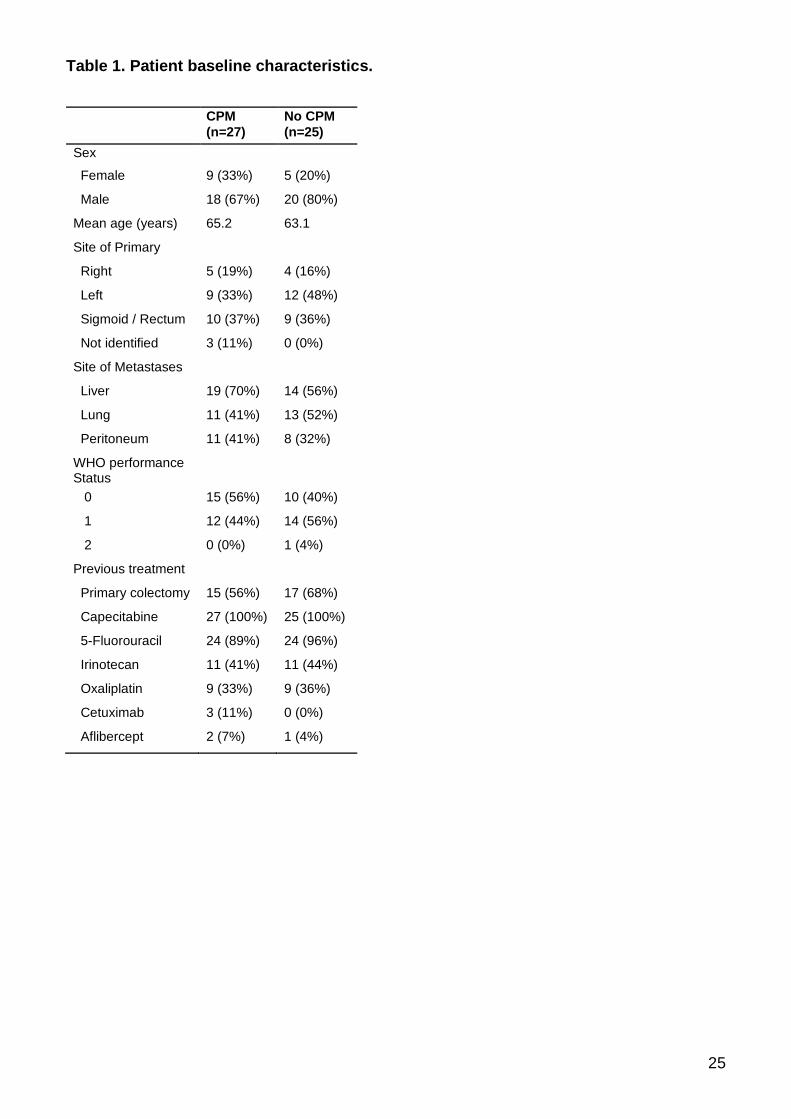
Table 1. Patient baseline characteristics.
CPM
(n=27)
No CPM
(n=25)
Sex
Female 9 (33%) 5 (20%)
Male 18 (67%) 20 (80%)
Mean age (years) 65.2 63.1
Site of Primary
Right 5 (19%) 4 (16%)
Left 9 (33%) 12 (48%)
Sigmoid / Rectum 10 (37%) 9 (36%)
Not identified 3 (11%) 0 (0%)
Site of Metastases
Liver 19 (70%) 14 (56%)
Lung 11 (41%) 13 (52%)
Peritoneum 11 (41%) 8 (32%)
WHO performance Status
0 15 (56%) 10 (40%)
1 12 (44%) 14 (56%)
2 0 (0%) 1 (4%)
Previous treatment
Primary colectomy 15 (56%) 17 (68%)
Capecitabine 27 (100%) 25 (100%)
5-Fluorouracil 24 (89%) 24 (96%)
Irinotecan 11 (41%) 11 (44%)
Oxaliplatin 9 (33%) 9 (36%)
Cetuximab 3 (11%) 0 (0%)
Aflibercept 2 (7%) 1 (4%)
26
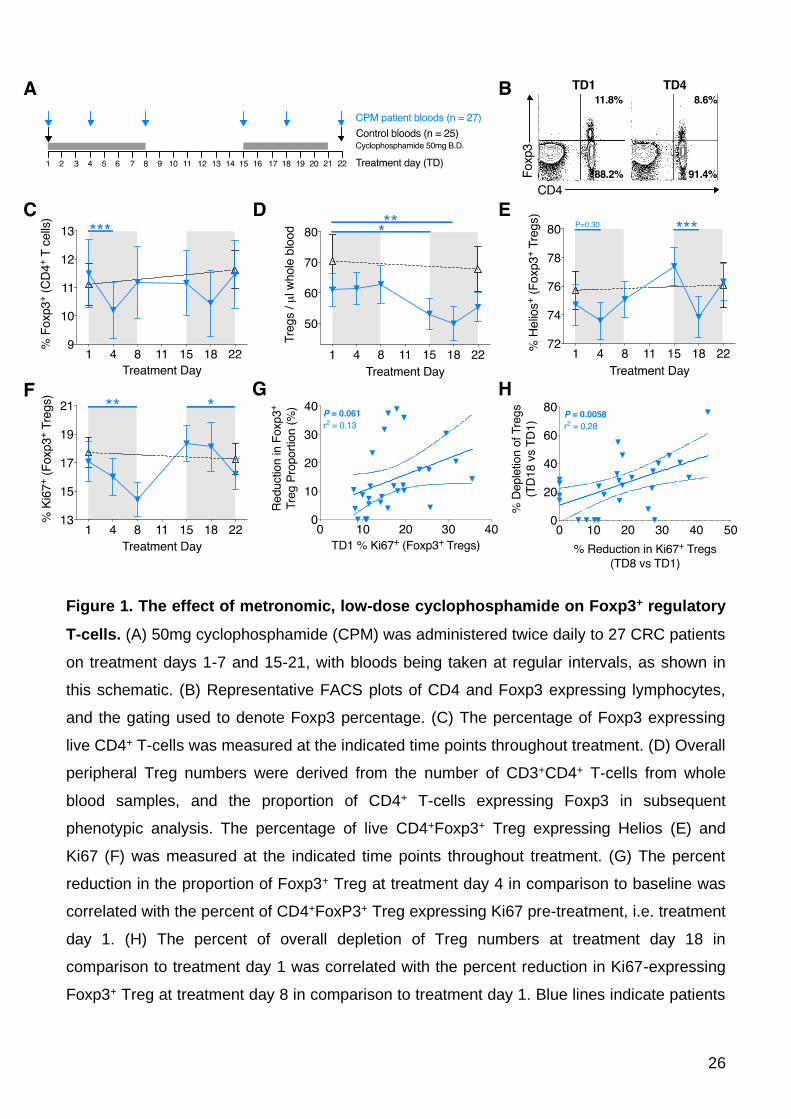
Figure 1. The effect of metronomic, low-dose cyclophosphamide on Foxp3+ regulatory
T-cells. (A) 50mg cyclophosphamide (CPM) was administered twice daily to 27 CRC patients
on treatment days 1-7 and 15-21, with bloods being taken at regular intervals, as shown in
this schematic. (B) Representative FACS plots of CD4 and Foxp3 expressing lymphocytes,
and the gating used to denote Foxp3 percentage. (C) The percentage of Foxp3 expressing
live CD4+ T-cells was measured at the indicated time points throughout treatment. (D) Overall
peripheral Treg numbers were derived from the number of CD3+CD4+ T-cells from whole
blood samples, and the proportion of CD4+ T-cells expressing Foxp3 in subsequent
phenotypic analysis. The percentage of live CD4+Foxp3+ Treg expressing Helios (E) and
Ki67 (F) was measured at the indicated time points throughout treatment. (G) The percent
reduction in the proportion of Foxp3+ Treg at treatment day 4 in comparison to baseline was
correlated with the percent of CD4+FoxP3+ Treg expressing Ki67 pre-treatment, i.e. treatment
day 1. (H) The percent of overall depletion of Treg numbers at treatment day 18 in
comparison to treatment day 1 was correlated with the percent reduction in Ki67-expressing
Foxp3+ Treg at treatment day 8 in comparison to treatment day 1. Blue lines indicate patients

27
taking CPM (n=27); black lines indicate control patients at the same stage of tumor
progression (n=25). Significant differences are indicated (* P<0.05, ** P<0.01, *** P<0.001).
28
Figure 2. T- and NK-cell number and proliferation in response to cyclophosphamide.
The overall number of CD3+CD4+(Foxp3-) T-cells (A), CD3+CD8+ T-cells (B) and CD3-CD56+
NK cells (C) per l whole blood were analyzed at indicated time points. The expression of
Ki67 in CD4+(Foxp3-) T-cells (D), CD8+ T-cells (E) and CD3-CD56+ NK cells (F) was
monitored throughout the course of CPM treatment. Blue lines indicate patients taking CPM
(n=27); black lines indicate control patients at the same stage of tumor progression (n=25).
Significant differences are indicated (* P<0.05, ** P<0.01, *** P<0.001).
29
Figure 3. Enhanced CD8+ T-cell function during CPM treatment. The expression of the
cytolytic molecules perforin (A) and granzyme B (B) in CD8+ T-cells was monitored
throughout the course of CPM treatment. Blue lines indicate patients taking CPM (n=27);
black lines indicate control patients at the same stage of tumor progression (n=25).
Significant differences are indicated (* P<0.05, ** P<0.01, *** P<0.001). A dual color
fluorospot analyzing for the production of IFN- (green spots), and granzyme B (red spots)
was performed, and representative well images are shown from two patients pre-treatment
(TD1) and during CPM treatment (TD4), with PBMC stimulated with 5T4 peptide pools
(Patient 102: C; Patient 116: E). The average number from duplicated wells of single- and
dual-cytokine producing T-cells in response to indicated stimulus, and normalized to SFC/105
PBMC, is shown (Patient 102: D; Patient 116: F).
30
Figure 4. Augmented anti-tumor (5T4)-specific responses during CPM treatment
associate with prolonged survival. PBMC were cultured with 5T4 peptide pools spanning
the entire protein (see Supplementary Figure 4 for peptide sequences and peptide pool
matrix) and IFN-+ T-cell responses were measured by ELISpot. Representative examples
from three patients at TD1 and TD22 are shown (A). The total number of spots to all positive
identified 5T4 epitopes (B) and tuberculin PPD (C) were enumerated and normalized to
31
SFC/105 cultured PBMC. Blue lines indicate patients taking CPM (n=27); black lines indicate
control patients at the same stage of tumor progression (n=25). Significant differences are
indicated (* P<0.05, ** P<0.01). (D) The mean change in 5T4-specific T-cell response at
TD8-22 in comparison to TD1 was measured for all patients, with patients being separated
into responders (blue, n=19) and non-responders (black, n=8) below the 95% CI of
responses at +105 SFC/105 cultured PBMC. (E) This change in 5T4 T-cell response was
correlated with the patient’s mean change in absolute peripheral CD3+ T-cell numbers during
CPM treatment. (F) High anti-5T4 T-cell responses were associated with progression-free
survival data. In addition, control patients who did not take any medication during the trial
were also included for analysis (green lines; n=8). Significant differences are indicated (*
P<0.05, ** P<0.01).