Embed Size (px)
Citation preview
Choosing the Best Commodity
Strategy: Active, Passive &
Quantitative Strategies
Olivier Ludwig, Moderator Managing Editor IndexUniverse Scott Reeves, Presenter Investment Solutions Analyst U.S. Trust Investment Solutions Group Joe Wickwire, CFA, Presenter Portfolio Manager Fidelity Investments

Olivier Ludwig, Managing Editor IndexUniverse
Choosing the Best Commodity
Strategy: Active, Passive &
Quantitative Strategies
Joe Wickwire, CFA Portfolio Manager Fidelity Investments
Scott Reeves, Investment Solutions Analyst U.S. Trust Investment Solutions Group
Choosing the Best Commodity
Strategy: Active, Passive &
Quantitative Strategies
Joe Wickwire, CFA Portfolio Manager Fidelity Investments
The Role of Active Commodity
Exposure in a Diversified Portfolio
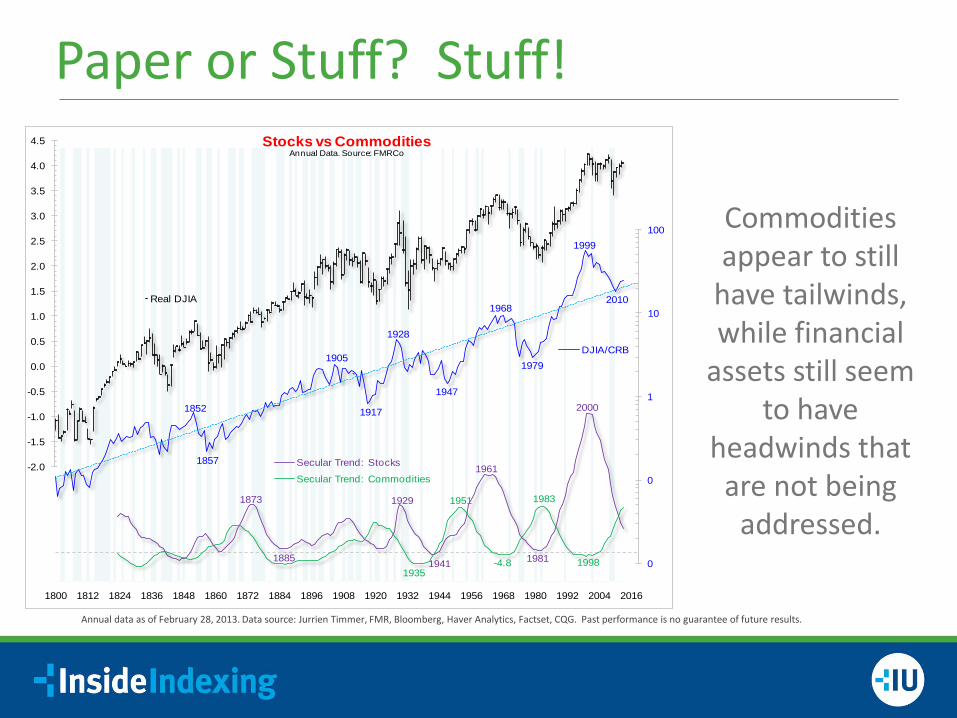
Paper or Stuff? Stuff!
Commodities appear to still
have tailwinds, while financial
assets still seem to have
headwinds that are not being
addressed.
`
-2.0
-1.5
-1.0
-0.5
0.0
0.5
1.0
1.5
2.0
2.5
3.0
3.5
4.0
4.5 Stocks vs CommoditiesAnnual Data. Source: FMRCo
Real DJIA
1852
1857
1905
1917
1928
1947
1968
1979
1999
2010
0
0
1
10
100
DJIA/CRB
1873
1885
1929
1941
1961
1981
2000
1935
1951
-4.8
1983
1998
1800 1812 1824 1836 1848 1860 1872 1884 1896 1908 1920 1932 1944 1956 1968 1980 1992 2004 2016
Secular Trend: Stocks
Secular Trend: Commodities
Annual data as of February 28, 2013. Data source: Jurrien Timmer, FMR, Bloomberg, Haver Analytics, Factset, CQG. Past performance is no guarantee of future results.
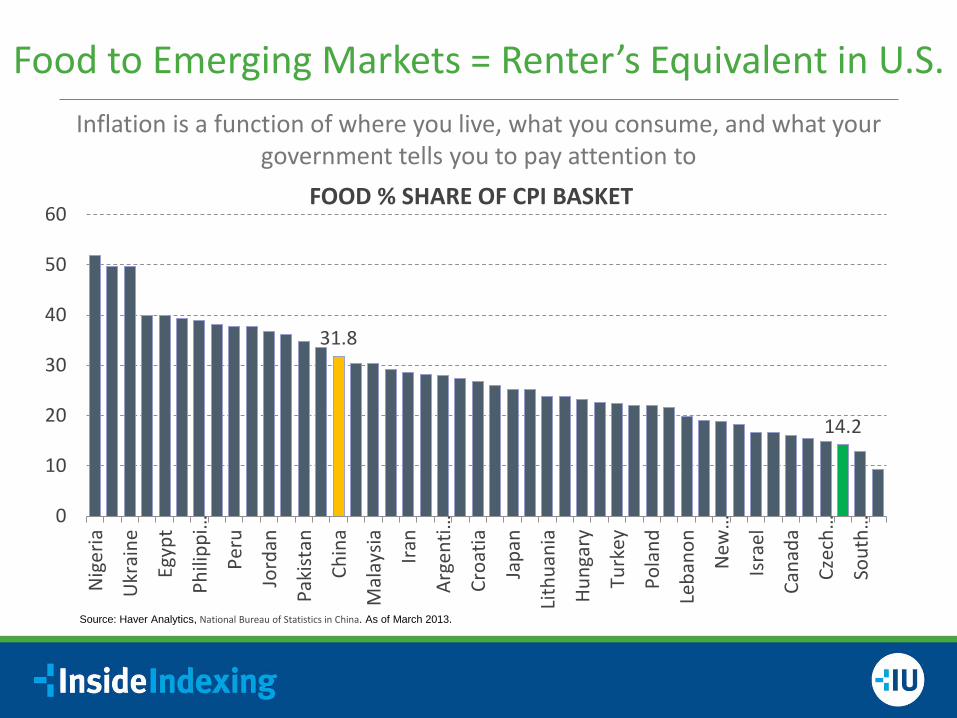
Food to Emerging Markets = Renter’s Equivalent in U.S. Inflation is a function of where you live, what you consume, and what your
government tells you to pay attention to
31.8
14.2
0
10
20
30
40
50
60
Nig
eria
Ukr
aine
Egyp
t
Phili
ppi…
Peru
Jord
an
Paki
stan
Chin
a
Mal
aysia Ira
n
Arge
nti…
Croa
tia
Japa
n
Lith
uani
a
Hung
ary
Turk
ey
Pola
nd
Leba
non
New
…
Isra
el
Cana
da
Czec
h…
Sout
h…
FOOD % SHARE OF CPI BASKET
Source: Haver Analytics, National Bureau of Statistics in China. As of March 2013.
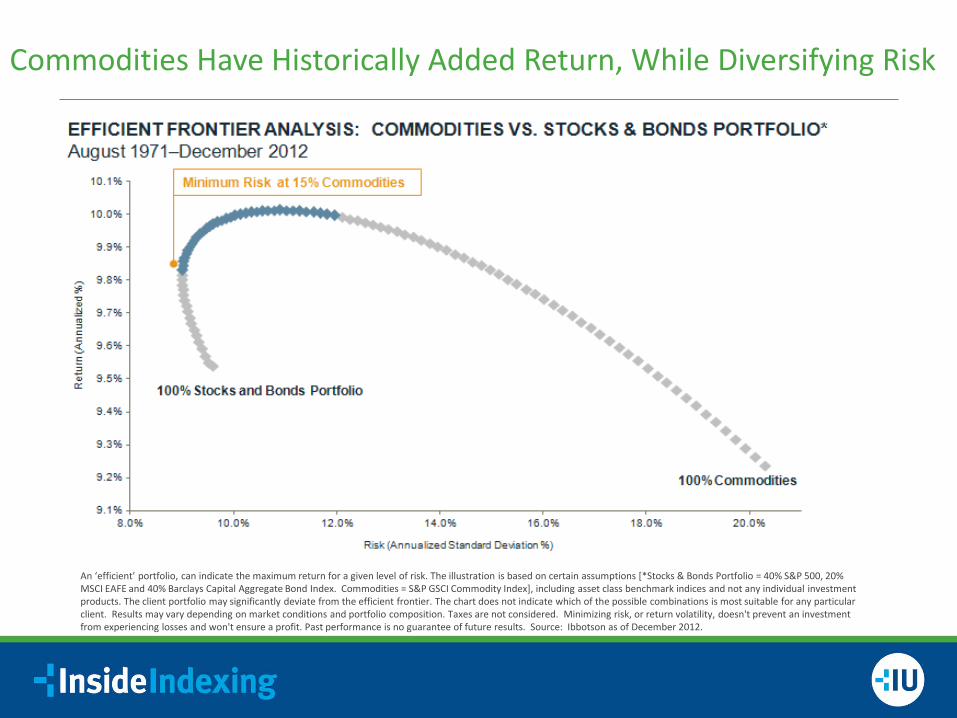
Commodities Have Historically Added Return, While Diversifying Risk
An ‘efficient’ portfolio, can indicate the maximum return for a given level of risk. The illustration is based on certain assumptions [*Stocks & Bonds Portfolio = 40% S&P 500, 20% MSCI EAFE and 40% Barclays Capital Aggregate Bond Index. Commodities = S&P GSCI Commodity Index], including asset class benchmark indices and not any individual investment products. The client portfolio may significantly deviate from the efficient frontier. The chart does not indicate which of the possible combinations is most suitable for any particular client. Results may vary depending on market conditions and portfolio composition. Taxes are not considered. Minimizing risk, or return volatility, doesn't prevent an investment from experiencing losses and won't ensure a profit. Past performance is no guarantee of future results. Source: Ibbotson as of December 2012.
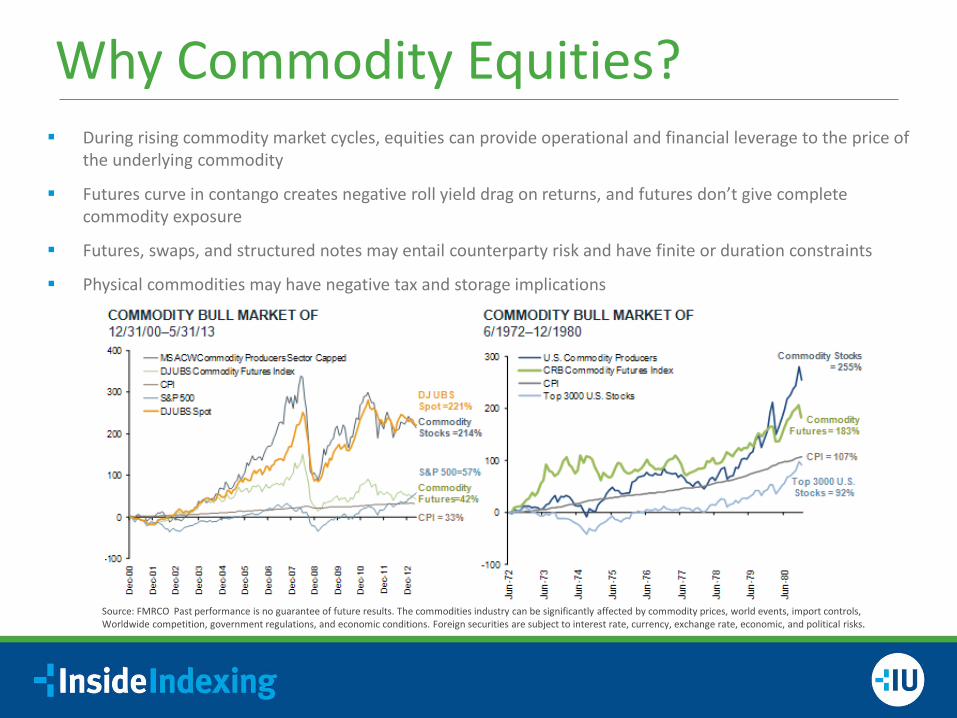
Why Commodity Equities? During rising commodity market cycles, equities can provide operational and financial leverage to the price of
the underlying commodity
Futures curve in contango creates negative roll yield drag on returns, and futures don’t give complete commodity exposure
Futures, swaps, and structured notes may entail counterparty risk and have finite or duration constraints
Physical commodities may have negative tax and storage implications
Source: FMRCO Past performance is no guarantee of future results. The commodities industry can be significantly affected by commodity prices, world events, import controls, Worldwide competition, government regulations, and economic conditions. Foreign securities are subject to interest rate, currency, exchange rate, economic, and political risks.
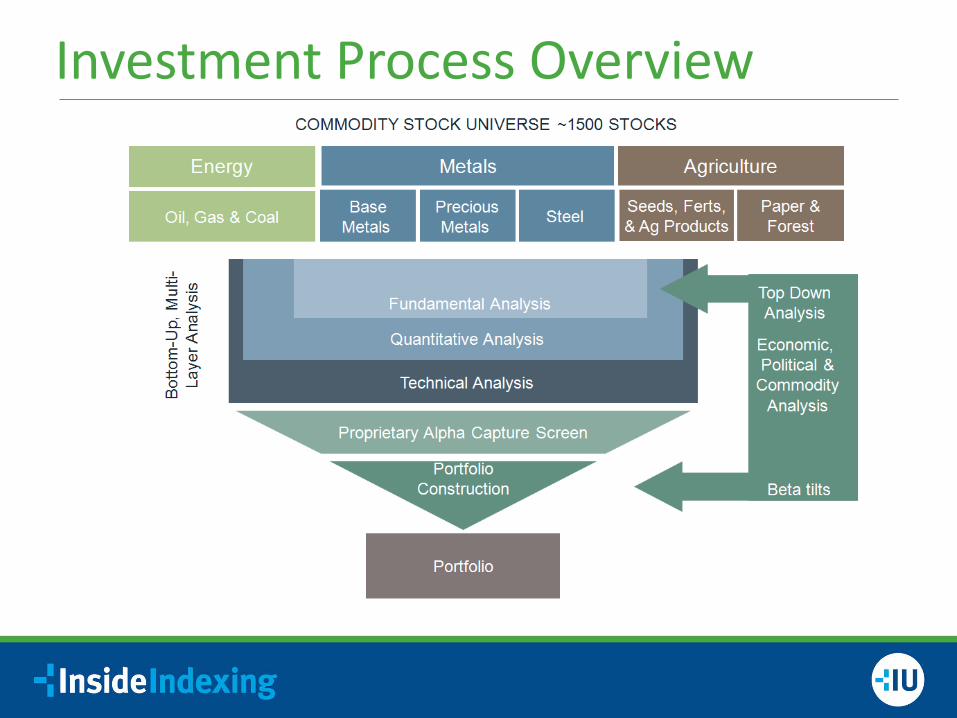
Investment Process Overview
Important Information Information provided herein is for discussion and illustrative purposes only and is not a
recommendation or an offer or solicitation to buy or sell any security or for any investment advisory service. Discussion of individual securities is not intended to represent holdings of any Fidelity fund or investment product.
Opinions expressed herein are those of the individual contributor, are subject to change, and do not necessarily represent the views of Fidelity.
Fidelity Investments/FMRCo are not affiliated with IndexUniverse

Scott Reeves, Investment Solutions Analyst U.S. Trust Investment Solutions Group
Commodities As Indexes & an Asset Class
Asset Class Overview Commodities Outlook – Strategic vs. Tactical
Long Term Themes
Asset Allocation Framework Equities vs. Futures
Strategies Employed ETFs Mutual Funds Private Investments (CTAs)
Commodity Index Development First Generation Indices
Front Month Roll Concentrated allocations Infrequent Rebalancing
Second Generation Indices Diversification Requirements Enhanced Contract Selection
Third Generation Indices Enhanced Contract Selection Active Commodity Selection Frequent Rebalancing
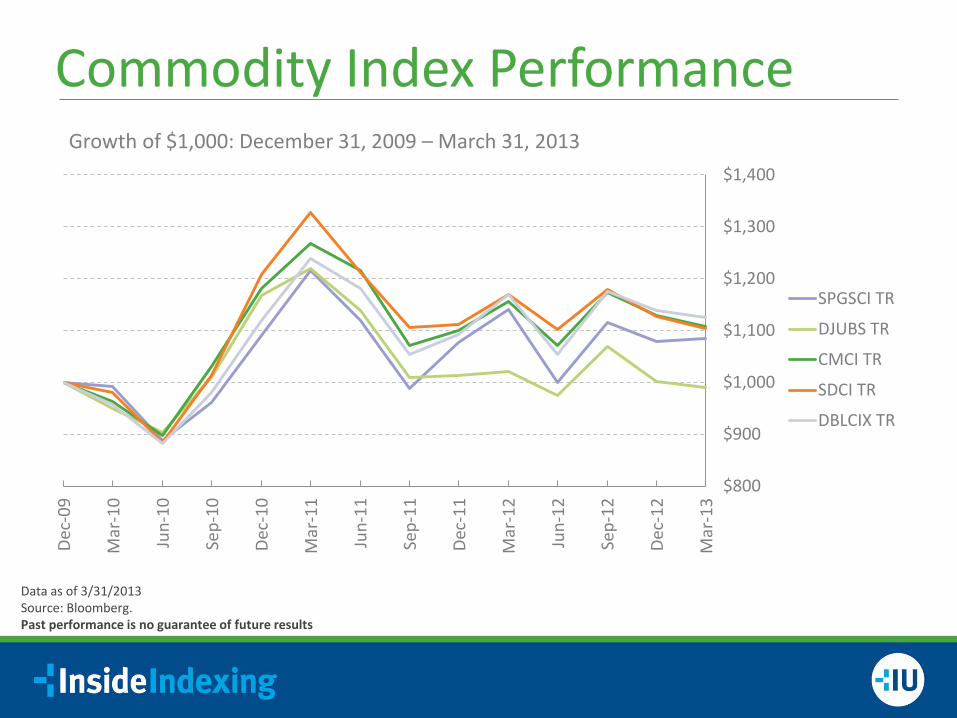
Commodity Index Performance
$800
$900
$1,000
$1,100
$1,200
$1,300
$1,400
Dec-
09
Mar
-10
Jun-
10
Sep-
10
Dec-
10
Mar
-11
Jun-
11
Sep-
11
Dec-
11
Mar
-12
Jun-
12
Sep-
12
Dec-
12
Mar
-13
Growth of $1,000: December 31, 2009 – March 31, 2013
SPGSCI TR
DJUBS TR
CMCI TR
SDCI TR
DBLCIX TR
Data as of 3/31/2013 Source: Bloomberg. Past performance is no guarantee of future results

Appendix Index Definitions: Indexes are unmanaged and do not incur fees or expenses. It is not possible to invest directly in an index. The Dow Jones – UBS Commodity Index: a broadly diversified index that allows investors to track commodity futures through a
single, simple measure. The index is composed of futures contracts on physical commodities. As the index has grown in popularity since its introduction in 1998, additional versions and a full complement of sub-indexes have been introduced. Together, the family offers investors a comprehensive set of tools for measuring the commodity markets.
The S&P GSCI™ Total Return Index: measures a fully collateralized commodity futures investment that is rolled forward from the
fifth to the ninth business day of each month. Currently the S&P GSCI™ includes 24 commodity nearby futures contracts. The S&P GSCI™ Total Return is significantly different than the return from buying physical commodities.
The SummerHaven Dynamic Commodity Index – Total Return tracks the performance of a fully collateralized portfolio of 14
commodity futures, selected each month from a universe of 27 eligible commodities based on observable price signals, subject to a diversification requirement across commodity sectors.
The UBS Bloomberg Constant Maturity Commodity Index (CMCI) Total Return is a diversified commodity index family made up of
27 components. CMCI offers the ability to gain exposure to the broad commodity markets, specific sectors including energy, industrial metals, precious metals, agriculture and livestock as well as individual components. It also includes a time dimension by allowing investment across different tenors.
DBIQ Optimum yield Diversified Commodity Index Excess Return is intended to reflect to the performance of certain commodities.
The commodities comprising the index are WTI Crude, Brent Crude, Heating Oil, RBOB Gasoline, Natural Gas, Gold, Silver, Aluminum, Zinc, Copper.
Disclosure This presentation is designed to introduce you to the products and services available through U.S. Trust, Bank of America Private Wealth Management, is provided for informational purposes only, and was not issued in connection with any proposed offering of securities. It was issued without regard to the specific investment objectives, financial situation or particular needs of any specific recipient and does not contain investment recommendations. Bank of America and its affiliates do not accept any liability for any direct, indirect or consequential damages or losses arising from any use of this presentation or its contents. The information in this presentation was obtained from sources believed to be accurate, but we do not guarantee that it is accurate or complete. The opinions expressed herein are made as of the date of this material and are subject to change without notice. There is no guarantee the views and opinions expressed in this presentation will come to pass. Other affiliates may have opinions that are different from and/or inconsistent with the opinions expressed herein and may have banking, lending and/or other commercial relationships with Bank of America and/or its affiliates. All charts are based on historical data for the time periods indicated and are intended for illustrative purposes only. Past performance is no guarantee of future results. Investments focused in a certain industry may pose additional risk due to lack of diversification, industry volatility, economic turmoil, susceptibility to economic, political or regulatory risks and other sector concentration risks. There are special risks associated with an investment in commodities, including market price fluctuations, regulatory changes, interest rate changes, credit risk, economic changes, and the impact of adverse political or financial factors. IMPORTANT: The material presented is designed to provide general information about ideas and strategies. It is for discussion purposes, since the availability and effectiveness of any strategy are dependent upon your individual facts and circumstances. Always consult with your independent attorney, tax advisor, investment manager and insurance agent for final recommendations and before changing or implementing any financial, tax, or estate planning strategy. Investment Products: U.S. Trust operates through Bank of America, N.A. and other subsidiaries of Bank of America Corporation. Bank of America, N.A., Member FDIC. This presentation may not be reproduced or distributed by any person for any purpose without prior written consent. © 2013, Bank of America Corporation. All rights reserved.
Are Not FDIC Insured Are Not Bank Guaranteed May Lose Value

Thank You. Questions?

Choosing the Best Commodity
Strategy: Active, Passive &
Quantitative Strategies
Olivier Ludwig, Moderator Managing Editor IndexUniverse Scott Reeves, Presenter Investment Solutions Analyst U.S. Trust Investment Solutions Group Joe Wickwire, CFA, Presenter Portfolio Manager Fidelity Investments


![Commodity Profile & Strategy Agreement Title: [insert] Reference: [insert] For info – delete prior to issue The strategy is used in the planning stage](https://img.dokumen.tips/doc/110x75/56649e365503460f94b2512f/commodity-profile-strategy-agreement-title-insert-reference-insert.jpg)


![[Commodity Name] Commodity Strategy](https://img.dokumen.tips/doc/110x75/568135d2550346895d9d3881/commodity-name-commodity-strategy.jpg)


![BPI Best Procurement Implementation [Commodity Name] Commodity Strategy [Name] [Date]](https://img.dokumen.tips/doc/110x75/56649e365503460f94b2512d/bpi-best-procurement-implementation-commodity-name-commodity-strategy-name.jpg)