Embed Size (px)
Citation preview

ANZ Commodity Strategy
AIBC Coal Update
Mark PervanHead of Commodities Research
June 2010
2
MACRO

3
Source: Bloomberg
Purchasing Managers Indices
China rebounded much quicker from the GFC
26
30
34
38
42
46
50
54
58
62
Jan-06 Jul-06 Jan-07 Jul-07 Jan-08 Jul-08 Jan-09 Jul-09 Jan-10
USEUChinaJapan
points
expanding
contracting
4
0.00
0.50
1.00
1.50
2.00
2.50
3.00
3.50
4.00
4.50
0 5 10 15 20 25
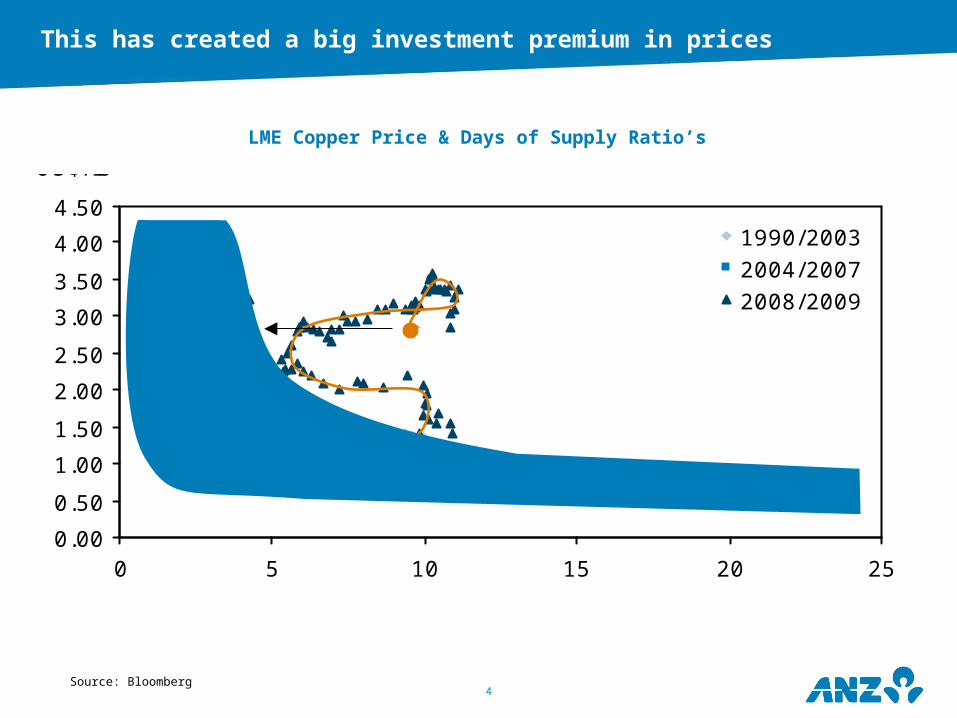
1990/2003
2004/20072008/2009
Copper
days of supply
US$/ lb
Source: Bloomberg
LME Copper Price & Days of Supply Ratio’s
This has created a big investment premium in prices

5
0
5
10
15
20
25
90 92 94 96 98 00 02 04 06 08 100
200
400
600
800
1,000
1,200
days of supply Total LME Supply (RHS)
'000t
9 9
days
Source: Bloomberg
LME Copper Stockpiles & Days of Supply
However, funds may be calling it right

6
(600)
(400)
(200)
0
200
400
600
800
J an-03 J an-04 J an-05 J an-06 J an-07 J an-08 J an-09 J an-10
Long Short Net (Long-Short)
Kt
Source: Bloomberg
Non-Commercial Copper Positions
Funds have taken profits

7
(300)
(200)
(100)
0
100
200
300
J an-03 J an-04 J an-05 J an-06 J an-07 J an-08 J an-09 J an-10
Long Short Net (Long-Short)
Mbbls
Source: Bloomberg
Non-Commercial Oil Positions
Oil positioned heavily in both directions

8Source: Bloomberg
Discount to Historical High Price Level
(3.1)
(15.2)
(26.0)
(26.4)
(28.9)
(31.6)
(32.8)
(40.1)
(47.8)
(48.6)
(53.2)
(57.0)
(59.9)
(60.9)
(80) (70) (60) (50) (40) (30) (20) (10) 0 10 20 30 40 50
Gold
Silver
Copper
Iron ore
Dow Jones
Tin
Platinum
Aluminium
US Dollar
Coal
Oil
Lead
Zinc
Nickel $24.52/lb - May 2007
120.9 - Jul 2001
$2.09/lb - Nov 2006
$195/t - Jul 2008
$145.30/bbl - Jul 2008
$1.81/lb - Oct 2007
$148.38/lb - Jul 2008
$11.49/lb - May 2008
$2,250/oz - Mar 2008
14,164 - Oct 2007
$4.04/lb - Jul 2008
$210/t - Mar 2008
$20.81/oz - Mar 2008
$1,220/oz - Mar 2008
Coal prices look cheap from a historical high basis
9Source: ANZ
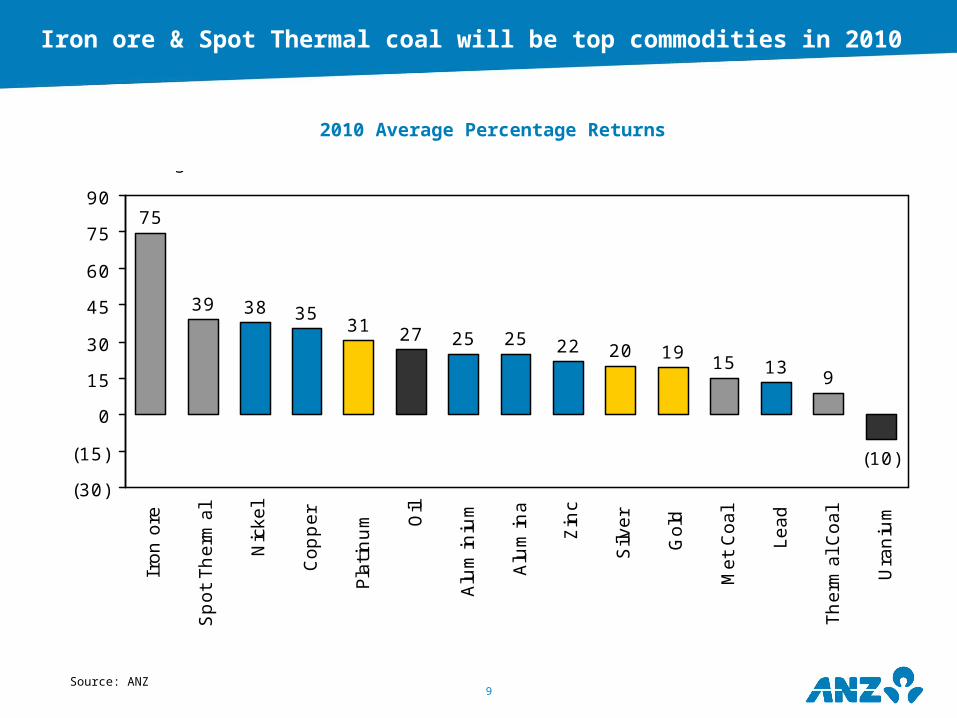
2010 Average Percentage Returns
Iron ore & Spot Thermal coal will be top commodities in 2010
75
39 38 3531 27 25 25 22 20 19
15 139
(10)
(30)
(15)
0
15
30
45
60
75
90
Iron
ore
Sp
ot
Th
erm
al
Nic
kel
Cop
per
Pla
tin
um
Oil
Alu
min
ium
Alu
min
a
Zin
c
Silv
er
Gold
Met
Coal
Lead
Th
erm
al C
oal
Ura
niu
m
YoY % change
10Source: ANZ
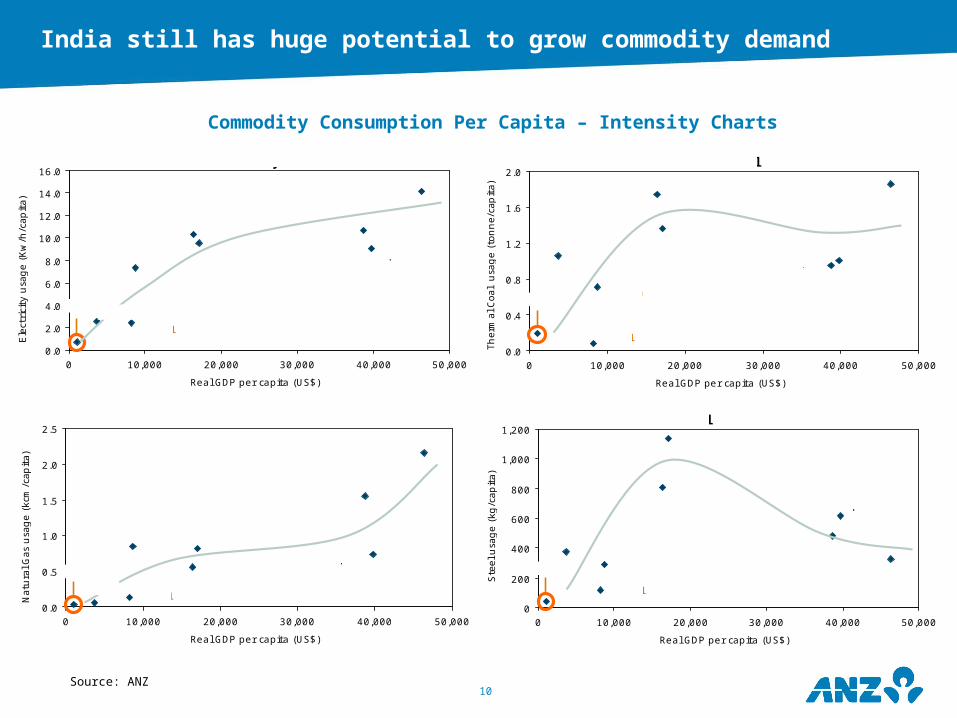
Commodity Consumption Per Capita – Intensity Charts
India still has huge potential to grow commodity demand
0
200
400
600
800
1,000
1,200
0 10,000 20,000 30,000 40,000 50,000
Real GDP per capita (US$)
Ste
el u
sag
e (
kg
/cap
ita)
Steel
India
Brazil
Russia
China
Taiwan
Sth Korea
Japan
EU
US
0.0
0.5
1.0
1.5
2.0
2.5
0 10,000 20,000 30,000 40,000 50,000
Real GDP per capita (US$)
Natu
ral G
as
usa
ge (
kcm
/cap
ita)
Natural Gas
India
Brazil
Russia
Taiwan
Sth KoreaJapan
EU
US
China
0.0
0.4
0.8
1.2
1.6
2.0
0 10,000 20,000 30,000 40,000 50,000
Real GDP per capita (US$)
Th
erm
al C
oal u
sag
e (
ton
ne/c
ap
ita)
Thermal Coal
India
Brazil
Russia
China Taiwan
Sth Korea
JapanEU
US
0.0
2.0
4.0
6.0
8.0
10.0
12.0
14.0
16.0
0 10,000 20,000 30,000 40,000 50,000
Real GDP per capita (US$)
Ele
ctri
city
usa
ge (
Kw
/h/c
ap
ita)
Electricity
India
Brazil
Russia
Taiwan
Sth Korea Japan
EU
US
China

11
THERMAL COAL
12
(10)
(8)
(6)
(4)
(2)
0
2
4
6
8
10
12
98 99 00 01 02 03 04 05 06 07 08 09 10(100)
(50)
0
50
100
150
200
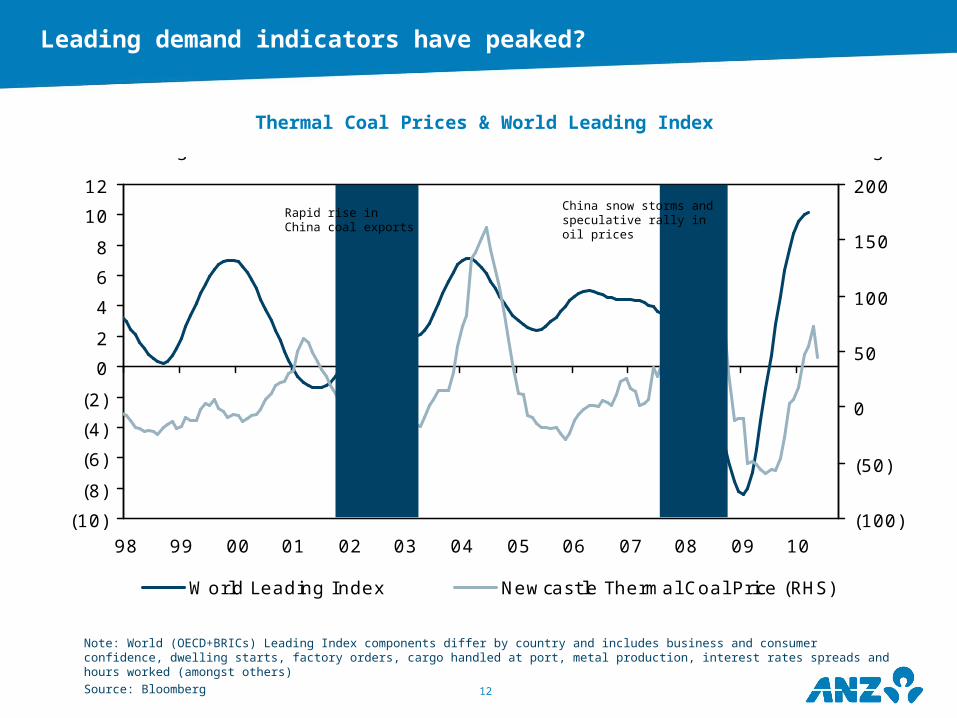
World Leading Index Newcastle Thermal Coal Price (RHS)
YoY % changeYoY % change
Note: World (OECD+BRICs) Leading Index components differ by country and includes business and consumer confidence, dwelling starts, factory orders, cargo handled at port, metal production, interest rates spreads and hours worked (amongst others)Source: Bloomberg
Thermal Coal Prices & World Leading Index
Leading demand indicators have peaked?
China snow storms and speculative rally in oil prices
Rapid rise in China coal exports
13
(90)
(60)
(30)
0
30
60
90
120
150
180
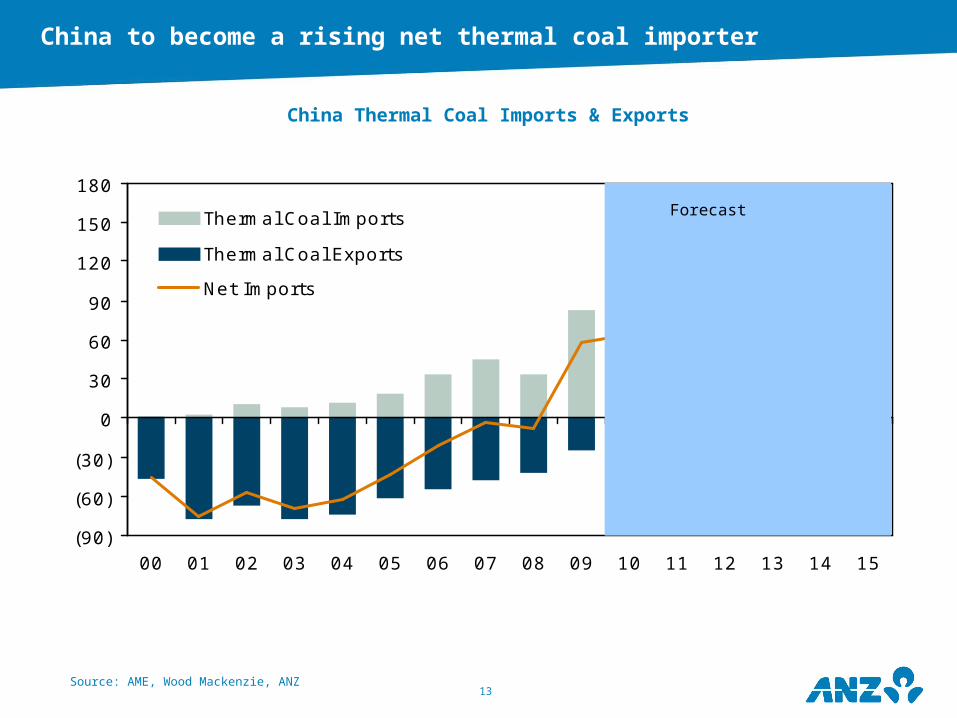
00 01 02 03 04 05 06 07 08 09 10 11 12 13 14 15
Thermal Coal Imports
Thermal Coal Exports
Net Imports
m tonnes
57
140
China Thermal Coal Imports & Exports
Source: AME, Wood Mackenzie, ANZ
China to become a rising net thermal coal importer
Forecast
14
0
25
50
75
100
125
150
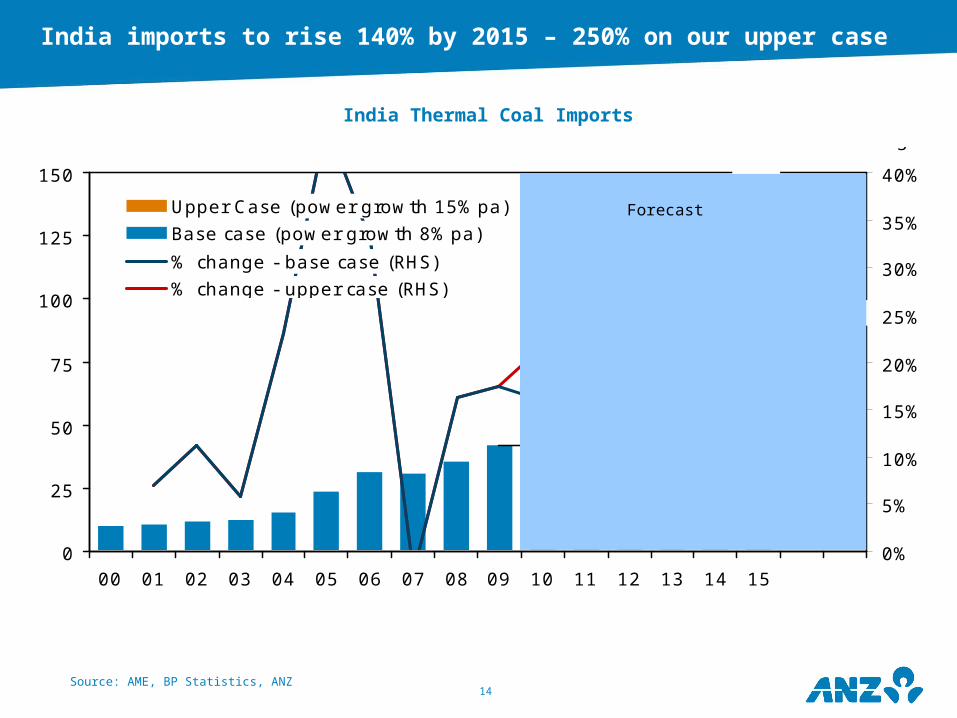
00 01 02 03 04 05 06 07 08 09 10 11 12 13 14 150%
5%
10%
15%
20%
25%
30%
35%
40%
Upper Case (power growth 15%pa)
Base case (power growth 8%pa)
% change - base case (RHS)
% change - upper case (RHS)
m tonnes YoY change
42
146
100
58
104
India Thermal Coal Imports
Source: AME, BP Statistics, ANZ
India imports to rise 140% by 2015 – 250% on our upper case
Forecast

15Source: AME, ANZ, Wood Mackenzie
Thermal Coal Import Demand (million tonnes)
India jumps to number 4 – and number 2 on the upper case
2009 2015
83101
2009 2015
4866
China
Russia
Europe
INDIA
J apan
Korea
2009 2015
108
138
Taiwan
2009 2015
83
2009 2015
23 25
2009 2015
42
2009 2015
107122
161
100
146
16
0
100
200
300
400
500
600
700
800
900
1,000
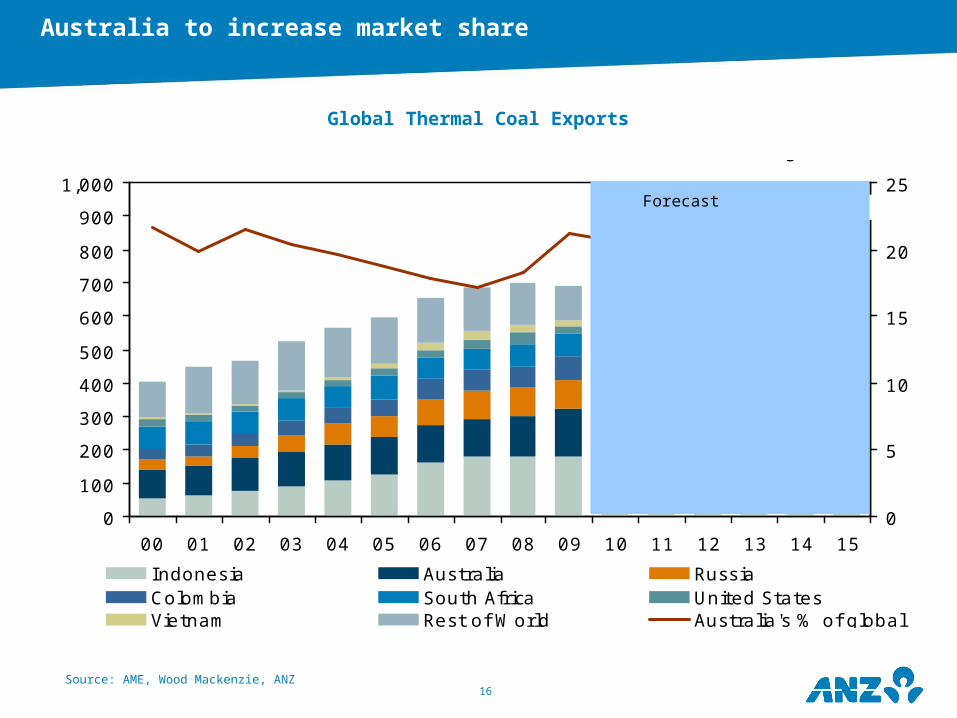
00 01 02 03 04 05 06 07 08 09 10 11 12 13 14 150
5
10
15
20
25
Indonesia Australia RussiaColombia South Africa United StatesVietnam Rest of World Australia's % of global
% global sharem tonnes
21% 24%
Source: AME, Wood Mackenzie, ANZ
Global Thermal Coal Exports
Australia to increase market share
Forecast

17
Source: Wood Mackenzie
New South Wales Coal Infrastructure Capacity
Port capacity constraints in NSW addressed by 2015?
0
50
100
150
200
250
2000 2002 2004 2006 2008 2010 2012 2014 2016 2018 2020
Port Capacity Rail Capacity
m tonnes
18
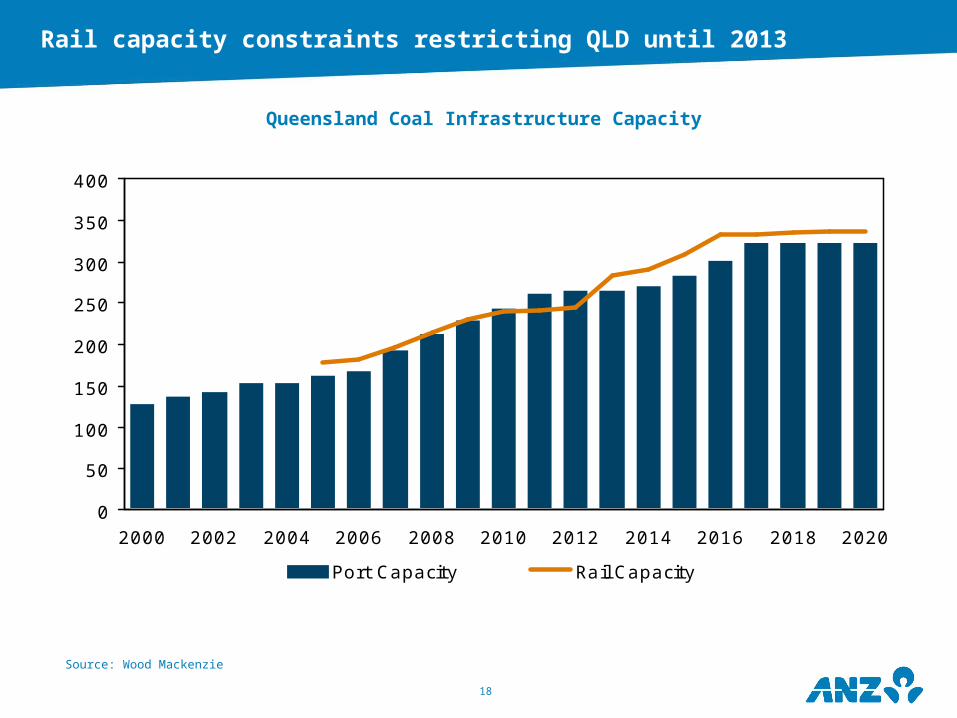
Source: Wood Mackenzie
Queensland Coal Infrastructure Capacity
Rail capacity constraints restricting QLD until 2013
0
50
100
150
200
250
300
350
400
2000 2002 2004 2006 2008 2010 2012 2014 2016 2018 2020
Port Capacity Rail Capacity
m tonnes

19Source: Indonesian Coal Mining Association, BP Statisctics
Global Thermal Proven Coal Reserves (million tonnes)
Australia has the reserves to provide longer term
246 bt50 bt
Africa
Europe
15 bt 32 bt
147 bt
59 bt
115 bt
76 bt
4 btLatin
America
North America
India
Russia
China
Australia
Indonesia
Total World826 bt

20
METALLURGICAL COAL

21
China Coking Coal Imports & Exports
Source: AME, ANZ
China to become a substantial coking coal importer
(30)
(20)
(10)
0
10
20
30
40
50
60
70
00 01 02 03 04 05 06 07 08 09 10 11 12 13 14 15
Coking Coal Imports
Coking Coal Exports
Net Imports
m tonnes
33
62

22
0
10
20
30
40
50
60
70
80
90
100
110
00 01 02 03 04 05 06 07 08 09 10F 11F 12F 13F 14F 15F0%
5%
10%
15%
20%
25%
30%
35%Upper Case (Steel growth 15%pa)
Base case (Steel growth 9%pa)
% change - base case (RHS)
% change - upper case (RHS)
m tonnes YoY change
4638
76
30
76
106
India Coking Coal Imports
Source: AME, Wood Mackenzie, ANZ
India imports to rise 160% by 2015 – 260% on our upper case
Forecast

23Source: AME, Wood Mackenzie, ANZ
Coking Coal Import Demand (million tonnes)
India jumps to number 1 on both growth scenario’s
2009 20152009 2015
2009 2015
2009 2015
2009 2015
2009 2015
2009 20152009 2015
USA
China
Brazil
J apanEurope
Taiwan
Korea
32
53
30
68
5 10
49
66
1727
1225
6 834
62
146
76
INDIA

24
0
50
100
150
200
250
300
350
400
00 01 02 03 04 05 06 07 08 09 10F 11F 12F 13F 14F 15F0
10
20
30
40
50
60
70
Australia Canada United States
Russia Rest of the World Australia % of global
million tonnnes % global share
61%
54%
Source: AME, Wood Mackenzie, ANZ
Global coking coal supply to remain leveraged to Australia
Forecast
Global Coking Coal Exports

25
APPENDIX

26
Appendix: ANZ quarterly commodity price forecasts
Source: Bloomberg, ANZ
End of Period Mar-10 J un-10 Sep-10 Dec-10 Mar-11 J un-11 Sep-11 Dec-11 Mar-12 J un-12 Sep-12 Dec-12 Mar-13 J un-13unit
Copper US$/ lb 3.52 2.90 3.10 3.20 3.30 3.40 3.50 3.50 3.55 3.60 3.55 3.40 3.20 3.00Aluminium US$/ lb 1.04 0.89 0.92 0.94 0.95 0.96 0.98 1.00 0.99 0.95 0.93 0.92 0.93 0.93Lead US$/ lb 0.96 0.77 0.84 0.88 0.92 0.96 0.98 1.00 1.01 1.02 1.00 0.98 0.96 0.94Nickel US$/ lb 11.32 8.50 8.80 9.10 9.30 9.50 9.80 10.00 10.00 9.70 9.40 9.10 8.80 8.50Zinc US$/ lb 1.06 0.80 0.85 0.90 0.94 0.98 1.00 1.02 1.05 1.05 1.02 1.00 0.98 0.96Gold US$/oz 1,113 1,210 1,190 1,160 1,130 1,100 1,070 1,050 1,050 1,060 1,080 1,100 1,100 1,070Silver US$/oz 17.5 17.9 18.0 17.8 17.5 17.2 17.0 16.7 16.9 17.1 17.7 17.5 17.5 17.0Platinum US$/oz 1,644 1,550 1,566 1,611 1,614 1,594 1,574 1,544 1,522 1,514 1,521 1,528 1,528 1,466WTI Crude US$/bbl 84 75 80 85 85 88 90 95 98 100 102 105 105 102Iron Ore Fines US$/t 60 120 150 145 155 160 160 155 150 145 140 135 130 120Iron Ore Lump US$/t 72 135 160 155 165 170 170 165 160 155 150 145 140 130Premium Coking Coal US$/t 128 200 225 240 260 260 270 270 260 255 250 245 240 240Steaming Coal US$/t 70 98 98 98 98 120 120 120 120 130 130 130 130 125Alumina US$/t 335 284 289 296 304 300 302 304 301 283 277 274 277 277Uranium US$/ lb 42 40 42 45 48 52 55 58 60 63 65 65 62 60A$/US$ US$ 0.92 0.84 0.88 0.90 0.92 0.94 0.94 0.92 0.90 0.88 0.86 0.84 0.75 0.74
Average Mar-10 J un-10 Sep-10 Dec-10 Mar-11 J un-11 Sep-11 Dec-11 Mar-12 J un-12 Sep-12 Dec-12 Mar-13 J un-13unit
Copper US$/ lb 3.29 3.21 3.00 3.15 3.25 3.35 3.45 3.50 3.53 3.58 3.58 3.48 3.30 3.10Aluminium US$/ lb 0.98 0.97 0.91 0.93 0.95 0.96 0.97 0.99 1.00 0.97 0.94 0.93 0.93 0.93Lead US$/ lb 1.00 0.87 0.81 0.86 0.90 0.94 0.97 0.99 1.01 1.02 1.01 0.99 0.97 0.95Nickel US$/ lb 9.10 9.91 8.65 8.95 9.20 9.40 9.65 9.90 10.00 9.85 9.55 9.25 8.95 8.65Zinc US$/ lb 1.04 0.93 0.83 0.88 0.92 0.96 0.99 1.01 1.04 1.05 1.04 1.01 0.99 0.97Gold US$/oz 1,110 1,162 1,200 1,175 1,145 1,115 1,085 1,060 1,050 1,055 1,070 1,090 1,100 1,085Silver US$/oz 16.9 17.7 18.0 17.9 17.7 17.4 17.1 16.8 16.8 17.0 17.4 17.6 17.5 17.2Platinum US$/oz 1,565 1,597 1,558 1,588 1,613 1,604 1,584 1,559 1,533 1,518 1,518 1,524 1,528 1,497WTI Crude US$/bbl 79 79 78 83 85 87 89 93 97 99 101 104 105 104Iron Ore Fines US$/t 60 120 150 145 155 160 160 155 150 145 140 135 130 120Iron Ore Lump US$/t 72 135 160 155 165 170 170 165 160 155 150 145 140 130Premium Coking Coal US$/t 128 200 225 240 260 260 270 270 260 255 250 245 240 240Steaming Coal US$/t 70 98 98 98 98 120 120 120 120 130 130 130 130 125Alumina US$/t 325 308 285 293 302 299 299 301 303 289 280 275 275 277Uranium US$/ lb 42 41 41 44 47 50 54 57 59 62 64 65 64 61A$/US$ US$ 0.90 0.88 0.86 0.89 0.91 0.93 0.94 0.93 0.91 0.89 0.87 0.85 0.80 0.75

27
Appendix: ANZ annual commodity price forecasts
Source: Bloomberg, ANZ
End of Period 2003 2004 2005 2006 2007 2008 2009 2010F 2011F 2012F 2013F 2014F 2015F LTunit
Copper US$/ lb 1.05 1.48 2.06 2.86 3.01 1.38 3.33 3.20 3.50 3.40 2.80 2.20 2.30 2.30Aluminium US$/ lb 0.72 0.89 1.03 1.28 1.07 0.68 1.00 0.94 1.00 0.92 0.94 0.98 1.00 1.00Lead US$/ lb 0.33 0.47 0.49 0.77 1.15 0.46 1.09 0.88 1.00 0.98 0.90 0.79 0.80 0.80Nickel US$/ lb 7.52 6.75 6.07 15.43 11.80 5.27 8.37 9.10 10.00 9.10 8.00 7.30 7.50 7.50Zinc US$/ lb 0.46 0.57 0.86 1.95 1.07 0.54 1.15 0.90 1.02 1.00 0.93 0.84 0.85 0.85Gold US$/oz 417 438 513 635 834 882 1,097 1,160 1,050 1,100 1,030 880 750 750Silver US$/oz 6.0 6.8 8.8 12.9 14.8 11.4 16.9 17.8 16.7 17.5 16.5 14.4 12.5 12.5Platinum US$/oz 814 860 965 1,118 1,526 935 1,466 1,611 1,544 1,528 1,411 1,173 1,000 1,000WTI Crude US$/bbl 33 43 61 61 96 45 79 85 95 105 95 84 85 85Iron Ore Fines US$/t 20 23 39 47 51 92 60 145 155 135 115 100 80 80Iron Ore Lump US$/t 25 29 50 59 65 128 72 155 165 145 125 105 90 90Premium Coking Coal US$/t 46 58 127 114 98 305 128 240 270 245 230 180 150 150Steaming Coal US$/t 27 45 53 53 56 125 70 98 120 130 125 115 90 90Alumina US$/t 340 405 585 205 360 225 305 296 304 274 280 292 300 300Uranium US$/ lb 14 21 36 72 90 54 45 45 58 65 58 52 50 50A$/US$ US$ 0.75 0.78 0.73 0.79 0.80 0.69 0.90 0.90 0.92 0.84 0.74 0.72 0.72 0.72
Average 2003 2004 2005 2006 2007 2008 2009F 2010F 2011F 2012F 2013F 2014F 2015F LTunit
Copper US$/ lb 0.81 1.30 1.67 3.06 3.24 3.16 2.34 3.16 3.39 3.54 3.05 2.45 2.29 2.30Aluminium US$/ lb 0.65 0.78 0.86 1.17 1.20 1.17 0.76 0.95 0.97 0.96 0.93 0.96 1.00 1.00Lead US$/ lb 0.23 0.40 0.44 0.58 1.17 0.95 0.78 0.88 0.95 1.01 0.94 0.84 0.80 0.80Nickel US$/ lb 4.37 6.28 6.71 10.96 16.87 9.58 6.65 9.15 9.54 9.66 8.51 7.66 7.48 7.50Zinc US$/ lb 0.38 0.48 0.63 1.48 1.48 0.85 0.75 0.92 0.97 1.03 0.96 0.89 0.85 0.85Gold US$/oz 364 410 445 604 697 873 973 1,162 1,101 1,066 1,071 956 821 750Silver US$/oz 4.9 6.7 7.3 11.6 13.4 15.0 14.7 17.6 17.2 17.2 17.1 15.5 13.5 12.5Platinum US$/oz 693 847 899 1,142 1,305 1,577 1,208 1,577 1,590 1,523 1,475 1,288 1,092 1,000WTI Crude US$/bbl 31 41 56 66 72 100 63 80 88 100 102 88 85 85Iron Ore Fines US$/t 19 22 35 45 50 81 68 119 158 143 120 105 88 80Iron Ore Lump US$/t 24 28 45 57 64 112 86 130 168 153 130 108 101 90Premium Coking Coal US$/t 47 55 110 117 102 253 172 198 265 253 235 196 165 150Steaming Coal US$/t 28 40 51 53 55 108 84 91 115 128 126 118 101 90Alumina US$/t 272 404 452 444 342 370 243 303 300 287 277 286 299 300Uranium US$/ lb 11 18 28 48 99 64 47 42 52 62 61 60 71 50A$/US$ US$ 0.65 0.74 0.76 0.75 0.84 0.85 0.79 0.88 0.93 0.88 0.76 0.72 0.72 0.72
28
40
60
80
100
120
140
160
180
200
220
240
Jan-04 Jan-05 Jan-06 Jan-07 Jan-08 Jan-09 Jan-10
Newcastle spot price (CIF China) Qinhuangdao coal price (CIF domestic)
US$/tonne
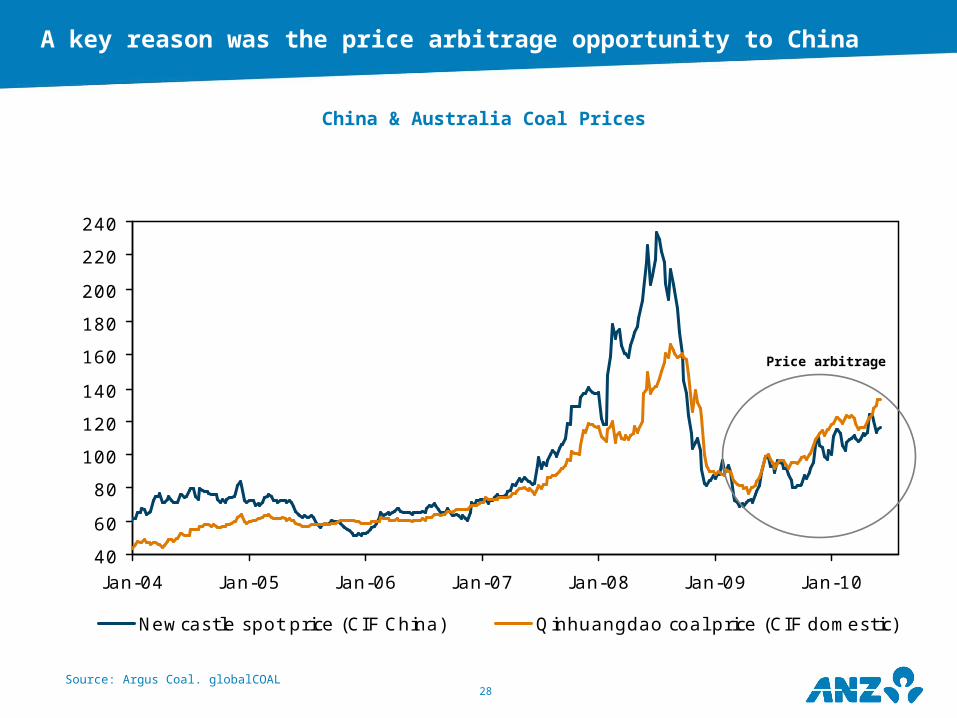
Source: Argus Coal. globalCOAL
China & Australia Coal Prices
A key reason was the price arbitrage opportunity to China
Price arbitrage
29
60
120
180
240
300
360
420
J an- 07 J ul- 07 J an- 08 J ul- 08 J an- 09 J ul- 09 J an- 10 J ul- 10 J an- 11
Shanghai spot Australia spot Australia contract
US$/t
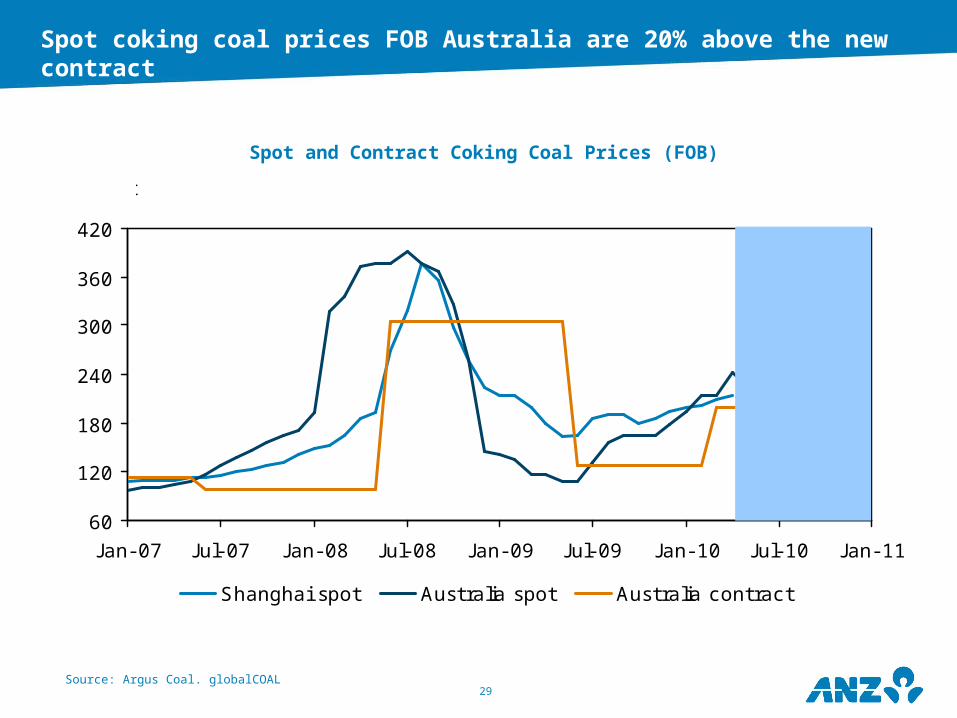
Source: Argus Coal. globalCOAL
Spot and Contract Coking Coal Prices (FOB)
Spot coking coal prices FOB Australia are 20% above the new contract
30
60
120
180
240
300
360
420
J an- 07 J ul- 07 J an- 08 J ul- 08 J an- 09 J ul- 09 J an- 10 J ul- 10 J an- 11
Australia Spot Coking Coal Price Contract Coking Coal Price
US$/t
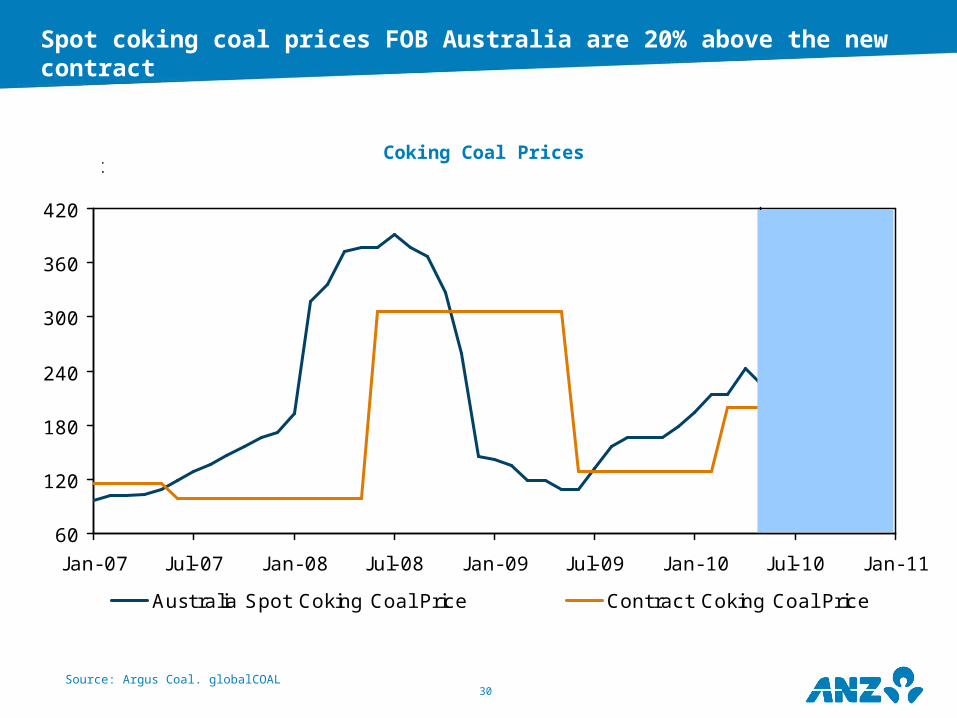
ANZ forecast - 240
J SM annoucement225
forecast
Source: Argus Coal. globalCOAL
Coking Coal Prices
Spot coking coal prices FOB Australia are 20% above the new contract

31Source: AME, Clarksons, ANZ
New Bulk Fleet Shipping Capacity
Low freight rates should spur stronger seaborne coal demand in 2010
0
20
40
60
80
100
120
98 99 00 01 02 03 04 05 06 07 08 09F 10F 11F 12F
Capesize Panamax Handymax Handysize
million dwt

32Source: globalCOAL, Bloomberg
Coal, Oil Prices & Freight Rates
Coal and oil price correlation improving
0
20
40
60
80
100
120
140
160
180
200
Jan-02 Jan-03 Jan-04 Jan-05 Jan-06 Jan-07 Jan-08 Jan-09 Jan-100
2,000
4,000
6,000
8,000
10,000
12,000
14,000
Newcastle Thermal Coal FOB Baltic Freight Rate (RHS)
US$/tonne pointsCoal Price & Freight Rates
0
20
40
60
80
100
120
140
160
180
200
Jan-02 Jan-03 Jan-04 Jan-05 Jan-06 Jan-07 Jan-08 Jan-09 Jan-100
20
40
60
80
100
120
140
160
Newcastle Thermal Coal FOB WTI Oil Price (RHS)
US$/tonne Coal Price & Oil Price US$/bbl
(1.0)
(0.8)
(0.6)
(0.4)
(0.2)
0.0
0.2
0.4
0.6
0.8
1.0
Jan-02 Jan-03 Jan-04 Jan-05 Jan-06 Jan-07 Jan-08 Jan-09 Jan-10
Newcastle FOB/WTI 12mth rolling correlation
Correlation coefficient Oil Price Correlation
(1.0)
(0.8)
(0.6)
(0.4)
(0.2)
0.0
0.2
0.4
0.6
0.8
1.0
Jan-02 Jan-03 Jan-04 Jan-05 Jan-06 Jan-07 Jan-08 Jan-09 Jan-10
Newcastle FOB/Baltic 12mth rolling correlation
Correlation coefficient Freight Rate Correlation

33
0
20
40
60
80
100
120
140
160
00 01 02 03 04 05 06 07 08 09 10F 11F 12F 13F 14F 15F-10%
0%
10%
20%
30%
40%
50%
60%
Thermal Imports Coking Imports % Thermal % Coking
m tonnes
India Thermal Coal & Coking Coal Imports
Source: AME, Wood Mackenzie, ANZ
XXX
Forecast
34
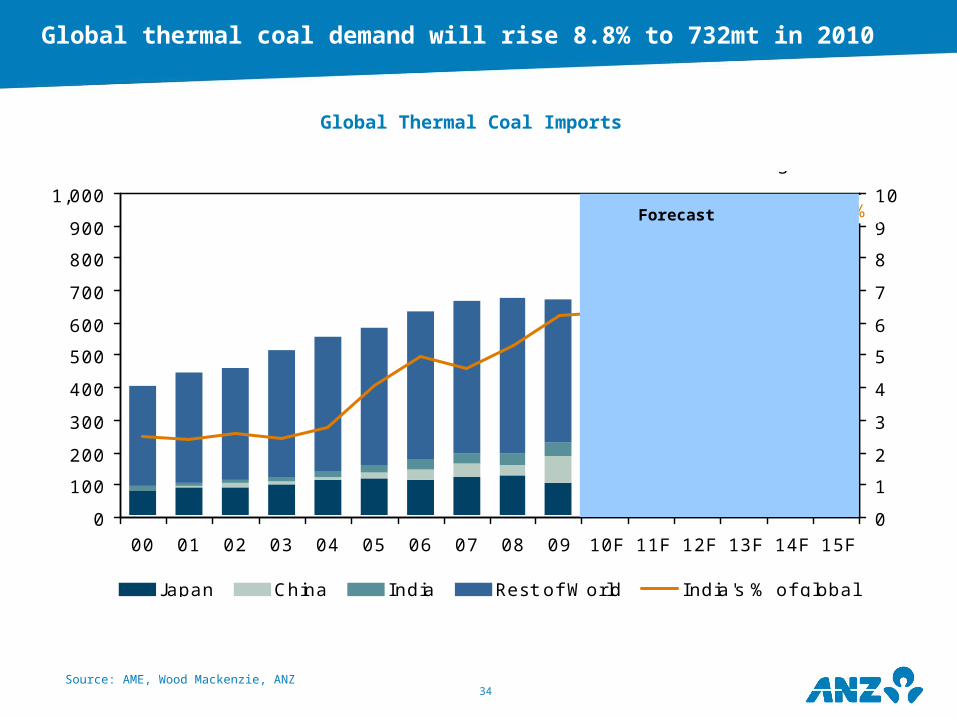
0
100
200
300
400
500
600
700
800
900
1,000
00 01 02 03 04 05 06 07 08 09 10F 11F 12F 13F 14F 15F0
1
2
3
4
5
6
7
8
9
10
Japan China India Rest of World India's % of global
% global sharem tonnes
6%
9%
Source: AME, Wood Mackenzie, ANZ
Global Thermal Coal Imports
Forecast
Global thermal coal demand will rise 8.8% to 732mt in 2010

35
0
50
100
150
200
250
300
350
400
00 01 02 03 04 05 06 07 08 09 10F 11F 12F 13F 14F 15F0
2
4
6
8
10
12
14
16
18
20
Japan China India Rest of the World China's % of global
m tonnes % global share
14%
19%
Source: AME, ANZ
Global Coking Coal Imports
Forecast
Global metallurgical coal demand will jump 14.2% in 2010

36Source: Bloomberg
Newcastle Port Shipment Destinations
Newcastle selling more to China
2006
J apan55%
S Korea13%
Malaysia2%
Taiwan14%
Other2%
China (PR)3%
India3%
EU2%
Mexico6% 2007
J apan56%
S Korea10%
Malaysia2%
Taiwan14%
Mexico6%EU
3%India3%
China (PR)3%
Other3%
2008
J apan61%
S Korea14%
Malaysia1%
Taiwan14%
Mexico1%
EU2%
India3%
China (PR)1%
Other3%
2009
J apan55%
S Korea17%
Malaysia1%
Taiwan10%
Other2%
China (PR)9%
India1%
EU2%
Mexico3%
37
•This document (“document”) is distributed to you in Australia and the United Kingdom by Australia and New Zealand Banking Group Limited ABN 11 005 357 522 (“ANZ”) and in New Zealand by ANZ National Bank Limited (“ANZ NZ”). ANZ holds an Australian Financial Services licence no. 234527 and is authorised in the UK by the Financial Services Authority (“FSA”). •This document is being distributed in the United States by ANZ Securities, Inc. (“ANZ S”) (an affiliated company of ANZ), which accepts responsibility for its content. Further information on any securities referred to herein may be obtained from ANZ S upon request. Any US person(s) receiving this document and wishing to effect transactions in any securities referred to herein should contact ANZ S, not its affiliates.•This document is being distributed in the United Kingdom by ANZ for the information of its market counterparties and intermediate customers only. It is not intended for and must not be distributed to private customers. In the UK, ANZ is regulated by the FSA. Nothing here excludes or restricts any duty or liability to a customer which ANZ may have under the UK Financial Services and Markets Act 2000 or under the regulatory system as defined in the Rules of the FSA.•This document is issued on the basis that it is only for the information of the particular person to whom it is provided. This document may not be reproduced, distributed or published by any recipient for any purpose. This document does not take into account your personal needs and financial circumstances. Under no circumstances is this document to be used or considered as an offer to sell, or a solicitation of an offer to buy.•In addition, from time to time ANZ, ANZ NZ, ANZ S, their affiliated companies, or their respective associates and employees may have an interest in any financial products (as defined by the Australian Corporations Act 2001), securities or other investments, directly or indirectly the subject of this document (and may receive commissions or other remuneration in relation to the sale of such financial products, securities or other investments), or may perform services for, or solicit business from, any company the subject of this document. If you have been referred to ANZ, ANZ NZ, ANZ S or their affiliated companies by any person, that person may receive a benefit in respect of any transactions effected on your behalf, details of which will be available upon request.•The information herein has been obtained from, and any opinions herein are based upon, sources believed reliable. The views expressed in this document accurately reflect the author’s personal views, including those about any and all of the securities and issuers referred to herein. The author however makes no representation as to its accuracy or completeness and the information should not be relied upon as such. All opinions and estimates herein reflect the author’s judgement on the date of this document and are subject to change without notice. No part of the author's compensation was, is or will directly or indirectly relate to specific recommendations or views expressed about any securities or issuers in this document. ANZ, ANZ NZ, ANZ S, their affiliated companies, their respective directors, officers, and employees disclaim any responsibility, and shall not be liable, for any loss, damage, claim, liability, proceedings, cost or expense (“Liability”) arising directly or indirectly (and whether in tort (including negligence), contract, equity or otherwise) out of or in connection with the contents of and/or any omissions from this communication except where a Liability is made non-excludable by legislation.•Where the recipient of this publication conducts a business, the provisions of the Consumer Guarantees Act 1993 (NZ) shall not apply..
Important NoticeAustralia and New Zealand Banking Group Limited is represented in:AUSTRALIA by:Australia and New Zealand Banking Group Limited ABN 11 005 357 52210th Floor 100 Queen Street, Melbourne 3000, AustraliaTelephone +61 3 9273 6224 Fax +61 3 9273 5711UNITED KINGDOM by:Australia and New Zealand Banking Group LimitedABN 11 005 357 52240 Bank Street, Canary Wharf, London, E14 5EJ, United KingdomTelephone +44 20 3229 2121 Fax +44 20 7378 2378
UNITED STATES OF AMERICA by:ANZ Securities, Inc. (Member of NASD and SIPC)6th Floor 1177 Avenue of the AmericasNew York, NY 10036, United States of AmericaTel: +1 212 801 9160 Fax: +1 212 801 9163NEW ZEALAND by:ANZ National Bank LimitedLevel 7, 1-9 Victoria Street, Wellington, New ZealandTelephone +64 4 802 2000
Disclaimer