Embed Size (px)
Citation preview
at SciVerse ScienceDirect
Journal of Cleaner Production 47 (2013) 490e503
Contents lists available
Journal of Cleaner Production
journal homepage: www.elsevier .com/locate/ jc lepro
Choosing cleaner and safer production practices througha multi-criteria approach
V. Laforest, G. Raymond, É. Piatyszek*
Institut Henri Fayol, École des Mines de Saint-Étienne, Saint-Étienne, 158 Cours Fauriel, 42023 Saint-Étienne Cedex 2, France
a r t i c l e i n f o
Article history:Received 7 February 2012Received in revised form22 October 2012Accepted 23 October 2012Available online 28 November 2012
Keywords:Cleaner and safer productionIntegrated approachDecision-makingMulti-criteria analysisMetal finishing
* Corresponding author. Tel.: þ33 477 426 621; faxE-mail addresses: [email protected] (V. La
(É. Piatyszek).
0959-6526/$ e see front matter � 2012 Elsevier Ltd.http://dx.doi.org/10.1016/j.jclepro.2012.10.031
a b s t r a c t
Through the international (Convention) and European (Industrial Emissions Directive) legislations,industries have to apply preventive measures according to the Best Available Technique (BAT) concept orcleaner production (CP) strategies. Many technical solutions exist to conform, but the major stake is toassess the overall effect or impact of the implementation of a technique on the installation. Severalmethods have been developed based on LCA or carbon balance methodologies, but they lack the tech-nical, economical and social criteria, which are aspects that should be taken into account when choosingcleaner and safer production practices. This paper presents a decision-making tool based on a multi-criteria analysis approach, likely to encourage manufacturers to implement cleaner and safer produc-tion practices in the metal finishing sector. First, a systemic analysis of the industrial facility and itsenvironment is used to identify 15 criteria structured in a hierarchical pattern. These criteria representthe targets which could potentially impacted by a cleaner and safer production practice: for example,water, soil, air, but also the environment of the workstation of an operator, the production processes, etc.Using these 15 criteria, users can then assess up to 86 practices selected in particular in the BREF reportdealing with Metal Finishing. Thus, this tool enables the practices the most adapted to a particularcompany to be chosen not only on financial criteria, but also on a social, environmental and technicalview.
� 2012 Elsevier Ltd. All rights reserved.
1. Introduction
With a view to restoring the balance of production e
consumption/health e environmental, the concept of cleanerproduction was introduced by the United Nations EnvironmentProgramme (UNEP) in 1989 in response to the logic of sustainableproduction and consumption (UNEP, 2001). This concept becamea program of action with two specific objectives:
- Improving eco-efficiency of production in the short andmedium term (one might see this as an optimization ofproduction systems using current technical knowledge) and,
- A long-term dematerialization
Globally, the process of adopting cleaner technologies is part ofthe sustainable development policy defined in Agenda 21, adoptedin Rio de Janeiro in 1992, in that it promotes and encourages the
: þ33 477 426 633.forest), [email protected]
All rights reserved.
adoption of new manufacturing processes that make scale econo-mies of both raw materials and energy, and are cleaner with regardto environmental protection and adjacent populations.
Agenda 21(UNCED, 1992) whose overall goal is to “restructurethe decision-making process to fully integrate socioeconomic andenvironmental issues and get a wider public participation” (art.8.3), defined in Chapters 30 and 34, on the one hand, the role ofindustry and trade for sustainable development (i.e. in promotingcleaner production) and, on the other hand, their principles ofAction to achieve this.
In addition, Section 34 on the Transfer of environmentally soundtechnologies, cooperation and capacity building defined as a fav-oured policy the transfer of “environmentally sound technologies”(awkwardly translated “environmentally sound” or “ecotechnolo-gies” in French). They are linked, by definition, to the principle ofpromoting the use of prevention technologies and thereforecleaner technologies, but they covered end-of-pipe solutions.Nevertheless, they are considered as a fundamental mechanism ofa cleaner and sustainable development.
For more than 15 years, high polluting industries are concernedby a European directive on Integrated Pollution Prevention andControl, also knownas the IPPCdirective. OnNovember 24, 2010, the

V. Laforest et al. / Journal of Cleaner Production 47 (2013) 490e503 491
European Parliament adopted the Directive 2010/75/UE relative tothe Industrial Emissions (IED). Integrating six previous directives, itincludes nowadays the IPPC Directive. General principles of the IPPCdirective have been retained for the IED, notably concerning theintegrated approaches, the flexibility principle, the participativeprinciple and the key principle of the use of the performance of BestAvailable Techniques (BAT).
Despite the evolution of the European regulation (from IPPC toIED), priority is given to the reduction at the source as much aspossible by taking into account the specificity of the organisationand the media in which it is implemented. One theoretical conceptassigned to the application of the priority of the IED is the conceptof cleaner production (CP) (Laforest, 2008; Polders et al., 2012).
Moreover, none methodology is proposed to help decisionmakers in the choice procedure of cleaner production strategy.After having presented the context, the existing methodology andthe multi-criteria theory, this article proposed to present a multi-criteria analysis method to support industrialists in their decisionprocedures.
2. Best available techniques, cleaner production strategiesand their assessment procedures
The principle of best available techniques (BAT), as defined bythe IPPC directive has become a significant issue for the industry todeal with, and the implementation of this Directive actuallycompels companies to apply BAT. The BAT principle is defined asbeing “themost effective and advanced stage in the development ofactivities and their methods of operation which indicate the prac-tical suitability of particular techniques for providing in principlethe basis for emission limit values designed to prevent and, wherethat is not practicable, generally to reduce emissions and theimpact on the environment as a whole” (Directive, 2008).
The terms “best”, “available” and “techniques” are detailed asfollows:
➢ ‘techniques’ shall include both the technology used and theway in which the installation is designed, built, maintained,operated and decommissioned,
➢ ‘available’ techniques shall mean those developed on a scalewhich allows implementation in the relevant industrialsector, under economically and technically viable conditions,taking into consideration the costs and advantages, whetheror not the techniques are used or produced inside theMember State in question, as long as they are reasonablyaccessible to the operator, and
➢ ‘best’ shall mean most effective in achieving a high generallevel of protection of the environment as a whole.
This definition is reinforced in Appendix IV of the IPPC Directivewith 12 considerations to be taken into account for the selection ofBATs. Unfortunately, this information does not seem to be suffi-ciently clear to be taken into account for the environmentalperformance assessment of techniques with regard to BATs.
Otherwise, the cleaner production principle involves thecontinuous use of industrial processes and products to increaseefficiency and to diminish their impact on humans and theenvironment.
Both BATs and CP represent viable preventive environmentalapproaches for the reduction of pollution at the source. These twoconcepts are more or less the same. In application of the principlesof cleaner production, the definition of BATs corresponds at first toprevention pollution techniques. Only when reduction at thesource is not practicable, curative techniques (i.e. end-of-pipetechniques) can be considered as BATs (Polders et al., 2012). Then
the greatest difference is that an end-of-pipe solution (for instance,a wastewater treatment plant) can be a BAT but not a CP strategy(Laforest, 2008).
Therefore, the concept of cleaner production applies to actionswhich aim at reducing pollution upstream of processes and serviceswith a view to reduce the impact on man and the environment. Theability of cleaner production practices to decrease the pressureexerted on the environment by human activities, improveproduction processes and generate profit has already beendemonstrated (Giannetti et al., 2008; Kjaerheim, 2003). However,and although clean technologies are really interesting, very fewapplications exist today, and manufacturers show very littleconcern for the environment (Laforest, 2008). A recent surveyconducted with French managers of companies with less than 250workers illustrated that even though they feel concerned by envi-ronmental protection (82%), 72% have not taken any action in thisfield and do not intend to do so (Gault, 2009). Both ignorance ofenvironmental impact and the fact that impact assessment toolsand decision-making tools are not readily available may account forsuch a disinterest in cleaner production strategies. According toGault (Gault, 2009), the environmental decision-making stage veryoften depends on the manager’s personal vision (52% of surveyedmanagers) (Kabongo, 2004). It is also mostly based on financialcriteria.
And yet deciding to implement cleaner production practicescovers a number of specific features
- A multi-criteria approach; cost is not the only decisive crite-rion. Other criteria such as the impact of the technology onwater, the level of maintenance actions, or the workingconditions are also essential to control the impacts of thetechnique used.
- Decisions are made by many actors who may not always agree,like the ordering party, manufacturers, experts, financers, andeven customers.
- A large number of cleaner and safer production (CSP) practicesdo exist, relating to processes, products and how to implementthem.
Today, many environmental assessment tools exist whose scopemay exceed the physical limits of an industrial facility. For example,the Life Cycle Assessment methodology helps to quantify a set ofpotential environmental impacts all along the life of the systemstudied (ISO, 2006; Aissani, 2008; Styles et al., 2009; Valderramaet al., 2012). Other tools such as carbon balance or ecologicalfootprint propose environmental performances from one singlecriterion which is the aggregation of a set of indicators. Neverthe-less they take into account only environmental impacts even ifsocial and cost criteria are starting to be implemented in somestudies. Moreover, these method (LCA, carbon balance, ecologicalfootprint) need a lot of data which are often not available forassessment notably the characterization factors. Then industrialoperators have difficulties in assessing their impact as a wholethrough an integrated approach in terms of management proce-dures and technologies. Thus, operators need to identify otherrelevant, coherent, accessible and representative indicators withinthe general industrial context in order to identify an overallperformance level.
Nevertheless, many methodologies have been developed toconform to the IPPC/IE directive (Geldermann and Rentz, 2004;Dijkmans, 2000; Barros et al., 2007). However each of them isfocused on a specific activity because of the specificity of theorganization of each production system.
Our contribution to all these existing methodology is first of all,to link, by the decision-making tool developed, cleaner production

V. Laforest et al. / Journal of Cleaner Production 47 (2013) 490e503492
strategy expertise and best available technique reference docu-ments on a specific application and secondly, to take into account aswell, environmental, technical, economic and social effects. More-over, it is intended that this methodology be based on specific, localand real data in order to be as representative as possible of theeffect of existing studies on CP strategies.
Environmental assessment results are usually given by envi-ronmental impact assessments which illustrate the potentialimpact of the system under review on the environment. Never-theless, when implementing a cleaner production strategy, deci-sion makers want to have solid information on the effects onemissions, the operator behaviors, the economic issue and theproduct quality. This is why the assessment will bemore focused onenvironmental, technical, social and economic aspects than only onenvironmental impacts.
Literature with reference documents on best available tech-niques (BREF), national technical documents, scientific articles andothers demonstrate that a lot of technical solutions are available toaccess cleaner production or best available techniques. Consideringboth the numbers of potential criteria and available techniques, thechoice is not trivial. “Humans cannot keep the meanings of morethan seven (plus or minus two) alternatives in mind simulta-neously. Larger numbers encourage coding habits to form andallow preferences to develop” (Krippendorff, 2004). Resorting toa multi-criteria analysis is therefore essential to facilitate the use ofclean production practices within the industrial facility and toprovide information used for decision makers.
The purpose of this paper is to present and describe a decision-making tool to select CSP practices using the so-called Electremulti-criteria analysis approach. This paper will first briefly explainthe use of Electre I and will subsequently describe the method usedto facilitate the selection of CSP practices. Then an example ofa metal finishing SME will be given before the conclusions aredrawn.
Table 1Studied methods of multi-criteria analysis and their advantages and drawbacks.
Method Type Description A
WSM Total aggregation - Weighting sums -
MAUT - Explicit utility function to obtain anranking of option
-
UTA - Explicit utility function to obtain anranking of option
--
AHP - Hierarchical method of binarycomparison of elements to establishthe priority between options
-
-ELECTRE I Partial aggregation
(choosing problem)- Based on the upgrade of actions fromeach other based on ratings criteria.
--
-ELECTRE Iv - Based on the upgrade of actions from
each other based on performancecriteria.
--
-
ELECTRE Is - Based on the upgrade of actions fromeach other based on performancecriteria.
-
--
STEM Local iterativeaggregation
- Determination of effective action byminimizing the weighted distanceaugmented of Tchebycheff
-
VINCKE - Determination of effective action byminimizing the weighted distanceaugmented of Tchebycheff
--
3. Surface treatment facilities as a key-application
Surface treatment of metals or plastics aims to change thesurface properties of pieces for decoration and/or reflectivity,improve hardness, prevent from corrosion or improve electricalconductivity. Currently, the main areas of application are jewelers,automotive and transportation, packaging and microelectronics.
The market structure in volume is as follows: automotive 22%,construction 9%, food and drink containers 8%, electric industry 7%,steel semi product 7%, electronic industry 7%, industrial equipment5%, aerospace industry 5%, unspecified 30% (BREF STM, 2006).
In Europe, the surface treatment of metals and plastics is carriedout inmore than 18,300 installations, frommainly small ormediumenterprises to multinational corporations.
Our study is focused on the aqueous treatment, which is themostpolluting with respect to wastewater. For the surface treatment,a production line is composed of successive tanks filled in withchemical solutions or water, in which the products to treat areplunged. Treatment tanks are separated by rinsing tanks. These twotypes of tanks can accumulate pollution through the drag process,which produceswastewater. Used processwaters are often treated inon-site wastewater treatment plants (end-of-pipe solution). If thetreated effluent is conform to the threshold of the regulation (emis-sion limit values), the discharge is then released directly to surfacewaters, but it can also be discharged to municipal wastewater treat-ment plants. Although the industry has improved both its practice andinfrastructure in many areas, it is still the source of a significant numberof environmental impacts. For France, from 1992 to 2002, 1.2% of allserious industrial water pollution incidents were attributable to thissector, rising to 5% for ‘near misses’ (BREF STM, 2006).
Because of the technical, environmental, social and economicalstakes of this activity and its history in the Rhône-Alps region, wehave decided to focus our study on it.
dvantages Drawbacks
Simple use - Arbitrary assignment of weights- Compensation between criteria
Avoid arbitrary assignment of weights - Utility concept unclear- Rationality of the decision maker- Lack of realism
More realistic than MAUTAdmits the revision of the coherence
- Utility concept unclear
Intuitive and attractive method whichadmits quantitative and qualitativecriteria and relative or absolute values.Consistency check
- Subjectivity of the analysis- A maximum number of criteriato compare and decision makers
- Ranking reverseRealistic methodClear establishment of links betweenactionsReduce cycle problems
- Heaviness of calculation- Lack of result clarity- Use of marks
Realistic methodClear establishment of links betweenactionsData mastering
- Heaviness of calculation- Lack of result clarity- Less flexible than Electre Ibecause of the use of vetothresholds
Clear establishment of links betweenactionsData masteringCorrection of the brutality of theconcordance with indifference andpreference thresholds
- Heaviness of calculation- Lack of result clarity- Less flexible than Electre Ivbecause of the use of indifferenceand preference thresholds
Simple calculation steps - Modelling rigidity- Permanent dialogue with decisionmakers
Simple calculation stepsMore flexible than STEM
- Permanent dialogue with decisionmakers

Choosing actions
Choosing criteria
Weighting criteria
Establishing outranking
relations
Studying robustness
Establishing the assessment matrix
Establishing actions in relation to criteria
Fig. 1. The five steps to carry out Electre I.
V. Laforest et al. / Journal of Cleaner Production 47 (2013) 490e503 493
4. Theory: multi-criteria analysis method
When dealing with a multi-criteria approach, problems areessential when choosing a method (Saaty, 1984). According to thetype method defined by Bernard Roy, they can be choosing (a),ranking (b), or sorting (g) problems (Roy, 1991). In our case, wewould like to help industries choose the best way to reducepollution at the source by using an integrated approach. This situ-ation deals with problem a, i.e. one practice will be chosen amonga number of innovating practices.
Three kinds of multi-criteria analysis exist. The American onewidely used in the United States seeks to maximize a utility func-tion linked to each potential action. The “French approach”(developed exclusively by French researchers) consists in theacceptance of the incomparability and intransitivity of criteria. Andfinally, the local iterative aggregation approach proceeds by aniterative method to approximate the best solution among a largenumber of potential actions. Table 1 gathers several methods andtheir advantages and drawbacks: WSM, which seems to simplifytoo much, is not retained. The same happens to the MAUT and UTAmethods, which are based on unclear and non-realistic utilityconcepts. Also, local iterative aggregation methods are excludedbecause of the necessity to be on constant relation with the deci-sion maker for each iteration. Electre Is results from Electre I and IVby improving them, even if this innovation rigidifies the method.Thus, Electre I seems to be the most relevant method for ourobjective to choose the best cleaner production strategy.
Electre I is a simple, intuitive method that comes into thisassignment problem. It helps compare possible solutions to a givendecision-making issue containing several criteria (Bouyssou et al.,1992) and is made up of five main stages (shown in Fig.1).
Table 2Cleaner production strategies and examples given in the metal finishing sector (Laforest
Strategy Definition
Good practices Adopting management and operation measures intleakage, accidental spill of contaminants; enforce einstructions, etc.
Better process control Altering operation procedures, equipment instructimethods to improve process efficiency and reduceemissions.
Replacing incoming matters Using less polluting, less rare, less energy-consuminmaterials with a longer service life for manufacturi
Modification of processes Changing the existing process in order to improvereduce emissions
In-situ regeneration Re-using flows in the same process or in another pBy-product regeneration Turning waste into by-products that can be sold asChanging technical methods Replacing technical methods, operation sequence, s
to reduce emissions and waste during the productiModification of product Altering product characteristics to make product m
improve product lifetime, and reduce product impa
4.1. Choosing actions
The set of potential actions (named A) that may be selected bythe decision maker is first defined. A potential action (ai) is a real orfictive action that is temporarily deemed realistic by at least onedecision maker (Maystre et al., 1994).
4.2. Choosing criteria
According to Roy’s definition (Roy, 1991), criterion gj is anattribute of action ai; therefore, the consequences of the actionsmust be contemplated when choosing the criteria.
All of the criteria chosen represent family F which contains ncriteria {g1, g2, ., gn}.
However, a number of properties must be observed whenchoosing family F:
- Exhaustiveness: all of the problem aspects must berepresented.
- Cohesiveness: when two actions show similar performance forall criteria but one gj, the action showing the best gj will bepreferred by the decision makers
- Non-redundancy: a point of view must not appear severaltimes in the same criteria family retained (Maystre et al., 1994).
4.3. Establishing the assessment matrix
The judgment matrix must be set up with the greatest care, as itis a crucial aspect of the multi-criteria analysis. This matrix formsa crosstab in which A’s actions are in rows and F’s criteria are in
and Cikankowitz, 2006).
Example
ended to preventxisting operation
� Systematic closing of taps� Control and optimisation of storage of chemicals� Covering unused baths
ons for use, readingboth waste and
� Optimising rinsing parameters to improve rinsingparameter efficiency
� Setting up static mounting for hand-operated lines� Maintenance of rectifiers
g matters, use ofng processes
� Replacing cleaning with chlorinated solvents bywater-based cleaning solvents
efficiency and � Replacing static rinsing by spray rinsing
rocess � Using ion-exchanging resins to re-use process waterraw materials � Using an electrolysis method to recover noble metalsynthesis methodson stage
� Replacing electroplating by chemical deposit in vapourphase
ore functional,ct on environment.
No examples available in the metal finishing sector
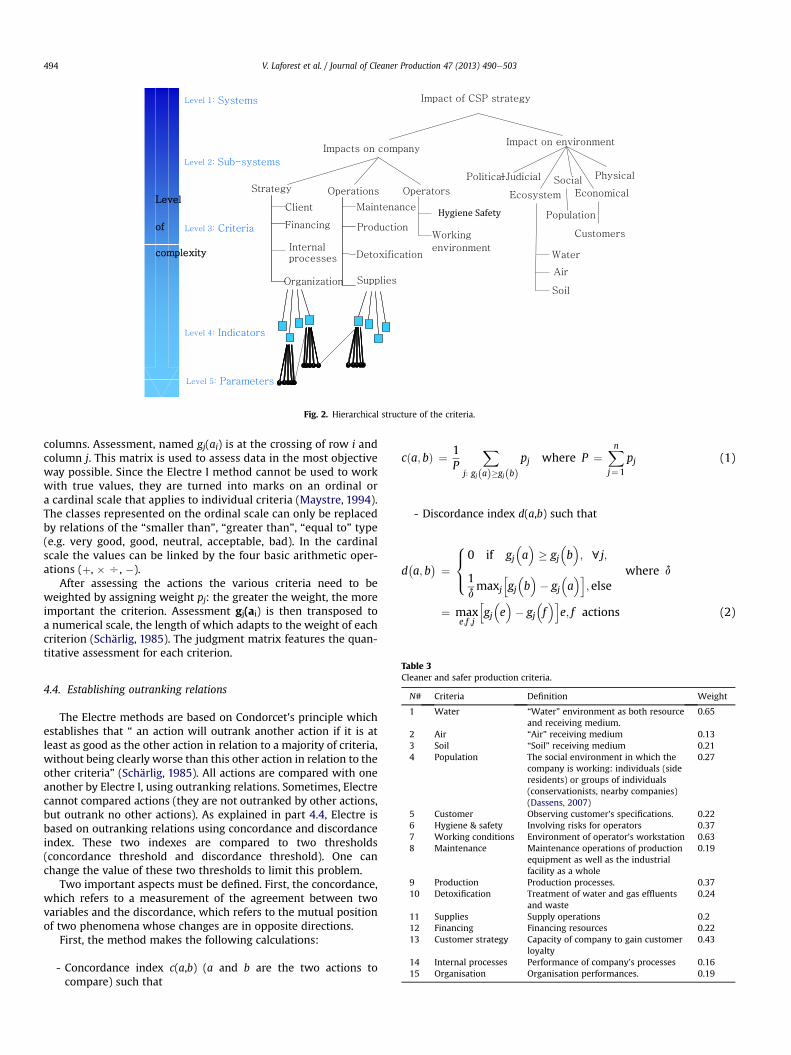
Fig. 2. Hierarchical structure of the criteria.
V. Laforest et al. / Journal of Cleaner Production 47 (2013) 490e503494
columns. Assessment, named gj(ai) is at the crossing of row i andcolumn j. This matrix is used to assess data in the most objectiveway possible. Since the Electre I method cannot be used to workwith true values, they are turned into marks on an ordinal ora cardinal scale that applies to individual criteria (Maystre, 1994).The classes represented on the ordinal scale can only be replacedby relations of the “smaller than”, “greater than”, “equal to” type(e.g. very good, good, neutral, acceptable, bad). In the cardinalscale the values can be linked by the four basic arithmetic oper-ations (þ, � O, �).
After assessing the actions the various criteria need to beweighted by assigning weight pj: the greater the weight, the moreimportant the criterion. Assessment gj(ai) is then transposed toa numerical scale, the length of which adapts to the weight of eachcriterion (Schärlig, 1985). The judgment matrix features the quan-titative assessment for each criterion.
Table 3Cleaner and safer production criteria.
N# Criteria Definition Weight
1 Water “Water” environment as both resourceand receiving medium.
0.65
2 Air “Air” receiving medium 0.133 Soil “Soil” receiving medium 0.214 Population The social environment in which the
company is working: individuals (sideresidents) or groups of individuals(conservationists, nearby companies)(Dassens, 2007)
0.27
5 Customer Observing customer’s specifications. 0.226 Hygiene & safety Involving risks for operators 0.377 Working conditions Environment of operator’s workstation 0.638 Maintenance Maintenance operations of production
equipment as well as the industrialfacility as a whole
0.19
9 Production Production processes. 0.3710 Detoxification Treatment of water and gas effluents
and waste0.24
11 Supplies Supply operations 0.212 Financing Financing resources 0.2213 Customer strategy Capacity of company to gain customer
loyalty0.43
14 Internal processes Performance of company’s processes 0.1615 Organisation Organisation performances. 0.19
4.4. Establishing outranking relations
The Electre methods are based on Condorcet’s principle whichestablishes that “ an action will outrank another action if it is atleast as good as the other action in relation to a majority of criteria,without being clearly worse than this other action in relation to theother criteria” (Schärlig, 1985). All actions are compared with oneanother by Electre I, using outranking relations. Sometimes, Electrecannot compared actions (they are not outranked by other actions,but outrank no other actions). As explained in part 4.4, Electre isbased on outranking relations using concordance and discordanceindex. These two indexes are compared to two thresholds(concordance threshold and discordance threshold). One canchange the value of these two thresholds to limit this problem.
Two important aspects must be defined. First, the concordance,which refers to a measurement of the agreement between twovariables and the discordance, which refers to the mutual positionof two phenomena whose changes are in opposite directions.
First, the method makes the following calculations:
- Concordance index c(a,b) (a and b are the two actions tocompare) such that
cða;bÞ ¼ 1P
Xpj where P ¼
Xnpj (1)
j: gjðaÞ�gjðbÞ j¼1
- Discordance index d(a,b) such that
� �8><0 if gj
�a�� gj
�b�; cj;
d a; b ¼ >:1dmaxj
hgj�b�� gj
�a�i
; elsewhere d
¼ maxe;f ;j
hgj�e�� gj
�f�i
e; f actions (2)

Table 4Extract of CSP practices e qualitative assessments.
Practices Description Criteria
Water Air Soil Population Customer Hygiene & safety
Replacement of chromium (VI)passivation layers by chromium(III) conversion coatings (Cr2O4
2�)
Chromium (VI) formulationreplaced by chromium(III) formulation. Replacementof chromium (VI) is recommendedby regulations
Reduction of toxicityon environment
Reduction of airpollution treatmentrequirements,decreasing of chromicacid in workshop’sambient air andoutdoor.
Reduction of soilcontaminationrisks by Cr (VI)
Reduction toxicityon environment
Protection againstsimilar corrosion;greenish colourreplacing unpleasantyellow
Reduction of toxicityon work place; lesschromic acid inworkshop’s ambientair; very good
Replacement of \chlorinated solventcleaning by water-based cleaningsolvents or petroleum solvents
Acids and bases replacesolvents harmful forhumans and environment
Petroleum solventsare less harmful forenvironment, terpenesare biodegradable
Less VOC emissions Larger use of soil Positive imagewhen chlorinatedsolvents are notused
Weakened cleaningquality
Alkaline lyes lessharmful for manthan chlorinatedsolutions, low flashpoint of terpenes
Electrolysis Enables i) reduction atcathode (of cation deposit)and ii) oxidation at anode(destruction of anions) ofelectrolyte’s chemicalcompounds
Savings on waterconsumption; effluentscomplying to thresholds,Destruction of cyanidethrough electrolyticoxidation
Caution: productionof dihydrogen
e Possible productionof explosive mixtures(H2 and O2),destruction of cyanide
Recovery of cadmiumor noble metals; quality
Possible productionof explosive mixtures(H2 and O2),destruction of cyanide
Covering of unused baths or use offloating balls
Limits heat losses due toevaporation, thus reducingenergy consumption neededfor keeping bath at propertemperature
Reduces consumptionof water needed forreadjusting bath level
Reduces losses due toevaporation and shortgas emissions
Reduces risk offortuitouspollution of soil
Reduces risks ofharmful gas emissions
Has a positive influenceof part quality
Reduces toxicity ofwork placeenvironment, globaldecrease of risks
Stirring of process solution with air Bath storing is often necessary.Can be performed usingcompressed air
Necessary topping up ofbaths increases waterconsumption
Worsening of risk ofair jets, mist andvapours of floatingparticles
Worsening risk offortuitous pollutionof soil
Noise pollution dueto air compressors
Reduces corrosion, provideshigher quality and betterdistribution of deposits
Worsening of riskof air jets, mist andvapours of floatingparticles
V.Laforestet
al./Journal
ofCleaner
Production47
(2013)490
e503
495

Table 5Marking system used to turn qualitative assessments into semi-qualitativeassessments.
Mark Meaning Rule
A Very good More than one positive impactProblem totally solved
B Good One positive impactC Rather good No particular data, but trend rather good
Positive impact seems to prevailD Neutral No impactE Average No particular data, but trend rather bad
Negative impact seems to prevailF Bad One negative impactG Very bad More than one negative impact
Table 7Numerical values vs. scales.
Mark 0e10 Scale 2e8 Scale 3e7 Scale
V. Laforest et al. / Journal of Cleaner Production 47 (2013) 490e503496
Comparing the indices to the concordance threshold bc (rather big)and a discordance threshold bd (rather small) helps express thesmallest concordance level required and the biggest acceptablediscordance level. The outranking relation is as follows:
aSb if ; and only if
8<:
c�a; b
� � bcd�a; b
� � bd (3)
The result of outranking (the so-called Electre core) is thenmade upof outranking actions that are not outranked by any other coreaction.
4.5. Studying robustness
Finally, a sensitivity analysis is performed in order to study thestability of the results obtained. To this end, each parameter isvaried to determine in which range of values the result (e.g. Electrecore) remains unchanged. The method consists in repeating theoriginal multi-criteria analysis and varying first individually, thencollectively the values assigned initially to the various parameters(weight, scale, indices, etc.). The sensitivity analysis will be the baseof the robustness analysis, which in turn will help determine theresult’s validity range and set up an operating recommendation. Ifno result alteration is observed when varying the parametersaround their initial value, then the results are not altered; therecommendation is said to be robust (Främling,1996;Maystre et al.,1994).
5. Calculation: using Electre I to work out a decision-makingtool for choosing CSP practices
This section presents the development of the decision-makingtool for choosing CSP for metal finishing facilities. As alreadyexplained in the previous section, the Electre I method consists offive different stages, whose detailed application is described below.These stages correspond to the steps of the methodology leading tothe decision-making tool.
5.1. Choosing potential actions
Many cleaner and safer production practices are availabletoday. Each practice can be considered as a potential action. The
Table 6Amplitude of scale vs. criterion’s weight.
Weight of the criterion pj 0.6 > pj > 1 0.3 < pj < 0.6 0 < pj < 0.30Amplitude of the corresponding
scale0e10 2e8 3e7
most common cleaner practices set up in the metal finishingsector have been listed, mostly in the BREF STM (SurfaceTreatment of Metals and Plastics), a European technical guid-ance report dealing with Metal Finishing. Moreover, theproduction practices can be sorted according to 8 cleanerproduction strategies (Good practices, Better process control,Replacing incoming matters, Modification of processes, In-situregeneration, By-product regeneration, Changing technicalmethods, Modification of product) (Lanteigne and Laforest,2007). Both strategies and examples of application in themetal finishing sector are shown in Table 2.
The practices were selected based on their recursion in indus-trial applications, as well as on the availability of the data used toassess them. Thus, 86 practices were selected. The “productmodification” strategy was not taken into account as it is rarelyimplemented in the metal finishing sector. Also, this strategydepends on the type of product and company, which limits theadaptability of the method. The same is true for the “in-situregeneration” and “by-product regeneration” strategies that werecombined into a single “regeneration” strategy, for very few CSPpractices have been listed in terms of by-product re-use.
5.2. Choosing criteria
As said in paragraph 2.2, the consequences of the actions takenneed to be considered when choosing the criteria (Roy, 1991). Asystemic analysis served as a basis for drawing up the criteria. Thepurpose of the systemic analysis was first to analyse the industrialfacility and its environment, and then to identify the targets, whichwould potentially be impacted by a CSP practice (Raymond et al.,2008).
The systemic modelling of the enterprise and its environmenthas highlighted the sub-systems susceptible to be impacted by VSPpractices. To determine the impact level, it is necessary to measurethem with criteria. The latest must reflect the completeness of thepotential impacts. Identification of CSP criteria is based notably onthe use of the MOSAR method used in risk sciences for hazardoussituation. Then, criteria identified must be completed with theseconsidered for normal operating.
Then a functional analysis has been carried out. SADT methodhas been used because it is founded on a systemic approach and useflux diagrams. This representation has allowed to put forward thecomplexity of the system studied and to complete the list ofcriteria.
Then, to develop the sub-system called “strategy”, authors haveused the Balanced Score Card method proposed by Kaplan andNorton (Kaplan and et Norton, 1996).
Then fifteen criteria were deemed relevant for choosingcleaner and safer production practices. The 15 criteria werestructured in a hierarchical pattern, as shown in Fig. 2 (Raymondet al., 2008).
Of course these criteria are not equivalent and therefore have tobe weighted. According to Styles and Ahlroth, several weighting
A 10 8 7B 8.33 7 6.33C 6.66 6 5.66D 5 5 5E 3.33 4 4.33F 1.66 3 3.66G 0 2 3

Table 8Application example e replacing chromium (VI) passivation layers by chromium (III) conversion coatings.
Criteria Water Air Soil Population Customer Hygiene & safety
Criterion weight 0.65 0.13 0.21 0.27 0.22 0.37Associated scale 0e10 3e7 3e7 3e7 3e7 2e8Qualitative assessment Less toxicity
on environmentReduction of air pollutiontreatment requirements,decreasing of chromicacid in workshop’s ambientair and outdoor
Less soilcontaminationrisks by Cr (VI)
Less toxicityon environment
Protectionagainst similarcorrosion; greenishcolor replacingunpleasant yellow
Less toxicity onwork place; lesschromic acid inworkshop’sambient air; verygood
Semi-qualitativeassessment
B A B B E A
Quantitative assessment 8.33 7 6.33 6.33 4.33 8
V. Laforest et al. / Journal of Cleaner Production 47 (2013) 490e503 497
methods can be applied. We have chosen the panel weightingmethod which allows to gathered stakeholder opinion and exper-tise to weight criteria (Styles et al., 2009; Ahlroth et al., 2001). Tothis end, a questionnaire (Appendix 1) was sent to about 20 experts(metal finishing manufacturers, DRIRE inspectors (Regional Direc-torate for Industry, Research and Environment), researchers, etc.).The questionnaire was exploited using Saaty’s analytic hierarchicprocess (Saaty, 1984). Each criterionwas assigned aweight that wasrepresentative of the advice of the professionals and experts of theindustrial sector. The various CSP criteria and their respectiveinitials weights assigned through expert’s analysis are shown inTable 3.
Ø
Ø
Ø
Ø
P1 , P3
P1 , P3
P1, P3, P8
P1, P3, P8, P11, P13
P1, P3, P8, P11, P13
A-(P6 & P14)
A-(P6 & P14)0
0.1
0.2
0.3
0.4
0.50.5 0.6 0.7 0.8 0.9 1
dis
co
rd
an
ce
th
re
sh
old
concordance threshold
Fig. 3. Varying concordance and discordance thresholds simultaneously to changecore value.
5.3. Establishing the assessment matrix
Because it is not possible to quantitatively evaluate the wholeimpact criterion due to a lack of available and free data, we proposea complete qualitative assessment.
The 86 CSP practices retained in relation to the 15 criteria wereassessed in three steps. The first step consisted in assessing thepractices in terms of quality; the second step turned the qualitativeassessments into quantitative assessments. The third step was usedfor evaluating the assessment-related uncertainties.
U Qualitative Assessment
The qualitative assessment identifies the potential impacts(both positive and negative) of each one of the practices towardsthe 15 criteria retained. Impact identification rests upon a biblio-graphic study of the techniques listed in the Metal finishing BREFreport. The data were completed by in-situ case studies anda report of experts. An extract of the qualitative assessment matrixis shown below.
U Quantitative Assessment
Quantitative assessments (marks or values) are required by theElectre I method to provide outranking relations. Qualitative datamust therefore be turned into marks as objectively as possible.Different problems came out in the process:
- The data availablewas not always quantifiable. For example, for“bath covering e water” (Table 4), the qualitative assessmentread as follows: “Reduces consumption of water needed forreadjusting bath level”. However, water reduction could not bequantified; a situation which is encountered in a large numberof practices.
- No reference practice existed to choose one practice againstanother practice.
- Some criteria were not documented; either the practice didnot have any impact on the criterion (e.g. the “electrolysis”practice e Soil criterion, Table 3), or the practice had anindirect impact (e.g. workshop toxicity was decreased by the“bath covering” practice, and working conditions of thecompany’s workers were improved. This in turn may lead toimproving company’s productivity). Here, not documentingthe criteria does not mean that an indirect preference towardsthe criterion does not exist.
A marking system (Table 5) was used to overcome the difficul-ties mentioned. A seven-level ordinal scalewas used to quantify thevarious assessment degrees.
Turning the semi-quantitative marks into values is basedon three numerical scales with variable amplitudes. Thenumerical marks will depend on the criterion-based scale, i.e.a scale that depends on the criterion’s weight (Schärlig, 1985)(Table 6).
In the scales, adapted from Scharlig’s work (Schärlig, 1985),assessment is refined by adding two additional levels (averageand rather good) (Table 7). The neutral value is kept at scalecentre. The other values are distributed evenly on two centreaxes.
An application example concerning the “Replacement of chro-mium (VI) passivation layers by chromium (III) conversion coat-ings” is shown in Table 8. The water criterion’s weight is 0.65. Theassociated scale has therefore the greatest amplitude. There isa single, positive impact for the qualitative assessment.
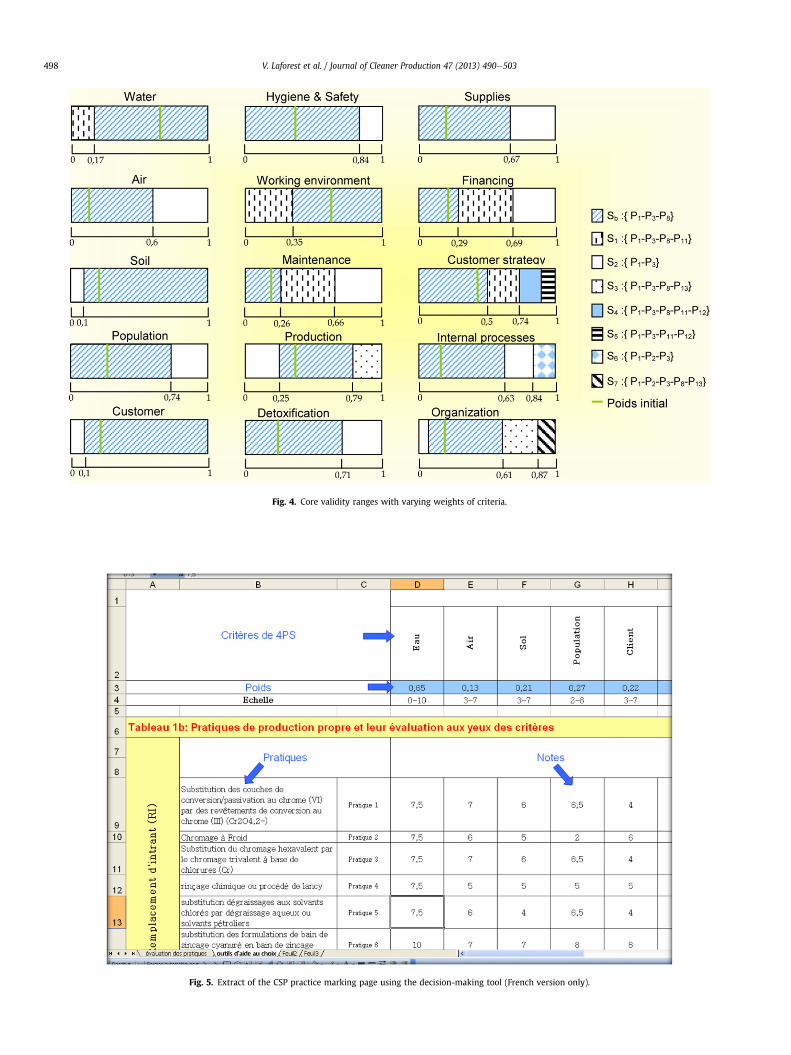
Fig. 4. Core validity ranges with varying weights of criteria.
Fig. 5. Extract of the CSP practice marking page using the decision-making tool (French version only).
V. Laforest et al. / Journal of Cleaner Production 47 (2013) 490e503498
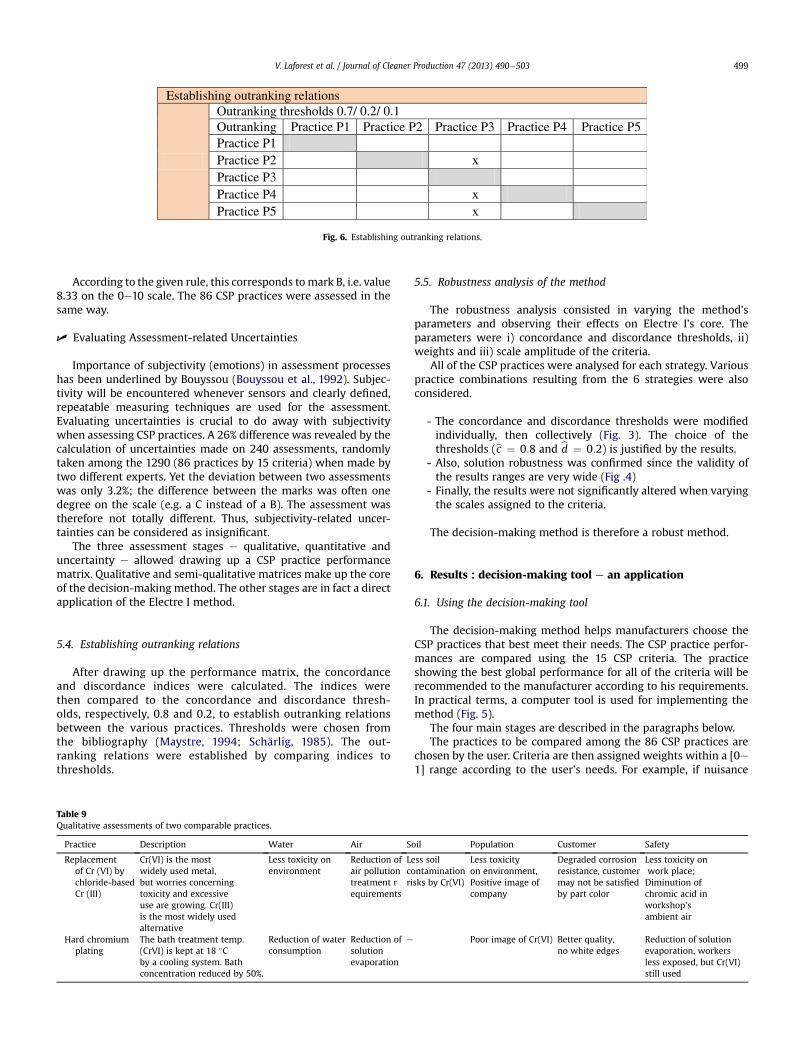
Establishing outranking relationsOutranking thresholds 0.7/ 0.2/ 0.1Outranking Practice P1 Practice P2 Practice P3 Practice P4 Practice P5Practice P1Practice P2 xPractice P3Practice P4 xPractice P5 x
Fig. 6. Establishing outranking relations.
V. Laforest et al. / Journal of Cleaner Production 47 (2013) 490e503 499
According to the given rule, this corresponds tomark B, i.e. value8.33 on the 0e10 scale. The 86 CSP practices were assessed in thesame way.
U Evaluating Assessment-related Uncertainties
Importance of subjectivity (emotions) in assessment processeshas been underlined by Bouyssou (Bouyssou et al., 1992). Subjec-tivity will be encountered whenever sensors and clearly defined,repeatable measuring techniques are used for the assessment.Evaluating uncertainties is crucial to do away with subjectivitywhen assessing CSP practices. A 26% difference was revealed by thecalculation of uncertainties made on 240 assessments, randomlytaken among the 1290 (86 practices by 15 criteria) when made bytwo different experts. Yet the deviation between two assessmentswas only 3.2%; the difference between the marks was often onedegree on the scale (e.g. a C instead of a B). The assessment wastherefore not totally different. Thus, subjectivity-related uncer-tainties can be considered as insignificant.
The three assessment stages e qualitative, quantitative anduncertainty e allowed drawing up a CSP practice performancematrix. Qualitative and semi-qualitative matrices make up the coreof the decision-making method. The other stages are in fact a directapplication of the Electre I method.
5.4. Establishing outranking relations
After drawing up the performance matrix, the concordanceand discordance indices were calculated. The indices werethen compared to the concordance and discordance thresh-olds, respectively, 0.8 and 0.2, to establish outranking relationsbetween the various practices. Thresholds were chosen fromthe bibliography (Maystre, 1994; Schärlig, 1985). The out-ranking relations were established by comparing indices tothresholds.
Table 9Qualitative assessments of two comparable practices.
Practice Description Water Air S
Replacementof Cr (VI) bychloride-basedCr (III)
Cr(VI) is the mostwidely used metal,but worries concerningtoxicity and excessiveuse are growing. Cr(III)is the most widely usedalternative
Less toxicity onenvironment
Reduction ofair pollutiontreatment requirements
Lecori
Hard chromiumplating
The bath treatment temp.(CrVI) is kept at 18 �Cby a cooling system. Bathconcentration reduced by 50%.
Reduction of waterconsumption
Reduction ofsolutionevaporation
e
5.5. Robustness analysis of the method
The robustness analysis consisted in varying the method’sparameters and observing their effects on Electre I’s core. Theparameters were i) concordance and discordance thresholds, ii)weights and iii) scale amplitude of the criteria.
All of the CSP practices were analysed for each strategy. Variouspractice combinations resulting from the 6 strategies were alsoconsidered.
- The concordance and discordance thresholds were modifiedindividually, then collectively (Fig. 3). The choice of thethresholds (bc ¼ 0:8 and bd ¼ 0:2) is justified by the results.
- Also, solution robustness was confirmed since the validity ofthe results ranges are very wide (Fig .4)
- Finally, the results were not significantly altered when varyingthe scales assigned to the criteria.
The decision-making method is therefore a robust method.
6. Results : decision-making tool e an application
6.1. Using the decision-making tool
The decision-making method helps manufacturers choose theCSP practices that best meet their needs. The CSP practice perfor-mances are compared using the 15 CSP criteria. The practiceshowing the best global performance for all of the criteria will berecommended to the manufacturer according to his requirements.In practical terms, a computer tool is used for implementing themethod (Fig. 5).
The four main stages are described in the paragraphs below.The practices to be compared among the 86 CSP practices are
chosen by the user. Criteria are then assigned weights within a [0e1] range according to the user’s needs. For example, if nuisance
oil Population Customer Safety
ss soilntaminationsks by Cr(VI)
Less toxicityon environment,Positive image ofcompany
Degraded corrosionresistance, customermay not be satisfiedby part color
Less toxicity onwork place;Diminution ofchromic acid inworkshop’sambient air
Poor image of Cr(VI) Better quality,no white edges
Reduction of solutionevaporation, workersless exposed, but Cr(VI)still used

Table
10Weigh
tsassign
edto
criteria
intheresincase
study.
Criteria
Water
Air
Soil
Population
Custom
ers
Safety
Workingen
vironmen
tMaintenan
ceProd
uction
Detox
ification
Supplie
sCustom
ers’strategy
Finan
cing
Intern
alprocesses
Organ
ization
Weigh
t1
00
10
0.1
0.2
0.3
10
01
11
0.5
Scale
0e10
3e7
3e7
0e10
3e7
3e7
3e7
3e7
0e10
3e7
3e7
0e10
0e10
0e10
2e8
P1:Ev
aporation
10.00
3.66
5.00
1.66
7.00
3.66
5.00
6.33
6.66
4.33
4.33
8.33
0.00
5.00
4.00
P2:Ionex
chan
geresins
10.00
5.00
5.00
5.00
5.00
5.00
5.00
5.66
10.00
4.33
3.66
8.33
3.30
5.00
5.00
P3:Rev
erse
osmoses
8.33
5.00
5.00
5.00
6.33
4.33
5.00
6.33
10.00
5.66
6.33
5.00
8.33
6.66
7.00
P3: reverse osmosisP2: Ion- exchangeresins
P1: Evaporation
Fig. 7. Outranking graph (resins).
V. Laforest et al. / Journal of Cleaner Production 47 (2013) 490e503500
towards the population (Population criterion) is a major issue fora manufacturer who also does not want to invest too much money(Financing criterion), the heaviest weights will be assigned to thesetwo criteria. In the same time, the requirements towards the othercriteria will be decreased. As described in part 5.3, the semi-quantitative mark is turned into a value from the criterion-associated scale. The scale depends on the criterion’s weight, sothe quantitative value of the assessment will automatically beadjusted when modifying the criterion’s weight (B on [0e10] scales B on [3e7] scale).
The concordance and discordance thresholds will be modi-fied by the decision maker if he wants to tighten or loosenthe outranking conditions. Thus, the so-called “outranking”practices, which prove to be the best for a majority of criteria,are chosen by the decision-making tool. In the previousexample, the practices show a positive effect on nuisanceswhile being inexpensive. Outranking is shown by a cross ina table (Fig. 6). Here, Practices P2, P4 and P5 are outranked byPractice P3.
In order to fine-tune the choice between two or three prac-tices, qualitative assessment can be carried out by the decisionmaker, in order to assess the real impacts of the practices heintends to put to work. Such an action is not allowed by markassignment-based quantitative assessment. For example,a manufacturer has the choice between two practices, i.e. “hardchromium plating” and replacement of Cr(VI) by Cr(III)”, whichare outranking practices, but cannot be compared to each other.Comparing the qualitative assessments of both practices inTable 9 will help to decide that in terms of safety, reducing theamount of chromium acid in ambient air will have a moresignificant impact than reducing evaporation. Cr(VI) plating willthen be used.
6.2. An application: re-using effluents and reducing metalconcentration in waste
U Background of Study
The CSP decision-making tool was tested in metal finishingfacilities using an aqueous medium. Indeed, large quantities ofharmful chemicals and water are used in this industrial sector,making it a highly polluting sector.
Company A is located near the town centre. It specializes in themetal finishing of decorative parts (improved corrosion resistance,electric and mechanical characteristics) in various industrialsectors, e.g. ironmongery, medical equipment, fittings, automobileand aircraft industry.
Company A is equipped with a wastewater treatment plantworking continuously and using various waste treatment tech-niques (decyanation, dechromation, neutralisation, flocculation,pressure filter, chelating resins, etc.). Yet, metal concentration inwaste (mainly Zn2þ and Ni2þ) does not comply with the legis-lation in force. Also, the manufacturer wishes to regenerate theeffluents to reduce the consumption of treatment bath water,

V. Laforest et al. / Journal of Cleaner Production 47 (2013) 490e503 501
but waste quality cannot be ensured if waste metal concentra-tion is too high, thus preventing waste from being re-used.Indeed, pollution would be caused by the excessive content ofimpurities contained in the treatment baths. Therefore,the manufacturer wants to implement a technique likely toeliminate metal concentrations to comply with the legislationand re-use the treated effluents.
U Implementing the Method
Three different processes were used to eliminate the metalscontained in effluents whenever the treated water was to be re-used, i.e. evaporation, ion exchange and reverse osmosis. First,CPS criteria were assigned weights by the manufacturer(Table 10). Here, the essential factors were the cost (Financing),the quality of the parts to be treated with recycled water(Customer strategy) and the conformity of the rejected watereffluents (Water). Population, production and internal processeswere also important parameters. A number of criteria were nottaken into account by the manufacturer (Air, Soil, Customer,Detoxification, and Supplies).
The outranking thresholds are 0.8 and 0.2 for concordance anddiscordance respectively. The outranking graph obtained is shownin Fig. 7
Practice P1 (evaporation) was outranked by Practice P2 (ion-exchanging resins); Table 10 shows that P2 is greater than P1formost CSP criteria. Concordance is then verified: Practice P1 wasgreater than P2 only when Customer, Maintenance and Suppliescriteria were taken into account (italic). Now the differencebetween the assessments was too small to reverse outranking,therefore confirming P2 over P1. On the other hand, P3 (reverseosmosis) could not be compared to the other two practices.Table 9 shows that P3 assessments are better than P1 assess-ments for most criteria, especially for those whose weight isnull. P1 assessments are better than P3 assessments whenthree criteria are considered (Customer, Water, and CustomerStrategy). The Water and Customer Strategy criteria show a veryhigh weight. Therefore, the concordance condition cannot beestablished easily as the concordance index is equal to the sumof the weights of the criteria for which the outranking relationhas been verified, divided by the total weight sum. It alsoappears that the assessments show quite a big differencebetween one another; the non-discordance condition is thus notobserved (the discordance index being the largest differenceratio between the assessments and this maximum scale of thecriterion).
The decision-making tool concluded that these two practicescould not be compared. As we ever said, sometimes, Electrecannot compare actions (they are not outranked by otheractions, but outrank no other actions). In our case, the twothresholds of concordance and discordance index were fixedafter a sensitivity analysis (see Section 4.5) and seemed optimale so the situation doesn’t happen too frequently.
The graph shows that one of the practices can be eliminatedfrom the choice. However, a feasibility study must be conductedwhen coming to choose between P2 and P3: in the end, Company Adecided to use the ion exchanging resin process.
7. Discussion and conclusion
Implementing cleaner and safer production practices withina company can be impeded both by the number of practicesavailable and the difficulty to assess their global impact. Althoughmanufacturers are compelled to set up preventive measures and
clean technologies by French and European laws, no means areclearly available to choose the most adapted practices in oneparticular field.
This research work helps to choose CSP practices based on theElectre I multi-criteria analysis method. 86 CSP practices were firstchosen and were assessed using 15 CSP criteria. A qualitativeassessment was turned into a quantitative assessment in the formof marks. The calculation of the assessment uncertainties allowedavoiding the subjectivity factor inherent in qualitative assessments.Finally, the robustness of the method was tested successfully byvarying the initial values of the parameters (thresholds, weights,scales).
The CSPmethod uses a computer-assisted decision-making tool.This tool enables the practices the most adapted to a particularcompany to be chosen by comparing performances towards thevarious CSP criteria. This methodwas drawn up and validated in themetal finishing sector.
This methodology informs decision makers by comparing up to16 practices simultaneously. It constitutes a real decision-makingaid firstly by clarifying the needs of the industrialists in attrib-uting weights to criteria and, secondly, by identifying the mostaccurate practices. Nevertheless, the results must be completedwith a technical feasibility study. One weakness of this method isthe significance of the performance gains. Indeed, the methodhelps to describe the potential impacts, but does not offera quantitative assessment of them. For example, if a practice hasa good performance for the criterion “water”, it creates thequestion of the performance percentage where there is a real gainfor the industrialist. Then, this methodology could be enhanced byvalidating the value of each indicator for each cleaner productionstrategy by a larger panel of experts. Moreover, it could be inter-esting to work on an integrated quantitative environmentalimpact assessment (local and global impacts) to take into accountthe effect on the ecosystem and human body of each solution.Methodologies like LCA could be used.
The methodology is relatively generic. The transposition toanother activity sector is then feasible. Nevertheless, indicators andcleaner practices have to be adapted to the new sector studied. Forexample, the textile sector could be chosenbecause of its similaritiesto metal finishing industries (size of the enterprises, productionmeans, aqueous pollution generated, etc.). European textile BREFcould be used to determine indicators and select cleaner productionstrategies, as it was done for the metal finishing application.
This methodology has been developed to support decisionmakers in their choice by having a first selection of processeshierarchically ranked following the 15 criteria presented. The CSPdecision-making tool will of course never replace managers orexperts: it will rather make their choice easier according to theweight given to the various criteria. A technical and economicalfeasibility studymust be performed tomake sure the CSPmethod isconsistent with the strategy and means of the company.
Acknowledgments
We would like to thank the cluster of environment of theRhone-Alps Region for the funding given for this research. Wewould also want to thank the directors of the metal finishingindustry for their trust and our solid partnership.
References
Ahlroth, S., Nilsson, M., Finnveden, G., Hjelm, O., Hochschorner, E., 2001. Weightingand valuation in selected environmental systems analysis tools e suggestionsfor further developments. Journal of Cleaner Production 19, 145e156.

Appendix 1. Questionnaire for interview support
Appendix 1: Questionnaire for interview support
1.1. According to you, compared to the overall operations of a company, what is the importance ofeach function versus other functions? For example, how important do you rate the function of"supply" versus "production"?
OPERATIONS Supply Production maintenance DetoxificationSupply 1
Production 1maintenance 1
Detoxification
11
1
1.2. Do you think that one of the following four strategies available to the company is more decisive than another one for the development of its business?
SRATEGIES Financial Organisation Internal process Customer satisfactionFinancial 1
Organisation 1Internal process 1
Customer satisfaction
11
1
1.3. Do you think that, for the operators "Security" is more or less important that "work environment"?
OPERATORS Work environment SecurityWork environment 1
Security 1
1.4. For Metal Finishing sector, which impacts affect the most the ecosystem? ECOSYSTEM Water Air Soil
Water 1Air 1Soil
11
How do you rank the items below in their contribution to the proper functioning of the company?COMPAGNY Strategy Operators Operations
Strategy 1Operators 1Operations
11
component as far as impacts of the company on the environment are concerned?ENVIRONMENT Economic Ecosystem Social
Economic 1Ecosystem 1
Social1
1
Scales for indicatorsThe goal is to build scales for each indicator
2.1. To assess presenteeism (average proportion of time spent by employees per month) : does the following scale seems to you adequate?> 96%: very good85% to 96%: good<85%: Poor
Yes No, otherwise give a scale that seems most suitable
2.2. To assess the customer satisfaction, does the following scale seem to you adequate?<1% of claims: very satisfied<5% of claims: relatively satisfied<10% claim: neither satisfied nor dissatisfied> 10% of claims: relatively dissatisfied> 50% of claims: very dissatisfied
Yes No, otherwise give a scale that seems most suitable
2.3. For the turnover of equipment (the share of annual incomes reinvested in new equipment), does the following scale seems to you adequate?
<5% of annual incomes reinvested: low5% to 10% of annual incomes reinvested: good> 10% of annual incomes reinvested: strong
Yes No, otherwise give a scale that seems most suitable
V. Laforest et al. / Journal of Cleaner Production 47 (2013) 490e503502

V. Laforest et al. / Journal of Cleaner Production 47 (2013) 490e503 503
Aissani, L., 2008. Intégration des paramètres spatio-temporels et des risques d’ac-cident à l’analyse du cycle de vie: application à la filière hydrogène énergie et àla filière essence. Thèse sci. Saint-Etienne: ENSM-SE, 352 pp, pp. 237e253 (onlyin French).
Barros, M.C., et al., 2007. Integrated pollution prevention and control for heavyceramic industry in Galicia (NW Spain). Journal of Hazardous Materials 141,680e692.
Bouyssou, D., Duckstein, L., Goicoechea, A., Zionts, S., 1992. On Some Properties ofOutranking Relations Based on a ConcordanceeDiscordance Principle, MultipleCriteria Decision Making. Springer-Verlag, Berlin, pp. 93e106.
BREF STM, August 2006. Integrated Pollution Prevention and Control ReferenceDocument on Best Available Techniques For the Surface Treatment of Metalsand Plastics. European Commission, 546 pp.
Dassens, A., 2007. Méthode pour une approche globale de l’analyse des risques enenterprise. PhD thesis, 280 pp., available only in French.
Dijkmans, R., 2000. Methodology for selection of best available techniques (BAT) atthe sector level. Journal of Cleaner Production 8, 11e21.
Directive 2008/1/EC of the European Parliament and of the Council of 15 January2008 concerning integrated pollution prevention and control.
Främling, K., 1996. Modélisation et apprentissage des préférences par réseaux deneurones pour l’aide à la décision multicritère. PhD thesis.
Gault, G., 2009. Quelle perception de l’environnement chez les dirigeants de PME?e Résultats d’un nouveau sondage ADEME/TNS SOFRES; Colloque PM4E:Environnement et Maitrise de l’énergie; Paris, 17e18 mars 2009 (available inFrench).
Geldermann, J., Rentz, O., 2004. The reference installation approach for thetechno-economic assessment of emission abatement options and the deter-mination of BAT according to the IPPC-directive. Journal of Cleaner Production12, 389e402.
Giannetti, B.F., Bonilla, S.H., Silva, I.R., Almeida, C.M.V.B., 2008. Cleaner productionpractices in a medium size gold-plated jewellery company in Brazil: when littlechanges make the difference. Journal of Cleaner Production 16, 1106e1117.
ISO 14040, 2006. Standard Environmental Management e Life Cycle Assessment ePrinciples and Framework. AFNOR, Paris, 23 pp.
Kabongo, J., 2004. Intégrer économie et écologie: le cas de l’industrie canadienne.Vertigo 5, 1e12.
Kaplan, R., Norton, D.P., 1996. Linking the balanced score card to strategy. CaliforniaManagement Review 39 (1), 53e79.
Kjaerheim, G., 2003. Cleaner production and sustainability. Journal of CleanerProduction 13, 329e339.
Krippendorff, K., 2004. Content Analysis e an Introduction to Its Methodology,second ed. Sage Publications, London.
Laforest, V., 2008. Applying Best Available Technologies in EnvironmentalManagement Accounting?. In: From the Definition to an Assessment Method-ology., 5th EMAN Book “Environmental Management Accounting for CleanerProduction”, EMAN Springer, ISBN 978-1-4020-8912-1, 500 pp., pp. 29e48.
Laforest, V., Cikankowitz, A., 2006. French Legislative and Institutional Contexts:Application to the Metal Finishing Sectors, Zero Plus European Project Report,54 pp.
Lanteigne, R., Laforest, V., 2007. Specifications for an internet based clean tech-nology information support system for SMEs. Journal of Cleaner Production 15,409e416.
Maystre, L.Y., Pictet, J., Simos, J., 1994. Méthodes multicritères Electre: Description,conseils pratiques et cas d’application à la gestion environnementale. Pressespolytechniques et universitaires romandes, Lausanne.
Polders, C., Van den Abeele, L., Derden, A., Huybrechts, D., 2012. Methodology fordetermining emission levels associated with the best available techniques forindustrial waste water. Journal of Cleaner Production 29e30, 113e121.
Raymond, G., Piatyszek, E., Laforest, V., 2008, Reducing the environmental impact inthe metal finishing industry by employing cleaner and safer production strat-egies. In: Second International conference on Environmental Economics andinvestment assessment, Cadiz. 28e30 mai 2008.
Roy, B., 1991. The outranking approach and the foundations of ELECTRE methods.Theory and Decision 31, 49e73.
Saaty, T.L., 1984. Decision Making for Leaders. Les Editions ESF, Paris.Schärlig, A., 1985. Décider sur plusieurs critères, panorama de l’aide à la décision
multicritère. Presses polytechniques et universitaires romandes, Lausanne.Styles, David, O’Brien, Phillip, O’Boyle, Shane, Cunningham, Peter, Donlon Brian,
Jones Michael, B., 2009. Measuring the environmental performance of IPPCindustry: I. Devising a quantitative science-based and policy-weighted envi-ronmental emissions index. Environmental Science and Policy 12, 226e242.
UNEP, 2001. United Nation for the Environmental Program; cleaner production.Online at: www.unep.fr/pc/cp/understanding_cp/home.htm.
UNCED, 1992. Conférence des Nations Unies sur l’Environnement et le Dével-oppement. Report on the United Nation Conference on the Environment andthe Development. Rio de Janeiro, 3rd to 14th of June 1992. Online at: http://www.agora21.org/dd.html.
Valderrama, C., Granados, R., Cortina, J.L., Gasol, C.M., Guillem, M., Josa, A., 2012.Implementation of best available techniques in cement manufacturing: a life-cycle assessment study. Journal of Cleaner Production 25, 60e67.