Embed Size (px)
DESCRIPTION
This volume examines various aspects of the rebalancing process underway in China, highlighting policy lessons for achieving stable, sustainable, and inclusive growth.
Citation preview

I N T E R N A T I O N A L M O N E T A R Y F U N D
EDITORS
Anoop Singh, Malhar Nabar, and Papa N’Diaye
China’s Economy in Transition
From External to Internal Rebalancing
©International Monetary Fund. Not for Redistribution

© 2013 International Monetary Fund
Cover design: IMF Multimedia Services Division
Cataloging-in-Publication DataJoint Bank-Fund Library
China’s economy in transition : from external to internal rebalancing / editors, Anoop Singh, Malhar Nabar, and Papa N’Diaye. – Washington, D.C. : International Monetary Fund, 2013. p. ; cm.
Includes bibliographical references. ISBN: 978-1-48430-393-1 (paper)
1. China—Economic conditions. 2. Exports—China. I. Singh, Anoop. II. Nabar, Malhar. III. N’Diaye, Papa M’B. P. (Papa M’Bagnick Paté). IV. International Monetary Fund.
HC427.95.C45 2013
Disclaimer: The views expressed in this book are those of the authors and should not be reported as or attributed to the International Monetary Fund, its Executive Board, or the governments of any of its members.
Please send orders to:International Monetary Fund, Publication ServicesP.O. Box 92780, Washington, DC 20090, U.S.A.
Tel.: (202) 623-7430 Fax: (202) 623-7201E-mail: [email protected]
Internet: www.imfbookstore.org
©International Monetary Fund. Not for Redistribution

iii
Contents
Acknowledgments v
Contributors vii
Abbreviations xi
Introduction and Overview 1
PART I A SHIFT IN FOCUS: FROM EXTERNAL TO INTERNAL IMBALANCES
1 An End to China’s Imbalances? ..................................................................................9Ashvin Ahuja, Nigel Chalk, Malhar Nabar, Papa N’Diaye, and Nathan Porter
2 Investment in China: Too Much of a Good Thing? .......................................... 31Il Houng Lee, Murtaza Syed, and Liu Xueyan
3 China’s Rapid Investment, Potential Output, and Output Gap .................. 47Papa N’Diaye and Steven Barnett
4 Determinants of Corporate Investment in China: Evidence from Cross-Country Firm-Level Data .................................................................... 57Nan Geng and Papa N’Diaye
5 Interest Rates, Targets, and Household Saving in Urban China ................. 81Malhar Nabar
PART II IMPLICATIONS FOR CHINA’S TRADING PARTNERS
6 Implications for Asia from Rebalancing in China ..........................................107Olaf Unteroberdoerster
7 Investment-Led Growth in China: Global Spillovers .....................................115Ashvin Ahuja and Malhar Nabar
8 The Spillover Effects of a Downturn in China’s Real Estate Investment ......................................................................................................137Ashvin Ahuja and Alla Myrvoda
©International Monetary Fund. Not for Redistribution
iv Contents
PART III POLICY IMPLICATIONS
9 Chronicle of a Decline Foretold: Has China Reached the Lewis Turning Point? ................................................................................................157Mitali Das and Papa N’Diaye
10 How Pro-Poor and Inclusive Is China’s Growth? A Cross-Country Perspective ...................................................................................................................181Ravi Balakrishnan, Chad Steinberg, and Murtaza Syed
11 De-Monopolization toward Long-Term Prosperity in China .....................201Ashvin Ahuja
12 Transforming China: Insights from the Japanese Experience of the 1980s .................................................................................................................217Papa N’Diaye
13 The Next Big Bang: A Road Map for Financial Reform in China ...............243Nigel Chalk and Murtaza Syed
14 Summation ..................................................................................................................267Markus Rodlauer
Index ...........................................................................................................................................271
©International Monetary Fund. Not for Redistribution

v
Acknowledgments
The authors would like to express their gratitude to IMF colleagues whose work on China and Asia has been instrumental in shaping the chapters that appear in this volume, particularly Steve Barnett, Nigel Chalk, and Markus Rodlauer. The analysis presented here has also benefited from discussions with officials and ana-lysts in China, elsewhere in Asia, and in Washington, D.C.
We are grateful to Imel Yu and Alla Myrvoda for assistance with putting the volume together, and to Joe Procopio for editing the volume and coordinating its production.
The opinions expressed in this book, as well as any errors, are the sole respon-sibility of the authors and do not necessarily reflect the views of other members of the IMF staff, Asian authorities, or the Executive Directors and Management of the IMF.
©International Monetary Fund. Not for Redistribution

This page intentionally left blank
©International Monetary Fund. Not for Redistribution

vii
Contributors
Ashvin Ahuja is a Senior Economist in the IMF’s Asia and Pacific Department and leads the missions to the Lao People’s Democratic Republic. He covered China and Hong Kong SAR from 2010 to 2012. Before joining the IMF in 2010, Mr. Ahuja worked at the Bank of Thailand. He holds a PhD in econom-ics from the University of Minnesota.
Ravi Balakrishnan completed his PhD in economics at the London School of Economics. Since joining the IMF, he has worked on various countries, includ-ing the United States, as well as on the World Economic Outlook, before taking up his current position as the IMF’s Resident Representative based in Singapore. His policy and research interests cover labor and job dynamics, inflation dynamics, exchange rate dynamics and capital flows, and capital mar-kets and financial systems. His research has been published in the European Economic Review, the Journal of International Money and Finance, and IMF Staff Papers.
Steve Barnett is a Division Chief in the Asia and Pacific Department of the IMF. He has spent the better part of the past 10 years covering Asia, including serv-ing as Assistant Director at the IMF Office for Asia and the Pacific in Tokyo, Resident Representative in China, and Resident Representative in Thailand. Before joining the IMF in 1997, he earned his PhD in economics from the University of Maryland. He has a bachelor’s degree in economics from Stanford University, as well as a master’s degree in Russian and East European Studies, also from Stanford.
Nigel Chalk is Deputy Director in the Asia and Pacific Department and headed the IMF’s missions to China and Hong Kong SAR from 2008 to 2011. Before that, he worked on a range of emerging market countries, including Russia, the Republic of Korea, Brazil, and Argentina. He holds a master’s degree in eco-nomics from the London School of Economics and a PhD from the University of California, Los Angeles.
Mitali Das is a Senior Economist in the IMF’s Research Department. Before joining the Fund in 2009, Ms. Das taught at Columbia University from 1998 to 2006 and the University of California, Davis, between 2006 and 2009. At the IMF, she has worked in the Open-Economy Macroeconomics and Multilateral Surveillance divisions of the Research Department. She received a PhD in economics from the Massachusetts Institute of Technology in 1998.
Nan Geng is an Economist in the IMF’s European Department. Since joining the IMF, she has worked on a range of Asian and European economies, including China, and produced publications on inflation and monetary policy, exchange rate unification, deleveraging and credit growth, spillover, and fiscal adjustment
©International Monetary Fund. Not for Redistribution

viii Contributors
and debt sustainability. Ms. Geng, a Chinese national, holds a PhD in econom-ics from the University of California, Santa Cruz.
Il Houng Lee was the IMF’s Chief Resident Representative in Beijing, China, from 2010 to 2013. Mr. Lee joined the IMF through the Economist Program in 1989. Since then, he has worked in various departments, and his country assignments in Asia have included a wide range of economies including Japan, Thailand, Malaysia, the Philippines, and Vietnam. Before coming to China, he was an Advisor in the Asia and Pacific Department working as the mission chief on the Philippines. Mr. Lee has a BSc in economics from the London School of Economics, and a PhD in economics from Warwick University. He taught economics at Warwick University and at the National Economics University in Hanoi.
Liu Xueyan is a Senior Fellow in the Academy of Macroeconomic Research at the National Development and Reform Commission (NDRC) of China. Ms. Xueyan has a PhD in economics from Nankai University. Her contribution to this volume was co-authored with Il Houng Lee and Murtaza Syed, Resident Representatives in China, while she was a visiting scholar at the IMF office in Beijing.
Alla Myrvoda is a Research Analyst in the IMF’s Asia and Pacific Department, covering China, Hong Kong SAR, and Taiwan Province of China. Before join-ing the Fund in 2011, Ms. Myrvoda worked at the Urban Institute. She holds a master’s degree in economics from Johns Hopkins University.
Malhar Nabar is a Senior Economist in the IMF’s Asia and Pacific Department, covering China and Hong Kong SAR. He previously worked in the Regional Studies Division of the Asia and Pacific Region. His research interests are in financial development, investment, and productivity growth. Before joining the IMF in 2009, Mr. Nabar was on the economics faculty at Wellesley College. He holds a PhD in economics from Brown University.
Papa N’Diaye is Deputy Division Chief in the IMF Strategy, Policy, and Review Department. Before this, Mr. N’Diaye worked on the China, Japan, and Malaysia desks at the IMF. He studied at Sorbonne University, special-izing in macroeconomics and econometrics, and taught macroeconomics to undergraduate students at Dauphine University. Mr. N’Diaye has numerous publications on various topics, including monetary policy, asset prices, mac-roprudential policies, fiscal policy, and rebalancing growth in China.
Nathan Porter is Deputy Division Chief in the IMF’s Strategy, Policy, and Review Department. Previously he worked in the Asia and Pacific Department, covering China and Hong Kong SAR. Mr. Porter holds a PhD in economics from the University of Pennsylvania.
Markus Rodlauer is Deputy Director of the IMF’s Asia and Pacific Department. He was head of the team that prepared the 2012 and 2013 Article IV Consultations for the People’s Republic of China. His previous operational
©International Monetary Fund. Not for Redistribution

Contributors ix
responsibilities include being Deputy Director in the Western Hemisphere Department, Assistant Director in the Asian Department, and IMF Representative to Poland and the Philippines. Mr. Rodlauer worked with the Ministry of Foreign Affairs of Austria before joining the IMF. His academic training includes degrees in law, economics, and international relations.
Anoop Singh has been Director of the Asia and Pacific Department of the IMF since November 2008. Before this, Mr. Singh was Director of the Western Hemisphere Department. Mr. Singh, an Indian national, holds graduate and postgraduate degrees from the universities of Bombay and Cambridge and the London School of Economics. His other appointments at the IMF have included Director, Special Operations, in the Office of the Managing Director; Senior Advisor, Policy Development and Review Department; Assistant Director, European Department; and IMF Resident Representative in Sri Lanka. His additional work experience includes Special Advisor to the Governor of the Reserve Bank of India (I.G. Patel and Manmohan Singh); Senior Economic Advisor to the Vice President, Asia Region, the World Bank; adjunct professor at Georgetown University; and sometime lecturer at Bombay University. Mr. Singh has worked and written on macroeconomics, surveil-lance, and crisis management issues, helping design IMF-supported programs in emerging market, transition, and developing countries in South and Southeast Asia, Eastern Europe, and Latin America. He led missions to Thailand, Indonesia, and Malaysia during the Asian crisis; to Vietnam, Bulgaria, and Albania during their early transition experiences; and to a num-ber of other countries in Asia and in the Americas, including Argentina, Australia, China, India, Japan, and the Philippines.
Chad Steinberg is a Senior Economist in the IMF’s Strategy, Policy, and Review Department. He joined the IMF in 2002 and was most recently assigned to the IMF’s Regional Office for Asia and the Pacific in Tokyo between 2008 and 2012. His research interests include international trade, economic develop-ment, and labor markets. He holds a PhD from Harvard University.
Murtaza Syed is the IMF’s Deputy Resident Representative in China. He has previously covered a broad range of Asian economies, including Japan, the Republic of Korea, Hong Kong SAR, and Lao PDR. He has also been involved in the IMF’s regional surveillance in Asia and its programs with Dominica and Myanmar. His research interests include trade, investment, inequality, fiscal sustainability, and financial spillovers. Mr. Syed has a PhD in economics from Oxford University (Nuffield College). Before joining the IMF, he worked at the Institute for Fiscal Studies in London and the United Nations Development Programme–sponsored Human Development Center in Islamabad.
Olaf Unteroberdoerster is Deputy Chief of the IMF’s Regional Studies Division for the Asia and Pacific Region. His research interests include international trade, financial integration and liberalization, and economic rebalancing. He is currently also IMF Mission Chief for Cambodia, and between 2007 and 2009
©International Monetary Fund. Not for Redistribution

x Contributors
was the IMF’s Resident Representative in Hong Kong SAR. Before joining the IMF in 1998, Mr. Unteroberdoerster was a visiting researcher at Hitotsubashi University and the United Nations University, both in Tokyo. He studied eco-nomics and business administration in Germany, France, and the United States and holds a PhD in international economics and finance from Brandeis University.
©International Monetary Fund. Not for Redistribution

xi
BVAR Bayesian vector autoregressionCD certificate of depositDOTS Direction of Trade StatisticsFAI fixed asset investmentFAVAR factor-augmented vector autoregressionFDI foreign direct investmentG7 Group of SevenG20 Group of 20GIMF Global Integrated Monetary and Fiscal ModelLTP Lewis Turning PointNAIRU nonaccelerating inflation rate of unemploymentNIE newly industrialized economyOLS ordinary least squaresPBC People’s Bank of ChinaPPP purchasing power parityREER real effective exchange rateSAR Special Administrative RegionTFP total factor productivityUN United NationsWEO World Economic OutlookWTO World Trade Organization
Abbreviations
©International Monetary Fund. Not for Redistribution

This page intentionally left blank
©International Monetary Fund. Not for Redistribution

1
INTRODUCTION AND OVERVIEW
ANOOP SINGH, MALHAR NABAR, AND PAPA N’DIAYE
By the time China joined the World Trade Organization (WTO) in 2001, its economy had already experienced slightly more than two decades of “reform and opening-up.” The shift from a domestically oriented, planned economy to an outward-looking, more market-driven one had, on the eve of WTO accession, placed China in the bracket of the world’s 10 largest exporters. What happened next, with its WTO membership, was almost inevitable, but the speed at which China shot to the top was astounding. To put this rise in perspective, in 2001, China’s exports were roughly three-quarters of Japan’s, just under half of Germany’s, and about a third of U.S. exports. By 2003, China had overtaken Japan to become the world’s third-largest exporter; in 2006, it moved into the second spot ahead of the United States; and by 2008, its exports had surpassed those of Germany, the leading exporter at the time.
EXTERNAL IMBALANCES IN THE AFTERMATH OF WTO ACCESSION
Reflecting the proliferation of Chinese exports in global markets, the statistics told a story of an economy becoming ever more reliant on external demand. Exports as a share of the national economy grew from 20 percent in 2001 to 35 percent in 2007; the net contribution of external demand to China’s growth doubled compared with the 1990s; and the external imbalance captured by China’s current account surplus grew from 1¼ percent of GDP in 2001 to more than 10 percent of GDP in 2007.
Within a few years of this rapid acceleration in the outward orientation of China’s economy, analysts began to worry about China’s widening current account in the context of growing global imbalances—mainly the financing of U.S. external deficits by a combination of East Asian, German, and oil-producer surpluses.1 The concern was that the large imbalances were unsustainable and would unwind chaotically once investors became wary of financing the U.S. external deficit. Higher borrowing costs would then push the U.S. economy into recession. Emerging markets that had come to rely on U.S. demand for their exports would suffer growth collapses and rising unemployment rates.2 Even the
1 See, for example, Obstfeld and Rogoff , 2005; Roubini and Setser, 2005.2 Th is is the downside scenario envisaged in the IMF’s 2006 Multilateral Consultation initiative, which led to commitments by the large current account surplus and defi cit countries (China, the euro area, Japan, Saudi Arabia, and the United States) to reduce global imbalances through a shared strategy that included structural reforms, fi scal consolidation, and greater exchange rate fl exibility.
©International Monetary Fund. Not for Redistribution

2 Introduction and Overview
seemingly unstoppable Chinese economy would not emerge unscathed. Against this backdrop, the leadership in China publicly acknowledged concerns with its pattern of economic growth.3
And then just as suddenly as China’s external surplus had emerged, it began to shrink. From a peak of more than 10 percent of GDP in 2007, the current account surplus declined to less than 2 percent of GDP by 2011. The trigger for the correction was different from what experts had predicted in that it was the collapse of U.S. housing, not a broad flight from dollar-denominated securities, that led to the worst contraction in global economic activity since the Great Depression. China’s exports as a share of GDP fell to 26 percent in 2011. And net external demand subtracted from growth in China for two out of the four years following the onset of the global financial crisis. Remarkably, the economy continued expanding at more than 9 percent each year during 2008–11, in part because of a forceful policy response from the Chinese authorities.
China’s declining external imbalance raises the prospect of a new phase for the economy in which domestic engines of growth play a more important role. In the first instance, this would be in the best interests of China’s economy, allowing its vast manufacturing capacity to be deployed domestically, reducing its dependence on uncertain external demand, and ensuring more sustainable growth. At the same time, the shift would also place the world economy on a more solid footing, with China providing a steadily expanding market for exports from elsewhere, helping to compensate somewhat for the weak demand in advanced economies. Considering its importance for contributing to stable and sustainable global growth, a central question is to what extent this transition is already under way in China. More specifically, is the compression in China’s current account a sign of a durable shift in the drivers of its growth away from exports and investment toward consumption?
DOMESTIC IMBALANCES ADVANCE AS EXTERNAL ONES RETREAT
This book brings together recent research by IMF staff on questions concerning the rebalancing under way in China. The decline in the current account surplus to nearly a fifth of its precrisis peak is no doubt a major reduction in China’s
3 See Premier Wen Jiabao’s press conference at the National People’s Congress in March 2007, http://www.china.org.cn/200714/2007-03/16/content_1203204.htm. Premier Wen acknowledged “Th ere are structural problems in China’s economy which cause unsteady, unbalanced, uncoordinated, and unsustainable development. Unsteady development means overheated investment as well as excessive credit supply and liquidity and surplus in foreign trade and international payments. Unbalanced devel-opment means uneven development between urban and rural areas, between diff erent regions and between economic and social development. Uncoordinated development means that there is lack of proper balance between the primary, secondary, and tertiary sectors and between investment and con-sumption. Economic growth is mainly driven by investment and export. Unsustainable development means that we have not done well in saving energy and resources and protecting the environment. All these are pressing problems facing us, which require long-term eff orts to resolve.”
©International Monetary Fund. Not for Redistribution

Singh, Nabar, and N’Diaye 3
external imbalance, and policy efforts have contributed much in reorienting the economy toward domestic demand. So far, however, the decline in the external surplus has not been accompanied by a decisive shift toward consumption-based growth. Instead, the compression in the external surplus has been accomplished through fixed investment rising higher as a share of the national economy. The continued reliance on investment raises questions about how durable the com-pression in the external surplus will be and whether the current growth model, which has had unprecedented success in lifting about 500 million people out of poverty during the last three decades, is sustainable. In a nutshell, even as exter-nal imbalances appear to be receding, domestic imbalances seem to be on the rise. This turn of events creates risks of persistent overcapacity, deflationary pres-sures, and large financial losses. Alternatively, if final domestic demand is not forthcoming, Chinese firms may look outward and push the excess capacity onto world markets at the risk of depressing prices and triggering retaliatory trade action.
The analysis in this volume covers three main themes—the reasons for the decline in China’s current account and signs of growing domestic imbalances; the implications for China’s trading partners; and policy lessons for seeing the process through to achieve a stable, sustainable, and more inclusive transformation of China’s growth model. The first section begins with an overview of China’s cur-rent account surplus in the context of global imbalances and the factors that account for its sharp decline since 2007. Undoubtedly, the shrinking external imbalance has been directly influenced by the collapse in external demand when the global financial crisis broke and the subsequent weak recovery. But other fac-tors also appear to be at work, including changes in the terms of trade, a gradual appreciation of the renminbi, and a step increase in investment as China builds infrastructure and capacity in new areas of manufacturing.
The remainder of Part I examines various dimensions of rising domestic imbalances. Chapters 2 through 4 focus on investment. An important distinction in this discussion is between the stock of capital and the flow of investment: the chapters find that although China’s capital-to-output ratio is within the range of that of other emerging markets, its investment ratio appears too high according to multiple metrics. Sectoral analysis indicates that manufacturing, real estate, and infrastructure have been the main drivers of investment in recent years. The heavy dependence on investment and capital accumulation has meant that capac-ity has run ahead of final demand, and China has operated with excess capacity for most of the 2000s.
Chapter 5 looks at household saving and consumption in more detail. In urban China, households living in an environment defined by rapid change, reforms to the social safety net, and growing aspirations regarding house pur-chases have self-insured to provide a buffer against fluctuations in income and health. Declines in the rate of return on those savings have induced them to save more out of disposable income to meet their saving targets. The key implication is that an increase in the real return on saving would enable households to achieve their saving goals more easily and could curb the high propensity to save.
©International Monetary Fund. Not for Redistribution

4 Introduction and Overview
THE IMPACT ON TRADING PARTNERS
Part II of the book explores the potential consequences for other economies of China’s growing domestic imbalances. Chapters 6 and 7 analyze the impact on trading partners of China’s external rebalancing and the tilt toward investment. Economies that have benefited from China’s rapid investment may see their exports suffer if domestic imbalances were to disrupt growth in China. Specifically, regional supply chain economies and commodity exporters with rela-tively less-diversified economies would be most vulnerable to an investment slowdown in China. The spillover effects from investment in China would also register strongly across a range of macroeconomic, trade, and financial variables among G20 trading partners, particularly Germany and Japan.
A related question, examined in Chapter 8, is the more specific impact of real estate investment activity on trading partners and the potential fallout from a disorderly correction in the real estate sector. Real estate investment is about a quarter of total fixed asset investment in China. A sudden decline in real estate investment in China would have an appreciable impact on overall activity in China and large spillover effects on commodity prices and economic growth in a number of China’s G20 trading partners. Machinery and commodity exporters among the G20 would suffer the largest impact from a correction in real estate activity in China.
POLICY IMPLICATIONS
The final part of the book explores what remains to be done to secure the trans-formation to a consumption-based and more inclusive growth model in China. Chapter 9 provides the motivation for reform through the lens of demographics. China’s growth miracle has thus far relied heavily on absorbing excess labor from the countryside into factories in export-oriented manufacturing. Although China still has a pool of surplus labor and is not expected to reach the Lewis Turning Point (at which this excess supply will be exhausted) until about 2020, time is running out on when the existing framework can be modified with relatively low adjustment costs.
A critical part of this adjustment will involve making growth even more inclu-sive. China’s urban-rural income gap has widened since 2000, and wage dispari-ties across provinces appear to have risen as well. Chapter 10 examines the policies that could make growth more inclusive in China. The main point is that there is room to expand spending on health and education, and to broaden the benefits of growth by improving the functioning of the labor markets. More broadly, enhancing the inclusiveness of growth and widening labor market opportunities will entail dismantling barriers to entry across various sectors. As Chapter 11 documents, removing these barriers is especially relevant in services and domesti-cally oriented industries. Encouraging the entry of new firms and improving contestability would substantially raise China’s income per capita, mainly through gains in total factor productivity.
©International Monetary Fund. Not for Redistribution
Singh, Nabar, and N’Diaye 5
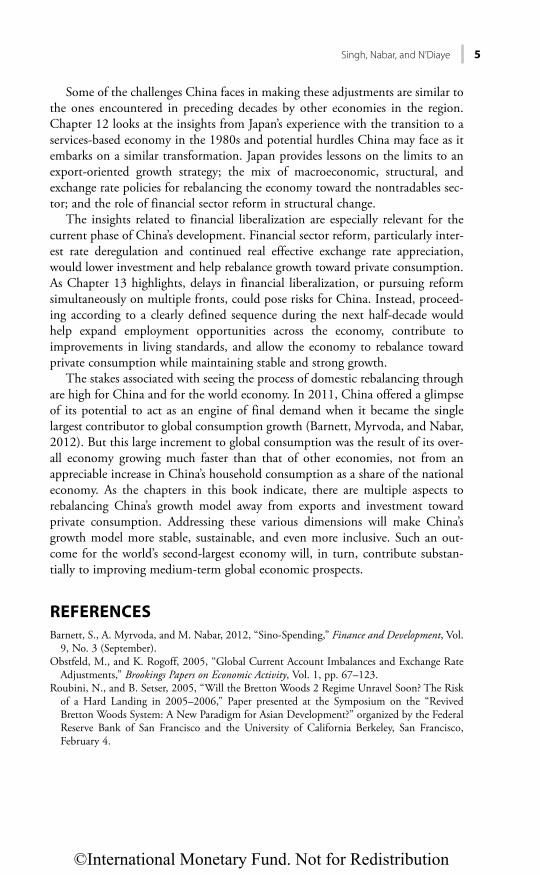
Some of the challenges China faces in making these adjustments are similar to the ones encountered in preceding decades by other economies in the region. Chapter 12 looks at the insights from Japan’s experience with the transition to a services-based economy in the 1980s and potential hurdles China may face as it embarks on a similar transformation. Japan provides lessons on the limits to an export-oriented growth strategy; the mix of macroeconomic, structural, and exchange rate policies for rebalancing the economy toward the nontradables sec-tor; and the role of financial sector reform in structural change.
The insights related to financial liberalization are especially relevant for the current phase of China’s development. Financial sector reform, particularly inter-est rate deregulation and continued real effective exchange rate appreciation, would lower investment and help rebalance growth toward private consumption. As Chapter 13 highlights, delays in financial liberalization, or pursuing reform simultaneously on multiple fronts, could pose risks for China. Instead, proceed-ing according to a clearly defined sequence during the next half-decade would help expand employment opportunities across the economy, contribute to improvements in living standards, and allow the economy to rebalance toward private consumption while maintaining stable and strong growth.
The stakes associated with seeing the process of domestic rebalancing through are high for China and for the world economy. In 2011, China offered a glimpse of its potential to act as an engine of final demand when it became the single largest contributor to global consumption growth (Barnett, Myrvoda, and Nabar, 2012). But this large increment to global consumption was the result of its over-all economy growing much faster than that of other economies, not from an appreciable increase in China’s household consumption as a share of the national economy. As the chapters in this book indicate, there are multiple aspects to rebalancing China’s growth model away from exports and investment toward private consumption. Addressing these various dimensions will make China’s growth model more stable, sustainable, and even more inclusive. Such an out-come for the world’s second-largest economy will, in turn, contribute substan-tially to improving medium-term global economic prospects.
REFERENCES
Barnett, S., A. Myrvoda, and M. Nabar, 2012, “Sino-Spending,” Finance and Development, Vol. 9, No. 3 (September).
Obstfeld, M., and K. Rogoff, 2005, “Global Current Account Imbalances and Exchange Rate Adjustments,” Brookings Papers on Economic Activity, Vol. 1, pp. 67–123.
Roubini, N., and B. Setser, 2005, “Will the Bretton Woods 2 Regime Unravel Soon? The Risk of a Hard Landing in 2005–2006,” Paper presented at the Symposium on the “Revived Bretton Woods System: A New Paradigm for Asian Development?” organized by the Federal Reserve Bank of San Francisco and the University of California Berkeley, San Francisco, February 4.
©International Monetary Fund. Not for Redistribution

This page intentionally left blank
©International Monetary Fund. Not for Redistribution

PART I
A Shift in Focus: From External to Internal Imbalances
©International Monetary Fund. Not for Redistribution

This page intentionally left blank
©International Monetary Fund. Not for Redistribution

9
CHAPTER 1
An End to China’s Imbalances?
ASHVIN AHUJA, NIGEL CHALK, MALHAR NABAR, PAPA N’DIAYE, AND NATHAN PORTER
Global imbalances have been a central theme of the international economic policy debate for much of the last decade, prompted by large and sustained current account deficits in the United States and counterpart surpluses in China, Germany, and many of the oil-producing economies. This chapter focuses on the external imbalance in China, examining the factors underlying the post-2008 drop in China’s current account surplus and analyzing the prospects for the external surplus going forward. It finds that China’s current account surplus should remain modest in the coming years. However, despite the likelihood that China’s medium-term current account will stay below its precrisis range, it is too early to conclude that “rebalancing” has truly been achieved in China. Although imbalances do not currently seem to be manifesting themselves as a feature of China’s external accounts, the evidence points to a domestic imbalance because the economy continues to rely on high levels of investment.
INTRODUCTION
As early as 2005, analysts and academics became concerned about the prospects for, and sustainability of, growing current account imbalances in the world’s larg-est economies (see, for example, Obstfeld and Rogoff, 2005). In the United States, low saving rates and growing household consumption—fueled in part by what later turned out to be a bubble in the property market—sucked in imports from abroad, causing the trade and current account deficits to balloon. Of course, this deficit had a counterpart in the United States’ principal trading partners. Among the oil producers, strong demand and rising prices resulted in growing trade sur-pluses and rising net foreign asset positions. In Germany and Japan, external surpluses rose steadily throughout the early part of the 2000s, mainly on account of rising trade surpluses but also, in Japan’s case, because of rapidly growing income flows accruing on Japan’s significant stock of foreign assets. Finally, begin-ning in 2004, the trade surplus in China took an unprecedented turn upward, which, in turn, created significant pressure for the renminbi to strengthen.1
1 An alternative view was that global imbalances had emerged as a by-product of underdeveloped financial markets in emerging economies (for example, Cooper 2007; and Caballero, Farhi, and Gourinchas, 2008). In this interpretation, savings from emerging economies were channeled uphill to advanced economies, particularly the United States, in search of safe and liquid assets (as the result of
©International Monetary Fund. Not for Redistribution

10 An End to China’s Imbalances?
Researchers viewed this system of growing global surpluses and deficits as a renewed “Bretton Woods II” system (Dooley, Folkerts-Landau, and Garber, 2003, 2004; Roubini and Setser, 2005). The principal concern among commentators was that, at some point, the global system would be unwilling to continue to finance the growing imbalances in the United States (particularly in financing the U.S. fiscal position), which would lead to a sudden stop in capital flows to the United States, a spike in U.S. treasury yields, a weaker U.S. dollar, and a collapse in both external deficits and surpluses. This disorderly unwinding was predicted to be painful, creat-ing macroeconomic and financial instability and a collapse of global growth.
The global economy did fall into a crisis—the worst tailspin since the Great Depression—but in a manner that was far from what was predicted by Bretton Woods II proponents (see Delong, 2008; and Dooley, Folkerts-Landau, and Garber, 2009). Catastrophic failures of risk management and financial regulation were exposed—spilling out from the U.S. real estate market—culminating in the startling failure of Lehman Brothers, the near-collapse of the international finan-cial system, and a sharp global recession. All of this occurred with relatively mod-est movements in the real exchange rates of both the deficit and the surplus economies (Figure 1.1).
As a by-product of the Great Recession, current account surpluses and deficits across the globe contracted. The U.S. saving rate moved sharply upward, and external demand collapsed. Japan’s current account surplus fell from 4.8 percent
a lack of such assets in these countries’ domestic economies). But as Obstfeld and Rogoff (2010) argue, based on the findings of Gruber and Kamin (2008) and Acharya and Schnabl (2010), little evidence suggests that capital flows from emerging to advanced economies were systematically related to the state of financial development, or that it was principally emerging economies’ demand for risk-free assets that was financing the U.S. current account deficit.
60
80
100
120
140
2000 2001 2002 2003 2004 2005 2006 2007 2008 2009 2010 2011 2012
ChinaIn
dex,
200
0 =
100
Euro area Japan United States
Figure 1.1 Real Effective Exchange Rate (Index, 2000 = 100)Source: IMF INS database and staff calculations.
©International Monetary Fund. Not for Redistribution

Ahuja, Chalk, Nabar, N’Diaye, and Porter 11
of GDP in 2007 to 2.8 percent of GDP in 2010. Germany’s current account surplus fell from 7½ percent of GDP to 5¾ percent of GDP during the same period. Despite relatively high oil prices, the current account surpluses of the oil exporters were cut in half, to about ½ percent of global GDP (Figure 1.2).
And then there was China. In the world’s second-largest economy, the current account surplus was cut in half from 2007 to 2009, amounting to a US$150 bil-lion swing in the current account surplus. The surplus leveled off in 2010 as the global economy recovered, but then in 2011 the current account surplus was cut almost in half once again (Figure 1.3). Forecasting China’s external accounts has
−6
−3
0
3
6
9
1971 1976 1981 1986 1991 1996 2001 2006 2011
Services balance
Income balance
Net transfers
Goods balance
Per
cent
of G
DP
Current account balance
Figure 1.3 China’s Current Account and Its ComponentsSources: IMF, World Economic Outlook; and IMF staff calculations.
−2
−1
0
1
2
3
1996 1999 2002 2005 2008 2011 2014 2017
Rest of world ForecastOil exportersUnited StatesJapanGermany
Per
cent
of w
orld
GD
P
China
Forecast
Figure 1.2 Global ImbalancesSources: IMF, World Economic Outlook; and IMF staff calculations.
©International Monetary Fund. Not for Redistribution

12 An End to China’s Imbalances?
always been challenging, in part reflecting rapid structural change, uncertainties surrounding China’s terms of trade, and difficulty predicting the path of the global recovery—but the scale of this current account reversal has been far sharper and more durable than expected.
This chapter focuses on describing the dynamics behind the fall in China’s external surplus since 2007. It aims to assess what has driven the external imbal-ance to shrink and provides a revised outlook for the current account in the medium term.
THE RECENT PATH OF CHINA’S EXTERNAL IMBALANCE
Until 2004, China’s external imbalances were relatively small with the trade sur-plus averaging only 3 percent of GDP during the period 1994−2003 (Figure 1.4). At a more disaggregated level, the trade surplus or deficit for various product components was also very small, although the trade surplus for textiles grew steadily during the period. Starting in 2004, the size of China’s imbalance acceler-ated, most notably as the result of an upswing in net exports of machinery and mechanical devices. This upswing was offset, in part, by a significant expansion of China’s trade deficit in minerals (largely metals and energy products). Despite these equalizing factors, as a share of GDP, China’s current account was able to rise to double digits by the eve of the global financial crisis, and at the time, few signs indicated that the pace of growth of the imbalance was set to slow down anytime soon.
However, what happened next was an extraordinary set of global circum-stances that combined to set off the worst global financial crisis in the post–World War II period. Against this external backdrop, China’s current account surplus was cut in half between 2007 and 2009 and, by 2011, had fallen to 1.9 percent of GDP. This compression in the external surplus was largely a result of a falling trade balance (which went from 9 percent of GDP in 2007 to 3.3 percent of GDP in 2011).
Certainly the drop in the trade balance has a cyclical component. After all, growth and demand in the global economy were damaged by the global financial crisis, and balance sheet repair and ongoing deleveraging were expected to weigh on growth well into the medium term. At the same time, the significantly higher demand for imported minerals (Figure 1.4) and energy was a side effect of China’s policy response to the global financial crisis—to put in place a significant infra-structure-driven stimulus funded by high credit growth.
Nevertheless, more lasting forces have also been at work, affecting the trade surplus in both directions. Domestic costs are rising, the costs of imported inputs (particularly commodities) have risen, and the stimulative effects on trade that were created by China’s accession to the World Trade Organization (WTO) may be waning. However, the relocation of global manufacturing capacity to China (financed by significant foreign direct investment [FDI] inflows) continues and
©International Monetary Fund. Not for Redistribution

Ahuja, Chalk, Nabar, N’Diaye, and Porter 13
capacity is being built in new industries as China moves rapidly up the quality ladder. The following discussion aims to weigh these various competing factors first by analyzing the main forces behind the recent decline in the surplus and then by drawing ideas together to summarize what this all means for China’s external imbalance going forward.
WHAT IS DRIVING THE DECLINING SURPLUS?
The Collapse in Global Demand
Since 2008, the global environment that China faces has changed radically. It has become clear that the path the advanced economies were on during the “Great Moderation” was unsustainable and built on excessive consumption and leverage. As a result, in 2008, the level of GDP in the advanced economies took a large step down. In addition, future growth is likely to struggle as balance sheet excesses are worked through. This will certainly prove to be a headwind for China’s trade performance. Part of this is cyclical; eventually the output gap in advanced economies is expected to close. However, the advanced economies are expected to endure lower potential growth in the medium term. The direct impact on China’s export sector has been visible. For example, exports of machinery and equipment to the United States—which contributed between 10 and 15 percent of China’s overall export growth early in the first decade of the 2000s—look unlikely to recover as long as the U.S. housing market remains subdued. Indeed, the contri-bution of these items to export growth has declined to about 5 percent in the postcrisis period.
−40
−20
0
20
1993 1995 1997 1999 2001 2003 2005 2007 2009 2011
Trade balance
Machinery and mechanical devices
Textile and textile articles
Miscellaneous manufactured articles
Mineral productsOther items
U.S
. dol
lars
(bill
ion)
Figure 1.4 Trade Balance (12-month moving average)Sources: CEIC Data; and IMF staff calculations.
©International Monetary Fund. Not for Redistribution
14 An End to China’s Imbalances?
One additional aspect of China’s export performance worth highlighting is that, although overall external demand has suffered as a result of the global finan-cial crisis, China’s ability to gain a larger share of those external markets appears to have been relatively unaffected. Even in 2008, when global trade collapsed, China was still able to gain market share, and since then, the pace of China’s market share gains has broadly returned to the level prevailing before the global crisis. At an aggregate level, China has, since 2003, managed to increase its share of world exports by an average of about ¾ percentage point per year.
While maintaining its foothold in traditional areas, China has also started to make a concerted push into industries typically dominated by more advanced economies. Prominent examples of these new growth areas include wind turbines, solar panels, automobiles, and semiconductor devices. In the wind energy indus-try, for example, China increased its share of global capacity from 16½ percent in 2009 to 22¾ percent in 2010, overtaking the United States as a world leader in wind energy capacity. Thus, China has increased its global market share in exports of wind energy equipment to about 6 percent (as of September 2011) from almost zero five years earlier. Similarly, China has moved rapidly to build production facilities in solar panels, and the upswing in China’s global export share in this industry has come at the expense of Japan and Germany (in part, as multinationals from those countries move their production facilities into China).
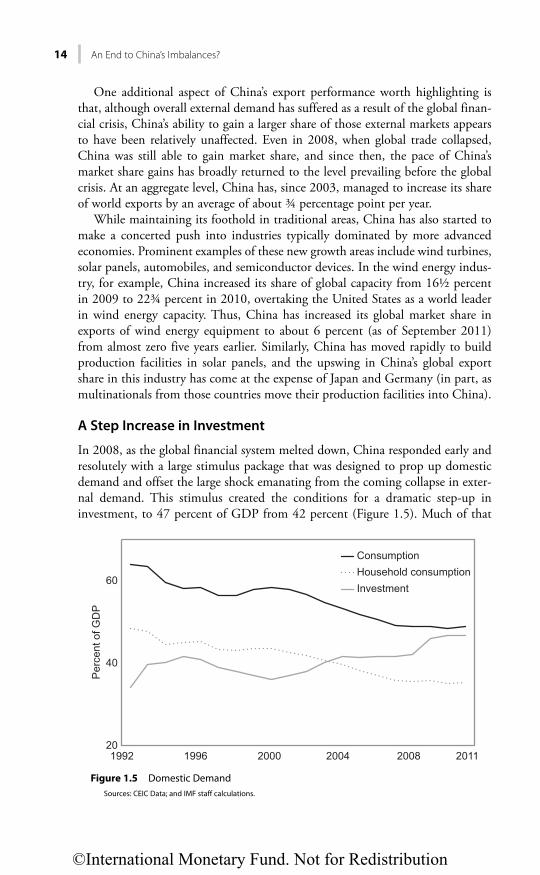
A Step Increase in Investment
In 2008, as the global financial system melted down, China responded early and resolutely with a large stimulus package that was designed to prop up domestic demand and offset the large shock emanating from the coming collapse in exter-nal demand. This stimulus created the conditions for a dramatic step-up in investment, to 47 percent of GDP from 42 percent (Figure 1.5). Much of that
20
40
60
Consumption
Per
cent
of G
DP
Household consumptionInvestment
1992 1996 2000 2004 2008 2011
Figure 1.5 Domestic DemandSources: CEIC Data; and IMF staff calculations.
©International Monetary Fund. Not for Redistribution
Ahuja, Chalk, Nabar, N’Diaye, and Porter 15
investment was concentrated in transportation, utilities, and housing construc-tion. A direct consequence of this investment has been to remove many of the infrastructure bottlenecks that existed and to increase the connectivity between provinces. Ultimately, these advances will serve to improve the competitiveness of China’s industry, in part as it facilitates industrial relocation to lower-cost areas within China (particularly the central and western provinces).
As the global economy started to recover, China’s spending on infrastructure began to wane, which created a hole in aggregate demand that was quickly filled by an upswing in private sector manufacturing investment. It appears this manu-facturing capacity is being built predominantly in a range of relatively higher-end manufacturing industries. In the coming years, this growth in manufacturing capacity could potentially lead to future increases in exports (as China sells these goods onto global markets). Alternatively, this capacity could be deployed domes-tically through sales to Chinese industries and households. Finally, there is a chance that it could remain underutilized (which would open up the question of how and whether the financing for these investments will be serviced). At this point, the purpose for which this new capacity will be used remains an important question but very difficult to predict.
The Role of Commodities and Capital Goods
As discussed, one of the by-products of the step increase in fixed investment has been a significant increase in China’s demand for commodities. This growth in demand took off first in metals followed by strong import growth in machinery and energy products. Both private and public investment projects have proved to be very import intensive. Some opportunistic cyclical stockpiling of commodities has occurred, and inventory data show stockbuilding in upstream industries such as ferrous metal mining (about 15 percent year-over-year growth in 2011) and nonferrous metal mining (about 25 percent year over year). Overall, however, little evidence points to a secular rise in inventories, which would suggest that this import demand is largely being used as an input to domestic production (see Ahuja and others, 2012, for more details).
The Terms of Trade
The sustained strength in imports of commodities and minerals has reinforced a dynamic that has been at work for several years now, going back to well before the global financial crisis. During the past several years, imports have become more linked to commodities and minerals, for which supply is relatively inelastic and global prices have been rising. At the same time, exports have become increas-ingly tilted toward machinery and equipment, for which supply is relatively elastic, competition is significant, and relative prices have been falling.
As a result, aside from 2009 and 2012, China’s terms of trade have been steadily worsening. This result may not be surprising from a historical standpoint. Several other economies that have witnessed export-oriented growth (notably Japan and the newly industrialized economies) were affected by similar terms of
©International Monetary Fund. Not for Redistribution

16 An End to China’s Imbalances?
trade declines along their development paths (Figure 1.6). In China’s case, this dynamic is further fueled by the fact that, in both export and import markets, the country has become so large as to no longer be a price taker. As a result, to some modest degree, China may well be generating a decline in its own terms of trade, creating a self-equilibrating mechanism that drives China’s terms of trade and creates countervailing downward pressures on China’s external surplus, through global prices.2
Exchange Rate Appreciation
The exchange rate appreciated 14¾ percent in real terms during April 2008–December 2011, but as mentioned above, this change masks considerable varia-tion within the interval. A significant portion of this appreciation took place in 2008, after which the pace slowed markedly through the crisis and recovery (and has included intervals of real depreciation). Most of the real appreciation was due to movements in nominal exchange rates relative to major trading partner currencies, whereas the portion of the real appreciation accounted for by inflation differentials relative to trading partners has been relatively minor (Table 1.1).
2 The deteriorating terms of trade could also generate negative income effects as prices of imported goods rise, which would lower domestic demand and partly offset the narrowing of the external sur-plus. But this offset so far appears to be relatively muted in China’s case, with domestic spending (particularly investment) continuing to rise rapidly even as import prices have risen.
50
100
150
Inde
x
200
1 6 11 16 21 26 31 36 41 46 51 56 61
China (1979–2011) Japan (1955–2010)
Rep. of Korea (1965–2010) NIEs (1967–2010)
Germany (1952–2010) China forecast (2012–16)
Years since growth take-off
Figure 1.6 Terms of Trade of Selected Economies since Growth Take-OffSources: IMF, World Economic Outlook; and IMF staff calculations.Note: NIE = Newly Industrialized Asian Economies.
©International Monetary Fund. Not for Redistribution

Ahuja, Chalk, Nabar, N’Diaye, and Porter 17
Net Income Flows
Finally, a few words on net income flows are warranted. It is something of a puzzle that, as China’s net foreign asset position has accelerated, net income flows have not increased correspondingly. Looking first at the asset side, the rise in foreign assets in China has largely tracked the evolution of the central bank’s reserve portfolio and China Investment Corporation’s investment position. Liabilities, however, have mirrored the growing stock of FDI flowing into China. The low net income flow numbers suggest a significant differential between the return on FDI into China versus the returns on the reserve holdings of the central bank. Indeed, it would appear that the return differential has been on the order of 3−4 percentage points for much of the past several years, resulting in net income flows that are close to zero despite a growing net foreign asset position (Ahuja and others, 2012).
Putting It All Together
Even as China’s growth has moderated compared with before the crisis, import volumes have continued their upward trajectory as output has become more capital goods and commodity intensive. The step increase in investment spending and the associated sustained strength in import volumes (particularly of key com-modities) have reinforced an ongoing secular deterioration in China’s terms of trade. To attach some quantitative importance to these effects, actual develop-ments during 2007–11 were compared with a counterfactual scenario based on both a reduced-form model of the current account and separate trade regressions (details are in the Annex 1A to this chapter). The counterfactual scenario is based on decomposing the change in the current account surplus since 2007, assuming that (1) partner country output was at potential from 2007 to 2011, (2) the real exchange rate had stayed constant, and (3) the terms of trade and investment-to-GDP ratio had remained at their 2007 levels.
TABLE 1.1
Decomposition of China’s Exchange Rate
Percent change April 2008–December 2011
REER appreciation 14.7Contribution from Inflation differential 1.6
NEER appreciation 13.0 of which, contribution from Appreciation against U.S.$ 2.4
Appreciation against other partner currencies 10.6
Memo item:Bilateral appreciation against U.S. dollar 10.6
Source: IMF staff estimates.Note: NEER = nominal effective exchange rate; REER = real effective exchange rate.
©International Monetary Fund. Not for Redistribution

18 An End to China’s Imbalances?
The calculations suggest that the terms of trade decline contributed between one-fifth and two-fifths of the decline in the current account surplus during 2007–11 (Table 1.2). The acceleration in investment accounted for one-quarter to one-third of the decline, whereas the appreciation of the currency contributed between one-fifth and one-third. Below-potential growth in partner countries had a slightly smaller effect. Overall, the conclusion is that growing domestic investment, worsening terms of trade, weakening external demand, and apprecia-tion of the REER explain a large share of the postcrisis decline in the current account surplus. That said, it should be noted that these calculations are based on a partial equilibrium approach and have to be interpreted with some caution. For example, they do not account for feedback effects between these various factors (such as the linkages between high investment in China and rising global com-modity prices).
POLICY REFORM, DEMOGRAPHICS, AND COST PRESSURES
Policy Reforms
The Chinese government has rightly focused its policy efforts since the global financial crisis on a range of areas designed to accelerate the transformation of the Chinese economic model, improve livelihoods, and raise domestic consumption. Access to primary health care has been improved through the construction of new health care facilities, particularly in previously underserved rural communities. A new government health insurance program has been launched nationwide, and subsidies for a core set of prescription drugs have been introduced. In addition, the existing government pension scheme is being expanded to cover urban
TABLE 1.2
Estimated Contributions to the Decline in China's Current Account Surplus, 2007–11 (percent of GDP)
Estimated Trade Elasticities1 Reduced-Form Current Account Equation
Actual 2007 10.1 10.1Actual 20112 2.8 2.8Decline −7.3 −7.3
Contributing factors:Terms of trade −1.6 −3.6Foreign demand −1.1 −1.4Investment −1.8 −2.6REER −2.1 −1.3Others −0.8 1.5
Source: IMF staff calculations.Note: REER = real effective exchange rate.1Elasticities based on estimated calculations for exports and imports of goods and services. 2Preliminary actual.
©International Monetary Fund. Not for Redistribution

Ahuja, Chalk, Nabar, N’Diaye, and Porter 19
unemployed workers across the country and to make those pensions more por-table within China. Also, the absolute level of pensions has been increased, par-ticularly for the elderly poor.
In addition to health care and pensions, improving access to affordable hous-ing has been an important policy objective. The 12th Five-Year Plan, launched in 2011, aims to construct 36 million low-income housing units by 2016. The wider availability of low-cost housing has the potential to ease the budget con-straints of low-income groups and release savings currently locked up in financing home purchases.
So far, however, it is still too early to conclude that the initiatives to build out the social safety net and increase the provision of social housing have led precau-tionary saving to decline or have created sufficient momentum for household consumption to durably reverse the secular decline as a share of GDP that has been seen since 2000.
At the same time that these housing and social reforms have been undertaken, greater policy emphasis has been placed on market-based pricing of factor inputs and the scaling back of subsidies. Nevertheless, the low cost of many of China’s factor inputs—including land, water, energy, labor, and capital—still creates incentives for an overly capital-intensive means of production. Factor inputs are priced below prices that would be expected to equilibrate supply and demand and are also low relative to international comparators. For instance, in many cases, industrial land is provided for free to enterprises to attract investment, and the price of water in China is about one-third of that of international comparators. Cross-country data on the cost of energy show that the prices of gasoline and electricity in China are low relative to much of the rest of the world. Studies estimate that the total value of China’s factor market distortions could be almost 10 percent of GDP.3 However, China is making progress in bringing some energy costs in line with international levels: oil product prices have been indexed to a weighted basket of international crude prices. natural gas prices have been steadi-ly increased, and preferential power tariffs for energy-intensive industries have been removed.
Again, so far these rising costs, along with higher wages and the more appreci-ated currency, appear to have had little effect on corporate saving. Geographical relocation, strong productivity, and modest increases in export prices are helping to defray cost pressures that firms may be facing.
Overall, although the policy reforms that have been undertaken are valuable and necessary, and structural forces are at work that should help redistribute resources and shift behaviors, little evidence indicates that these efforts have cre-ated a decisive turnaround in national saving behavior, either at the corporate or the household level. However, many of these policies are likely to have long lags before their impact on saving behavior is clearly seen. It may well be that an effect
3 See Huang and Tao (2010) or Huang (2010). Also see IMF (2011) for more discussion on relative factor costs comparing China with other economies.
©International Monetary Fund. Not for Redistribution

20 An End to China’s Imbalances?
on household income and consumption will become steadily more discernible in the coming years.
Urbanization
In addition to the policy efforts taken by the government to lessen its external imbalances, raise household income, expand the services sector, and boost con-sumption, some important underlying structural changes are also under way. Over the decades, urbanization has proceeded steadily and is now at the point that half of the Chinese population is living in urban areas. This process has tended to be commodity intensive; new housing and infrastructure built to accommodate this growing urban citizenry has put downward pressure on the trade surplus. At the same time, this shift has raised the standard of living for many Chinese, lifting millions out of poverty and creating a vibrant urban middle class. This process undoubtedly has been associated with growing consumption of tradable goods, some imported from abroad but the majority produced within China. Thus, while manufacturing capacity has been expanding at a breathtaking pace, a large share of this capacity has been deployed to provide goods to the domestic market. That fact is becoming increasingly evident as the domestic economy—particularly the interior of the country—develops and companies relocate production facilities out of the coastal areas and closer to these fast-growing local markets.4
Demographic Change
A second important structural factor has been China’s unique demographics. China is fast approaching the point at which its labor force will start to shrink; already, the size of the cohorts that are younger than 24 years old has begun to decline. This change is naturally going to tighten labor markets and put upward pressure on wages as the labor-supply curve moves from perfectly elastic to mod-erately upward sloping, as is now happening. Although China is not yet at the so-called Lewis Turning Point, it has entered a period in which real wages are going to continue to rise and increasingly at a rate that is faster than productivi-ty.5 These ongoing shifts in factor markets—both labor and other inputs—are clearly important and, over time, should lead to rising cost pressures. This will also have implications for the external imbalance. Nonetheless, it is still too early to conclude that rising cost pressures have been responsible, in a meaningful way, for China’s shrinking external surplus. As seen in the decomposition of the REER appreciation in Table 1.1, the contribution of the inflation differential (which reflects, in part, the influence of factor cost differences) has been rela-tively minor.
4 The process has been facilitated by the loosening of restrictions on household registration require-ments in certain interior urban areas such as Chongqing. For more details, see The Economist (2012). 5 See Chapter 9 for a detailed analysis of this issue.
©International Monetary Fund. Not for Redistribution

Ahuja, Chalk, Nabar, N’Diaye, and Porter 21
THE OUTLOOK FOR CHINA’S EXTERNAL SURPLUS
As discussed above, prospects for China’s external surplus are closely linked to the outlook for the principal drivers of the recent decline—external demand, the level of investment, and the future trends for China’s terms of trade and domestic costs. The outlook draws on the conclusions of the various modeling approaches described in Annex 1A but also imposes some degree of judgment given the uncer-tainties. Therefore, these projections are predicated on the assumption that many of the recent shifts underpinning the surplus reversal will be persistent, in particular,
• China continues to gain global market share at the average pace seen during the past decade, but in an environment of generally weak growth in China’s main trading partners (as described in the April 2012 World Economic Outlook).
• The elevated level of investment spending continues, keeping the investment-to-GDP ratio close to current levels and well above the precrisis average.
• China’s terms of trade continue to steadily deteriorate (by ½ percent per year).
• The usual World Economic Outlook assumption that China’s REER remains constant continues to be true.
• As the global recovery gathers momentum in the medium term, the rates of return on China’s reserve portfolio increase, leading to a growing surplus on the income account.
• Under these conditions, net exports will likely improve in real terms as global demand slowly recovers, but the current account surplus will not rise to anywhere near the levels seen before the global financial crisis. Instead, the current account surplus is expected to stay close to current levels in the near term and rise in the medium term but only to about 4 to 4½ percent of GDP by 2017 (Figure 1.7).
The downside risks to the outlook for the current account are considerable. They are partly tied to the global outlook, but the pace of continued structural change in China’s economy is also subject to uncertainty. For example, various factors—including the beneficial impact of WTO accession in 2001, strong growth in manufacturing productivity, a relocation of global production facilities to China, and low-cost factors of production—created the conditions for the country’s export market share to rise rapidly since the early 2000s. China is expected to continue building its export market share and to rotate its product mix toward higher-end manufacturing. This process may, however, face head-winds from the slow recovery in global demand. It is also possible that market share gains will moderate relative to the rate experienced since early in the 2000s as China’s export mix gets closer to the technology frontier and opportunities for technology transfer and the relocation of overseas production facilities diminish. Finally, if past experience can be extrapolated, China’s real exchange rate may continue to appreciate, which, again, will diminish the size of the external surplus.
©International Monetary Fund. Not for Redistribution

22 An End to China’s Imbalances?
WHAT DOES THIS REVISED OUTLOOK FOR CHINA’S CURRENT ACCOUNT IMPLY FOR THE PATH OF GLOBAL IMBALANCES?
The implications of changes in China’s current account for global imbalances is a big question that does not lend itself to a neatly wrapped answer. The issue also goes well beyond China and requires that the imbalances in many other large economies be examined. However, there are three major points:
• First, the Chinese economy is growing rapidly, so even though the increase in the size of the imbalance in the medium term is relatively modest, it would still translate into a growing share of the aggregate external balance of surplus economies in the future. Furthermore, relative to the size of the world economy, the rapid growth in the Chinese economy would indicate an increase in the current account to 0.6 percent of global GDP in the medium term from 0.2 percent in 2012 (high growth ensures that China’s economy becomes a larger and larger share of global output through time). By this metric, the current account surplus is far from negligible, albeit well below the share of global GDP that China’s current account surplus reached in 2007–08.
• Second, the fading of China’s external surplus does not mean global imbal-ances are solved. Rather, these global imbalances may be rearranging them-selves into a different geographical constellation. China’s external surplus may well have migrated elsewhere, aided, in part, by the impact China is having on global prices and its own terms of trade.
−6
−3
0
3
6
9
1971 1986 2001 2016
Services balance
Income balance
Net transfers
Goods balance
Per
cent
of G
DP
Current account balance
Figure 1.7 Projection to 2016 of China’s Current Account and Its ComponentsSource: IMF, World Economic Outlook.
©International Monetary Fund. Not for Redistribution

Ahuja, Chalk, Nabar, N’Diaye, and Porter 23
• Third, unless consumption can soon be catalyzed, the decline in the external surplus will have come at the expense of a widening imbalance in China’s domestic economy. However, such an imbalance is not merely a domestic issue. If left unresolved, it has the potential to generate macroeconomic and financial instability in China’s economy, which, because of China’s size and systemic importance, will undoubtedly have consequences for global mac-roeconomic and financial stability.
CONCLUSION
The decline in China’s external surplus has been impressive and should be wel-comed. However, this adjustment has largely been the result of very high levels of investment, a weak global environment, and an increased pace of commodity prices that outstrips the rising price of Chinese manufactured goods. Although all three of these factors are likely to continue to put downward pressure on the external imbalance, the “rebalancing” in China advocated by the IMF over the past several years is not occurring.6 Certainly, the policy thrust of the 12th Five-Year Plan is very much focused on raising household income, boosting consump-tion, and facilitating expansion of the service sector. In the coming years, if these ongoing structural reforms continue to be implemented, China does have the potential to evolve from a largely investment-based to a more consumption-based decline in its external imbalance. If successful, this would ultimately prove to be a more lasting shift that would increase the welfare of the Chinese people and contribute significantly to strong, sustained, and balanced global growth.
6 See, for example, IMF (2010, 2011).
©International Monetary Fund. Not for Redistribution

24 An End to China’s Imbalances?
ANNEX 1A. EMPIRICAL ANALYSIS
A number of different models have been estimated to explain the external sur-plus—see, for example, Aziz and Li (2007), Cheung, Chinn, and Qian (2012), or Mann and Pluck (2007). The analysis in this annex looks at four different approaches—a structural dynamic stochastic general equilibrium model, a multi-variate Bayesian vector autoregression (BVAR) model, a reduced-form time series model of the current account, and an approach using simpler trade equations—and examines their predictions for the future path of China’s current account surplus.
In most cases, these forecasts assume a constant real effective exchange rate (REER); the World Economic Outlook (WEO) projections for global demand; and a path of steady, medium-term fiscal consolidation in China. If the exchange rate appreciates in real terms (because of either faster nominal appreciation or a sus-tained increase in domestic cost pressures that translates into larger inflation dif-ferentials relative to trading partners) or external demand is weaker, the current account will undoubtedly be below these projected ranges.
• Global Integrated Monetary and Fiscal Model (GIMF). The first approach uses the IMF’s multicountry dynamic general equilibrium model.7 The model captures the vertical trade structure and other key features of trade between China, advanced economies, emerging economies, and the rest of the world. Simulations using the GIMF show that a combination of stronger global demand and a lower fiscal deficit creates the conditions for a rise in exports and a decline in commodity imports. As a result, the current account surplus would be predicted to increase to about 4 percent in the medium term.
• Bayesian VAR (BVAR). The second method uses higher-frequency, quar-terly data based on the BVAR methodology (Österholm and Zettelmeyer, 2007). The model includes trading partners’ demand, domes-tic demand, property prices, consumer price index inflation, commodity price changes, interest rates, the fiscal balance (as a percentage of GDP), the current account balance (as a percentage of GDP), the money supply, and the REER. Similarly to the GIMF approach, the out-of-sample forecasts assume a steady path of fiscal consolidation and a global recovery as pro-jected by the WEO. Simulations using the BVAR model show a much stronger and earlier rise in the trade surplus. The model forecasts that the current account surplus would rise to about 5 percent of GDP by 2014 (Figure 1A.1).
• Reduced-form current account model. A third approach uses a set of vari-ables similar to those in the BVAR. Specifically, the reduced-form model relates China’s current account share of GDP to real GDP growth, China’s
7 See Kumhof and others (2010) for a description of the model.
©International Monetary Fund. Not for Redistribution

Ahuja, Chalk, Nabar, N’Diaye, and Porter 25
trading partners’ real GDP growth, the REER, the terms of trade, and ratio of the lagged current account to GDP. • The model was estimated for 1986−2011 using the generalized method
of moments approach. All parameters are significant and with signs con-sistent with economic theory (Table 1A.1).
• In the short term, a 1 percentage point increase in China’s real GDP growth reduces the current account surplus by 1/3 percent of GDP; a 1 percentage point increase in trading partners’ growth increases China’s current account surplus by about ½ percent of GDP; a 10 percent real effective exchange rate appreciation would lower the surplus by 1 percent of GDP; an improvement in the terms of trade up to a threshold would improve China’s current account surplus. Above that threshold, the income effect from the improvement in the terms of trade would start to dominate, leading to a reduction in the current account surplus as the terms of trade improve. In the longer term, the effects of these variables are about 2¾ times larger.
• The model predicts that a gradual strengthening of demand for China’s exports, steady annual GDP growth in China, a slight deterioration in the terms of trade, and a constant REER would leave China’s current account surplus at less than 4 percent of GDP by 2017 (Figure 1A.2). This predic-tion is despite an in-sample overestimation of the 2011 current account surplus by 2¼ percent of GDP (i.e., in 2011 the model predicts a current account surplus of 4¼ percent of GDP versus the 1.9 percent of GDP outturn).
0
2
4
6
8
2010 2012 2014 2016
WEO
Bayesian VAR
GIMF
Per
cent
of G
DP
Figure 1A.1 Current Account Balance Projections Using Different ModelsSource: IMF staff calculations.Note: GIMF = Global Integrated Monetary and Fixed Model; VAR = vector autoregression; WEO = IMF World Economic Outlook.
©International Monetary Fund. Not for Redistribution

26 An End to China’s Imbalances?
• Trade equations. One recurrent theme in estimating trade equations for China is that the estimated elasticity of exports to external demand is very large.8 At the same time, on the import side, an important driver of imports has been the level of exports (about ½ of imports in some way or another are destined as inputs for goods that are processed and then eventually exported to third countries). To take into account these two features of
8 For example, in Aziz and Li (2007), a 1 percent increase in external demand is associated with a 5 or 6 percent increase in China’s exports. This far outstrips the typical elasticity in other countries and is the counterpart of China’s rapid growth in global export market share. Such a large export response is clearly unsustainable and should eventually decline, although the timing of that decline is highly uncertain (Guo and N’Diaye, 2009).
−4
0
4
Per
cent
of G
DP
8
12
1986 1991 1996 2001 2006 2011 2016
Reduced-form modelforecast
WEO
Figure 1A.2 Current Account Forecast Based on Time Series ModelSources: IMF, World Economic Outlook; and IMF staff calculations.Note: WEO = World Economic Outlook.
TABLE 1A.1
Generalized Method of Moments Estimate of Current Account Balance(Percent of GDP)
Parameter Estimates
Real GDP growth −0.30 [.001]Trading partners, real GDP growth 0.43 [.000]REER −0.09 [.006]Terms of trade (lagged 1 year) 0.42 [.000]Terms of trade squared (lagged 1 year) −2.8E-03 [.000]Current account balance (lagged 1 year) 0.64 [.000]Dummy 2009–11 −2.99 [.000]J-stat 3.01
Source: IMF staff calculations.Note: Generalized method of moments estimates over the sample 1986–2011. Figures in brackets are p-values. REER = real effective exchange rate.
©International Monetary Fund. Not for Redistribution

Ahuja, Chalk, Nabar, N’Diaye, and Porter 27
China’s trade, a simple modified trade model is used.9 In particular, FDI is included in the export equation as a proxy for the expansion of China’s tradables production and increased involvement in cross-border production sharing. On the import side, the effect of processing trade is captured by including exports in the import equation. With FDI in the export regres-sion, the elasticity of exports to foreign demand falls from 5 to 2, whereas including exports in the import equation reduces the elasticity of imports to domestic demand from 1.4 to 0.6 (Table 1A.2). Using these models to forecast, and assuming a modest decline in inward FDI as a share of GDP, the trade surplus falls to about 3 percent of GDP in the medium term. However, the forecast is subject to significant uncertainty and is highly sensitive to the path of future FDI inflows; if FDI stays about the same share of GDP as in 2011, the model would forecast the trade surplus to be some 6 percentage points of GDP higher in the medium term.
9 See Bems and others (forthcoming) for details.
TABLE 1A.2
Trade Elasticities
Export Elasticities Import Elasticities
with respect to: Standard Model Augmented Model Standard Model Augmented Model
Foreign demand 5.46*** 2.28**FDI/GDP 2.15***
Domestic demand 1.39*** 0.62*Exports 0.49**
REER −0.32 −0.30** 0.52** 0.42*
Source: IMF staff calculations.Note: *significant at 10%; **significant at 5%; ***significant at 1%.FDI/GDP = Foreign direct investment divided by GDP; REER = Real effective exchange rate.
©International Monetary Fund. Not for Redistribution

28 An End to China’s Imbalances?
REFERENCES
Acharya, Viral V., and Philipp Schnabl, 2010, “Do Global Banks Spread Global Imbalances? The Case of Asset-Backed Commercial Paper during the Financial Crisis of 2007−09,” IMF Economic Review, Vol. 58, No. 1, pp. 37–73.
Ahuja, Ashvin, Nigel Chalk, Malhar Nabar, Papa N’Diaye, and Nathan Porter, 2012, “An End to China’s Imbalances,” IMF Working Paper 12/100 (Washington: International Monetary Fund).
Aziz, Jahangir, and Xiangming Li, 2007, “China’s Changing Trade Elasticities,” IMF Working Paper 07/266 (Washington: International Monetary Fund).
Bems, Rudolfs, Joshua Felman, David Reichsfeld, and Shaun Roache, forthcoming, “Why Has China’s Current Account Surplus Declined?” IMF Working Paper (Washington: International Monetary Fund).
Caballero, Ricardo, Emmanuel Farhi, and Pierre-Olivier Gourinchas, 2008, “An Equilibrium Model of ‘Global Imbalances’ and Low Interest Rates,” American Economic Review, Vol. 98, No. 1, pp. 358–93.
Cheung, Yin-Wong, Menzie Chinn, and XingWang Qian, 2012, “Are Chinese Trade Flows Different?” Journal of International Money and Finance, Vol. 31, No. 8, pp. 2127–46.
Cooper, Richard N., 2007, “Living with Global Imbalances,” Brookings Papers on Economic Activity, Vol. 2, pp. 91–110.
De Long, J. Bradford, 2008, “The Wrong Financial Crisis,” VOX. http://www.voxeu.org/index.php?q=node/2383.
Dooley, Michael P., David Folkerts-Landau, and Peter Garber, 2003, “An Essay on the Revived Bretton Woods System,” NBER Working Paper No. 9971 (Cambridge, Massachusetts: National Bureau of Economic Research).
———, 2004, “The Revived Bretton Woods System: The Effects of Periphery Intervention and Reserve Management on Interest Rates and Exchange Rates in Center Countries,” NBER Working Paper No. 10332 (Cambridge, Massachusetts: National Bureau of Economic Research).
———, 2009, “Bretton Woods II Still Defines the International Monetary System,” Pacific Economic Review, Vol. 14, No. 3, pp. 297–311.
The Economist, 2012, “Changing Migration Patterns: Welcome Home,” February 25.Gruber, Joseph W., and Steven B. Kamin, 2008, “Do Differences in Financial Development
Explain the Global Pattern of Current Account Imbalances?” International Finance Discussion Paper No. 923 (Washington: Board of Governors of the Federal Reserve System).
Guo, Kai, and Papa N’Diaye, 2009, “Is China’s Export-Oriented Growth Sustainable?” IMF Working Paper 09/172 (Washington: International Monetary Fund).
Huang, Yiping, 2010, “Krugman’s Chinese Renminbi Fallacy,” VoxEU.org, March 26.———, and Kunyu Tao, 2010, “Causes and Remedies of China’s External Imbalances,” China
Center for Economic Research Working Paper No. E2010002 (Beijing: Peking University).International Monetary Fund (IMF), 2010, “People’s Republic of China Article IV
Consultation—Staff Report; Staff Statement; Public Information Notice on the Executive Board Discussion,” IMF Country Report 10/238 (Washington).
———, 2011, “People’s Republic of China Article IV Consultation—Staff Report; Staff Statement; Public Information Notice on the Executive Board Discussion,” IMF Country Report 11/192 (Washington).
Kumhof, Michael, Douglas Laxton, Dirk Muir, and Susanna Mursula, 2010, “The Global Integrated Monetary and Fiscal Model—Theoretical Structure,” IMF Working Paper 10/34 (Washington: International Monetary Fund).
Mann, Catherine L., and Katharina Plück, 2007, “Understanding the U.S. Trade Deficit: A Disaggregated Perspective,” in G-7 Current Account Imbalances: Sustainability and Adjustment, ed. by Richard Clarida (Chicago: University of Chicago Press) pp. 247–82.
©International Monetary Fund. Not for Redistribution

Ahuja, Chalk, Nabar, N’Diaye, and Porter 29
Obstfeld, M., and K. Rogoff, 2005, “Global Current Account Imbalances and Exchange Rate Adjustments,” Brookings Papers on Economic Activity, 2005, Vol. 1, pp. 67–123.
———, 2010, “Global Imbalances and the Financial Crisis: Products of Common Causes,” in Asia and the Global Financial Crisis, ed. by Reuven Glick and Mark M. Spiegel (San Francisco: Federal Reserve Bank of San Francisco).
Österholm, P., and J. Zettelmeyer, 2007, “The Effect of External Conditions on Growth in Latin America,” IMF Working Paper 07/176 (Washington: International Monetary Fund).
Roubini, Nouriel, and Brad Setser, 2005, “Will the Bretton Woods 2 Regime Unravel Soon? The Risk of a Hard Landing in 2005−2006,” Paper presented at the Symposium on the “Revived Bretton Woods System: A New Paradigm for Asian Development?” organized by the Federal Reserve Bank of San Francisco and the University of California Berkeley, San Francisco, February 4.
©International Monetary Fund. Not for Redistribution

To purchase a copy of the complete book or for additional information on IMF publications, please visit
www.imfbookstore.org
To download digital formats, visit the IMF eLibrary www.elibrary.imf.org