Embed Size (px)
Citation preview

China: Towards Low Carbon Green Development
Qi Ye
Climate Policy Initiative (CPI)
Tsinghua University
Beijing, China
Sciences Po and IDDRI, Paris, 4 May 2011

OUTLINE
Carbon Emission from China and the Carbon Intensity of the Chinese Economy
Efforts to Reduce Carbon Intensity
Towards a Low-Carbon, Green Economy
International Cooperation

Carbon Emission of from China
The largest carbon emitter in the worldThe largest energy consumer in the
world In 2010: 3.2 5billion tce of energy consumption 7 billion tCO2 emission from fossil fuel
combustion

An energy and carbon intensive economy
Energy intensity
5X Japan 3X US
Is China’s economy inefficient?

Benchmarking: Power generation
1985 1990 1995 2000 2005 2010250
270
290
310
330
350
370
390
410
317 315303 301299300
292
392
379
363
343342332
322
China
Source:
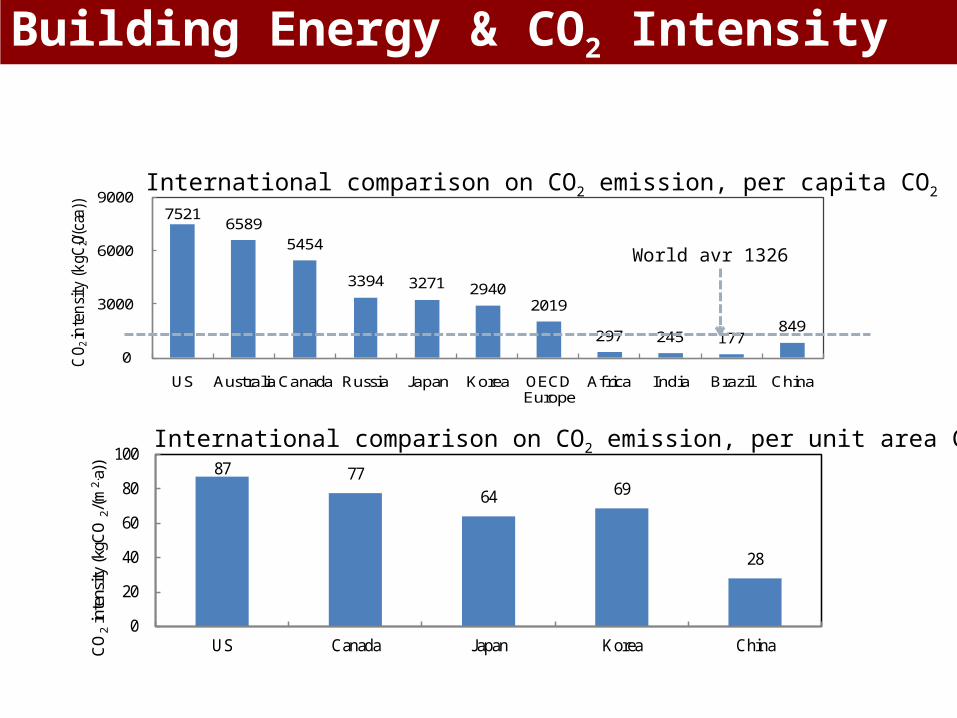
Building Energy & CO2 Intensity
87 77 64 69
28
0
20
40
60
80
100
US Canada Japan Korea ChinaCO
2in
tens
ity (k
gCO
2/(m
2.a)
)
International comparison on CO2 emission, per unit area CO2
7521 6589
5454
3394 3271 2940 2019
297 245 177 849
0
3000
6000
9000
US Australia Canada Russia Japan Korea OECDEurope
Africa India Brazil China
CO
2in
ten
sity
(kgC
O 2/(c
a. a))
World avr 1326
International comparison on CO2 emission, per capita CO2
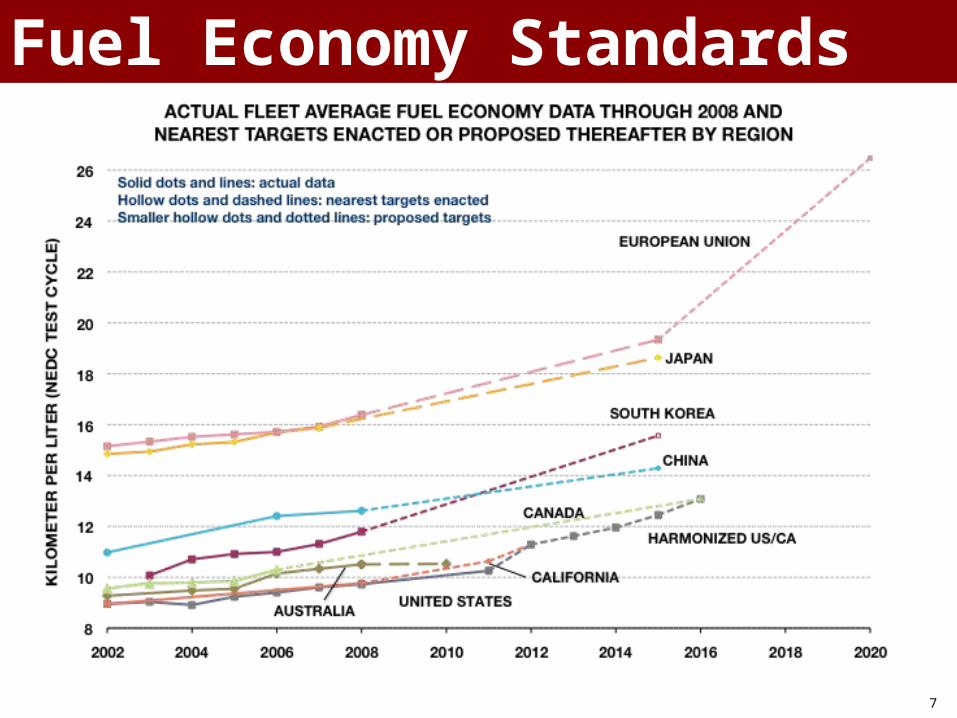
Fuel Economy Standards
7
88
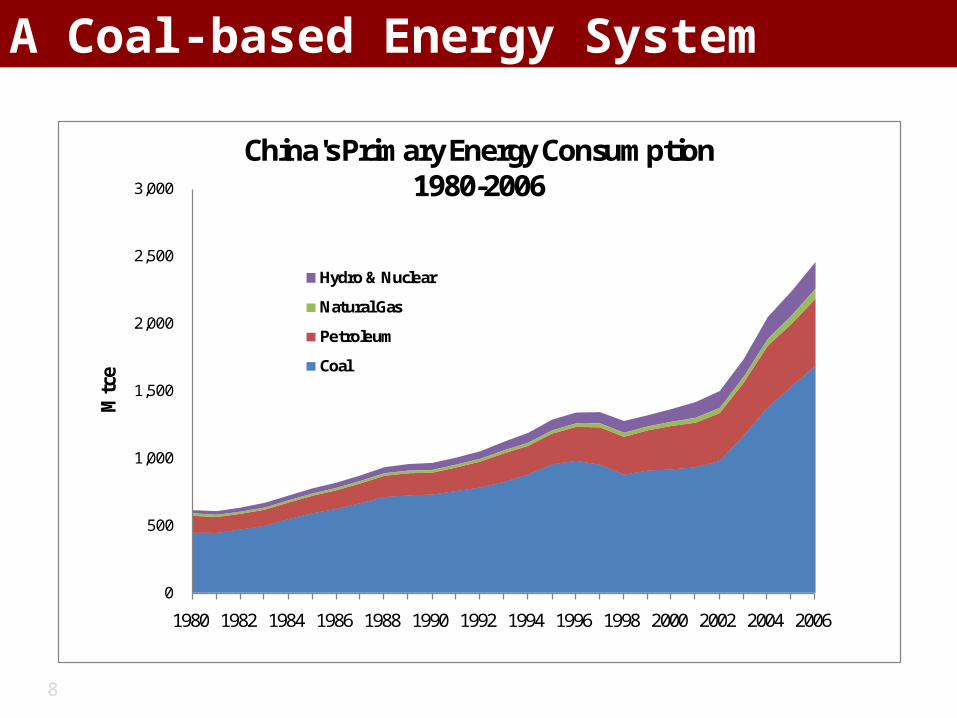
A Coal-based Energy System
0
500
1,000
1,500
2,000
2,500
3,000
1980 1982 1984 1986 1988 1990 1992 1994 1996 1998 2000 2002 2004 2006
Mtc
e
China's Primary Energy Consumption1980-2006
Hydro & Nuclear
Natural Gas
Petroleum
Coal

99
Resource endowment
Coal238 billion tons coal equivalent
97% total fossil fuel reserve base
Oil Natural Gas
Source: NBS, 2007.
10
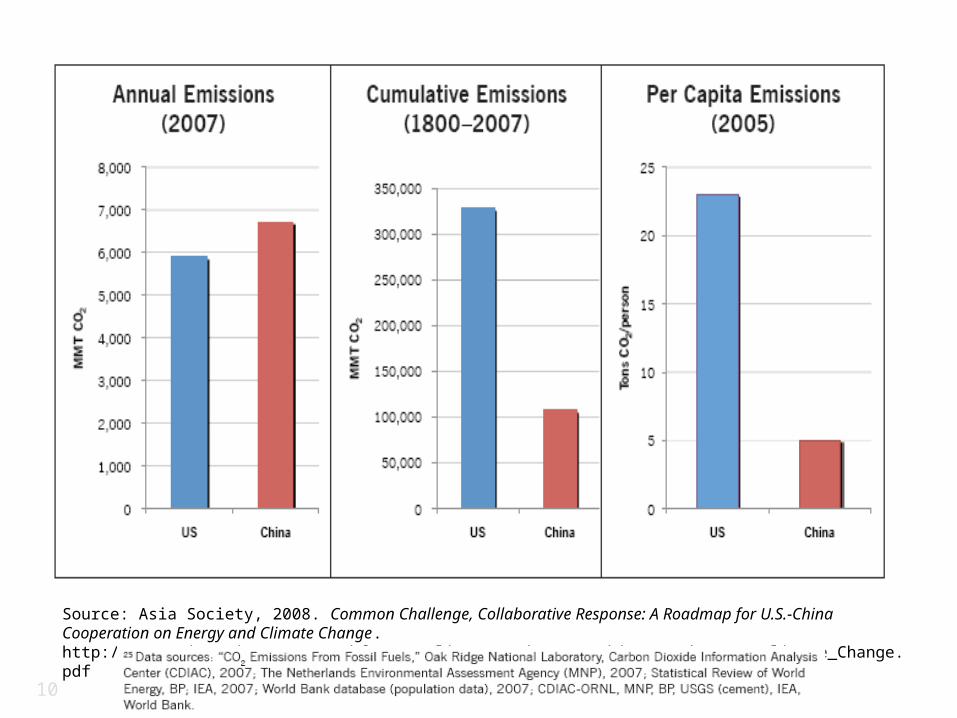
中美碳排放比较
Source: Asia Society, 2008. Common Challenge, Collaborative Response: A Roadmap for U.S.-China Cooperation on Energy and Climate Change. http://www.asiasociety.org/taskforces/climateroadmap/US_China_Roadmap_on_Climate_Change.pdf

1111
Per capita CO2 Emission
Source: Historical 1950-2005 US, China and global emissions data from Oak Ridge National Laboratory, Carbon Dioxide Information Analysis Center; 2006-2007 US, China and global emissions data are preliminary estimates from Carbon Dioxide Information Analysis Center; 2006-2007 population data of China from China Statistical Bureau; 2006-2007 US and global population data from US Census.
-
5
10
15
20
25
1950 1954 1958 1962 1966 1970 1974 1978 1982 1986 1990 1994 1998 2002 2006
Tonn
es o
f CO
2/Pe
rson
Per Capita Energy Related CO2 Emissions1950-2007
China
US
Global Average
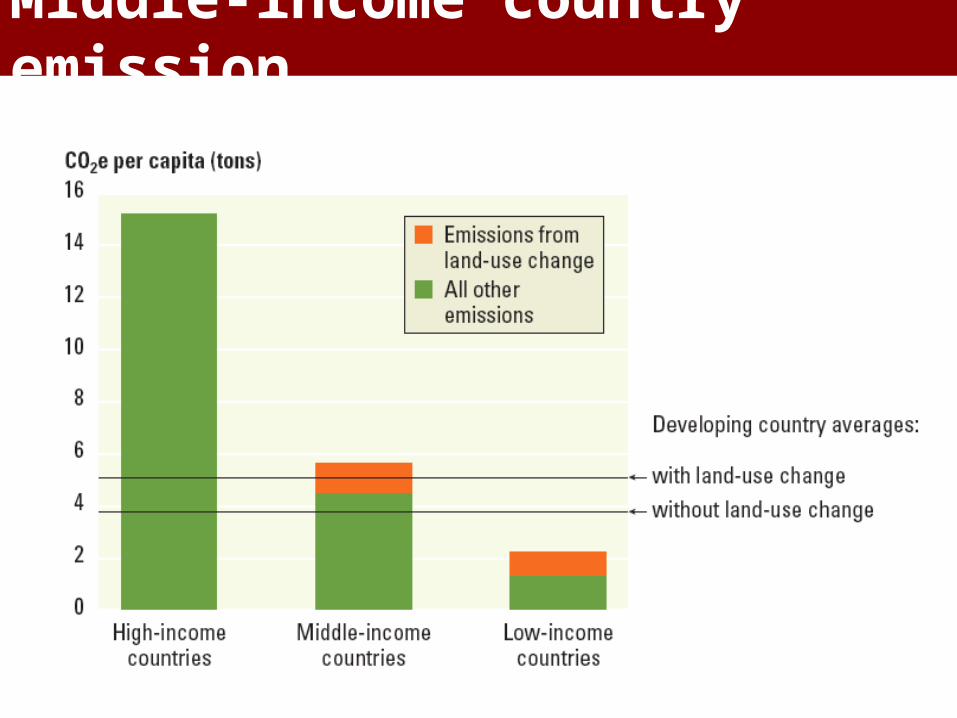
Middle-income country emission

Efforts to Reduce Energy Intensity
The largest carbon emitter in the worldThe largest energy consumer in the
world In 2010: 3.2 5billion tce of energy consumption 7 billion tCO2 emission from fossil fuel
combustion

1414 Source: National Bureau of Statistics, China Statistical Abstract, various years.
Effort to Reduce Energy Intensity
0
500
1,000
1,500
2,000
2,500
3,000
3,500
4,000
4,500
1980 1985 1990 1995 2000 2005
kg c
oal e
quiv
alen
t/10
,000
(200
0) R
MB
Average Annual Decline of5% per year
Average Annual Increase of2% per year

On track to goalDuring the 11th FYP, China was on track to meet energy intensity target, reversed an upward trend of energy intensity between 2002 and 2005.
19801982
19841986
19881990
19921994
19961998
20002002
20042006
20080.0
0.5
1.0
1.5
2.0
2.5
3.0
3.5
1.20
1.16
1.22 1.29
1.28
1.24 1.18
1.12 1.08
En
erg
y In
ten
sit
y (
tce
/10
4 R
MB
)
10 th FYP 11 th FYP

1616
Reversal of the trend
Note: energy intensity values are calculated using deflated year 2000 GDP values; expressed in kilograms coal equivalent primary energy consumption per reminbi GDP.
2000 2001 2002 2003 2004 2005 2006 2007 2008 20091.00
1.05
1.10
1.15
1.20
1.25
1.19
1.14
1.11
1.16
1.22 1.23
1.20
1.16
1.10
1.08

The Power Sector

Decarbonization of power industry: 2005 - 2008
2005 2006 2007 2008
Power industry total capacity (GW) 517 621 713 791
Thermal power capacity (GW) 391 484 554 601
Hydro power capacity (GW) 117 129 145 172
Wind power capacity (GW) 1.1 1.9 4.0 8.9
Nuclear power capacity (GW) 6.9 6.9 8.9 9.1
Power industry total generation (TWh) 2500 2866 3282 3467
Thermal power generation (TWh) 2047 2370 2723 2790
Hydro power generation (TWh) 397 436 485 585
Wind power generation (TWh) 1 3 6 13
Nuclear power generation (TWh) 53 55 62 68
Power industry CO2 emission intensity (gCO2/kWh) 766.8 772.4 760.3 716.6
Thermal power industry carbon emission intensity (gCO2/kWh) 935.8 933.2 914.7 887.8

Renewable Energy and Nuclear Power
Installation: Renewable energy: 226GW in 2009;
Hydro: 200GW in 2010 (20GW added each year);
Wind power was 25.8GW in 2009 (annual growth of 130% from 2006 to 2009)
Generation: Renewables and nuclear power: 18.5% of national total in 2009. The electricity generated by hydro, wind and nuclear power increased from 2005’s 451.4TWh to 2009’s 666.7TWh, 47.7% higher than 2005 level, and the growth rate surpassed that of thermal power (36.3%).

Thermal Power: Structure and Efficiency
Closure of small and inefficient power plants: 72 GW, 20% more than total capacity of UK. 26.17GW closed in 2009 alone.
Structural change: 34% of units larger than 600MW in 2009 as compared to 13% in 2005; and proportion of units smaller than 300MW decreased from 53% to 31%, respectively.

2000 2001 2002 2003 2004 2005 2006 2007 2008 20090
5000
10000
15000
20000
25000
30000
新增装机 (MW) 累计装机 (MW)
Wind Power Installation
Source:

Policies for decarbonization of the power industry

The Manufacturing Industry Sector

Energy and Carbon Intensity
2005~2008, energy intensity decreased 13.3%, an 4.6% average annual reduction.
2005~2008, carbon intensity decreased 14.8%, a 5.4% average annual reduction.
2.10 2.05 1.93
1.82
0
0.5
1
1.5
2
2.5
2005 2006 2007 2008
单位
工业
增加
值能
耗(
tce/
万元
)
(年)
(a)
5.08 4.96 4.58
4.30
0
1
2
3
4
5
6
2005 2006 2007 2008单位
工业
增加
值C
O2排
放(
t-C
O2/万
元)
(年)
(b)
Ene
rgy
inte
nsity
(tc
e/10
4R
MB
)
CO
2 em
issi
ons
inte
nsity
(tc
e/10
4R
MB
)

Energy Savings in Manufacturing Sector
2006~2008, the industrial sector achieved cumulative energy savings of 421Mtce (frozen 2005 energy intensity baseline).
2006~2008, the industrial sector achieved aggregate CO2 emission reduction of 1170MtCO2.
2006 2007 2008
1618
1417
1546
1866
1451
1686
248
34
140
Unit: Mtce
Baseline
Energy savings
Actual energy consumption
2006 2007 2008
3814
3425
3674
4509
3505
4073
695
80
398
Unit:MtCO2
Baseline
CO2 emissions Reduction
Actual CO2 emissions

Goal: Reduce energy intensity from 2005-2010 by 20%
Manufacturing Sector Policy and Energy Saved
Policy Energy savings, 2006-2009
Contribution to 20% EI reduction
Top 1000 Energy Consuming Enterprises
132Mtce (exceeds target)
27%
Ten Key Energy Conservation Projects
140 Mtce (2006-2008) 29%
Small Plant Closures 110 Mtce 22%
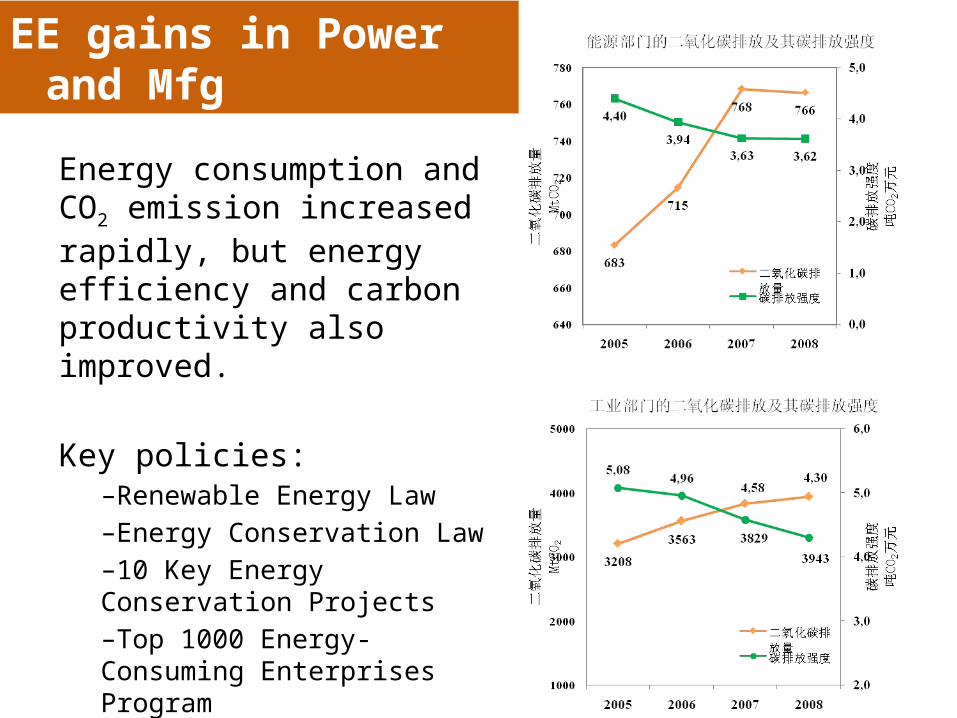
EE gains in Power and Mfg
Energy consumption and CO2 emission increased rapidly, but energy efficiency and carbon productivity also improved.
Key policies:–Renewable Energy Law–Energy Conservation Law–10 Key Energy Conservation Projects–Top 1000 Energy-Consuming Enterprises Program–Plant Closure Program

The Building Sector
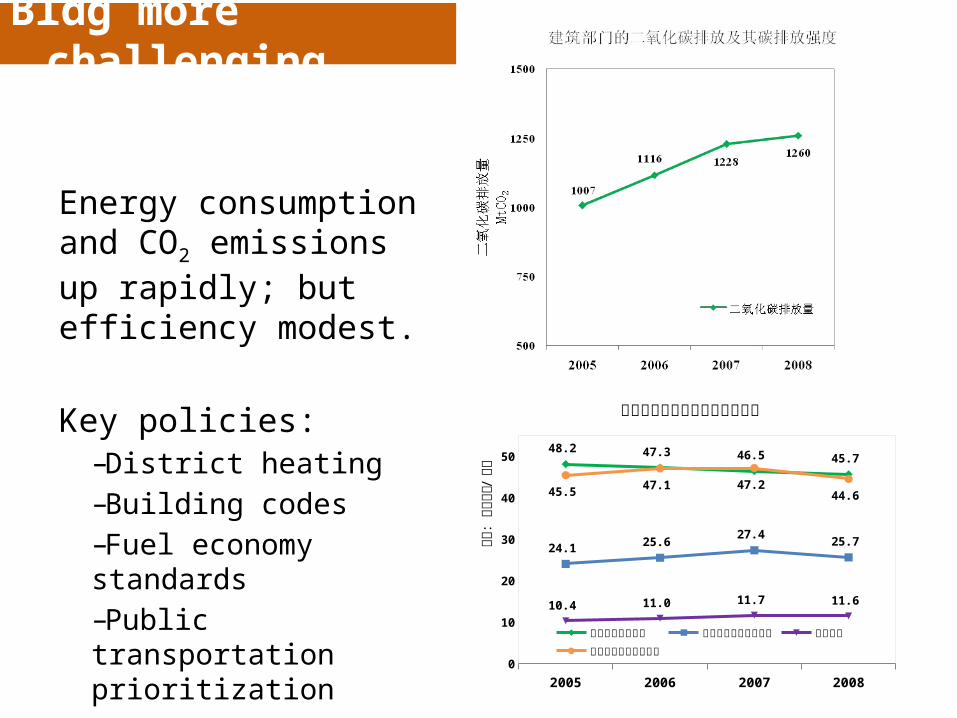
Bldg more challenging
Energy consumption and CO2 emissions up rapidly; but efficiency modest.
Key policies: –District heating–Building codes–Fuel economy standards–Public transportation prioritization
2005 2006 2007 20080
10
20
30
40
5048.2 47.3 46.5 45.7
24.1 25.6 27.4
25.7
10.4 11.0 11.7 11.6
45.5 47.1 47.2
44.6
不同建筑类型的单位建筑碳排放
北方城镇集中采暖 城镇住宅除集中采暖外农村住宅 公共建筑除集中采暖外
单位:千克标煤
/平米
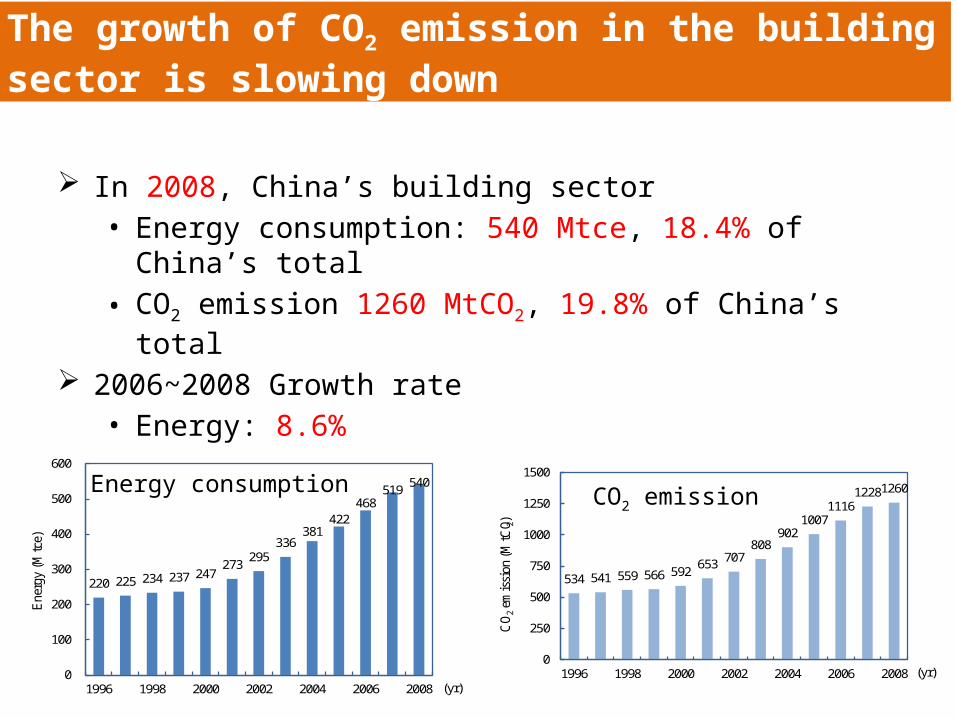
The growth of CO2 emission in the building sector is slowing down
In 2008, China’s building sector• Energy consumption: 540 Mtce, 18.4% of China’s total
• CO2 emission 1260 MtCO2, 19.8% of China’s total
2006~2008 Growth rate• Energy: 8.6%
• CO2: 7.8%
220 225 234 237 247 273
295 336
381 422
468 519
540
0
100
200
300
400
500
600
1996 1998 2000 2002 2004 2006 2008
Ene
rgy
(Mtc
e)
(yr)
534 541 559 566 592 653 707
808 902
1007 1116
1228 1260
0
250
500
750
1000
1250
1500
1996 1998 2000 2002 2004 2006 2008
CO
2em
issi
on (
MtC
O 2)
(yr)
Energy consumption CO2 emission

75% of the energy saving targets by 11th FYP has been fulfilled during 2006~2008
2006 2007 2008
540
468
519
581
480
544
40.1
11.7
25.3
Unit: Mtce
Baseline
Energy savings
Actual energy consumption
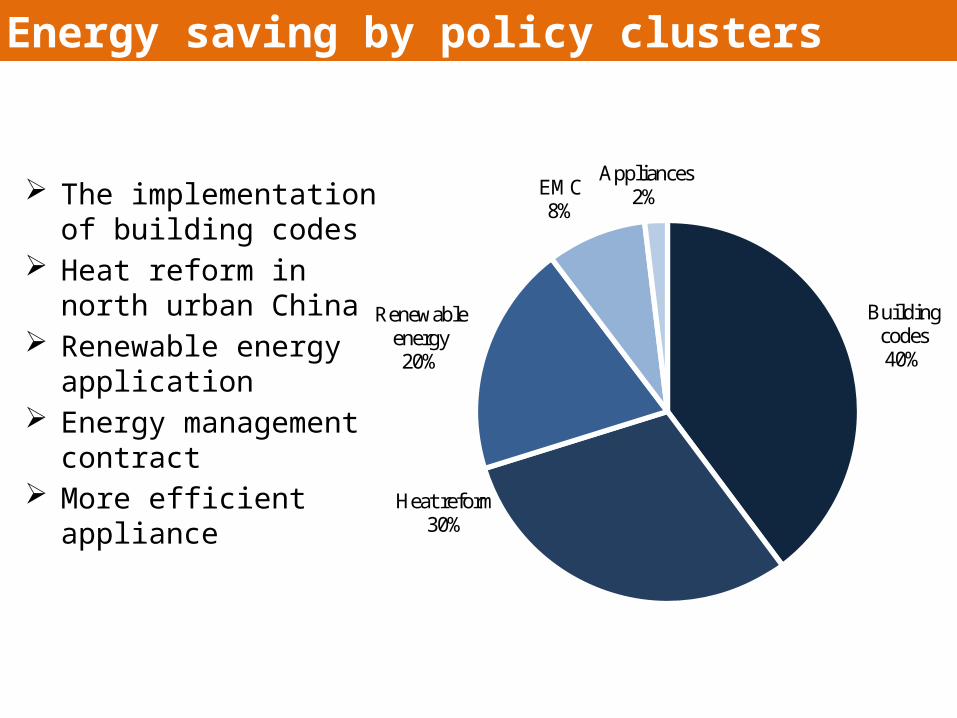
Energy saving by policy clusters
Building codes40%
Heat reform30%
Renewable energy20%
EMC8%
Appliances2% The implementation of
building codes Heat reform in north urban
China Renewable energy
application Energy management contract More efficient appliance

The Transportation Sector

2005 2006 2007 20080
200
400
600
800
1000
509557
604631
交通部门的二氧化碳排放量
二氧化碳排放量
MtCO2
Transportation

3. More Energy-intensive TransportationP
asse
nger
Tra
nspo
rt
Fre
igh
t T
ran
spor
t
(a) Passenger mode share change, passenger-kilometers travelled(b) Freight mode share change, ton-kilometers travelled
(Sources: China Transportation Yearbook)

The Agriculture and Forestry Sector

GHG Emissions/Absorptions of the Agriculture and Forestry Sector
Direct CO2 Emissions Other Greenhouse Gas Emissions
CO2 Absorptions Indirect Embedded CO2 Emissions
Other Greenhouse Gas (GHG) EmissionsDirect CO2 Emissions
Fertilizers production
Pesticides production
Agricultural machinery depreciation
Agricultural film production
Rice cultivationFertilizers application
Livestock enteric fermentation
Livestock manure management
ForestryAgricultural
soil
CO2 CH4 N2O
Fossil energy consumption
122131 164158 66.1 110
420 50.7 272 13.6 6.37 24.4
CO2 Absorptions Indirect CO2 Emissions (Embedded Carbon)
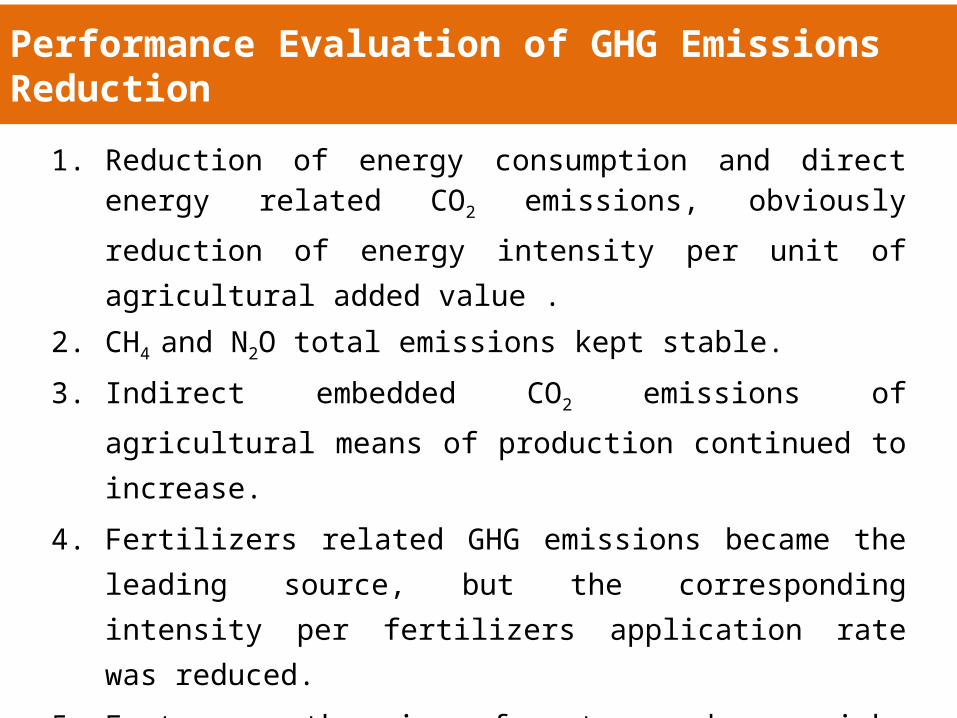
Performance Evaluation of GHG Emissions Reduction
1. Reduction of energy consumption and direct energy related CO2 emissions, obviously reduction of energy intensity per
unit of agricultural added value .
2. CH4 and N2O total emissions kept stable.
3. Indirect embedded CO2 emissions of agricultural means of
production continued to increase.
4. Fertilizers related GHG emissions became the leading
source, but the corresponding intensity per fertilizers
application rate was reduced.
5. Fast growth in forest carbon sink, effectively increase in
agricultural soil.
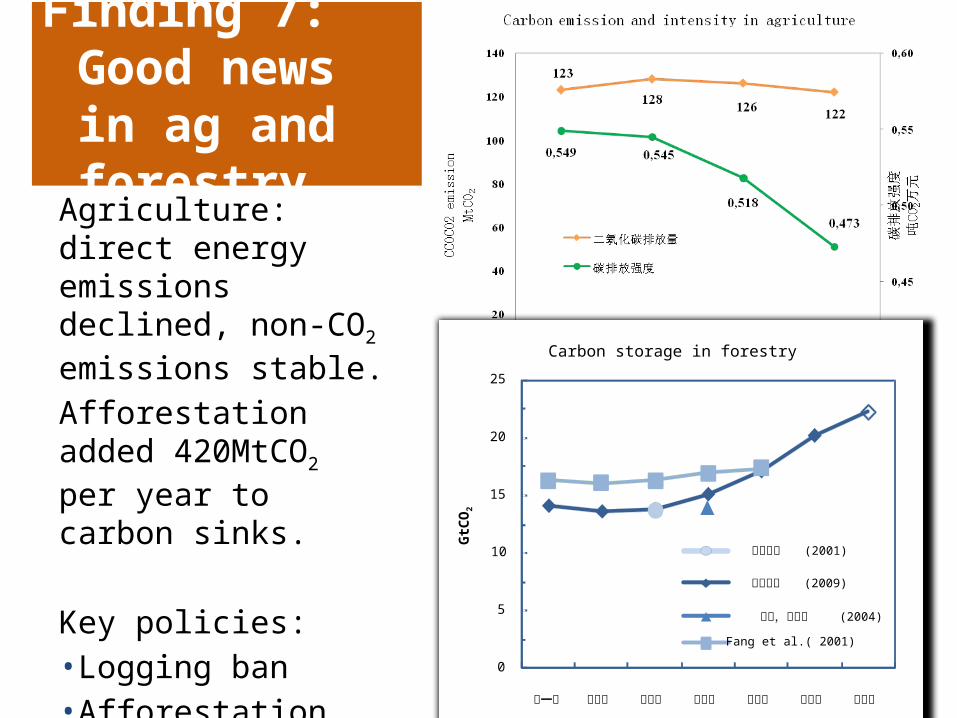
Finding 7: Good news in ag and forestry
Agriculture: direct energy emissions declined, non-CO2 emissions stable.
Afforestation added 420MtCO2 per year to carbon sinks.
Key policies:•Logging ban•Afforestation
0
5
10
15
20
25
第一次 第二次 第三次 第四次 第五次 第六次 第七次
赵敏,周广胜 (2004)
李克让等 (2009)
Fang et al.( 2001)
王效科等 (2001)
Carbon storage in forestry
GtC
O2

Energy efficiency reduces carbon emission China’s carbon emissions intensity fell
largely as a result of energy intensity decrease, effect of energy mix was insignificant.
Policies that target emissions (not just energy) would accelerate reduction of carbon intensity.

Effective but not efficient policies
The most effective policies were top-down administrative measures such as the target responsibility system (TRS).
More cost-effective policies are needed to achieve future targets.

Much of the low-hanging fruit for reducing energy intensity has been picked (e.g., small plant closures). Economic structure has improved. Further reductions in energy intensity during the 12th FYP period will be more challenging.
Low-hanging fruit picked
Source: Xu Huaqing, 2007; State electricity regulatory commission, 2010

12th FYP: Towards A Low Carbon Green Economy
• A national consensus• Restructuring of economy• Emission reduction, not just energy efficiency• Consumption side management
• Market-based instruments: • ETS pilot• Energy Performance Contracting• Carbon tax
• Coal (energy) consumption cap and trade

International Cooperation
• The need for cooperation• Break the Prisoner’s dilemma• Build a shared vision of a green economy• Take small but concrete steps

Thank you very much for your attention !


![Wu Yun Liu Qi - China Dragon · Day 6 –Case Study ... ‘Wu-Yun Liu-Qi Theory for Clinical Practice’ 22nd ... Yang Shouzhong] (1999) ‘A Study of Daoist Acupuncture & Moxibustion’](https://img.dokumen.tips/doc/110x75/5b25a58b7f8b9af5448b4953/wu-yun-liu-qi-china-day-6-case-study-wu-yun-liu-qi-theory-for-clinical.jpg)