Embed Size (px)
Citation preview

7 December 2010 Nomura
AN
CH
OR
R
EP
OR
T
Nomura Anchor Reports examine the key themes and value drivers that underpin our sector views and stock recommendations for the next 6 to 12 months.
Any authors named on this report are research analysts unless otherwise indicated. See the important disclosures and analyst certifications on pages 172 to 176.
Strategy | C H I N A 2011 Outlook Henry Wu, CFA +852 2252 2122 [email protected]
And the China Equity Research Team
Higher ground Following the rebound of 2009 and consolidation of 2010, we are positive on the outlook for China’s equity markets in 2011F. We have year-end targets for the MSCI China Index and HSCEI Index of 83 and 16,000, implying 24% and 25% upside potential, respectively. We see index performance being backed by: 1) 21%+ earnings growth, with large-cap sectors such as Financials and Energy on course to deliver strong earnings; 2) attractive valuations (on our forecasts, 13x FY11F earnings, in line with the past 10-year average, and 2.5x price/book with RoE of 20%); and 3) a positive liquidity outlook. We believe fundamentals will provide the surest footing for stock pickers in 2011. Sectors with improving earnings prospects and strong RoEs are best placed to scale the heights, in our view, particularly when there are uncertainties on the policy front and the cost of capital is on the rise. While concerns over high inflation could weigh on equity market performance in the short term, we recommend investors position themselves for resulting buying opportunities, since historically the market tends to rally once inflation has peaked out. Our 10 stocks for 2011: Agile Properties, ABC, China Everbright International, China Life Insurance, China Mengniu Dairy, CRCC, Gome, Perfect World, Sinopec and ZTE.
20%-plus upside potential for the markets in 2011
Inflation to weigh on performance in short term
Sector scorecard –leveraging Nomura’s bottom-up research
Our top 10 for 2011
TOP DOWN
Stocks for action
Our top picks are front-line beneficiaries
of investment opportunities in China in
2011, and feature strong earnings
growth potential, healthy balance
sheets, and attractive valuations.
Stock Rating Price Price
target
Agile Properties (3383 HK) BUY 11.1 13.3
Agricultural Bank of China (1288 HK) BUY 4.1 4.7
China Everbright (257 HK) BUY 4.4 6.1
China Life Insurance (2628 HK) BUY 33.7 40.0
China Mengniu (2319 HK) BUY 22.7 32.0
China Railway Construction Corp (1186 HK)
BUY 9.4 11.8
Gome Electrical Appliances (493 HK) BUY 3.2 4.3
Perfect World (PWRD US)* BUY 23.7 37.0
Sinopec (386 HK) BUY 7.3 9.6
ZTE Corp (763 HK) BUY 29.4 36.0
Priced as at 1 December 2010 close; local currency
* Priced as at 30 November 2010 close
Analyst Henry Wu, CFA
+852 2252 2122
And the China Equity Research Team
N O M U R A I N T E R N A T I O N A L ( H K ) L I M I T E D
Don’t miss our companion outlook reports on Asia, Singapore and
Malaysia, published 6 December, 2010.
7 December 2010 Nomura 1
Strategy | C H I N A 2011 Outlook Henry Wu, CFA +852 2252 2122 [email protected]
And the China Equity Research Team
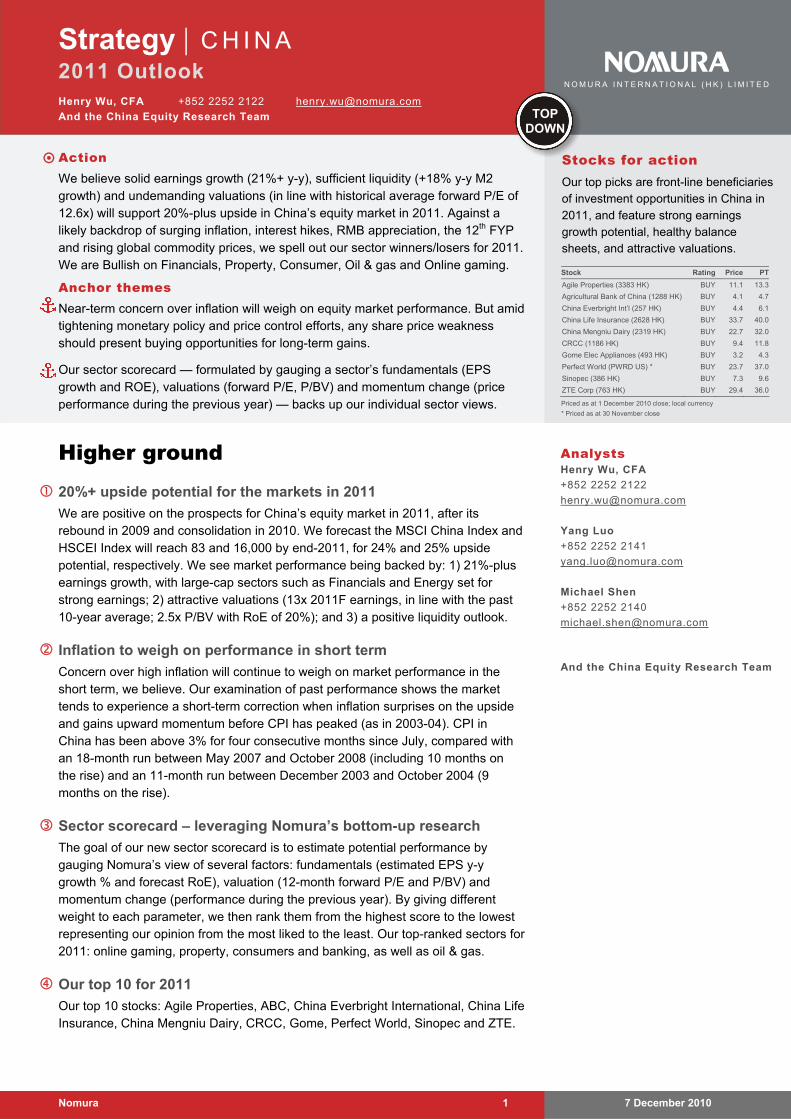
Action We believe solid earnings growth (21%+ y-y), sufficient liquidity (+18% y-y M2
growth) and undemanding valuations (in line with historical average forward P/E of 12.6x) will support 20%-plus upside in China’s equity market in 2011. Against a likely backdrop of surging inflation, interest hikes, RMB appreciation, the 12th FYP and rising global commodity prices, we spell out our sector winners/losers for 2011. We are Bullish on Financials, Property, Consumer, Oil & gas and Online gaming.
Anchor themes Near-term concern over inflation will weigh on equity market performance. But amidtightening monetary policy and price control efforts, any share price weakness should present buying opportunities for long-term gains.
Our sector scorecard — formulated by gauging a sector’s fundamentals (EPS growth and ROE), valuations (forward P/E, P/BV) and momentum change (price performance during the previous year) — backs up our individual sector views.
Higher ground 20%+ upside potential for the markets in 2011
We are positive on the prospects for China’s equity market in 2011, after its rebound in 2009 and consolidation in 2010. We forecast the MSCI China Index and HSCEI Index will reach 83 and 16,000 by end-2011, for 24% and 25% upside potential, respectively. We see market performance being backed by: 1) 21%-plus earnings growth, with large-cap sectors such as Financials and Energy set for strong earnings; 2) attractive valuations (13x 2011F earnings, in line with the past 10-year average; 2.5x P/BV with RoE of 20%); and 3) a positive liquidity outlook.
Inflation to weigh on performance in short term
Concern over high inflation will continue to weigh on market performance in the short term, we believe. Our examination of past performance shows the market tends to experience a short-term correction when inflation surprises on the upside and gains upward momentum before CPI has peaked (as in 2003-04). CPI in China has been above 3% for four consecutive months since July, compared with an 18-month run between May 2007 and October 2008 (including 10 months on the rise) and an 11-month run between December 2003 and October 2004 (9 months on the rise).
Sector scorecard – leveraging Nomura’s bottom-up research
The goal of our new sector scorecard is to estimate potential performance by gauging Nomura’s view of several factors: fundamentals (estimated EPS y-y growth % and forecast RoE), valuation (12-month forward P/E and P/BV) and momentum change (performance during the previous year). By giving different weight to each parameter, we then rank them from the highest score to the lowest representing our opinion from the most liked to the least. Our top-ranked sectors for 2011: online gaming, property, consumers and banking, as well as oil & gas.
Our top 10 for 2011
Our top 10 stocks: Agile Properties, ABC, China Everbright International, China Life Insurance, China Mengniu Dairy, CRCC, Gome, Perfect World, Sinopec and ZTE.
N O M U R A I N T E R N A T I O N A L ( H K ) L I M I T E D
Stocks for action Our top picks are front-line beneficiaries of investment opportunities in China in 2011, and feature strong earnings growth potential, healthy balance sheets, and attractive valuations.
Stock Rating Price PT
Agile Properties (3383 HK) BUY 11.1 13.3
Agricultural Bank of China (1288 HK) BUY 4.1 4.7
China Everbright Int’l (257 HK) BUY 4.4 6.1
China Life Insurance (2628 HK) BUY 33.7 40.0
China Mengniu Dairy (2319 HK) BUY 22.7 32.0
CRCC (1186 HK) BUY 9.4 11.8
Gome Elec Appliances (493 HK) BUY 3.2 4.3
Perfect World (PWRD US) * BUY 23.7 37.0
Sinopec (386 HK) BUY 7.3 9.6
ZTE Corp (763 HK) BUY 29.4 36.0
Priced as at 1 December 2010 close; local currency
* Priced as at 30 November close
TOPDOWN
Analysts Henry Wu, CFA
+852 2252 2122
Yang Luo
+852 2252 2141
Michael Shen
+852 2252 2140
And the China Equity Research Team
Strategy | China Henry Wu, CFA
7 December 2010 Nomura 2
Contents
Executive summary 4
Investment risks 19
Higher ground 20
Macro-economic growth will remain healthy in 2011… 21 … and corporate earnings growth too 22 Sufficient liquidity will add fuel 25 Undemanding looking valuations 32
Investment opportunities in 2011 36 Consumption – long-term positive 36 Inflation makes the difference 36 Price controls – 2003, 2007, 2011? 38 Interest rate hikes – can’t be any more aggressive than in 2006-07 45 Implementation of 12th FYP presents investment opportunities 47 We know how to appreciate renminbi appreciation 47
Commodity price hikes: thank you, QE! 50
Scorecard — playing to win 51 It has worked in the past 52
Nomura insights 54 Nomura’s China coverage 54 Major calendar events in 2011 55 Stocks: historical performance recap 55 Nomura Survey – Ideas for 2011 55 MSCI China Index components 55
Strategy | China Henry Wu, CFA
7 December 2010 Nomura 3
Sector summaries
Autos and Auto Parts 66
Banks 68
Cement 70
Container box manufacturing 72
Food & Beverages 74
China Healthcare & Pharmaceutical 78
Industrials 82
Insurance 84
Online gaming & media 88
Macau gaming 92
Oil and Gas 94
Retail 98
Shipping 102
Steel 104
Telecom services 106
Telecom equipment 108
Transport 110
Power, Utilities, Coal and Renewable 112
Property 116
Stock picks 121
Agile Properties 122
Agricultural Bank of China 126
China Everbright International 130
China Life Insurance 134
China Mengniu Dairy 138
China Railway Construction Corp 142
Gome Electrical Appliances 146
Perfect World 150
Sinopec 154
ZTE Corp 158
Appendix
Valuation methodology and risks 162
Strategy | China Henry Wu, CFA
7 December 2010 Nomura 4
Summary
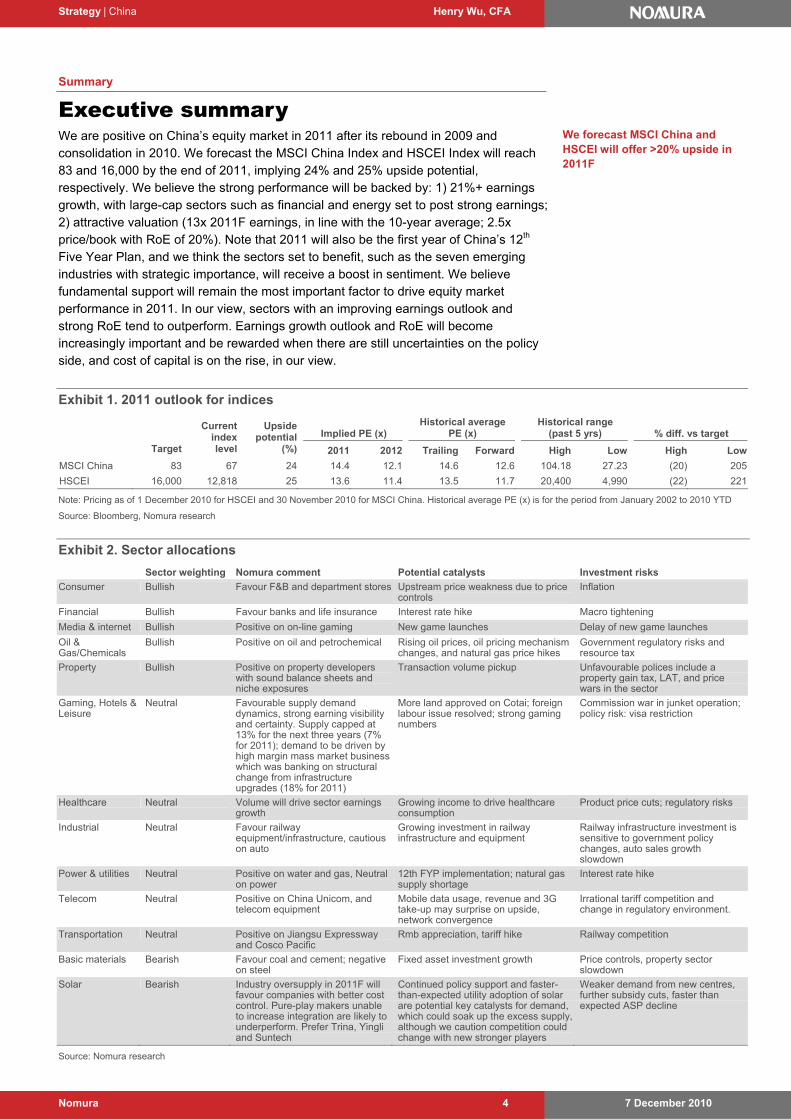
Executive summary We are positive on China’s equity market in 2011 after its rebound in 2009 and consolidation in 2010. We forecast the MSCI China Index and HSCEI Index will reach 83 and 16,000 by the end of 2011, implying 24% and 25% upside potential, respectively. We believe the strong performance will be backed by: 1) 21%+ earnings growth, with large-cap sectors such as financial and energy set to post strong earnings; 2) attractive valuation (13x 2011F earnings, in line with the 10-year average; 2.5x price/book with RoE of 20%). Note that 2011 will also be the first year of China’s 12th Five Year Plan, and we think the sectors set to benefit, such as the seven emerging industries with strategic importance, will receive a boost in sentiment. We believe fundamental support will remain the most important factor to drive equity market performance in 2011. In our view, sectors with an improving earnings outlook and strong RoE tend to outperform. Earnings growth outlook and RoE will become increasingly important and be rewarded when there are still uncertainties on the policy side, and cost of capital is on the rise, in our view.
Exhibit 1. 2011 outlook for indices
Implied PE (x) Historical average
PE (x) Historical range
(past 5 yrs) % diff. vs target
Target
Current index level
Upside potential
(%) 2011 2012 Trailing Forward High Low High Low
MSCI China 83 67 24 14.4 12.1 14.6 12.6 104.18 27.23 (20) 205
HSCEI 16,000 12,818 25 13.6 11.4 13.5 11.7 20,400 4,990 (22) 221
Note: Pricing as of 1 December 2010 for HSCEI and 30 November 2010 for MSCI China. Historical average PE (x) is for the period from January 2002 to 2010 YTD
Source: Bloomberg, Nomura research
Exhibit 2. Sector allocations
Sector weighting Nomura comment Potential catalysts Investment risks
Consumer Bullish Favour F&B and department stores Upstream price weakness due to price controls
Inflation
Financial Bullish Favour banks and life insurance Interest rate hike Macro tightening
Media & internet Bullish Positive on on-line gaming New game launches Delay of new game launches
Oil & Gas/Chemicals
Bullish Positive on oil and petrochemical Rising oil prices, oil pricing mechanism changes, and natural gas price hikes
Government regulatory risks and resource tax
Property Bullish Positive on property developers with sound balance sheets and niche exposures
Transaction volume pickup Unfavourable polices include a property gain tax, LAT, and price wars in the sector
Gaming, Hotels & Leisure
Neutral Favourable supply demand dynamics, strong earning visibility and certainty. Supply capped at 13% for the next three years (7% for 2011); demand to be driven by high margin mass market business which was banking on structural change from infrastructure upgrades (18% for 2011)
More land approved on Cotai; foreign labour issue resolved; strong gaming numbers
Commission war in junket operation; policy risk: visa restriction
Healthcare Neutral Volume will drive sector earnings growth
Growing income to drive healthcare consumption
Product price cuts; regulatory risks
Industrial Neutral Favour railway equipment/infrastructure, cautious on auto
Growing investment in railway infrastructure and equipment
Railway infrastructure investment is sensitive to government policy changes, auto sales growth slowdown
Power & utilities Neutral Positive on water and gas, Neutral on power
12th FYP implementation; natural gas supply shortage
Interest rate hike
Telecom Neutral Positive on China Unicom, and telecom equipment
Mobile data usage, revenue and 3G take-up may surprise on upside, network convergence
Irrational tariff competition and change in regulatory environment.
Transportation Neutral Positive on Jiangsu Expressway and Cosco Pacific
Rmb appreciation, tariff hike Railway competition
Basic materials Bearish Favour coal and cement; negative on steel
Fixed asset investment growth Price controls, property sector slowdown
Solar Bearish Industry oversupply in 2011F will favour companies with better cost control. Pure-play makers unable to increase integration are likely to underperform. Prefer Trina, Yingli and Suntech
Continued policy support and faster-than-expected utility adoption of solar are potential key catalysts for demand, which could soak up the excess supply, although we caution competition could change with new stronger players
Weaker demand from new centres, further subsidy cuts, faster than expected ASP decline
Source: Nomura research
We forecast MSCI China and HSCEI will offer >20% upside in 2011F
Strategy | China Henry Wu, CFA
7 December 2010 Nomura 5
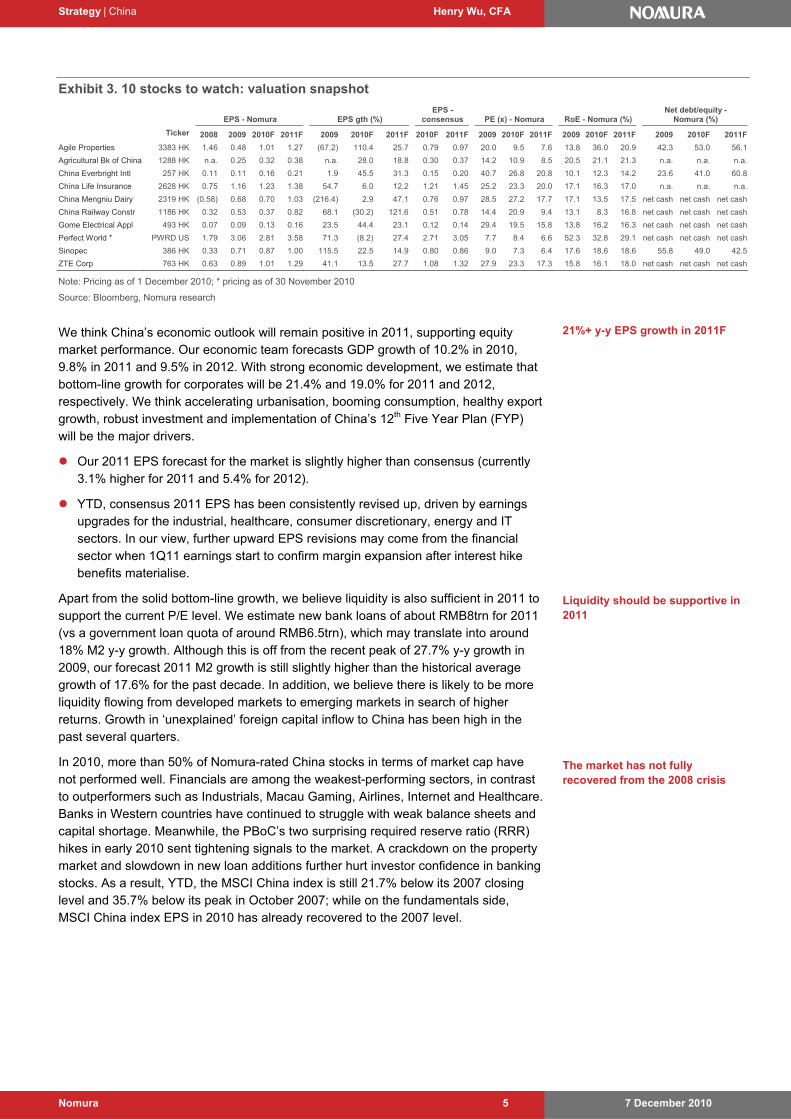
Exhibit 3. 10 stocks to watch: valuation snapshot
EPS - Nomura EPS gth (%) EPS -
consensus PE (x) - Nomura RoE - Nomura (%) Net debt/equity -
Nomura (%)
Ticker 2008 2009 2010F 2011F 2009 2010F 2011F 2010F 2011F 2009 2010F 2011F 2009 2010F 2011F 2009 2010F 2011F
Agile Properties 3383 HK 1.46 0.48 1.01 1.27 (67.2) 110.4 25.7 0.79 0.97 20.0 9.5 7.6 13.8 36.0 20.9 42.3 53.0 56.1
Agricultural Bk of China 1288 HK n.a. 0.25 0.32 0.38 n.a. 28.0 18.8 0.30 0.37 14.2 10.9 8.5 20.5 21.1 21.3 n.a. n.a. n.a.
China Everbright Intl 257 HK 0.11 0.11 0.16 0.21 1.9 45.5 31.3 0.15 0.20 40.7 26.8 20.8 10.1 12.3 14.2 23.6 41.0 60.8
China Life Insurance 2628 HK 0.75 1.16 1.23 1.38 54.7 6.0 12.2 1.21 1.45 25.2 23.3 20.0 17.1 16.3 17.0 n.a. n.a. n.a.
China Mengniu Dairy 2319 HK (0.58) 0.68 0.70 1.03 (216.4) 2.9 47.1 0.76 0.97 28.5 27.2 17.7 17.1 13.5 17.5 net cash net cash net cash
China Railway Constr 1186 HK 0.32 0.53 0.37 0.82 68.1 (30.2) 121.6 0.51 0.78 14.4 20.9 9.4 13.1 8.3 16.8 net cash net cash net cash
Gome Electrical Appl 493 HK 0.07 0.09 0.13 0.16 23.5 44.4 23.1 0.12 0.14 29.4 19.5 15.8 13.8 16.2 16.3 net cash net cash net cash
Perfect World * PWRD US 1.79 3.06 2.81 3.58 71.3 (8.2) 27.4 2.71 3.05 7.7 8.4 6.6 52.3 32.8 29.1 net cash net cash net cash
Sinopec 386 HK 0.33 0.71 0.87 1.00 115.5 22.5 14.9 0.80 0.86 9.0 7.3 6.4 17.6 18.6 18.6 55.8 49.0 42.5
ZTE Corp 763 HK 0.63 0.89 1.01 1.29 41.1 13.5 27.7 1.08 1.32 27.9 23.3 17.3 15.8 16.1 18.0 net cash net cash net cash
Note: Pricing as of 1 December 2010; * pricing as of 30 November 2010
Source: Bloomberg, Nomura research
We think China’s economic outlook will remain positive in 2011, supporting equity market performance. Our economic team forecasts GDP growth of 10.2% in 2010, 9.8% in 2011 and 9.5% in 2012. With strong economic development, we estimate that bottom-line growth for corporates will be 21.4% and 19.0% for 2011 and 2012, respectively. We think accelerating urbanisation, booming consumption, healthy export growth, robust investment and implementation of China’s 12th Five Year Plan (FYP) will be the major drivers.
Our 2011 EPS forecast for the market is slightly higher than consensus (currently 3.1% higher for 2011 and 5.4% for 2012).
YTD, consensus 2011 EPS has been consistently revised up, driven by earnings upgrades for the industrial, healthcare, consumer discretionary, energy and IT sectors. In our view, further upward EPS revisions may come from the financial sector when 1Q11 earnings start to confirm margin expansion after interest hike benefits materialise.
Apart from the solid bottom-line growth, we believe liquidity is also sufficient in 2011 to support the current P/E level. We estimate new bank loans of about RMB8trn for 2011 (vs a government loan quota of around RMB6.5trn), which may translate into around 18% M2 y-y growth. Although this is off from the recent peak of 27.7% y-y growth in 2009, our forecast 2011 M2 growth is still slightly higher than the historical average growth of 17.6% for the past decade. In addition, we believe there is likely to be more liquidity flowing from developed markets to emerging markets in search of higher returns. Growth in ‘unexplained’ foreign capital inflow to China has been high in the past several quarters.
In 2010, more than 50% of Nomura-rated China stocks in terms of market cap have not performed well. Financials are among the weakest-performing sectors, in contrast to outperformers such as Industrials, Macau Gaming, Airlines, Internet and Healthcare. Banks in Western countries have continued to struggle with weak balance sheets and capital shortage. Meanwhile, the PBoC’s two surprising required reserve ratio (RRR) hikes in early 2010 sent tightening signals to the market. A crackdown on the property market and slowdown in new loan additions further hurt investor confidence in banking stocks. As a result, YTD, the MSCI China index is still 21.7% below its 2007 closing level and 35.7% below its peak in October 2007; while on the fundamentals side, MSCI China index EPS in 2010 has already recovered to the 2007 level.
21%+ y-y EPS growth in 2011F
Liquidity should be supportive in 2011
The market has not fully recovered from the 2008 crisis
Strategy | China Henry Wu, CFA
7 December 2010 Nomura 6
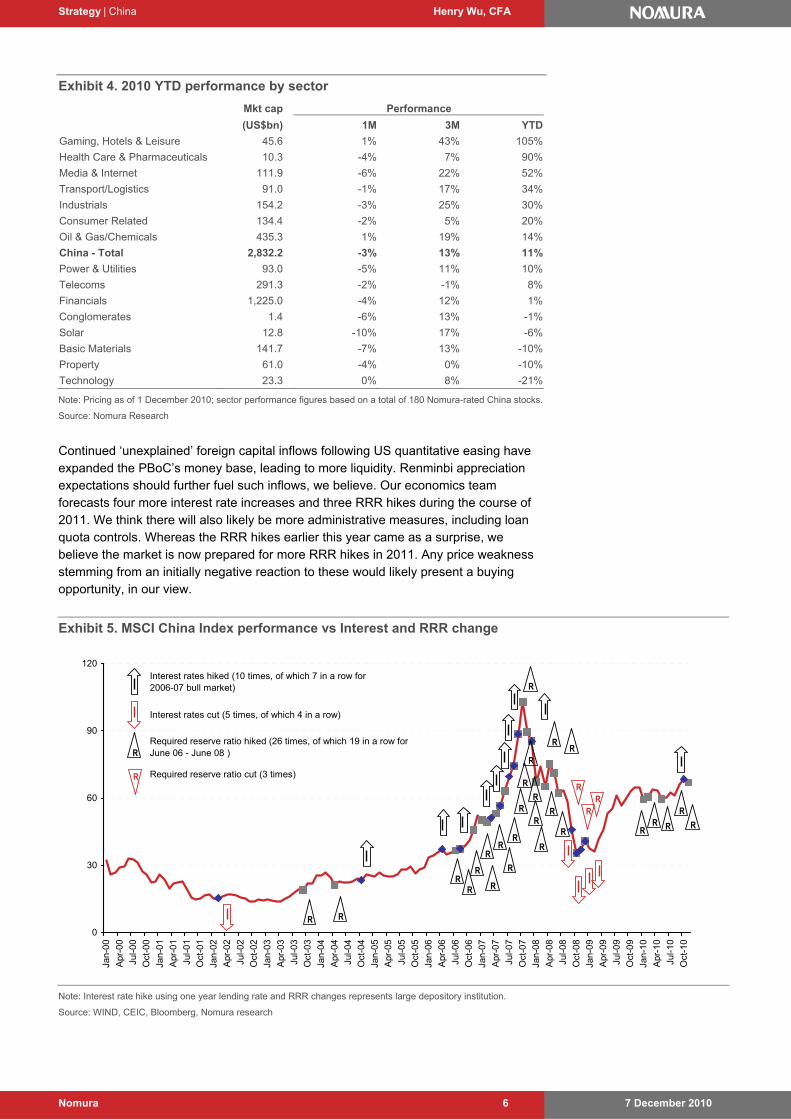
Exhibit 4. 2010 YTD performance by sector
Mkt cap Performance
(US$bn) 1M 3M YTD
Gaming, Hotels & Leisure 45.6 1% 43% 105%
Health Care & Pharmaceuticals 10.3 -4% 7% 90%
Media & Internet 111.9 -6% 22% 52%
Transport/Logistics 91.0 -1% 17% 34%
Industrials 154.2 -3% 25% 30%
Consumer Related 134.4 -2% 5% 20%
Oil & Gas/Chemicals 435.3 1% 19% 14%
China - Total 2,832.2 -3% 13% 11%
Power & Utilities 93.0 -5% 11% 10%
Telecoms 291.3 -2% -1% 8%
Financials 1,225.0 -4% 12% 1%
Conglomerates 1.4 -6% 13% -1%
Solar 12.8 -10% 17% -6%
Basic Materials 141.7 -7% 13% -10%
Property 61.0 -4% 0% -10%
Technology 23.3 0% 8% -21%
Note: Pricing as of 1 December 2010; sector performance figures based on a total of 180 Nomura-rated China stocks.
Source: Nomura Research
Continued ‘unexplained’ foreign capital inflows following US quantitative easing have expanded the PBoC’s money base, leading to more liquidity. Renminbi appreciation expectations should further fuel such inflows, we believe. Our economics team forecasts four more interest rate increases and three RRR hikes during the course of 2011. We think there will also likely be more administrative measures, including loan quota controls. Whereas the RRR hikes earlier this year came as a surprise, we believe the market is now prepared for more RRR hikes in 2011. Any price weakness stemming from an initially negative reaction to these would likely present a buying opportunity, in our view.
Exhibit 5. MSCI China Index performance vs Interest and RRR change
0
30
60
90
120
Jan-
00
Apr
-00
Jul-0
0
Oct
-00
Jan-
01
Apr
-01
Jul-0
1
Oct
-01
Jan-
02
Apr
-02
Jul-0
2
Oct
-02
Jan-
03
Apr
-03
Jul-0
3
Oct
-03
Jan-
04
Apr
-04
Jul-0
4
Oct
-04
Jan-
05
Apr
-05
Jul-0
5
Oct
-05
Jan-
06
Apr
-06
Jul-0
6
Oct
-06
Jan-
07
Apr
-07
Jul-0
7
Oct
-07
Jan-
08
Apr
-08
Jul-0
8
Oct
-08
Jan-
09
Apr
-09
Jul-0
9
Oct
-09
Jan-
10
Apr
-10
Jul-1
0
Oct
-10
R
R
R
R
RR
R
R
R
R
R
R
R
R
R
R
R
R
R
R
RR
R
RR
RR R
Interest rates hiked (10 times, of which 7 in a row for 2006-07 bull market)
Interest rates cut (5 times, of which 4 in a row)
Required reserve ratio hiked (26 times, of which 19 in a row for June 06 - June 08 )
Required reserve ratio cut (3 times)
R
R
R
Note: Interest rate hike using one year lending rate and RRR changes represents large depository institution.
Source: WIND, CEIC, Bloomberg, Nomura research
Strategy | China Henry Wu, CFA
7 December 2010 Nomura 7
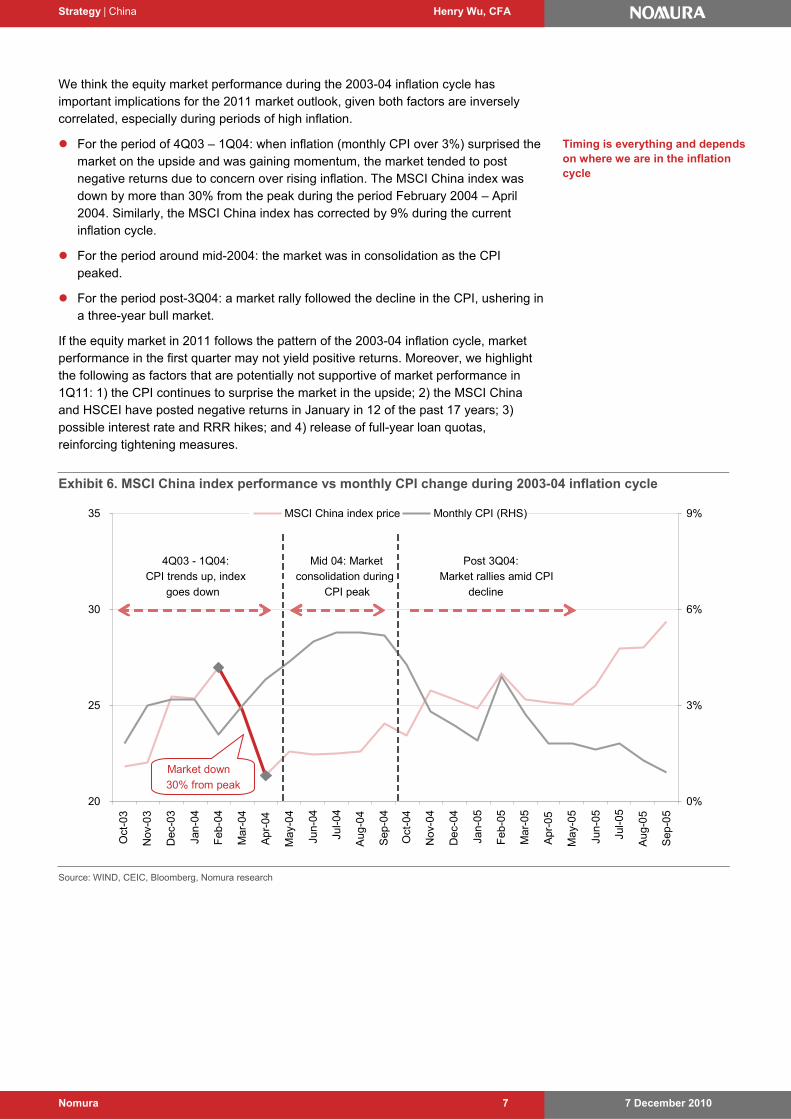
We think the equity market performance during the 2003-04 inflation cycle has important implications for the 2011 market outlook, given both factors are inversely correlated, especially during periods of high inflation.
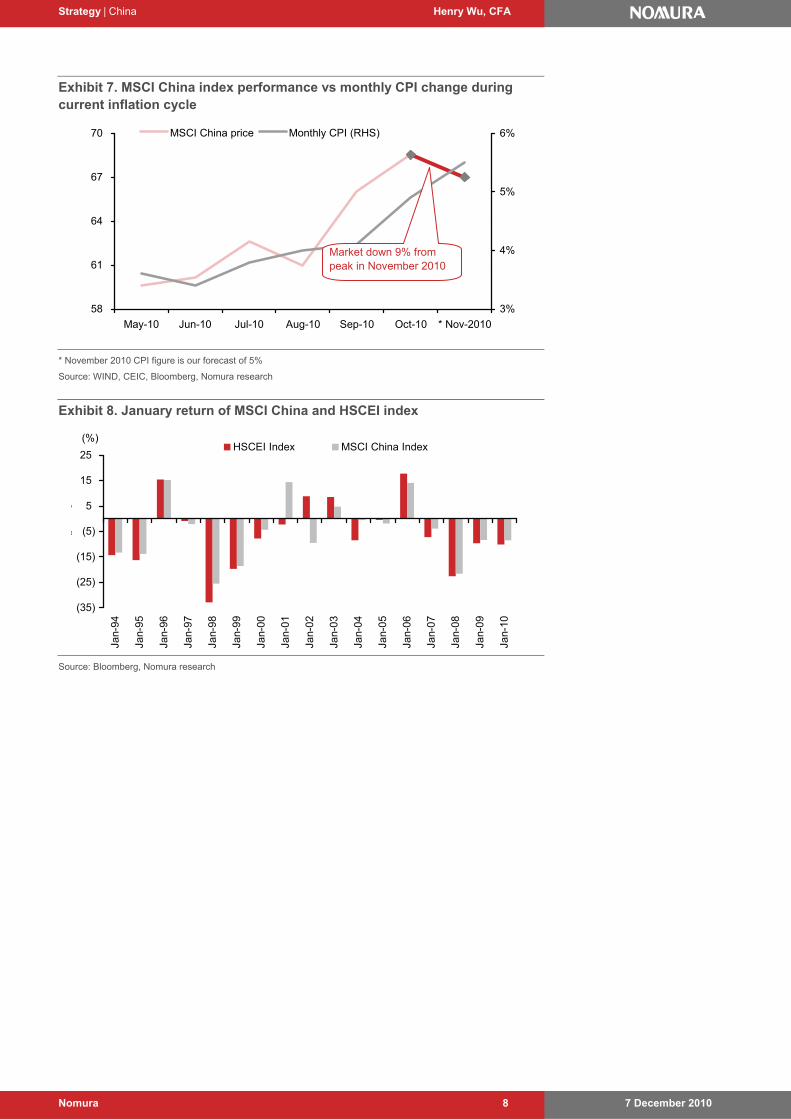
For the period of 4Q03 – 1Q04: when inflation (monthly CPI over 3%) surprised the market on the upside and was gaining momentum, the market tended to post negative returns due to concern over rising inflation. The MSCI China index was down by more than 30% from the peak during the period February 2004 – April 2004. Similarly, the MSCI China index has corrected by 9% during the current inflation cycle.
For the period around mid-2004: the market was in consolidation as the CPI peaked.
For the period post-3Q04: a market rally followed the decline in the CPI, ushering in a three-year bull market.
If the equity market in 2011 follows the pattern of the 2003-04 inflation cycle, market performance in the first quarter may not yield positive returns. Moreover, we highlight the following as factors that are potentially not supportive of market performance in 1Q11: 1) the CPI continues to surprise the market in the upside; 2) the MSCI China and HSCEI have posted negative returns in January in 12 of the past 17 years; 3) possible interest rate and RRR hikes; and 4) release of full-year loan quotas, reinforcing tightening measures.
Exhibit 6. MSCI China index performance vs monthly CPI change during 2003-04 inflation cycle
20
25
30
35
Oct
-03
Nov
-03
Dec
-03
Jan-
04
Feb
-04
Mar
-04
Apr
-04
May
-04
Jun-
04
Jul-0
4
Aug
-04
Sep
-04
Oct
-04
Nov
-04
Dec
-04
Jan-
05
Feb
-05
Mar
-05
Apr
-05
May
-05
Jun-
05
Jul-0
5
Aug
-05
Sep
-05
0%
3%
6%
9%MSCI China index price Monthly CPI (RHS)
Market down
30% from peak
4Q03 - 1Q04: CPI trends up, index
goes down
Mid 04: Market consolidation during
CPI peak
Post 3Q04: Market rallies amid CPI
decline
Source: WIND, CEIC, Bloomberg, Nomura research
Timing is everything and depends on where we are in the inflation cycle
Strategy | China Henry Wu, CFA
7 December 2010 Nomura 8
Exhibit 7. MSCI China index performance vs monthly CPI change during current inflation cycle
58
61
64
67
70
May-10 Jun-10 Jul-10 Aug-10 Sep-10 Oct-10 * Nov-2010
3%
4%
5%
6%MSCI China price Monthly CPI (RHS)
Market down 9% from peak in November 2010
* November 2010 CPI figure is our forecast of 5%
Source: WIND, CEIC, Bloomberg, Nomura research
Exhibit 8. January return of MSCI China and HSCEI index
(35)
(25)
(15)
% (5)
% 5
15
25
Jan-
94
Jan-
95
Jan-
96
Jan-
97
Jan-
98
Jan-
99
Jan-
00
Jan-
01
Jan-
02
Jan-
03
Jan-
04
Jan-
05
Jan-
06
Jan-
07
Jan-
08
Jan-
09
Jan-
10
HSCEI Index MSCI China Index(%)
Source: Bloomberg, Nomura research
Strategy | China Henry Wu, CFA
7 December 2010 Nomura 9
Exhibit 9. Overview of MSCI China sector performance
(%) 2000 2001 2002 2003 2004 2005 2006 2007 2008 2009 2010 YTD
MSCI China Index 22.8 16.8 14.1 25.5 25.3 29.3 52.3 85.5 40.9 64.9 67.0
MSCI China Return (32) (26) (16) 80 (1) 16 79 64 (52) 59 3
-Consumer-Discretionary (33) 28 2 104 (20) (10) 37 73 (64) 146 3
-Energy n.a. 4 19 137 2 32 67 61 (57) 74 13
-Consumer-Staple (41) 10 (20) 224 (24) 0 89 48 (41) 113 5
-Healthcare n.a. (9) 100 77 (17) (41) (28) n.a. n.a. 39 20
-Material (29) (10) 28 225 (2) 13 89 99 (69) 82 (1)
-Industrial (25) (23) (1) 70 14 (7) 48 104 (62) 46 6
-Telecom services n.a. (36) (32) 40 7 30 77 96 (45) (4) 0
-IT (3) (13) (36) 25 (34) 5 (7) 20 (57) 231 7
-Utilities 79 34 4 96 (18) (7) 49 59 (40) (2) (11)
-Financial 2 37 (44) 89 (5) 20 138 34 (46) 68 (1)
Macro
Inflation (CPI) - Actual 0.4 0.7 (0.8) 1.2 3.9 1.8 1.5 4.8 5.9 (0.7) 3.3*
Inflation (CPI) - Target n.a. n.a. n.a. n.a. n.a. 4.0 3.0 3.0 4.8 4.0 3.0
Lending Rate (1Y) - - -54bp - +27bp - +54bp +135bp -216bp - +25bp
FX-RMB Change 0.0 0.0 0.0 0.0 0.0 2.6 3.3 6.9 6.9 0.1 3.5*
M2 growth, Y-y 14.0 14.4 16.8 19.6 14.6 17.6 16.9 16.7 17.8 27.7 19.3
Company Fundamentals
EPS 0.66 1.11 1.34 1.68 2.16 2.41 2.57 3.81 3.16 3.83 4.8**
EPS Growth (78) 68 21 25 29 12 7 48 (17) 21 26
ROE 10 20 16 16 19 21 20 23 18 19 20**
Company Valuation
Forward PB (x) 2.4 1.4 1.1 1.9 1.7 1.8 2.4 3.7 1.6 2.2 2.0**
Forward PE (x) 20.5 12.6 8.4 11.8 10.5 11.4 13.7 27.1 10.7 13.4 12.1**
Note: Pricing date as of 30 November, 2010; * Nomura estimate; ** consensus estimate
Source: WIND, CEIC, Bloomberg, Nomura research
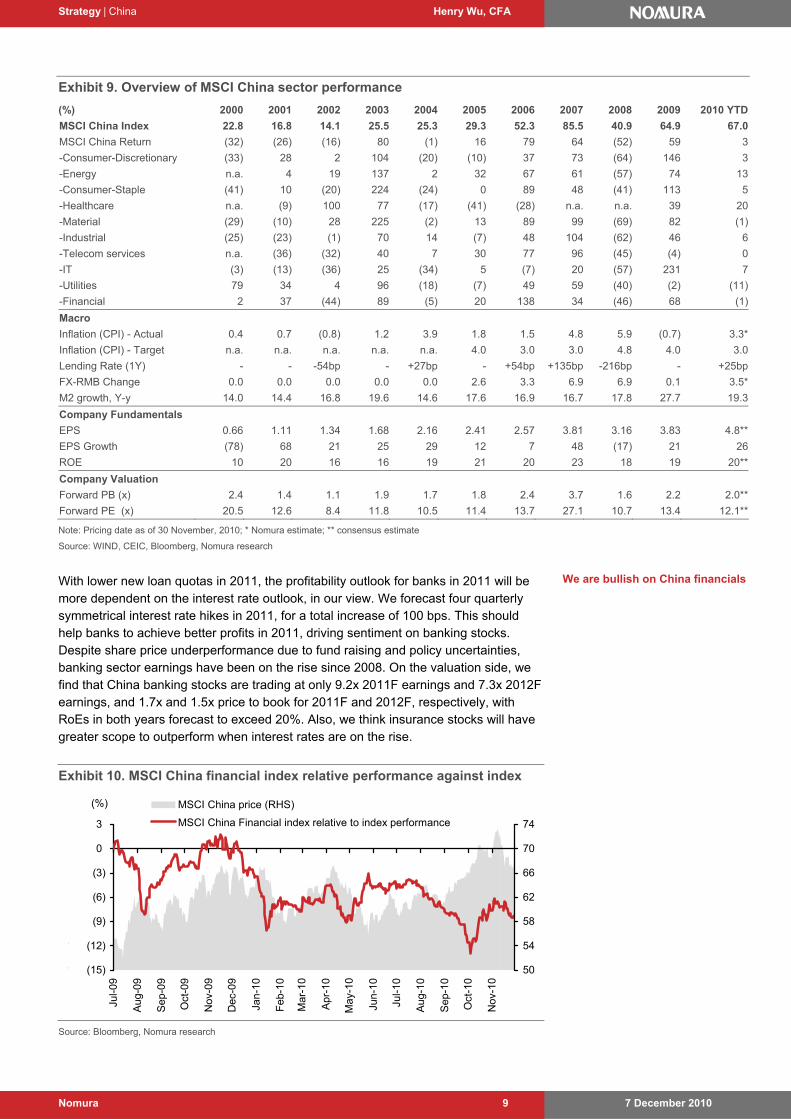
With lower new loan quotas in 2011, the profitability outlook for banks in 2011 will be more dependent on the interest rate outlook, in our view. We forecast four quarterly symmetrical interest rate hikes in 2011, for a total increase of 100 bps. This should help banks to achieve better profits in 2011, driving sentiment on banking stocks. Despite share price underperformance due to fund raising and policy uncertainties, banking sector earnings have been on the rise since 2008. On the valuation side, we find that China banking stocks are trading at only 9.2x 2011F earnings and 7.3x 2012F earnings, and 1.7x and 1.5x price to book for 2011F and 2012F, respectively, with RoEs in both years forecast to exceed 20%. Also, we think insurance stocks will have greater scope to outperform when interest rates are on the rise.
Exhibit 10. MSCI China financial index relative performance against index
% (15)
% (12)
% (9)
% (6)
% (3)
% 0
% 3
Jul-0
9
Aug
-09
Sep
-09
Oct
-09
Nov
-09
Dec
-09
Jan-
10
Feb
-10
Mar
-10
Apr
-10
May
-10
Jun-
10
Jul-1
0
Aug
-10
Sep
-10
Oct
-10
Nov
-10
50
54
58
62
66
70
74
MSCI China price (RHS)
MSCI China Financial index relative to index performance
(%)
Source: Bloomberg, Nomura research
We are bullish on China financials
Strategy | China Henry Wu, CFA
7 December 2010 Nomura 10
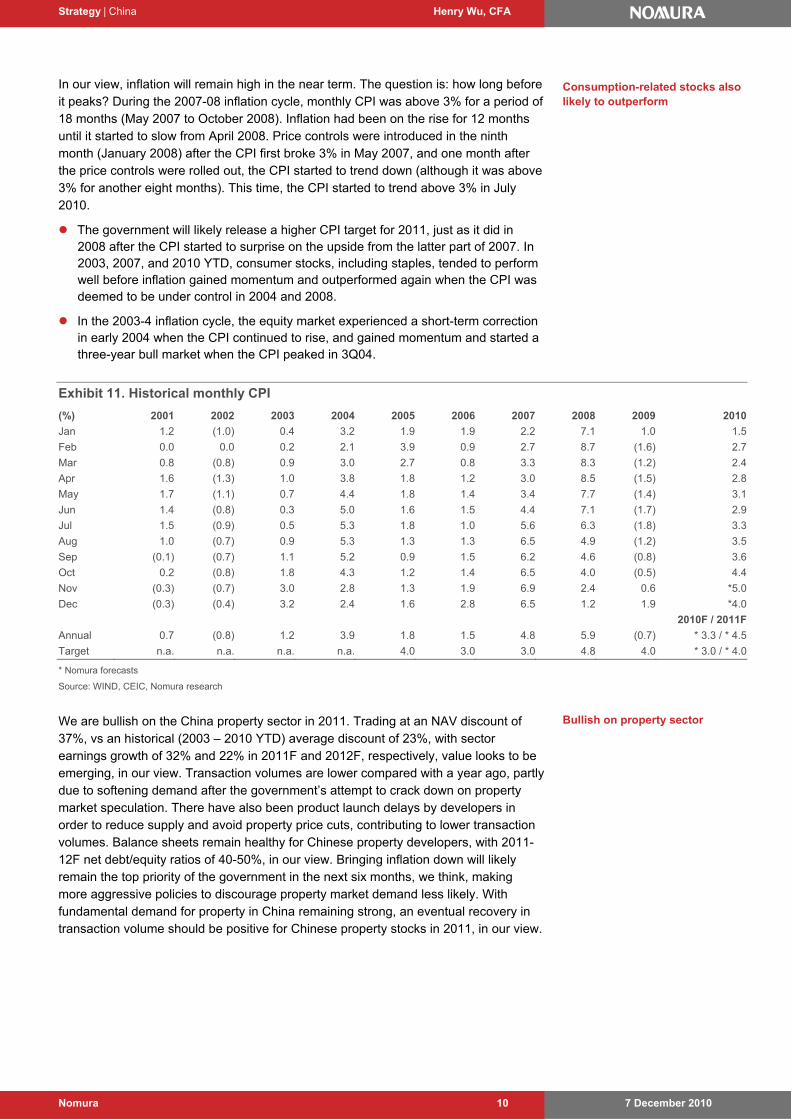
In our view, inflation will remain high in the near term. The question is: how long before it peaks? During the 2007-08 inflation cycle, monthly CPI was above 3% for a period of 18 months (May 2007 to October 2008). Inflation had been on the rise for 12 months until it started to slow from April 2008. Price controls were introduced in the ninth month (January 2008) after the CPI first broke 3% in May 2007, and one month after the price controls were rolled out, the CPI started to trend down (although it was above 3% for another eight months). This time, the CPI started to trend above 3% in July 2010.
The government will likely release a higher CPI target for 2011, just as it did in 2008 after the CPI started to surprise on the upside from the latter part of 2007. In 2003, 2007, and 2010 YTD, consumer stocks, including staples, tended to perform well before inflation gained momentum and outperformed again when the CPI was deemed to be under control in 2004 and 2008.
In the 2003-4 inflation cycle, the equity market experienced a short-term correction in early 2004 when the CPI continued to rise, and gained momentum and started a three-year bull market when the CPI peaked in 3Q04.
Exhibit 11. Historical monthly CPI
(%) 2001 2002 2003 2004 2005 2006 2007 2008 2009 2010
Jan 1.2 (1.0) 0.4 3.2 1.9 1.9 2.2 7.1 1.0 1.5
Feb 0.0 0.0 0.2 2.1 3.9 0.9 2.7 8.7 (1.6) 2.7
Mar 0.8 (0.8) 0.9 3.0 2.7 0.8 3.3 8.3 (1.2) 2.4
Apr 1.6 (1.3) 1.0 3.8 1.8 1.2 3.0 8.5 (1.5) 2.8
May 1.7 (1.1) 0.7 4.4 1.8 1.4 3.4 7.7 (1.4) 3.1
Jun 1.4 (0.8) 0.3 5.0 1.6 1.5 4.4 7.1 (1.7) 2.9
Jul 1.5 (0.9) 0.5 5.3 1.8 1.0 5.6 6.3 (1.8) 3.3
Aug 1.0 (0.7) 0.9 5.3 1.3 1.3 6.5 4.9 (1.2) 3.5
Sep (0.1) (0.7) 1.1 5.2 0.9 1.5 6.2 4.6 (0.8) 3.6
Oct 0.2 (0.8) 1.8 4.3 1.2 1.4 6.5 4.0 (0.5) 4.4
Nov (0.3) (0.7) 3.0 2.8 1.3 1.9 6.9 2.4 0.6 *5.0
Dec (0.3) (0.4) 3.2 2.4 1.6 2.8 6.5 1.2 1.9 *4.0
2010F / 2011F
Annual 0.7 (0.8) 1.2 3.9 1.8 1.5 4.8 5.9 (0.7) * 3.3 / * 4.5
Target n.a. n.a. n.a. n.a. 4.0 3.0 3.0 4.8 4.0 * 3.0 / * 4.0
* Nomura forecasts
Source: WIND, CEIC, Nomura research
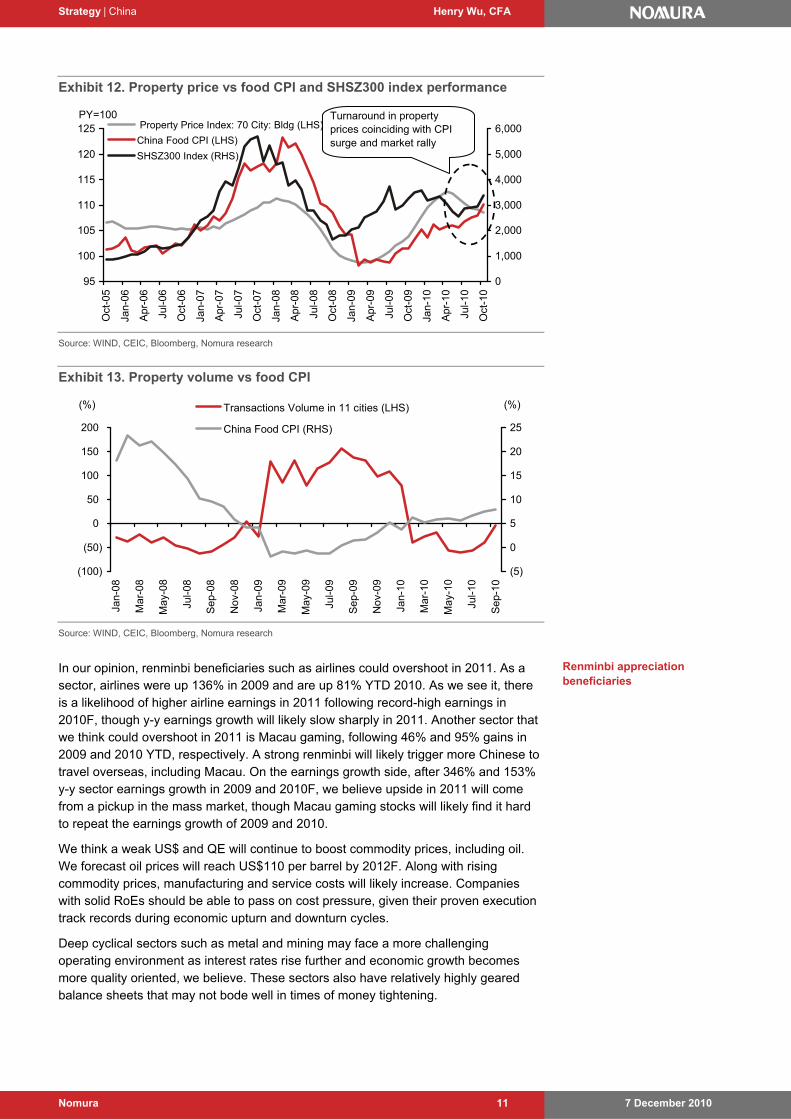
We are bullish on the China property sector in 2011. Trading at an NAV discount of 37%, vs an historical (2003 – 2010 YTD) average discount of 23%, with sector earnings growth of 32% and 22% in 2011F and 2012F, respectively, value looks to be emerging, in our view. Transaction volumes are lower compared with a year ago, partly due to softening demand after the government’s attempt to crack down on property market speculation. There have also been product launch delays by developers in order to reduce supply and avoid property price cuts, contributing to lower transaction volumes. Balance sheets remain healthy for Chinese property developers, with 2011-12F net debt/equity ratios of 40-50%, in our view. Bringing inflation down will likely remain the top priority of the government in the next six months, we think, making more aggressive policies to discourage property market demand less likely. With fundamental demand for property in China remaining strong, an eventual recovery in transaction volume should be positive for Chinese property stocks in 2011, in our view.
Consumption-related stocks also likely to outperform
Bullish on property sector
Strategy | China Henry Wu, CFA
7 December 2010 Nomura 11
Exhibit 12. Property price vs food CPI and SHSZ300 index performance
95
100
105
110
115
120
125
Oct
-05
Jan-
06
Apr
-06
Jul-0
6
Oct
-06
Jan-
07
Apr
-07
Jul-0
7
Oct
-07
Jan-
08
Apr
-08
Jul-0
8
Oct
-08
Jan-
09
Apr
-09
Jul-0
9
Oct
-09
Jan-
10
Apr
-10
Jul-1
0
Oct
-10
0
1,000
2,000
3,000
4,000
5,000
6,000 Property Price Index: 70 City: Bldg (LHS)
China Food CPI (LHS)
SHSZ300 Index (RHS)
PY=100 Turnaround in property prices coinciding with CPI surge and market rally
Source: WIND, CEIC, Bloomberg, Nomura research
Exhibit 13. Property volume vs food CPI
(100)
(50)
0
50
100
150
200
Jan-
08
Mar
-08
May
-08
Jul-0
8
Sep
-08
Nov
-08
Jan-
09
Mar
-09
May
-09
Jul-0
9
Sep
-09
Nov
-09
Jan-
10
Mar
-10
May
-10
Jul-1
0
Sep
-10
(5)
0
5
10
15
20
25
Transactions Volume in 11 cities (LHS)
China Food CPI (RHS)
(%) (%)
Source: WIND, CEIC, Bloomberg, Nomura research
In our opinion, renminbi beneficiaries such as airlines could overshoot in 2011. As a sector, airlines were up 136% in 2009 and are up 81% YTD 2010. As we see it, there is a likelihood of higher airline earnings in 2011 following record-high earnings in 2010F, though y-y earnings growth will likely slow sharply in 2011. Another sector that we think could overshoot in 2011 is Macau gaming, following 46% and 95% gains in 2009 and 2010 YTD, respectively. A strong renminbi will likely trigger more Chinese to travel overseas, including Macau. On the earnings growth side, after 346% and 153% y-y sector earnings growth in 2009 and 2010F, we believe upside in 2011 will come from a pickup in the mass market, though Macau gaming stocks will likely find it hard to repeat the earnings growth of 2009 and 2010.
We think a weak US$ and QE will continue to boost commodity prices, including oil. We forecast oil prices will reach US$110 per barrel by 2012F. Along with rising commodity prices, manufacturing and service costs will likely increase. Companies with solid RoEs should be able to pass on cost pressure, given their proven execution track records during economic upturn and downturn cycles.
Deep cyclical sectors such as metal and mining may face a more challenging operating environment as interest rates rise further and economic growth becomes more quality oriented, we believe. These sectors also have relatively highly geared balance sheets that may not bode well in times of money tightening.
Renminbi appreciation beneficiaries
Strategy | China Henry Wu, CFA
7 December 2010 Nomura 12
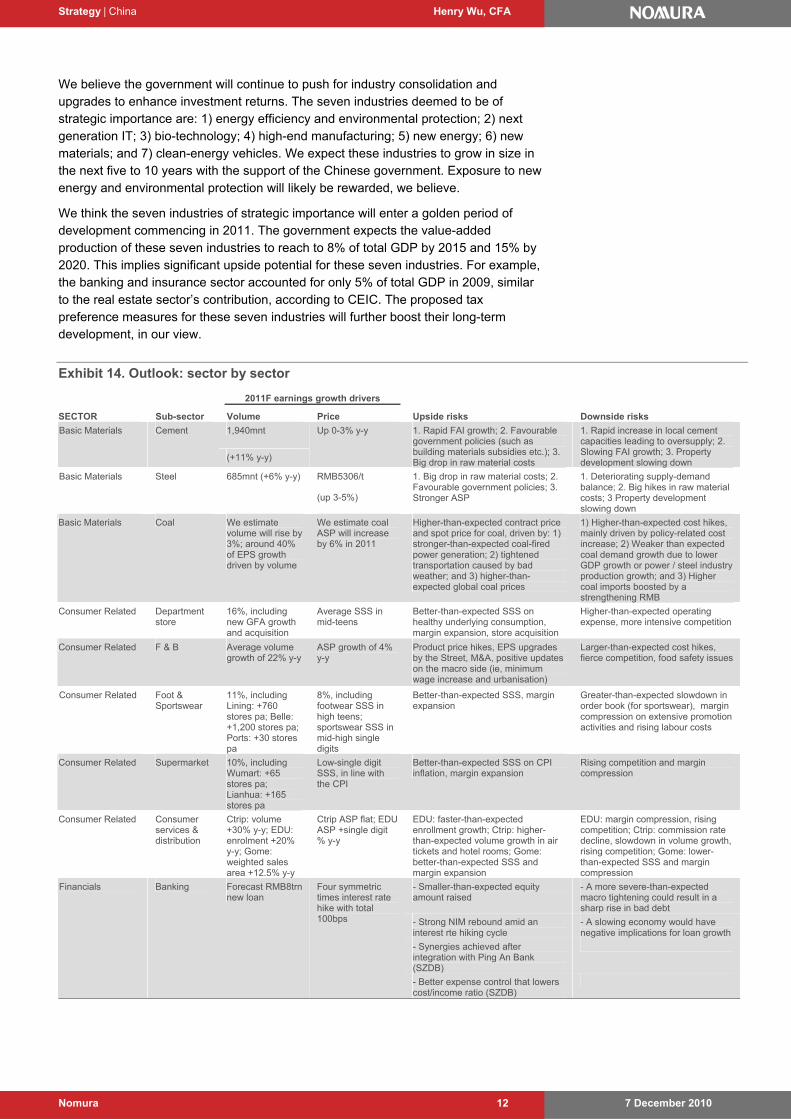
We believe the government will continue to push for industry consolidation and upgrades to enhance investment returns. The seven industries deemed to be of strategic importance are: 1) energy efficiency and environmental protection; 2) next generation IT; 3) bio-technology; 4) high-end manufacturing; 5) new energy; 6) new materials; and 7) clean-energy vehicles. We expect these industries to grow in size in the next five to 10 years with the support of the Chinese government. Exposure to new energy and environmental protection will likely be rewarded, we believe.
We think the seven industries of strategic importance will enter a golden period of development commencing in 2011. The government expects the value-added production of these seven industries to reach to 8% of total GDP by 2015 and 15% by 2020. This implies significant upside potential for these seven industries. For example, the banking and insurance sector accounted for only 5% of total GDP in 2009, similar to the real estate sector’s contribution, according to CEIC. The proposed tax preference measures for these seven industries will further boost their long-term development, in our view.
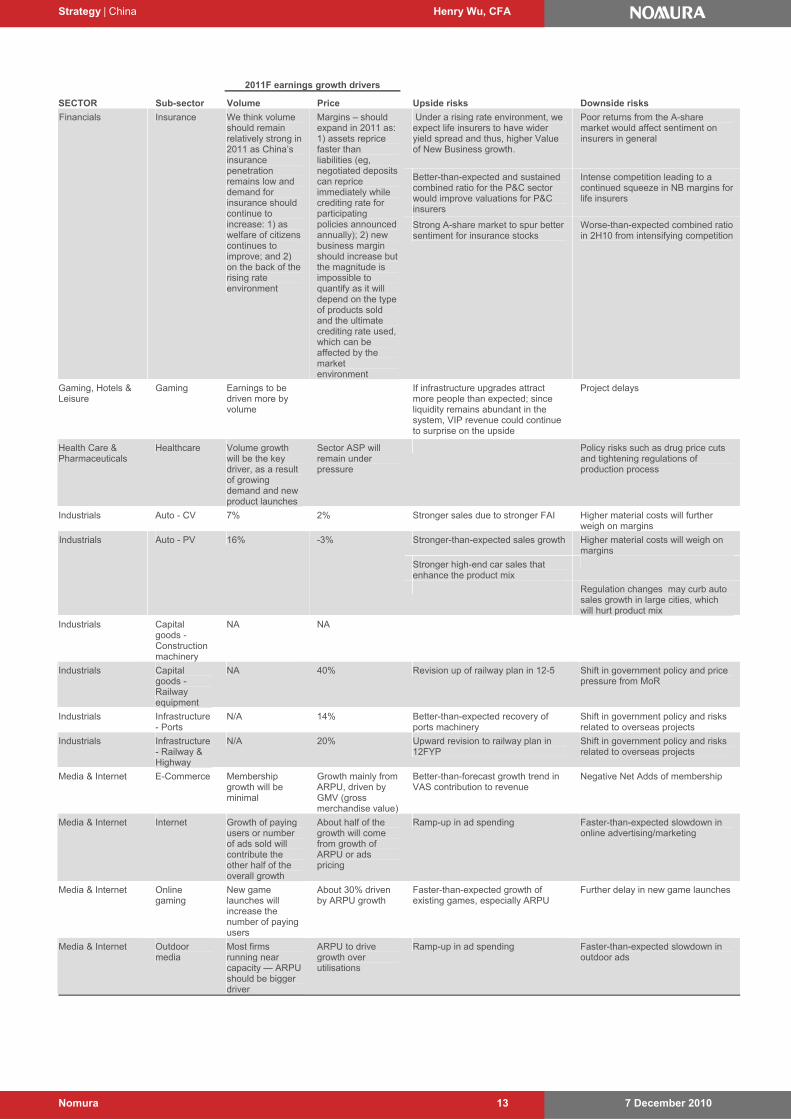
Exhibit 14. Outlook: sector by sector
2011F earnings growth drivers
SECTOR Sub-sector Volume Price Upside risks Downside risks
1,940mnt Basic Materials Cement
(+11% y-y)
Up 0-3% y-y 1. Rapid FAI growth; 2. Favourable government policies (such as building materials subsidies etc.); 3. Big drop in raw material costs
1. Rapid increase in local cement capacities leading to oversupply; 2. Slowing FAI growth; 3. Property development slowing down
RMB5306/t Basic Materials Steel 685mnt (+6% y-y)
(up 3-5%)
1. Big drop in raw material costs; 2. Favourable government policies; 3. Stronger ASP
1. Deteriorating supply-demand balance; 2. Big hikes in raw material costs; 3 Property development slowing down
Basic Materials Coal We estimate volume will rise by 3%; around 40% of EPS growth driven by volume
We estimate coal ASP will increase by 6% in 2011
Higher-than-expected contract price and spot price for coal, driven by: 1) stronger-than-expected coal-fired power generation; 2) tightened transportation caused by bad weather; and 3) higher-than-expected global coal prices
1) Higher-than-expected cost hikes, mainly driven by policy-related cost increase; 2) Weaker than expected coal demand growth due to lower GDP growth or power / steel industry production growth; and 3) Higher coal imports boosted by a strengthening RMB
Consumer Related Department store
16%, including new GFA growth and acquisition
Average SSS in mid-teens
Better-than-expected SSS on healthy underlying consumption, margin expansion, store acquisition
Higher-than-expected operating expense, more intensive competition
Consumer Related F & B Average volume growth of 22% y-y
ASP growth of 4% y-y
Product price hikes, EPS upgrades by the Street, M&A, positive updates on the macro side (ie, minimum wage increase and urbanisation)
Larger-than-expected cost hikes, fierce competition, food safety issues
Consumer Related Foot & Sportswear
11%, including Lining: +760 stores pa; Belle: +1,200 stores pa; Ports: +30 stores pa
8%, including footwear SSS in high teens; sportswear SSS in mid-high single digits
Better-than-expected SSS, margin expansion
Greater-than-expected slowdown in order book (for sportswear), margin compression on extensive promotion activities and rising labour costs
Consumer Related Supermarket 10%, including Wumart: +65 stores pa; Lianhua: +165 stores pa
Low-single digit SSS, in line with the CPI
Better-than-expected SSS on CPI inflation, margin expansion
Rising competition and margin compression
Consumer Related Consumer services & distribution
Ctrip: volume +30% y-y; EDU: enrolment +20% y-y; Gome: weighted sales area +12.5% y-y
Ctrip ASP flat; EDU ASP +single digit % y-y
EDU: faster-than-expected enrollment growth; Ctrip: higher-than-expected volume growth in air tickets and hotel rooms; Gome: better-than-expected SSS and margin expansion
EDU: margin compression, rising competition; Ctrip: commission rate decline, slowdown in volume growth, rising competition; Gome: lower-than-expected SSS and margin compression
- Smaller-than-expected equity amount raised
- A more severe-than-expected macro tightening could result in a sharp rise in bad debt
- Strong NIM rebound amid an interest rte hiking cycle
- A slowing economy would have negative implications for loan growth
- Synergies achieved after integration with Ping An Bank (SZDB)
Financials Banking Forecast RMB8trn new loan
Four symmetric times interest rate hike with total 100bps
- Better expense control that lowers cost/income ratio (SZDB)
Strategy | China Henry Wu, CFA
7 December 2010 Nomura 13
2011F earnings growth drivers
SECTOR Sub-sector Volume Price Upside risks Downside risks
Under a rising rate environment, we expect life insurers to have wider yield spread and thus, higher Value of New Business growth.
Poor returns from the A-share market would affect sentiment on insurers in general
Better-than-expected and sustained combined ratio for the P&C sector would improve valuations for P&C insurers
Intense competition leading to a continued squeeze in NB margins for life insurers
Financials Insurance We think volume should remain relatively strong in 2011 as China’s insurance penetration remains low and demand for insurance should continue to increase: 1) as welfare of citizens continues to improve; and 2) on the back of the rising rate environment
Margins – should expand in 2011 as: 1) assets reprice faster than liabilities (eg, negotiated deposits can reprice immediately while crediting rate for participating policies announced annually); 2) new business margin should increase but the magnitude is impossible to quantify as it will depend on the type of products sold and the ultimate crediting rate used, which can be affected by the market environment
Strong A-share market to spur better sentiment for insurance stocks
Worse-than-expected combined ratio in 2H10 from intensifying competition
Gaming, Hotels & Leisure
Gaming Earnings to be driven more by volume
If infrastructure upgrades attract more people than expected; since liquidity remains abundant in the system, VIP revenue could continue to surprise on the upside
Project delays
Health Care & Pharmaceuticals
Healthcare Volume growth will be the key driver, as a result of growing demand and new product launches
Sector ASP will remain under pressure
Policy risks such as drug price cuts and tightening regulations of production process
Industrials Auto - CV 7% 2% Stronger sales due to stronger FAI Higher material costs will further weigh on margins
Stronger-than-expected sales growth Higher material costs will weigh on margins
Stronger high-end car sales that enhance the product mix
Industrials Auto - PV 16% -3%
Regulation changes may curb auto sales growth in large cities, which will hurt product mix
Industrials Capital goods - Construction machinery
NA NA
Industrials Capital goods - Railway equipment
NA 40% Revision up of railway plan in 12-5 Shift in government policy and price pressure from MoR
Industrials Infrastructure - Ports
N/A 14% Better-than-expected recovery of ports machinery
Shift in government policy and risks related to overseas projects
Industrials Infrastructure - Railway & Highway
N/A 20% Upward revision to railway plan in 12FYP
Shift in government policy and risks related to overseas projects
Media & Internet E-Commerce Membership growth will be minimal
Growth mainly from ARPU, driven by GMV (gross merchandise value)
Better-than-forecast growth trend in VAS contribution to revenue
Negative Net Adds of membership
Media & Internet Internet Growth of paying users or number of ads sold will contribute the other half of the overall growth
About half of the growth will come from growth of ARPU or ads pricing
Ramp-up in ad spending Faster-than-expected slowdown in online advertising/marketing
Media & Internet Online gaming
New game launches will increase the number of paying users
About 30% driven by ARPU growth
Faster-than-expected growth of existing games, especially ARPU
Further delay in new game launches
Media & Internet Outdoor media
Most firms running near capacity — ARPU should be bigger driver
ARPU to drive growth over utilisations
Ramp-up in ad spending Faster-than-expected slowdown in outdoor ads
Strategy | China Henry Wu, CFA
7 December 2010 Nomura 14
2011F earnings growth drivers
SECTOR Sub-sector Volume Price Upside risks Downside risks
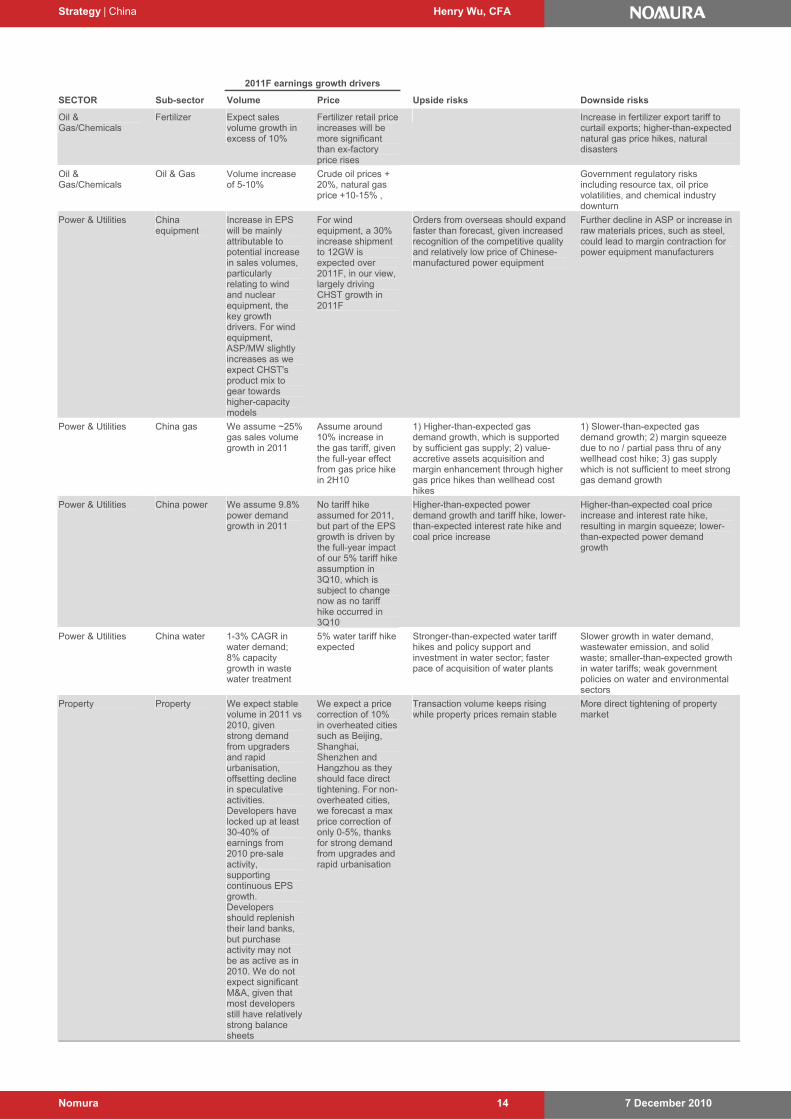
Oil & Gas/Chemicals
Fertilizer Expect sales volume growth in excess of 10%
Fertilizer retail price increases will be more significant than ex-factory price rises
Increase in fertilizer export tariff to curtail exports; higher-than-expected natural gas price hikes, natural disasters
Oil & Gas/Chemicals
Oil & Gas Volume increase of 5-10%
Crude oil prices + 20%, natural gas price +10-15% ,
Government regulatory risks including resource tax, oil price volatilities, and chemical industry downturn
Power & Utilities China equipment
Increase in EPS will be mainly attributable to potential increase in sales volumes, particularly relating to wind and nuclear equipment, the key growth drivers. For wind equipment, ASP/MW slightly increases as we expect CHST's product mix to gear towards higher-capacity models
For wind equipment, a 30% increase shipment to 12GW is expected over 2011F, in our view, largely driving CHST growth in 2011F
Orders from overseas should expand faster than forecast, given increased recognition of the competitive quality and relatively low price of Chinese-manufactured power equipment
Further decline in ASP or increase in raw materials prices, such as steel, could lead to margin contraction for power equipment manufacturers
Power & Utilities China gas We assume ~25% gas sales volume growth in 2011
Assume around 10% increase in the gas tariff, given the full-year effect from gas price hike in 2H10
1) Higher-than-expected gas demand growth, which is supported by sufficient gas supply; 2) value-accretive assets acquisition and margin enhancement through higher gas price hikes than wellhead cost hikes
1) Slower-than-expected gas demand growth; 2) margin squeeze due to no / partial pass thru of any wellhead cost hike; 3) gas supply which is not sufficient to meet strong gas demand growth
Power & Utilities China power We assume 9.8% power demand growth in 2011
No tariff hike assumed for 2011, but part of the EPS growth is driven by the full-year impact of our 5% tariff hike assumption in 3Q10, which is subject to change now as no tariff hike occurred in 3Q10
Higher-than-expected power demand growth and tariff hike, lower-than-expected interest rate hike and coal price increase
Higher-than-expected coal price increase and interest rate hike, resulting in margin squeeze; lower-than-expected power demand growth
Power & Utilities China water 1-3% CAGR in water demand; 8% capacity growth in waste water treatment
5% water tariff hike expected
Stronger-than-expected water tariff hikes and policy support and investment in water sector; faster pace of acquisition of water plants
Slower growth in water demand, wastewater emission, and solid waste; smaller-than-expected growth in water tariffs; weak government policies on water and environmental sectors
Property Property We expect stable volume in 2011 vs 2010, given strong demand from upgraders and rapid urbanisation, offsetting decline in speculative activities. Developers have locked up at least 30-40% of earnings from 2010 pre-sale activity, supporting continuous EPS growth. Developers should replenish their land banks, but purchase activity may not be as active as in 2010. We do not expect significant M&A, given that most developers still have relatively strong balance sheets
We expect a price correction of 10% in overheated cities such as Beijing, Shanghai, Shenzhen and Hangzhou as they should face direct tightening. For non-overheated cities, we forecast a max price correction of only 0-5%, thanks for strong demand from upgrades and rapid urbanisation
Transaction volume keeps rising while property prices remain stable
More direct tightening of property market
Strategy | China Henry Wu, CFA
7 December 2010 Nomura 15
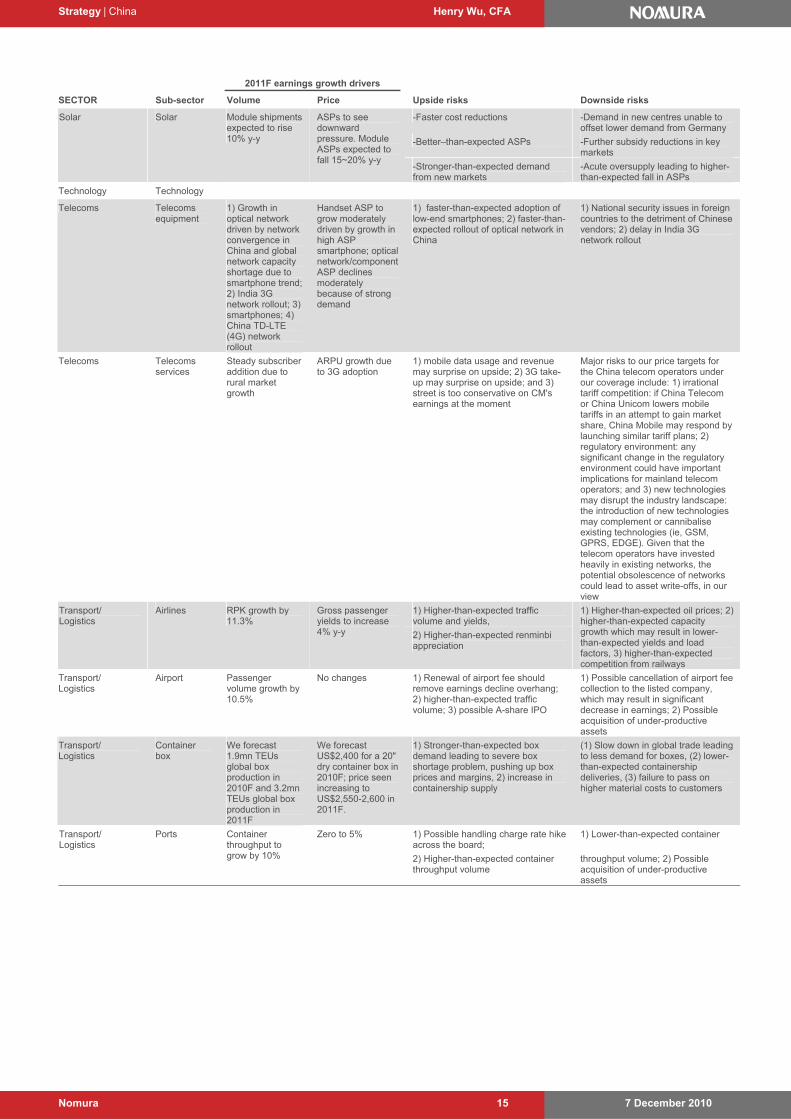
2011F earnings growth drivers
SECTOR Sub-sector Volume Price Upside risks Downside risks
-Faster cost reductions -Demand in new centres unable to offset lower demand from Germany
-Better–than-expected ASPs -Further subsidy reductions in key markets
Solar Solar Module shipments expected to rise 10% y-y
ASPs to see downward pressure. Module ASPs expected to fall 15~20% y-y
-Stronger-than-expected demand from new markets
-Acute oversupply leading to higher-than-expected fall in ASPs
Technology Technology
Telecoms Telecoms equipment
1) Growth in optical network driven by network convergence in China and global network capacity shortage due to smartphone trend; 2) India 3G network rollout; 3) smartphones; 4) China TD-LTE (4G) network rollout
Handset ASP to grow moderately driven by growth in high ASP smartphone; optical network/component ASP declines moderately because of strong demand
1) faster-than-expected adoption of low-end smartphones; 2) faster-than-expected rollout of optical network in China
1) National security issues in foreign countries to the detriment of Chinese vendors; 2) delay in India 3G network rollout
Telecoms Telecoms services
Steady subscriber addition due to rural market growth
ARPU growth due to 3G adoption
1) mobile data usage and revenue may surprise on upside; 2) 3G take-up may surprise on upside; and 3) street is too conservative on CM's earnings at the moment
Major risks to our price targets for the China telecom operators under our coverage include: 1) irrational tariff competition: if China Telecom or China Unicom lowers mobile tariffs in an attempt to gain market share, China Mobile may respond by launching similar tariff plans; 2) regulatory environment: any significant change in the regulatory environment could have important implications for mainland telecom operators; and 3) new technologies may disrupt the industry landscape: the introduction of new technologies may complement or cannibalise existing technologies (ie, GSM, GPRS, EDGE). Given that the telecom operators have invested heavily in existing networks, the potential obsolescence of networks could lead to asset write-offs, in our view
1) Higher-than-expected traffic volume and yields,
Transport/ Logistics
Airlines RPK growth by 11.3%
Gross passenger yields to increase 4% y-y 2) Higher-than-expected renminbi
appreciation
1) Higher-than-expected oil prices; 2) higher-than-expected capacity growth which may result in lower-than-expected yields and load factors, 3) higher-than-expected competition from railways
Transport/ Logistics
Airport Passenger volume growth by 10.5%
No changes 1) Renewal of airport fee should remove earnings decline overhang; 2) higher-than-expected traffic volume; 3) possible A-share IPO
1) Possible cancellation of airport fee collection to the listed company, which may result in significant decrease in earnings; 2) Possible acquisition of under-productive assets
Transport/ Logistics
Container box
We forecast 1.9mn TEUs global box production in 2010F and 3.2mn TEUs global box production in 2011F
We forecast US$2,400 for a 20" dry container box in 2010F; price seen increasing to US$2,550-2,600 in 2011F.
1) Stronger-than-expected box demand leading to severe box shortage problem, pushing up box prices and margins, 2) increase in containership supply
(1) Slow down in global trade leading to less demand for boxes, (2) lower-than-expected containership deliveries, (3) failure to pass on higher material costs to customers
1) Possible handling charge rate hike across the board;
1) Lower-than-expected container Transport/ Logistics
Ports Container throughput to grow by 10%
Zero to 5%
2) Higher-than-expected container throughput volume
throughput volume; 2) Possible acquisition of under-productive assets
Strategy | China Henry Wu, CFA
7 December 2010 Nomura 16
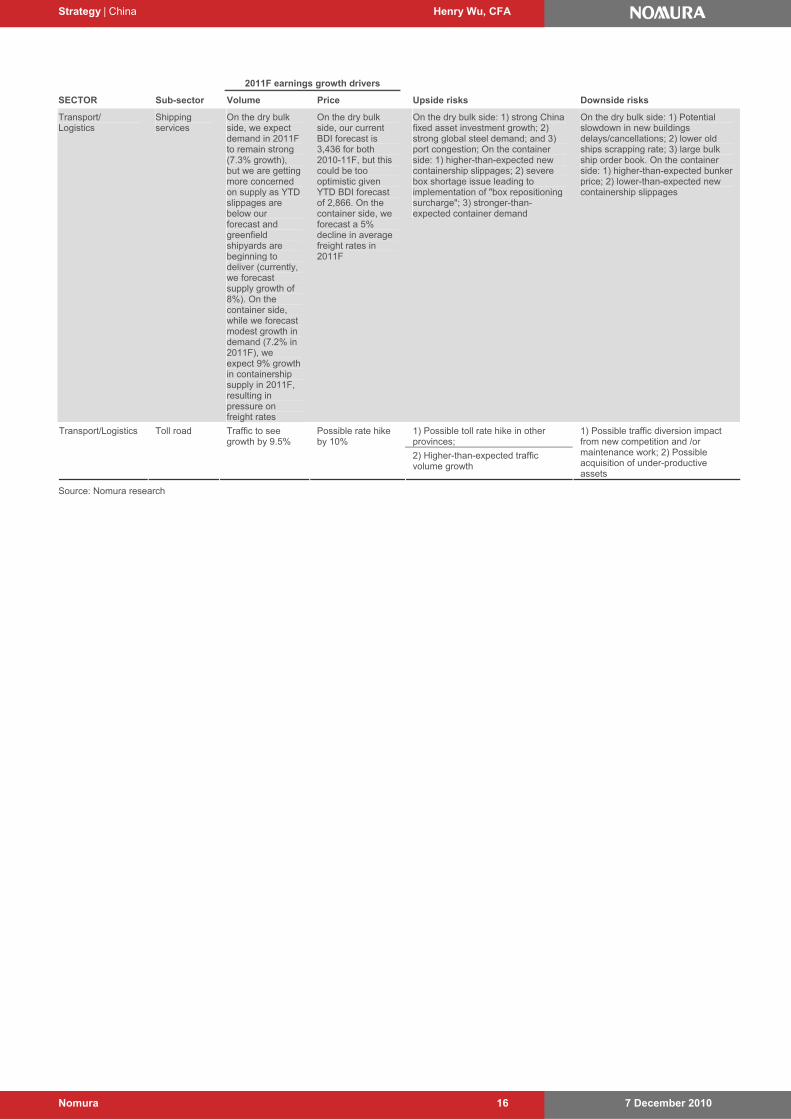
2011F earnings growth drivers
SECTOR Sub-sector Volume Price Upside risks Downside risks
Transport/ Logistics
Shipping services
On the dry bulk side, we expect demand in 2011F to remain strong (7.3% growth), but we are getting more concerned on supply as YTD slippages are below our forecast and greenfield shipyards are beginning to deliver (currently, we forecast supply growth of 8%). On the container side, while we forecast modest growth in demand (7.2% in 2011F), we expect 9% growth in containership supply in 2011F, resulting in pressure on freight rates
On the dry bulk side, our current BDI forecast is 3,436 for both 2010-11F, but this could be too optimistic given YTD BDI forecast of 2,866. On the container side, we forecast a 5% decline in average freight rates in 2011F
On the dry bulk side: 1) strong China fixed asset investment growth; 2) strong global steel demand; and 3) port congestion; On the container side: 1) higher-than-expected new containership slippages; 2) severe box shortage issue leading to implementation of "box repositioning surcharge"; 3) stronger-than-expected container demand
On the dry bulk side: 1) Potential slowdown in new buildings delays/cancellations; 2) lower old ships scrapping rate; 3) large bulk ship order book. On the container side: 1) higher-than-expected bunker price; 2) lower-than-expected new containership slippages
1) Possible toll rate hike in other provinces;
Transport/Logistics Toll road Traffic to see growth by 9.5%
Possible rate hike by 10%
2) Higher-than-expected traffic volume growth
1) Possible traffic diversion impact from new competition and /or maintenance work; 2) Possible acquisition of under-productive assets
Source: Nomura research
Strategy | China Henry Wu, CFA
7 December 2010 Nomura 17
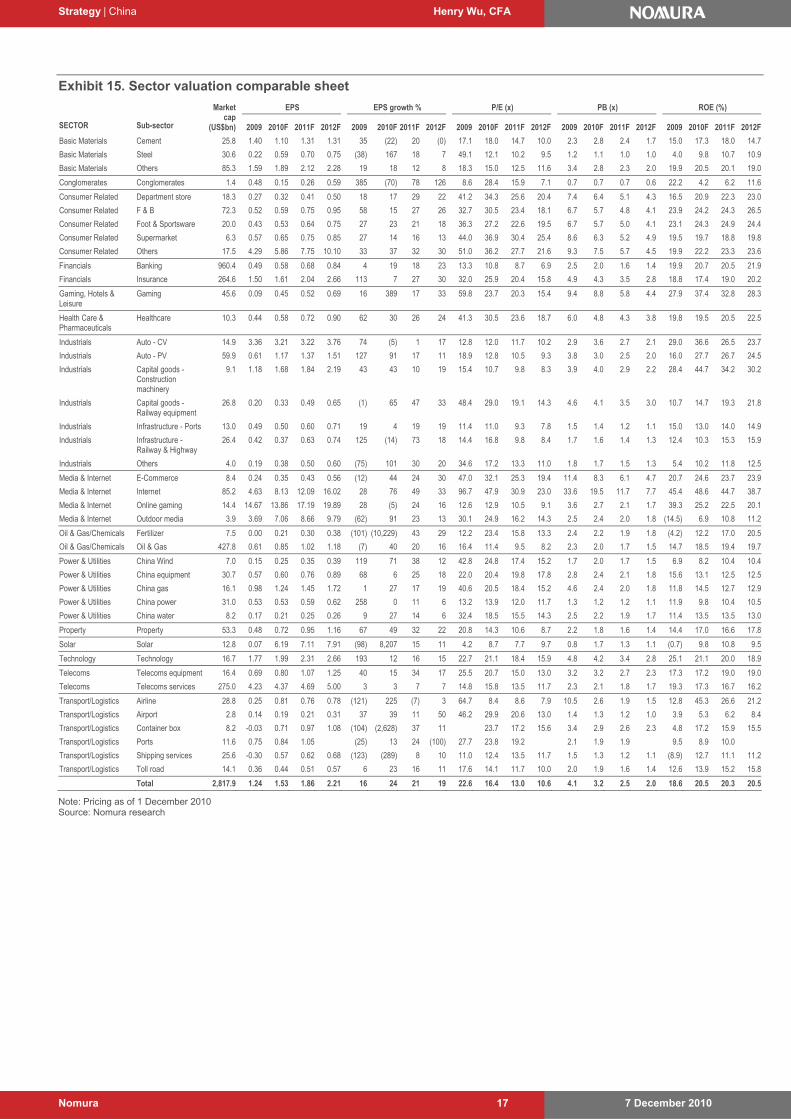
Exhibit 15. Sector valuation comparable sheet
EPS EPS growth % P/E (x) PB (x) ROE (%)
SECTOR Sub-sector
Market cap
(US$bn) 2009 2010F 2011F 2012F 2009 2010F 2011F 2012F 2009 2010F 2011F 2012F 2009 2010F 2011F 2012F 2009 2010F 2011F 2012F
Basic Materials Cement 25.8 1.40 1.10 1.31 1.31 35 (22) 20 (0) 17.1 18.0 14.7 10.0 2.3 2.8 2.4 1.7 15.0 17.3 18.0 14.7
Basic Materials Steel 30.6 0.22 0.59 0.70 0.75 (38) 167 18 7 49.1 12.1 10.2 9.5 1.2 1.1 1.0 1.0 4.0 9.8 10.7 10.9
Basic Materials Others 85.3 1.59 1.89 2.12 2.28 19 18 12 8 18.3 15.0 12.5 11.6 3.4 2.8 2.3 2.0 19.9 20.5 20.1 19.0
Conglomerates Conglomerates 1.4 0.48 0.15 0.26 0.59 385 (70) 78 126 8.6 28.4 15.9 7.1 0.7 0.7 0.7 0.6 22.2 4.2 6.2 11.6
Consumer Related Department store 18.3 0.27 0.32 0.41 0.50 18 17 29 22 41.2 34.3 25.6 20.4 7.4 6.4 5.1 4.3 16.5 20.9 22.3 23.0
Consumer Related F & B 72.3 0.52 0.59 0.75 0.95 58 15 27 26 32.7 30.5 23.4 18.1 6.7 5.7 4.8 4.1 23.9 24.2 24.3 26.5
Consumer Related Foot & Sportsware 20.0 0.43 0.53 0.64 0.75 27 23 21 18 36.3 27.2 22.6 19.5 6.7 5.7 5.0 4.1 23.1 24.3 24.9 24.4
Consumer Related Supermarket 6.3 0.57 0.65 0.75 0.85 27 14 16 13 44.0 36.9 30.4 25.4 8.6 6.3 5.2 4.9 19.5 19.7 18.8 19.8
Consumer Related Others 17.5 4.29 5.86 7.75 10.10 33 37 32 30 51.0 36.2 27.7 21.6 9.3 7.5 5.7 4.5 19.9 22.2 23.3 23.6
Financials Banking 960.4 0.49 0.58 0.68 0.84 4 19 18 23 13.3 10.8 8.7 6.9 2.5 2.0 1.6 1.4 19.9 20.7 20.5 21.9
Financials Insurance 264.6 1.50 1.61 2.04 2.66 113 7 27 30 32.0 25.9 20.4 15.8 4.9 4.3 3.5 2.8 18.8 17.4 19.0 20.2
Gaming, Hotels & Leisure
Gaming 45.6 0.09 0.45 0.52 0.69 16 389 17 33 59.8 23.7 20.3 15.4 9.4 8.8 5.8 4.4 27.9 37.4 32.8 28.3
Health Care & Pharmaceuticals
Healthcare 10.3 0.44 0.58 0.72 0.90 62 30 26 24 41.3 30.5 23.6 18.7 6.0 4.8 4.3 3.8 19.8 19.5 20.5 22.5
Industrials Auto - CV 14.9 3.36 3.21 3.22 3.76 74 (5) 1 17 12.8 12.0 11.7 10.2 2.9 3.6 2.7 2.1 29.0 36.6 26.5 23.7
Industrials Auto - PV 59.9 0.61 1.17 1.37 1.51 127 91 17 11 18.9 12.8 10.5 9.3 3.8 3.0 2.5 2.0 16.0 27.7 26.7 24.5
Industrials Capital goods - Construction machinery
9.1 1.18 1.68 1.84 2.19 43 43 10 19 15.4 10.7 9.8 8.3 3.9 4.0 2.9 2.2 28.4 44.7 34.2 30.2
Industrials Capital goods - Railway equipment
26.8 0.20 0.33 0.49 0.65 (1) 65 47 33 48.4 29.0 19.1 14.3 4.6 4.1 3.5 3.0 10.7 14.7 19.3 21.8
Industrials Infrastructure - Ports 13.0 0.49 0.50 0.60 0.71 19 4 19 19 11.4 11.0 9.3 7.8 1.5 1.4 1.2 1.1 15.0 13.0 14.0 14.9
Industrials Infrastructure - Railway & Highway
26.4 0.42 0.37 0.63 0.74 125 (14) 73 18 14.4 16.8 9.8 8.4 1.7 1.6 1.4 1.3 12.4 10.3 15.3 15.9
Industrials Others 4.0 0.19 0.38 0.50 0.60 (75) 101 30 20 34.6 17.2 13.3 11.0 1.8 1.7 1.5 1.3 5.4 10.2 11.8 12.5
Media & Internet E-Commerce 8.4 0.24 0.35 0.43 0.56 (12) 44 24 30 47.0 32.1 25.3 19.4 11.4 8.3 6.1 4.7 20.7 24.6 23.7 23.9
Media & Internet Internet 85.2 4.63 8.13 12.09 16.02 28 76 49 33 96.7 47.9 30.9 23.0 33.6 19.5 11.7 7.7 45.4 48.6 44.7 38.7
Media & Internet Online gaming 14.4 14.67 13.86 17.19 19.89 28 (5) 24 16 12.6 12.9 10.5 9.1 3.6 2.7 2.1 1.7 39.3 25.2 22.5 20.1
Media & Internet Outdoor media 3.9 3.69 7.06 8.66 9.79 (62) 91 23 13 30.1 24.9 16.2 14.3 2.5 2.4 2.0 1.8 (14.5) 6.9 10.8 11.2
Oil & Gas/Chemicals Fertilizer 7.5 0.00 0.21 0.30 0.38 (101) (10,229) 43 29 12.2 23.4 15.8 13.3 2.4 2.2 1.9 1.8 (4.2) 12.2 17.0 20.5
Oil & Gas/Chemicals Oil & Gas 427.8 0.61 0.85 1.02 1.18 (7) 40 20 16 16.4 11.4 9.5 8.2 2.3 2.0 1.7 1.5 14.7 18.5 19.4 19.7
Power & Utilities China Wind 7.0 0.15 0.25 0.35 0.39 119 71 38 12 42.8 24.8 17.4 15.2 1.7 2.0 1.7 1.5 6.9 8.2 10.4 10.4
Power & Utilities China equipment 30.7 0.57 0.60 0.76 0.89 68 6 25 18 22.0 20.4 19.8 17.8 2.8 2.4 2.1 1.8 15.6 13.1 12.5 12.5
Power & Utilities China gas 16.1 0.98 1.24 1.45 1.72 1 27 17 19 40.6 20.5 18.4 15.2 4.6 2.4 2.0 1.8 11.8 14.5 12.7 12.9
Power & Utilities China power 31.0 0.53 0.53 0.59 0.62 258 0 11 6 13.2 13.9 12.0 11.7 1.3 1.2 1.2 1.1 11.9 9.8 10.4 10.5
Power & Utilities China water 8.2 0.17 0.21 0.25 0.26 9 27 14 6 32.4 18.5 15.5 14.3 2.5 2.2 1.9 1.7 11.4 13.5 13.5 13.0
Property Property 53.3 0.48 0.72 0.95 1.16 67 49 32 22 20.8 14.3 10.6 8.7 2.2 1.8 1.6 1.4 14.4 17.0 16.6 17.8
Solar Solar 12.8 0.07 6.19 7.11 7.91 (98) 8,207 15 11 4.2 8.7 7.7 9.7 0.8 1.7 1.3 1.1 (0.7) 9.8 10.8 9.5
Technology Technology 16.7 1.77 1.99 2.31 2.66 193 12 16 15 22.7 21.1 18.4 15.9 4.8 4.2 3.4 2.8 25.1 21.1 20.0 18.9
Telecoms Telecoms equipment 16.4 0.69 0.80 1.07 1.25 40 15 34 17 25.5 20.7 15.0 13.0 3.2 3.2 2.7 2.3 17.3 17.2 19.0 19.0
Telecoms Telecoms services 275.0 4.23 4.37 4.69 5.00 3 3 7 7 14.8 15.8 13.5 11.7 2.3 2.1 1.8 1.7 19.3 17.3 16.7 16.2
Transport/Logistics Airline 28.8 0.25 0.81 0.76 0.78 (121) 225 (7) 3 64.7 8.4 8.6 7.9 10.5 2.6 1.9 1.5 12.8 45.3 26.6 21.2
Transport/Logistics Airport 2.8 0.14 0.19 0.21 0.31 37 39 11 50 46.2 29.9 20.6 13.0 1.4 1.3 1.2 1.0 3.9 5.3 6.2 8.4
Transport/Logistics Container box 8.2 -0.03 0.71 0.97 1.08 (104) (2,628) 37 11 23.7 17.2 15.6 3.4 2.9 2.6 2.3 4.8 17.2 15.9 15.5
Transport/Logistics Ports 11.6 0.75 0.84 1.05 (25) 13 24 (100) 27.7 23.8 19.2 2.1 1.9 1.9 9.5 8.9 10.0
Transport/Logistics Shipping services 25.6 -0.30 0.57 0.62 0.68 (123) (289) 8 10 11.0 12.4 13.5 11.7 1.5 1.3 1.2 1.1 (8.9) 12.7 11.1 11.2
Transport/Logistics Toll road 14.1 0.36 0.44 0.51 0.57 6 23 16 11 17.6 14.1 11.7 10.0 2.0 1.9 1.6 1.4 12.6 13.9 15.2 15.8
Total 2,817.9 1.24 1.53 1.86 2.21 16 24 21 19 22.6 16.4 13.0 10.6 4.1 3.2 2.5 2.0 18.6 20.5 20.3 20.5
Note: Pricing as of 1 December 2010 Source: Nomura research
Strategy | China Henry Wu, CFA
7 December 2010 Nomura 18
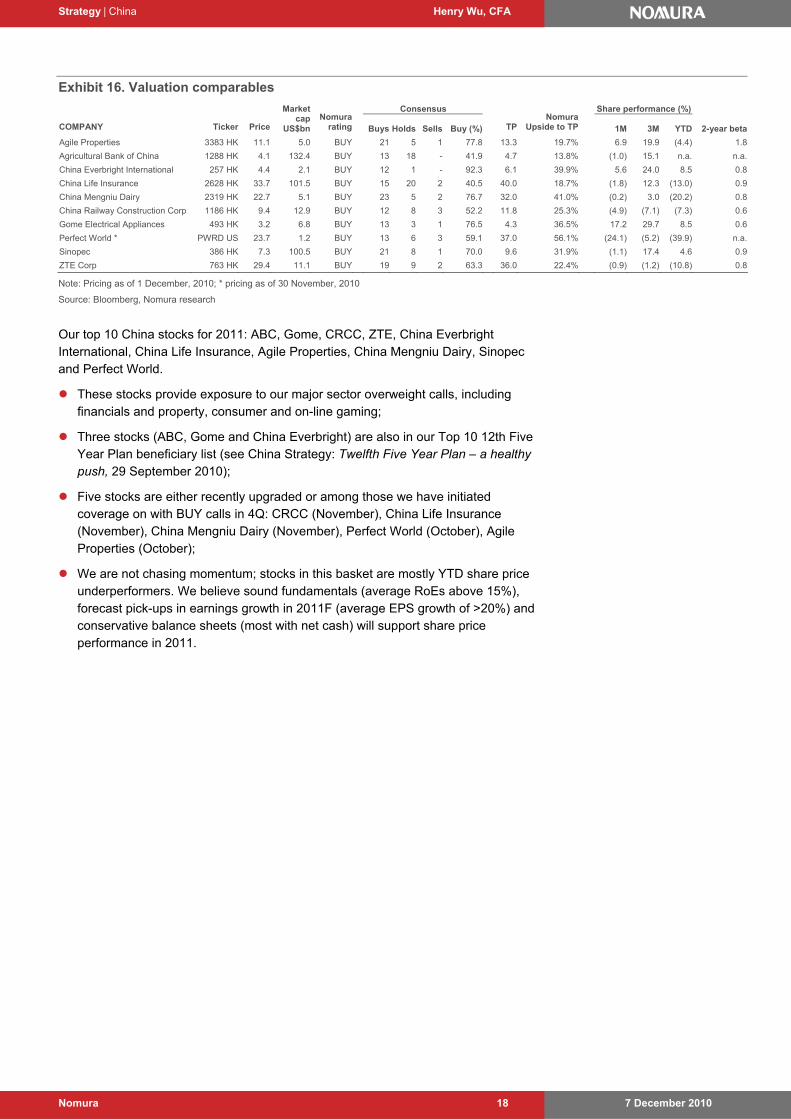
Exhibit 16. Valuation comparables
Consensus Share performance (%)
COMPANY Ticker Price
Market cap
US$bn Nomura
rating Buys Holds Sells Buy (%) TPNomura
Upside to TP 1M 3M YTD 2-year beta
Agile Properties 3383 HK 11.1 5.0 BUY 21 5 1 77.8 13.3 19.7% 6.9 19.9 (4.4) 1.8
Agricultural Bank of China 1288 HK 4.1 132.4 BUY 13 18 - 41.9 4.7 13.8% (1.0) 15.1 n.a. n.a.
China Everbright International 257 HK 4.4 2.1 BUY 12 1 - 92.3 6.1 39.9% 5.6 24.0 8.5 0.8
China Life Insurance 2628 HK 33.7 101.5 BUY 15 20 2 40.5 40.0 18.7% (1.8) 12.3 (13.0) 0.9
China Mengniu Dairy 2319 HK 22.7 5.1 BUY 23 5 2 76.7 32.0 41.0% (0.2) 3.0 (20.2) 0.8
China Railway Construction Corp 1186 HK 9.4 12.9 BUY 12 8 3 52.2 11.8 25.3% (4.9) (7.1) (7.3) 0.6
Gome Electrical Appliances 493 HK 3.2 6.8 BUY 13 3 1 76.5 4.3 36.5% 17.2 29.7 8.5 0.6
Perfect World * PWRD US 23.7 1.2 BUY 13 6 3 59.1 37.0 56.1% (24.1) (5.2) (39.9) n.a.
Sinopec 386 HK 7.3 100.5 BUY 21 8 1 70.0 9.6 31.9% (1.1) 17.4 4.6 0.9
ZTE Corp 763 HK 29.4 11.1 BUY 19 9 2 63.3 36.0 22.4% (0.9) (1.2) (10.8) 0.8
Note: Pricing as of 1 December, 2010; * pricing as of 30 November, 2010
Source: Bloomberg, Nomura research
Our top 10 China stocks for 2011: ABC, Gome, CRCC, ZTE, China Everbright International, China Life Insurance, Agile Properties, China Mengniu Dairy, Sinopec and Perfect World.
These stocks provide exposure to our major sector overweight calls, including financials and property, consumer and on-line gaming;
Three stocks (ABC, Gome and China Everbright) are also in our Top 10 12th Five Year Plan beneficiary list (see China Strategy: Twelfth Five Year Plan – a healthy push, 29 September 2010);
Five stocks are either recently upgraded or among those we have initiated coverage on with BUY calls in 4Q: CRCC (November), China Life Insurance (November), China Mengniu Dairy (November), Perfect World (October), Agile Properties (October);
We are not chasing momentum; stocks in this basket are mostly YTD share price underperformers. We believe sound fundamentals (average RoEs above 15%), forecast pick-ups in earnings growth in 2011F (average EPS growth of >20%) and conservative balance sheets (most with net cash) will support share price performance in 2011.
Strategy | China Henry Wu, CFA
7 December 2010 Nomura 19
Risks
Investment risks Economic development uncertainty
We believe all sectors’ performances largely hinge on China’s economic development. A weaker-than-expected economic recovery or a double-dip could significantly impact sectors’ bottom-line growth, and hence the performance of the broader equity market.
Surging inflation
If the CPI again surprises the market on the upside during 2011, equity market performance could be negatively impacted, as surging inflation would likely trigger the government to implement even more tightening measures on easing liquidity.
Change in government policies
Equity market performance is susceptible to policies introduced by the government. Any change in policy or implementation could have a significant impact on market sentiment.
Assumption deviation
We derive our MSCI China index price target based on certain forecasts for China’s macro data during 2011, including four interest rate hikes, three RRR rises and about 5.8% RMB appreciation against the USD. If the actual largely deviates from our estimation, this could significantly affect our price target for the MSCI China index.
Liquidity fluctuation
We believe liquidity will be sufficient in 2011 to support the market. Any major change in money supply or extreme tightening measures could substantially hit the market valuation level, causing market volatility.
Strategy | China Henry Wu, CFA
7 December 2010 Nomura 20
2011 outlook
Higher ground We are positive on China’s equity market in 2011 after its rebound in 2009 and consolidation in 2010. We forecast the MSCI China Index and HSCEI Index will reach 83 and 16,000 by the end of 2011, offering 24% and 25% upside potential, respectively. We believe the strong performance will be backed by: 1) 21%+ earnings growth, with large-cap sectors such as financial and energy set to post strong earnings; 2) attractive valuations (13x 2011F earnings, in line with the 10-year average; 2.5x price/book with RoEs of 20%). Note that 2011 will also be the first year of China’s 12th Five Year Plan, and we think the sectors set to benefit, such as the seven emerging industries with strategic importance, will receive a boost in sentiment. We believe fundamental support will remain the most important factor to drive equity market performance in 2011. In our view, sectors with an improving earnings outlook and strong RoE tend to outperform. Earnings growth outlook and RoE will become increasingly important and be rewarded when there are still uncertainties on the policy side, and cost of capital is on the rise, in our view.
We have developed a scorecard to quantify the impact of fundamentals (earnings growth, RoE), valuation (P/E, P/BV) and relative share price momentum on each sector. Our favoured sectors include Banking, Property, Online gaming, Consumption and Oil & Gas.
We believe that in 2011, a number of developments will impact company earnings and market sentiment, and thus present opportunities for equity market investment:
1) continuing from 2010, consumption will remain one of the major storylines in 2011;
2) inflation changes both company earnings expectations and market sentiment. We have found that in the past, the equity market has tended to experience a short-term correction when inflation continued to surprise on the upside, before picking up and gaining momentum after the CPI peaked. In addition, consumer-staple stocks tended not to perform well when inflation was out of control, but tended to perform very well during the early and latter stages of an inflation cycle;
3) implementation of China’s 12th Five Year Plan (FYP) will likely trigger more investment opportunities for certain sectors, especially for emerging industries deemed to be of strategic importance;
4) the domestic interest rate hike cycle together with RMB appreciation will likely boost interest rate- and renminbi appreciation-sensitive sectors, including financials and transportation. However, concerns on valuations may offset some of the benefits to sectors such as airlines;
5) further global commodity price rises as a result of excess liquidity will likely eventually affect the China market and lead to divergent performance;
6) share price laggards with robust bottom-line growth and strong RoEs are included in our stock picks.
We think China will continue to deliver solid economic data in 2011, and this fundamentally makes us quite optimistic about China’s equity market in 2011. Our economic team forecasts GDP growth of 10.2% in 2010, 9.8% in 2011 and 9.5% in 2012. With strong economic development, we forecast bottom-line growth for corporates of 21.4% and 19.0% for 2011 and 2012, respectively. We think accelerating urbanization, booming consumption, healthy export growth, robust investment and implementation of various measures as part of China’s 12th Five Year Plan (FYP) will be the major drivers.
We forecast MSCI China and HSCEI will offer >20% upside in 2011F
Key investment strategy for 2011
Solid bottom-line growth
Strategy | China Henry Wu, CFA
7 December 2010 Nomura 21
Apart from the solid bottom-line growth, we believe liquidity is also sufficient in 2011 to support the current P/E level. We estimate new bank loans of about RMB8trn for 2011 (vs a government loan quota of around RMB6.5trn), which may translate into around 18% M2 y-y growth. Although this is off from the recent peak of 27.7% y-y growth in 2009, our forecast 2011 M2 growth is still slightly higher than the historical average growth of 17.6% for the past decade. In addition, we believe there is likely to be more liquidity flowing from developed markets to emerging markets in search of higher returns. Growth in ‘unexplained’ foreign capital inflow to China has been high in the past several quarters.
During the 2008 bear market following the outbreak of the financial crisis, the index gave up more than it had put on during the 2007 bull run (the MSCI China index closed at 41 in 2008, after rallying from 52 in 2006 to 86 in 2007). With governments around the world launching more easing policies from 2Q09 onward, the market rebounded quickly from its 2008 low. Consumption stocks, both staple and discretionary, led the rally in 2009, joined by materials and financials – two important sectors that are contributing to the economic recovery. Meanwhile, booming liquidity as a result of quantitative easing around the globe has bid commodity prices higher, hence the outperformance of energy stocks.
Macro-economic growth will remain healthy in 2011… There is no little uncertainty over global economic prospects for 2011, associated with the probability of a double-dipping economy, excess liquidity from loosening monetary policy, relatively high unemployment, surging commodity prices and rising inflation. To tackle these problems, certain measures need to be implemented by policymakers which we believe will have a significant impact on China’s overall economic development and hence its equity market.
Complicating the outlook for 2011, alongside these external uncertainties, China also faces its own challenges. The recent interest rate hike by the PBoC and three RRR rises signify the government’s intention to tame excess liquidity and curb surging inflation. Plus, 2011 is the first year of China’s Twelfth Five-Year Plan (FYP). We believe structural reform will be the major theme and, increasingly, the quality of economic growth is likely to hold more weight than the headline GDP growth number.
We estimate China’s economic development will remain strong over 2011 and 2012, with growth of 9.8% y-y and 9.5% y-y, respectively, providing a solid basis for corporates’ bottom-line growth. We think consumption will play an increasing role in terms of its contribution to GDP over the medium term, fuelled by the government’s intention to shift the structure of economic development towards consumption and income distribution reform, including raising the minimum wage. Investment should also remain strong over the next two years, triggered by the rapid development of central and western China as the larger theme of industry transferring inland from eastern China, especially capital-intensive secondary industry, plays out.
Challenges for 2011: domestic and global
But still optimistic on China
Liquidity should be supportive in 2011
Strategy | China Henry Wu, CFA
7 December 2010 Nomura 22
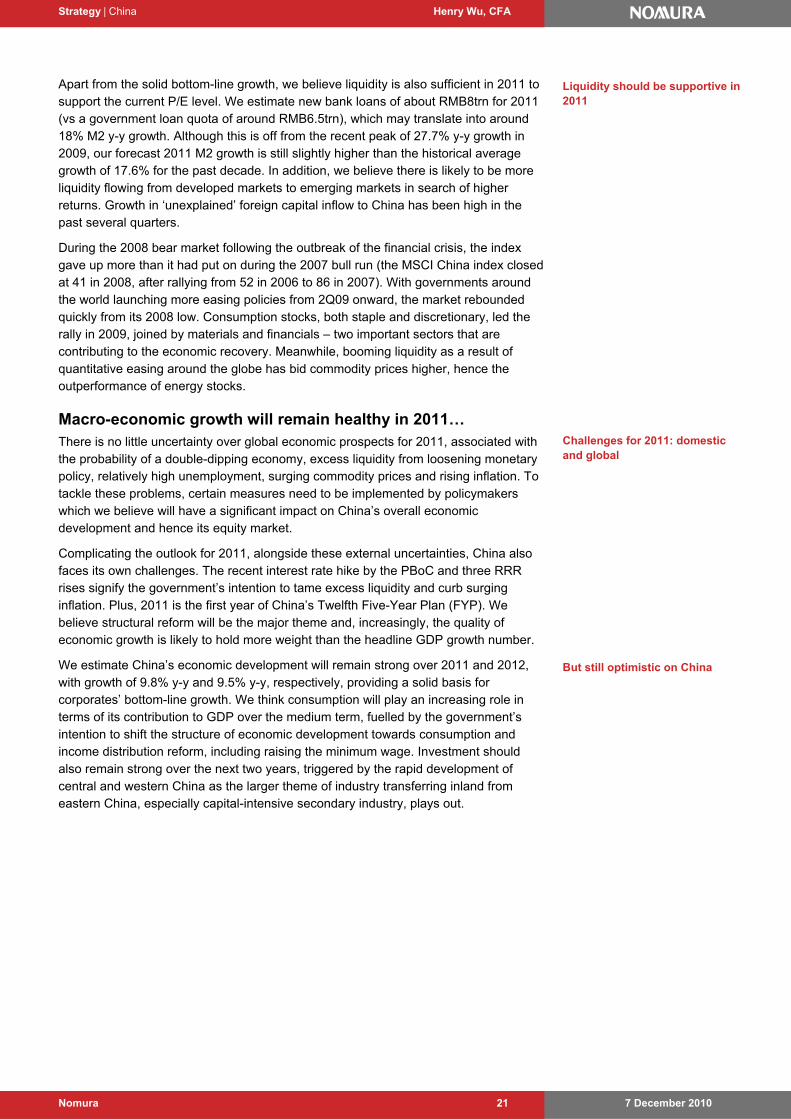
Exhibit 17. China: major economic indicators
% y-o-y unless otherwise stated 3Q10 4Q10 1Q11 2Q11 3Q11 4Q11 1Q12 2Q12 2010 2011 2012
Real GDP 9.6 9.2 9.4 9.7 9.9 10.0 9.0 9.4 10.2 9.8 9.5
Consumer prices 3.5 4.5 4.1 4.5 4.9 4.4 5.0 5.2 3.3 4.5 5.0
Core CPI 1.1 1.6 2.0 2.2 2.4 2.5 2.3 2.4 1.0 2.3 2.5
Retail sales (nominal) 18.4 18.6 20.1 19.7 19.9 20.1 20.3 20.6 18.4 20.0 21.0
Fixed-asset investment (nominal, ytd) 24.0 23.5 23.0 23.5 22.5 22.0 20.5 22.5 23.5 22.0 21.0
Industrial production (real) 13.5 13.7 12.8 14.2 15.1 16.0 15.1 14.1 15.8 14.5 14.2
Exports (value) 32.3 17.0 18.0 10.0 9.5 12.0 17.5 11.2 29.0 12.0 12.0
Imports (value) 27.1 18.5 12.0 14.0 13.0 16.0 14.0 17.0 35.6 13.8 16.0
Trade surplus (US$bn) 65.7 35.4 35.3 31.4 59.1 61.9 53.2 12.1 189 188 147
Current account (% of GDP) 5.0 4.1 3.1
Fiscal balance (% of GDP) -2.5 -1.3 -1.0
Net increase in RMB loans (RMB trn) 8.0 8.0 8.4
1-yr bank lending rate (%) 5.31 5.56 5.81 6.06 6.31 6.56 6.81 7.06 5.56 6.56 7.31
1-yr bank deposit rate (%) 2.25 2.50 2.75 3.00 3.25 3.50 3.75 4.25 2.50 3.50 4.75
Reserve requirement ratio (%) 17.00 18.50 19.00 19.50 20.00 20.50 20.50 20.50 18.00 20.50 20.50
Exchange rate (RMB/US$) 6.70 6.60 6.50 6.40 6.30 6.22 6.60 6.22 6.00
Note: Numbers in bold are actual values; others forecast. Interest rate and currency forecasts are end of period; other measures are period average. All forecasts are modal forecasts (i.e., the single most likely outcomes).
Source: CEIC, Nomura economics team
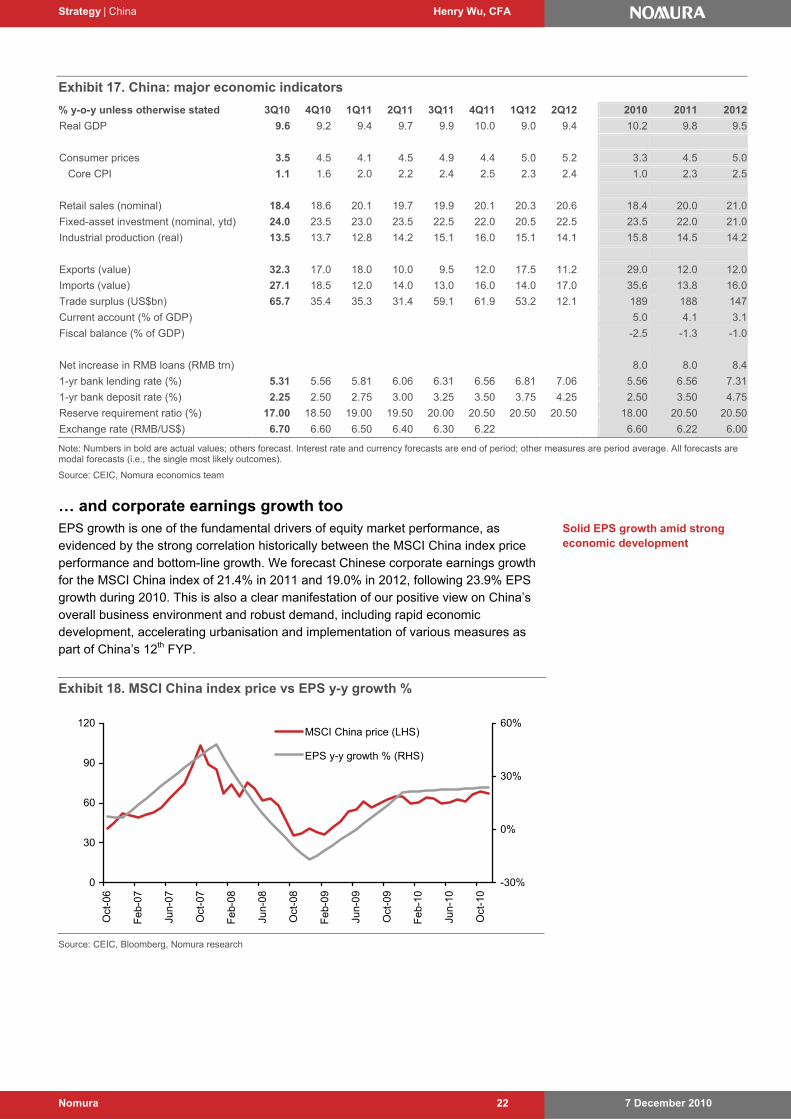
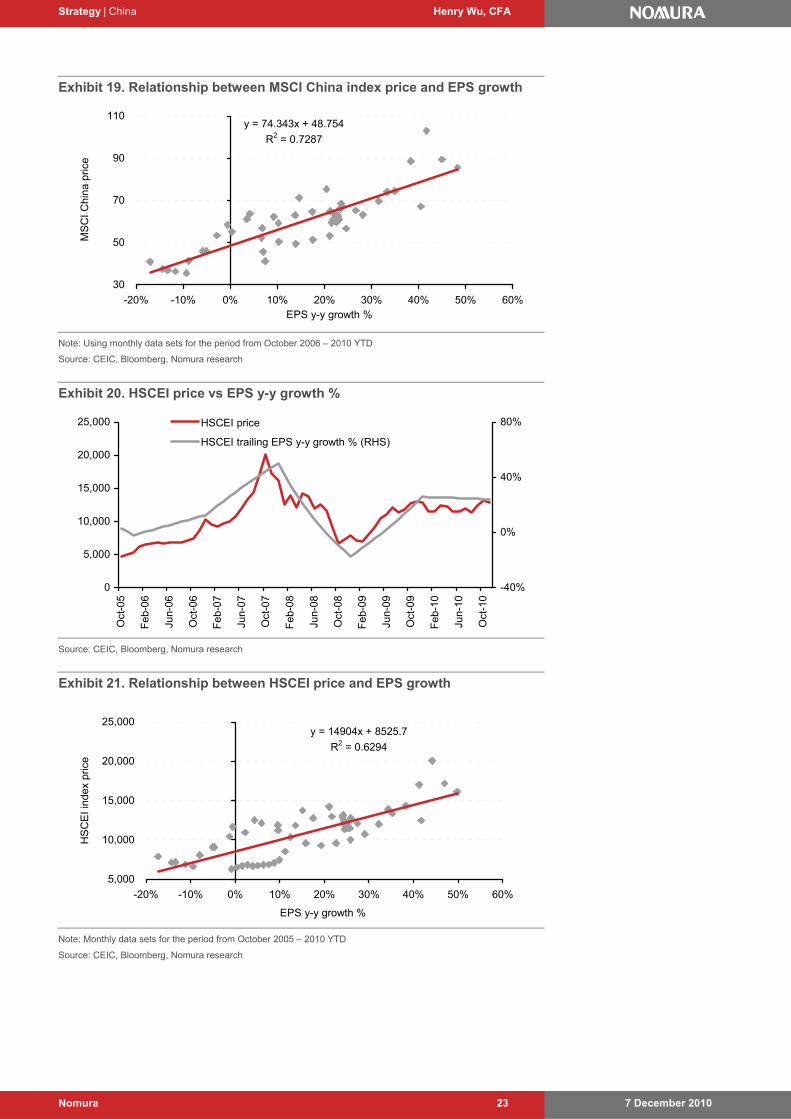
… and corporate earnings growth too EPS growth is one of the fundamental drivers of equity market performance, as evidenced by the strong correlation historically between the MSCI China index price performance and bottom-line growth. We forecast Chinese corporate earnings growth for the MSCI China index of 21.4% in 2011 and 19.0% in 2012, following 23.9% EPS growth during 2010. This is also a clear manifestation of our positive view on China’s overall business environment and robust demand, including rapid economic development, accelerating urbanisation and implementation of various measures as part of China’s 12th FYP.
Exhibit 18. MSCI China index price vs EPS y-y growth %
0
30
60
90
120
Oct
-06
Feb
-07
Jun-
07
Oct
-07
Feb
-08
Jun-
08
Oct
-08
Feb
-09
Jun-
09
Oct
-09
Feb
-10
Jun-
10
Oct
-10
-30%
0%
30%
60%MSCI China price (LHS)
EPS y-y growth % (RHS)
Source: CEIC, Bloomberg, Nomura research
Solid EPS growth amid strong economic development
Strategy | China Henry Wu, CFA
7 December 2010 Nomura 23
Exhibit 19. Relationship between MSCI China index price and EPS growth
y = 74.343x + 48.754
R2 = 0.7287
30
50
70
90
110
-20% -10% 0% 10% 20% 30% 40% 50% 60%EPS y-y growth %
MS
CI
Chi
na p
rice
Note: Using monthly data sets for the period from October 2006 – 2010 YTD
Source: CEIC, Bloomberg, Nomura research
Exhibit 20. HSCEI price vs EPS y-y growth %
0
5,000
10,000
15,000
20,000
25,000
Oct
-05
Feb
-06
Jun-
06
Oct
-06
Feb
-07
Jun-
07
Oct
-07
Feb
-08
Jun-
08
Oct
-08
Feb
-09
Jun-
09
Oct
-09
Feb
-10
Jun-
10
Oct
-10
-40%
0%
40%
80%HSCEI price
HSCEI trailing EPS y-y growth % (RHS)
Source: CEIC, Bloomberg, Nomura research
Exhibit 21. Relationship between HSCEI price and EPS growth
y = 14904x + 8525.7
R2 = 0.6294
5,000
10,000
15,000
20,000
25,000
-20% -10% 0% 10% 20% 30% 40% 50% 60%
EPS y-y growth %
HS
CE
I in
dex
pric
e
Note: Monthly data sets for the period from October 2005 – 2010 YTD
Source: CEIC, Bloomberg, Nomura research
Strategy | China Henry Wu, CFA
7 December 2010 Nomura 24
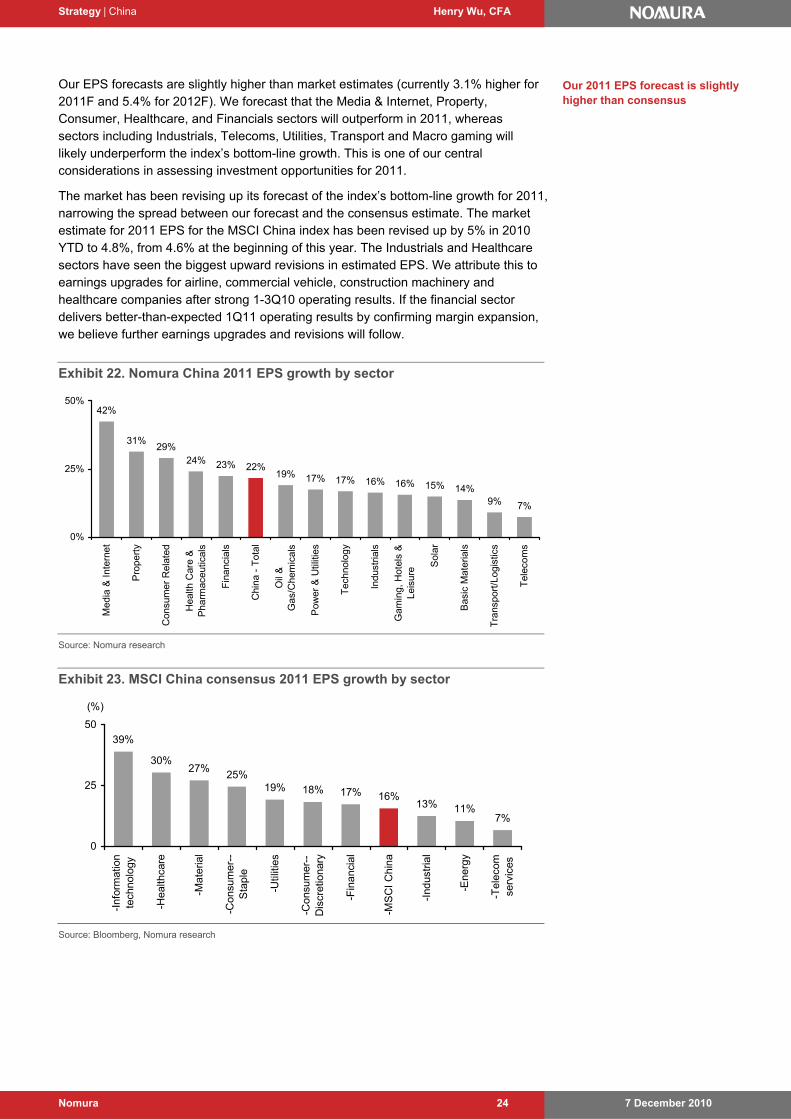
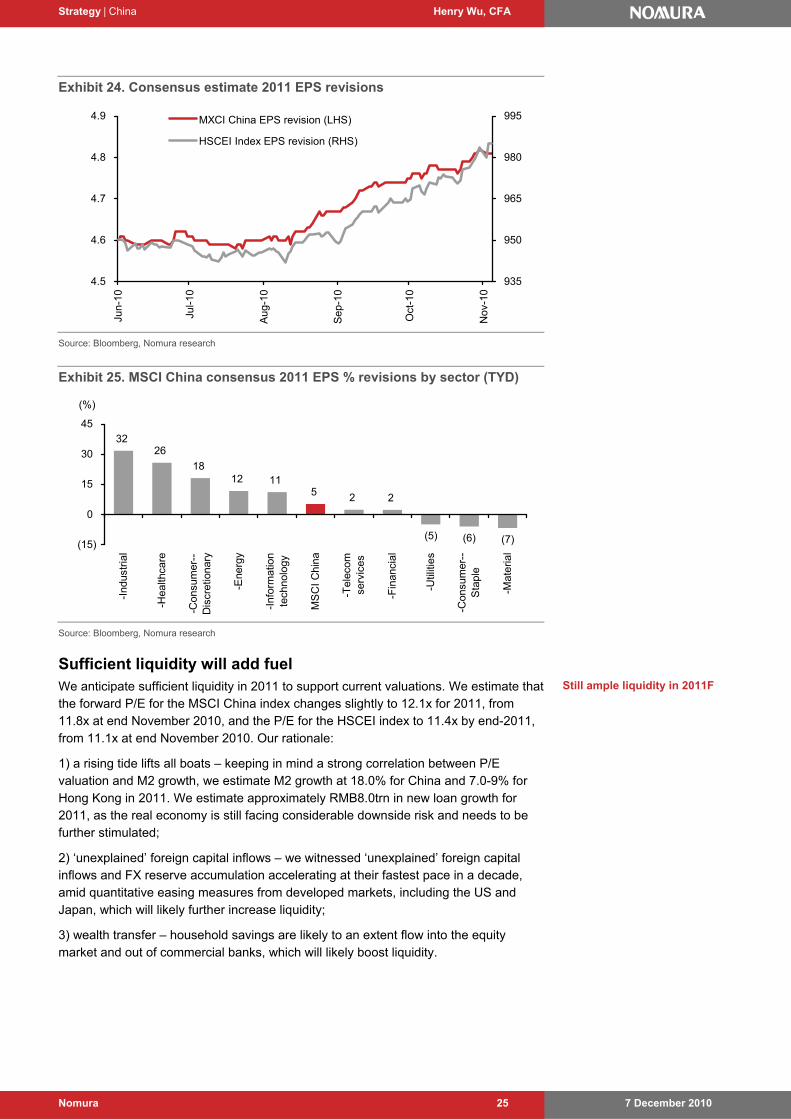
Our EPS forecasts are slightly higher than market estimates (currently 3.1% higher for 2011F and 5.4% for 2012F). We forecast that the Media & Internet, Property, Consumer, Healthcare, and Financials sectors will outperform in 2011, whereas sectors including Industrials, Telecoms, Utilities, Transport and Macro gaming will likely underperform the index’s bottom-line growth. This is one of our central considerations in assessing investment opportunities for 2011.
The market has been revising up its forecast of the index’s bottom-line growth for 2011, narrowing the spread between our forecast and the consensus estimate. The market estimate for 2011 EPS for the MSCI China index has been revised up by 5% in 2010 YTD to 4.8%, from 4.6% at the beginning of this year. The Industrials and Healthcare sectors have seen the biggest upward revisions in estimated EPS. We attribute this to earnings upgrades for airline, commercial vehicle, construction machinery and healthcare companies after strong 1-3Q10 operating results. If the financial sector delivers better-than-expected 1Q11 operating results by confirming margin expansion, we believe further earnings upgrades and revisions will follow.
Exhibit 22. Nomura China 2011 EPS growth by sector
42%
31%29%
24% 23%19% 17% 17% 16% 16% 15% 14%
9% 7%
22%
0%
25%
50%
Med
ia &
Int
erne
t
Pro
pert
y
Con
sum
er R
elat
ed
Hea
lth C
are
&P
harm
aceu
tical
s
Fin
anci
als
Chi
na -
Tot
al
Oil
&G
as/C
hem
ical
s
Pow
er &
Util
ities
Tec
hnol
ogy
Indu
stria
ls
Gam
ing,
Hot
els
&Le
isur
e Sol
ar
Bas
ic M
ater
ials
Tra
nspo
rt/L
ogis
tics
Tel
ecom
s
Source: Nomura research
Exhibit 23. MSCI China consensus 2011 EPS growth by sector
39%
30%27%
25%19% 18% 17% 16%
13% 11%7%
0
25
50
-Inf
orm
atio
nte
chno
logy
-Hea
lthca
re
-Mat
eria
l
-Con
sum
er--
Sta
ple
-Util
ities
-Con
sum
er--
Dis
cret
iona
ry
-Fin
anci
al
-MS
CI
Chi
na
-Ind
ustr
ial
-Ene
rgy
-Tel
ecom
serv
ices
(%)
Source: Bloomberg, Nomura research
Our 2011 EPS forecast is slightly higher than consensus
Strategy | China Henry Wu, CFA
7 December 2010 Nomura 25
Exhibit 24. Consensus estimate 2011 EPS revisions
4.5
4.6
4.7
4.8
4.9Ju
n-10
Jul-1
0
Aug
-10
Sep
-10
Oct
-10
Nov
-10
935
950
965
980
995MXCI China EPS revision (LHS)
HSCEI Index EPS revision (RHS)
Source: Bloomberg, Nomura research
Exhibit 25. MSCI China consensus 2011 EPS % revisions by sector (TYD)
3226
1812 11
5 2 2
(5) (6) (7)(15)
0
15
30
45
-Ind
ustr
ial
-Hea
lthca
re
-Con
sum
er--
Dis
cret
iona
ry
-Ene
rgy
-Inf
orm
atio
nte
chno
logy
MS
CI
Chi
na
-Tel
ecom
serv
ices
-Fin
anci
al
-Util
itie
s
-Con
sum
er--
Sta
ple
-Mat
eria
l
(%)
Source: Bloomberg, Nomura research
Sufficient liquidity will add fuel We anticipate sufficient liquidity in 2011 to support current valuations. We estimate that the forward P/E for the MSCI China index changes slightly to 12.1x for 2011, from 11.8x at end November 2010, and the P/E for the HSCEI index to 11.4x by end-2011, from 11.1x at end November 2010. Our rationale:
1) a rising tide lifts all boats – keeping in mind a strong correlation between P/E valuation and M2 growth, we estimate M2 growth at 18.0% for China and 7.0-9% for Hong Kong in 2011. We estimate approximately RMB8.0trn in new loan growth for 2011, as the real economy is still facing considerable downside risk and needs to be further stimulated;
2) ‘unexplained’ foreign capital inflows – we witnessed ‘unexplained’ foreign capital inflows and FX reserve accumulation accelerating at their fastest pace in a decade, amid quantitative easing measures from developed markets, including the US and Japan, which will likely further increase liquidity;
3) wealth transfer – household savings are likely to an extent flow into the equity market and out of commercial banks, which will likely boost liquidity.
Still ample liquidity in 2011F
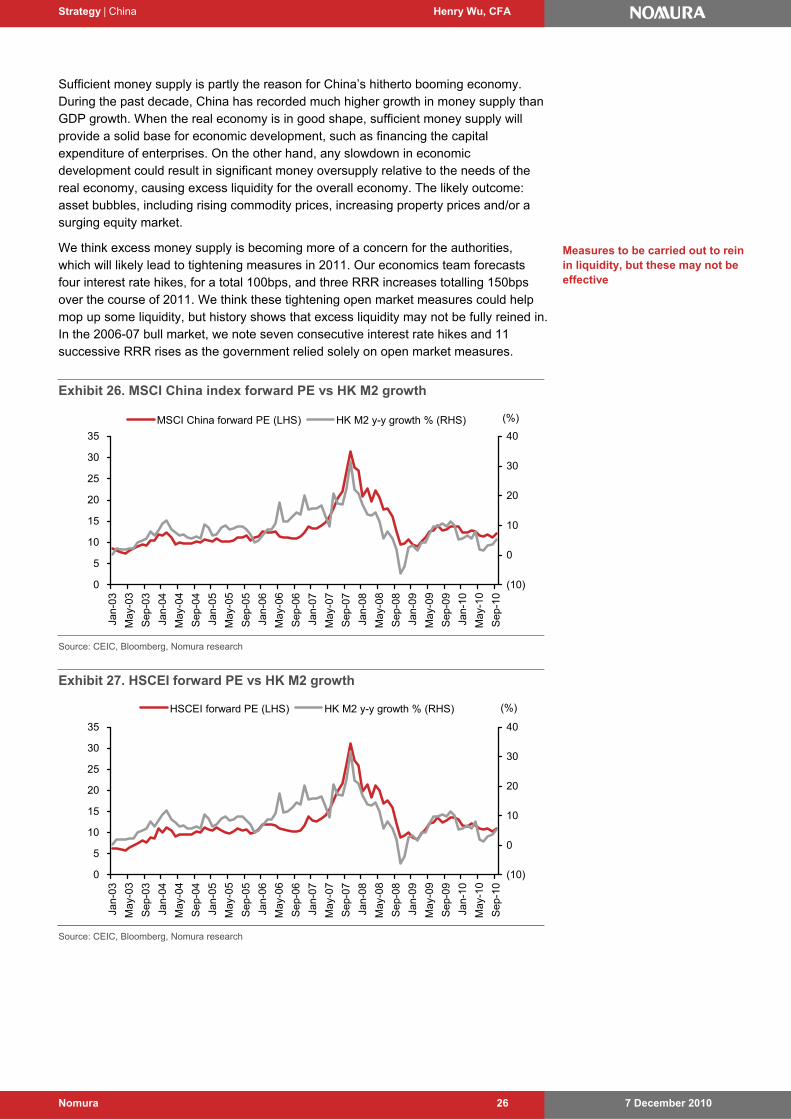
Strategy | China Henry Wu, CFA
7 December 2010 Nomura 26
Sufficient money supply is partly the reason for China’s hitherto booming economy. During the past decade, China has recorded much higher growth in money supply than GDP growth. When the real economy is in good shape, sufficient money supply will provide a solid base for economic development, such as financing the capital expenditure of enterprises. On the other hand, any slowdown in economic development could result in significant money oversupply relative to the needs of the real economy, causing excess liquidity for the overall economy. The likely outcome: asset bubbles, including rising commodity prices, increasing property prices and/or a surging equity market.
We think excess money supply is becoming more of a concern for the authorities, which will likely lead to tightening measures in 2011. Our economics team forecasts four interest rate hikes, for a total 100bps, and three RRR increases totalling 150bps over the course of 2011. We think these tightening open market measures could help mop up some liquidity, but history shows that excess liquidity may not be fully reined in. In the 2006-07 bull market, we note seven consecutive interest rate hikes and 11 successive RRR rises as the government relied solely on open market measures.
Exhibit 26. MSCI China index forward PE vs HK M2 growth
0
5
10
15
20
25
30
35
Jan-
03
May
-03
Sep
-03
Jan-
04
May
-04
Sep
-04
Jan-
05
May
-05
Sep
-05
Jan-
06
May
-06
Sep
-06
Jan-
07
May
-07
Sep
-07
Jan-
08
May
-08
Sep
-08
Jan-
09
May
-09
Sep
-09
Jan-
10
May
-10
Sep
-10
(10)
0
10
20
30
40
MSCI China forward PE (LHS) HK M2 y-y growth % (RHS) (%)
Source: CEIC, Bloomberg, Nomura research
Exhibit 27. HSCEI forward PE vs HK M2 growth
0
5
10
15
20
25
30
35
Jan-
03
May
-03
Sep
-03
Jan-
04
May
-04
Sep
-04
Jan-
05
May
-05
Sep
-05
Jan-
06
May
-06
Sep
-06
Jan-
07
May
-07
Sep
-07
Jan-
08
May
-08
Sep
-08
Jan-
09
May
-09
Sep
-09
Jan-
10
May
-10
Sep
-10
(10)
0
10
20
30
40
HSCEI forward PE (LHS) HK M2 y-y growth % (RHS) (%)
Source: CEIC, Bloomberg, Nomura research
Measures to be carried out to rein in liquidity, but these may not be effective
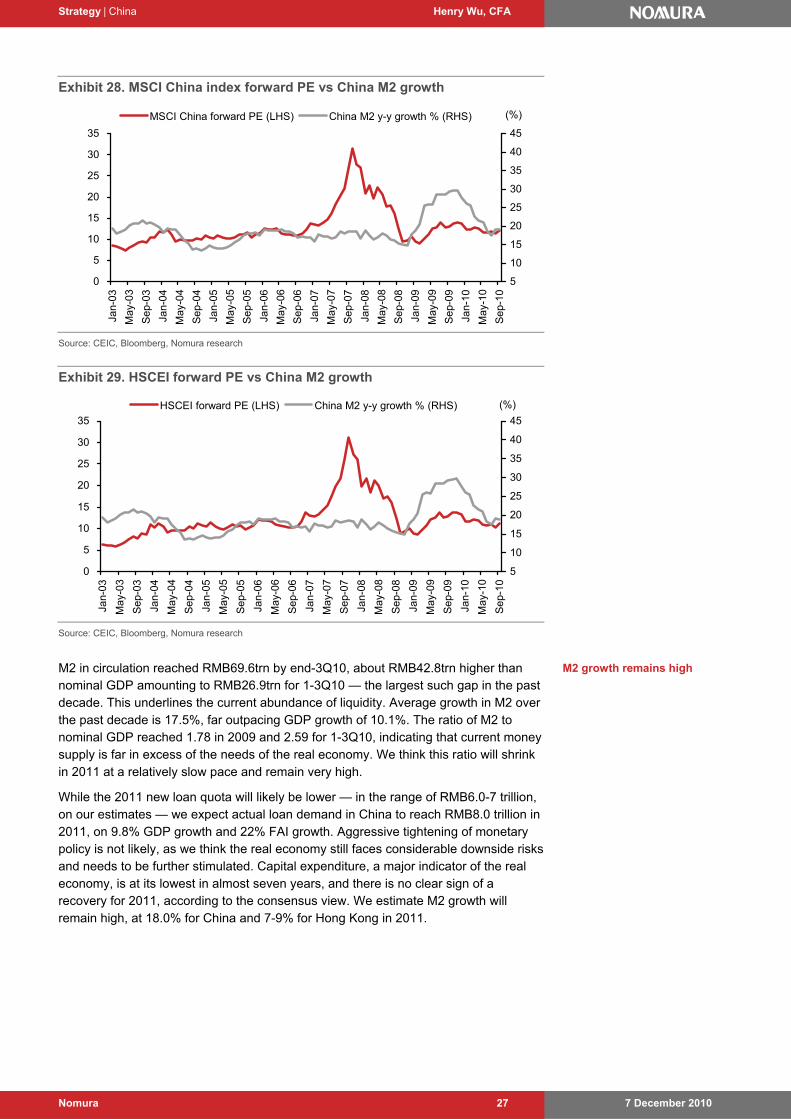
Strategy | China Henry Wu, CFA
7 December 2010 Nomura 27
Exhibit 28. MSCI China index forward PE vs China M2 growth
0
5
10
15
20
25
30
35
Jan-
03
May
-03
Sep
-03
Jan-
04
May
-04
Sep
-04
Jan-
05
May
-05
Sep
-05
Jan-
06
May
-06
Sep
-06
Jan-
07
May
-07
Sep
-07
Jan-
08
May
-08
Sep
-08
Jan-
09
May
-09
Sep
-09
Jan-
10
May
-10
Sep
-10
5
10
15
20
25
30
35
40
45
MSCI China forward PE (LHS) China M2 y-y growth % (RHS) (%)
Source: CEIC, Bloomberg, Nomura research
Exhibit 29. HSCEI forward PE vs China M2 growth
0
5
10
15
20
25
30
35
Jan-
03
May
-03
Sep
-03
Jan-
04
May
-04
Sep
-04
Jan-
05
May
-05
Sep
-05
Jan-
06
May
-06
Sep
-06
Jan-
07
May
-07
Sep
-07
Jan-
08
May
-08
Sep
-08
Jan-
09
May
-09
Sep
-09
Jan-
10
May
-10
Sep
-10
5
10
15
20
25
30
35
40
45
HSCEI forward PE (LHS) China M2 y-y growth % (RHS) (%)
Source: CEIC, Bloomberg, Nomura research
M2 in circulation reached RMB69.6trn by end-3Q10, about RMB42.8trn higher than nominal GDP amounting to RMB26.9trn for 1-3Q10 — the largest such gap in the past decade. This underlines the current abundance of liquidity. Average growth in M2 over the past decade is 17.5%, far outpacing GDP growth of 10.1%. The ratio of M2 to nominal GDP reached 1.78 in 2009 and 2.59 for 1-3Q10, indicating that current money supply is far in excess of the needs of the real economy. We think this ratio will shrink in 2011 at a relatively slow pace and remain very high.
While the 2011 new loan quota will likely be lower — in the range of RMB6.0-7 trillion, on our estimates — we expect actual loan demand in China to reach RMB8.0 trillion in 2011, on 9.8% GDP growth and 22% FAI growth. Aggressive tightening of monetary policy is not likely, as we think the real economy still faces considerable downside risks and needs to be further stimulated. Capital expenditure, a major indicator of the real economy, is at its lowest in almost seven years, and there is no clear sign of a recovery for 2011, according to the consensus view. We estimate M2 growth will remain high, at 18.0% for China and 7-9% for Hong Kong in 2011.
M2 growth remains high
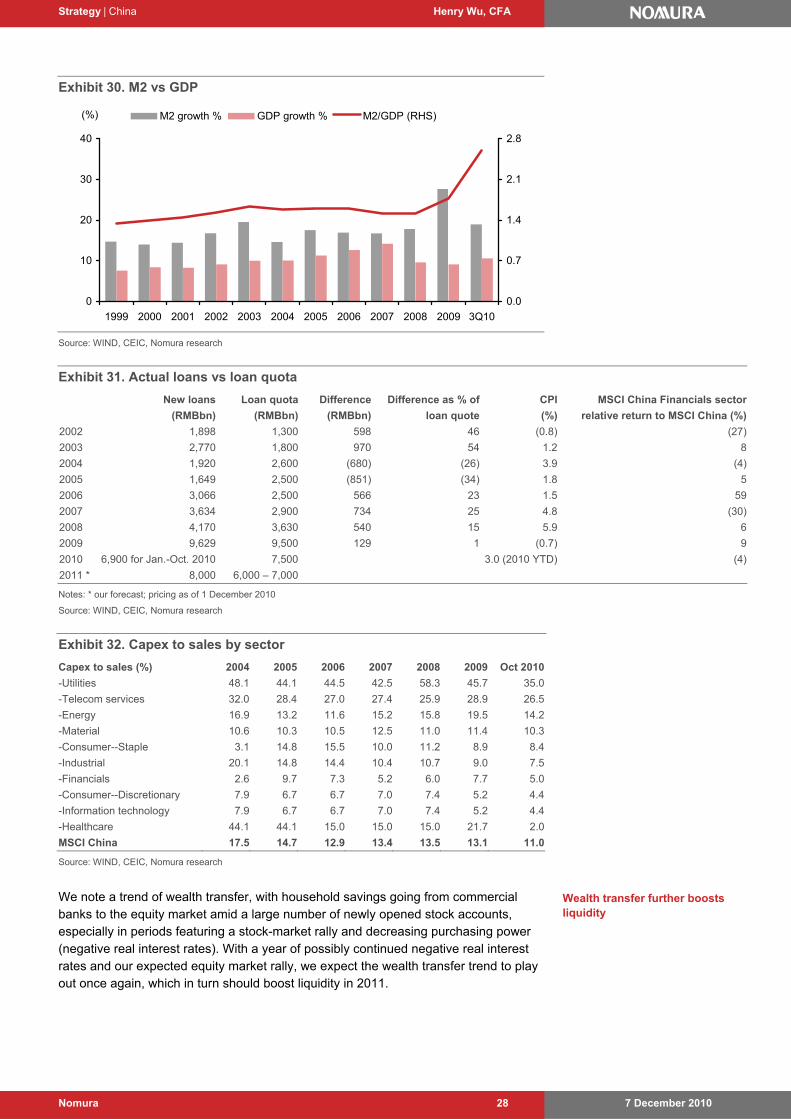
Strategy | China Henry Wu, CFA
7 December 2010 Nomura 28
Exhibit 30. M2 vs GDP
0
10
20
30
40
1999 2000 2001 2002 2003 2004 2005 2006 2007 2008 2009 3Q10
0.0
0.7
1.4
2.1
2.8
M2 growth % GDP growth % M2/GDP (RHS)(%)
Source: WIND, CEIC, Nomura research
Exhibit 31. Actual loans vs loan quota
New loans Loan quota Difference Difference as % of CPI MSCI China Financials sector
(RMBbn) (RMBbn) (RMBbn) loan quote (%) relative return to MSCI China (%)
2002 1,898 1,300 598 46 (0.8) (27)
2003 2,770 1,800 970 54 1.2 8
2004 1,920 2,600 (680) (26) 3.9 (4)
2005 1,649 2,500 (851) (34) 1.8 5
2006 3,066 2,500 566 23 1.5 59
2007 3,634 2,900 734 25 4.8 (30)
2008 4,170 3,630 540 15 5.9 6
2009 9,629 9,500 129 1 (0.7) 9
2010 6,900 for Jan.-Oct. 2010 7,500 3.0 (2010 YTD) (4)
2011 * 8,000 6,000 – 7,000 Notes: * our forecast; pricing as of 1 December 2010
Source: WIND, CEIC, Nomura research
Exhibit 32. Capex to sales by sector
Capex to sales (%) 2004 2005 2006 2007 2008 2009 Oct 2010
-Utilities 48.1 44.1 44.5 42.5 58.3 45.7 35.0
-Telecom services 32.0 28.4 27.0 27.4 25.9 28.9 26.5
-Energy 16.9 13.2 11.6 15.2 15.8 19.5 14.2
-Material 10.6 10.3 10.5 12.5 11.0 11.4 10.3
-Consumer--Staple 3.1 14.8 15.5 10.0 11.2 8.9 8.4
-Industrial 20.1 14.8 14.4 10.4 10.7 9.0 7.5
-Financials 2.6 9.7 7.3 5.2 6.0 7.7 5.0
-Consumer--Discretionary 7.9 6.7 6.7 7.0 7.4 5.2 4.4
-Information technology 7.9 6.7 6.7 7.0 7.4 5.2 4.4
-Healthcare 44.1 44.1 15.0 15.0 15.0 21.7 2.0
MSCI China 17.5 14.7 12.9 13.4 13.5 13.1 11.0
Source: WIND, CEIC, Nomura research
We note a trend of wealth transfer, with household savings going from commercial banks to the equity market amid a large number of newly opened stock accounts, especially in periods featuring a stock-market rally and decreasing purchasing power (negative real interest rates). With a year of possibly continued negative real interest rates and our expected equity market rally, we expect the wealth transfer trend to play out once again, which in turn should boost liquidity in 2011.
Wealth transfer further boosts liquidity
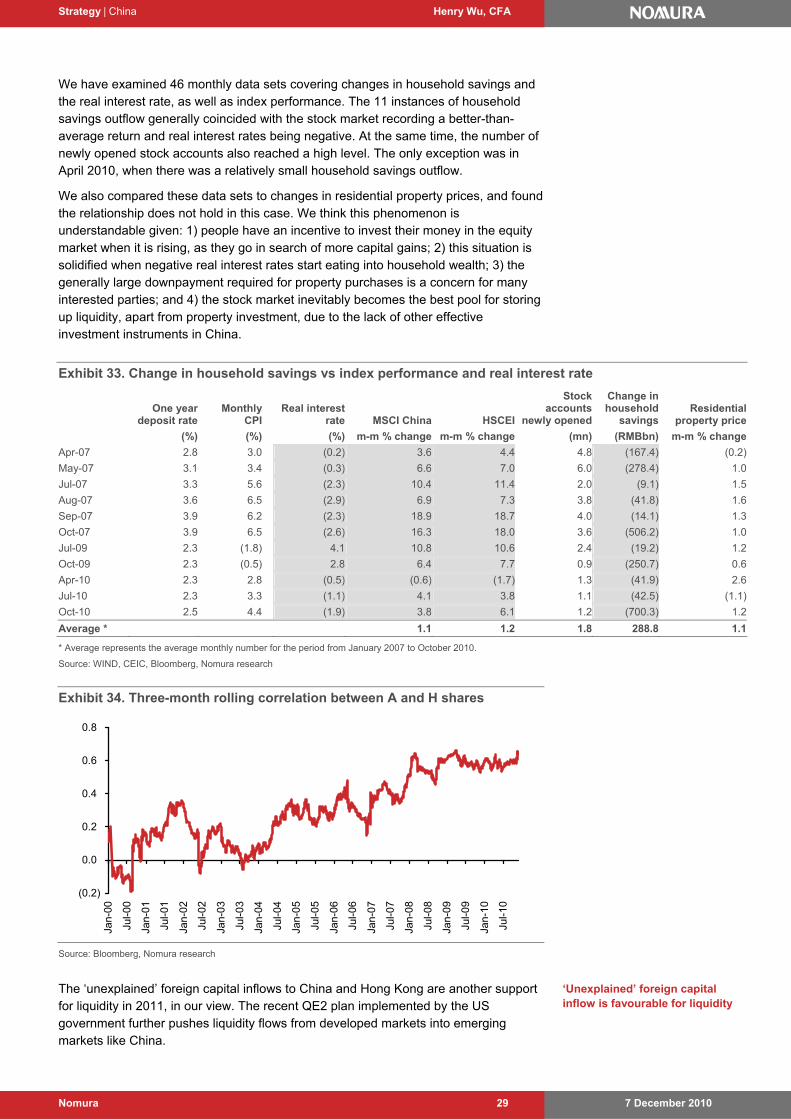
Strategy | China Henry Wu, CFA
7 December 2010 Nomura 29
We have examined 46 monthly data sets covering changes in household savings and the real interest rate, as well as index performance. The 11 instances of household savings outflow generally coincided with the stock market recording a better-than-average return and real interest rates being negative. At the same time, the number of newly opened stock accounts also reached a high level. The only exception was in April 2010, when there was a relatively small household savings outflow.
We also compared these data sets to changes in residential property prices, and found the relationship does not hold in this case. We think this phenomenon is understandable given: 1) people have an incentive to invest their money in the equity market when it is rising, as they go in search of more capital gains; 2) this situation is solidified when negative real interest rates start eating into household wealth; 3) the generally large downpayment required for property purchases is a concern for many interested parties; and 4) the stock market inevitably becomes the best pool for storing up liquidity, apart from property investment, due to the lack of other effective investment instruments in China.
Exhibit 33. Change in household savings vs index performance and real interest rate
One year
deposit rate Monthly
CPI Real interest
rate MSCI China HSCEI
Stock accounts
newly opened
Change in household
savingsResidential
property price
(%) (%) (%) m-m % change m-m % change (mn) (RMBbn) m-m % change
Apr-07 2.8 3.0 (0.2) 3.6 4.4 4.8 (167.4) (0.2)
May-07 3.1 3.4 (0.3) 6.6 7.0 6.0 (278.4) 1.0
Jul-07 3.3 5.6 (2.3) 10.4 11.4 2.0 (9.1) 1.5
Aug-07 3.6 6.5 (2.9) 6.9 7.3 3.8 (41.8) 1.6
Sep-07 3.9 6.2 (2.3) 18.9 18.7 4.0 (14.1) 1.3
Oct-07 3.9 6.5 (2.6) 16.3 18.0 3.6 (506.2) 1.0
Jul-09 2.3 (1.8) 4.1 10.8 10.6 2.4 (19.2) 1.2
Oct-09 2.3 (0.5) 2.8 6.4 7.7 0.9 (250.7) 0.6
Apr-10 2.3 2.8 (0.5) (0.6) (1.7) 1.3 (41.9) 2.6
Jul-10 2.3 3.3 (1.1) 4.1 3.8 1.1 (42.5) (1.1)
Oct-10 2.5 4.4 (1.9) 3.8 6.1 1.2 (700.3) 1.2
Average * 1.1 1.2 1.8 288.8 1.1
* Average represents the average monthly number for the period from January 2007 to October 2010.
Source: WIND, CEIC, Bloomberg, Nomura research
Exhibit 34. Three-month rolling correlation between A and H shares
(0.2)
0.0
0.2
0.4
0.6
0.8
Jan-
00
Jul-0
0
Jan-
01
Jul-0
1
Jan-
02
Jul-0
2
Jan-
03
Jul-0
3
Jan-
04
Jul-0
4
Jan-
05
Jul-0
5
Jan-
06
Jul-0
6
Jan-
07
Jul-0
7
Jan-
08
Jul-0
8
Jan-
09
Jul-0
9
Jan-
10
Jul-1
0
Source: Bloomberg, Nomura research
The ‘unexplained’ foreign capital inflows to China and Hong Kong are another support for liquidity in 2011, in our view. The recent QE2 plan implemented by the US government further pushes liquidity flows from developed markets into emerging markets like China.
‘Unexplained’ foreign capital inflow is favourable for liquidity
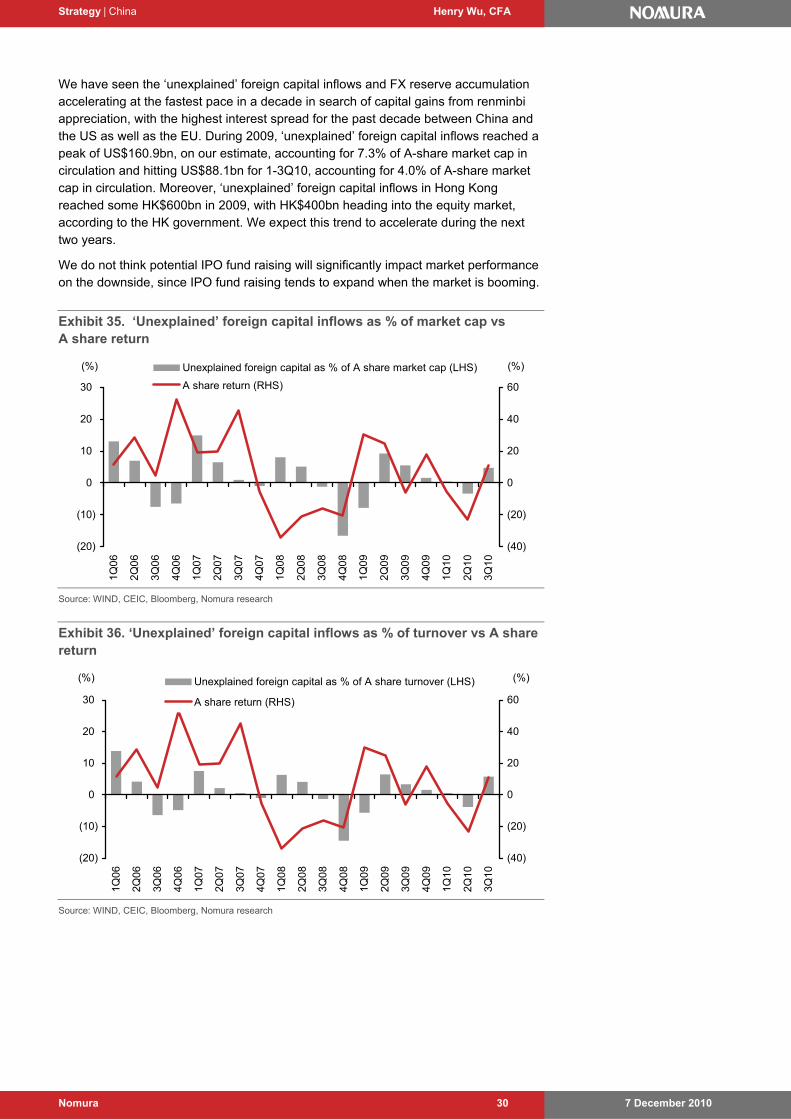
Strategy | China Henry Wu, CFA
7 December 2010 Nomura 30
We have seen the ‘unexplained’ foreign capital inflows and FX reserve accumulation accelerating at the fastest pace in a decade in search of capital gains from renminbi appreciation, with the highest interest spread for the past decade between China and the US as well as the EU. During 2009, ‘unexplained’ foreign capital inflows reached a peak of US$160.9bn, on our estimate, accounting for 7.3% of A-share market cap in circulation and hitting US$88.1bn for 1-3Q10, accounting for 4.0% of A-share market cap in circulation. Moreover, ‘unexplained’ foreign capital inflows in Hong Kong reached some HK$600bn in 2009, with HK$400bn heading into the equity market, according to the HK government. We expect this trend to accelerate during the next two years.
We do not think potential IPO fund raising will significantly impact market performance on the downside, since IPO fund raising tends to expand when the market is booming.
Exhibit 35. ‘Unexplained’ foreign capital inflows as % of market cap vs A share return
(20)
(10)
0
10
20
30
1Q06
2Q06
3Q06
4Q06
1Q07
2Q07
3Q07
4Q07
1Q08
2Q08
3Q08
4Q08
1Q09
2Q09
3Q09
4Q09
1Q10
2Q10
3Q10
(40)
(20)
0
20
40
60
Unexplained foreign capital as % of A share market cap (LHS)
A share return (RHS)
(%) (%)
Source: WIND, CEIC, Bloomberg, Nomura research
Exhibit 36. ‘Unexplained’ foreign capital inflows as % of turnover vs A share return
(20)
(10)
0
10
20
30
1Q06
2Q06
3Q06
4Q06
1Q07
2Q07
3Q07
4Q07
1Q08
2Q08
3Q08
4Q08
1Q09
2Q09
3Q09
4Q09
1Q10
2Q10
3Q10
(40)
(20)
0
20
40
60
Unexplained foreign capital as % of A share turnover (LHS)
A share return (RHS)
(%) (%)
Source: WIND, CEIC, Bloomberg, Nomura research
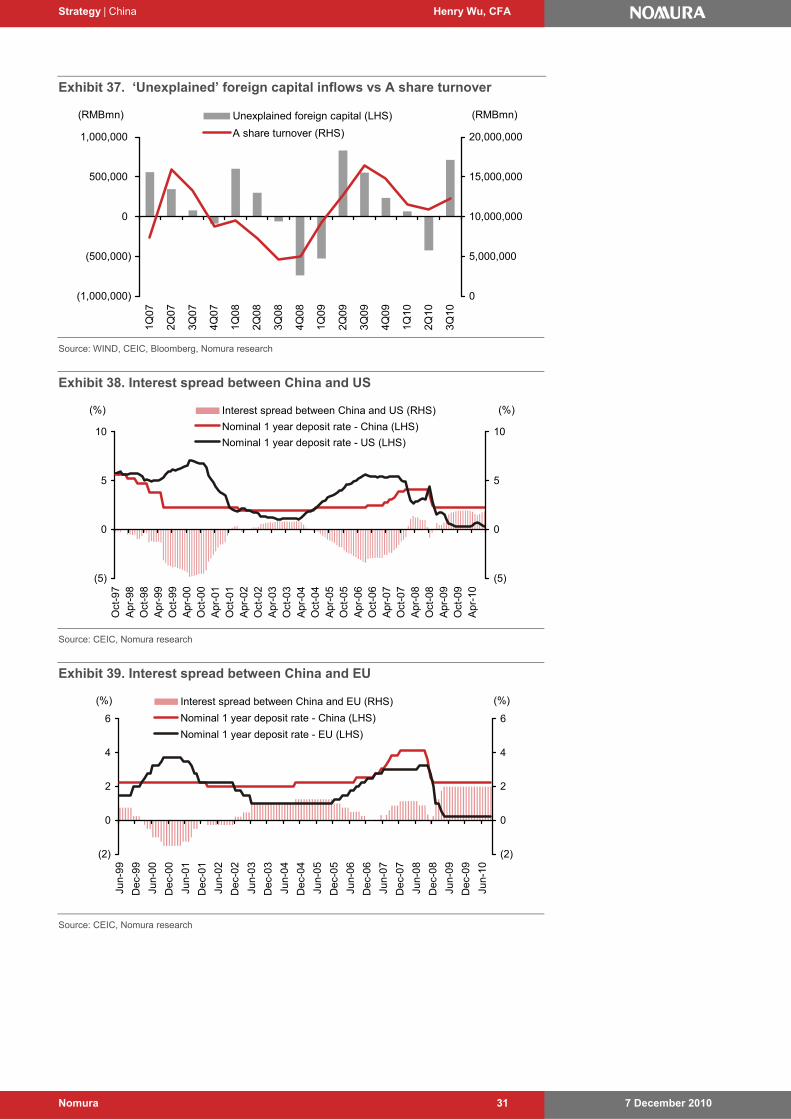
Strategy | China Henry Wu, CFA
7 December 2010 Nomura 31
Exhibit 37. ‘Unexplained’ foreign capital inflows vs A share turnover
(1,000,000)
(500,000)
0
500,000
1,000,0001Q
07
2Q07
3Q07
4Q07
1Q08
2Q08
3Q08
4Q08
1Q09
2Q09
3Q09
4Q09
1Q10
2Q10
3Q10
0
5,000,000
10,000,000
15,000,000
20,000,000
Unexplained foreign capital (LHS)
A share turnover (RHS)
(RMBmn) (RMBmn)
Source: WIND, CEIC, Bloomberg, Nomura research
Exhibit 38. Interest spread between China and US
(5)
0
5
10
Oct
-97
Apr
-98
Oct
-98
Apr
-99
Oct
-99
Apr
-00
Oct
-00
Apr
-01
Oct
-01
Apr
-02
Oct
-02
Apr
-03
Oct
-03
Apr
-04
Oct
-04
Apr
-05
Oct
-05
Apr
-06
Oct
-06
Apr
-07
Oct
-07
Apr
-08
Oct
-08
Apr
-09
Oct
-09
Apr
-10
(5)
0
5
10
Interest spread between China and US (RHS)
Nominal 1 year deposit rate - China (LHS)
Nominal 1 year deposit rate - US (LHS)
(%) (%)
Source: CEIC, Nomura research
Exhibit 39. Interest spread between China and EU
(2)
0
2
4
6
Jun-
99
Dec
-99
Jun-
00
Dec
-00
Jun-
01
Dec
-01
Jun-
02
Dec
-02
Jun-
03
Dec
-03
Jun-
04
Dec
-04
Jun-
05
Dec
-05
Jun-
06
Dec
-06
Jun-
07
Dec
-07
Jun-
08
Dec
-08
Jun-
09
Dec
-09
Jun-
10
(2)
0
2
4
6
Interest spread between China and EU (RHS)
Nominal 1 year deposit rate - China (LHS)
Nominal 1 year deposit rate - EU (LHS)
(%) (%)
Source: CEIC, Nomura research
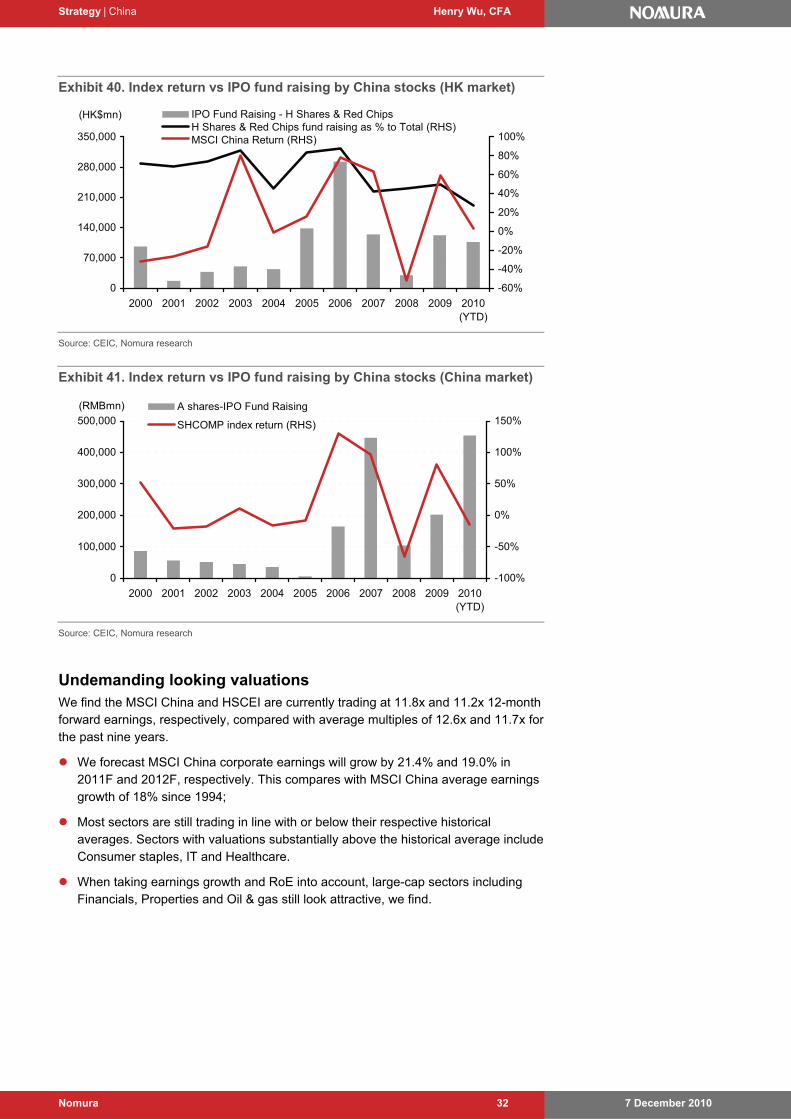
Strategy | China Henry Wu, CFA
7 December 2010 Nomura 32
Exhibit 40. Index return vs IPO fund raising by China stocks (HK market)
0
70,000
140,000
210,000
280,000
350,000
2000 2001 2002 2003 2004 2005 2006 2007 2008 2009 2010(YTD)
-60%
-40%
-20%
0%
20%
40%
60%
80%
100%
IPO Fund Raising - H Shares & Red ChipsH Shares & Red Chips fund raising as % to Total (RHS)MSCI China Return (RHS)
(HK$mn)
Source: CEIC, Nomura research
Exhibit 41. Index return vs IPO fund raising by China stocks (China market)
0
100,000
200,000
300,000
400,000
500,000
2000 2001 2002 2003 2004 2005 2006 2007 2008 2009 2010(YTD)
-100%
-50%
0%
50%
100%
150%A shares-IPO Fund Raising
SHCOMP index return (RHS)
(RMBmn)
Source: CEIC, Nomura research
Undemanding looking valuations We find the MSCI China and HSCEI are currently trading at 11.8x and 11.2x 12-month forward earnings, respectively, compared with average multiples of 12.6x and 11.7x for the past nine years.
We forecast MSCI China corporate earnings will grow by 21.4% and 19.0% in 2011F and 2012F, respectively. This compares with MSCI China average earnings growth of 18% since 1994;
Most sectors are still trading in line with or below their respective historical averages. Sectors with valuations substantially above the historical average include Consumer staples, IT and Healthcare.
When taking earnings growth and RoE into account, large-cap sectors including Financials, Properties and Oil & gas still look attractive, we find.
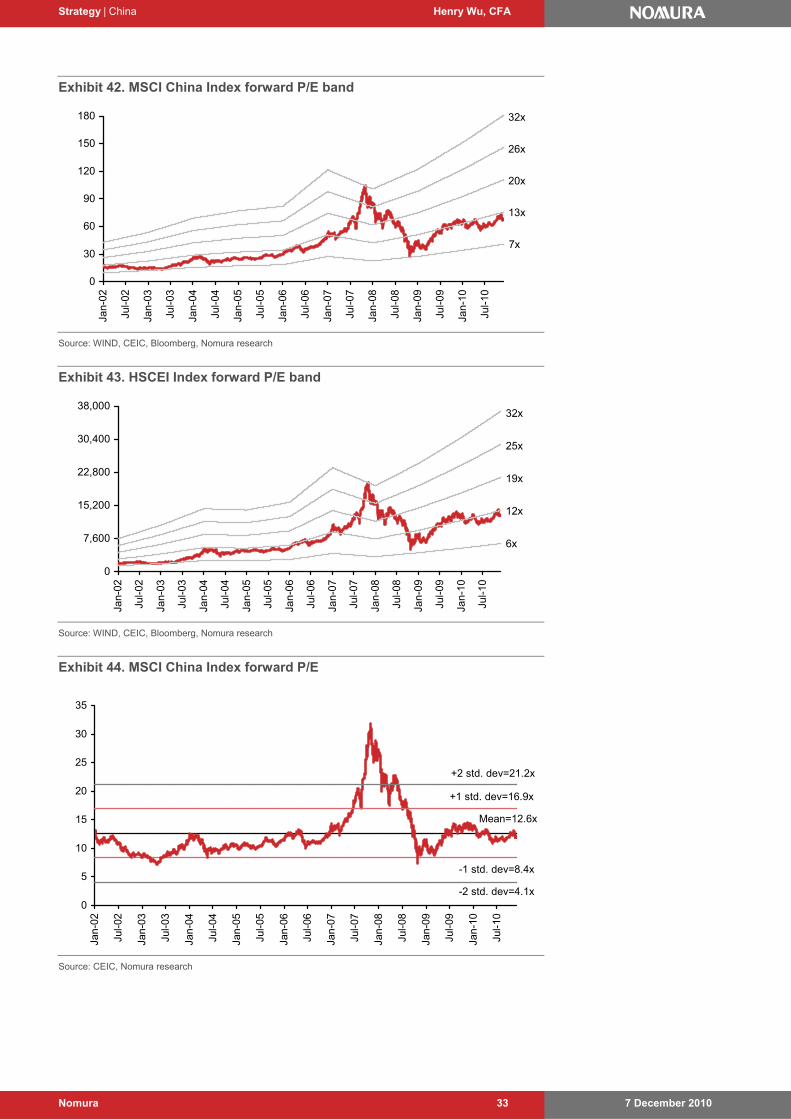
Strategy | China Henry Wu, CFA
7 December 2010 Nomura 33
Exhibit 42. MSCI China Index forward P/E band
7x
13x
20x
26x
32x
0
30
60
90
120
150
180Ja
n-02
Jul-0
2
Jan-
03
Jul-0
3
Jan-
04
Jul-0
4
Jan-
05
Jul-0
5
Jan-
06
Jul-0
6
Jan-
07
Jul-0
7
Jan-
08
Jul-0
8
Jan-
09
Jul-0
9
Jan-
10
Jul-1
0
Source: WIND, CEIC, Bloomberg, Nomura research
Exhibit 43. HSCEI Index forward P/E band
6x
12x
19x
25x
32x
0
7,600
15,200
22,800
30,400
38,000
Jan-
02
Jul-0
2
Jan-
03
Jul-0
3
Jan-
04
Jul-0
4
Jan-
05
Jul-0
5
Jan-
06
Jul-0
6
Jan-
07
Jul-0
7
Jan-
08
Jul-0
8
Jan-
09
Jul-0
9
Jan-
10
Jul-1
0
Source: WIND, CEIC, Bloomberg, Nomura research
Exhibit 44. MSCI China Index forward P/E
-2 std. dev=4.1x
-1 std. dev=8.4x
Mean=12.6x
+1 std. dev=16.9x
+2 std. dev=21.2x
0
5
10
15
20
25
30
35
Jan-
02
Jul-0
2
Jan-
03
Jul-0
3
Jan-
04
Jul-0
4
Jan-
05
Jul-0
5
Jan-
06
Jul-0
6
Jan-
07
Jul-0
7
Jan-
08
Jul-0
8
Jan-
09
Jul-0
9
Jan-
10
Jul-1
0
Source: CEIC, Nomura research
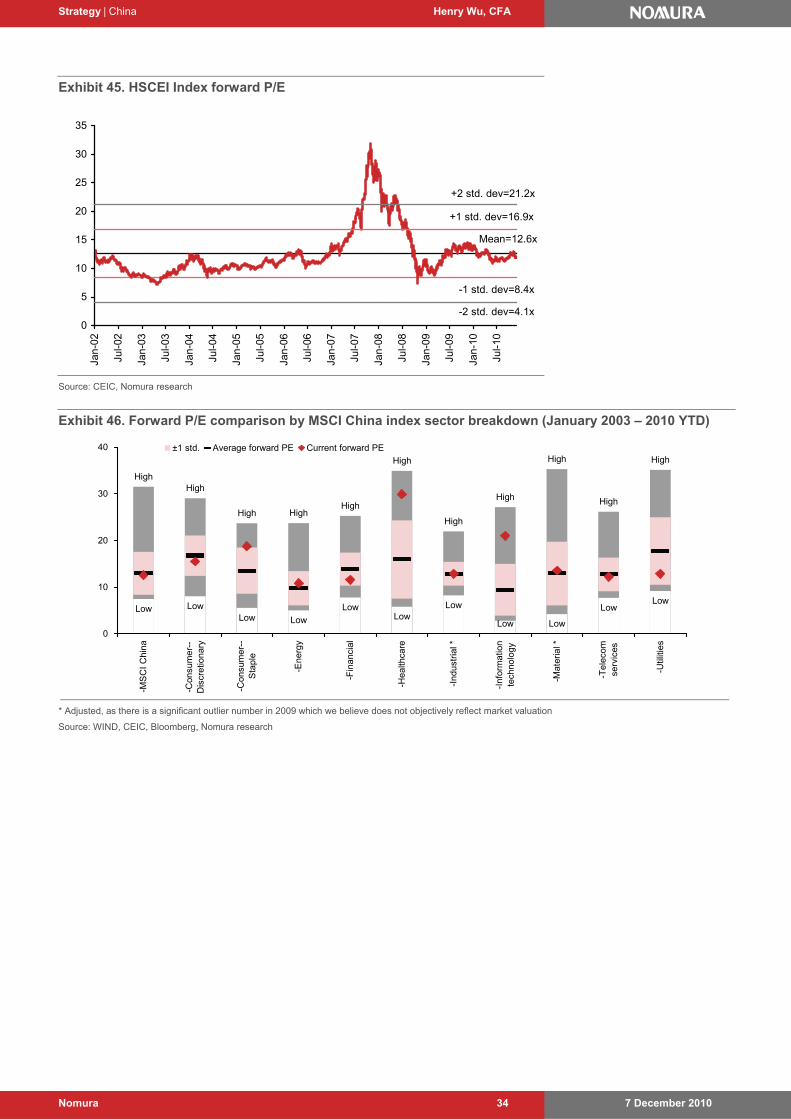
Strategy | China Henry Wu, CFA
7 December 2010 Nomura 34
Exhibit 45. HSCEI Index forward P/E
-2 std. dev=4.1x
-1 std. dev=8.4x
Mean=12.6x
+1 std. dev=16.9x
+2 std. dev=21.2x
0
5
10
15
20
25
30
35
Jan-
02
Jul-0
2
Jan-
03
Jul-0
3
Jan-
04
Jul-0
4
Jan-
05
Jul-0
5
Jan-
06
Jul-0
6
Jan-
07
Jul-0
7
Jan-
08
Jul-0
8
Jan-
09
Jul-0
9
Jan-
10
Jul-1
0
Source: CEIC, Nomura research
Exhibit 46. Forward P/E comparison by MSCI China index sector breakdown (January 2003 – 2010 YTD)
HighHigh
High HighHigh
High
High
High
High
High
High
Low LowLow Low
LowLow
Low
Low Low
LowLow
0
10
20
30
40
-MS
CI
Chi
na
-Con
sum
er--
Dis
cret
iona
ry
-Con
sum
er--
Sta
ple
-Ene
rgy
-Fin
anci
al
-Hea
lthca
re
-Ind
ustr
ial *
-Inf
orm
atio
nte
chno
logy
-Mat
eria
l *
-Tel
ecom
serv
ices
-Util
ities
±1 std. Average forward PE Current forward PE
* Adjusted, as there is a significant outlier number in 2009 which we believe does not objectively reflect market valuation
Source: WIND, CEIC, Bloomberg, Nomura research
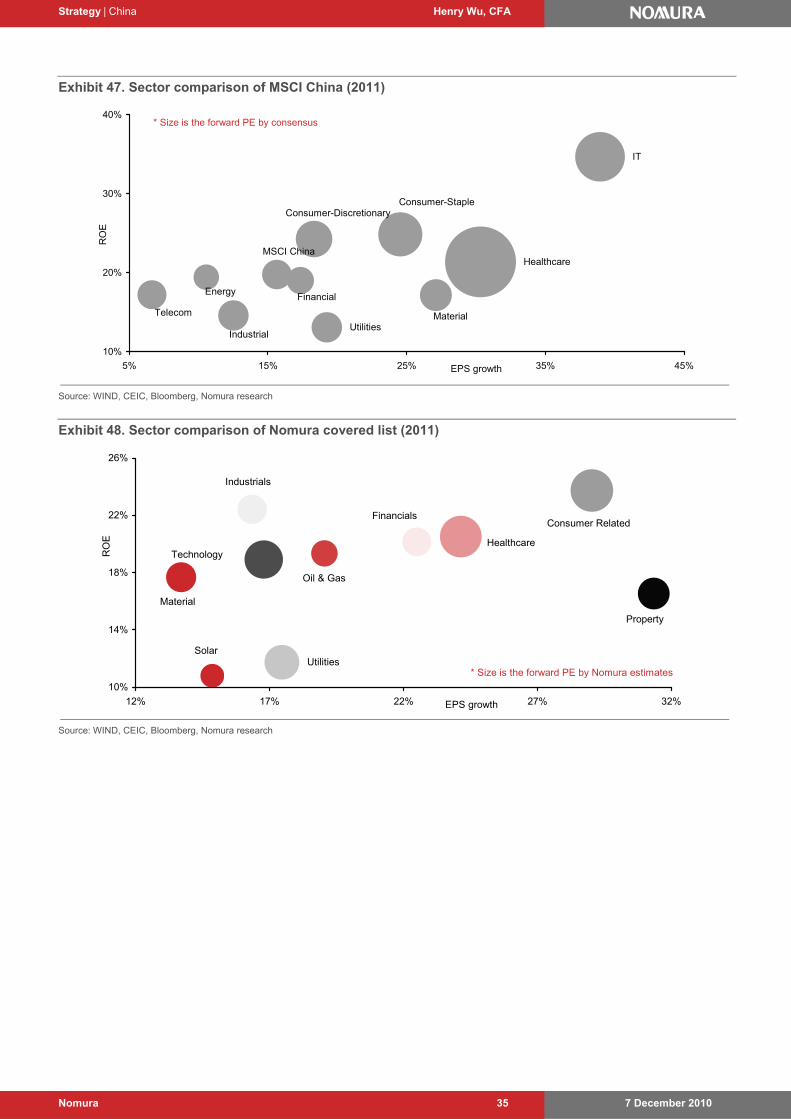
Strategy | China Henry Wu, CFA
7 December 2010 Nomura 35
Exhibit 47. Sector comparison of MSCI China (2011)
MSCI China
Consumer-DiscretionaryConsumer-Staple
EnergyFinancial
Healthcare
Industrial
IT
MaterialTelecom
Utilities
10%
20%
30%
40%
5% 15% 25% 35% 45%EPS growth
RO
E
* Size is the forward PE by consensus
Source: WIND, CEIC, Bloomberg, Nomura research
Exhibit 48. Sector comparison of Nomura covered list (2011)
Consumer Related
Healthcare
Property
Utilities
Material
Industrials
Solar
Oil & Gas
Financials
Technology
10%
14%
18%
22%
26%
12% 17% 22% 27% 32%EPS growth
RO
E
* Size is the forward PE by Nomura estimates
Source: WIND, CEIC, Bloomberg, Nomura research
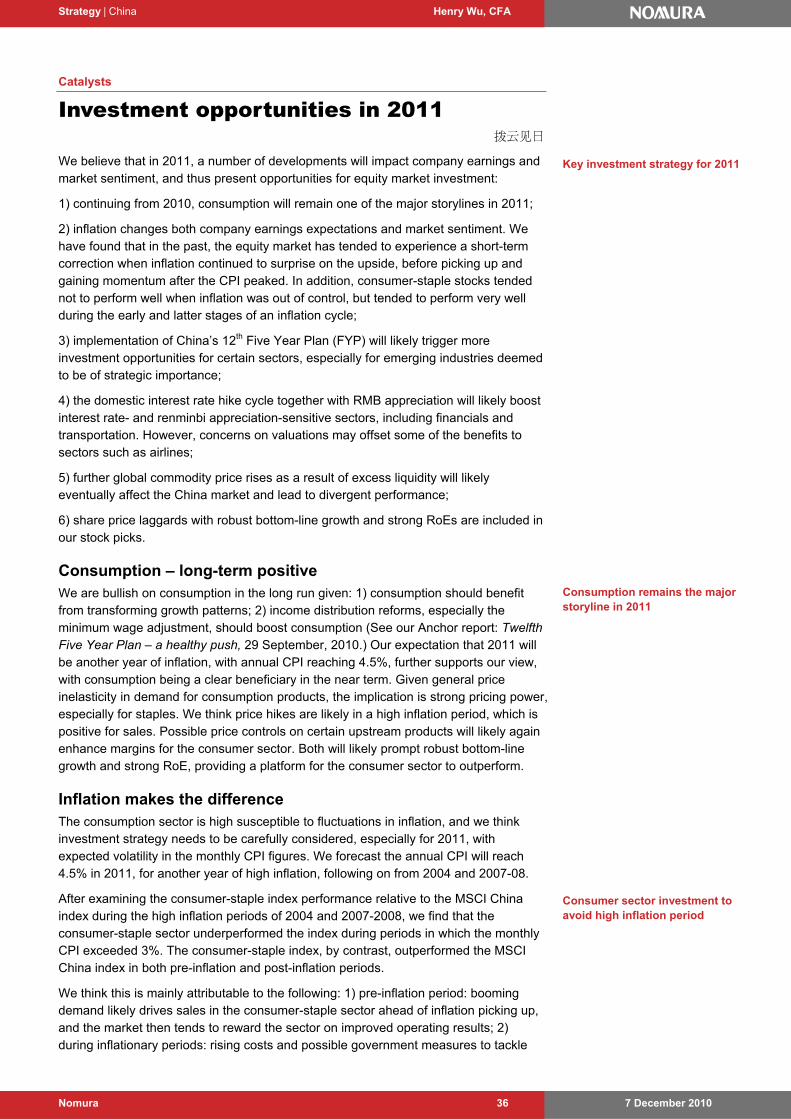
Strategy | China Henry Wu, CFA
7 December 2010 Nomura 36
Catalysts
Investment opportunities in 2011 拨云见日
We believe that in 2011, a number of developments will impact company earnings and market sentiment, and thus present opportunities for equity market investment:
1) continuing from 2010, consumption will remain one of the major storylines in 2011;
2) inflation changes both company earnings expectations and market sentiment. We have found that in the past, the equity market has tended to experience a short-term correction when inflation continued to surprise on the upside, before picking up and gaining momentum after the CPI peaked. In addition, consumer-staple stocks tended not to perform well when inflation was out of control, but tended to perform very well during the early and latter stages of an inflation cycle;
3) implementation of China’s 12th Five Year Plan (FYP) will likely trigger more investment opportunities for certain sectors, especially for emerging industries deemed to be of strategic importance;
4) the domestic interest rate hike cycle together with RMB appreciation will likely boost interest rate- and renminbi appreciation-sensitive sectors, including financials and transportation. However, concerns on valuations may offset some of the benefits to sectors such as airlines;
5) further global commodity price rises as a result of excess liquidity will likely eventually affect the China market and lead to divergent performance;
6) share price laggards with robust bottom-line growth and strong RoEs are included in our stock picks.
Consumption – long-term positive We are bullish on consumption in the long run given: 1) consumption should benefit from transforming growth patterns; 2) income distribution reforms, especially the minimum wage adjustment, should boost consumption (See our Anchor report: Twelfth Five Year Plan – a healthy push, 29 September, 2010.) Our expectation that 2011 will be another year of inflation, with annual CPI reaching 4.5%, further supports our view, with consumption being a clear beneficiary in the near term. Given general price inelasticity in demand for consumption products, the implication is strong pricing power, especially for staples. We think price hikes are likely in a high inflation period, which is positive for sales. Possible price controls on certain upstream products will likely again enhance margins for the consumer sector. Both will likely prompt robust bottom-line growth and strong RoE, providing a platform for the consumer sector to outperform.
Inflation makes the difference The consumption sector is high susceptible to fluctuations in inflation, and we think investment strategy needs to be carefully considered, especially for 2011, with expected volatility in the monthly CPI figures. We forecast the annual CPI will reach 4.5% in 2011, for another year of high inflation, following on from 2004 and 2007-08.
After examining the consumer-staple index performance relative to the MSCI China index during the high inflation periods of 2004 and 2007-2008, we find that the consumer-staple sector underperformed the index during periods in which the monthly CPI exceeded 3%. The consumer-staple index, by contrast, outperformed the MSCI China index in both pre-inflation and post-inflation periods.
We think this is mainly attributable to the following: 1) pre-inflation period: booming demand likely drives sales in the consumer-staple sector ahead of inflation picking up, and the market then tends to reward the sector on improved operating results; 2) during inflationary periods: rising costs and possible government measures to tackle
Consumption remains the major storyline in 2011
Consumer sector investment to avoid high inflation period
Key investment strategy for 2011
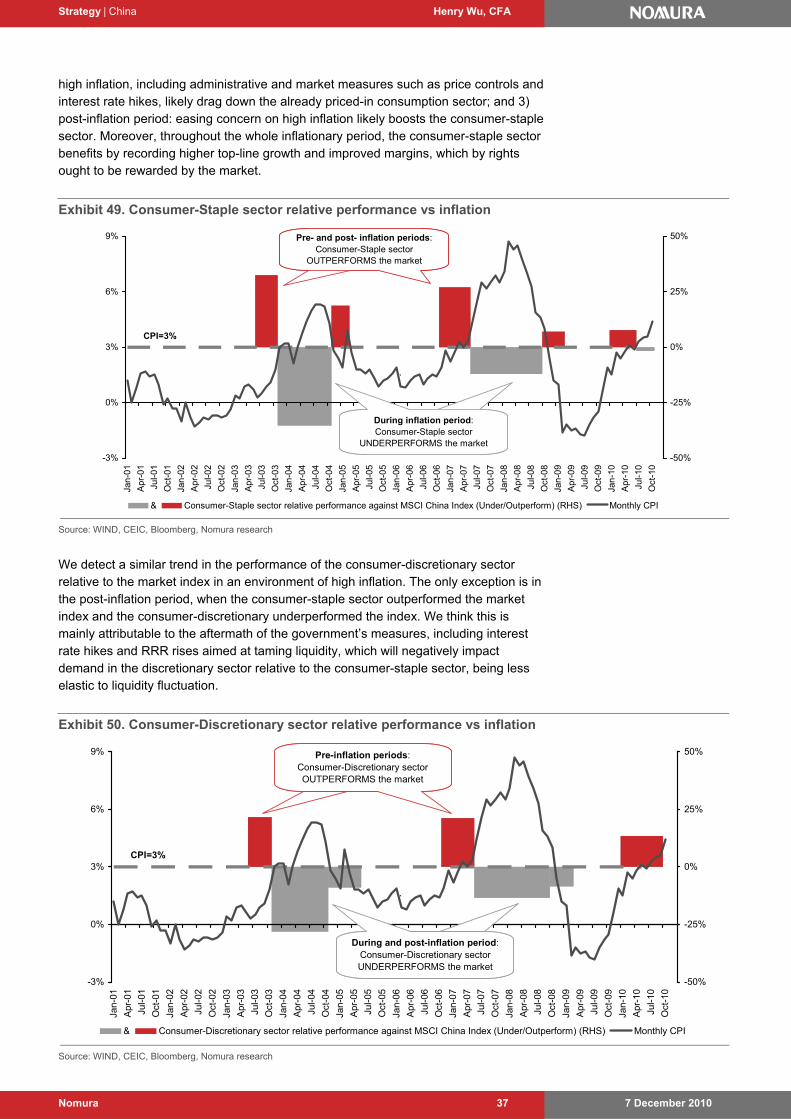
Strategy | China Henry Wu, CFA
7 December 2010 Nomura 37
high inflation, including administrative and market measures such as price controls and interest rate hikes, likely drag down the already priced-in consumption sector; and 3) post-inflation period: easing concern on high inflation likely boosts the consumer-staple sector. Moreover, throughout the whole inflationary period, the consumer-staple sector benefits by recording higher top-line growth and improved margins, which by rights ought to be rewarded by the market.
Exhibit 49. Consumer-Staple sector relative performance vs inflation
-3%
0%
3%
6%
9%
Jan-
01
Apr
-01
Jul-0
1
Oct
-01
Jan-
02
Apr
-02
Jul-0
2
Oct
-02
Jan-
03
Apr
-03
Jul-0
3
Oct
-03
Jan-
04
Apr
-04
Jul-0
4
Oct
-04
Jan-
05
Apr
-05
Jul-0
5
Oct
-05
Jan-
06
Apr
-06
Jul-0
6
Oct
-06
Jan-
07
Apr
-07
Jul-0
7
Oct
-07
Jan-
08
Apr
-08
Jul-0
8
Oct
-08
Jan-
09
Apr
-09
Jul-0
9
Oct
-09
Jan-
10
Apr
-10
Jul-1
0
Oct
-10
-50%
-25%
0%
25%
50%
& Consumer-Staple sector relative performance against MSCI China Index (Under/Outperform) (RHS) Monthly CPI
CPI=3%
During inflation period: consumption sector underperform the market
During inflation period: Consumer-Staple sector
UNDERPERFORMS the market
Pre- and post- inflation periods: consumption sector OUTPERFORM
the market
Pre- and post- inflation periods: Consumer-Staple sector
OUTPERFORMS the market
`
Source: WIND, CEIC, Bloomberg, Nomura research
We detect a similar trend in the performance of the consumer-discretionary sector relative to the market index in an environment of high inflation. The only exception is in the post-inflation period, when the consumer-staple sector outperformed the market index and the consumer-discretionary underperformed the index. We think this is mainly attributable to the aftermath of the government’s measures, including interest rate hikes and RRR rises aimed at taming liquidity, which will negatively impact demand in the discretionary sector relative to the consumer-staple sector, being less elastic to liquidity fluctuation.
Exhibit 50. Consumer-Discretionary sector relative performance vs inflation
-3%
0%
3%
6%
9%
Jan-
01
Apr
-01
Jul-0
1
Oct
-01
Jan-
02
Apr
-02
Jul-0
2
Oct
-02
Jan-
03
Apr
-03
Jul-0
3
Oct
-03
Jan-
04
Apr
-04
Jul-0
4
Oct
-04
Jan-
05
Apr
-05
Jul-0
5
Oct
-05
Jan-
06
Apr
-06
Jul-0
6
Oct
-06
Jan-
07
Apr
-07
Jul-0
7
Oct
-07
Jan-
08
Apr
-08
Jul-0
8
Oct
-08
Jan-
09
Apr
-09
Jul-0
9
Oct
-09
Jan-
10
Apr
-10
Jul-1
0
Oct
-10
-50%
-25%
0%
25%
50%
& Consumer-Discretionary sector relative performance against MSCI China Index (Under/Outperform) (RHS) Monthly CPI
CPI=3%
During inflation period: consumption sector underperform the market
During and post-inflation period: Consumer-Discretionary sector UNDERPERFORMS the market
Pre- and post- inflation periods: consumption sector OUTPERFORM
the market
Pre-inflation periods: Consumer-Discretionary sector OUTPERFORMS the market
`
Source: WIND, CEIC, Bloomberg, Nomura research
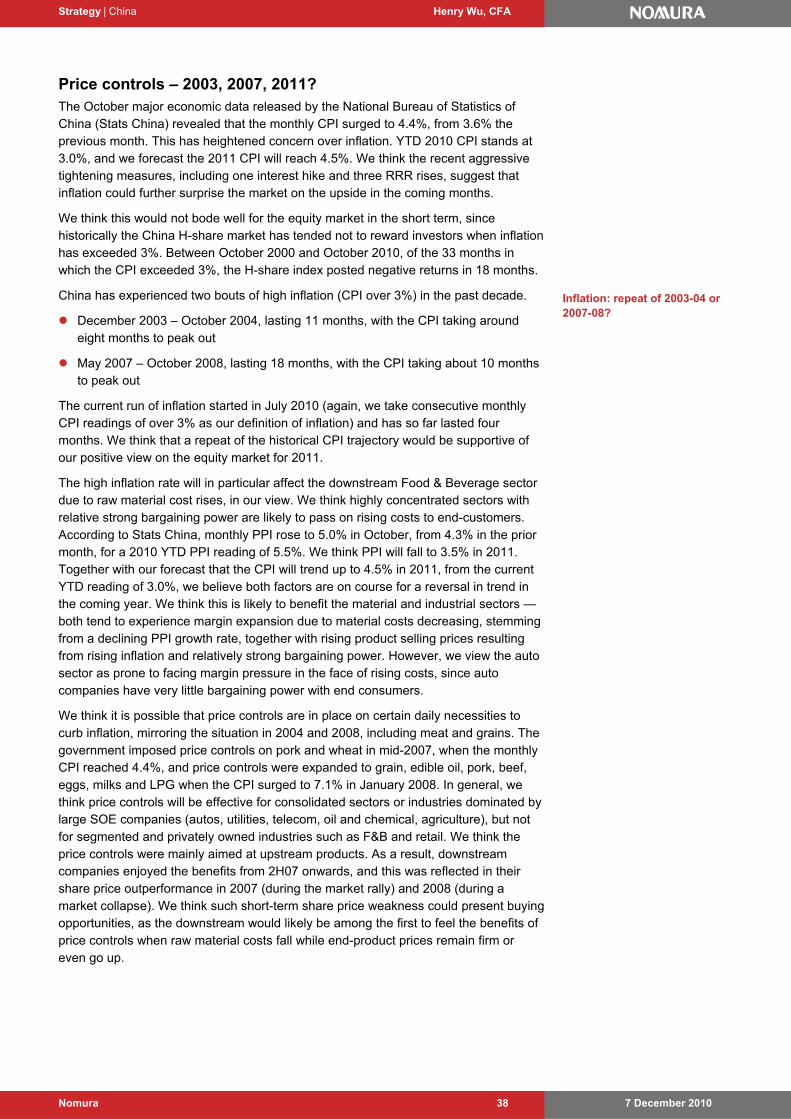
Strategy | China Henry Wu, CFA
7 December 2010 Nomura 38
Price controls – 2003, 2007, 2011? The October major economic data released by the National Bureau of Statistics of China (Stats China) revealed that the monthly CPI surged to 4.4%, from 3.6% the previous month. This has heightened concern over inflation. YTD 2010 CPI stands at 3.0%, and we forecast the 2011 CPI will reach 4.5%. We think the recent aggressive tightening measures, including one interest hike and three RRR rises, suggest that inflation could further surprise the market on the upside in the coming months.
We think this would not bode well for the equity market in the short term, since historically the China H-share market has tended not to reward investors when inflation has exceeded 3%. Between October 2000 and October 2010, of the 33 months in which the CPI exceeded 3%, the H-share index posted negative returns in 18 months.
China has experienced two bouts of high inflation (CPI over 3%) in the past decade.
December 2003 – October 2004, lasting 11 months, with the CPI taking around eight months to peak out
May 2007 – October 2008, lasting 18 months, with the CPI taking about 10 months to peak out
The current run of inflation started in July 2010 (again, we take consecutive monthly CPI readings of over 3% as our definition of inflation) and has so far lasted four months. We think that a repeat of the historical CPI trajectory would be supportive of our positive view on the equity market for 2011.
The high inflation rate will in particular affect the downstream Food & Beverage sector due to raw material cost rises, in our view. We think highly concentrated sectors with relative strong bargaining power are likely to pass on rising costs to end-customers. According to Stats China, monthly PPI rose to 5.0% in October, from 4.3% in the prior month, for a 2010 YTD PPI reading of 5.5%. We think PPI will fall to 3.5% in 2011. Together with our forecast that the CPI will trend up to 4.5% in 2011, from the current YTD reading of 3.0%, we believe both factors are on course for a reversal in trend in the coming year. We think this is likely to benefit the material and industrial sectors — both tend to experience margin expansion due to material costs decreasing, stemming from a declining PPI growth rate, together with rising product selling prices resulting from rising inflation and relatively strong bargaining power. However, we view the auto sector as prone to facing margin pressure in the face of rising costs, since auto companies have very little bargaining power with end consumers.
We think it is possible that price controls are in place on certain daily necessities to curb inflation, mirroring the situation in 2004 and 2008, including meat and grains. The government imposed price controls on pork and wheat in mid-2007, when the monthly CPI reached 4.4%, and price controls were expanded to grain, edible oil, pork, beef, eggs, milks and LPG when the CPI surged to 7.1% in January 2008. In general, we think price controls will be effective for consolidated sectors or industries dominated by large SOE companies (autos, utilities, telecom, oil and chemical, agriculture), but not for segmented and privately owned industries such as F&B and retail. We think the price controls were mainly aimed at upstream products. As a result, downstream companies enjoyed the benefits from 2H07 onwards, and this was reflected in their share price outperformance in 2007 (during the market rally) and 2008 (during a market collapse). We think such short-term share price weakness could present buying opportunities, as the downstream would likely be among the first to feel the benefits of price controls when raw material costs fall while end-product prices remain firm or even go up.
Inflation: repeat of 2003-04 or 2007-08?
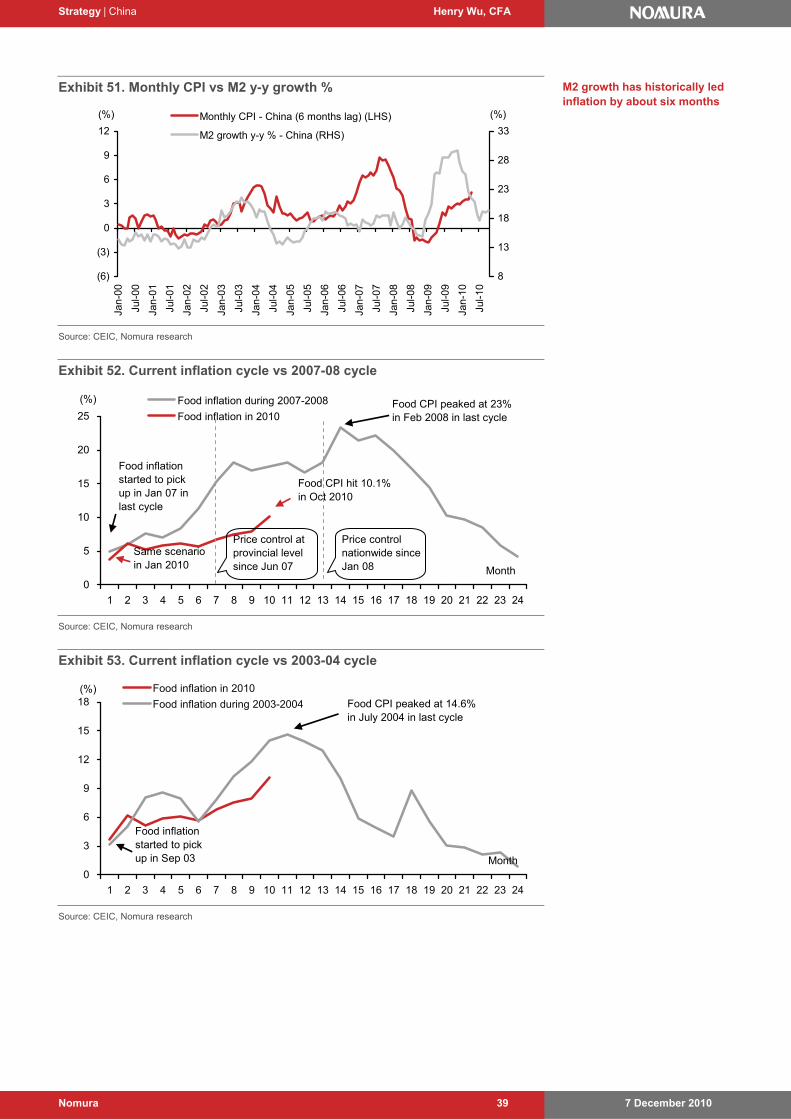
Strategy | China Henry Wu, CFA
7 December 2010 Nomura 39
Exhibit 51. Monthly CPI vs M2 y-y growth %
(6)
(3)
0
3
6
9
12Ja
n-00
Jul-0
0
Jan-
01
Jul-0
1
Jan-
02
Jul-0
2
Jan-
03
Jul-0
3
Jan-
04
Jul-0
4
Jan-
05
Jul-0
5
Jan-
06
Jul-0
6
Jan-
07
Jul-0
7
Jan-
08
Jul-0
8
Jan-
09
Jul-0
9
Jan-
10
Jul-1
0
8
13
18
23
28
33 Monthly CPI - China (6 months lag) (LHS)
M2 growth y-y % - China (RHS)
(%) (%)
Source: CEIC, Nomura research
Exhibit 52. Current inflation cycle vs 2007-08 cycle
0
5
10
15
20
25
1 2 3 4 5 6 7 8 9 10 11 12 13 14 15 16 17 18 19 20 21 22 23 24
Food inflation during 2007-2008
Food inflation in 2010
(%)
Price control at provincial level since Jun 07
Price control nationwide since Jan 08
Food inflation started to pick up in Jan 07 in last cycle
Food CPI peaked at 23% in Feb 2008 in last cycle
Same scenario in Jan 2010
Food CPI hit 10.1% in Oct 2010
Month
Source: CEIC, Nomura research
Exhibit 53. Current inflation cycle vs 2003-04 cycle
0
3
6
9
12
15
18
1 2 3 4 5 6 7 8 9 10 11 12 13 14 15 16 17 18 19 20 21 22 23 24
Food inflation in 2010
Food inflation during 2003-2004
(%)
Food inflation started to pick up in Sep 03
Food CPI peaked at 14.6% in July 2004 in last cycle
Month
Source: CEIC, Nomura research
M2 growth has historically led inflation by about six months

Strategy | China Henry Wu, CFA
7 December 2010 Nomura 40
Exhibit 54. CPI component
Housing13%
Recreation, education and
services14%
Transportation and
communications10%
Home electronics and maintenance
6%
Clothing9%
Tobacco and alcohol
4%
Foodstuffs34%
Health and medical products/services
10%
Source: Nomura research
Exhibit 55. CPI breakdown
(5)
0
5
10
15
20
25
Jan-
01M
ay-0
1S
ep-0
1Ja
n-02
May
-02
Sep
-02
Jan-
03M
ay-0
3S
ep-0
3Ja
n-04
May
-04
Sep
-04
Jan-
05M
ay-0
5S
ep-0
5Ja
n-06
May
-06
Sep
-06
Jan-
07M
ay-0
7S
ep-0
7Ja
n-08
May
-08
Sep
-08
Jan-
09M
ay-0
9S
ep-0
9Ja
n-10
May
-10
Sep
-10
CPI Core CPI Food CPI
Price control initiated
CPI=3%
(%)
Source: CEIC, Nomura research
Exhibit 56. Monthly CPI vs monthly PPI
(12)
(6)
% 0
% 6
12
Jan-
97
Jan-
98
Jan-
99
Jan-
00
Jan-
01
Jan-
02
Jan-
03
Jan-
04
Jan-
05
Jan-
06
Jan-
07
Jan-
08
Jan-
09
Jan-
10
Monthly CPI - China Monthly PPI - China(%)
Source: CEIC, Nomura research
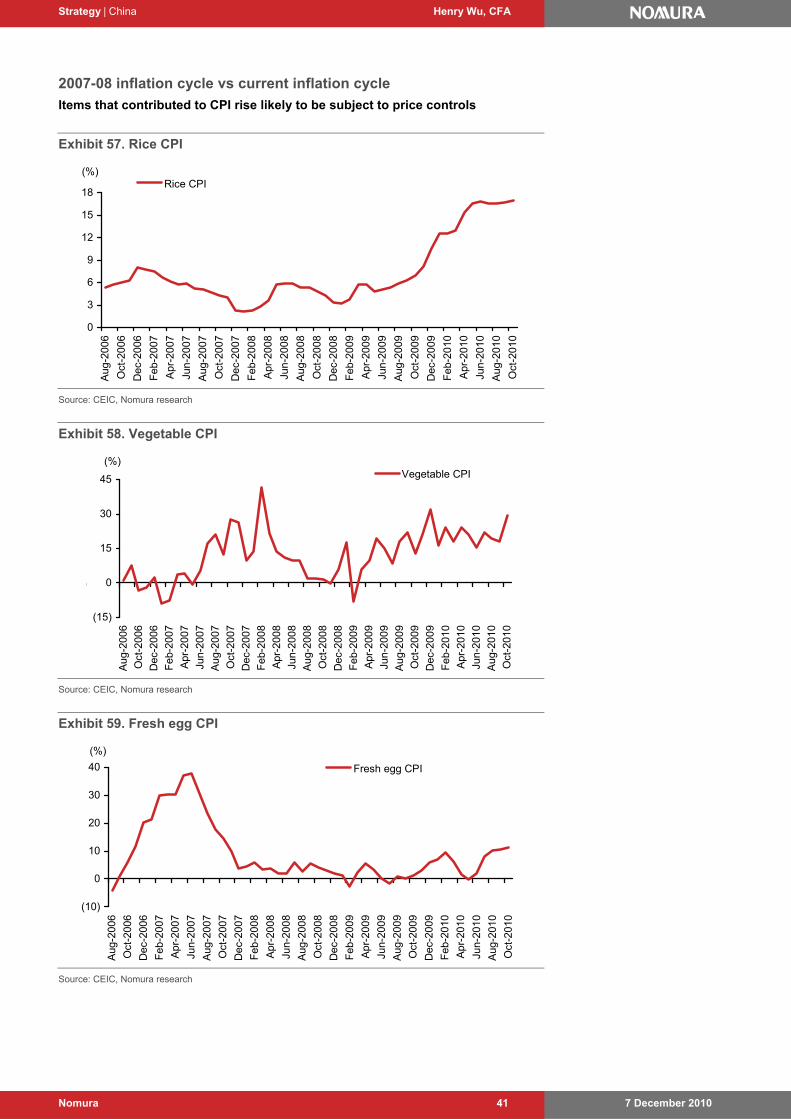
Strategy | China Henry Wu, CFA
7 December 2010 Nomura 41
2007-08 inflation cycle vs current inflation cycle
Items that contributed to CPI rise likely to be subject to price controls
Exhibit 57. Rice CPI
0
3
6
9
12
15
18
Aug
-200
6
Oct
-200
6
Dec
-200
6
Feb
-200
7
Apr
-200
7
Jun-
2007
Aug
-200
7
Oct
-200
7
Dec
-200
7
Feb
-200
8
Apr
-200
8
Jun-
2008
Aug
-200
8
Oct
-200
8
Dec
-200
8
Feb
-200
9
Apr
-200
9
Jun-
2009
Aug
-200
9
Oct
-200
9
Dec
-200
9
Feb
-201
0
Apr
-201
0
Jun-
2010
Aug
-201
0
Oct
-201
0
Rice CPI(%)
Source: CEIC, Nomura research
Exhibit 58. Vegetable CPI
(15)
% 0
15
30
45
Aug
-200
6
Oct
-200
6
Dec
-200
6
Feb
-200
7
Apr
-200
7
Jun-
2007
Aug
-200
7
Oct
-200
7
Dec
-200
7
Feb
-200
8
Apr
-200
8
Jun-
2008
Aug
-200
8
Oct
-200
8
Dec
-200
8
Feb
-200
9
Apr
-200
9
Jun-
2009
Aug
-200
9
Oct
-200
9
Dec
-200
9
Feb
-201
0
Apr
-201
0
Jun-
2010
Aug
-201
0
Oct
-201
0
Vegetable CPI(%)
Source: CEIC, Nomura research
Exhibit 59. Fresh egg CPI
(10)
% 0
10
20
30
40
Aug
-200
6
Oct
-200
6
Dec
-200
6
Feb
-200
7
Apr
-200
7
Jun-
2007
Aug
-200
7
Oct
-200
7
Dec
-200
7
Feb
-200
8
Apr
-200
8
Jun-
2008
Aug
-200
8
Oct
-200
8
Dec
-200
8
Feb
-200
9
Apr
-200
9
Jun-
2009
Aug
-200
9
Oct
-200
9
Dec
-200
9
Feb
-201
0
Apr
-201
0
Jun-
2010
Aug
-201
0
Oct
-201
0
Fresh egg CPI
(%)
Source: CEIC, Nomura research
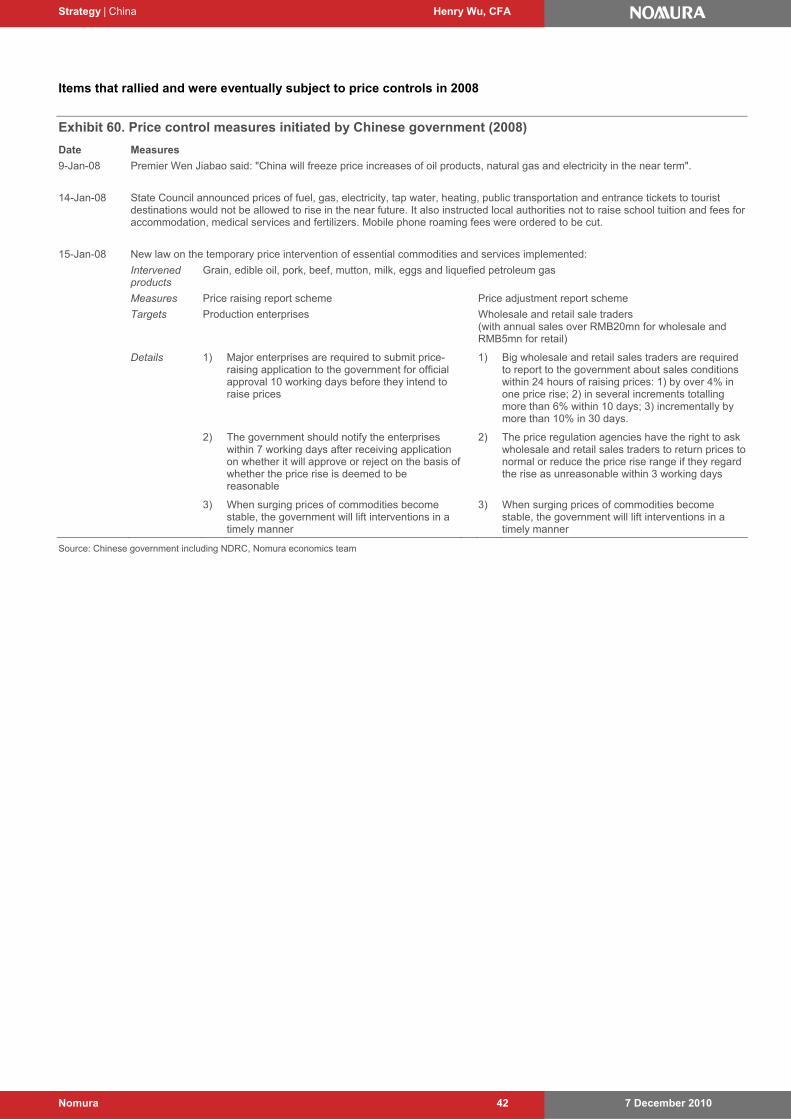
Strategy | China Henry Wu, CFA
7 December 2010 Nomura 42
Items that rallied and were eventually subject to price controls in 2008
Exhibit 60. Price control measures initiated by Chinese government (2008)
Date Measures
9-Jan-08 Premier Wen Jiabao said: "China will freeze price increases of oil products, natural gas and electricity in the near term".
14-Jan-08 State Council announced prices of fuel, gas, electricity, tap water, heating, public transportation and entrance tickets to tourist destinations would not be allowed to rise in the near future. It also instructed local authorities not to raise school tuition and fees for accommodation, medical services and fertilizers. Mobile phone roaming fees were ordered to be cut.
15-Jan-08 New law on the temporary price intervention of essential commodities and services implemented:
Intervened products
Grain, edible oil, pork, beef, mutton, milk, eggs and liquefied petroleum gas
Measures Price raising report scheme Price adjustment report scheme
Targets Production enterprises Wholesale and retail sale traders (with annual sales over RMB20mn for wholesale and RMB5mn for retail)
Details 1) Major enterprises are required to submit price-raising application to the government for official approval 10 working days before they intend to raise prices
1) Big wholesale and retail sales traders are required to report to the government about sales conditions within 24 hours of raising prices: 1) by over 4% in one price rise; 2) in several increments totalling more than 6% within 10 days; 3) incrementally by more than 10% in 30 days.
2) The government should notify the enterprises within 7 working days after receiving application on whether it will approve or reject on the basis of whether the price rise is deemed to be reasonable
2) The price regulation agencies have the right to ask wholesale and retail sales traders to return prices to normal or reduce the price rise range if they regard the rise as unreasonable within 3 working days
3) When surging prices of commodities become stable, the government will lift interventions in a timely manner
3) When surging prices of commodities become stable, the government will lift interventions in a timely manner
Source: Chinese government including NDRC, Nomura economics team
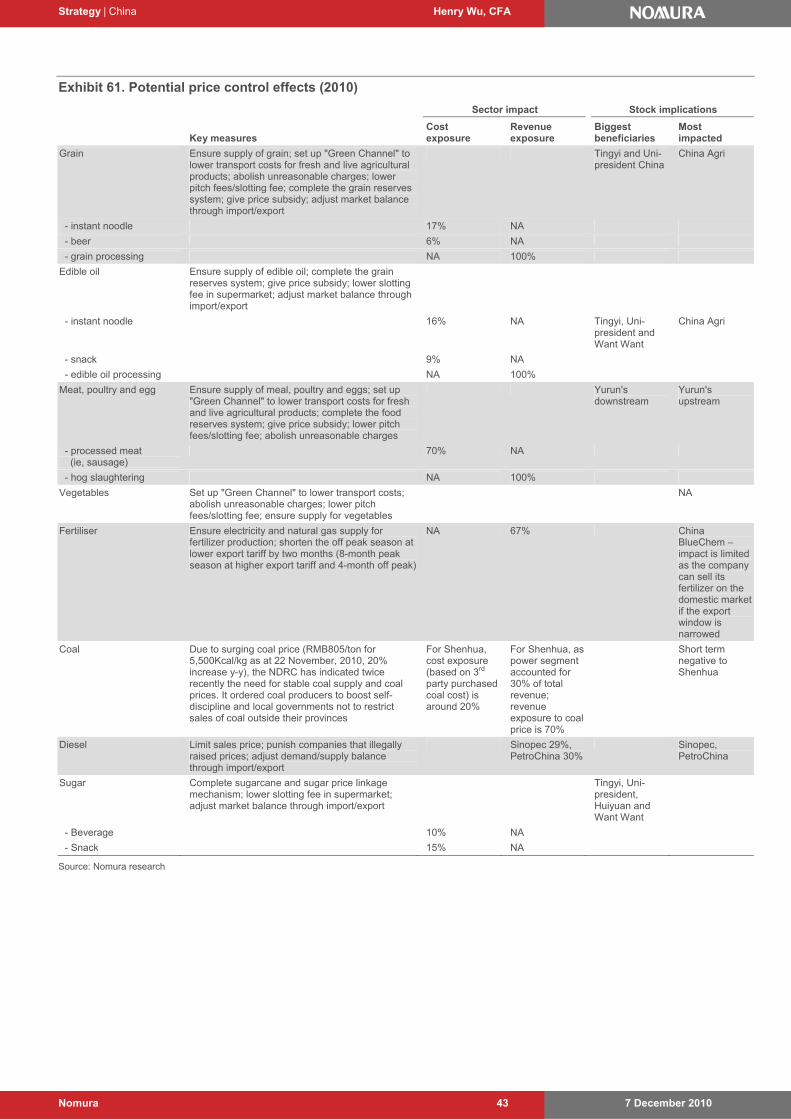
Strategy | China Henry Wu, CFA
7 December 2010 Nomura 43
Exhibit 61. Potential price control effects (2010)
Sector impact Stock implications
Key measures
Cost exposure
Revenue exposure
Biggest beneficiaries
Most impacted
Grain Ensure supply of grain; set up "Green Channel" to lower transport costs for fresh and live agricultural products; abolish unreasonable charges; lower pitch fees/slotting fee; complete the grain reserves system; give price subsidy; adjust market balance through import/export
Tingyi and Uni-president China
China Agri
- instant noodle 17% NA
- beer 6% NA
- grain processing NA 100%
Edible oil Ensure supply of edible oil; complete the grain reserves system; give price subsidy; lower slotting fee in supermarket; adjust market balance through import/export
- instant noodle 16% NA Tingyi, Uni-president and Want Want
China Agri
- snack 9% NA
- edible oil processing NA 100%
Meat, poultry and egg Ensure supply of meal, poultry and eggs; set up "Green Channel" to lower transport costs for fresh and live agricultural products; complete the food reserves system; give price subsidy; lower pitch fees/slotting fee; abolish unreasonable charges
Yurun's downstream
Yurun's upstream
- processed meat (ie, sausage)
70% NA
- hog slaughtering NA 100%
Vegetables Set up "Green Channel" to lower transport costs; abolish unreasonable charges; lower pitch fees/slotting fee; ensure supply for vegetables
NA
Fertiliser Ensure electricity and natural gas supply for fertilizer production; shorten the off peak season at lower export tariff by two months (8-month peak season at higher export tariff and 4-month off peak)
NA 67% China BlueChem –impact is limited as the company can sell its fertilizer on the domestic market if the export window is narrowed
Coal Due to surging coal price (RMB805/ton for 5,500Kcal/kg as at 22 November, 2010, 20% increase y-y), the NDRC has indicated twice recently the need for stable coal supply and coal prices. It ordered coal producers to boost self-discipline and local governments not to restrict sales of coal outside their provinces
For Shenhua, cost exposure (based on 3rd party purchased coal cost) is around 20%
For Shenhua, as power segment accounted for 30% of total revenue; revenue exposure to coal price is 70%
Short term negative to Shenhua
Diesel Limit sales price; punish companies that illegally raised prices; adjust demand/supply balance through import/export
Sinopec 29%, PetroChina 30%
Sinopec, PetroChina
Sugar Complete sugarcane and sugar price linkage mechanism; lower slotting fee in supermarket; adjust market balance through import/export
Tingyi, Uni-president, Huiyuan and Want Want
- Beverage 10% NA
- Snack 15% NA
Source: Nomura research
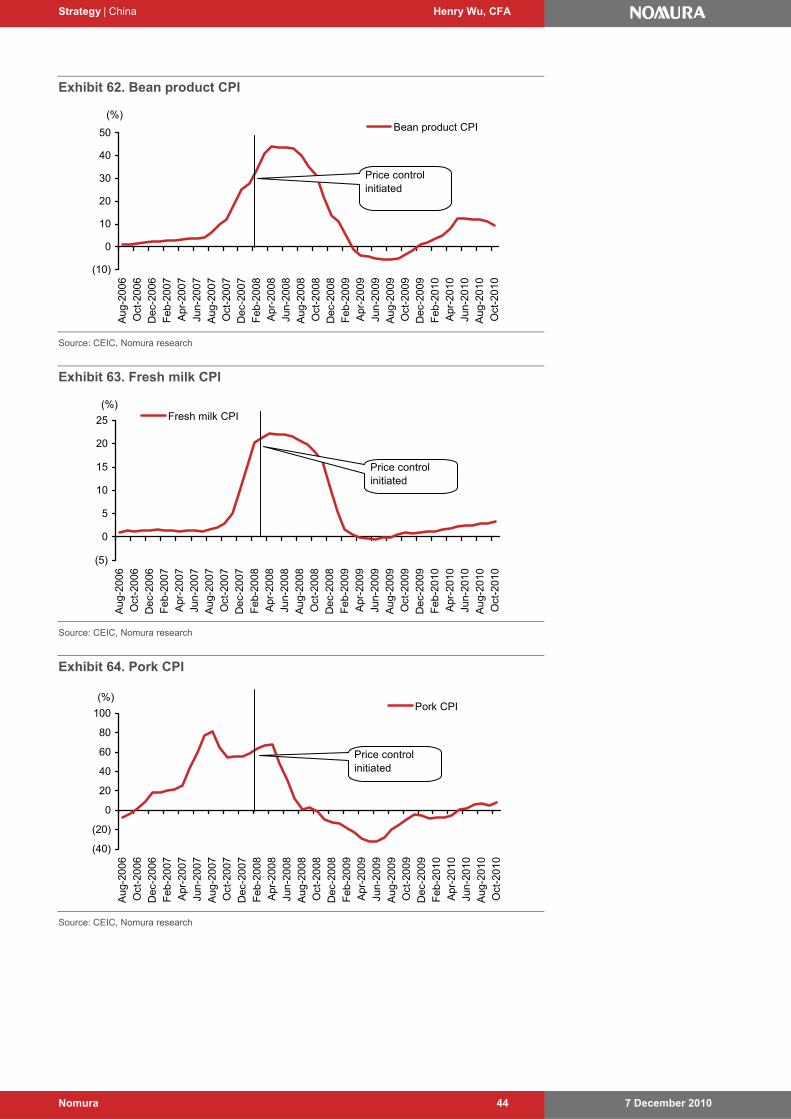
Strategy | China Henry Wu, CFA
7 December 2010 Nomura 44
Exhibit 62. Bean product CPI
(10)
0
10
20
30
40
50A
ug-2
006
Oct
-200
6D
ec-2
006
Feb
-200
7A
pr-2
007
Jun-
2007
Aug
-200
7O
ct-2
007
Dec
-200
7
Feb
-200
8A
pr-2
008
Jun-
2008
Aug
-200
8
Oct
-200
8D
ec-2
008
Feb
-200
9A
pr-2
009
Jun-
2009
Aug
-200
9O
ct-2
009
Dec
-200
9
Feb
-201
0A
pr-2
010
Jun-
2010
Aug
-201
0
Oct
-201
0
Bean product CPI
Price control initiated
(%)
Source: CEIC, Nomura research
Exhibit 63. Fresh milk CPI
(5)
0
5
10
15
20
25
Aug
-200
6
Oct
-200
6
Dec
-200
6
Feb
-200
7
Apr
-200
7
Jun-
2007
Aug
-200
7
Oct
-200
7
Dec
-200
7
Feb
-200
8
Apr
-200
8
Jun-
2008
Aug
-200
8
Oct
-200
8
Dec
-200
8
Feb
-200
9
Apr
-200
9
Jun-
2009
Aug
-200
9
Oct
-200
9
Dec
-200
9
Feb
-201
0
Apr
-201
0
Jun-
2010
Aug
-201
0
Oct
-201
0
Fresh milk CPI
Price control initiated
(%)
Source: CEIC, Nomura research
Exhibit 64. Pork CPI
(40)
(20)
0
20
40
60
80
100
Aug
-200
6
Oct
-200
6
Dec
-200
6
Feb
-200
7
Apr
-200
7
Jun-
2007
Aug
-200
7O
ct-2
007
Dec
-200
7
Feb
-200
8A
pr-2
008
Jun-
2008
Aug
-200
8O
ct-2
008
Dec
-200
8
Feb
-200
9A
pr-2
009
Jun-
2009
Aug
-200
9O
ct-2
009
Dec
-200
9
Feb
-201
0
Apr
-201
0Ju
n-20
10
Aug
-201
0
Oct
-201
0
Pork CPI
Price control initiated
(%)
Source: CEIC, Nomura research
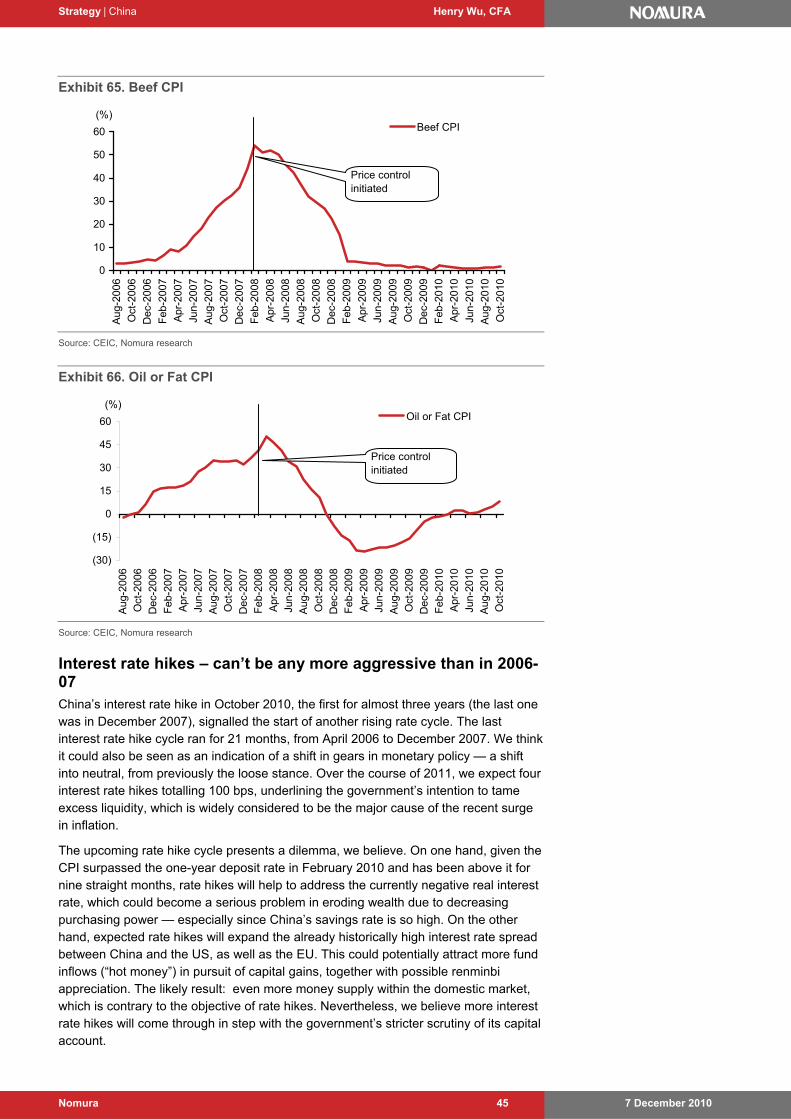
Strategy | China Henry Wu, CFA
7 December 2010 Nomura 45
Exhibit 65. Beef CPI
0
10
20
30
40
50
60
Aug
-200
6
Oct
-200
6
Dec
-200
6
Feb
-200
7
Apr
-200
7
Jun-
2007
Aug
-200
7
Oct
-200
7
Dec
-200
7
Feb
-200
8
Apr
-200
8
Jun-
2008
Aug
-200
8
Oct
-200
8
Dec
-200
8
Feb
-200
9
Apr
-200
9
Jun-
2009
Aug
-200
9
Oct
-200
9
Dec
-200
9
Feb
-201
0
Apr
-201
0
Jun-
2010
Aug
-201
0
Oct
-201
0
Beef CPI
Price control initiated
(%)
Source: CEIC, Nomura research
Exhibit 66. Oil or Fat CPI
(30)
(15)
0
15
30
45
60
Aug
-200
6
Oct
-200
6
Dec
-200
6
Feb
-200
7
Apr
-200
7
Jun-
2007
Aug
-200
7
Oct
-200
7
Dec
-200
7
Feb
-200
8
Apr
-200
8
Jun-
2008
Aug
-200
8
Oct
-200
8
Dec
-200
8
Feb
-200
9
Apr
-200
9
Jun-
2009
Aug
-200
9
Oct
-200
9
Dec
-200
9
Feb
-201
0
Apr
-201
0
Jun-
2010
Aug
-201
0
Oct
-201
0
Oil or Fat CPI
Price control initiated
(%)
Source: CEIC, Nomura research
Interest rate hikes – can’t be any more aggressive than in 2006-07 China’s interest rate hike in October 2010, the first for almost three years (the last one was in December 2007), signalled the start of another rising rate cycle. The last interest rate hike cycle ran for 21 months, from April 2006 to December 2007. We think it could also be seen as an indication of a shift in gears in monetary policy — a shift into neutral, from previously the loose stance. Over the course of 2011, we expect four interest rate hikes totalling 100 bps, underlining the government’s intention to tame excess liquidity, which is widely considered to be the major cause of the recent surge in inflation.
The upcoming rate hike cycle presents a dilemma, we believe. On one hand, given the CPI surpassed the one-year deposit rate in February 2010 and has been above it for nine straight months, rate hikes will help to address the currently negative real interest rate, which could become a serious problem in eroding wealth due to decreasing purchasing power — especially since China’s savings rate is so high. On the other hand, expected rate hikes will expand the already historically high interest rate spread between China and the US, as well as the EU. This could potentially attract more fund inflows (“hot money”) in pursuit of capital gains, together with possible renminbi appreciation. The likely result: even more money supply within the domestic market, which is contrary to the objective of rate hikes. Nevertheless, we believe more interest rate hikes will come through in step with the government’s stricter scrutiny of its capital account.
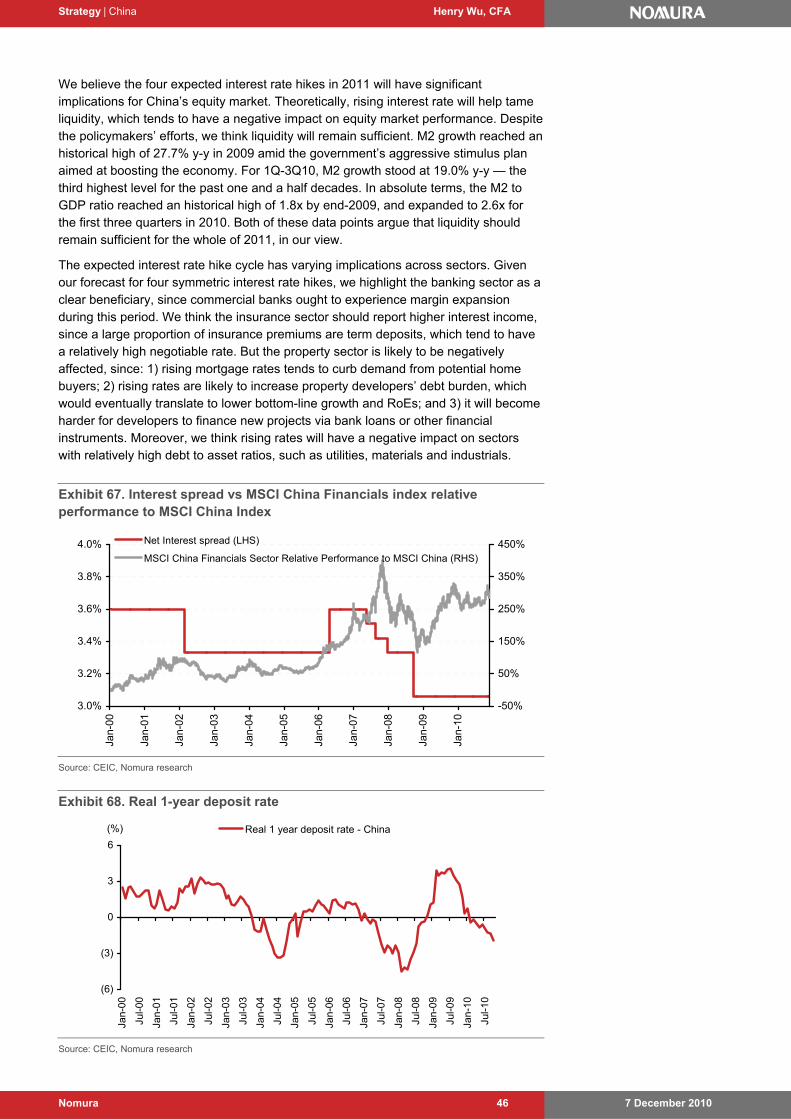
Strategy | China Henry Wu, CFA
7 December 2010 Nomura 46
We believe the four expected interest rate hikes in 2011 will have significant implications for China’s equity market. Theoretically, rising interest rate will help tame liquidity, which tends to have a negative impact on equity market performance. Despite the policymakers’ efforts, we think liquidity will remain sufficient. M2 growth reached an historical high of 27.7% y-y in 2009 amid the government’s aggressive stimulus plan aimed at boosting the economy. For 1Q-3Q10, M2 growth stood at 19.0% y-y — the third highest level for the past one and a half decades. In absolute terms, the M2 to GDP ratio reached an historical high of 1.8x by end-2009, and expanded to 2.6x for the first three quarters in 2010. Both of these data points argue that liquidity should remain sufficient for the whole of 2011, in our view.
The expected interest rate hike cycle has varying implications across sectors. Given our forecast for four symmetric interest rate hikes, we highlight the banking sector as a clear beneficiary, since commercial banks ought to experience margin expansion during this period. We think the insurance sector should report higher interest income, since a large proportion of insurance premiums are term deposits, which tend to have a relatively high negotiable rate. But the property sector is likely to be negatively affected, since: 1) rising mortgage rates tends to curb demand from potential home buyers; 2) rising rates are likely to increase property developers’ debt burden, which would eventually translate to lower bottom-line growth and RoEs; and 3) it will become harder for developers to finance new projects via bank loans or other financial instruments. Moreover, we think rising rates will have a negative impact on sectors with relatively high debt to asset ratios, such as utilities, materials and industrials.
Exhibit 67. Interest spread vs MSCI China Financials index relative performance to MSCI China Index
3.0%
3.2%
3.4%
3.6%
3.8%
4.0%
Jan-
00
Jan-
01
Jan-
02
Jan-
03
Jan-
04
Jan-
05
Jan-
06
Jan-
07
Jan-
08
Jan-
09
Jan-
10
-50%
50%
150%
250%
350%
450%Net Interest spread (LHS)
MSCI China Financials Sector Relative Performance to MSCI China (RHS)
Source: CEIC, Nomura research
Exhibit 68. Real 1-year deposit rate
(6)
(3)
0
3
6
Jan-
00
Jul-0
0
Jan-
01
Jul-0
1
Jan-
02
Jul-0
2
Jan-
03
Jul-0
3
Jan-
04
Jul-0
4
Jan-
05
Jul-0
5
Jan-
06
Jul-0
6
Jan-
07
Jul-0
7
Jan-
08
Jul-0
8
Jan-
09
Jul-0
9
Jan-
10
Jul-1
0
Real 1 year deposit rate - China(%)
Source: CEIC, Nomura research
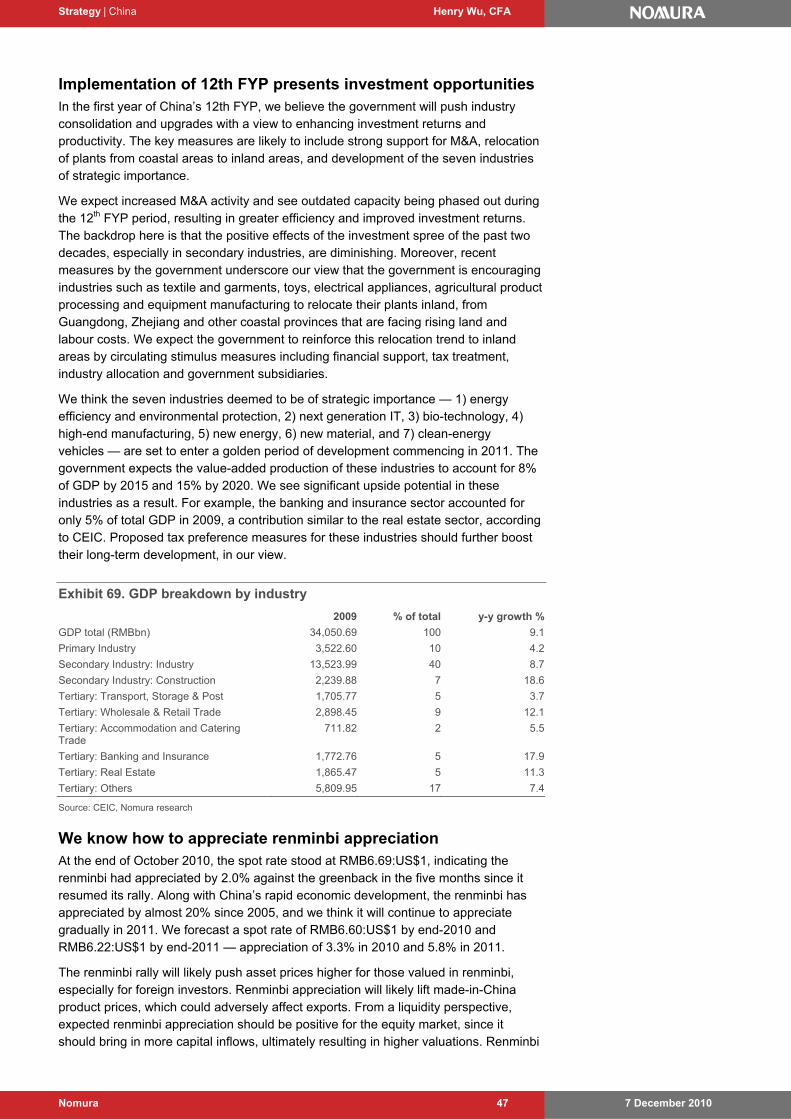
Strategy | China Henry Wu, CFA
7 December 2010 Nomura 47
Implementation of 12th FYP presents investment opportunities In the first year of China’s 12th FYP, we believe the government will push industry consolidation and upgrades with a view to enhancing investment returns and productivity. The key measures are likely to include strong support for M&A, relocation of plants from coastal areas to inland areas, and development of the seven industries of strategic importance.
We expect increased M&A activity and see outdated capacity being phased out during the 12th FYP period, resulting in greater efficiency and improved investment returns. The backdrop here is that the positive effects of the investment spree of the past two decades, especially in secondary industries, are diminishing. Moreover, recent measures by the government underscore our view that the government is encouraging industries such as textile and garments, toys, electrical appliances, agricultural product processing and equipment manufacturing to relocate their plants inland, from Guangdong, Zhejiang and other coastal provinces that are facing rising land and labour costs. We expect the government to reinforce this relocation trend to inland areas by circulating stimulus measures including financial support, tax treatment, industry allocation and government subsidiaries.
We think the seven industries deemed to be of strategic importance — 1) energy efficiency and environmental protection, 2) next generation IT, 3) bio-technology, 4) high-end manufacturing, 5) new energy, 6) new material, and 7) clean-energy vehicles — are set to enter a golden period of development commencing in 2011. The government expects the value-added production of these industries to account for 8% of GDP by 2015 and 15% by 2020. We see significant upside potential in these industries as a result. For example, the banking and insurance sector accounted for only 5% of total GDP in 2009, a contribution similar to the real estate sector, according to CEIC. Proposed tax preference measures for these industries should further boost their long-term development, in our view.
Exhibit 69. GDP breakdown by industry
2009 % of total y-y growth %
GDP total (RMBbn) 34,050.69 100 9.1
Primary Industry 3,522.60 10 4.2
Secondary Industry: Industry 13,523.99 40 8.7
Secondary Industry: Construction 2,239.88 7 18.6
Tertiary: Transport, Storage & Post 1,705.77 5 3.7
Tertiary: Wholesale & Retail Trade 2,898.45 9 12.1
Tertiary: Accommodation and Catering Trade
711.82 2 5.5
Tertiary: Banking and Insurance 1,772.76 5 17.9
Tertiary: Real Estate 1,865.47 5 11.3
Tertiary: Others 5,809.95 17 7.4
Source: CEIC, Nomura research
We know how to appreciate renminbi appreciation At the end of October 2010, the spot rate stood at RMB6.69:US$1, indicating the renminbi had appreciated by 2.0% against the greenback in the five months since it resumed its rally. Along with China’s rapid economic development, the renminbi has appreciated by almost 20% since 2005, and we think it will continue to appreciate gradually in 2011. We forecast a spot rate of RMB6.60:US$1 by end-2010 and RMB6.22:US$1 by end-2011 — appreciation of 3.3% in 2010 and 5.8% in 2011.
The renminbi rally will likely push asset prices higher for those valued in renminbi, especially for foreign investors. Renminbi appreciation will likely lift made-in-China product prices, which could adversely affect exports. From a liquidity perspective, expected renminbi appreciation should be positive for the equity market, since it should bring in more capital inflows, ultimately resulting in higher valuations. Renminbi
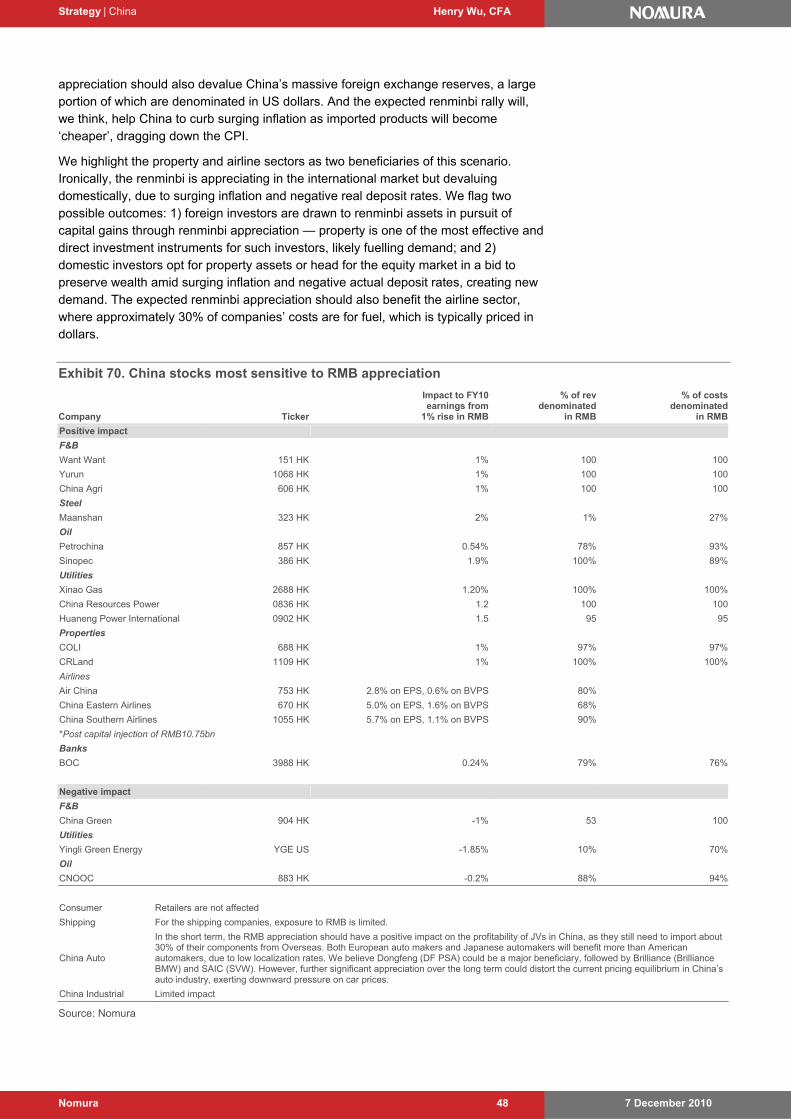
Strategy | China Henry Wu, CFA
7 December 2010 Nomura 48
appreciation should also devalue China’s massive foreign exchange reserves, a large portion of which are denominated in US dollars. And the expected renminbi rally will, we think, help China to curb surging inflation as imported products will become ‘cheaper’, dragging down the CPI.
We highlight the property and airline sectors as two beneficiaries of this scenario. Ironically, the renminbi is appreciating in the international market but devaluing domestically, due to surging inflation and negative real deposit rates. We flag two possible outcomes: 1) foreign investors are drawn to renminbi assets in pursuit of capital gains through renminbi appreciation — property is one of the most effective and direct investment instruments for such investors, likely fuelling demand; and 2) domestic investors opt for property assets or head for the equity market in a bid to preserve wealth amid surging inflation and negative actual deposit rates, creating new demand. The expected renminbi appreciation should also benefit the airline sector, where approximately 30% of companies’ costs are for fuel, which is typically priced in dollars.
Exhibit 70. China stocks most sensitive to RMB appreciation
Company Ticker
Impact to FY10 earnings from
1% rise in RMB
% of rev denominated
in RMB
% of costsdenominated
in RMB
Positive impact
F&B
Want Want 151 HK 1% 100 100
Yurun 1068 HK 1% 100 100
China Agri 606 HK 1% 100 100
Steel
Maanshan 323 HK 2% 1% 27%
Oil
Petrochina 857 HK 0.54% 78% 93%
Sinopec 386 HK 1.9% 100% 89%
Utilities
Xinao Gas 2688 HK 1.20% 100% 100%
China Resources Power 0836 HK 1.2 100 100
Huaneng Power International 0902 HK 1.5 95 95
Properties
COLI 688 HK 1% 97% 97%
CRLand 1109 HK 1% 100% 100%
Airlines
Air China 753 HK 2.8% on EPS, 0.6% on BVPS 80%
China Eastern Airlines 670 HK 5.0% on EPS, 1.6% on BVPS 68%
China Southern Airlines 1055 HK 5.7% on EPS, 1.1% on BVPS 90%
*Post capital injection of RMB10.75bn
Banks
BOC 3988 HK 0.24% 79% 76%
Negative impact
F&B
China Green 904 HK -1% 53 100
Utilities
Yingli Green Energy YGE US -1.85% 10% 70%
Oil
CNOOC 883 HK -0.2% 88% 94%
Consumer Retailers are not affected
Shipping For the shipping companies, exposure to RMB is limited.
China Auto
In the short term, the RMB appreciation should have a positive impact on the profitability of JVs in China, as they still need to import about 30% of their components from Overseas. Both European auto makers and Japanese automakers will benefit more than American automakers, due to low localization rates. We believe Dongfeng (DF PSA) could be a major beneficiary, followed by Brilliance (Brilliance BMW) and SAIC (SVW). However, further significant appreciation over the long term could distort the current pricing equilibrium in China’s auto industry, exerting downward pressure on car prices.
China Industrial Limited impact
Source: Nomura
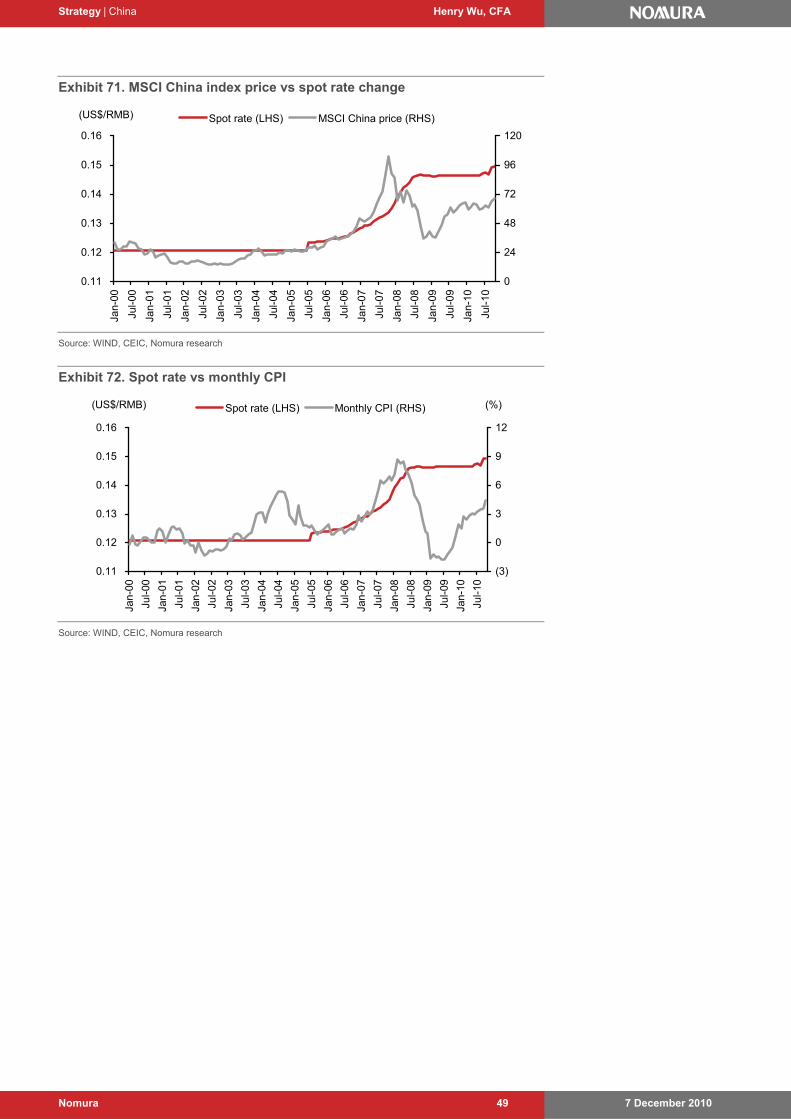
Strategy | China Henry Wu, CFA
7 December 2010 Nomura 49
Exhibit 71. MSCI China index price vs spot rate change
0.11
0.12
0.13
0.14
0.15
0.16
Jan-
00
Jul-0
0
Jan-
01
Jul-0
1
Jan-
02
Jul-0
2
Jan-
03
Jul-0
3
Jan-
04
Jul-0
4
Jan-
05
Jul-0
5
Jan-
06
Jul-0
6
Jan-
07
Jul-0
7
Jan-
08
Jul-0
8
Jan-
09
Jul-0
9
Jan-
10
Jul-1
0
0
24
48
72
96
120
Spot rate (LHS) MSCI China price (RHS)(US$/RMB)
Source: WIND, CEIC, Nomura research
Exhibit 72. Spot rate vs monthly CPI
0.11
0.12
0.13
0.14
0.15
0.16
Jan-
00
Jul-0
0
Jan-
01
Jul-0
1
Jan-
02
Jul-0
2
Jan-
03
Jul-0
3
Jan-
04
Jul-0
4
Jan-
05
Jul-0
5
Jan-
06
Jul-0
6
Jan-
07
Jul-0
7
Jan-
08
Jul-0
8
Jan-
09
Jul-0
9
Jan-
10
Jul-1
0
(3)
0
3
6
9
12
Spot rate (LHS) Monthly CPI (RHS)(US$/RMB) (%)
Source: WIND, CEIC, Nomura research

Strategy | China Henry Wu, CFA
7 December 2010 Nomura 50
Effects of QE
Commodity price hikes: thank you, QE! Domestic commodity prices are closely correlated to international prices, which continue to surge amid aggressive loosening of monetary policy by the majority of developed markets, including the US, Japan and the EU. Rising global commodity prices will likely expose China’s economy to pressure from imported inflation, which would likely be negative for the overall equity market. On the other hand, we think it could benefit some corporates, such as oil and agri-products producers. Take the first round of US quantitative easing measures as an example. Crude oil and coal prices surged 69% and 51%, respectively, amid the first round of QE amounting to US$1.7trn. The second round of QE, totalling US$0.6trn, has already pushed most international commodities prices higher, and we believe prices will be further boosted as the effects of excess liquidity manifest themselves.
Exhibit 73. US QE effects
FED Quantitative Easing Project Prior period 1st round 2nd round *
Period Jan-08~Mar-09 Mar-09~Mar-10 Aug-10~Jun 11
Fund Injection n.a. US$1.7tn US$0.6tn
International commodity (%)
Crude Oil (OPEC) (49) 69 11
Coal (Aus BJ) (30) 51 15
CBOT Wheat (Future Price) (46) (8) (11)
CBOT Corn (Future Price) (17) (8) 29
Domestic commodity (%)
Crude Oil and Products (22) 39 5
Raw Coal (1) 23 (1)
Corn (Dalian Future Market Price) 3 16 5
Wheat (Zhengzhou Future Market Price) 5 18 5
Stock market index (%)
MSCI China Index (38) 55 10
Dow Jones Index (40) 43 10
* Commodity price change under 2nd round QE as of 30 November, 2010.
Source: WIND, CEIC, Bloomberg, Nomura research
Future global commodity price rises, heightening imported inflation risk for China
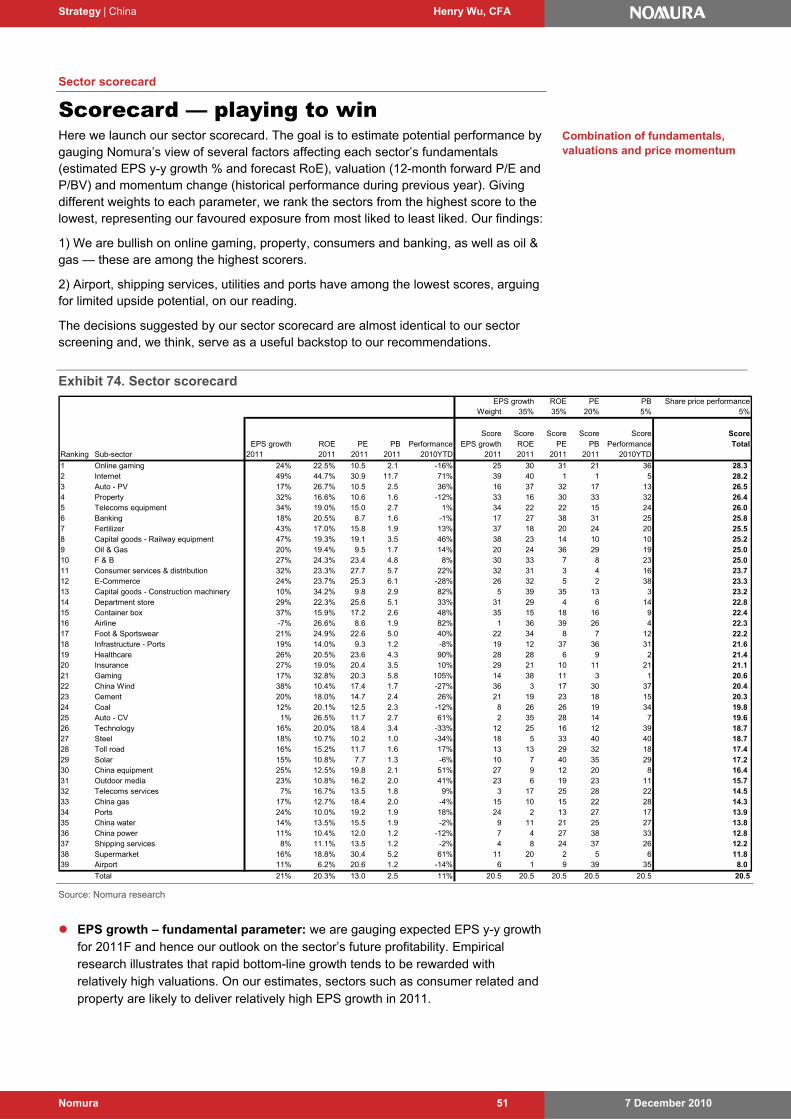
Strategy | China Henry Wu, CFA
7 December 2010 Nomura 51
Sector scorecard
Scorecard — playing to win Here we launch our sector scorecard. The goal is to estimate potential performance by gauging Nomura’s view of several factors affecting each sector’s fundamentals (estimated EPS y-y growth % and forecast RoE), valuation (12-month forward P/E and P/BV) and momentum change (historical performance during previous year). Giving different weights to each parameter, we rank the sectors from the highest score to the lowest, representing our favoured exposure from most liked to least liked. Our findings:
1) We are bullish on online gaming, property, consumers and banking, as well as oil & gas — these are among the highest scorers.
2) Airport, shipping services, utilities and ports have among the lowest scores, arguing for limited upside potential, on our reading.
The decisions suggested by our sector scorecard are almost identical to our sector screening and, we think, serve as a useful backstop to our recommendations.
Exhibit 74. Sector scorecard EPS growth ROE PE PB Share price performance
Weight 35% 35% 20% 5% 5%
Score Score Score Score Score ScoreEPS growth ROE PE PB Performance EPS growth ROE PE PB Performance Total
Ranking Sub-sector 2011 2011 2011 2011 2010YTD 2011 2011 2011 2011 2010YTD
1 Online gaming 24% 22.5% 10.5 2.1 -16% 25 30 31 21 36 28.3 2 Internet 49% 44.7% 30.9 11.7 71% 39 40 1 1 5 28.2 3 Auto - PV 17% 26.7% 10.5 2.5 36% 16 37 32 17 13 26.5 4 Property 32% 16.6% 10.6 1.6 -12% 33 16 30 33 32 26.4 5 Telecoms equipment 34% 19.0% 15.0 2.7 1% 34 22 22 15 24 26.0 6 Banking 18% 20.5% 8.7 1.6 -1% 17 27 38 31 25 25.8 7 Fertilizer 43% 17.0% 15.8 1.9 13% 37 18 20 24 20 25.5 8 Capital goods - Railway equipment 47% 19.3% 19.1 3.5 46% 38 23 14 10 10 25.2 9 Oil & Gas 20% 19.4% 9.5 1.7 14% 20 24 36 29 19 25.0 10 F & B 27% 24.3% 23.4 4.8 8% 30 33 7 8 23 25.0 11 Consumer services & distribution 32% 23.3% 27.7 5.7 22% 32 31 3 4 16 23.7 12 E-Commerce 24% 23.7% 25.3 6.1 -28% 26 32 5 2 38 23.3 13 Capital goods - Construction machinery 10% 34.2% 9.8 2.9 82% 5 39 35 13 3 23.2 14 Department store 29% 22.3% 25.6 5.1 33% 31 29 4 6 14 22.8 15 Container box 37% 15.9% 17.2 2.6 48% 35 15 18 16 9 22.4 16 Airline -7% 26.6% 8.6 1.9 82% 1 36 39 26 4 22.3 17 Foot & Sportswear 21% 24.9% 22.6 5.0 40% 22 34 8 7 12 22.2 18 Infrastructure - Ports 19% 14.0% 9.3 1.2 -8% 19 12 37 36 31 21.6 19 Healthcare 26% 20.5% 23.6 4.3 90% 28 28 6 9 2 21.4 20 Insurance 27% 19.0% 20.4 3.5 10% 29 21 10 11 21 21.1 21 Gaming 17% 32.8% 20.3 5.8 105% 14 38 11 3 1 20.6 22 China Wind 38% 10.4% 17.4 1.7 -27% 36 3 17 30 37 20.4 23 Cement 20% 18.0% 14.7 2.4 26% 21 19 23 18 15 20.3 24 Coal 12% 20.1% 12.5 2.3 -12% 8 26 26 19 34 19.8 25 Auto - CV 1% 26.5% 11.7 2.7 61% 2 35 28 14 7 19.6 26 Technology 16% 20.0% 18.4 3.4 -33% 12 25 16 12 39 18.7 27 Steel 18% 10.7% 10.2 1.0 -34% 18 5 33 40 40 18.7 28 Toll road 16% 15.2% 11.7 1.6 17% 13 13 29 32 18 17.4 29 Solar 15% 10.8% 7.7 1.3 -6% 10 7 40 35 29 17.2 30 China equipment 25% 12.5% 19.8 2.1 51% 27 9 12 20 8 16.4 31 Outdoor media 23% 10.8% 16.2 2.0 41% 23 6 19 23 11 15.7 32 Telecoms services 7% 16.7% 13.5 1.8 9% 3 17 25 28 22 14.5 33 China gas 17% 12.7% 18.4 2.0 -4% 15 10 15 22 28 14.3 34 Ports 24% 10.0% 19.2 1.9 18% 24 2 13 27 17 13.9 35 China water 14% 13.5% 15.5 1.9 -2% 9 11 21 25 27 13.8 36 China power 11% 10.4% 12.0 1.2 -12% 7 4 27 38 33 12.8 37 Shipping services 8% 11.1% 13.5 1.2 -2% 4 8 24 37 26 12.2 38 Supermarket 16% 18.8% 30.4 5.2 61% 11 20 2 5 6 11.8 39 Airport 11% 6.2% 20.6 1.2 -14% 6 1 9 39 35 8.0
Total 21% 20.3% 13.0 2.5 11% 20.5 20.5 20.5 20.5 20.5 20.5
Source: Nomura research
EPS growth – fundamental parameter: we are gauging expected EPS y-y growth for 2011F and hence our outlook on the sector’s future profitability. Empirical research illustrates that rapid bottom-line growth tends to be rewarded with relatively high valuations. On our estimates, sectors such as consumer related and property are likely to deliver relatively high EPS growth in 2011.
Combination of fundamentals, valuations and price momentum
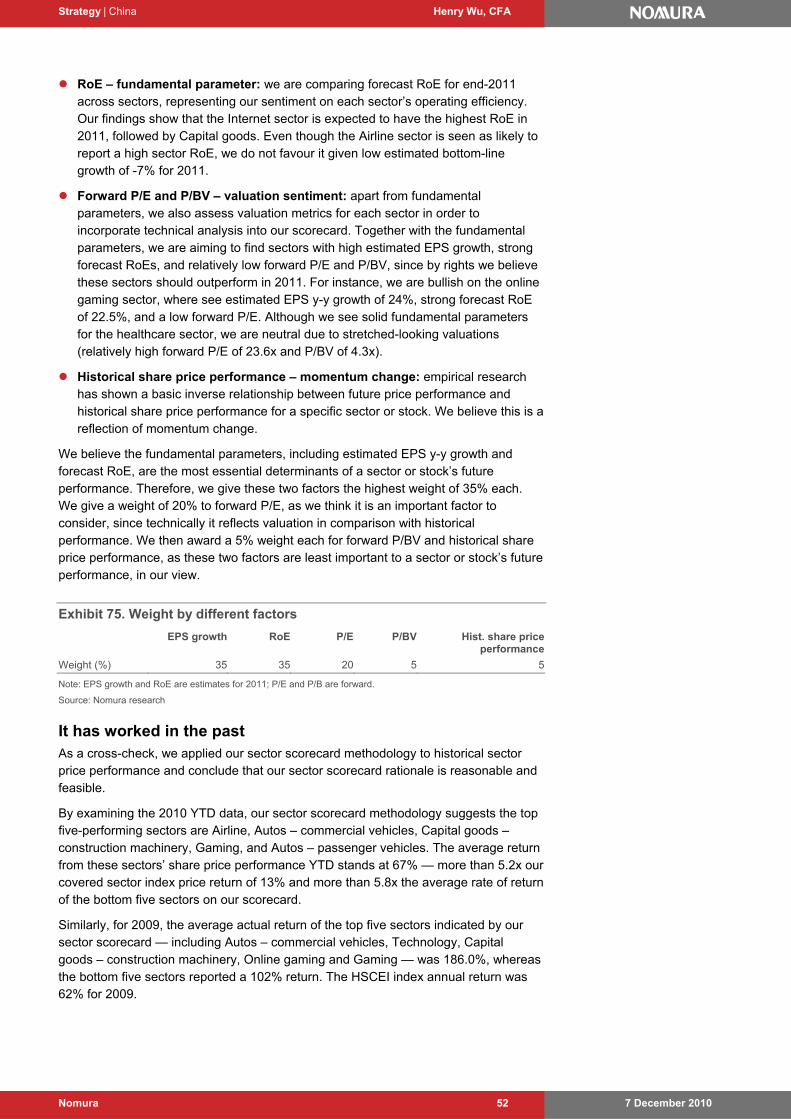
Strategy | China Henry Wu, CFA
7 December 2010 Nomura 52
RoE – fundamental parameter: we are comparing forecast RoE for end-2011 across sectors, representing our sentiment on each sector’s operating efficiency. Our findings show that the Internet sector is expected to have the highest RoE in 2011, followed by Capital goods. Even though the Airline sector is seen as likely to report a high sector RoE, we do not favour it given low estimated bottom-line growth of -7% for 2011.
Forward P/E and P/BV – valuation sentiment: apart from fundamental parameters, we also assess valuation metrics for each sector in order to incorporate technical analysis into our scorecard. Together with the fundamental parameters, we are aiming to find sectors with high estimated EPS growth, strong forecast RoEs, and relatively low forward P/E and P/BV, since by rights we believe these sectors should outperform in 2011. For instance, we are bullish on the online gaming sector, where see estimated EPS y-y growth of 24%, strong forecast RoE of 22.5%, and a low forward P/E. Although we see solid fundamental parameters for the healthcare sector, we are neutral due to stretched-looking valuations (relatively high forward P/E of 23.6x and P/BV of 4.3x).
Historical share price performance – momentum change: empirical research has shown a basic inverse relationship between future price performance and historical share price performance for a specific sector or stock. We believe this is a reflection of momentum change.
We believe the fundamental parameters, including estimated EPS y-y growth and forecast RoE, are the most essential determinants of a sector or stock’s future performance. Therefore, we give these two factors the highest weight of 35% each. We give a weight of 20% to forward P/E, as we think it is an important factor to consider, since technically it reflects valuation in comparison with historical performance. We then award a 5% weight each for forward P/BV and historical share price performance, as these two factors are least important to a sector or stock’s future performance, in our view.
Exhibit 75. Weight by different factors
EPS growth RoE P/E P/BV Hist. share price performance
Weight (%) 35 35 20 5 5
Note: EPS growth and RoE are estimates for 2011; P/E and P/B are forward.
Source: Nomura research
It has worked in the past As a cross-check, we applied our sector scorecard methodology to historical sector price performance and conclude that our sector scorecard rationale is reasonable and feasible.
By examining the 2010 YTD data, our sector scorecard methodology suggests the top five-performing sectors are Airline, Autos – commercial vehicles, Capital goods – construction machinery, Gaming, and Autos – passenger vehicles. The average return from these sectors’ share price performance YTD stands at 67% — more than 5.2x our covered sector index price return of 13% and more than 5.8x the average rate of return of the bottom five sectors on our scorecard.
Similarly, for 2009, the average actual return of the top five sectors indicated by our sector scorecard — including Autos – commercial vehicles, Technology, Capital goods – construction machinery, Online gaming and Gaming — was 186.0%, whereas the bottom five sectors reported a 102% return. The HSCEI index annual return was 62% for 2009.
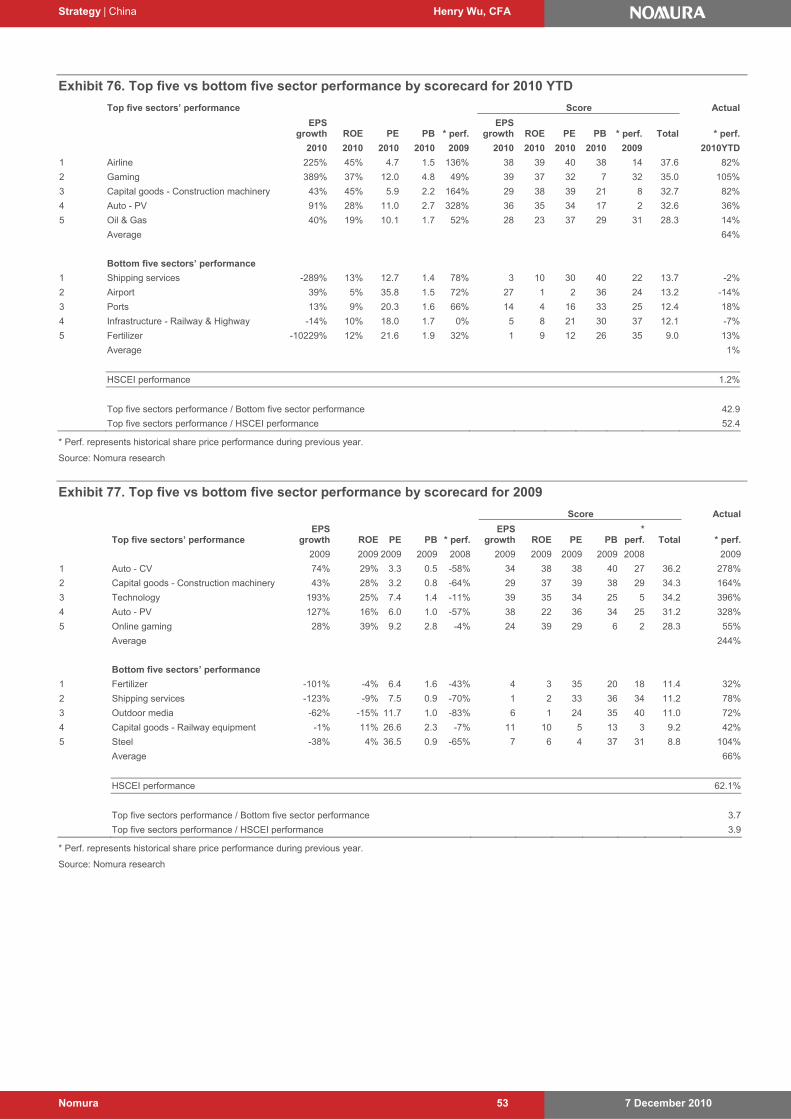
Strategy | China Henry Wu, CFA
7 December 2010 Nomura 53
Exhibit 76. Top five vs bottom five sector performance by scorecard for 2010 YTD
Top five sectors’ performance Score Actual
EPS growth ROE PE PB * perf.
EPS growth ROE PE PB * perf. Total * perf.
2010 2010 2010 2010 2009 2010 2010 2010 2010 2009 2010YTD
1 Airline 225% 45% 4.7 1.5 136% 38 39 40 38 14 37.6 82%
2 Gaming 389% 37% 12.0 4.8 49% 39 37 32 7 32 35.0 105%
3 Capital goods - Construction machinery 43% 45% 5.9 2.2 164% 29 38 39 21 8 32.7 82%
4 Auto - PV 91% 28% 11.0 2.7 328% 36 35 34 17 2 32.6 36%
5 Oil & Gas 40% 19% 10.1 1.7 52% 28 23 37 29 31 28.3 14%
Average 64%
Bottom five sectors’ performance
1 Shipping services -289% 13% 12.7 1.4 78% 3 10 30 40 22 13.7 -2%
2 Airport 39% 5% 35.8 1.5 72% 27 1 2 36 24 13.2 -14%
3 Ports 13% 9% 20.3 1.6 66% 14 4 16 33 25 12.4 18%
4 Infrastructure - Railway & Highway -14% 10% 18.0 1.7 0% 5 8 21 30 37 12.1 -7%
5 Fertilizer -10229% 12% 21.6 1.9 32% 1 9 12 26 35 9.0 13%
Average 1%
HSCEI performance 1.2%
Top five sectors performance / Bottom five sector performance 42.9
Top five sectors performance / HSCEI performance 52.4
* Perf. represents historical share price performance during previous year.
Source: Nomura research
Exhibit 77. Top five vs bottom five sector performance by scorecard for 2009
Score Actual
Top five sectors’ performance
EPS growth ROE PE PB * perf.
EPS growth ROE PE PB
* perf. Total * perf.
2009 2009 2009 2009 2008 2009 2009 2009 2009 2008 2009
1 Auto - CV 74% 29% 3.3 0.5 -58% 34 38 38 40 27 36.2 278%
2 Capital goods - Construction machinery 43% 28% 3.2 0.8 -64% 29 37 39 38 29 34.3 164%
3 Technology 193% 25% 7.4 1.4 -11% 39 35 34 25 5 34.2 396%
4 Auto - PV 127% 16% 6.0 1.0 -57% 38 22 36 34 25 31.2 328%
5 Online gaming 28% 39% 9.2 2.8 -4% 24 39 29 6 2 28.3 55%
Average 244%
Bottom five sectors’ performance
1 Fertilizer -101% -4% 6.4 1.6 -43% 4 3 35 20 18 11.4 32%
2 Shipping services -123% -9% 7.5 0.9 -70% 1 2 33 36 34 11.2 78%
3 Outdoor media -62% -15% 11.7 1.0 -83% 6 1 24 35 40 11.0 72%
4 Capital goods - Railway equipment -1% 11% 26.6 2.3 -7% 11 10 5 13 3 9.2 42%
5 Steel -38% 4% 36.5 0.9 -65% 7 6 4 37 31 8.8 104%
Average 66%
HSCEI performance 62.1%
Top five sectors performance / Bottom five sector performance 3.7
Top five sectors performance / HSCEI performance 3.9
* Perf. represents historical share price performance during previous year.
Source: Nomura research
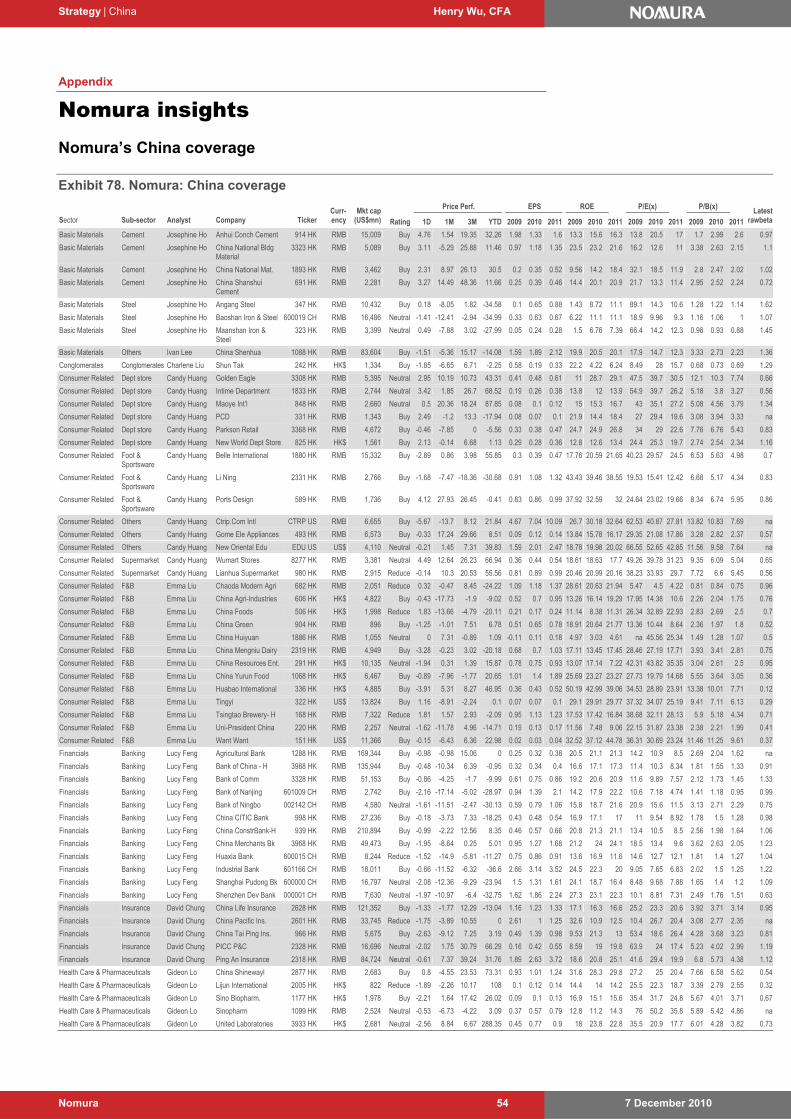
Strategy | China Henry Wu, CFA
7 December 2010 Nomura 54
Appendix
Nomura insights Nomura’s China coverage
Exhibit 78. Nomura: China coverage
Price Perf. EPS ROE P/E(x) P/B(x)
Sector Sub-sector Analyst Company Ticker Curr-ency
Mkt cap (US$mn) Rating 1D 1M 3M YTD 2009 2010 2011 2009 2010 2011 2009 2010 2011 2009 2010 2011
Latest rawbeta
Basic Materials Cement Josephine Ho Anhui Conch Cement 914 HK RMB 15,009 Buy 4.76 1.54 19.35 32.26 1.98 1.33 1.6 13.3 15.6 16.3 13.8 20.5 17 1.7 2.99 2.6 0.97
Basic Materials Cement Josephine Ho China National Bldg Material
3323 HK RMB 5,089 Buy 3.11 -5.29 25.88 11.46 0.97 1.18 1.35 23.5 23.2 21.6
16.2 12.6 11 3.38 2.63 2.15 1.1
Basic Materials Cement Josephine Ho China National Mat. 1893 HK RMB 3,462 Buy 2.31 8.97 26.13 30.5 0.2 0.35 0.52 9.56 14.2 18.4 32.1 18.5 11.9 2.8 2.47 2.02 1.02
Basic Materials Cement Josephine Ho China Shanshui Cement
691 HK RMB 2,281 Buy 3.27 14.49 48.36 11.66 0.25 0.39 0.46 14.4 20.1 20.9
21.7 13.3 11.4 2.95 2.52 2.24 0.72
Basic Materials Steel Josephine Ho Angang Steel 347 HK RMB 10,432 Buy 0.18 -8.05 1.82 -34.58 0.1 0.65 0.88 1.43 8.72 11.1 89.1 14.3 10.6 1.28 1.22 1.14 1.62
Basic Materials Steel Josephine Ho Baoshan Iron & Steel 600019 CH RMB 16,486 Neutral -1.41 -12.41 -2.94 -34.99 0.33 0.63 0.67 6.22 11.1 11.1 18.9 9.96 9.3 1.16 1.06 1 1.07
Basic Materials Steel Josephine Ho Maanshan Iron & Steel
323 HK RMB 3,399 Neutral 0.49 -7.88 3.02 -27.99 0.05 0.24 0.28 1.5 6.76 7.39 66.4 14.2 12.3 0.98 0.93 0.88 1.45
Basic Materials Others Ivan Lee China Shenhua 1088 HK RMB 83,604 Buy -1.51 -5.36 15.17 -14.08 1.59 1.89 2.12 19.9 20.5 20.1 17.9 14.7 12.3 3.33 2.73 2.23 1.36
Conglomerates Conglomerates Charlene Liu Shun Tak 242 HK HK$ 1,334 Buy -1.85 -6.65 6.71 -2.25 0.58 0.19 0.33 22.2 4.22 6.24 8.49 28 15.7 0.68 0.73 0.69 1.29
Consumer Related Dept store Candy Huang Golden Eagle 3308 HK RMB 5,395 Neutral 2.95 10.19 10.73 43.31 0.41 0.48 0.61 11 28.7 29.1 47.5 39.7 30.5 12.1 10.3 7.74 0.66
Consumer Related Dept store Candy Huang Intime Department 1833 HK RMB 2,744 Neutral 3.42 1.85 26.7 68.52 0.19 0.26 0.38 13.8 12 13.9 54.9 39.7 26.2 5.18 3.8 3.27 0.56
Consumer Related Dept store Candy Huang Maoye Int’l 848 HK RMB 2,660 Neutral 0.5 20.36 18.24 87.85 0.08 0.1 0.12 15 15.3 16.7 43 35.1 27.2 5.08 4.56 3.79 1.34
Consumer Related Dept store Candy Huang PCD 331 HK RMB 1,343 Buy 2.49 -1.2 13.3 -17.94 0.08 0.07 0.1 21.9 14.4 18.4 27 29.4 19.6 3.08 3.94 3.33 na
Consumer Related Dept store Candy Huang Parkson Retail 3368 HK RMB 4,672 Buy -0.46 -7.85 0 -5.56 0.33 0.38 0.47 24.7 24.9 26.8 34 29 22.6 7.76 6.76 5.43 0.83
Consumer Related Dept store Candy Huang New World Dept Store 825 HK HK$ 1,561 Buy 2.13 -0.14 6.68 1.13 0.29 0.28 0.36 12.8 12.6 13.4 24.4 25.3 19.7 2.74 2.54 2.34 1.16
Consumer Related Foot & Sportsware
Candy Huang Belle International 1880 HK RMB 15,332 Buy -2.89 0.86 3.98 55.85 0.3 0.39 0.47 17.76 20.59 21.65 40.23 29.57 24.5 6.53 5.63 4.98 0.7
Consumer Related Foot & Sportsware
Candy Huang Li Ning 2331 HK RMB 2,766 Buy -1.68 -7.47 -18.36 -30.68 0.91 1.08 1.32 43.43 39.46 38.55 19.53 15.41 12.42 6.68 5.17 4.34 0.83
Consumer Related Foot & Sportsware
Candy Huang Ports Design 589 HK RMB 1,736 Buy 4.12 27.93 26.45 -0.41 0.83 0.86 0.99 37.92 32.59 32 24.64 23.02 19.66 8.34 6.74 5.95 0.86
Consumer Related Others Candy Huang Ctrip.Com Intl CTRP US RMB 6,655 Buy -5.67 -13.7 8.12 21.84 4.67 7.04 10.09 26.7 30.18 32.64 62.53 40.87 27.81 13.82 10.83 7.69 na
Consumer Related Others Candy Huang Gome Ele Appliances 493 HK RMB 6,573 Buy -0.33 17.24 29.66 8.51 0.09 0.12 0.14 13.84 15.78 16.17 29.35 21.08 17.86 3.28 2.82 2.37 0.57
Consumer Related Others Candy Huang New Oriental Edu EDU US US$ 4,110 Neutral -0.21 1.45 7.31 39.83 1.59 2.01 2.47 18.78 19.98 20.02 66.55 52.65 42.85 11.56 9.58 7.64 na
Consumer Related Supermarket Candy Huang Wumart Stores 8277 HK RMB 3,381 Neutral 4.49 12.64 26.23 66.94 0.36 0.44 0.54 18.61 18.63 17.7 49.26 39.78 31.23 9.35 6.09 5.04 0.65
Consumer Related Supermarket Candy Huang Lianhua Supermarket 980 HK RMB 2,915 Reduce -0.14 10.3 20.53 55.56 0.81 0.89 0.99 20.46 20.99 20.16 38.23 33.93 29.7 7.72 6.6 5.45 0.56
Consumer Related F&B Emma Liu Chaoda Modern Agri 682 HK RMB 2,051 Reduce 0.32 -0.47 8.45 -24.22 1.09 1.18 1.37 28.61 20.63 21.94 5.47 4.5 4.22 0.81 0.84 0.75 0.96
Consumer Related F&B Emma Liu China Agri-Industries 606 HK HK$ 4,822 Buy -0.43 -17.73 -1.9 -9.02 0.52 0.7 0.95 13.26 16.14 19.29 17.95 14.38 10.6 2.26 2.04 1.75 0.76
Consumer Related F&B Emma Liu China Foods 506 HK HK$ 1,998 Reduce 1.83 -13.66 -4.79 -20.11 0.21 0.17 0.24 11.14 8.38 11.31 26.34 32.89 22.93 2.83 2.69 2.5 0.7
Consumer Related F&B Emma Liu China Green 904 HK RMB 896 Buy -1.25 -1.01 7.51 6.78 0.51 0.65 0.78 18.91 20.64 21.77 13.36 10.44 8.64 2.36 1.97 1.8 0.52
Consumer Related F&B Emma Liu China Huiyuan 1886 HK RMB 1,055 Neutral 0 7.31 -0.89 1.09 -0.11 0.11 0.18 4.97 3.03 4.61 na 45.56 25.34 1.49 1.28 1.07 0.5
Consumer Related F&B Emma Liu China Mengniu Dairy 2319 HK RMB 4,949 Buy -3.28 -0.23 3.02 -20.18 0.68 0.7 1.03 17.11 13.45 17.45 28.46 27.19 17.71 3.93 3.41 2.81 0.75
Consumer Related F&B Emma Liu China Resources Ent. 291 HK HK$ 10,135 Neutral -1.94 0.31 1.39 15.87 0.78 0.75 0.93 13.07 17.14 7.22 42.31 43.82 35.35 3.04 2.61 2.5 0.95
Consumer Related F&B Emma Liu China Yurun Food 1068 HK HK$ 6,467 Buy -0.89 -7.96 -1.77 20.65 1.01 1.4 1.89 25.69 23.27 23.27 27.73 19.79 14.68 5.55 3.64 3.05 0.36
Consumer Related F&B Emma Liu Huabao International 336 HK HK$ 4,885 Buy -3.91 5.31 8.27 46.95 0.36 0.43 0.52 50.19 42.99 39.06 34.53 28.89 23.91 13.38 10.01 7.71 0.12
Consumer Related F&B Emma Liu Tingyi 322 HK US$ 13,824 Buy 1.16 -8.91 -2.24 0.1 0.07 0.07 0.1 29.1 29.91 29.77 37.32 34.07 25.19 9.41 7.11 6.13 0.29
Consumer Related F&B Emma Liu Tsingtao Brewery- H 168 HK RMB 7,322 Reduce 1.81 1.57 2.93 -2.09 0.95 1.13 1.23 17.53 17.42 16.84 38.68 32.11 28.13 5.9 5.18 4.34 0.71
Consumer Related F&B Emma Liu Uni-President China 220 HK RMB 2,257 Neutral -1.62 -11.78 4.96 -14.71 0.19 0.13 0.17 11.56 7.48 9.06 22.15 31.87 23.38 2.38 2.21 1.99 0.41
Consumer Related F&B Emma Liu Want Want 151 HK US$ 11,366 Buy -0.15 -6.43 6.36 22.98 0.02 0.03 0.04 32.52 37.12 44.78 36.31 30.69 23.24 11.46 11.25 9.61 0.37
Financials Banking Lucy Feng Agricultural Bank 1288 HK RMB 169,344 Buy -0.98 -0.98 15.06 0 0.25 0.32 0.38 20.5 21.1 21.3 14.2 10.9 8.5 2.69 2.04 1.62 na
Financials Banking Lucy Feng Bank of China - H 3988 HK RMB 135,944 Buy -0.48 -10.34 6.39 -0.95 0.32 0.34 0.4 16.6 17.1 17.3 11.4 10.3 8.34 1.81 1.55 1.33 0.91
Financials Banking Lucy Feng Bank of Comm 3328 HK RMB 51,153 Buy -0.86 -4.25 -1.7 -9.99 0.61 0.75 0.86 19.2 20.6 20.9 11.6 9.89 7.57 2.12 1.73 1.45 1.33
Financials Banking Lucy Feng Bank of Nanjing 601009 CH RMB 2,742 Buy -2.16 -17.14 -5.02 -28.97 0.94 1.39 2.1 14.2 17.9 22.2 10.6 7.18 4.74 1.41 1.18 0.95 0.99
Financials Banking Lucy Feng Bank of Ningbo 002142 CH RMB 4,580 Neutral -1.61 -11.51 -2.47 -30.13 0.59 0.79 1.06 15.8 18.7 21.6 20.9 15.6 11.5 3.13 2.71 2.29 0.75
Financials Banking Lucy Feng China CITIC Bank 998 HK RMB 27,236 Buy -0.18 -3.73 7.33 -18.25 0.43 0.48 0.54 16.9 17.1 17 11 9.54 8.92 1.78 1.5 1.28 0.98
Financials Banking Lucy Feng China ConstrBank-H 939 HK RMB 210,894 Buy -0.99 -2.22 12.56 8.35 0.46 0.57 0.66 20.8 21.3 21.1 13.4 10.5 8.5 2.56 1.98 1.64 1.06
Financials Banking Lucy Feng China Merchants Bk 3968 HK RMB 49,473 Buy -1.95 -8.64 0.25 5.01 0.95 1.27 1.68 21.2 24 24.1 18.5 13.4 9.6 3.62 2.63 2.05 1.23
Financials Banking Lucy Feng Huaxia Bank 600015 CH RMB 8,244 Reduce -1.52 -14.9 -5.81 -11.27 0.75 0.86 0.91 13.6 16.9 11.6 14.6 12.7 12.1 1.81 1.4 1.27 1.04
Financials Banking Lucy Feng Industrial Bank 601166 CH RMB 18,011 Buy -0.66 -11.52 -6.32 -36.6 2.66 3.14 3.52 24.5 22.3 20 9.05 7.65 6.83 2.02 1.5 1.25 1.22
Financials Banking Lucy Feng Shanghai Pudong Bk 600000 CH RMB 16,797 Neutral -2.08 -12.36 -9.29 -23.94 1.5 1.31 1.61 24.1 18.7 16.4 8.48 9.68 7.88 1.65 1.4 1.2 1.09
Financials Banking Lucy Feng Shenzhen Dev Bank 000001 CH RMB 7,630 Neutral -1.97 -10.97 -6.4 -32.75 1.62 1.86 2.24 27.3 23.1 22.3 10.1 8.81 7.31 2.49 1.76 1.51 0.63
Financials Insurance David Chung China Life Insurance 2628 HK RMB 121,352 Buy -1.33 -1.77 12.29 -13.04 1.16 1.23 1.33 17.1 16.3 16.6 25.2 23.3 20.6 3.92 3.71 3.14 0.95
Financials Insurance David Chung China Pacific Ins. 2601 HK RMB 33,745 Reduce -1.75 -3.89 10.55 0 2.61 1 1.25 32.6 10.9 12.5 10.4 26.7 20.4 3.08 2.77 2.35 na
Financials Insurance David Chung China Tai Ping Ins. 966 HK RMB 5,675 Buy -2.63 -9.12 7.25 3.19 0.49 1.39 0.98 9.53 21.3 13 53.4 18.6 26.4 4.28 3.68 3.23 0.81
Financials Insurance David Chung PICC P&C 2328 HK RMB 16,696 Neutral -2.02 1.75 30.79 66.29 0.16 0.42 0.55 8.59 19 19.8 63.9 24 17.4 5.23 4.02 2.99 1.19
Financials Insurance David Chung Ping An Insurance 2318 HK RMB 84,724 Neutral -0.61 7.37 39.24 31.76 1.89 2.63 3.72 18.6 20.8 25.1 41.6 29.4 19.9 6.8 5.73 4.38 1.12
Health Care & Pharmaceuticals Gideon Lo China Shinewayl 2877 HK RMB 2,683 Buy 0.8 -4.55 23.53 73.31 0.93 1.01 1.24 31.6 28.3 29.8 27.2 25 20.4 7.66 6.58 5.62 0.54
Health Care & Pharmaceuticals Gideon Lo Lijun International 2005 HK HK$ 822 Reduce -1.89 -2.26 10.17 108 0.1 0.12 0.14 14.4 14 14.2 25.5 22.3 18.7 3.39 2.79 2.55 0.32
Health Care & Pharmaceuticals Gideon Lo Sino Biopharm. 1177 HK HK$ 1,978 Buy -2.21 1.64 17.42 26.02 0.09 0.1 0.13 16.9 15.1 15.6 35.4 31.7 24.8 5.67 4.01 3.71 0.67
Health Care & Pharmaceuticals Gideon Lo Sinopharm 1099 HK RMB 2,524 Neutral -0.53 -6.73 -4.22 3.09 0.37 0.57 0.79 12.8 11.2 14.3 76 50.2 35.8 5.89 5.42 4.86 na
Health Care & Pharmaceuticals Gideon Lo United Laboratories 3933 HK HK$ 2,681 Neutral -2.56 8.84 6.67 288.35 0.45 0.77 0.9 18 23.8 22.8 35.5 20.9 17.7 6.01 4.28 3.82 0.73
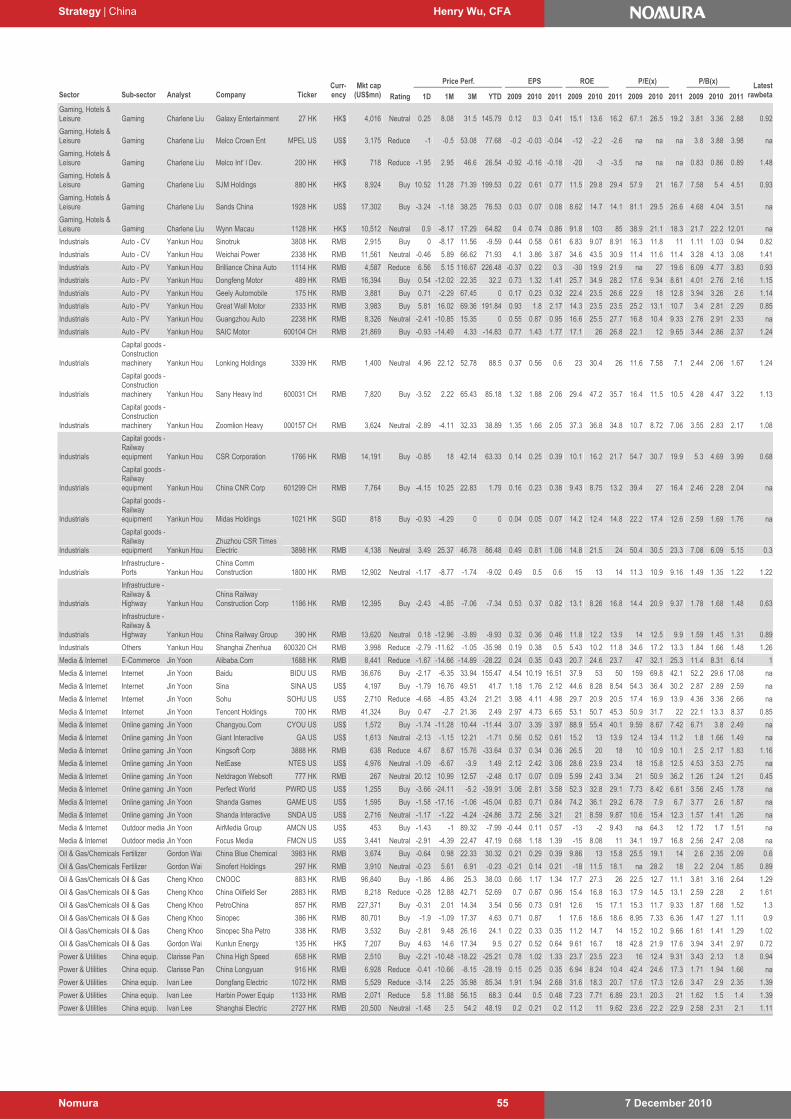
Strategy | China Henry Wu, CFA
7 December 2010 Nomura 55
Price Perf. EPS ROE P/E(x) P/B(x)
Sector Sub-sector Analyst Company Ticker Curr-ency
Mkt cap (US$mn) Rating 1D 1M 3M YTD 2009 2010 2011 2009 2010 2011 2009 2010 2011 2009 2010 2011
Latest rawbeta
Gaming, Hotels & Leisure Gaming Charlene Liu Galaxy Entertainment 27 HK HK$ 4,016 Neutral 0.25 8.08 31.5 145.79 0.12 0.3 0.41 15.1 13.6 16.2 67.1 26.5 19.2 3.81 3.36 2.88 0.92
Gaming, Hotels & Leisure Gaming Charlene Liu Melco Crown Ent MPEL US US$ 3,175 Reduce -1 -0.5 53.08 77.68 -0.2 -0.03 -0.04 -12 -2.2 -2.6 na na na 3.8 3.88 3.98 na
Gaming, Hotels & Leisure Gaming Charlene Liu Melco Int' l Dev. 200 HK HK$ 718 Reduce -1.95 2.95 46.6 26.54 -0.92 -0.16 -0.18 -20 -3 -3.5 na na na 0.83 0.86 0.89 1.48
Gaming, Hotels & Leisure Gaming Charlene Liu SJM Holdings 880 HK HK$ 8,924 Buy 10.52 11.28 71.39 199.53 0.22 0.61 0.77 11.5 29.8 29.4 57.9 21 16.7 7.58 5.4 4.51 0.93
Gaming, Hotels & Leisure Gaming Charlene Liu Sands China 1928 HK US$ 17,302 Buy -3.24 -1.18 38.25 76.53 0.03 0.07 0.08 8.62 14.7 14.1 81.1 29.5 26.6 4.68 4.04 3.51 na
Gaming, Hotels & Leisure Gaming Charlene Liu Wynn Macau 1128 HK HK$ 10,512 Neutral 0.9 -8.17 17.29 64.82 0.4 0.74 0.86 91.8 103 85 38.9 21.1 18.3 21.7 22.2 12.01 na
Industrials Auto - CV Yankun Hou Sinotruk 3808 HK RMB 2,915 Buy 0 -8.17 11.56 -9.59 0.44 0.58 0.61 6.83 9.07 8.91 16.3 11.8 11 1.11 1.03 0.94 0.82
Industrials Auto - CV Yankun Hou Weichai Power 2338 HK RMB 11,561 Neutral -0.46 5.89 66.62 71.93 4.1 3.86 3.87 34.6 43.5 30.9 11.4 11.6 11.4 3.28 4.13 3.08 1.41
Industrials Auto - PV Yankun Hou Brilliance China Auto 1114 HK RMB 4,587 Reduce 6.56 5.15 116.67 226.48 -0.37 0.22 0.3 -30 19.9 21.9 na 27 19.6 6.09 4.77 3.83 0.93
Industrials Auto - PV Yankun Hou Dongfeng Motor 489 HK RMB 16,394 Buy 0.54 -12.02 22.35 32.2 0.73 1.32 1.41 25.7 34.9 28.2 17.6 9.34 8.61 4.01 2.76 2.16 1.15
Industrials Auto - PV Yankun Hou Geely Automobile 175 HK RMB 3,881 Buy 0.71 -2.29 67.45 0 0.17 0.23 0.32 22.4 23.5 26.6 22.9 18 12.8 3.94 3.26 2.6 1.14
Industrials Auto - PV Yankun Hou Great Wall Motor 2333 HK RMB 3,983 Buy 5.81 16.02 69.36 191.84 0.93 1.8 2.17 14.3 23.5 23.5 25.2 13.1 10.7 3.4 2.81 2.29 0.85
Industrials Auto - PV Yankun Hou Guangzhou Auto 2238 HK RMB 8,326 Neutral -2.41 -10.85 15.35 0 0.55 0.87 0.95 16.6 25.5 27.7 16.8 10.4 9.33 2.76 2.91 2.33 na
Industrials Auto - PV Yankun Hou SAIC Motor 600104 CH RMB 21,869 Buy -0.93 -14.49 4.33 -14.83 0.77 1.43 1.77 17.1 26 26.8 22.1 12 9.65 3.44 2.86 2.37 1.24
Industrials
Capital goods - Construction machinery Yankun Hou Lonking Holdings 3339 HK RMB 1,400 Neutral 4.96 22.12 52.78 88.5 0.37 0.56 0.6 23 30.4 26 11.6 7.58 7.1 2.44 2.06 1.67 1.24
Industrials
Capital goods - Construction machinery Yankun Hou Sany Heavy Ind 600031 CH RMB 7,820 Buy -3.52 2.22 65.43 85.18 1.32 1.88 2.06 29.4 47.2 35.7 16.4 11.5 10.5 4.28 4.47 3.22 1.13
Industrials
Capital goods - Construction machinery Yankun Hou Zoomlion Heavy 000157 CH RMB 3,624 Neutral -2.89 -4.11 32.33 38.89 1.35 1.66 2.05 37.3 36.8 34.8 10.7 8.72 7.06 3.55 2.83 2.17 1.08
Industrials
Capital goods - Railway equipment Yankun Hou CSR Corporation 1766 HK RMB 14,191 Buy -0.85 18 42.14 63.33 0.14 0.25 0.39 10.1 16.2 21.7 54.7 30.7 19.9 5.3 4.69 3.99 0.68
Industrials
Capital goods - Railway equipment Yankun Hou China CNR Corp 601299 CH RMB 7,764 Buy -4.15 10.25 22.83 1.79 0.16 0.23 0.38 9.43 8.75 13.2 39.4 27 16.4 2.46 2.28 2.04 na
Industrials
Capital goods - Railway equipment Yankun Hou Midas Holdings 1021 HK SGD 818 Buy -0.93 -4.29 0 0 0.04 0.05 0.07 14.2 12.4 14.8 22.2 17.4 12.6 2.59 1.69 1.76 na
Industrials
Capital goods - Railway equipment Yankun Hou
Zhuzhou CSR Times Electric 3898 HK RMB 4,138 Neutral 3.49 25.37 46.78 86.48 0.49 0.81 1.06 14.8 21.5 24 50.4 30.5 23.3 7.08 6.09 5.15 0.3
Industrials Infrastructure - Ports Yankun Hou
China Comm Construction 1800 HK RMB 12,902 Neutral -1.17 -8.77 -1.74 -9.02 0.49 0.5 0.6 15 13 14 11.3 10.9 9.16 1.49 1.35 1.22 1.22
Industrials
Infrastructure - Railway & Highway Yankun Hou
China Railway Construction Corp 1186 HK RMB 12,395 Buy -2.43 -4.85 -7.06 -7.34 0.53 0.37 0.82 13.1 8.26 16.8 14.4 20.9 9.37 1.78 1.68 1.48 0.63
Industrials
Infrastructure - Railway & Highway Yankun Hou China Railway Group 390 HK RMB 13,620 Neutral 0.18 -12.96 -3.89 -9.93 0.32 0.36 0.46 11.8 12.2 13.9 14 12.5 9.9 1.59 1.45 1.31 0.89
Industrials Others Yankun Hou Shanghai Zhenhua 600320 CH RMB 3,998 Reduce -2.79 -11.62 -1.05 -35.98 0.19 0.38 0.5 5.43 10.2 11.8 34.6 17.2 13.3 1.84 1.66 1.48 1.26
Media & Internet E-Commerce Jin Yoon Alibaba.Com 1688 HK RMB 8,441 Reduce -1.67 -14.66 -14.89 -28.22 0.24 0.35 0.43 20.7 24.6 23.7 47 32.1 25.3 11.4 8.31 6.14 1
Media & Internet Internet Jin Yoon Baidu BIDU US RMB 36,676 Buy -2.17 -6.35 33.94 155.47 4.54 10.19 16.51 37.9 53 50 159 69.8 42.1 52.2 29.6 17.08 na
Media & Internet Internet Jin Yoon Sina SINA US US$ 4,197 Buy -1.79 16.76 49.51 41.7 1.18 1.76 2.12 44.6 8.28 8.54 54.3 36.4 30.2 2.87 2.89 2.59 na
Media & Internet Internet Jin Yoon Sohu SOHU US US$ 2,710 Reduce -4.68 -4.85 43.24 21.21 3.98 4.11 4.98 29.7 20.9 20.5 17.4 16.9 13.9 4.36 3.36 2.66 na
Media & Internet Internet Jin Yoon Tencent Holdings 700 HK RMB 41,324 Buy 0.47 -2.7 21.36 2.49 2.97 4.73 6.65 53.1 50.7 45.3 50.9 31.7 22 22.1 13.3 8.37 0.85
Media & Internet Online gaming Jin Yoon Changyou.Com CYOU US US$ 1,572 Buy -1.74 -11.28 10.44 -11.44 3.07 3.39 3.97 88.9 55.4 40.1 9.59 8.67 7.42 6.71 3.8 2.49 na
Media & Internet Online gaming Jin Yoon Giant Interactive GA US US$ 1,613 Neutral -2.13 -1.15 12.21 -1.71 0.56 0.52 0.61 15.2 13 13.9 12.4 13.4 11.2 1.8 1.66 1.49 na
Media & Internet Online gaming Jin Yoon Kingsoft Corp 3888 HK RMB 638 Reduce 4.67 8.67 15.76 -33.64 0.37 0.34 0.36 26.5 20 18 10 10.9 10.1 2.5 2.17 1.83 1.16
Media & Internet Online gaming Jin Yoon NetEase NTES US US$ 4,976 Neutral -1.09 -6.67 -3.9 1.49 2.12 2.42 3.06 28.6 23.9 23.4 18 15.8 12.5 4.53 3.53 2.75 na
Media & Internet Online gaming Jin Yoon Netdragon Websoft 777 HK RMB 267 Neutral 20.12 10.99 12.57 -2.48 0.17 0.07 0.09 5.99 2.43 3.34 21 50.9 36.2 1.26 1.24 1.21 0.45
Media & Internet Online gaming Jin Yoon Perfect World PWRD US US$ 1,255 Buy -3.66 -24.11 -5.2 -39.91 3.06 2.81 3.58 52.3 32.8 29.1 7.73 8.42 6.61 3.56 2.45 1.78 na
Media & Internet Online gaming Jin Yoon Shanda Games GAME US US$ 1,595 Buy -1.58 -17.16 -1.06 -45.04 0.83 0.71 0.84 74.2 36.1 29.2 6.78 7.9 6.7 3.77 2.6 1.87 na
Media & Internet Online gaming Jin Yoon Shanda Interactive SNDA US US$ 2,716 Neutral -1.17 -1.22 -4.24 -24.86 3.72 2.56 3.21 21 8.59 9.87 10.6 15.4 12.3 1.57 1.41 1.26 na
Media & Internet Outdoor media Jin Yoon AirMedia Group AMCN US US$ 453 Buy -1.43 -1 89.32 -7.99 -0.44 0.11 0.57 -13 -2 9.43 na 64.3 12 1.72 1.7 1.51 na
Media & Internet Outdoor media Jin Yoon Focus Media FMCN US US$ 3,441 Neutral -2.91 -4.39 22.47 47.19 0.68 1.18 1.39 -15 8.08 11 34.1 19.7 16.8 2.56 2.47 2.08 na
Oil & Gas/Chemicals Fertilizer Gordon Wai China Blue Chemical 3983 HK RMB 3,674 Buy -0.64 0.98 22.33 30.32 0.21 0.29 0.39 9.86 13 15.8 25.5 19.1 14 2.6 2.35 2.09 0.6
Oil & Gas/Chemicals Fertilizer Gordon Wai Sinofert Holdings 297 HK RMB 3,910 Neutral -0.23 5.61 6.91 -0.23 -0.21 0.14 0.21 -18 11.5 18.1 na 28.2 18 2.2 2.04 1.85 0.89
Oil & Gas/Chemicals Oil & Gas Cheng Khoo CNOOC 883 HK RMB 96,840 Buy -1.86 4.86 25.3 38.03 0.66 1.17 1.34 17.7 27.3 26 22.5 12.7 11.1 3.81 3.16 2.64 1.29
Oil & Gas/Chemicals Oil & Gas Cheng Khoo China Oilfield Ser 2883 HK RMB 8,218 Reduce -0.28 12.88 42.71 52.69 0.7 0.87 0.96 15.4 16.8 16.3 17.9 14.5 13.1 2.59 2.28 2 1.61
Oil & Gas/Chemicals Oil & Gas Cheng Khoo PetroChina 857 HK RMB 227,371 Buy -0.31 2.01 14.34 3.54 0.56 0.73 0.91 12.6 15 17.1 15.3 11.7 9.33 1.87 1.68 1.52 1.3
Oil & Gas/Chemicals Oil & Gas Cheng Khoo Sinopec 386 HK RMB 80,701 Buy -1.9 -1.09 17.37 4.63 0.71 0.87 1 17.6 18.6 18.6 8.95 7.33 6.36 1.47 1.27 1.11 0.9
Oil & Gas/Chemicals Oil & Gas Cheng Khoo Sinopec Sha Petro 338 HK RMB 3,532 Buy -2.81 9.48 26.16 24.1 0.22 0.33 0.35 11.2 14.7 14 15.2 10.2 9.66 1.61 1.41 1.29 1.02
Oil & Gas/Chemicals Oil & Gas Gordon Wai Kunlun Energy 135 HK HK$ 7,207 Buy 4.63 14.6 17.34 9.5 0.27 0.52 0.64 9.61 16.7 18 42.8 21.9 17.6 3.94 3.41 2.97 0.72
Power & Utilities China equip. Clarisse Pan China High Speed 658 HK RMB 2,510 Buy -2.21 -10.48 -18.22 -25.21 0.78 1.02 1.33 23.7 23.5 22.3 16 12.4 9.31 3.43 2.13 1.8 0.94
Power & Utilities China equip. Clarisse Pan China Longyuan 916 HK RMB 6,928 Reduce -0.41 -10.66 -8.15 -28.19 0.15 0.25 0.35 6.94 8.24 10.4 42.4 24.6 17.3 1.71 1.94 1.66 na
Power & Utilities China equip. Ivan Lee Dongfang Electric 1072 HK RMB 5,529 Reduce -3.14 2.25 35.98 85.34 1.91 1.94 2.68 31.6 18.3 20.7 17.6 17.3 12.6 3.47 2.9 2.35 1.39
Power & Utilities China equip. Ivan Lee Harbin Power Equip 1133 HK RMB 2,071 Reduce 5.8 11.88 56.15 68.3 0.44 0.5 0.48 7.23 7.71 6.89 23.1 20.3 21 1.62 1.5 1.4 1.39
Power & Utilities China equip. Ivan Lee Shanghai Electric 2727 HK RMB 20,500 Neutral -1.48 2.5 54.2 48.19 0.2 0.21 0.2 11.2 11 9.62 23.6 22.2 22.9 2.58 2.31 2.1 1.11
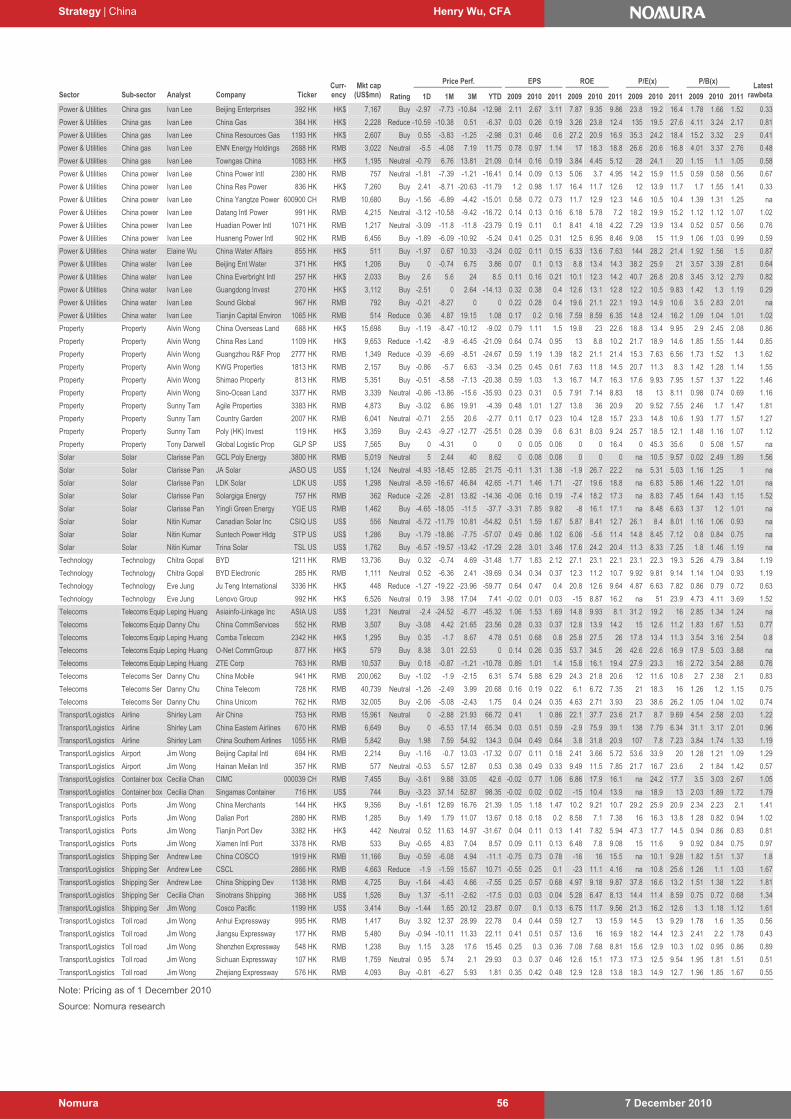
Strategy | China Henry Wu, CFA
7 December 2010 Nomura 56
Price Perf. EPS ROE P/E(x) P/B(x)
Sector Sub-sector Analyst Company Ticker Curr-ency
Mkt cap (US$mn) Rating 1D 1M 3M YTD 2009 2010 2011 2009 2010 2011 2009 2010 2011 2009 2010 2011
Latest rawbeta
Power & Utilities China gas Ivan Lee Beijing Enterprises 392 HK HK$ 7,167 Buy -2.97 -7.73 -10.84 -12.98 2.11 2.67 3.11 7.87 9.35 9.86 23.8 19.2 16.4 1.78 1.66 1.52 0.33
Power & Utilities China gas Ivan Lee China Gas 384 HK HK$ 2,228 Reduce -10.59 -10.38 0.51 -6.37 0.03 0.26 0.19 3.26 23.8 12.4 135 19.5 27.6 4.11 3.24 2.17 0.81
Power & Utilities China gas Ivan Lee China Resources Gas 1193 HK HK$ 2,607 Buy 0.55 -3.83 -1.25 -2.98 0.31 0.46 0.6 27.2 20.9 16.9 35.3 24.2 18.4 15.2 3.32 2.9 0.41
Power & Utilities China gas Ivan Lee ENN Energy Holdings 2688 HK RMB 3,022 Neutral -5.5 -4.08 7.19 11.75 0.78 0.97 1.14 17 18.3 18.8 26.6 20.6 16.8 4.01 3.37 2.76 0.48
Power & Utilities China gas Ivan Lee Towngas China 1083 HK HK$ 1,195 Neutral -0.79 6.76 13.81 21.09 0.14 0.16 0.19 3.84 4.45 5.12 28 24.1 20 1.15 1.1 1.05 0.58
Power & Utilities China power Ivan Lee China Power Intl 2380 HK RMB 757 Neutral -1.81 -7.39 -1.21 -16.41 0.14 0.09 0.13 5.06 3.7 4.95 14.2 15.9 11.5 0.59 0.58 0.56 0.67
Power & Utilities China power Ivan Lee China Res Power 836 HK HK$ 7,260 Buy 2.41 -8.71 -20.63 -11.79 1.2 0.98 1.17 16.4 11.7 12.6 12 13.9 11.7 1.7 1.55 1.41 0.33
Power & Utilities China power Ivan Lee China Yangtze Power 600900 CH RMB 10,680 Buy -1.56 -6.89 -4.42 -15.01 0.58 0.72 0.73 11.7 12.9 12.3 14.6 10.5 10.4 1.39 1.31 1.25 na
Power & Utilities China power Ivan Lee Datang Intl Power 991 HK RMB 4,215 Neutral -3.12 -10.58 -9.42 -16.72 0.14 0.13 0.16 6.18 5.78 7.2 18.2 19.9 15.2 1.12 1.12 1.07 1.02
Power & Utilities China power Ivan Lee Huadian Power Intl 1071 HK RMB 1,217 Neutral -3.09 -11.8 -11.8 -23.79 0.19 0.11 0.1 8.41 4.18 4.22 7.29 13.9 13.4 0.52 0.57 0.56 0.76
Power & Utilities China power Ivan Lee Huaneng Power Intl 902 HK RMB 6,456 Buy -1.89 -6.09 -10.92 -5.24 0.41 0.25 0.31 12.5 6.95 8.46 9.08 15 11.9 1.06 1.03 0.99 0.59
Power & Utilities China water Elaine Wu China Water Affairs 855 HK HK$ 511 Buy -1.97 0.67 10.33 -3.24 0.02 0.11 0.15 6.33 13.6 7.63 144 28.2 21.4 1.92 1.56 1.5 0.87
Power & Utilities China water Ivan Lee Beijing Ent Water 371 HK HK$ 1,206 Buy 0 -0.74 6.75 3.86 0.07 0.1 0.13 8.8 13.4 14.3 38.2 25.9 21 3.57 3.39 2.81 0.64
Power & Utilities China water Ivan Lee China Everbright Intl 257 HK HK$ 2,033 Buy 2.6 5.6 24 8.5 0.11 0.16 0.21 10.1 12.3 14.2 40.7 26.8 20.8 3.45 3.12 2.79 0.82
Power & Utilities China water Ivan Lee Guangdong Invest 270 HK HK$ 3,112 Buy -2.51 0 2.64 -14.13 0.32 0.38 0.4 12.6 13.1 12.8 12.2 10.5 9.83 1.42 1.3 1.19 0.29
Power & Utilities China water Ivan Lee Sound Global 967 HK RMB 792 Buy -0.21 -8.27 0 0 0.22 0.28 0.4 19.6 21.1 22.1 19.3 14.9 10.6 3.5 2.83 2.01 na
Power & Utilities China water Ivan Lee Tianjin Capital Environ 1065 HK RMB 514 Reduce 0.36 4.87 19.15 1.08 0.17 0.2 0.16 7.59 8.59 6.35 14.8 12.4 16.2 1.09 1.04 1.01 1.02
Property Property Alvin Wong China Overseas Land 688 HK HK$ 15,698 Buy -1.19 -8.47 -10.12 -9.02 0.79 1.11 1.5 19.8 23 22.6 18.8 13.4 9.95 2.9 2.45 2.08 0.86
Property Property Alvin Wong China Res Land 1109 HK HK$ 9,653 Reduce -1.42 -8.9 -6.45 -21.09 0.64 0.74 0.95 13 8.8 10.2 21.7 18.9 14.6 1.85 1.55 1.44 0.85
Property Property Alvin Wong Guangzhou R&F Prop 2777 HK RMB 1,349 Reduce -0.39 -6.69 -8.51 -24.67 0.59 1.19 1.39 18.2 21.1 21.4 15.3 7.63 6.56 1.73 1.52 1.3 1.62
Property Property Alvin Wong KWG Properties 1813 HK RMB 2,157 Buy -0.86 -5.7 6.63 -3.34 0.25 0.45 0.61 7.63 11.8 14.5 20.7 11.3 8.3 1.42 1.28 1.14 1.55
Property Property Alvin Wong Shimao Property 813 HK RMB 5,351 Buy -0.51 -8.58 -7.13 -20.38 0.59 1.03 1.3 16.7 14.7 16.3 17.6 9.93 7.95 1.57 1.37 1.22 1.46
Property Property Alvin Wong Sino-Ocean Land 3377 HK RMB 3,339 Neutral -0.86 -13.86 -15.6 -35.93 0.23 0.31 0.5 7.91 7.14 8.83 18 13 8.11 0.98 0.74 0.69 1.16
Property Property Sunny Tam Agile Properties 3383 HK RMB 4,873 Buy -3.02 6.86 19.91 -4.39 0.48 1.01 1.27 13.8 36 20.9 20 9.52 7.55 2.46 1.7 1.47 1.81
Property Property Sunny Tam Country Garden 2007 HK RMB 6,041 Neutral -0.71 2.55 20.6 -2.77 0.11 0.17 0.23 10.4 12.8 15.7 23.3 14.8 10.6 1.93 1.77 1.57 1.27
Property Property Sunny Tam Poly (HK) Invest 119 HK HK$ 3,359 Buy -2.43 -9.27 -12.77 -25.51 0.28 0.39 0.6 6.31 8.03 9.24 25.7 18.5 12.1 1.48 1.16 1.07 1.12
Property Property Tony Darwell Global Logistic Prop GLP SP US$ 7,565 Buy 0 -4.31 0 0 0 0.05 0.06 0 0 16.4 0 45.3 35.6 0 5.08 1.57 na
Solar Solar Clarisse Pan GCL Poly Energy 3800 HK RMB 5,019 Neutral 5 2.44 40 8.62 0 0.08 0.08 0 0 0 na 10.5 9.57 0.02 2.49 1.89 1.56
Solar Solar Clarisse Pan JA Solar JASO US US$ 1,124 Neutral -4.93 -18.45 12.85 21.75 -0.11 1.31 1.38 -1.9 26.7 22.2 na 5.31 5.03 1.16 1.25 1 na
Solar Solar Clarisse Pan LDK Solar LDK US US$ 1,298 Neutral -8.59 -16.67 46.84 42.65 -1.71 1.46 1.71 -27 19.6 18.8 na 6.83 5.86 1.46 1.22 1.01 na
Solar Solar Clarisse Pan Solargiga Energy 757 HK RMB 362 Reduce -2.26 -2.81 13.82 -14.36 -0.06 0.16 0.19 -7.4 18.2 17.3 na 8.83 7.45 1.64 1.43 1.15 1.52
Solar Solar Clarisse Pan Yingli Green Energy YGE US RMB 1,462 Buy -4.65 -18.05 -11.5 -37.7 -3.31 7.85 9.82 -8 16.1 17.1 na 8.48 6.63 1.37 1.2 1.01 na
Solar Solar Nitin Kumar Canadian Solar Inc CSIQ US US$ 556 Neutral -5.72 -11.79 10.81 -54.82 0.51 1.59 1.67 5.87 8.41 12.7 26.1 8.4 8.01 1.16 1.06 0.93 na
Solar Solar Nitin Kumar Suntech Power Hldg STP US US$ 1,286 Buy -1.79 -18.86 -7.75 -57.07 0.49 0.86 1.02 6.06 -5.6 11.4 14.8 8.45 7.12 0.8 0.84 0.75 na
Solar Solar Nitin Kumar Trina Solar TSL US US$ 1,762 Buy -6.57 -19.57 -13.42 -17.29 2.28 3.01 3.46 17.6 24.2 20.4 11.3 8.33 7.25 1.8 1.46 1.19 na
Technology Technology Chitra Gopal BYD 1211 HK RMB 13,736 Buy 0.32 -0.74 4.69 -31.48 1.77 1.83 2.12 27.1 23.1 22.1 23.1 22.3 19.3 5.26 4.79 3.84 1.19
Technology Technology Chitra Gopal BYD Electronic 285 HK RMB 1,111 Neutral 0.52 -6.36 2.41 -39.69 0.34 0.34 0.37 12.3 11.2 10.7 9.92 9.81 9.14 1.14 1.04 0.93 1.19
Technology Technology Eve Jung Ju Teng International 3336 HK HK$ 448 Reduce -1.27 -19.22 -23.96 -59.77 0.64 0.47 0.4 20.8 12.6 9.64 4.87 6.63 7.82 0.86 0.79 0.72 0.63
Technology Technology Eve Jung Lenovo Group 992 HK HK$ 6,526 Neutral 0.19 3.98 17.04 7.41 -0.02 0.01 0.03 -15 8.87 16.2 na 51 23.9 4.73 4.11 3.69 1.52
Telecoms Telecoms Equip Leping Huang Asiainfo-Linkage Inc ASIA US US$ 1,231 Neutral -2.4 -24.52 -6.77 -45.32 1.06 1.53 1.69 14.8 9.93 8.1 31.2 19.2 16 2.85 1.34 1.24 na
Telecoms Telecoms Equip Danny Chu China CommServices 552 HK RMB 3,507 Buy -3.08 4.42 21.65 23.56 0.28 0.33 0.37 12.8 13.9 14.2 15 12.6 11.2 1.83 1.67 1.53 0.77
Telecoms Telecoms Equip Leping Huang Comba Telecom 2342 HK HK$ 1,295 Buy 0.35 -1.7 8.67 4.78 0.51 0.68 0.8 25.8 27.5 26 17.8 13.4 11.3 3.54 3.16 2.54 0.8
Telecoms Telecoms Equip Leping Huang O-Net CommGroup 877 HK HK$ 579 Buy 8.38 3.01 22.53 0 0.14 0.26 0.35 53.7 34.5 26 42.6 22.6 16.9 17.9 5.03 3.88 na
Telecoms Telecoms Equip Leping Huang ZTE Corp 763 HK RMB 10,537 Buy 0.18 -0.87 -1.21 -10.78 0.89 1.01 1.4 15.8 16.1 19.4 27.9 23.3 16 2.72 3.54 2.88 0.76
Telecoms Telecoms Ser Danny Chu China Mobile 941 HK RMB 200,062 Buy -1.02 -1.9 -2.15 6.31 5.74 5.88 6.29 24.3 21.8 20.6 12 11.6 10.8 2.7 2.38 2.1 0.83
Telecoms Telecoms Ser Danny Chu China Telecom 728 HK RMB 40,739 Neutral -1.26 -2.49 3.99 20.68 0.16 0.19 0.22 6.1 6.72 7.35 21 18.3 16 1.26 1.2 1.15 0.75
Telecoms Telecoms Ser Danny Chu China Unicom 762 HK RMB 32,005 Buy -2.06 -5.08 -2.43 1.75 0.4 0.24 0.35 4.63 2.71 3.93 23 38.6 26.2 1.05 1.04 1.02 0.74
Transport/Logistics Airline Shirley Lam Air China 753 HK RMB 15,961 Neutral 0 -2.88 21.93 66.72 0.41 1 0.86 22.1 37.7 23.6 21.7 8.7 9.69 4.54 2.58 2.03 1.22
Transport/Logistics Airline Shirley Lam China Eastern Airlines 670 HK RMB 6,649 Buy 0 -6.53 17.14 65.34 0.03 0.51 0.59 -2.9 75.9 39.1 138 7.79 6.34 31.1 3.17 2.01 0.96
Transport/Logistics Airline Shirley Lam China Southern Airlines 1055 HK RMB 5,842 Buy 1.98 7.59 54.92 134.3 0.04 0.49 0.64 3.8 31.8 20.9 107 7.8 7.23 3.84 1.74 1.33 1.19
Transport/Logistics Airport Jim Wong Beijing Capital Intl 694 HK RMB 2,214 Buy -1.16 -0.7 13.03 -17.32 0.07 0.11 0.18 2.41 3.66 5.72 53.6 33.9 20 1.28 1.21 1.09 1.29
Transport/Logistics Airport Jim Wong Hainan Meilan Intl 357 HK RMB 577 Neutral -0.53 5.57 12.87 0.53 0.38 0.49 0.33 9.49 11.5 7.85 21.7 16.7 23.6 2 1.84 1.42 0.57
Transport/Logistics Container box Cecilia Chan CIMC 000039 CH RMB 7,455 Buy -3.61 9.88 33.05 42.6 -0.02 0.77 1.06 6.86 17.9 16.1 na 24.2 17.7 3.5 3.03 2.67 1.05
Transport/Logistics Container box Cecilia Chan Singamas Container 716 HK US$ 744 Buy -3.23 37.14 52.87 98.35 -0.02 0.02 0.02 -15 10.4 13.9 na 18.9 13 2.03 1.89 1.72 1.79
Transport/Logistics Ports Jim Wong China Merchants 144 HK HK$ 9,356 Buy -1.61 12.89 16.76 21.39 1.05 1.18 1.47 10.2 9.21 10.7 29.2 25.9 20.9 2.34 2.23 2.1 1.41
Transport/Logistics Ports Jim Wong Dalian Port 2880 HK RMB 1,285 Buy 1.49 1.79 11.07 13.67 0.18 0.18 0.2 8.58 7.1 7.38 16 16.3 13.8 1.28 0.82 0.94 1.02
Transport/Logistics Ports Jim Wong Tianjin Port Dev 3382 HK HK$ 442 Neutral 0.52 11.63 14.97 -31.67 0.04 0.11 0.13 1.41 7.82 5.94 47.3 17.7 14.5 0.94 0.86 0.83 0.81
Transport/Logistics Ports Jim Wong Xiamen Intl Port 3378 HK RMB 533 Buy -0.65 4.83 7.04 8.57 0.09 0.11 0.13 6.48 7.8 9.08 15 11.6 9 0.92 0.84 0.75 0.97
Transport/Logistics Shipping Ser Andrew Lee China COSCO 1919 HK RMB 11,166 Buy -0.59 -6.08 4.94 -11.1 -0.75 0.73 0.78 -16 16 15.5 na 10.1 9.28 1.82 1.51 1.37 1.8
Transport/Logistics Shipping Ser Andrew Lee CSCL 2866 HK RMB 4,663 Reduce -1.9 -1.59 15.67 10.71 -0.55 0.25 0.1 -23 11.1 4.16 na 10.8 25.6 1.26 1.1 1.03 1.67
Transport/Logistics Shipping Ser Andrew Lee China Shipping Dev 1138 HK RMB 4,725 Buy -1.64 -4.43 4.66 -7.55 0.25 0.57 0.68 4.97 9.18 9.87 37.8 16.6 13.2 1.51 1.38 1.22 1.81
Transport/Logistics Shipping Ser Cecilia Chan Sinotrans Shipping 368 HK US$ 1,526 Buy 1.37 -5.11 -2.62 -17.5 0.03 0.03 0.04 5.28 6.47 8.13 14.4 11.4 8.59 0.75 0.72 0.68 1.34
Transport/Logistics Shipping Ser Jim Wong Cosco Pacific 1199 HK US$ 3,414 Buy -1.44 1.65 20.12 23.87 0.07 0.1 0.13 6.75 11.7 9.56 21.3 16.2 12.6 1.3 1.18 1.12 1.61
Transport/Logistics Toll road Jim Wong Anhui Expressway 995 HK RMB 1,417 Buy 3.92 12.37 28.99 22.78 0.4 0.44 0.59 12.7 13 15.9 14.5 13 9.29 1.78 1.6 1.35 0.56
Transport/Logistics Toll road Jim Wong Jiangsu Expressway 177 HK RMB 5,480 Buy -0.94 -10.11 11.33 22.11 0.41 0.51 0.57 13.6 16 16.9 18.2 14.4 12.3 2.41 2.2 1.78 0.43
Transport/Logistics Toll road Jim Wong Shenzhen Expressway 548 HK RMB 1,238 Buy 1.15 3.28 17.6 15.45 0.25 0.3 0.36 7.08 7.68 8.81 15.6 12.9 10.3 1.02 0.95 0.86 0.89
Transport/Logistics Toll road Jim Wong Sichuan Expressway 107 HK RMB 1,759 Neutral 0.95 5.74 2.1 29.93 0.3 0.37 0.46 12.6 15.1 17.3 17.3 12.5 9.54 1.95 1.81 1.51 0.51
Transport/Logistics Toll road Jim Wong Zhejiang Expressway 576 HK RMB 4,093 Buy -0.81 -6.27 5.93 1.81 0.35 0.42 0.48 12.9 12.8 13.8 18.3 14.9 12.7 1.96 1.85 1.67 0.55
Note: Pricing as of 1 December 2010
Source: Nomura research
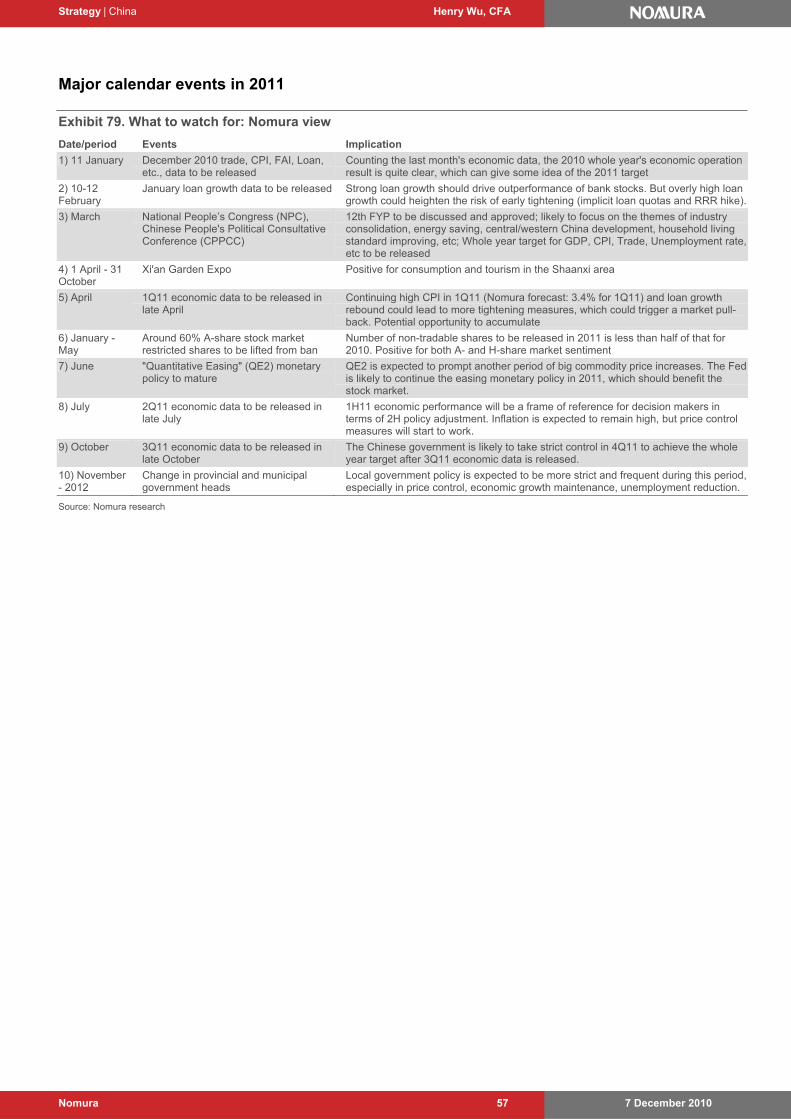
Strategy | China Henry Wu, CFA
7 December 2010 Nomura 57
Major calendar events in 2011
Exhibit 79. What to watch for: Nomura view
Date/period Events Implication
1) 11 January December 2010 trade, CPI, FAI, Loan, etc., data to be released
Counting the last month's economic data, the 2010 whole year's economic operation result is quite clear, which can give some idea of the 2011 target
2) 10-12 February
January loan growth data to be released Strong loan growth should drive outperformance of bank stocks. But overly high loan growth could heighten the risk of early tightening (implicit loan quotas and RRR hike).
3) March National People’s Congress (NPC), Chinese People's Political Consultative Conference (CPPCC)
12th FYP to be discussed and approved; likely to focus on the themes of industry consolidation, energy saving, central/western China development, household living standard improving, etc; Whole year target for GDP, CPI, Trade, Unemployment rate, etc to be released
4) 1 April - 31 October
Xi'an Garden Expo Positive for consumption and tourism in the Shaanxi area
5) April 1Q11 economic data to be released in late April
Continuing high CPI in 1Q11 (Nomura forecast: 3.4% for 1Q11) and loan growth rebound could lead to more tightening measures, which could trigger a market pull-back. Potential opportunity to accumulate
6) January - May
Around 60% A-share stock market restricted shares to be lifted from ban
Number of non-tradable shares to be released in 2011 is less than half of that for 2010. Positive for both A- and H-share market sentiment
7) June "Quantitative Easing" (QE2) monetary policy to mature
QE2 is expected to prompt another period of big commodity price increases. The Fed is likely to continue the easing monetary policy in 2011, which should benefit the stock market.
8) July 2Q11 economic data to be released in late July
1H11 economic performance will be a frame of reference for decision makers in terms of 2H policy adjustment. Inflation is expected to remain high, but price control measures will start to work.
9) October 3Q11 economic data to be released in late October
The Chinese government is likely to take strict control in 4Q11 to achieve the whole year target after 3Q11 economic data is released.
10) November - 2012
Change in provincial and municipal government heads
Local government policy is expected to be more strict and frequent during this period, especially in price control, economic growth maintenance, unemployment reduction.
Source: Nomura research
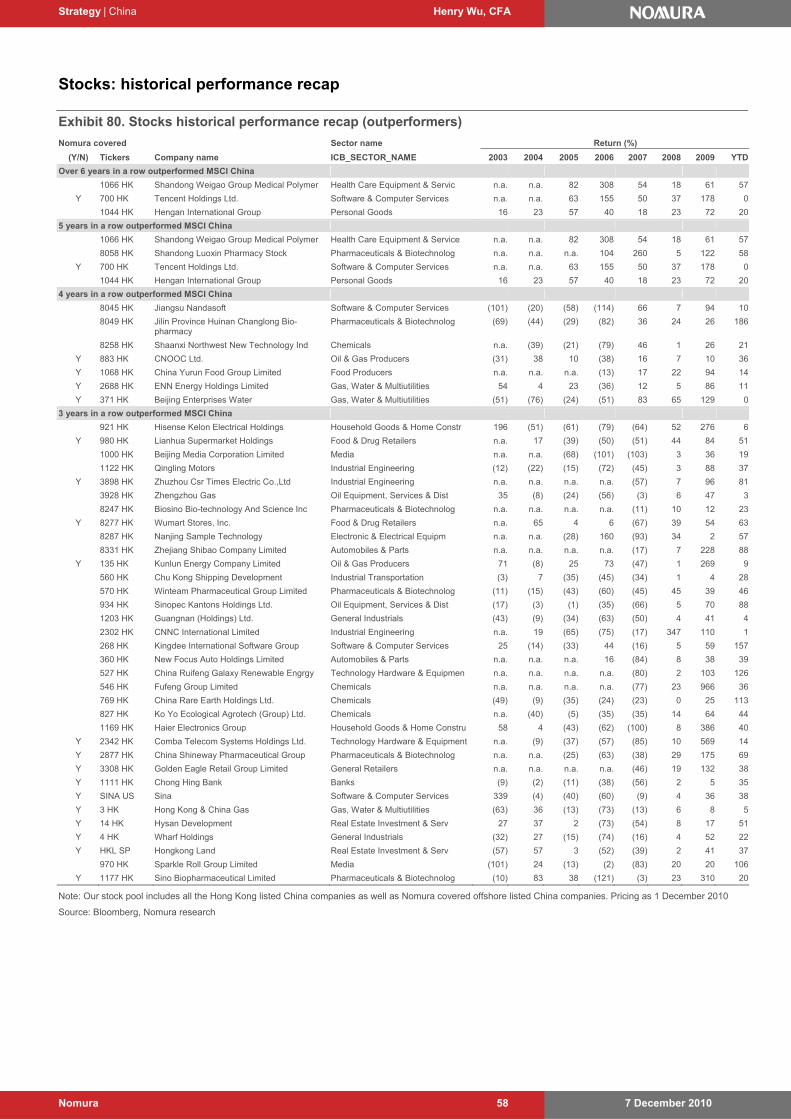
Strategy | China Henry Wu, CFA
7 December 2010 Nomura 58
Stocks: historical performance recap
Exhibit 80. Stocks historical performance recap (outperformers)
Nomura covered Sector name Return (%)
(Y/N) Tickers Company name ICB_SECTOR_NAME 2003 2004 2005 2006 2007 2008 2009 YTD
Over 6 years in a row outperformed MSCI China
1066 HK Shandong Weigao Group Medical Polymer Health Care Equipment & Servic n.a. n.a. 82 308 54 18 61 57
Y 700 HK Tencent Holdings Ltd. Software & Computer Services n.a. n.a. 63 155 50 37 178 0
1044 HK Hengan International Group Personal Goods 16 23 57 40 18 23 72 20
5 years in a row outperformed MSCI China
1066 HK Shandong Weigao Group Medical Polymer Health Care Equipment & Service n.a. n.a. 82 308 54 18 61 57
8058 HK Shandong Luoxin Pharmacy Stock Pharmaceuticals & Biotechnolog n.a. n.a. n.a. 104 260 5 122 58
Y 700 HK Tencent Holdings Ltd. Software & Computer Services n.a. n.a. 63 155 50 37 178 0
1044 HK Hengan International Group Personal Goods 16 23 57 40 18 23 72 20
4 years in a row outperformed MSCI China
8045 HK Jiangsu Nandasoft Software & Computer Services (101) (20) (58) (114) 66 7 94 10
8049 HK Jilin Province Huinan Changlong Bio-pharmacy
Pharmaceuticals & Biotechnolog (69) (44) (29) (82) 36 24 26 186
8258 HK Shaanxi Northwest New Technology Ind Chemicals n.a. (39) (21) (79) 46 1 26 21
Y 883 HK CNOOC Ltd. Oil & Gas Producers (31) 38 10 (38) 16 7 10 36
Y 1068 HK China Yurun Food Group Limited Food Producers n.a. n.a. n.a. (13) 17 22 94 14
Y 2688 HK ENN Energy Holdings Limited Gas, Water & Multiutilities 54 4 23 (36) 12 5 86 11
Y 371 HK Beijing Enterprises Water Gas, Water & Multiutilities (51) (76) (24) (51) 83 65 129 0
3 years in a row outperformed MSCI China
921 HK Hisense Kelon Electrical Holdings Household Goods & Home Constr 196 (51) (61) (79) (64) 52 276 6
Y 980 HK Lianhua Supermarket Holdings Food & Drug Retailers n.a. 17 (39) (50) (51) 44 84 51
1000 HK Beijing Media Corporation Limited Media n.a. n.a. (68) (101) (103) 3 36 19
1122 HK Qingling Motors Industrial Engineering (12) (22) (15) (72) (45) 3 88 37
Y 3898 HK Zhuzhou Csr Times Electric Co.,Ltd Industrial Engineering n.a. n.a. n.a. n.a. (57) 7 96 81
3928 HK Zhengzhou Gas Oil Equipment, Services & Dist 35 (8) (24) (56) (3) 6 47 3
8247 HK Biosino Bio-technology And Science Inc Pharmaceuticals & Biotechnolog n.a. n.a. n.a. n.a. (11) 10 12 23
Y 8277 HK Wumart Stores, Inc. Food & Drug Retailers n.a. 65 4 6 (67) 39 54 63
8287 HK Nanjing Sample Technology Electronic & Electrical Equipm n.a. n.a. (28) 160 (93) 34 2 57
8331 HK Zhejiang Shibao Company Limited Automobiles & Parts n.a. n.a. n.a. n.a. (17) 7 228 88
Y 135 HK Kunlun Energy Company Limited Oil & Gas Producers 71 (8) 25 73 (47) 1 269 9
560 HK Chu Kong Shipping Development Industrial Transportation (3) 7 (35) (45) (34) 1 4 28
570 HK Winteam Pharmaceutical Group Limited Pharmaceuticals & Biotechnolog (11) (15) (43) (60) (45) 45 39 46
934 HK Sinopec Kantons Holdings Ltd. Oil Equipment, Services & Dist (17) (3) (1) (35) (66) 5 70 88
1203 HK Guangnan (Holdings) Ltd. General Industrials (43) (9) (34) (63) (50) 4 41 4
2302 HK CNNC International Limited Industrial Engineering n.a. 19 (65) (75) (17) 347 110 1
268 HK Kingdee International Software Group Software & Computer Services 25 (14) (33) 44 (16) 5 59 157
360 HK New Focus Auto Holdings Limited Automobiles & Parts n.a. n.a. n.a. 16 (84) 8 38 39
527 HK China Ruifeng Galaxy Renewable Engrgy Technology Hardware & Equipmen n.a. n.a. n.a. n.a. (80) 2 103 126
546 HK Fufeng Group Limited Chemicals n.a. n.a. n.a. n.a. (77) 23 966 36
769 HK China Rare Earth Holdings Ltd. Chemicals (49) (9) (35) (24) (23) 0 25 113
827 HK Ko Yo Ecological Agrotech (Group) Ltd. Chemicals n.a. (40) (5) (35) (35) 14 64 44
1169 HK Haier Electronics Group Household Goods & Home Constru 58 4 (43) (62) (100) 8 386 40
Y 2342 HK Comba Telecom Systems Holdings Ltd. Technology Hardware & Equipment n.a. (9) (37) (57) (85) 10 569 14
Y 2877 HK China Shineway Pharmaceutical Group Pharmaceuticals & Biotechnolog n.a. n.a. (25) (63) (38) 29 175 69
Y 3308 HK Golden Eagle Retail Group Limited General Retailers n.a. n.a. n.a. n.a. (46) 19 132 38
Y 1111 HK Chong Hing Bank Banks (9) (2) (11) (38) (56) 2 5 35
Y SINA US Sina Software & Computer Services 339 (4) (40) (60) (9) 4 36 38
Y 3 HK Hong Kong & China Gas Gas, Water & Multiutilities (63) 36 (13) (73) (13) 6 8 5
Y 14 HK Hysan Development Real Estate Investment & Serv 27 37 2 (73) (54) 8 17 51
Y 4 HK Wharf Holdings General Industrials (32) 27 (15) (74) (16) 4 52 22
Y HKL SP Hongkong Land Real Estate Investment & Serv (57) 57 3 (52) (39) 2 41 37
970 HK Sparkle Roll Group Limited Media (101) 24 (13) (2) (83) 20 20 106
Y 1177 HK Sino Biopharmaceutical Limited Pharmaceuticals & Biotechnolog (10) 83 38 (121) (3) 23 310 20
Note: Our stock pool includes all the Hong Kong listed China companies as well as Nomura covered offshore listed China companies. Pricing as 1 December 2010
Source: Bloomberg, Nomura research
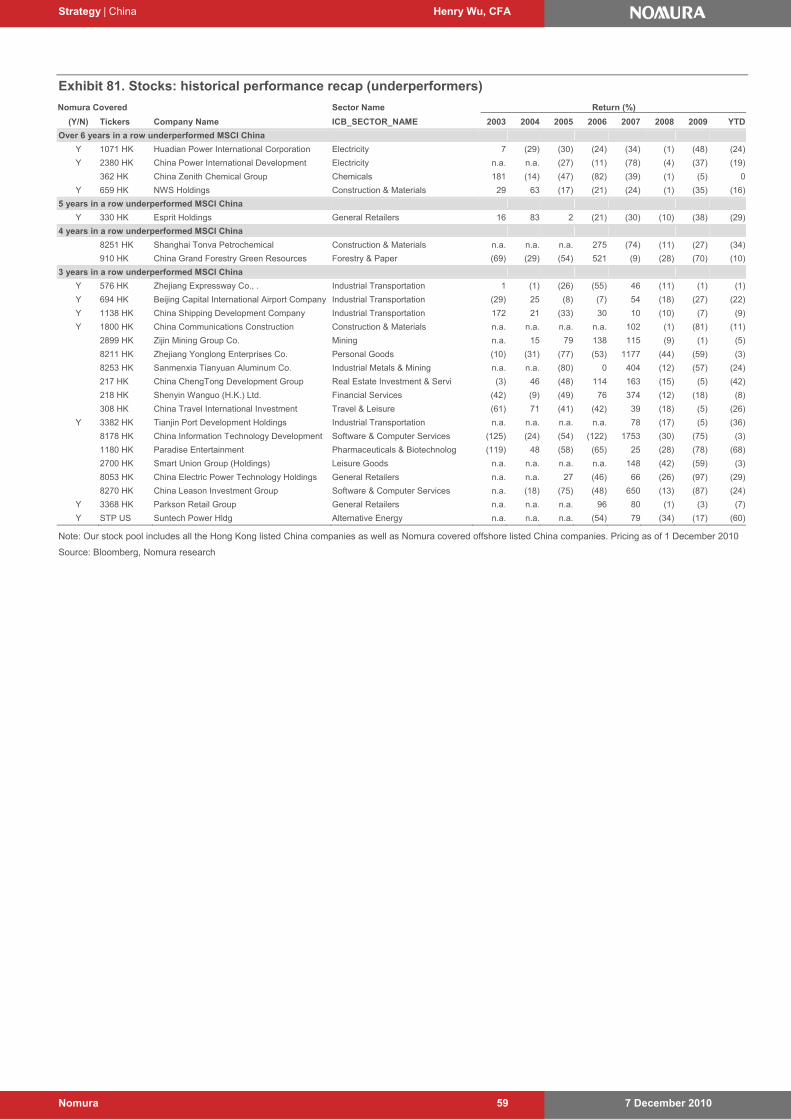
Strategy | China Henry Wu, CFA
7 December 2010 Nomura 59
Exhibit 81. Stocks: historical performance recap (underperformers)
Nomura Covered Sector Name Return (%)
(Y/N) Tickers Company Name ICB_SECTOR_NAME 2003 2004 2005 2006 2007 2008 2009 YTD
Over 6 years in a row underperformed MSCI China
Y 1071 HK Huadian Power International Corporation Electricity 7 (29) (30) (24) (34) (1) (48) (24)
Y 2380 HK China Power International Development Electricity n.a. n.a. (27) (11) (78) (4) (37) (19)
362 HK China Zenith Chemical Group Chemicals 181 (14) (47) (82) (39) (1) (5) 0
Y 659 HK NWS Holdings Construction & Materials 29 63 (17) (21) (24) (1) (35) (16)
5 years in a row underperformed MSCI China
Y 330 HK Esprit Holdings General Retailers 16 83 2 (21) (30) (10) (38) (29)
4 years in a row underperformed MSCI China
8251 HK Shanghai Tonva Petrochemical Construction & Materials n.a. n.a. n.a. 275 (74) (11) (27) (34)
910 HK China Grand Forestry Green Resources Forestry & Paper (69) (29) (54) 521 (9) (28) (70) (10)
3 years in a row underperformed MSCI China
Y 576 HK Zhejiang Expressway Co., . Industrial Transportation 1 (1) (26) (55) 46 (11) (1) (1)
Y 694 HK Beijing Capital International Airport Company Industrial Transportation (29) 25 (8) (7) 54 (18) (27) (22)
Y 1138 HK China Shipping Development Company Industrial Transportation 172 21 (33) 30 10 (10) (7) (9)
Y 1800 HK China Communications Construction Construction & Materials n.a. n.a. n.a. n.a. 102 (1) (81) (11)
2899 HK Zijin Mining Group Co. Mining n.a. 15 79 138 115 (9) (1) (5)
8211 HK Zhejiang Yonglong Enterprises Co. Personal Goods (10) (31) (77) (53) 1177 (44) (59) (3)
8253 HK Sanmenxia Tianyuan Aluminum Co. Industrial Metals & Mining n.a. n.a. (80) 0 404 (12) (57) (24)
217 HK China ChengTong Development Group Real Estate Investment & Servi (3) 46 (48) 114 163 (15) (5) (42)
218 HK Shenyin Wanguo (H.K.) Ltd. Financial Services (42) (9) (49) 76 374 (12) (18) (8)
308 HK China Travel International Investment Travel & Leisure (61) 71 (41) (42) 39 (18) (5) (26)
Y 3382 HK Tianjin Port Development Holdings Industrial Transportation n.a. n.a. n.a. n.a. 78 (17) (5) (36)
8178 HK China Information Technology Development Software & Computer Services (125) (24) (54) (122) 1753 (30) (75) (3)
1180 HK Paradise Entertainment Pharmaceuticals & Biotechnolog (119) 48 (58) (65) 25 (28) (78) (68)
2700 HK Smart Union Group (Holdings) Leisure Goods n.a. n.a. n.a. n.a. 148 (42) (59) (3)
8053 HK China Electric Power Technology Holdings General Retailers n.a. n.a. 27 (46) 66 (26) (97) (29)
8270 HK China Leason Investment Group Software & Computer Services n.a. (18) (75) (48) 650 (13) (87) (24)
Y 3368 HK Parkson Retail Group General Retailers n.a. n.a. n.a. 96 80 (1) (3) (7)
Y STP US Suntech Power Hldg Alternative Energy n.a. n.a. n.a. (54) 79 (34) (17) (60)
Note: Our stock pool includes all the Hong Kong listed China companies as well as Nomura covered offshore listed China companies. Pricing as of 1 December 2010
Source: Bloomberg, Nomura research
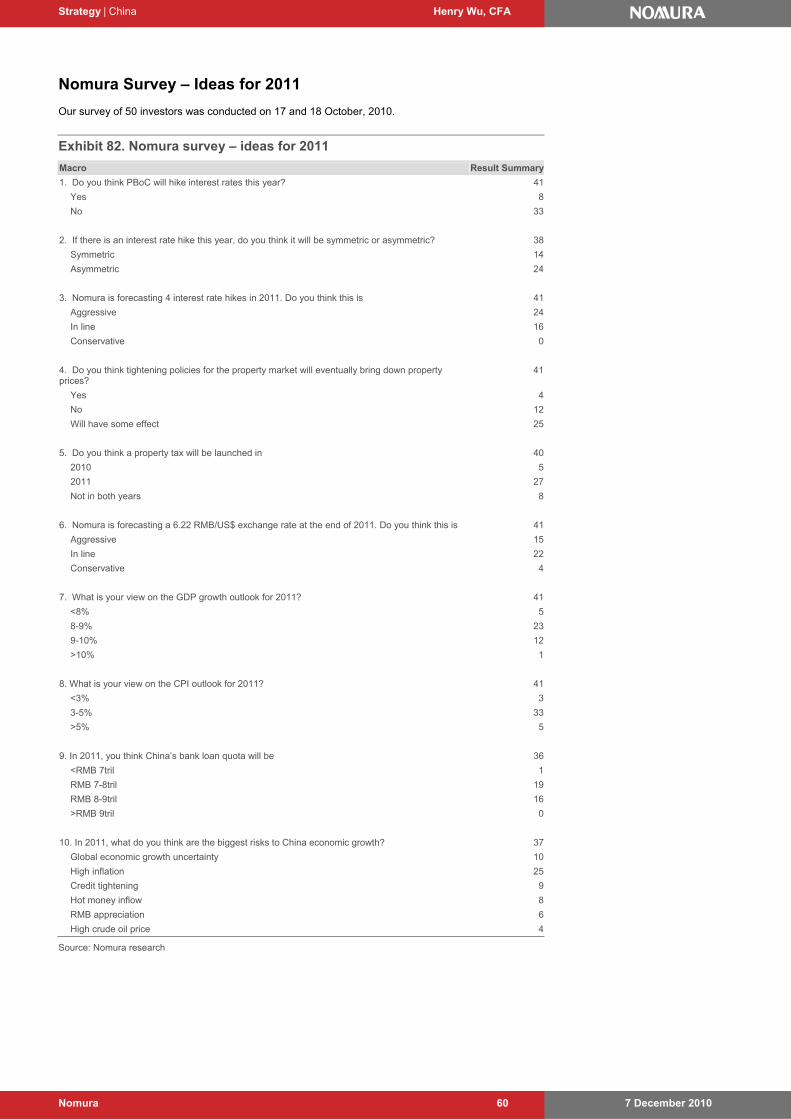
Strategy | China Henry Wu, CFA
7 December 2010 Nomura 60
Nomura Survey – Ideas for 2011 Our survey of 50 investors was conducted on 17 and 18 October, 2010.
Exhibit 82. Nomura survey – ideas for 2011
Macro Result Summary
1. Do you think PBoC will hike interest rates this year? 41
Yes 8
No 33
2. If there is an interest rate hike this year, do you think it will be symmetric or asymmetric? 38
Symmetric 14
Asymmetric 24
3. Nomura is forecasting 4 interest rate hikes in 2011. Do you think this is 41
Aggressive 24
In line 16
Conservative 0
4. Do you think tightening policies for the property market will eventually bring down property prices?
41
Yes 4
No 12
Will have some effect 25
5. Do you think a property tax will be launched in 40
2010 5
2011 27
Not in both years 8
6. Nomura is forecasting a 6.22 RMB/US$ exchange rate at the end of 2011. Do you think this is 41
Aggressive 15
In line 22
Conservative 4
7. What is your view on the GDP growth outlook for 2011? 41
<8% 5
8-9% 23
9-10% 12
>10% 1
8. What is your view on the CPI outlook for 2011? 41
<3% 3
3-5% 33
>5% 5
9. In 2011, you think China’s bank loan quota will be 36
<RMB 7tril 1
RMB 7-8tril 19
RMB 8-9tril 16
>RMB 9tril 0
10. In 2011, what do you think are the biggest risks to China economic growth? 37
Global economic growth uncertainty 10
High inflation 25
Credit tightening 9
Hot money inflow 8
RMB appreciation 6
High crude oil price 4 Source: Nomura research
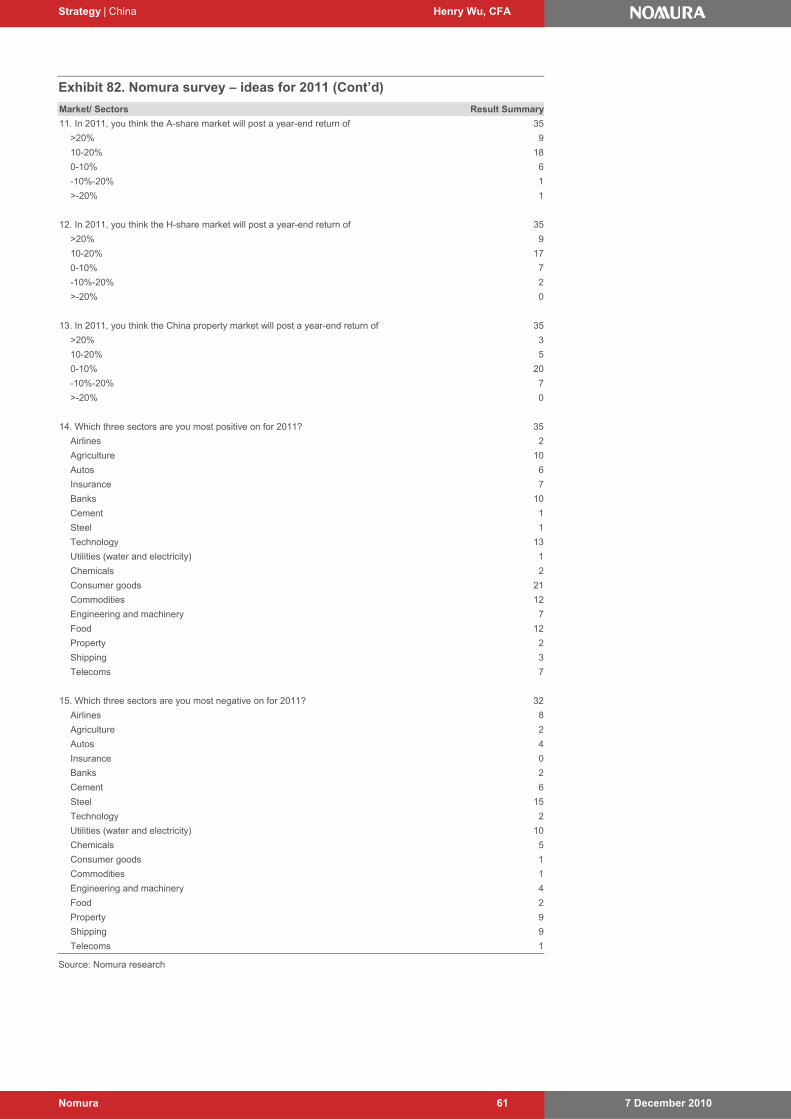
Strategy | China Henry Wu, CFA
7 December 2010 Nomura 61
Exhibit 82. Nomura survey – ideas for 2011 (Cont’d)
Market/ Sectors Result Summary
11. In 2011, you think the A-share market will post a year-end return of 35
>20% 9
10-20% 18
0-10% 6
-10%-20% 1
>-20% 1
12. In 2011, you think the H-share market will post a year-end return of 35
>20% 9
10-20% 17
0-10% 7
-10%-20% 2
>-20% 0
13. In 2011, you think the China property market will post a year-end return of 35
>20% 3
10-20% 5
0-10% 20
-10%-20% 7
>-20% 0
14. Which three sectors are you most positive on for 2011? 35
Airlines 2
Agriculture 10
Autos 6
Insurance 7
Banks 10
Cement 1
Steel 1
Technology 13
Utilities (water and electricity) 1
Chemicals 2
Consumer goods 21
Commodities 12
Engineering and machinery 7
Food 12
Property 2
Shipping 3
Telecoms 7
15. Which three sectors are you most negative on for 2011? 32
Airlines 8
Agriculture 2
Autos 4
Insurance 0
Banks 2
Cement 6
Steel 15
Technology 2
Utilities (water and electricity) 10
Chemicals 5
Consumer goods 1
Commodities 1
Engineering and machinery 4
Food 2
Property 9
Shipping 9
Telecoms 1 Source: Nomura research
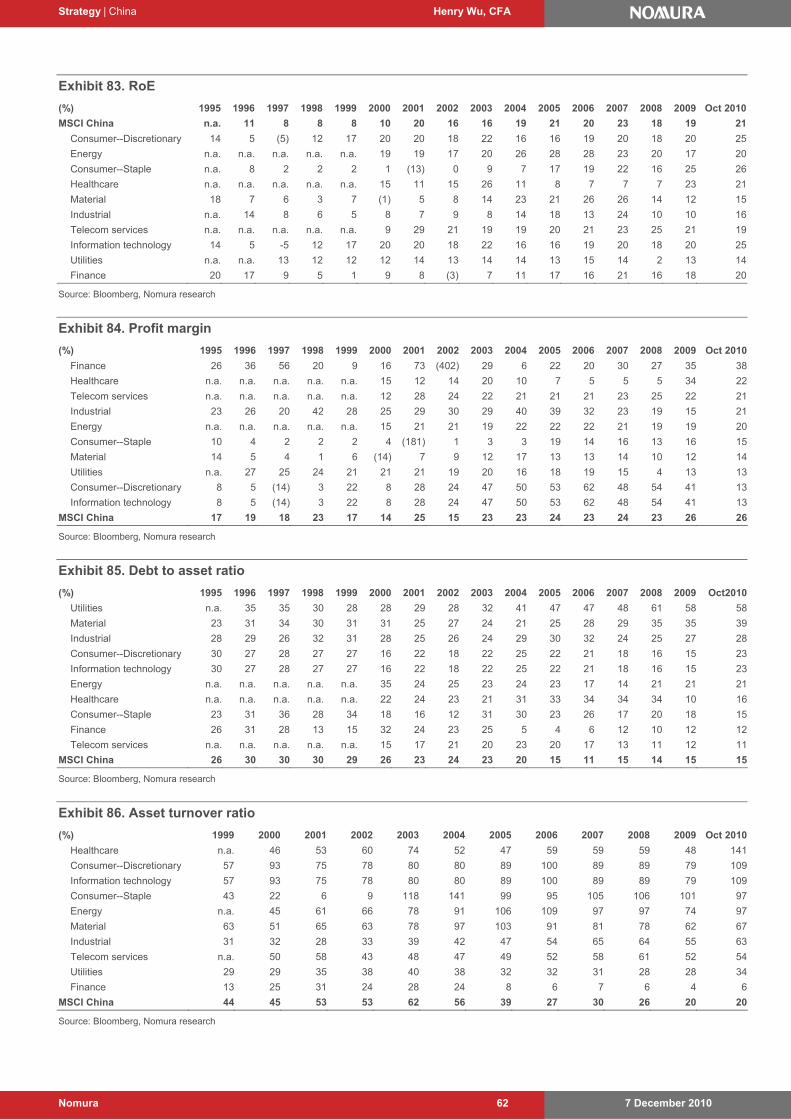
Strategy | China Henry Wu, CFA
7 December 2010 Nomura 62
Exhibit 83. RoE
(%) 1995 1996 1997 1998 1999 2000 2001 2002 2003 2004 2005 2006 2007 2008 2009 Oct 2010
MSCI China n.a. 11 8 8 8 10 20 16 16 19 21 20 23 18 19 21
Consumer--Discretionary 14 5 (5) 12 17 20 20 18 22 16 16 19 20 18 20 25
Energy n.a. n.a. n.a. n.a. n.a. 19 19 17 20 26 28 28 23 20 17 20
Consumer--Staple n.a. 8 2 2 2 1 (13) 0 9 7 17 19 22 16 25 26
Healthcare n.a. n.a. n.a. n.a. n.a. 15 11 15 26 11 8 7 7 7 23 21
Material 18 7 6 3 7 (1) 5 8 14 23 21 26 26 14 12 15
Industrial n.a. 14 8 6 5 8 7 9 8 14 18 13 24 10 10 16
Telecom services n.a. n.a. n.a. n.a. n.a. 9 29 21 19 19 20 21 23 25 21 19
Information technology 14 5 -5 12 17 20 20 18 22 16 16 19 20 18 20 25
Utilities n.a. n.a. 13 12 12 12 14 13 14 14 13 15 14 2 13 14
Finance 20 17 9 5 1 9 8 (3) 7 11 17 16 21 16 18 20
Source: Bloomberg, Nomura research
Exhibit 84. Profit margin
(%) 1995 1996 1997 1998 1999 2000 2001 2002 2003 2004 2005 2006 2007 2008 2009 Oct 2010
Finance 26 36 56 20 9 16 73 (402) 29 6 22 20 30 27 35 38
Healthcare n.a. n.a. n.a. n.a. n.a. 15 12 14 20 10 7 5 5 5 34 22
Telecom services n.a. n.a. n.a. n.a. n.a. 12 28 24 22 21 21 21 23 25 22 21
Industrial 23 26 20 42 28 25 29 30 29 40 39 32 23 19 15 21
Energy n.a. n.a. n.a. n.a. n.a. 15 21 21 19 22 22 22 21 19 19 20
Consumer--Staple 10 4 2 2 2 4 (181) 1 3 3 19 14 16 13 16 15
Material 14 5 4 1 6 (14) 7 9 12 17 13 13 14 10 12 14
Utilities n.a. 27 25 24 21 21 21 19 20 16 18 19 15 4 13 13
Consumer--Discretionary 8 5 (14) 3 22 8 28 24 47 50 53 62 48 54 41 13
Information technology 8 5 (14) 3 22 8 28 24 47 50 53 62 48 54 41 13
MSCI China 17 19 18 23 17 14 25 15 23 23 24 23 24 23 26 26
Source: Bloomberg, Nomura research
Exhibit 85. Debt to asset ratio
(%) 1995 1996 1997 1998 1999 2000 2001 2002 2003 2004 2005 2006 2007 2008 2009 Oct2010
Utilities n.a. 35 35 30 28 28 29 28 32 41 47 47 48 61 58 58
Material 23 31 34 30 31 31 25 27 24 21 25 28 29 35 35 39
Industrial 28 29 26 32 31 28 25 26 24 29 30 32 24 25 27 28
Consumer--Discretionary 30 27 28 27 27 16 22 18 22 25 22 21 18 16 15 23
Information technology 30 27 28 27 27 16 22 18 22 25 22 21 18 16 15 23
Energy n.a. n.a. n.a. n.a. n.a. 35 24 25 23 24 23 17 14 21 21 21
Healthcare n.a. n.a. n.a. n.a. n.a. 22 24 23 21 31 33 34 34 34 10 16
Consumer--Staple 23 31 36 28 34 18 16 12 31 30 23 26 17 20 18 15
Finance 26 31 28 13 15 32 24 23 25 5 4 6 12 10 12 12
Telecom services n.a. n.a. n.a. n.a. n.a. 15 17 21 20 23 20 17 13 11 12 11
MSCI China 26 30 30 30 29 26 23 24 23 20 15 11 15 14 15 15
Source: Bloomberg, Nomura research
Exhibit 86. Asset turnover ratio
(%) 1999 2000 2001 2002 2003 2004 2005 2006 2007 2008 2009 Oct 2010
Healthcare n.a. 46 53 60 74 52 47 59 59 59 48 141
Consumer--Discretionary 57 93 75 78 80 80 89 100 89 89 79 109
Information technology 57 93 75 78 80 80 89 100 89 89 79 109
Consumer--Staple 43 22 6 9 118 141 99 95 105 106 101 97
Energy n.a. 45 61 66 78 91 106 109 97 97 74 97
Material 63 51 65 63 78 97 103 91 81 78 62 67
Industrial 31 32 28 33 39 42 47 54 65 64 55 63
Telecom services n.a. 50 58 43 48 47 49 52 58 61 52 54
Utilities 29 29 35 38 40 38 32 32 31 28 28 34
Finance 13 25 31 24 28 24 8 6 7 6 4 6
MSCI China 44 45 53 53 62 56 39 27 30 26 20 20
Source: Bloomberg, Nomura research
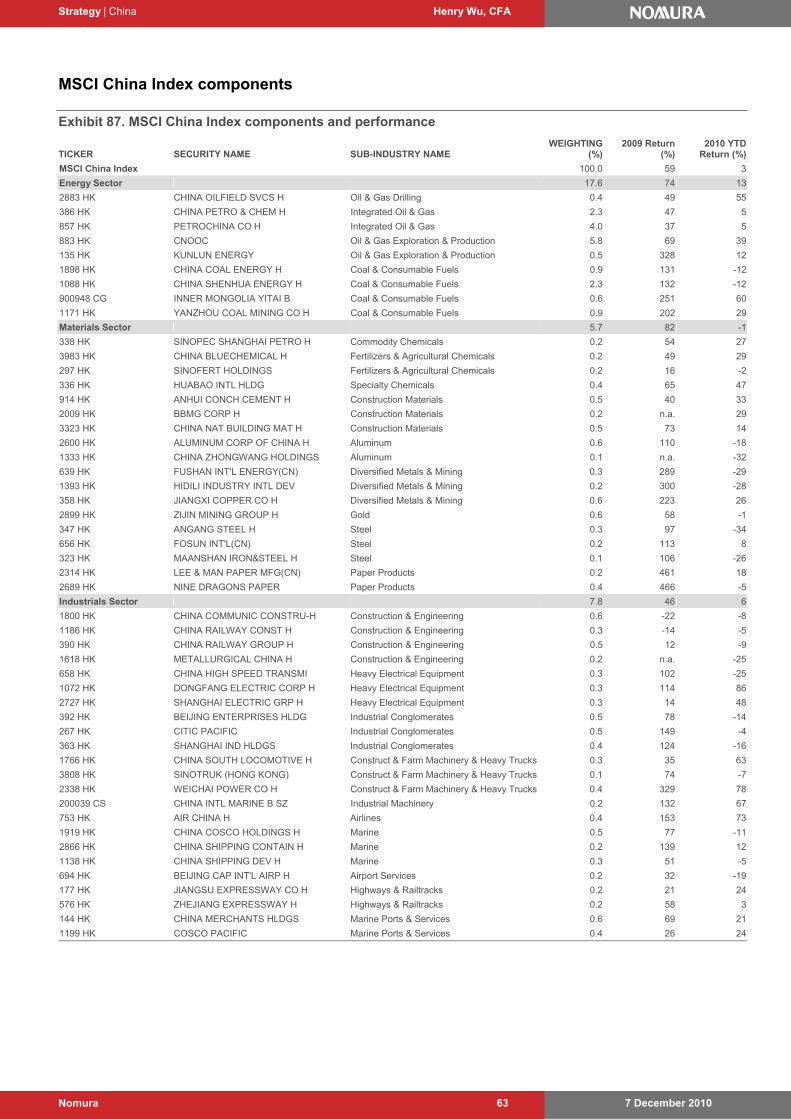
Strategy | China Henry Wu, CFA
7 December 2010 Nomura 63
MSCI China Index components
Exhibit 87. MSCI China Index components and performance
TICKER SECURITY NAME SUB-INDUSTRY NAME WEIGHTING
(%) 2009 Return
(%)2010 YTD
Return (%)
MSCI China Index 100.0 59 3
Energy Sector 17.6 74 13
2883 HK CHINA OILFIELD SVCS H Oil & Gas Drilling 0.4 49 55
386 HK CHINA PETRO & CHEM H Integrated Oil & Gas 2.3 47 5
857 HK PETROCHINA CO H Integrated Oil & Gas 4.0 37 5
883 HK CNOOC Oil & Gas Exploration & Production 5.8 69 39
135 HK KUNLUN ENERGY Oil & Gas Exploration & Production 0.5 328 12
1898 HK CHINA COAL ENERGY H Coal & Consumable Fuels 0.9 131 -12
1088 HK CHINA SHENHUA ENERGY H Coal & Consumable Fuels 2.3 132 -12
900948 CG INNER MONGOLIA YITAI B Coal & Consumable Fuels 0.6 251 60
1171 HK YANZHOU COAL MINING CO H Coal & Consumable Fuels 0.9 202 29
Materials Sector 5.7 82 -1
338 HK SINOPEC SHANGHAI PETRO H Commodity Chemicals 0.2 54 27
3983 HK CHINA BLUECHEMICAL H Fertilizers & Agricultural Chemicals 0.2 49 29
297 HK SINOFERT HOLDINGS Fertilizers & Agricultural Chemicals 0.2 16 -2
336 HK HUABAO INTL HLDG Specialty Chemicals 0.4 65 47
914 HK ANHUI CONCH CEMENT H Construction Materials 0.5 40 33
2009 HK BBMG CORP H Construction Materials 0.2 n.a. 29
3323 HK CHINA NAT BUILDING MAT H Construction Materials 0.5 73 14
2600 HK ALUMINUM CORP OF CHINA H Aluminum 0.6 110 -18
1333 HK CHINA ZHONGWANG HOLDINGS Aluminum 0.1 n.a. -32
639 HK FUSHAN INT'L ENERGY(CN) Diversified Metals & Mining 0.3 289 -29
1393 HK HIDILI INDUSTRY INTL DEV Diversified Metals & Mining 0.2 300 -28
358 HK JIANGXI COPPER CO H Diversified Metals & Mining 0.6 223 26
2899 HK ZIJIN MINING GROUP H Gold 0.6 58 -1
347 HK ANGANG STEEL H Steel 0.3 97 -34
656 HK FOSUN INT'L(CN) Steel 0.2 113 8
323 HK MAANSHAN IRON&STEEL H Steel 0.1 106 -26
2314 HK LEE & MAN PAPER MFG(CN) Paper Products 0.2 461 18
2689 HK NINE DRAGONS PAPER Paper Products 0.4 466 -5
Industrials Sector 7.8 46 6
1800 HK CHINA COMMUNIC CONSTRU-H Construction & Engineering 0.6 -22 -8
1186 HK CHINA RAILWAY CONST H Construction & Engineering 0.3 -14 -5
390 HK CHINA RAILWAY GROUP H Construction & Engineering 0.5 12 -9
1618 HK METALLURGICAL CHINA H Construction & Engineering 0.2 n.a. -25
658 HK CHINA HIGH SPEED TRANSMI Heavy Electrical Equipment 0.3 102 -25
1072 HK DONGFANG ELECTRIC CORP H Heavy Electrical Equipment 0.3 114 86
2727 HK SHANGHAI ELECTRIC GRP H Heavy Electrical Equipment 0.3 14 48
392 HK BEIJING ENTERPRISES HLDG Industrial Conglomerates 0.5 78 -14
267 HK CITIC PACIFIC Industrial Conglomerates 0.5 149 -4
363 HK SHANGHAI IND HLDGS Industrial Conglomerates 0.4 124 -16
1766 HK CHINA SOUTH LOCOMOTIVE H Construct & Farm Machinery & Heavy Trucks 0.3 35 63
3808 HK SINOTRUK (HONG KONG) Construct & Farm Machinery & Heavy Trucks 0.1 74 -7
2338 HK WEICHAI POWER CO H Construct & Farm Machinery & Heavy Trucks 0.4 329 78
200039 CS CHINA INTL MARINE B SZ Industrial Machinery 0.2 132 67
753 HK AIR CHINA H Airlines 0.4 153 73
1919 HK CHINA COSCO HOLDINGS H Marine 0.5 77 -11
2866 HK CHINA SHIPPING CONTAIN H Marine 0.2 139 12
1138 HK CHINA SHIPPING DEV H Marine 0.3 51 -5
694 HK BEIJING CAP INT'L AIRP H Airport Services 0.2 32 -19
177 HK JIANGSU EXPRESSWAY CO H Highways & Railtracks 0.2 21 24
576 HK ZHEJIANG EXPRESSWAY H Highways & Railtracks 0.2 58 3
144 HK CHINA MERCHANTS HLDGS Marine Ports & Services 0.6 69 21
1199 HK COSCO PACIFIC Marine Ports & Services 0.4 26 24
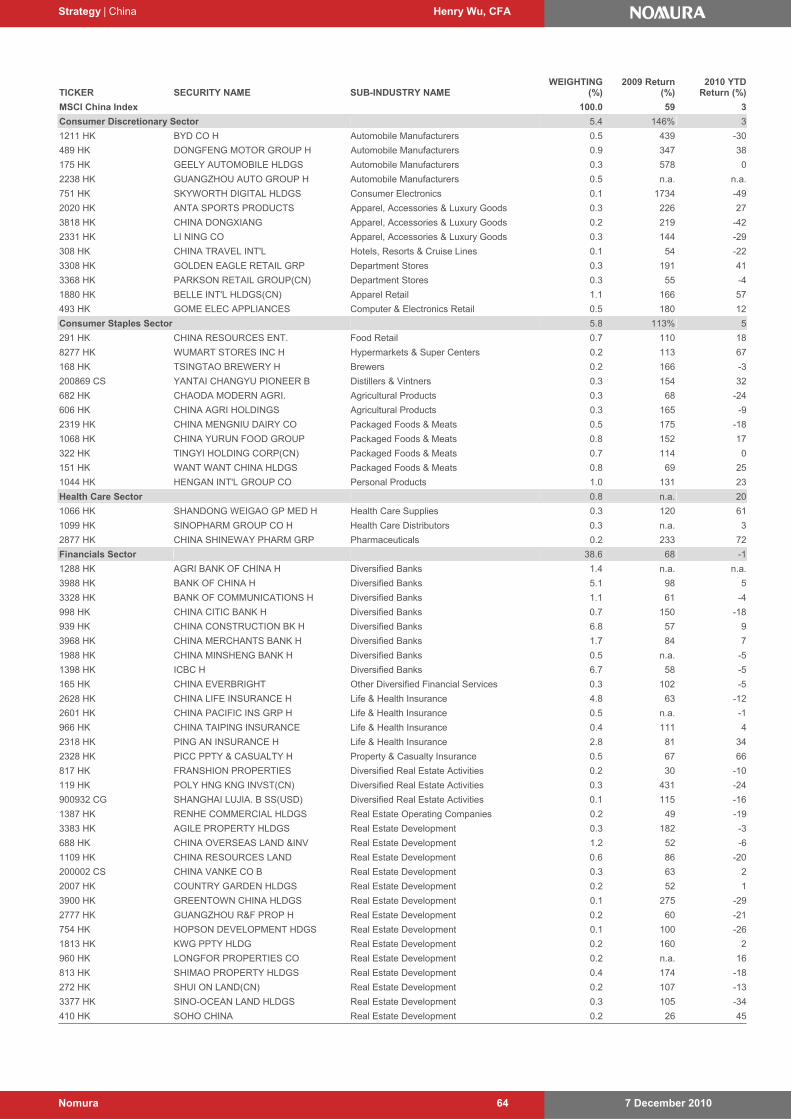
Strategy | China Henry Wu, CFA
7 December 2010 Nomura 64
TICKER SECURITY NAME SUB-INDUSTRY NAME WEIGHTING
(%) 2009 Return
(%)2010 YTD
Return (%)
MSCI China Index 100.0 59 3
Consumer Discretionary Sector 5.4 146% 3
1211 HK BYD CO H Automobile Manufacturers 0.5 439 -30
489 HK DONGFENG MOTOR GROUP H Automobile Manufacturers 0.9 347 38
175 HK GEELY AUTOMOBILE HLDGS Automobile Manufacturers 0.3 578 0
2238 HK GUANGZHOU AUTO GROUP H Automobile Manufacturers 0.5 n.a. n.a.
751 HK SKYWORTH DIGITAL HLDGS Consumer Electronics 0.1 1734 -49
2020 HK ANTA SPORTS PRODUCTS Apparel, Accessories & Luxury Goods 0.3 226 27
3818 HK CHINA DONGXIANG Apparel, Accessories & Luxury Goods 0.2 219 -42
2331 HK LI NING CO Apparel, Accessories & Luxury Goods 0.3 144 -29
308 HK CHINA TRAVEL INT'L Hotels, Resorts & Cruise Lines 0.1 54 -22
3308 HK GOLDEN EAGLE RETAIL GRP Department Stores 0.3 191 41
3368 HK PARKSON RETAIL GROUP(CN) Department Stores 0.3 55 -4
1880 HK BELLE INT'L HLDGS(CN) Apparel Retail 1.1 166 57
493 HK GOME ELEC APPLIANCES Computer & Electronics Retail 0.5 180 12
Consumer Staples Sector 5.8 113% 5
291 HK CHINA RESOURCES ENT. Food Retail 0.7 110 18
8277 HK WUMART STORES INC H Hypermarkets & Super Centers 0.2 113 67
168 HK TSINGTAO BREWERY H Brewers 0.2 166 -3
200869 CS YANTAI CHANGYU PIONEER B Distillers & Vintners 0.3 154 32
682 HK CHAODA MODERN AGRI. Agricultural Products 0.3 68 -24
606 HK CHINA AGRI HOLDINGS Agricultural Products 0.3 165 -9
2319 HK CHINA MENGNIU DAIRY CO Packaged Foods & Meats 0.5 175 -18
1068 HK CHINA YURUN FOOD GROUP Packaged Foods & Meats 0.8 152 17
322 HK TINGYI HOLDING CORP(CN) Packaged Foods & Meats 0.7 114 0
151 HK WANT WANT CHINA HLDGS Packaged Foods & Meats 0.8 69 25
1044 HK HENGAN INT'L GROUP CO Personal Products 1.0 131 23
Health Care Sector 0.8 n.a. 20
1066 HK SHANDONG WEIGAO GP MED H Health Care Supplies 0.3 120 61
1099 HK SINOPHARM GROUP CO H Health Care Distributors 0.3 n.a. 3
2877 HK CHINA SHINEWAY PHARM GRP Pharmaceuticals 0.2 233 72
Financials Sector 38.6 68 -1
1288 HK AGRI BANK OF CHINA H Diversified Banks 1.4 n.a. n.a.
3988 HK BANK OF CHINA H Diversified Banks 5.1 98 5
3328 HK BANK OF COMMUNICATIONS H Diversified Banks 1.1 61 -4
998 HK CHINA CITIC BANK H Diversified Banks 0.7 150 -18
939 HK CHINA CONSTRUCTION BK H Diversified Banks 6.8 57 9
3968 HK CHINA MERCHANTS BANK H Diversified Banks 1.7 84 7
1988 HK CHINA MINSHENG BANK H Diversified Banks 0.5 n.a. -5
1398 HK ICBC H Diversified Banks 6.7 58 -5
165 HK CHINA EVERBRIGHT Other Diversified Financial Services 0.3 102 -5
2628 HK CHINA LIFE INSURANCE H Life & Health Insurance 4.8 63 -12
2601 HK CHINA PACIFIC INS GRP H Life & Health Insurance 0.5 n.a. -1
966 HK CHINA TAIPING INSURANCE Life & Health Insurance 0.4 111 4
2318 HK PING AN INSURANCE H Life & Health Insurance 2.8 81 34
2328 HK PICC PPTY & CASUALTY H Property & Casualty Insurance 0.5 67 66
817 HK FRANSHION PROPERTIES Diversified Real Estate Activities 0.2 30 -10
119 HK POLY HNG KNG INVST(CN) Diversified Real Estate Activities 0.3 431 -24
900932 CG SHANGHAI LUJIA. B SS(USD) Diversified Real Estate Activities 0.1 115 -16
1387 HK RENHE COMMERCIAL HLDGS Real Estate Operating Companies 0.2 49 -19
3383 HK AGILE PROPERTY HLDGS Real Estate Development 0.3 182 -3
688 HK CHINA OVERSEAS LAND &INV Real Estate Development 1.2 52 -6
1109 HK CHINA RESOURCES LAND Real Estate Development 0.6 86 -20
200002 CS CHINA VANKE CO B Real Estate Development 0.3 63 2
2007 HK COUNTRY GARDEN HLDGS Real Estate Development 0.2 52 1
3900 HK GREENTOWN CHINA HLDGS Real Estate Development 0.1 275 -29
2777 HK GUANGZHOU R&F PROP H Real Estate Development 0.2 60 -21
754 HK HOPSON DEVELOPMENT HDGS Real Estate Development 0.1 100 -26
1813 HK KWG PPTY HLDG Real Estate Development 0.2 160 2
960 HK LONGFOR PROPERTIES CO Real Estate Development 0.2 n.a. 16
813 HK SHIMAO PROPERTY HLDGS Real Estate Development 0.4 174 -18
272 HK SHUI ON LAND(CN) Real Estate Development 0.2 107 -13
3377 HK SINO-OCEAN LAND HLDGS Real Estate Development 0.3 105 -34
410 HK SOHO CHINA Real Estate Development 0.2 26 45
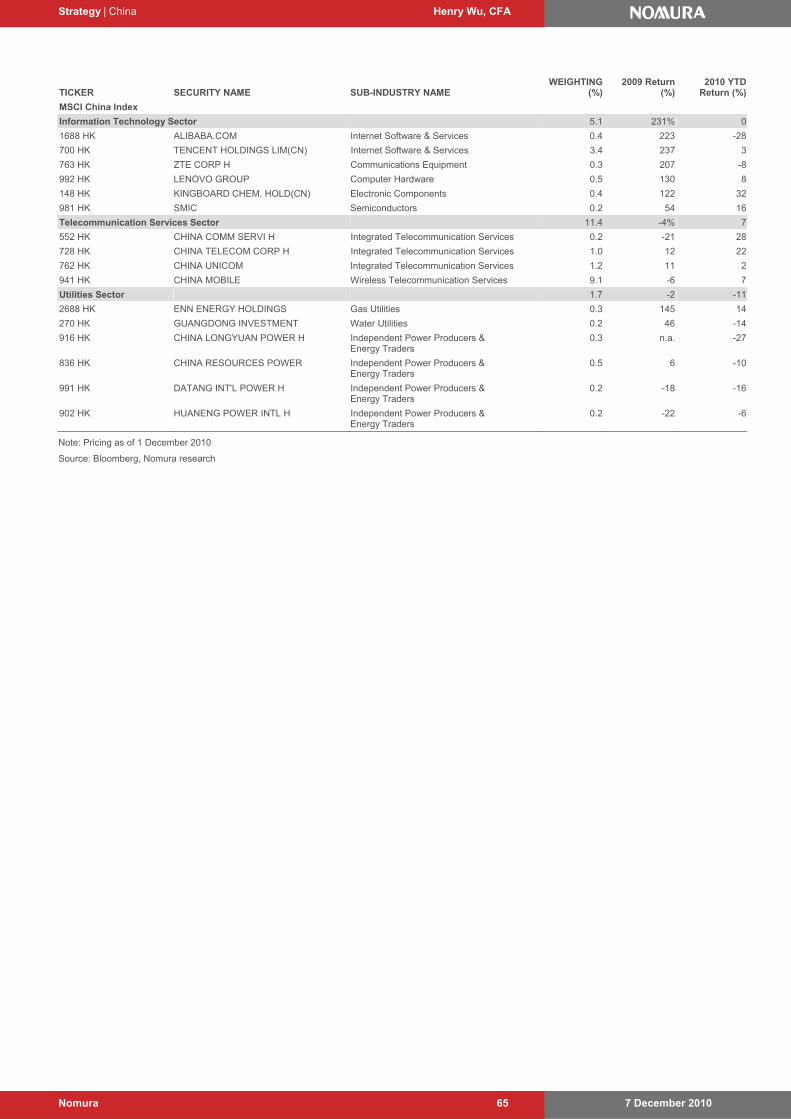
Strategy | China Henry Wu, CFA
7 December 2010 Nomura 65
TICKER SECURITY NAME SUB-INDUSTRY NAME WEIGHTING
(%) 2009 Return
(%)2010 YTD
Return (%)
MSCI China Index
Information Technology Sector 5.1 231% 0
1688 HK ALIBABA.COM Internet Software & Services 0.4 223 -28
700 HK TENCENT HOLDINGS LIM(CN) Internet Software & Services 3.4 237 3
763 HK ZTE CORP H Communications Equipment 0.3 207 -8
992 HK LENOVO GROUP Computer Hardware 0.5 130 8
148 HK KINGBOARD CHEM. HOLD(CN) Electronic Components 0.4 122 32
981 HK SMIC Semiconductors 0.2 54 16
Telecommunication Services Sector 11.4 -4% 7
552 HK CHINA COMM SERVI H Integrated Telecommunication Services 0.2 -21 28
728 HK CHINA TELECOM CORP H Integrated Telecommunication Services 1.0 12 22
762 HK CHINA UNICOM Integrated Telecommunication Services 1.2 11 2
941 HK CHINA MOBILE Wireless Telecommunication Services 9.1 -6 7
Utilities Sector 1.7 -2 -11
2688 HK ENN ENERGY HOLDINGS Gas Utilities 0.3 145 14
270 HK GUANGDONG INVESTMENT Water Utilities 0.2 46 -14
916 HK CHINA LONGYUAN POWER H Independent Power Producers & Energy Traders
0.3 n.a. -27
836 HK CHINA RESOURCES POWER Independent Power Producers & Energy Traders
0.5 6 -10
991 HK DATANG INT'L POWER H Independent Power Producers & Energy Traders
0.2 -18 -16
902 HK HUANENG POWER INTL H Independent Power Producers & Energy Traders
0.2 -22 -6
Note: Pricing as of 1 December 2010
Source: Bloomberg, Nomura research
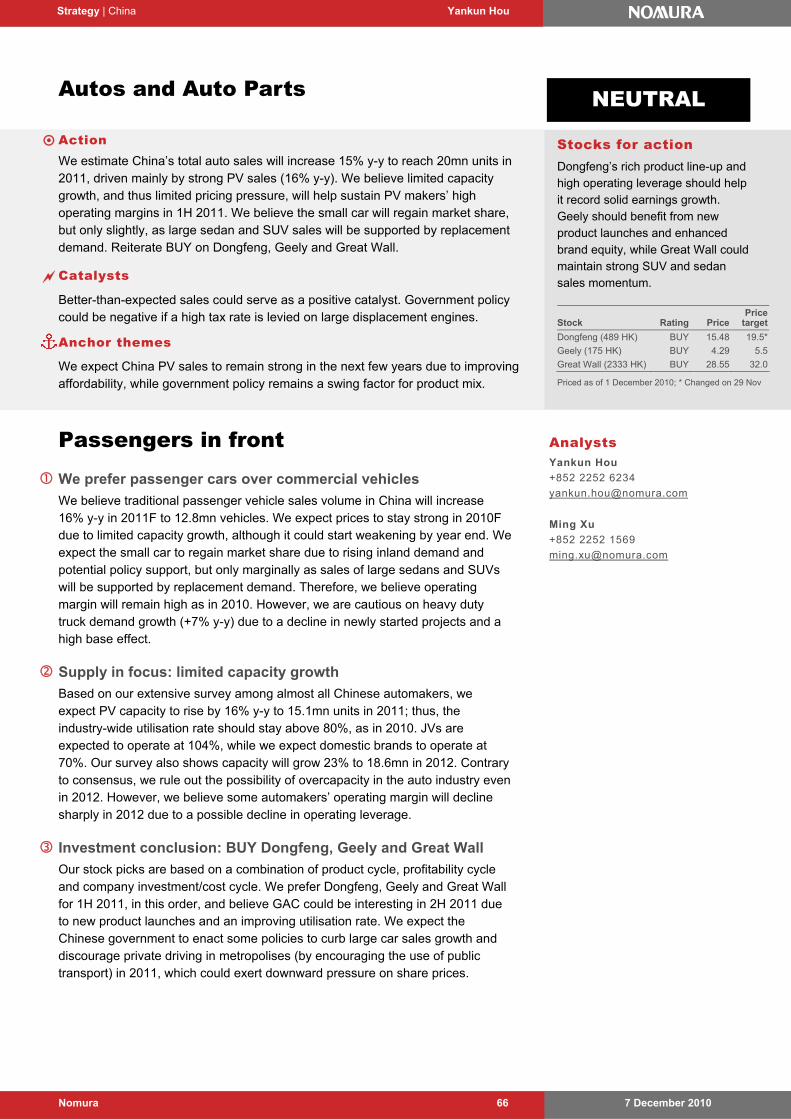
7 December 2010 Nomura 66
Strategy | China Yankun Hou
Autos and Auto Parts
Action We estimate China’s total auto sales will increase 15% y-y to reach 20mn units in
2011, driven mainly by strong PV sales (16% y-y). We believe limited capacity growth, and thus limited pricing pressure, will help sustain PV makers’ high operating margins in 1H 2011. We believe the small car will regain market share, but only slightly, as large sedan and SUV sales will be supported by replacement demand. Reiterate BUY on Dongfeng, Geely and Great Wall.
Catalysts Better-than-expected sales could serve as a positive catalyst. Government policy
could be negative if a high tax rate is levied on large displacement engines.
Anchor themes We expect China PV sales to remain strong in the next few years due to improving
affordability, while government policy remains a swing factor for product mix.
Passengers in front We prefer passenger cars over commercial vehicles
We believe traditional passenger vehicle sales volume in China will increase 16% y-y in 2011F to 12.8mn vehicles. We expect prices to stay strong in 2010F due to limited capacity growth, although it could start weakening by year end. We expect the small car to regain market share due to rising inland demand and potential policy support, but only marginally as sales of large sedans and SUVs will be supported by replacement demand. Therefore, we believe operating margin will remain high as in 2010. However, we are cautious on heavy duty truck demand growth (+7% y-y) due to a decline in newly started projects and a high base effect.
Supply in focus: limited capacity growth
Based on our extensive survey among almost all Chinese automakers, we expect PV capacity to rise by 16% y-y to 15.1mn units in 2011; thus, the industry-wide utilisation rate should stay above 80%, as in 2010. JVs are expected to operate at 104%, while we expect domestic brands to operate at 70%. Our survey also shows capacity will grow 23% to 18.6mn in 2012. Contrary to consensus, we rule out the possibility of overcapacity in the auto industry even in 2012. However, we believe some automakers’ operating margin will decline sharply in 2012 due to a possible decline in operating leverage.
Investment conclusion: BUY Dongfeng, Geely and Great Wall
Our stock picks are based on a combination of product cycle, profitability cycle and company investment/cost cycle. We prefer Dongfeng, Geely and Great Wall for 1H 2011, in this order, and believe GAC could be interesting in 2H 2011 due to new product launches and an improving utilisation rate. We expect the Chinese government to enact some policies to curb large car sales growth and discourage private driving in metropolises (by encouraging the use of public transport) in 2011, which could exert downward pressure on share prices.
Stocks for action Dongfeng’s rich product line-up and high operating leverage should help it record solid earnings growth. Geely should benefit from new product launches and enhanced brand equity, while Great Wall could maintain strong SUV and sedan sales momentum.
NEUTRAL
Analysts Yankun Hou
+852 2252 6234
Ming Xu
+852 2252 1569
Stock Rating Price Price
target
Dongfeng (489 HK) BUY 15.48 19.5*
Geely (175 HK) BUY 4.29 5.5
Great Wall (2333 HK) BUY 28.55 32.0
Priced as of 1 December 2010; * Changed on 29 Nov
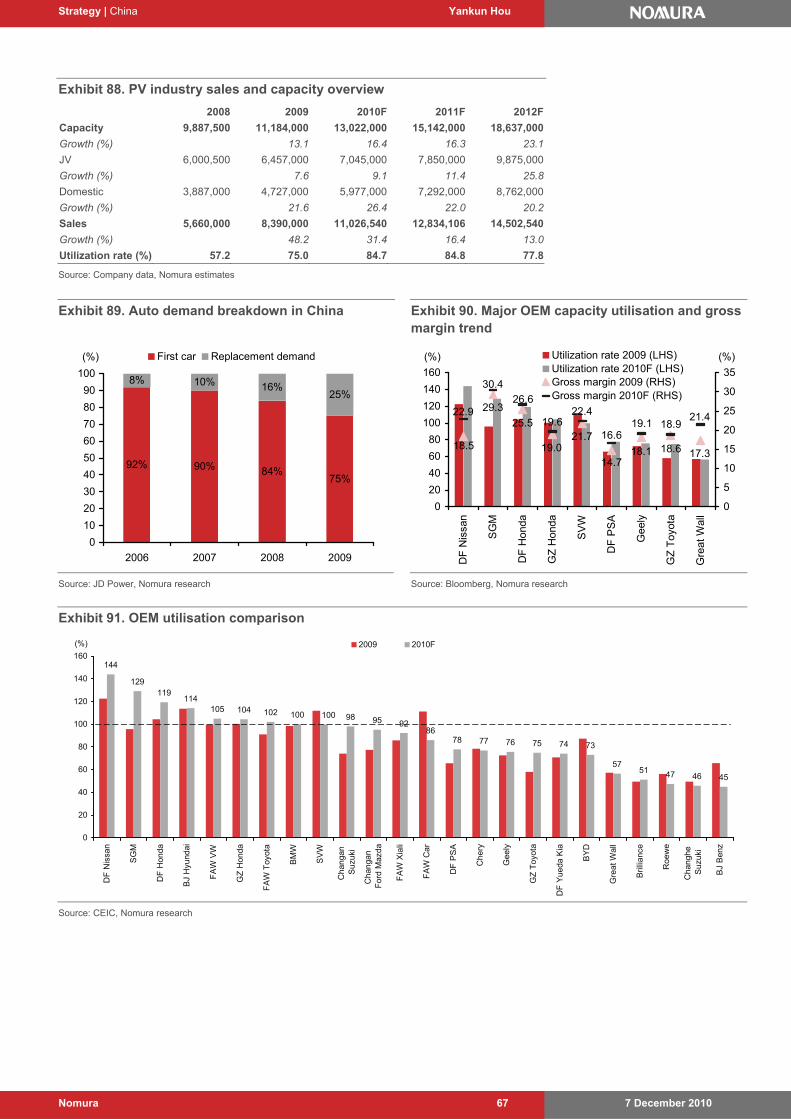
Strategy | China Yankun Hou
7 December 2010 Nomura 67
Exhibit 88. PV industry sales and capacity overview
2008 2009 2010F 2011F 2012F
Capacity 9,887,500 11,184,000 13,022,000 15,142,000 18,637,000
Growth (%) 13.1 16.4 16.3 23.1
JV 6,000,500 6,457,000 7,045,000 7,850,000 9,875,000
Growth (%) 7.6 9.1 11.4 25.8
Domestic 3,887,000 4,727,000 5,977,000 7,292,000 8,762,000
Growth (%) 21.6 26.4 22.0 20.2
Sales 5,660,000 8,390,000 11,026,540 12,834,106 14,502,540
Growth (%) 48.2 31.4 16.4 13.0
Utilization rate (%) 57.2 75.0 84.7 84.8 77.8
Source: Company data, Nomura estimates
Exhibit 89. Auto demand breakdown in China
92% 90% 84%75%
8% 10% 16%25%
0
10
20
30
40
50
60
70
80
90
100
2006 2007 2008 2009
First car Replacement demand(%)
Source: JD Power, Nomura research
Exhibit 90. Major OEM capacity utilisation and gross margin trend
18.5
29.3
25.5
19.021.7
14.718.1 18.6 17.3
21.418.919.1
16.6
22.419.6
26.6
30.4
22.9
0
20
40
60
80
100
120
140
160
DF
Nis
san
SG
M
DF
Hon
da
GZ
Hon
da
SV
W
DF
PS
A
Gee
ly
GZ
Toy
ota
Gre
at W
all
0
5
10
15
20
25
30
35
Utilization rate 2009 (LHS)Utilization rate 2010F (LHS)Gross margin 2009 (RHS)Gross margin 2010F (RHS)
(%) (%)
Source: Bloomberg, Nomura research
Exhibit 91. OEM utilisation comparison
144
129119
114105 104 102 100 98 95 92
78 77 76 75 74
5751 47 46 45
73
86
100
0
20
40
60
80
100
120
140
160
DF
Nis
san
SG
M
DF
Hon
da
BJ
Hyu
ndai
FA
W V
W
GZ
Hon
da
FA
W T
oyot
a
BM
W
SV
W
Cha
ngan
S
uzuk
i
Cha
ngan
F
ord
Maz
da
FA
W X
iali
FA
W C
ar
DF
PS
A
Che
ry
Gee
ly
GZ
Toy
ota
DF
Yue
da K
ia
BY
D
Gre
at W
all
Bril
lianc
e
Roe
we
Cha
nghe
S
uzuk
i
BJ
Ben
z
2009 2010F(%)
Source: CEIC, Nomura research
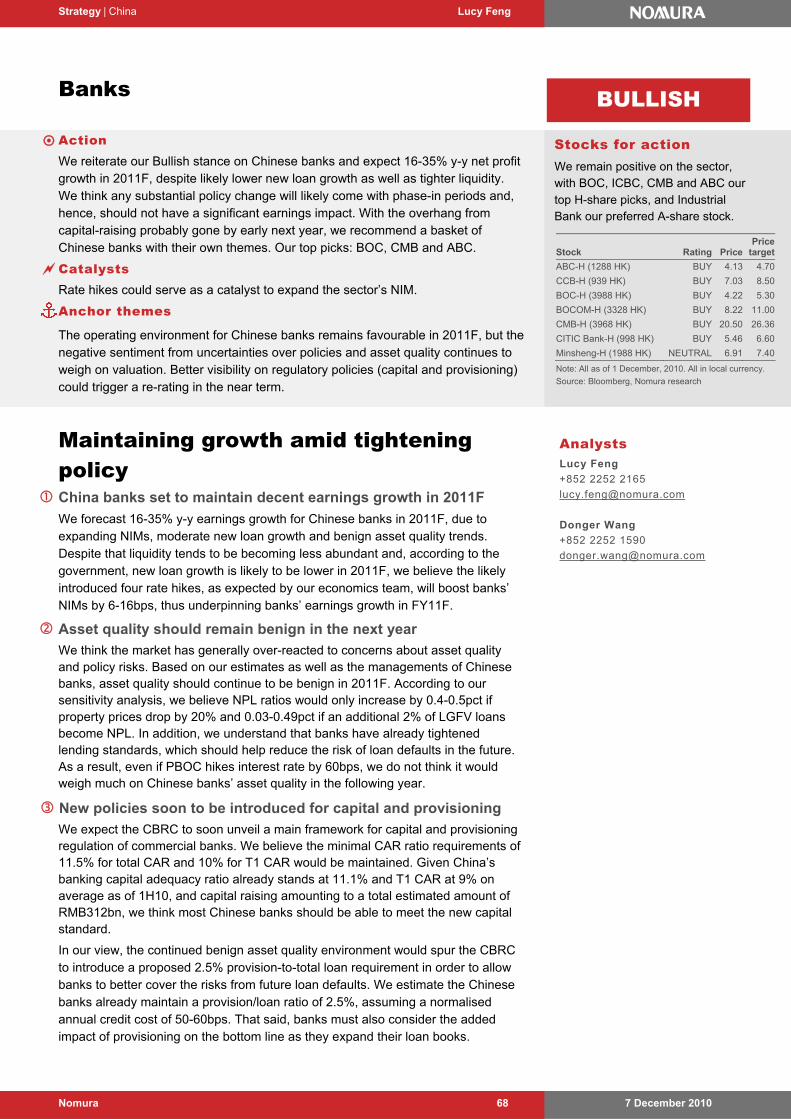
Strategy | China Lucy Feng
7 December 2010 Nomura 68
Banks
Action We reiterate our Bullish stance on Chinese banks and expect 16-35% y-y net profit
growth in 2011F, despite likely lower new loan growth as well as tighter liquidity. We think any substantial policy change will likely come with phase-in periods and, hence, should not have a significant earnings impact. With the overhang from capital-raising probably gone by early next year, we recommend a basket of Chinese banks with their own themes. Our top picks: BOC, CMB and ABC.
Catalysts Rate hikes could serve as a catalyst to expand the sector’s NIM.
Anchor themes
The operating environment for Chinese banks remains favourable in 2011F, but the negative sentiment from uncertainties over policies and asset quality continues to weigh on valuation. Better visibility on regulatory policies (capital and provisioning) could trigger a re-rating in the near term.
Maintaining growth amid tightening policy
China banks set to maintain decent earnings growth in 2011F
We forecast 16-35% y-y earnings growth for Chinese banks in 2011F, due to expanding NIMs, moderate new loan growth and benign asset quality trends. Despite that liquidity tends to be becoming less abundant and, according to the government, new loan growth is likely to be lower in 2011F, we believe the likely introduced four rate hikes, as expected by our economics team, will boost banks’ NIMs by 6-16bps, thus underpinning banks’ earnings growth in FY11F.
Asset quality should remain benign in the next year
We think the market has generally over-reacted to concerns about asset quality and policy risks. Based on our estimates as well as the managements of Chinese banks, asset quality should continue to be benign in 2011F. According to our sensitivity analysis, we believe NPL ratios would only increase by 0.4-0.5pct if property prices drop by 20% and 0.03-0.49pct if an additional 2% of LGFV loans become NPL. In addition, we understand that banks have already tightened lending standards, which should help reduce the risk of loan defaults in the future. As a result, even if PBOC hikes interest rate by 60bps, we do not think it would weigh much on Chinese banks’ asset quality in the following year.
New policies soon to be introduced for capital and provisioning
We expect the CBRC to soon unveil a main framework for capital and provisioning regulation of commercial banks. We believe the minimal CAR ratio requirements of 11.5% for total CAR and 10% for T1 CAR would be maintained. Given China’s banking capital adequacy ratio already stands at 11.1% and T1 CAR at 9% on average as of 1H10, and capital raising amounting to a total estimated amount of RMB312bn, we think most Chinese banks should be able to meet the new capital standard.
In our view, the continued benign asset quality environment would spur the CBRC to introduce a proposed 2.5% provision-to-total loan requirement in order to allow banks to better cover the risks from future loan defaults. We estimate the Chinese banks already maintain a provision/loan ratio of 2.5%, assuming a normalised annual credit cost of 50-60bps. That said, banks must also consider the added impact of provisioning on the bottom line as they expand their loan books.
Analysts Lucy Feng
+852 2252 2165
Donger Wang
+852 2252 1590
Stocks for action We remain positive on the sector, with BOC, ICBC, CMB and ABC our top H-share picks, and Industrial Bank our preferred A-share stock.
BULLISH
Stock Rating PricePrice
target
ABC-H (1288 HK) BUY 4.13 4.70
CCB-H (939 HK) BUY 7.03 8.50
BOC-H (3988 HK) BUY 4.22 5.30
BOCOM-H (3328 HK) BUY 8.22 11.00
CMB-H (3968 HK) BUY 20.50 26.36
CITIC Bank-H (998 HK) BUY 5.46 6.60
Minsheng-H (1988 HK) NEUTRAL 6.91 7.40
Note: All as of 1 December, 2010. All in local currency.
Source: Bloomberg, Nomura research
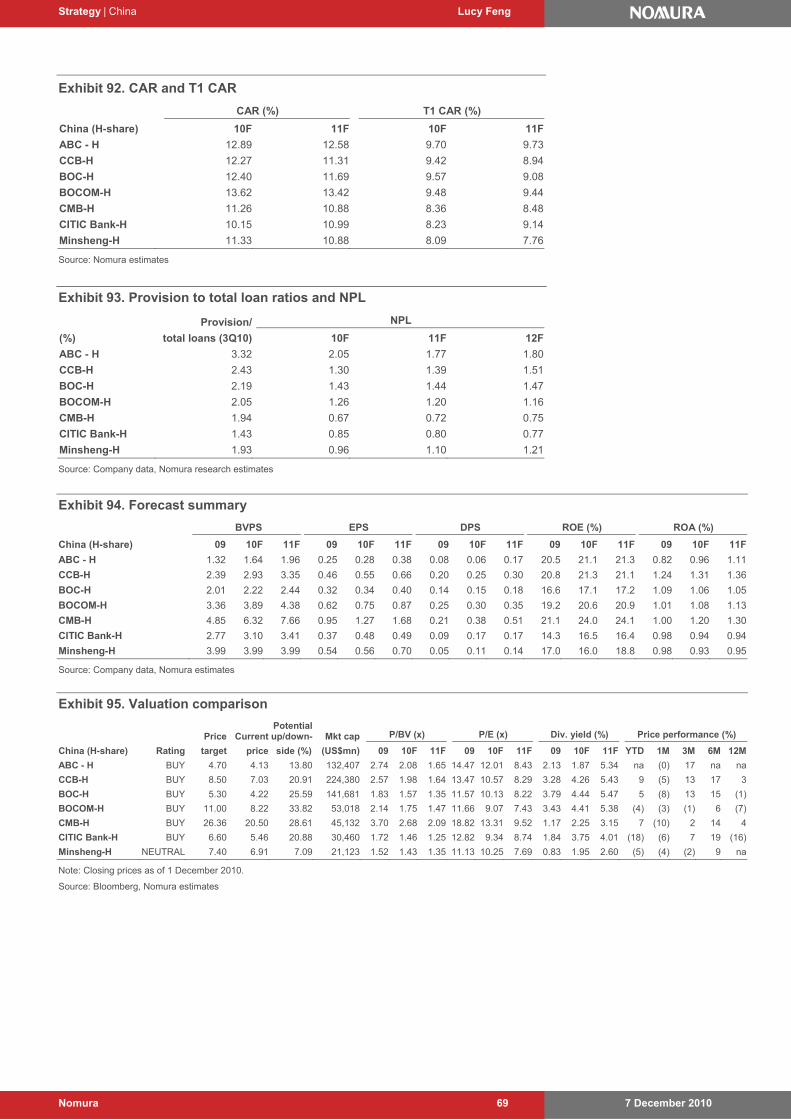
Strategy | China Lucy Feng
7 December 2010 Nomura 69
Exhibit 92. CAR and T1 CAR
CAR (%) T1 CAR (%)
China (H-share) 10F 11F 10F 11F
ABC - H 12.89 12.58 9.70 9.73
CCB-H 12.27 11.31 9.42 8.94
BOC-H 12.40 11.69 9.57 9.08
BOCOM-H 13.62 13.42 9.48 9.44
CMB-H 11.26 10.88 8.36 8.48
CITIC Bank-H 10.15 10.99 8.23 9.14
Minsheng-H 11.33 10.88 8.09 7.76
Source: Nomura estimates
Exhibit 93. Provision to total loan ratios and NPL
Provision/ NPL
(%) total loans (3Q10) 10F 11F 12F
ABC - H 3.32 2.05 1.77 1.80
CCB-H 2.43 1.30 1.39 1.51
BOC-H 2.19 1.43 1.44 1.47
BOCOM-H 2.05 1.26 1.20 1.16
CMB-H 1.94 0.67 0.72 0.75
CITIC Bank-H 1.43 0.85 0.80 0.77
Minsheng-H 1.93 0.96 1.10 1.21
Source: Company data, Nomura research estimates
Exhibit 94. Forecast summary
BVPS EPS DPS ROE (%) ROA (%)
China (H-share) 09 10F 11F 09 10F 11F 09 10F 11F 09 10F 11F 09 10F 11F
ABC - H 1.32 1.64 1.96 0.25 0.28 0.38 0.08 0.06 0.17 20.5 21.1 21.3 0.82 0.96 1.11
CCB-H 2.39 2.93 3.35 0.46 0.55 0.66 0.20 0.25 0.30 20.8 21.3 21.1 1.24 1.31 1.36
BOC-H 2.01 2.22 2.44 0.32 0.34 0.40 0.14 0.15 0.18 16.6 17.1 17.2 1.09 1.06 1.05
BOCOM-H 3.36 3.89 4.38 0.62 0.75 0.87 0.25 0.30 0.35 19.2 20.6 20.9 1.01 1.08 1.13
CMB-H 4.85 6.32 7.66 0.95 1.27 1.68 0.21 0.38 0.51 21.1 24.0 24.1 1.00 1.20 1.30
CITIC Bank-H 2.77 3.10 3.41 0.37 0.48 0.49 0.09 0.17 0.17 14.3 16.5 16.4 0.98 0.94 0.94
Minsheng-H 3.99 3.99 3.99 0.54 0.56 0.70 0.05 0.11 0.14 17.0 16.0 18.8 0.98 0.93 0.95
Source: Company data, Nomura estimates
Exhibit 95. Valuation comparison
Price Current
Potential up/down- Mkt cap P/BV (x) P/E (x) Div. yield (%) Price performance (%)
China (H-share) Rating target price side (%) (US$mn) 09 10F 11F 09 10F 11F 09 10F 11F YTD 1M 3M 6M 12M
ABC - H BUY 4.70 4.13 13.80 132,407 2.74 2.08 1.65 14.47 12.01 8.43 2.13 1.87 5.34 na (0) 17 na na
CCB-H BUY 8.50 7.03 20.91 224,380 2.57 1.98 1.64 13.47 10.57 8.29 3.28 4.26 5.43 9 (5) 13 17 3
BOC-H BUY 5.30 4.22 25.59 141,681 1.83 1.57 1.35 11.57 10.13 8.22 3.79 4.44 5.47 5 (8) 13 15 (1)
BOCOM-H BUY 11.00 8.22 33.82 53,018 2.14 1.75 1.47 11.66 9.07 7.43 3.43 4.41 5.38 (4) (3) (1) 6 (7)
CMB-H BUY 26.36 20.50 28.61 45,132 3.70 2.68 2.09 18.82 13.31 9.52 1.17 2.25 3.15 7 (10) 2 14 4
CITIC Bank-H BUY 6.60 5.46 20.88 30,460 1.72 1.46 1.25 12.82 9.34 8.74 1.84 3.75 4.01 (18) (6) 7 19 (16)
Minsheng-H NEUTRAL 7.40 6.91 7.09 21,123 1.52 1.43 1.35 11.13 10.25 7.69 0.83 1.95 2.60 (5) (4) (2) 9 na
Note: Closing prices as of 1 December 2010.
Source: Bloomberg, Nomura estimates
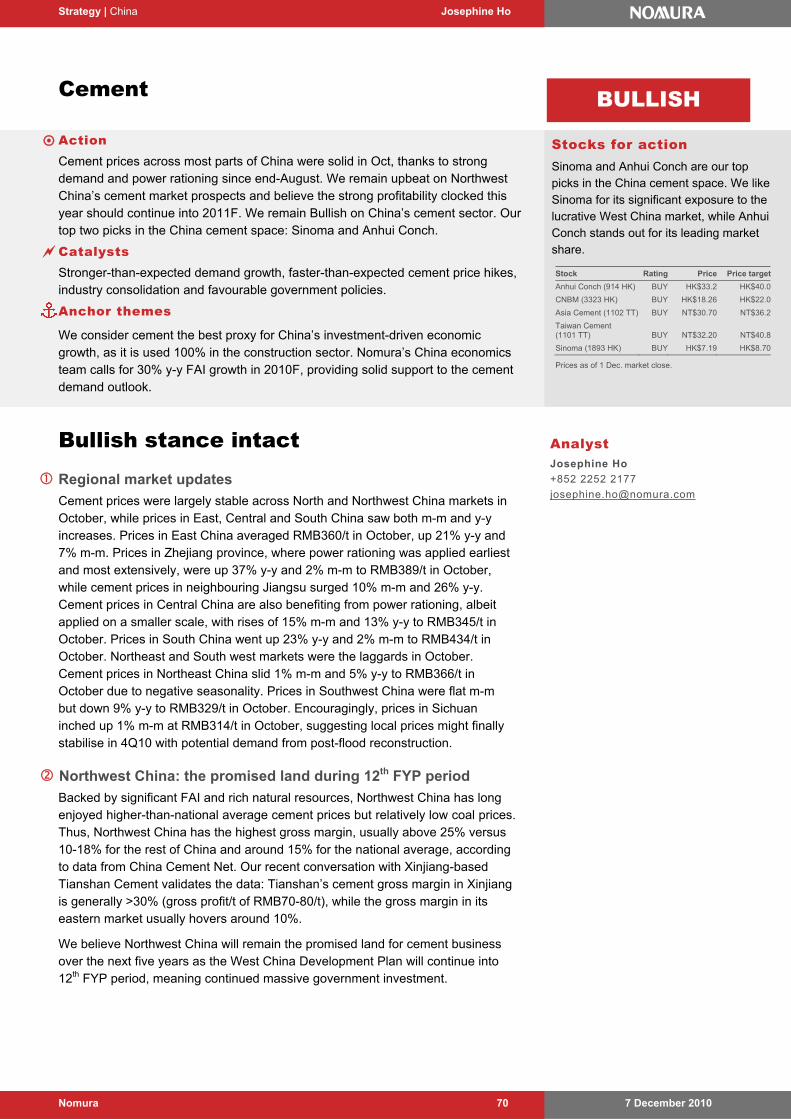
Strategy | China Josephine Ho
7 December 2010 Nomura 70
Cement
Action Cement prices across most parts of China were solid in Oct, thanks to strong
demand and power rationing since end-August. We remain upbeat on Northwest China’s cement market prospects and believe the strong profitability clocked this year should continue into 2011F. We remain Bullish on China’s cement sector. Our top two picks in the China cement space: Sinoma and Anhui Conch.
Catalysts Stronger-than-expected demand growth, faster-than-expected cement price hikes,
industry consolidation and favourable government policies.
Anchor themes
We consider cement the best proxy for China’s investment-driven economic growth, as it is used 100% in the construction sector. Nomura’s China economics team calls for 30% y-y FAI growth in 2010F, providing solid support to the cement demand outlook.
Bullish stance intact Regional market updates
Cement prices were largely stable across North and Northwest China markets in October, while prices in East, Central and South China saw both m-m and y-y increases. Prices in East China averaged RMB360/t in October, up 21% y-y and 7% m-m. Prices in Zhejiang province, where power rationing was applied earliest and most extensively, were up 37% y-y and 2% m-m to RMB389/t in October, while cement prices in neighbouring Jiangsu surged 10% m-m and 26% y-y. Cement prices in Central China are also benefiting from power rationing, albeit applied on a smaller scale, with rises of 15% m-m and 13% y-y to RMB345/t in October. Prices in South China went up 23% y-y and 2% m-m to RMB434/t in October. Northeast and South west markets were the laggards in October. Cement prices in Northeast China slid 1% m-m and 5% y-y to RMB366/t in October due to negative seasonality. Prices in Southwest China were flat m-m but down 9% y-y to RMB329/t in October. Encouragingly, prices in Sichuan inched up 1% m-m at RMB314/t in October, suggesting local prices might finally stabilise in 4Q10 with potential demand from post-flood reconstruction.
Northwest China: the promised land during 12th FYP period
Backed by significant FAI and rich natural resources, Northwest China has long enjoyed higher-than-national average cement prices but relatively low coal prices. Thus, Northwest China has the highest gross margin, usually above 25% versus 10-18% for the rest of China and around 15% for the national average, according to data from China Cement Net. Our recent conversation with Xinjiang-based Tianshan Cement validates the data: Tianshan’s cement gross margin in Xinjiang is generally >30% (gross profit/t of RMB70-80/t), while the gross margin in its eastern market usually hovers around 10%.
We believe Northwest China will remain the promised land for cement business over the next five years as the West China Development Plan will continue into 12th FYP period, meaning continued massive government investment.
Analyst Josephine Ho
+852 2252 2177
Stocks for action Sinoma and Anhui Conch are our top picks in the China cement space. We like Sinoma for its significant exposure to the lucrative West China market, while Anhui Conch stands out for its leading market share.
BULLISH
Stock Rating Price Price target
Anhui Conch (914 HK) BUY HK$33.2 HK$40.0
CNBM (3323 HK) BUY HK$18.26 HK$22.0
Asia Cement (1102 TT) BUY NT$30.70 NT$36.2
Taiwan Cement (1101 TT) BUY NT$32.20 NT$40.8
Sinoma (1893 HK) BUY HK$7.19 HK$8.70
Prices as of 1 Dec. market close.
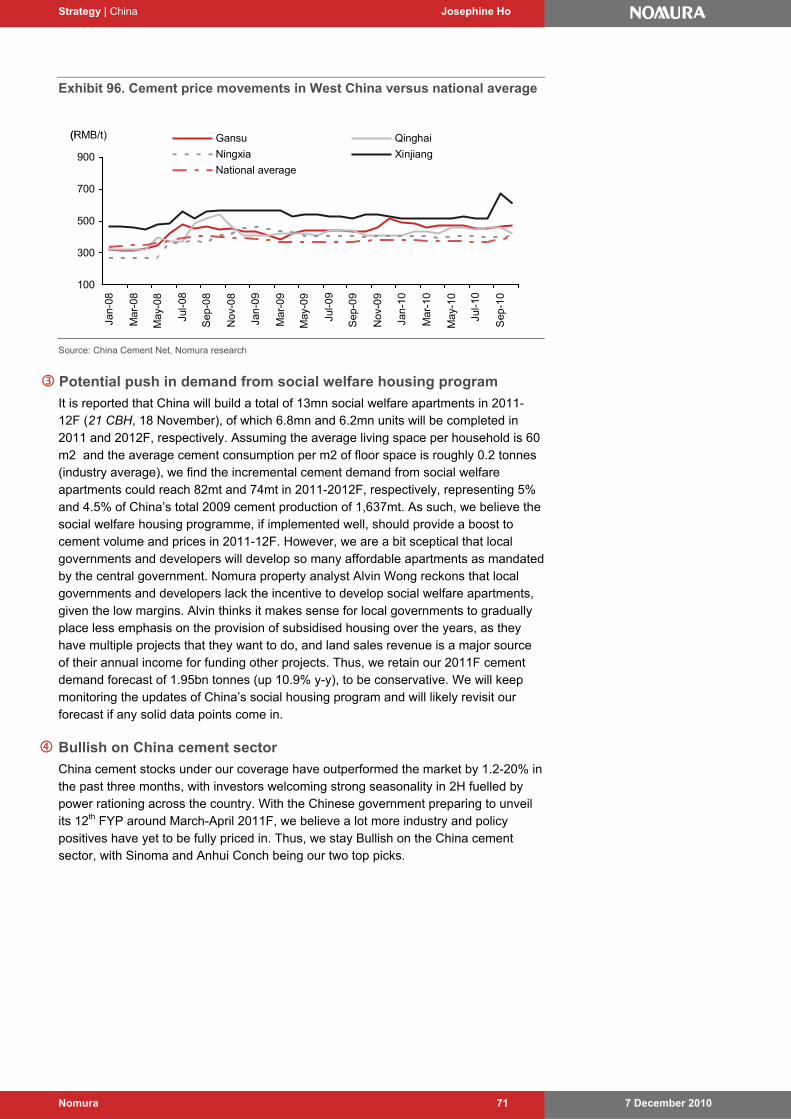
Strategy | China Josephine Ho
7 December 2010 Nomura 71
Exhibit 96. Cement price movements in West China versus national average
100
300
500
700
900
Jan-
08
Mar
-08
May
-08
Jul-0
8
Sep
-08
Nov
-08
Jan-
09
Mar
-09
May
-09
Jul-0
9
Sep
-09
Nov
-09
Jan-
10
Mar
-10
May
-10
Jul-1
0
Sep
-10
(RMB/t) Gansu Qinghai
Ningxia Xinjiang
National average
100
300
500
700
900
Jan-
08
Mar
-08
May
-08
Jul-0
8
Sep
-08
Nov
-08
Jan-
09
Mar
-09
May
-09
Jul-0
9
Sep
-09
Nov
-09
Jan-
10
Mar
-10
May
-10
Jul-1
0
Sep
-10
(RMB/t) Gansu Qinghai
Ningxia Xinjiang
National average
Source: China Cement Net, Nomura research
Potential push in demand from social welfare housing program
It is reported that China will build a total of 13mn social welfare apartments in 2011-12F (21 CBH, 18 November), of which 6.8mn and 6.2mn units will be completed in 2011 and 2012F, respectively. Assuming the average living space per household is 60 m2 and the average cement consumption per m2 of floor space is roughly 0.2 tonnes (industry average), we find the incremental cement demand from social welfare apartments could reach 82mt and 74mt in 2011-2012F, respectively, representing 5% and 4.5% of China’s total 2009 cement production of 1,637mt. As such, we believe the social welfare housing programme, if implemented well, should provide a boost to cement volume and prices in 2011-12F. However, we are a bit sceptical that local governments and developers will develop so many affordable apartments as mandated by the central government. Nomura property analyst Alvin Wong reckons that local governments and developers lack the incentive to develop social welfare apartments, given the low margins. Alvin thinks it makes sense for local governments to gradually place less emphasis on the provision of subsidised housing over the years, as they have multiple projects that they want to do, and land sales revenue is a major source of their annual income for funding other projects. Thus, we retain our 2011F cement demand forecast of 1.95bn tonnes (up 10.9% y-y), to be conservative. We will keep monitoring the updates of China’s social housing program and will likely revisit our forecast if any solid data points come in.
Bullish on China cement sector
China cement stocks under our coverage have outperformed the market by 1.2-20% in the past three months, with investors welcoming strong seasonality in 2H fuelled by power rationing across the country. With the Chinese government preparing to unveil its 12th FYP around March-April 2011F, we believe a lot more industry and policy positives have yet to be fully priced in. Thus, we stay Bullish on the China cement sector, with Sinoma and Anhui Conch being our two top picks.
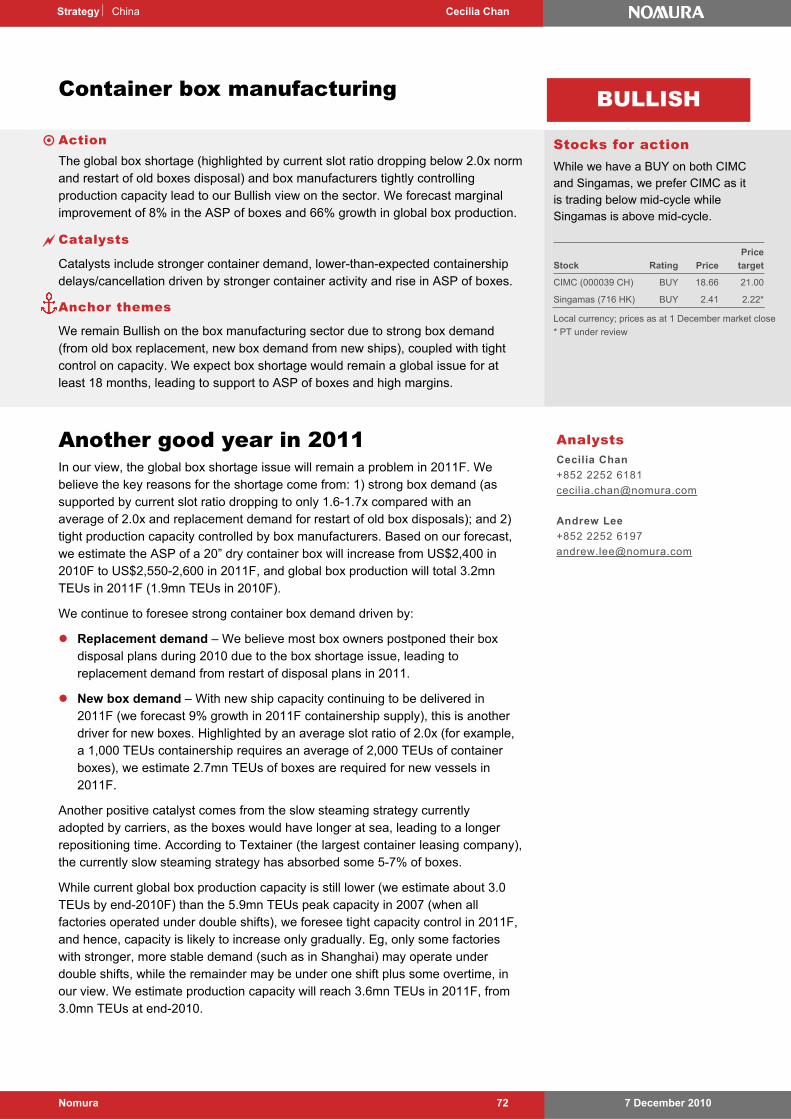
7 December 2010 Nomura 72
Strategy China Cecilia Chan
Container box manufacturing
Action The global box shortage (highlighted by current slot ratio dropping below 2.0x norm
and restart of old boxes disposal) and box manufacturers tightly controlling production capacity lead to our Bullish view on the sector. We forecast marginal improvement of 8% in the ASP of boxes and 66% growth in global box production.
Catalysts Catalysts include stronger container demand, lower-than-expected containership
delays/cancellation driven by stronger container activity and rise in ASP of boxes.
Anchor themes We remain Bullish on the box manufacturing sector due to strong box demand
(from old box replacement, new box demand from new ships), coupled with tight control on capacity. We expect box shortage would remain a global issue for at least 18 months, leading to support to ASP of boxes and high margins.
Another good year in 2011 In our view, the global box shortage issue will remain a problem in 2011F. We believe the key reasons for the shortage come from: 1) strong box demand (as supported by current slot ratio dropping to only 1.6-1.7x compared with an average of 2.0x and replacement demand for restart of old box disposals); and 2) tight production capacity controlled by box manufacturers. Based on our forecast, we estimate the ASP of a 20” dry container box will increase from US$2,400 in 2010F to US$2,550-2,600 in 2011F, and global box production will total 3.2mn TEUs in 2011F (1.9mn TEUs in 2010F).
We continue to foresee strong container box demand driven by:
Replacement demand – We believe most box owners postponed their box disposal plans during 2010 due to the box shortage issue, leading to replacement demand from restart of disposal plans in 2011.
New box demand – With new ship capacity continuing to be delivered in 2011F (we forecast 9% growth in 2011F containership supply), this is another driver for new boxes. Highlighted by an average slot ratio of 2.0x (for example, a 1,000 TEUs containership requires an average of 2,000 TEUs of container boxes), we estimate 2.7mn TEUs of boxes are required for new vessels in 2011F.
Another positive catalyst comes from the slow steaming strategy currently adopted by carriers, as the boxes would have longer at sea, leading to a longer repositioning time. According to Textainer (the largest container leasing company), the currently slow steaming strategy has absorbed some 5-7% of boxes.
While current global box production capacity is still lower (we estimate about 3.0 TEUs by end-2010F) than the 5.9mn TEUs peak capacity in 2007 (when all factories operated under double shifts), we foresee tight capacity control in 2011F, and hence, capacity is likely to increase only gradually. Eg, only some factories with stronger, more stable demand (such as in Shanghai) may operate under double shifts, while the remainder may be under one shift plus some overtime, in our view. We estimate production capacity will reach 3.6mn TEUs in 2011F, from 3.0mn TEUs at end-2010.
Stocks for action While we have a BUY on both CIMC and Singamas, we prefer CIMC as itis trading below mid-cycle while Singamas is above mid-cycle.
BULLISH
Analysts Cecilia Chan
+852 2252 6181
Andrew Lee
+852 2252 6197
Stock Rating Price
Price
target
CIMC (000039 CH) BUY 18.66 21.00
Singamas (716 HK) BUY 2.41 2.22*
Local currency; prices as at 1 December market close
* PT under review
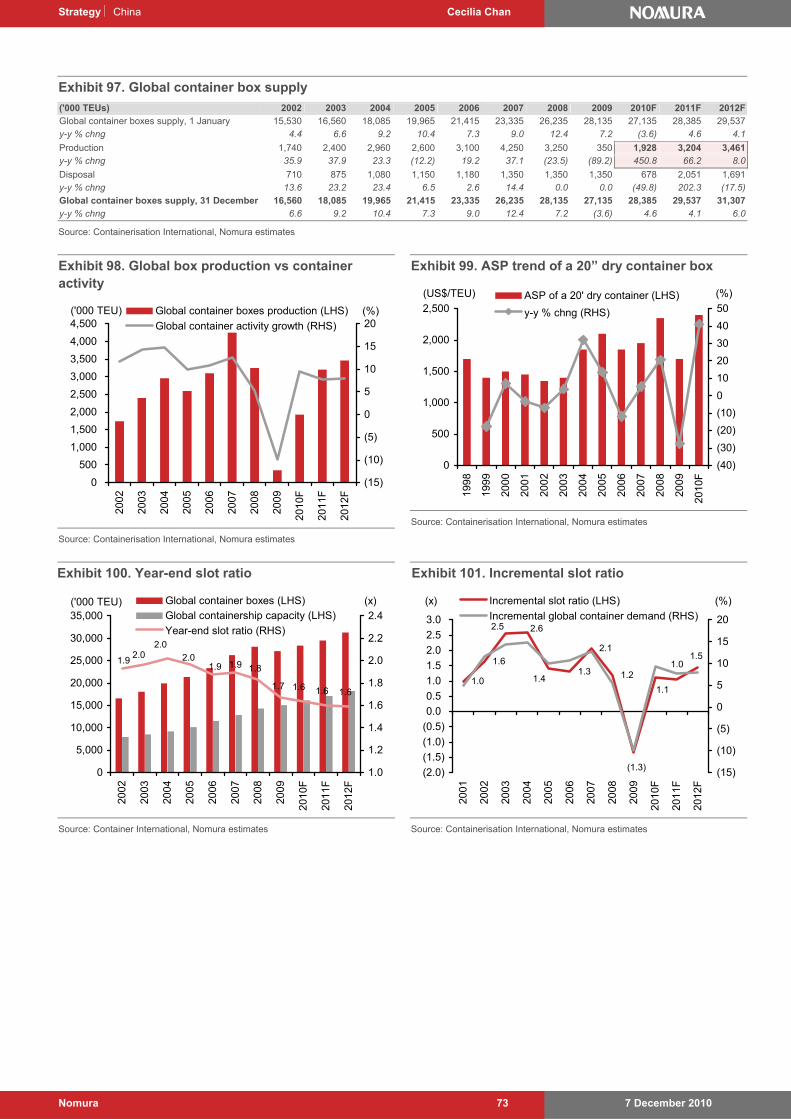
Strategy China Cecilia Chan
7 December 2010 Nomura 73
Exhibit 97. Global container box supply
('000 TEUs) 2002 2003 2004 2005 2006 2007 2008 2009 2010F 2011F 2012FGlobal container boxes supply, 1 January 15,530 16,560 18,085 19,965 21,415 23,335 26,235 28,135 27,135 28,385 29,537y-y % chng 4.4 6.6 9.2 10.4 7.3 9.0 12.4 7.2 (3.6) 4.6 4.1
Production 1,740 2,400 2,960 2,600 3,100 4,250 3,250 350 1,928 3,204 3,461y-y % chng 35.9 37.9 23.3 (12.2) 19.2 37.1 (23.5) (89.2) 450.8 66.2 8.0
Disposal 710 875 1,080 1,150 1,180 1,350 1,350 1,350 678 2,051 1,691y-y % chng 13.6 23.2 23.4 6.5 2.6 14.4 0.0 0.0 (49.8) 202.3 (17.5)
Global container boxes supply, 31 December 16,560 18,085 19,965 21,415 23,335 26,235 28,135 27,135 28,385 29,537 31,307y-y % chng 6.6 9.2 10.4 7.3 9.0 12.4 7.2 (3.6) 4.6 4.1 6.0 Source: Containerisation International, Nomura estimates
Exhibit 98. Global box production vs container activity
0
500
1,000
1,500
2,000
2,500
3,000
3,500
4,000
4,500
2002
2003
2004
2005
2006
2007
2008
2009
2010
F
2011
F
2012
F
(15)
(10)
(5)
0
5
10
15
20Global container boxes production (LHS)
Global container activity growth (RHS)
('000 TEU) (%)
Source: Containerisation International, Nomura estimates
Exhibit 99. ASP trend of a 20” dry container box
0
500
1,000
1,500
2,000
2,500
1998
1999
2000
2001
2002
2003
2004
2005
2006
2007
2008
2009
2010
F
(40)
(30)
(20)
(10)
0
10
20
30
40
50ASP of a 20' dry container (LHS)
y-y % chng (RHS)
(US$/TEU) (%)
Source: Containerisation International, Nomura estimates
Exhibit 100. Year-end slot ratio
1.61.61.61.7
1.81.91.92.0
2.02.0
1.9
0
5,000
10,000
15,000
20,000
25,000
30,000
35,000
2002
2003
2004
2005
2006
2007
2008
2009
2010
F
2011
F
2012
F
1.0
1.2
1.4
1.6
1.8
2.0
2.2
2.4
Global container boxes (LHS)
Global containership capacity (LHS)
Year-end slot ratio (RHS)
('000 TEU) (x)
Source: Container International, Nomura estimates
Exhibit 101. Incremental slot ratio
1.0
1.61.3
2.1
1.21.0
(1.3)
1.4
2.5 2.6
1.5
1.1
(2.0)
(1.5)
(1.0)
(0.5)
0.0
0.5
1.0
1.5
2.0
2.5
3.0
2001
2002
2003
2004
2005
2006
2007
2008
2009
2010
F
2011
F
2012
F
(15)
(10)
(5)
0
5
10
15
20
Incremental slot ratio (LHS)
Incremental global container demand (RHS)
(x) (%)
Source: Containerisation International, Nomura estimates
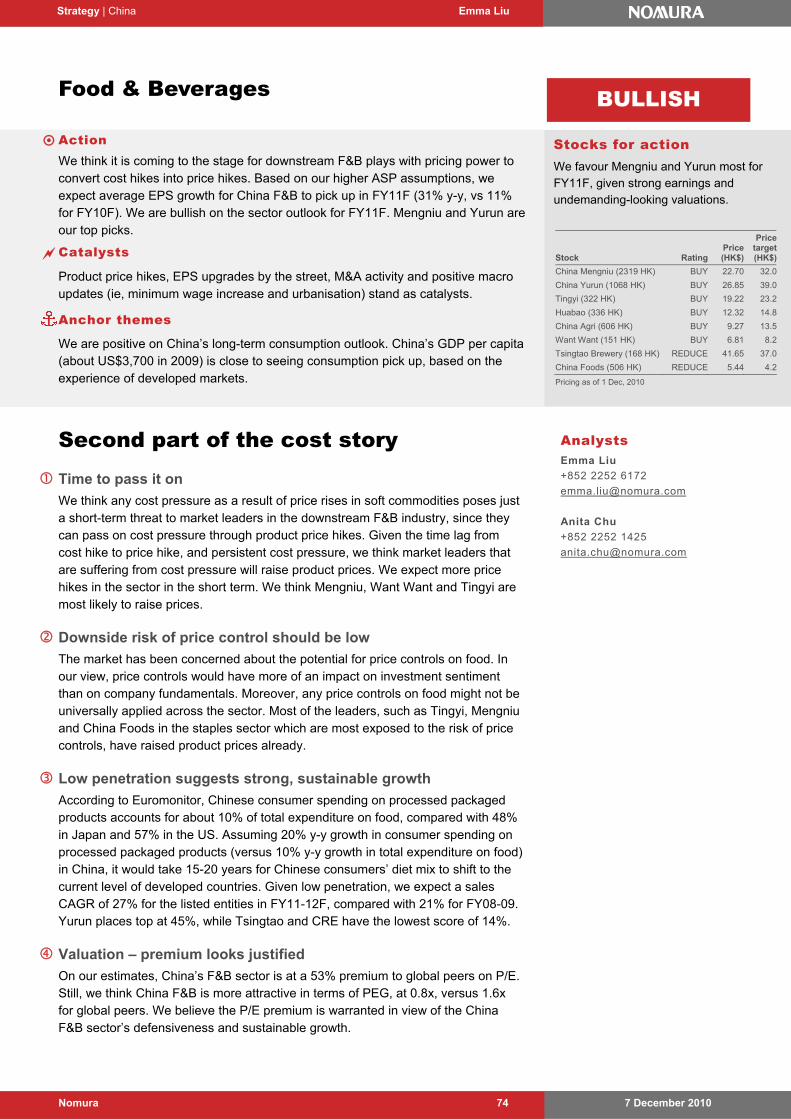
7 December 2010 Nomura 74
Strategy | China Emma Liu
Food & Beverages
Action We think it is coming to the stage for downstream F&B plays with pricing power to
convert cost hikes into price hikes. Based on our higher ASP assumptions, we expect average EPS growth for China F&B to pick up in FY11F (31% y-y, vs 11% for FY10F). We are bullish on the sector outlook for FY11F. Mengniu and Yurun are our top picks.
Catalysts Product price hikes, EPS upgrades by the street, M&A activity and positive macro
updates (ie, minimum wage increase and urbanisation) stand as catalysts.
Anchor themes We are positive on China’s long-term consumption outlook. China’s GDP per capita
(about US$3,700 in 2009) is close to seeing consumption pick up, based on the experience of developed markets.
Second part of the cost story Time to pass it on
We think any cost pressure as a result of price rises in soft commodities poses just a short-term threat to market leaders in the downstream F&B industry, since they can pass on cost pressure through product price hikes. Given the time lag from cost hike to price hike, and persistent cost pressure, we think market leaders that are suffering from cost pressure will raise product prices. We expect more price hikes in the sector in the short term. We think Mengniu, Want Want and Tingyi are most likely to raise prices.
Downside risk of price control should be low
The market has been concerned about the potential for price controls on food. In our view, price controls would have more of an impact on investment sentiment than on company fundamentals. Moreover, any price controls on food might not be universally applied across the sector. Most of the leaders, such as Tingyi, Mengniu and China Foods in the staples sector which are most exposed to the risk of price controls, have raised product prices already.
Low penetration suggests strong, sustainable growth
According to Euromonitor, Chinese consumer spending on processed packaged products accounts for about 10% of total expenditure on food, compared with 48% in Japan and 57% in the US. Assuming 20% y-y growth in consumer spending on processed packaged products (versus 10% y-y growth in total expenditure on food) in China, it would take 15-20 years for Chinese consumers’ diet mix to shift to the current level of developed countries. Given low penetration, we expect a sales CAGR of 27% for the listed entities in FY11-12F, compared with 21% for FY08-09. Yurun places top at 45%, while Tsingtao and CRE have the lowest score of 14%.
Valuation – premium looks justified
On our estimates, China’s F&B sector is at a 53% premium to global peers on P/E. Still, we think China F&B is more attractive in terms of PEG, at 0.8x, versus 1.6x for global peers. We believe the P/E premium is warranted in view of the China F&B sector’s defensiveness and sustainable growth.
Stocks for action We favour Mengniu and Yurun most for FY11F, given strong earnings and undemanding-looking valuations.
BULLISH
Stock RatingPrice(HK$)
Pricetarget (HK$)
China Mengniu (2319 HK) BUY 22.70 32.0
China Yurun (1068 HK) BUY 26.85 39.0
Tingyi (322 HK) BUY 19.22 23.2
Huabao (336 HK) BUY 12.32 14.8
China Agri (606 HK) BUY 9.27 13.5
Want Want (151 HK) BUY 6.81 8.2
Tsingtao Brewery (168 HK) REDUCE 41.65 37.0
China Foods (506 HK) REDUCE 5.44 4.2
Pricing as of 1 Dec, 2010
Analysts Emma Liu
+852 2252 6172
Anita Chu
+852 2252 1425
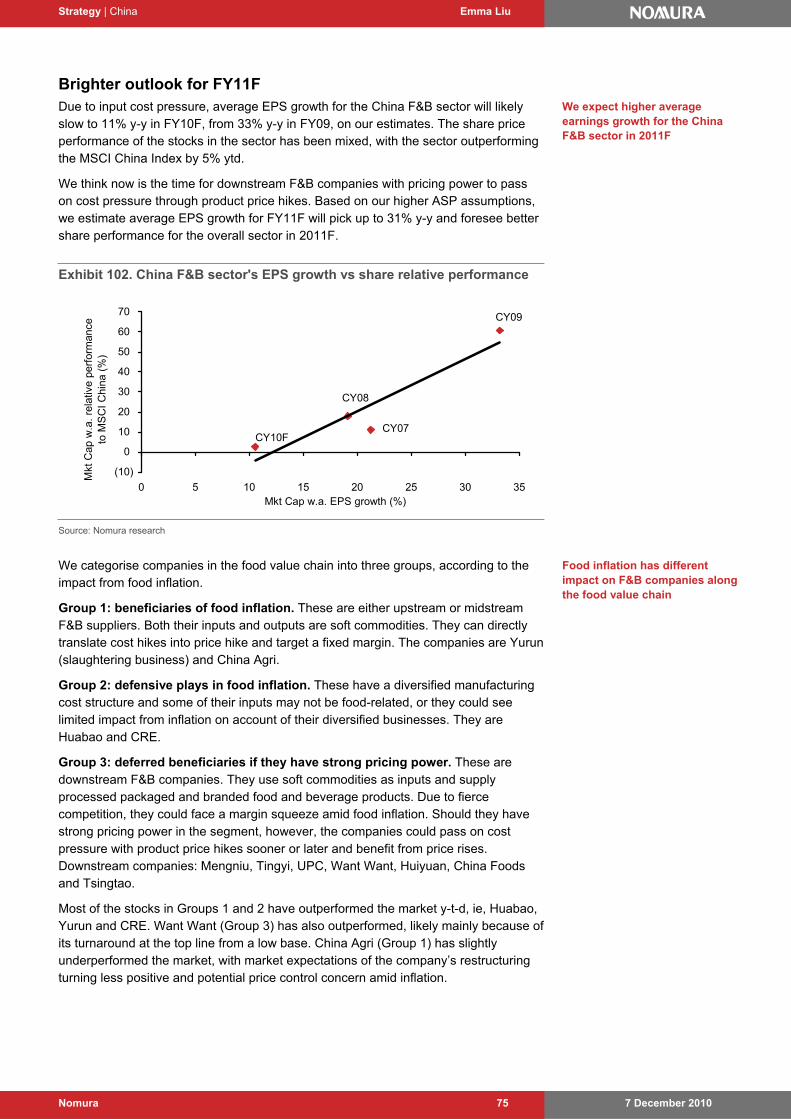
Strategy | China Emma Liu
7 December 2010 Nomura 75
Brighter outlook for FY11F Due to input cost pressure, average EPS growth for the China F&B sector will likely slow to 11% y-y in FY10F, from 33% y-y in FY09, on our estimates. The share price performance of the stocks in the sector has been mixed, with the sector outperforming the MSCI China Index by 5% ytd.
We think now is the time for downstream F&B companies with pricing power to pass on cost pressure through product price hikes. Based on our higher ASP assumptions, we estimate average EPS growth for FY11F will pick up to 31% y-y and foresee better share performance for the overall sector in 2011F.
Exhibit 102. China F&B sector's EPS growth vs share relative performance
CY07
CY09
CY08
CY10F
(10)
0
10
20
30
40
50
60
70
0 5 10 15 20 25 30 35Mkt Cap w.a. EPS growth (%)
Mkt
Cap
w.a
. re
lativ
e pe
rfor
man
ce
to M
SC
I C
hina
(%
)
Source: Nomura research
We categorise companies in the food value chain into three groups, according to the impact from food inflation.
Group 1: beneficiaries of food inflation. These are either upstream or midstream F&B suppliers. Both their inputs and outputs are soft commodities. They can directly translate cost hikes into price hike and target a fixed margin. The companies are Yurun (slaughtering business) and China Agri.
Group 2: defensive plays in food inflation. These have a diversified manufacturing cost structure and some of their inputs may not be food-related, or they could see limited impact from inflation on account of their diversified businesses. They are Huabao and CRE.
Group 3: deferred beneficiaries if they have strong pricing power. These are downstream F&B companies. They use soft commodities as inputs and supply processed packaged and branded food and beverage products. Due to fierce competition, they could face a margin squeeze amid food inflation. Should they have strong pricing power in the segment, however, the companies could pass on cost pressure with product price hikes sooner or later and benefit from price rises. Downstream companies: Mengniu, Tingyi, UPC, Want Want, Huiyuan, China Foods and Tsingtao.
Most of the stocks in Groups 1 and 2 have outperformed the market y-t-d, ie, Huabao, Yurun and CRE. Want Want (Group 3) has also outperformed, likely mainly because of its turnaround at the top line from a low base. China Agri (Group 1) has slightly underperformed the market, with market expectations of the company’s restructuring turning less positive and potential price control concern amid inflation.
We expect higher average earnings growth for the China F&B sector in 2011F
Food inflation has different impact on F&B companies along the food value chain
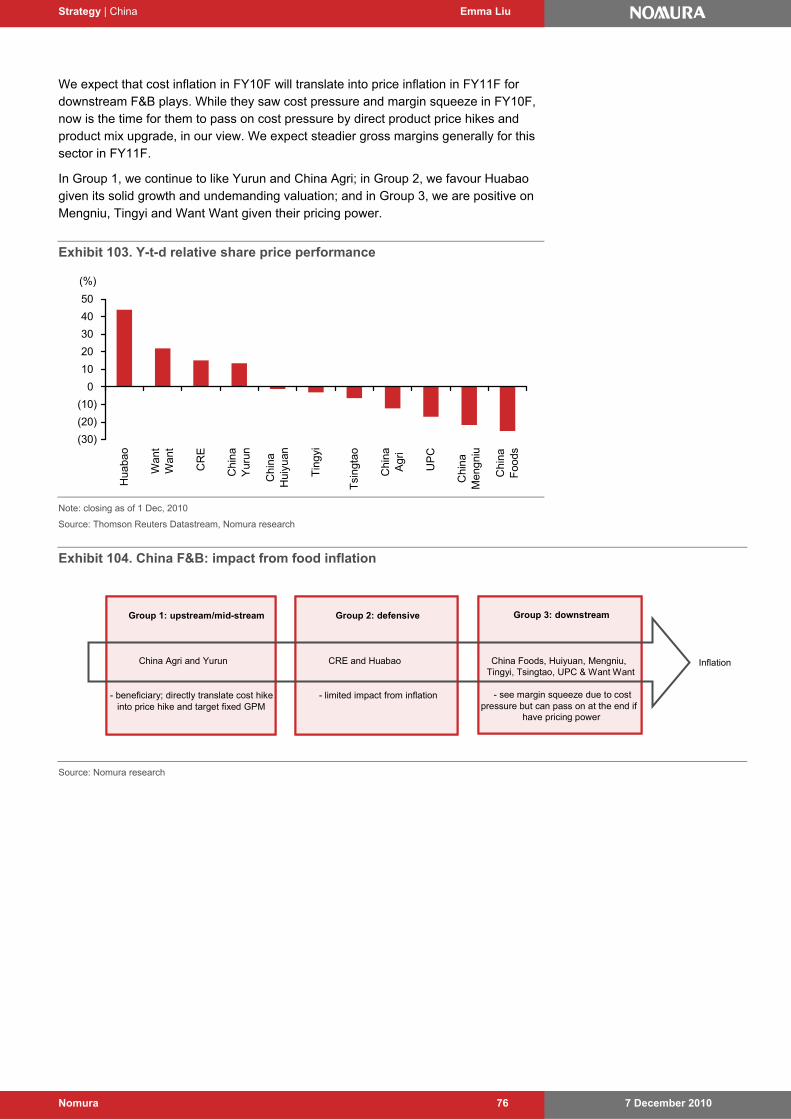
Strategy | China Emma Liu
7 December 2010 Nomura 76
We expect that cost inflation in FY10F will translate into price inflation in FY11F for downstream F&B plays. While they saw cost pressure and margin squeeze in FY10F, now is the time for them to pass on cost pressure by direct product price hikes and product mix upgrade, in our view. We expect steadier gross margins generally for this sector in FY11F.
In Group 1, we continue to like Yurun and China Agri; in Group 2, we favour Huabao given its solid growth and undemanding valuation; and in Group 3, we are positive on Mengniu, Tingyi and Want Want given their pricing power.
Exhibit 103. Y-t-d relative share price performance
(30)
(20)
(10)
0
10
20
30
40
50
Hua
bao
Wan
tW
ant
CR
E
Chi
naY
urun
Chi
naH
uiyu
an
Tin
gyi
Tsi
ngta
o
Chi
naA
gri
UP
C
Chi
naM
engn
iu
Chi
naF
oods
(%)
Note: closing as of 1 Dec, 2010
Source: Thomson Reuters Datastream, Nomura research
Exhibit 104. China F&B: impact from food inflation
Group 1: upstream/mid-stream
- beneficiary; directly translate cost hike into price hike and target fixed GPM
Group 2: defensive
- limited impact from inflation
Group 3: downstream
- see margin squeeze due to cost pressure but can pass on at the end if
have pricing power
China Agri and Yurun CRE and Huabao China Foods, Huiyuan, Mengniu, Tingyi, Tsingtao, UPC & Want Want
Inflation
Source: Nomura research
Strategy | China Emma Liu
7 December 2010 Nomura 77
Downside risk of price controls: low
Impact more on sentiment than fundamentals
China CPI headline hit 4.4%, with food CPI, the main driver, exceeding 10% in October 2010. As flagged by our strategist Sean Darby in “China: an inflationary surprise (IX) and the Engel coefficient” dated 17 November, 2010, the likelihood of a reintroduction of price controls on food is growing.
Imposition of price controls would pose a downside risk to our investment view, since much of our investment thesis rests on pricing power. However, we think the negative impact of price controls would be felt more in investment sentiment than in company fundamentals.
Upstream/midstream – hard to control
The effectiveness of direct price caps in the upstream and midstream parts of the food sector is open to question, we believe, given a fragmented industry structure. In the slaughtering industry where Yurun is positioned, we believe there are more than 20,000 producers in China; in the oilseed crushing industry where China Agri is engaged, there are still more than 2,000 processors in the country. How could the authorities control the product prices of thousands of players in a single sector?
Downstream – price controls may not be universal
Most downstream sectors in food are also fragmented, again calling into question the effectiveness of price caps. Moreover, we believe any price controls might not be universally applied to all segments downstream, since some segments — snack, alcohol, soft drinks — are discretionary and not related to basic necessities.
We would see sectors that feature food staples and have relatively consolidated market structures as most at risk of being included in any price controls. Among these sectors we include instant noodles, liquid pure milk and consumer-pack edible oil, all of which were included in the last price controls in 2008.
Still, we think potential price controls are most likely to take the form of an approval system (as they did in 2008) rather than direct price caps per se. Our expectation of leading food suppliers’ product price hikes is based on the pre-condition that they have already seen cost pressures and margin squeeze as a result.
Should we see the worst case, where the authorities put direct price caps on instant noodles, liquid pure milk and consumer-pack edible oil, our earnings estimates for related stocks, including Tingyi, Uni-president, Mengniu and China Foods, would not be at significant downside risk, in our opinion. These companies have already raised product prices, such that further hikes would likely not be significant, we believe.
Authorities could again implement price controls…
…but we see only limited downside risk
Effectiveness of price caps open to question, particularly upstream/midstream
Price controls, if any, may not be universally applied
Also see our Asia Pacific Strategy piece — China: an inflationary surprise (IX) and the Engel coefficient , 17 November, 2010
Strategy | China Gideon Lo, CFA
7 December 2010 Nomura 78
China Healthcare & Pharmaceutical
Action We recommend investors to rein in their urge to buy healthcare stocks until the
policy overhang clears; a clearer picture should emerge in 2Q11F after the government announces new drug price regulations and other process reform policies. Our top BUY calls are Sino Biopharmaceutical and China Shineway.
Catalysts Short-term consolidation catalysts could come from lower product prices but could
also push up product costs.
Anchor themes
We see significant long-term re-rating potential for top flight firms, considering that they could benefit from the upcoming market consolidation and industry upgrade set in motion by government policies and an evolving market.
A year of two halves Looming policy risks in 1H11F – short-term overhang
We view 2011F as a policy inflection year as it is a cross-over for the last year of the ongoing healthcare reform plans and the first year of the 12th Five-year Plan (FYP). This implies that the healthcare sector may face higher policy risks and uncertainties. On analysing the past reforms in 2004-06, we identify some controversial healthcare policies that could bring short-term pain before generating long-term gains.
The key near-term policy risks may come from: 1) new regulations to control drug and other medical product prices in the national drug reimbursement list; and 2) new measures to reform industry processes and product quality, such as the introduction of good manufacturing practices (GMP) and the streamlining of distribution systems. These will likely lead to profit margin pressure in the short term, despite prospects for long-term positive effects that will help accelerate market consolidation and industry upgrades.
In view of the short-term policy overhang, we believe the re-rating impetus via P/E value expansion should ease for most stocks in 2011F, which will likely continue the sector’s on-going consolidation for a while. In the coming months, we believe, some stocks face a risk of correction due to: 1) stretched valuations, reflecting the high expectations; 2) unintended outcomes from some controversial reform policies, especially for some single-product companies; and 3) other risk factors, such as cost inflation, interest rate hikes and renminbi appreciation.
Re-entry opportunities in mid-2011F on clear long-term growth visibility
Nevertheless, we are positive on the robust long-term growth prospects of China’s healthcare and pharmaceuticals sector, underpinned by the country’s favourable macroeconomic and demographic features and trends. Our positive stance is premised on: solid economic growth and development, sustainable urbanisation, a large ageing population, and the healthy policy push from healthcare reforms and the 12th FYP.
Stocks for action We like Sino Biopharmaceuticals (industry upgrade theme) and China Shineway (market consolidation theme) in view of the potential long-term re-rating of the fast-growing pharmaceuticals sector in China.
NEUTRAL
Stock Rating PricePrice
target
Sino Biopharm (1177 HK) BUY 3.02 3.75
China Shineway (2877 HK) BUY 25.0 32.30
Prices in local currency as of 1 December, 2010
Analyst Gideon Lo, CFA
+852 2252 6190
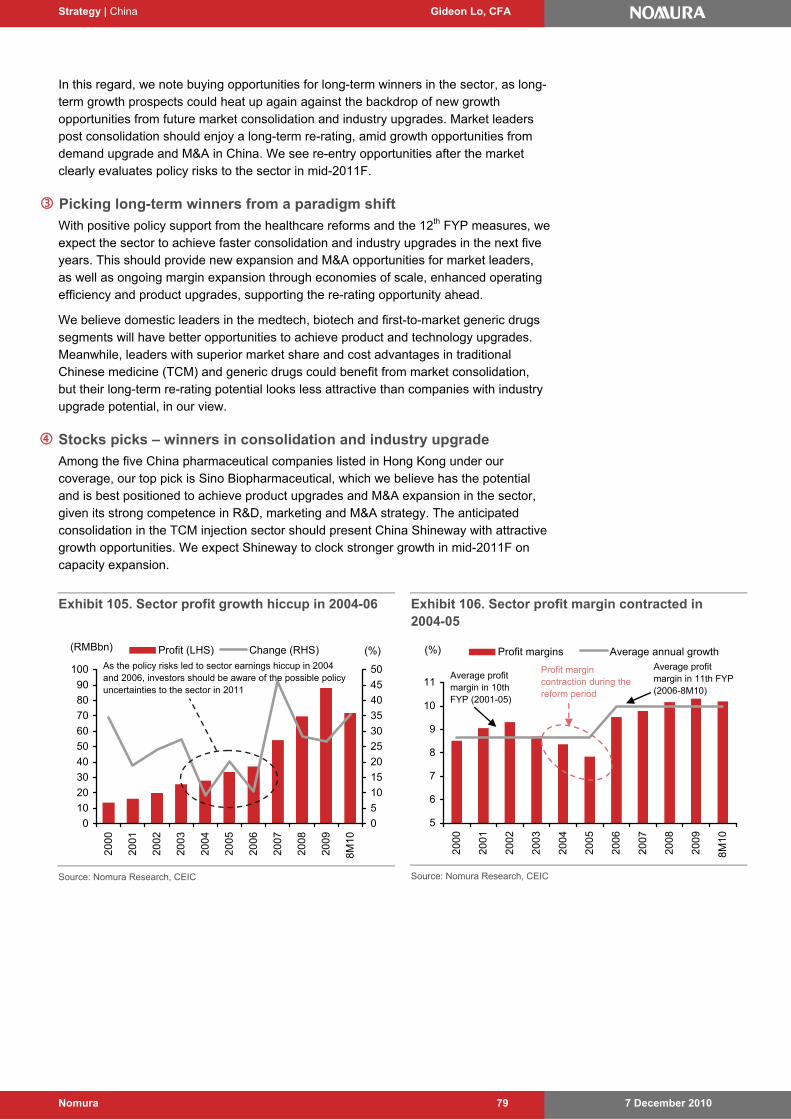
Strategy | China Gideon Lo, CFA
7 December 2010 Nomura 79
In this regard, we note buying opportunities for long-term winners in the sector, as long-term growth prospects could heat up again against the backdrop of new growth opportunities from future market consolidation and industry upgrades. Market leaders post consolidation should enjoy a long-term re-rating, amid growth opportunities from demand upgrade and M&A in China. We see re-entry opportunities after the market clearly evaluates policy risks to the sector in mid-2011F.
Picking long-term winners from a paradigm shift
With positive policy support from the healthcare reforms and the 12th FYP measures, we expect the sector to achieve faster consolidation and industry upgrades in the next five years. This should provide new expansion and M&A opportunities for market leaders, as well as ongoing margin expansion through economies of scale, enhanced operating efficiency and product upgrades, supporting the re-rating opportunity ahead.
We believe domestic leaders in the medtech, biotech and first-to-market generic drugs segments will have better opportunities to achieve product and technology upgrades. Meanwhile, leaders with superior market share and cost advantages in traditional Chinese medicine (TCM) and generic drugs could benefit from market consolidation, but their long-term re-rating potential looks less attractive than companies with industry upgrade potential, in our view.
Stocks picks – winners in consolidation and industry upgrade
Among the five China pharmaceutical companies listed in Hong Kong under our coverage, our top pick is Sino Biopharmaceutical, which we believe has the potential and is best positioned to achieve product upgrades and M&A expansion in the sector, given its strong competence in R&D, marketing and M&A strategy. The anticipated consolidation in the TCM injection sector should present China Shineway with attractive growth opportunities. We expect Shineway to clock stronger growth in mid-2011F on capacity expansion.
Exhibit 105. Sector profit growth hiccup in 2004-06
0
10
20
30
40
50
60
70
80
90
100
2000
2001
2002
2003
2004
2005
2006
2007
2008
2009
8M10
0
5
10
15
20
25
30
35
40
45
50
(%)Profit (LHS) Change (RHS)(RMBbn)
As the policy risks led to sector earnings hiccup in 2004 and 2006, investors should be aware of the possible policy uncertainties to the sector in 2011
Source: Nomura Research, CEIC
Exhibit 106. Sector profit margin contracted in 2004-05
5
6
7
8
9
10
11
2000
2001
2002
2003
2004
2005
2006
2007
2008
2009
8M10
(%) Profit margins Average annual growth
Average profit margin in 10th FYP (2001-05)
Average profit margin in 11th FYP (2006-8M10)
Profit margin contraction during the reform period
Source: Nomura Research, CEIC
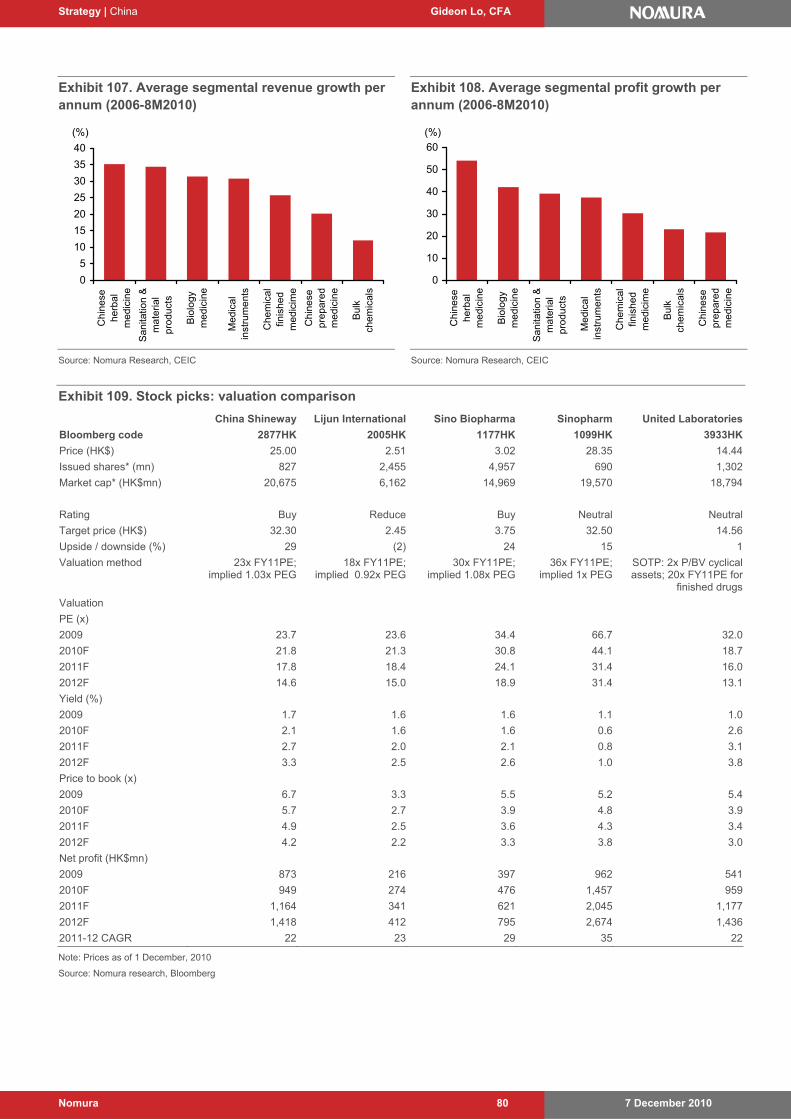
Strategy | China Gideon Lo, CFA
7 December 2010 Nomura 80
Exhibit 107. Average segmental revenue growth per annum (2006-8M2010)
0
5
10
15
20
25
30
35
40
Ch
ine
seh
erb
al
me
dic
ine
Sa
nita
tion
&m
ate
ria
lp
rod
uct
s
Bio
log
ym
ed
icin
e
Me
dic
al
inst
rum
en
ts
Ch
em
ica
lfin
ish
ed
med
icim
e
Ch
ine
sep
rep
are
dm
ed
icin
e
Bu
lkch
em
ica
ls
(%)
Source: Nomura Research, CEIC
Exhibit 108. Average segmental profit growth per annum (2006-8M2010)
0
10
20
30
40
50
60
Ch
ine
seh
erb
al
me
dic
ine
Bio
log
ym
ed
icin
e
Sa
nita
tion
&m
ate
ria
lp
rod
uct
s
Me
dic
al
inst
rum
en
ts
Ch
em
ica
lfin
ish
ed
med
icim
e
Bu
lkch
em
ica
ls
Ch
ine
sep
rep
are
dm
ed
icin
e
(%)
Source: Nomura Research, CEIC
Exhibit 109. Stock picks: valuation comparison
China Shineway Lijun International Sino Biopharma Sinopharm United Laboratories
Bloomberg code 2877HK 2005HK 1177HK 1099HK 3933HK
Price (HK$) 25.00 2.51 3.02 28.35 14.44
Issued shares* (mn) 827 2,455 4,957 690 1,302
Market cap* (HK$mn) 20,675 6,162 14,969 19,570 18,794
Rating Buy Reduce Buy Neutral Neutral
Target price (HK$) 32.30 2.45 3.75 32.50 14.56
Upside / downside (%) 29 (2) 24 15 1
Valuation method 23x FY11PE; implied 1.03x PEG
18x FY11PE; implied 0.92x PEG
30x FY11PE; implied 1.08x PEG
36x FY11PE; implied 1x PEG
SOTP: 2x P/BV cyclical assets; 20x FY11PE for
finished drugs
Valuation
PE (x)
2009 23.7 23.6 34.4 66.7 32.0
2010F 21.8 21.3 30.8 44.1 18.7
2011F 17.8 18.4 24.1 31.4 16.0
2012F 14.6 15.0 18.9 31.4 13.1
Yield (%)
2009 1.7 1.6 1.6 1.1 1.0
2010F 2.1 1.6 1.6 0.6 2.6
2011F 2.7 2.0 2.1 0.8 3.1
2012F 3.3 2.5 2.6 1.0 3.8
Price to book (x)
2009 6.7 3.3 5.5 5.2 5.4
2010F 5.7 2.7 3.9 4.8 3.9
2011F 4.9 2.5 3.6 4.3 3.4
2012F 4.2 2.2 3.3 3.8 3.0
Net profit (HK$mn)
2009 873 216 397 962 541
2010F 949 274 476 1,457 959
2011F 1,164 341 621 2,045 1,177
2012F 1,418 412 795 2,674 1,436
2011-12 CAGR 22 23 29 35 22
Note: Prices as of 1 December, 2010
Source: Nomura research, Bloomberg
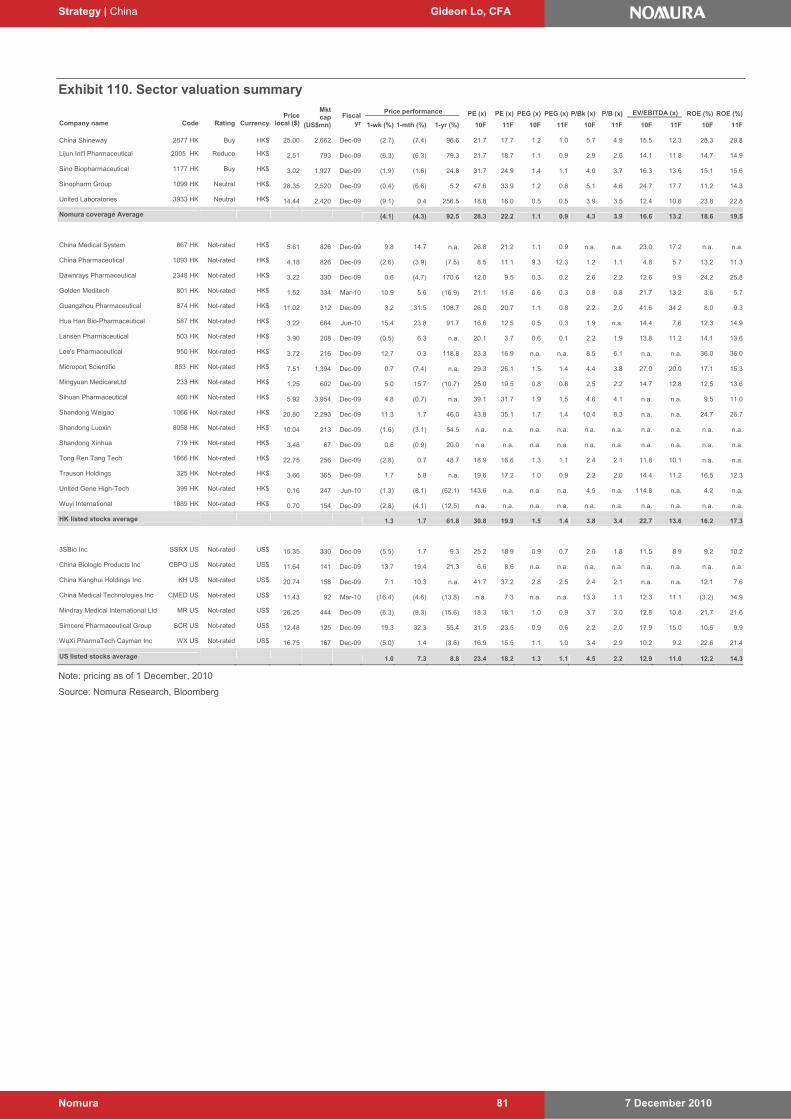
Strategy | China Gideon Lo, CFA
7 December 2010 Nomura 81
Exhibit 110. Sector valuation summary
Price performance PE (x) PE (x) PEG (x) PEG (x) P/Bk (x) P/B (x) EV/EBITDA (x) ROE (%) ROE (%)
Company name
Code Rating
Currency Price
local ($)
Mktcap
(US$mn)
Fiscalyr 1-wk (%) 1-mth (%) 1-yr (%) 10F 11F 10F 11F 10F 11F 10F 11F 10F 11F
China Shineway 2877 HK Buy HK$ 25.00 2,662 Dec-09 (2.7) (7.4) 96.6 21.7 17.7 1.2 1.0 5.7 4.9 15.5 12.3 28.3 29.8
Lijun Int'l Pharmaceutical 2005 HK Reduce HK$ 2.51 793 Dec-09 (6.3) (6.3) 79.3 21.7 18.7 1.1 0.9 2.9 2.6 14.1 11.8 14.7 14.9
Sino Biopharmaceutical 1177 HK Buy HK$ 3.02 1,927 Dec-09 (1.9) (1.6) 24.8 31.7 24.9 1.4 1.1 4.0 3.7 16.3 13.6 15.1 15.6
Sinopharm Group 1099 HK Neutral HK$ 28.35 2,520 Dec-09 (0.4) (6.6) 5.2 47.6 33.9 1.2 0.8 5.1 4.6 24.7 17.7 11.2 14.3
United Laboratories 3933 HK Neutral HK$ 14.44 2,420 Dec-09 (9.1) 0.4 256.5 18.8 16.0 0.5 0.5 3.9 3.5 12.4 10.6 23.8 22.8
Nomura coverage Average (4.1) (4.3) 92.5 28.3 22.2 1.1 0.9 4.3 3.9 16.6 13.2 18.6 19.5
China Medical System 867 HK Not-rated HK$ 5.61 826 Dec-09 9.8 14.7 n.a. 26.8 21.2 1.1 0.9 n.a. n.a. 23.0 17.2 n.a. n.a.
China Pharmaceutical 1093 HK Not-rated HK$ 4.18 826 Dec-09 (2.6) (3.9) (7.5) 8.5 11.1 9.3 12.3 1.2 1.1 4.8 5.7 13.2 11.3
Dawnrays Pharmaceutical 2348 HK Not-rated HK$ 3.22 330 Dec-09 0.6 (4.7) 170.6 12.0 9.5 0.3 0.2 2.6 2.2 12.6 9.9 24.2 25.8
Golden Meditech 801 HK Not-rated HK$ 1.52 334 Mar-10 10.9 5.6 (16.9) 21.1 11.6 0.6 0.3 0.8 0.8 21.7 13.2 3.6 5.7
Guangzhou Pharmaceutical 874 HK Not-rated HK$ 11.02 312 Dec-09 3.2 31.5 108.7 26.0 20.7 1.1 0.8 2.2 2.0 41.6 34.2 8.0 9.3
Hua Han Bio-Pharmaceutical 587 HK Not-rated HK$ 3.22 664 Jun-10 15.4 23.8 91.7 16.6 12.5 0.5 0.3 1.9 n.a. 14.4 7.6 12.3 14.9
Lansen Pharmaceutical 503 HK Not-rated HK$ 3.90 208 Dec-09 (0.5) 6.3 n.a. 20.1 3.7 0.6 0.1 2.2 1.9 13.8 11.2 14.1 13.6
Lee's Pharmaceutical 950 HK Not-rated HK$ 3.72 216 Dec-09 12.7 0.3 118.8 23.3 16.9 n.a. n.a. 8.5 6.1 n.a. n.a. 36.0 36.0
Microport Scientific 853 HK Not-rated HK$ 7.51 1,394 Dec-09 0.7 (7.4) n.a. 29.3 26.1 1.5 1.4 4.4 3.8 27.0 20.0 17.1 15.3
Mingyuan MedicareLtd 233 HK Not-rated HK$ 1.25 602 Dec-09 5.0 15.7 (10.7) 25.0 19.5 0.8 0.6 2.5 2.2 14.7 12.8 12.5 13.6
Sihuan Pharmaceutical 460 HK Not-rated HK$ 5.92 3,954 Dec-09 4.8 (0.7) n.a. 39.1 31.7 1.9 1.5 4.6 4.1 n.a. n.a. 9.5 11.0
Shandong Weigao 1066 HK Not-rated HK$ 20.80 2,293 Dec-09 11.3 1.7 46.0 43.8 35.1 1.7 1.4 10.4 8.3 n.a. n.a. 24.7 26.7
Shandong Luoxin 8058 HK Not-rated HK$ 10.04 213 Dec-09 (1.6) (3.1) 54.5 n.a. n.a. n.a. n.a. n.a. n.a. n.a. n.a. n.a. n.a.
Shandong Xinhua 719 HK Not-rated HK$ 3.48 67 Dec-09 0.6 (0.9) 20.0 n.a. n.a. n.a. n.a. n.a. n.a. n.a. n.a. n.a. n.a.
Tong Ren Tang Tech 1666 HK Not-rated HK$ 22.75 256 Dec-09 (2.8) 0.7 48.7 18.9 16.6 1.3 1.1 2.4 2.1 11.8 10.1 n.a. n.a.
Trauson Holdings 325 HK Not-rated HK$ 3.66 365 Dec-09 1.7 5.8 n.a. 19.6 17.2 1.0 0.9 2.2 2.0 14.4 11.2 16.5 12.3
United Gene High-Tech 399 HK Not-rated HK$ 0.16 247 Jun-10 (1.3) (8.1) (62.1) 143.6 n.a. n.a. n.a. 4.5 n.a. 114.8 n.a. 4.2 n.a.
Wuyi International 1889 HK Not-rated HK$ 0.70 154 Dec-09 (2.8) (4.1) (12.5) n.a. n.a. n.a. n.a. n.a. n.a. n.a. n.a. n.a. n.a.
HK listed stocks average 1.3 1.7 61.8 30.8 19.9 1.5 1.4 3.8 3.4 22.7 13.6 16.2 17.3
3SBio Inc SSRX US Not-rated US$ 15.35 330 Dec-09 (5.5) 1.7 9.3 25.2 18.9 0.9 0.7 2.0 1.8 11.5 8.9 9.2 10.2
China Biologic Products Inc CBPO US Not-rated US$ 11.64 141 Dec-09 13.7 19.4 21.3 6.6 8.6 n.a. n.a. n.a. n.a. n.a. n.a. n.a. n.a.
China Kanghui Holdings Inc KH US Not-rated US$ 20.74 158 Dec-09 7.1 10.3 n.a. 41.7 37.2 2.8 2.5 2.4 2.1 n.a. n.a. 12.1 7.6
China Medical Technologies Inc CMED US Not-rated US$ 11.43 92 Mar-10 (16.4) (4.6) (13.8) n.a. 7.3 n.a. n.a. 13.3 1.1 12.3 11.1 (3.2) 14.9
Mindray Medical International Ltd MR US Not-rated US$ 26.25 444 Dec-09 (6.3) (9.3) (15.6) 18.3 16.1 1.0 0.9 3.7 3.0 12.8 10.8 21.7 21.6
Simcere Pharmaceutical Group SCR US Not-rated US$ 12.48 125 Dec-09 19.3 32.3 55.4 31.5 23.5 0.9 0.6 2.2 2.0 17.9 15.0 10.5 9.9
WuXi PharmaTech Cayman Inc WX US Not-rated US$ 16.75 167 Dec-09 (5.0) 1.4 (3.6) 16.9 15.5 1.1 1.0 3.4 2.9 10.2 9.2 22.6 21.4
US listed stocks average 1.0 7.3 8.8 23.4 18.2 1.3 1.1 4.5 2.2 12.9 11.0 12.2 14.3
Note: pricing as of 1 December, 2010
Source: Nomura Research, Bloomberg
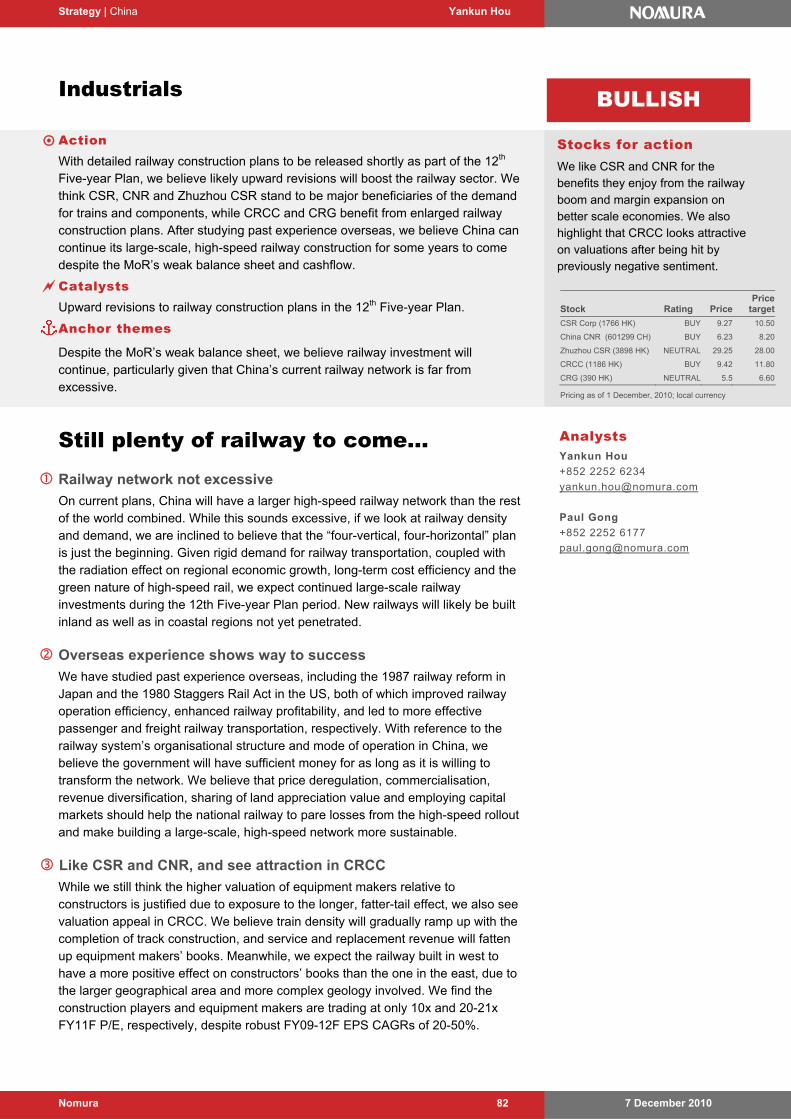
Strategy | China Yankun Hou
7 December 2010 Nomura 82
Industrials
Action With detailed railway construction plans to be released shortly as part of the 12th
Five-year Plan, we believe likely upward revisions will boost the railway sector. We think CSR, CNR and Zhuzhou CSR stand to be major beneficiaries of the demand for trains and components, while CRCC and CRG benefit from enlarged railway construction plans. After studying past experience overseas, we believe China can continue its large-scale, high-speed railway construction for some years to come despite the MoR’s weak balance sheet and cashflow.
Catalysts Upward revisions to railway construction plans in the 12th Five-year Plan.
Anchor themes
Despite the MoR’s weak balance sheet, we believe railway investment will continue, particularly given that China’s current railway network is far from excessive.
Still plenty of railway to come… Railway network not excessive
On current plans, China will have a larger high-speed railway network than the rest of the world combined. While this sounds excessive, if we look at railway density and demand, we are inclined to believe that the “four-vertical, four-horizontal” plan is just the beginning. Given rigid demand for railway transportation, coupled with the radiation effect on regional economic growth, long-term cost efficiency and the green nature of high-speed rail, we expect continued large-scale railway investments during the 12th Five-year Plan period. New railways will likely be built inland as well as in coastal regions not yet penetrated.
Overseas experience shows way to success
We have studied past experience overseas, including the 1987 railway reform in Japan and the 1980 Staggers Rail Act in the US, both of which improved railway operation efficiency, enhanced railway profitability, and led to more effective passenger and freight railway transportation, respectively. With reference to the railway system’s organisational structure and mode of operation in China, we believe the government will have sufficient money for as long as it is willing to transform the network. We believe that price deregulation, commercialisation, revenue diversification, sharing of land appreciation value and employing capital markets should help the national railway to pare losses from the high-speed rollout and make building a large-scale, high-speed network more sustainable.
Like CSR and CNR, and see attraction in CRCC
While we still think the higher valuation of equipment makers relative to constructors is justified due to exposure to the longer, fatter-tail effect, we also see valuation appeal in CRCC. We believe train density will gradually ramp up with the completion of track construction, and service and replacement revenue will fatten up equipment makers’ books. Meanwhile, we expect the railway built in west to have a more positive effect on constructors’ books than the one in the east, due to the larger geographical area and more complex geology involved. We find the construction players and equipment makers are trading at only 10x and 20-21x FY11F P/E, respectively, despite robust FY09-12F EPS CAGRs of 20-50%.
Analysts Yankun Hou
+852 2252 6234
Paul Gong
+852 2252 6177
Stocks for action We like CSR and CNR for the benefits they enjoy from the railway boom and margin expansion on better scale economies. We also highlight that CRCC looks attractive on valuations after being hit by previously negative sentiment.
BULLISH
Stock Rating PricePrice
target
CSR Corp (1766 HK) BUY 9.27 10.50
China CNR (601299 CH) BUY 6.23 8.20
Zhuzhou CSR (3898 HK) NEUTRAL 29.25 28.00
CRCC (1186 HK) BUY 9.42 11.80
CRG (390 HK) NEUTRAL 5.5 6.60
Pricing as of 1 December, 2010; local currency
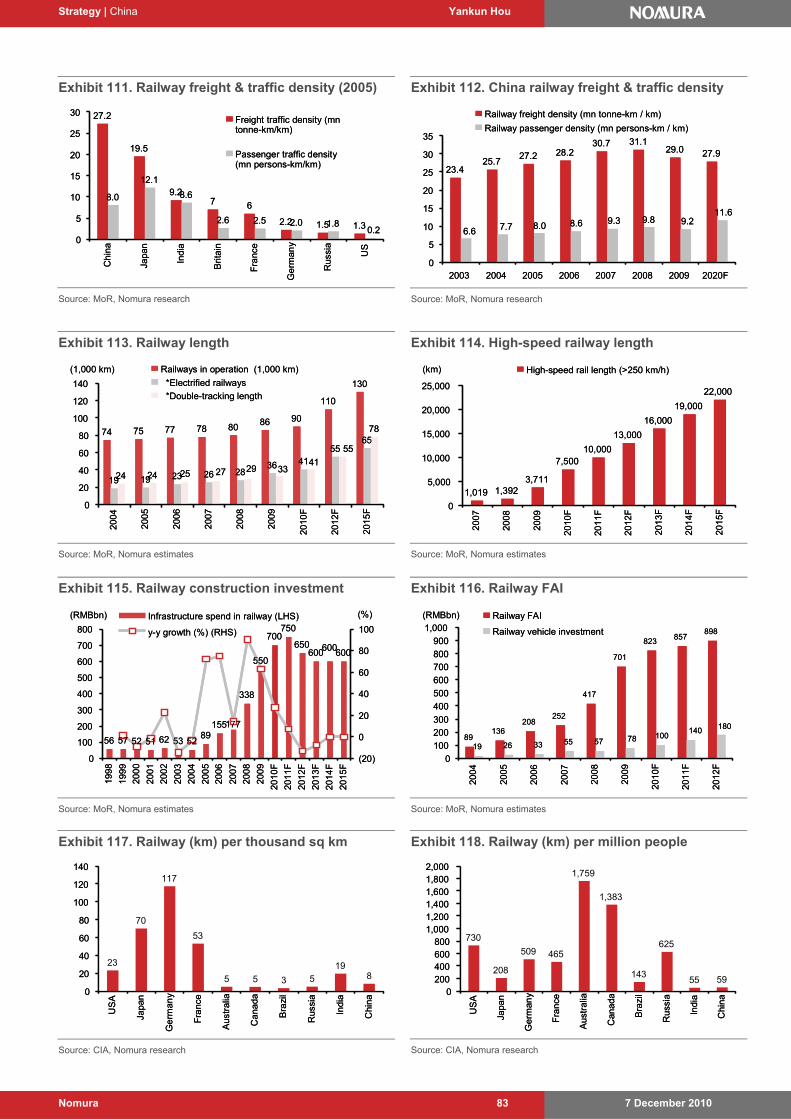
Strategy | China Yankun Hou
7 December 2010 Nomura 83
Exhibit 111. Railway freight & traffic density (2005)
27.2
19.5
9.27 6
2.2 1.5 1.3
8.0
12.1
8.6
2.6 2.5 2.0 1.80.2
0
5
10
15
20
25
30C
hina
Japa
n
Indi
a
Brit
ain
Fra
nce
Ge
rman
y
Rus
sia
US
Freight traffic density (mntonne-km/km)
Passenger traffic density(mn persons-km/km)
27.2
19.5
9.27 6
2.2 1.5 1.3
8.0
12.1
8.6
2.6 2.5 2.0 1.80.2
0
5
10
15
20
25
30C
hina
Japa
n
Indi
a
Brit
ain
Fra
nce
Ge
rman
y
Rus
sia
US
Freight traffic density (mntonne-km/km)
Passenger traffic density(mn persons-km/km)
Source: MoR, Nomura research
Exhibit 112. China railway freight & traffic density
23.425.7
27.2 28.230.7 31.1
29.0 27.9
9.211.6
9.89.38.68.07.76.6
0
5
10
15
20
25
30
35
2003 2004 2005 2006 2007 2008 2009 2020F
Railway freight density (mn tonne-km / km)
Railway passenger density (mn persons-km / km)
23.425.7
27.2 28.230.7 31.1
29.0 27.9
9.211.6
9.89.38.68.07.76.6
0
5
10
15
20
25
30
35
2003 2004 2005 2006 2007 2008 2009 2020F
Railway freight density (mn tonne-km / km)
Railway passenger density (mn persons-km / km)
Source: MoR, Nomura research
Exhibit 113. Railway length
74 75 77 78 8086 90
110
130
19 19 23 26 2836 41
5565
24 24
78
25 27 29 3341
55
0
20
40
60
80
100
120
140
2004
2005
2006
2007
2008
2009
2010
F
2012
F
2015
F(1,000 km) Railways in operation (1,000 km)
*Electrified railways
*Double-tracking length
74 75 77 78 8086 90
110
130
19 19 23 26 2836 41
5565
24 24
78
25 27 29 3341
55
0
20
40
60
80
100
120
140
2004
2005
2006
2007
2008
2009
2010
F
2012
F
2015
F(1,000 km) Railways in operation (1,000 km)
*Electrified railways
*Double-tracking length
Source: MoR, Nomura estimates
Exhibit 114. High-speed railway length
1,019 1,3923,711
7,50010,000
13,000
16,000
19,000
22,000
0
5,000
10,000
15,000
20,000
25,000
2007
2008
2009
2010
F
2011
F
2012
F
2013
F
2014
F
2015
F
(km) High-speed rail length (>250 km/h)
1,019 1,3923,711
7,50010,000
13,000
16,000
19,000
22,000
0
5,000
10,000
15,000
20,000
25,000
2007
2008
2009
2010
F
2011
F
2012
F
2013
F
2014
F
2015
F
(km) High-speed rail length (>250 km/h)
Source: MoR, Nomura estimates
Exhibit 115. Railway construction investment
56 57 52 51 62 53 5289
155
338
550
700750
650600 600
177
600
0
100
200
300
400
500
600
700
800
199
8
199
9
200
0
200
1
200
2
200
3
200
4
200
5
200
6
200
7
200
8
200
9
201
0F
201
1F
201
2F
201
3F
201
4F
201
5F
(RMBbn)
(20)
0
20
40
60
80
100
Infrastructure spend in railway (LHS)
y-y growth (%) (RHS)
(%)
Source: MoR, Nomura estimates
Exhibit 116. Railway FAI
89136
208252
417
701
823857
898
19 26 33 55 57 78 100140 180
0
100
200300
400
500
600
700800
900
1,000
2004
2005
2006
2007
2008
2009
2010
F
2011
F
2012
F
(RMBbn) Railway FAI
Railway vehicle investment
89136
208252
417
701
823857
898
19 26 33 55 57 78 100140 180
0
100
200300
400
500
600
700800
900
1,000
2004
2005
2006
2007
2008
2009
2010
F
2011
F
2012
F
(RMBbn) Railway FAI
Railway vehicle investment
Source: MoR, Nomura estimates
Exhibit 117. Railway (km) per thousand sq km
23
70
117
53
5 5 3 519
8
0
20
40
60
80
100
120
140
US
A
Japa
n
Ge
rman
y
Fra
nce
Aus
tral
ia
Ca
nada
Bra
zil
Rus
sia
Indi
a
Chi
na
23
70
117
53
5 5 3 519
8
0
20
40
60
80
100
120
140
US
A
Japa
n
Ge
rman
y
Fra
nce
Aus
tral
ia
Ca
nada
Bra
zil
Rus
sia
Indi
a
Chi
na
Source: CIA, Nomura research
Exhibit 118. Railway (km) per million people
730
208
509 465
143
625
55 59
1,383
1,759
0200400600800
1,0001,2001,4001,6001,8002,000
US
A
Japa
n
Ge
rman
y
Fra
nce
Aus
tral
ia
Can
ada
Bra
zil
Rus
sia
Indi
a
Chi
na
730
208
509 465
143
625
55 59
1,383
1,759
0200400600800
1,0001,2001,4001,6001,8002,000
US
A
Japa
n
Ge
rman
y
Fra
nce
Aus
tral
ia
Can
ada
Bra
zil
Rus
sia
Indi
a
Chi
na
Source: CIA, Nomura research
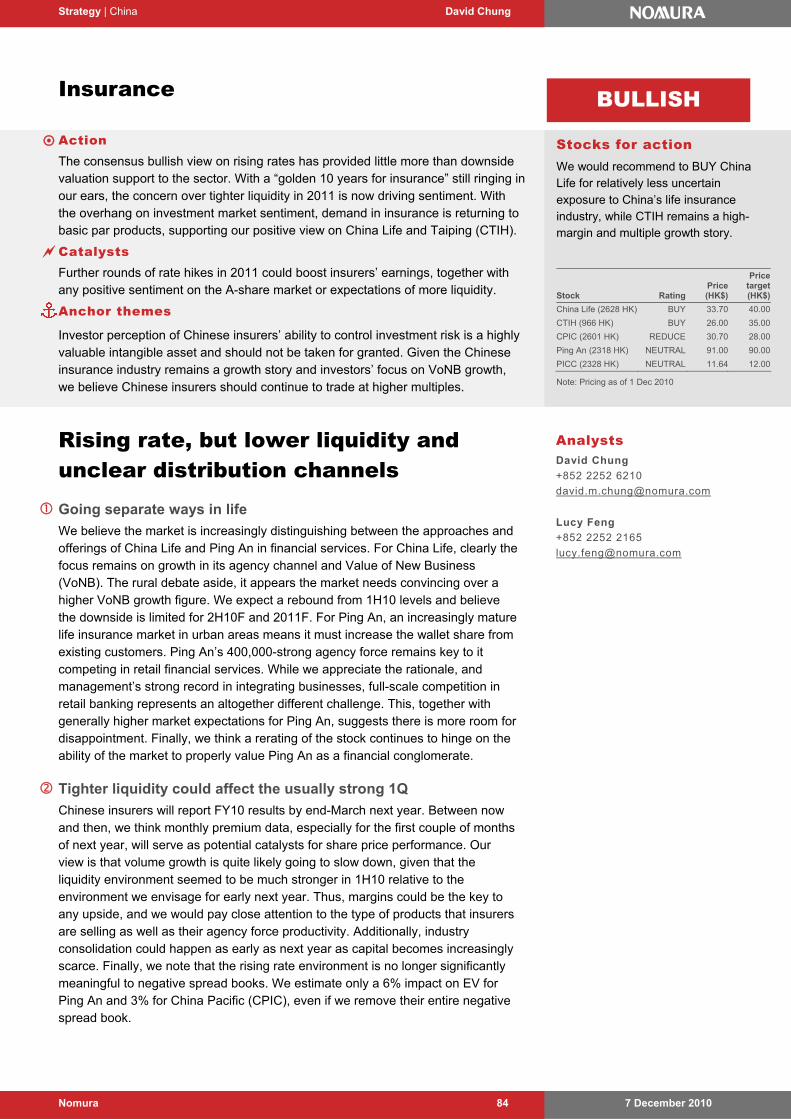
Strategy | China David Chung
7 December 2010 Nomura 84
Insurance
Action The consensus bullish view on rising rates has provided little more than downside
valuation support to the sector. With a “golden 10 years for insurance” still ringing in our ears, the concern over tighter liquidity in 2011 is now driving sentiment. With the overhang on investment market sentiment, demand in insurance is returning to basic par products, supporting our positive view on China Life and Taiping (CTIH).
Catalysts Further rounds of rate hikes in 2011 could boost insurers’ earnings, together with
any positive sentiment on the A-share market or expectations of more liquidity.
Anchor themes
Investor perception of Chinese insurers’ ability to control investment risk is a highly valuable intangible asset and should not be taken for granted. Given the Chinese insurance industry remains a growth story and investors’ focus on VoNB growth, we believe Chinese insurers should continue to trade at higher multiples.
Rising rate, but lower liquidity and unclear distribution channels
Going separate ways in life
We believe the market is increasingly distinguishing between the approaches and offerings of China Life and Ping An in financial services. For China Life, clearly the focus remains on growth in its agency channel and Value of New Business (VoNB). The rural debate aside, it appears the market needs convincing over a higher VoNB growth figure. We expect a rebound from 1H10 levels and believe the downside is limited for 2H10F and 2011F. For Ping An, an increasingly mature life insurance market in urban areas means it must increase the wallet share from existing customers. Ping An’s 400,000-strong agency force remains key to it competing in retail financial services. While we appreciate the rationale, and management’s strong record in integrating businesses, full-scale competition in retail banking represents an altogether different challenge. This, together with generally higher market expectations for Ping An, suggests there is more room for disappointment. Finally, we think a rerating of the stock continues to hinge on the ability of the market to properly value Ping An as a financial conglomerate.
Tighter liquidity could affect the usually strong 1Q
Chinese insurers will report FY10 results by end-March next year. Between now and then, we think monthly premium data, especially for the first couple of months of next year, will serve as potential catalysts for share price performance. Our view is that volume growth is quite likely going to slow down, given that the liquidity environment seemed to be much stronger in 1H10 relative to the environment we envisage for early next year. Thus, margins could be the key to any upside, and we would pay close attention to the type of products that insurers are selling as well as their agency force productivity. Additionally, industry consolidation could happen as early as next year as capital becomes increasingly scarce. Finally, we note that the rising rate environment is no longer significantly meaningful to negative spread books. We estimate only a 6% impact on EV for Ping An and 3% for China Pacific (CPIC), even if we remove their entire negative spread book.
Stocks for action We would recommend to BUY China Life for relatively less uncertain exposure to China’s life insurance industry, while CTIH remains a high-margin and multiple growth story.
BULLISH
Stock RatingPrice (HK$)
Price target (HK$)
China Life (2628 HK) BUY 33.70 40.00
CTIH (966 HK) BUY 26.00 35.00
CPIC (2601 HK) REDUCE 30.70 28.00
Ping An (2318 HK) NEUTRAL 91.00 90.00
PICC (2328 HK) NEUTRAL 11.64 12.00
Note: Pricing as of 1 Dec 2010
Analysts David Chung
+852 2252 6210
Lucy Feng
+852 2252 2165
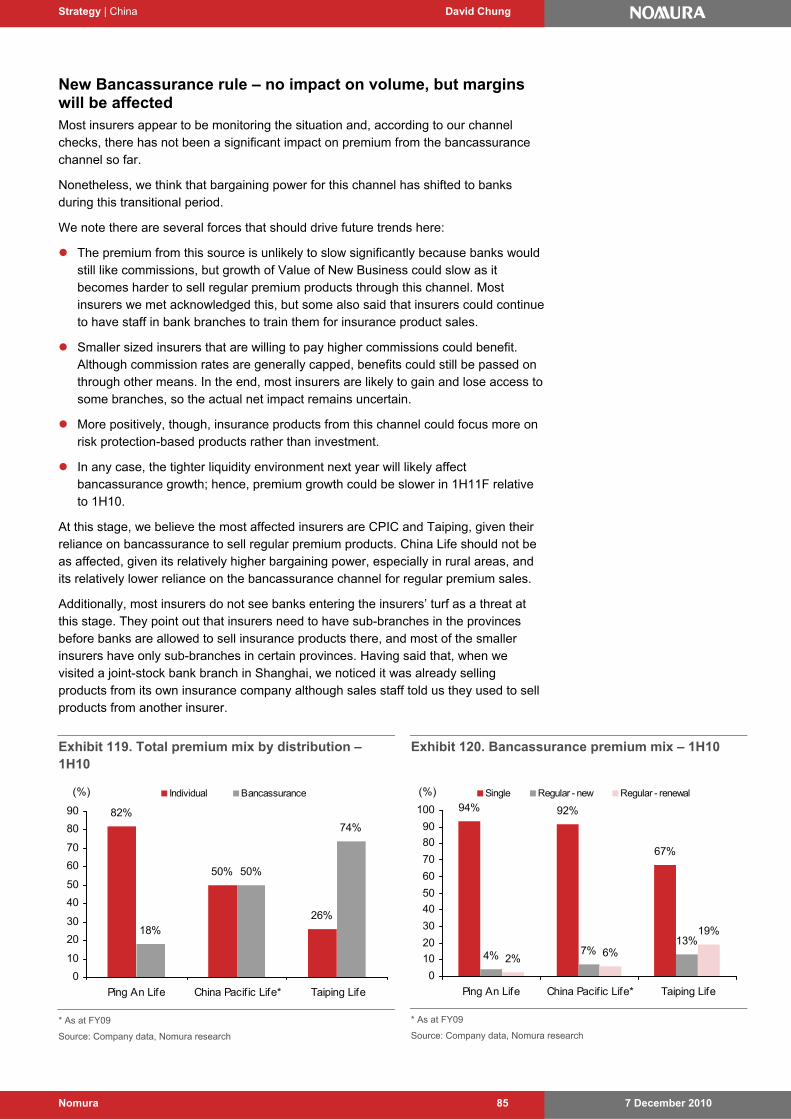
Strategy | China David Chung
7 December 2010 Nomura 85
New Bancassurance rule – no impact on volume, but margins will be affected Most insurers appear to be monitoring the situation and, according to our channel checks, there has not been a significant impact on premium from the bancassurance channel so far.
Nonetheless, we think that bargaining power for this channel has shifted to banks during this transitional period.
We note there are several forces that should drive future trends here:
The premium from this source is unlikely to slow significantly because banks would still like commissions, but growth of Value of New Business could slow as it becomes harder to sell regular premium products through this channel. Most insurers we met acknowledged this, but some also said that insurers could continue to have staff in bank branches to train them for insurance product sales.
Smaller sized insurers that are willing to pay higher commissions could benefit. Although commission rates are generally capped, benefits could still be passed on through other means. In the end, most insurers are likely to gain and lose access to some branches, so the actual net impact remains uncertain.
More positively, though, insurance products from this channel could focus more on risk protection-based products rather than investment.
In any case, the tighter liquidity environment next year will likely affect bancassurance growth; hence, premium growth could be slower in 1H11F relative to 1H10.
At this stage, we believe the most affected insurers are CPIC and Taiping, given their reliance on bancassurance to sell regular premium products. China Life should not be as affected, given its relatively higher bargaining power, especially in rural areas, and its relatively lower reliance on the bancassurance channel for regular premium sales.
Additionally, most insurers do not see banks entering the insurers’ turf as a threat at this stage. They point out that insurers need to have sub-branches in the provinces before banks are allowed to sell insurance products there, and most of the smaller insurers have only sub-branches in certain provinces. Having said that, when we visited a joint-stock bank branch in Shanghai, we noticed it was already selling products from its own insurance company although sales staff told us they used to sell products from another insurer.
Exhibit 119. Total premium mix by distribution – 1H10
82%
50%
26%18%
50%
74%
0
10
20
30
40
50
60
70
80
90
Ping An Life China Pacif ic Life* Taiping Life
Individual Bancassurance(%)
* As at FY09
Source: Company data, Nomura research
Exhibit 120. Bancassurance premium mix – 1H10
94% 92%
67%
4% 7%13%
2% 6%
19%
0
10
20
30
40
50
60
70
80
90
100
Ping An Life China Pacific Life* Taiping Life
Single Regular - new Regular - renewal(%)
* As at FY09
Source: Company data, Nomura research
Strategy | China David Chung
7 December 2010 Nomura 86
Agency reform – chicken and egg, but the impact could be less than expected While the China Insurance Regulatory Commission (CIRC) is clearly interested in improving the social status and financial wellbeing of the agency force, which in turn is likely to drive agency force productivity, there is a lot of push back from insurers.
In any case, if applied, we expect a more gradual change, with higher-productivity agents moving from a contract basis to employees after demonstrating good performance or, for example, switching from an agent to becoming a trainer in bank branches and getting a base pay and welfare benefits (which we see as natural to maintain higher-productivity agents).
As a result, we expect likely higher fixed costs (wage and welfare) but possibly lower variable (commission) costs, which might actually be good for insurers on a net basis.
In addition, in our opinion, changing to an employee basis may not have a significant impact or dramatically change the dynamics of the industry after all.
This is because it is already difficult for insurers to poach high-productivity agents from competitors. By definition, these agents would already be receiving kick-back commissions from the continued stream of regular premiums and therefore would be very costly to poach.
Agents most susceptible to poaching are rising stars who have the potential to grow and are not so expensive to poach. By joining a smaller insurer, these agents are likely to get a better title, income and profit sharing going, and their opportunity costs are also lower.
If a larger insurer can offer better welfare benefits to its employees, it would perhaps make poaching of agents more difficult as, in the end, the commission level is regulated and set by the actuary.
Strategy | China David Chung
7 December 2010 Nomura 87
Intermediary channel gaining momentum – commission rate balancing act begins Clearly, other distribution channels such as direct/phone/internet marketing and intermediaries will continue to be more important, in our opinion. Looking at trends in other developed markets, China is likely to move to a 40:40:20 mix for agents:bancassurance:direct marketing & intermediaries in the medium term.
Generally, direct marketing usually has cheaper acquisition costs but higher claims and losses, and generally applies more to P&C than life insurance. In fact, we understand that in China, the penetration level for phone marketing is already very high. For example, Ping An has already derived over a quarter of its motor business from phone marketing. From overseas experiences, direct marketing usually becomes saturated at certain levels and we believe in China, it could already be quite close to this level given recent aggressive marketing by larger insurers, such as PICC and Ping An.
For intermediaries, we see them becoming more active and in fact, an intermediary guided that intermediaries have been allocated 2011 premium targets that are 2-3x that of 2010 and in addition, they are guiding for higher commission rates. Having said that, we note that commissions for life products are regulated and therefore, we believe there could be some sort of a cap as to how far this rate could go. Additionally, given life insurers focus on quality and premium margin rather than on pure volume, we believe intermediaries will also need to have the same focus and therefore, costs to train high productivity employees.
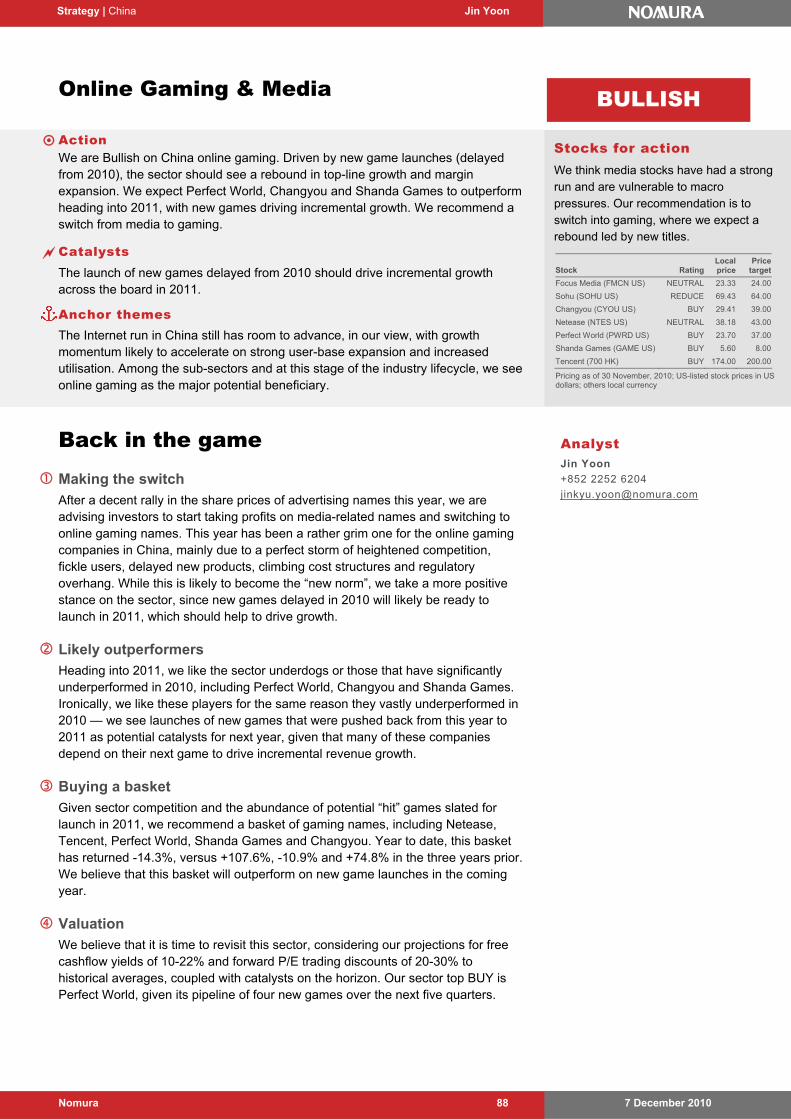
7 December 2010 Nomura 88
Strategy | China Jin Yoon
Online Gaming & Media
Action We are Bullish on China online gaming. Driven by new game launches (delayed
from 2010), the sector should see a rebound in top-line growth and margin expansion. We expect Perfect World, Changyou and Shanda Games to outperform heading into 2011, with new games driving incremental growth. We recommend a switch from media to gaming.
Catalysts The launch of new games delayed from 2010 should drive incremental growth
across the board in 2011.
Anchor themes The Internet run in China still has room to advance, in our view, with growth
momentum likely to accelerate on strong user-base expansion and increased utilisation. Among the sub-sectors and at this stage of the industry lifecycle, we see online gaming as the major potential beneficiary.
Back in the game Making the switch
After a decent rally in the share prices of advertising names this year, we are advising investors to start taking profits on media-related names and switching to online gaming names. This year has been a rather grim one for the online gaming companies in China, mainly due to a perfect storm of heightened competition, fickle users, delayed new products, climbing cost structures and regulatory overhang. While this is likely to become the “new norm”, we take a more positive stance on the sector, since new games delayed in 2010 will likely be ready to launch in 2011, which should help to drive growth.
Likely outperformers
Heading into 2011, we like the sector underdogs or those that have significantly underperformed in 2010, including Perfect World, Changyou and Shanda Games. Ironically, we like these players for the same reason they vastly underperformed in 2010 — we see launches of new games that were pushed back from this year to 2011 as potential catalysts for next year, given that many of these companies depend on their next game to drive incremental revenue growth.
Buying a basket
Given sector competition and the abundance of potential “hit” games slated for launch in 2011, we recommend a basket of gaming names, including Netease, Tencent, Perfect World, Shanda Games and Changyou. Year to date, this basket has returned -14.3%, versus +107.6%, -10.9% and +74.8% in the three years prior. We believe that this basket will outperform on new game launches in the coming year.
Valuation
We believe that it is time to revisit this sector, considering our projections for free cashflow yields of 10-22% and forward P/E trading discounts of 20-30% to historical averages, coupled with catalysts on the horizon. Our sector top BUY is Perfect World, given its pipeline of four new games over the next five quarters.
Stocks for action We think media stocks have had a strong run and are vulnerable to macro pressures. Our recommendation is to switch into gaming, where we expect a rebound led by new titles.
BULLISH
Stock RatingLocal price
Price target
Focus Media (FMCN US) NEUTRAL 23.33 24.00
Sohu (SOHU US) REDUCE 69.43 64.00
Changyou (CYOU US) BUY 29.41 39.00
Netease (NTES US) NEUTRAL 38.18 43.00
Perfect World (PWRD US) BUY 23.70 37.00
Shanda Games (GAME US) BUY 5.60 8.00
Tencent (700 HK) BUY 174.00 200.00
Pricing as of 30 November, 2010; US-listed stock prices in US dollars; others local currency
Analyst Jin Yoon
+852 2252 6204
Strategy | China Jin Yoon
7 December 2010 Nomura 89
Turning positive on online gaming Making the switch. After a decent rally in the share prices of advertising names
this year, we are advising investors to start to take profits on media-related names and switching to online gaming names. The advertising industry in China performed poorly in 2009, but so far in 2010, it has recovered on an improved economy, rising consumption growth and special one-off events, including the World Cup and the World Expo. Coming off a low base in 2009, Internet advertising companies in China have outperformed in 2010 as the secular growth story remains intact. We believe that the Internet advertising outlook in China remains positive in the longer term, and we remain positive on the Chinese consumption story and the switch from traditional to digital media. However, we believe the share prices of Internet advertising companies in China would not continue to see strong increases in 2011F, due to higher comparables and lack of one-off special events. We would be taking profits on Media-related names and switching to online gaming.
Business environment to improve. This has been a rather grim year for online gaming companies, mainly owing to a perfect storm of heightened competition, fickle users, delayed new products, climbing cost structures and regulatory overhang. While this is likely to become the “new norm”, we take a more positive stance on the sector, since new games delayed in 2010 will be ready to launch in 2011, which should help to stir interest from gamers and investors alike.
Margin relief ahead. We continue to believe that non-GAAP operating margins will never again reach prior years’ historical highs (55%-plus). A lack of top-line leverage for many of the game companies plus rising costs and licensing fees has resulted in a dramatic drop in operating margins in 2010 of as much as 10%-plus from last year’s levels. In 2011, we see margin run rates improving for gaming companies, due largely to better top-line leverage as delayed new games will soon hit the marketplace, providing incremental revenues.
The unlikely overachievers. Internet businesses are highly monopolistic, largely due to strong networking impact. Hence, we see companies such as Tencent, Baidu and Alibaba.com trading at a significant premium to peers. However, heading into 2011, we like sector underdogs or companies that have significantly underperformed in 2010, including Perfect World, Changyou and Shanda Games. These companies do not possess the “edge” in maintaining sticky traffic, thus we believe they will not be as structurally sound as Tencent or Baidu. However, we believe these three companies will outperform peers in 2011, mainly on new game catalysts. Ironically, we like these companies in 2011 for the same reason that they significantly underperformed in 2010 — we see new game launches that were pushed back from this year to 2011 as catalysts for next year, given that many of these companies depend on their next game to drive incremental revenue growth.
Buying a basket. Given sector competition and the significant number of potential “hit” games to be launched in 2011, we believe that buying a basket of gaming names may prove to be prudent. On examining a basket of gaming names including Netease, Shanda Games, Perfect World, Tencent and Sohu/Changyou, we see a wave-like pattern where the basket of companies outperforms/ underperforms the NASDAQ every other year. Year to date, the basket has returned -14.3%, versus +107.6%, -10.9% and +74.8% in the three years prior. We believe the group can outperform given that various companies will be launching new games in the coming year.
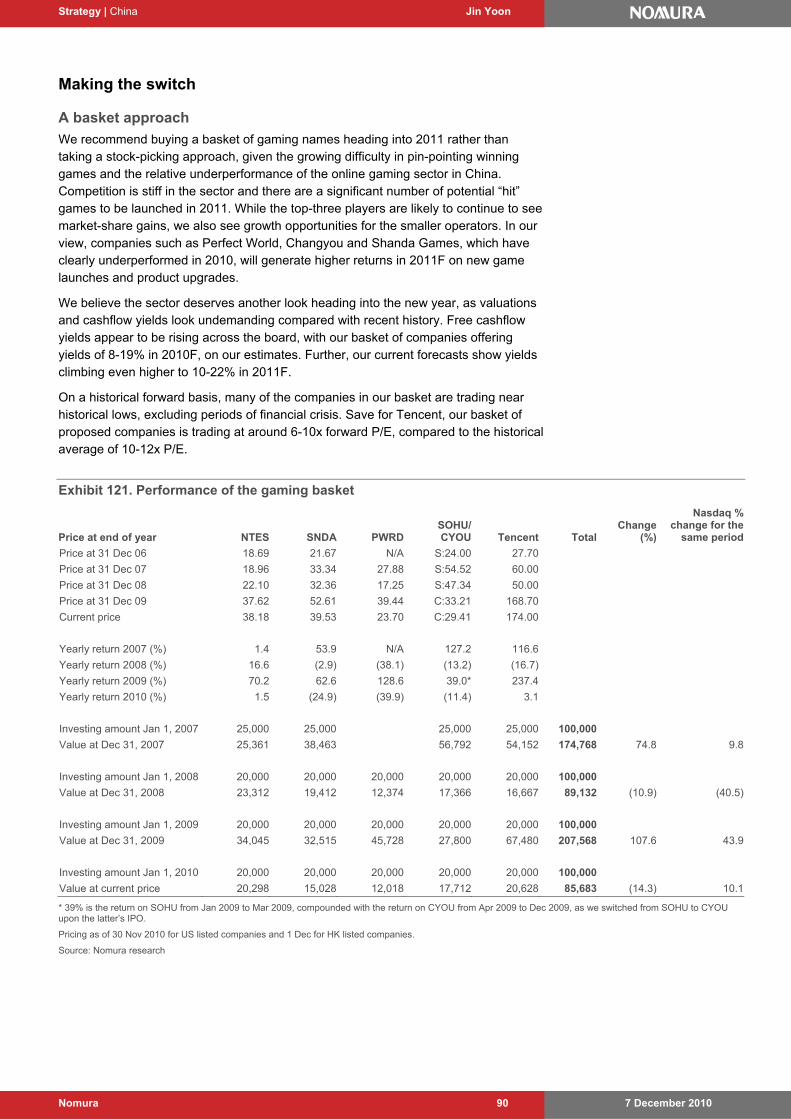
Strategy | China Jin Yoon
7 December 2010 Nomura 90
Making the switch
A basket approach
We recommend buying a basket of gaming names heading into 2011 rather than taking a stock-picking approach, given the growing difficulty in pin-pointing winning games and the relative underperformance of the online gaming sector in China. Competition is stiff in the sector and there are a significant number of potential “hit” games to be launched in 2011. While the top-three players are likely to continue to see market-share gains, we also see growth opportunities for the smaller operators. In our view, companies such as Perfect World, Changyou and Shanda Games, which have clearly underperformed in 2010, will generate higher returns in 2011F on new game launches and product upgrades.
We believe the sector deserves another look heading into the new year, as valuations and cashflow yields look undemanding compared with recent history. Free cashflow yields appear to be rising across the board, with our basket of companies offering yields of 8-19% in 2010F, on our estimates. Further, our current forecasts show yields climbing even higher to 10-22% in 2011F.
On a historical forward basis, many of the companies in our basket are trading near historical lows, excluding periods of financial crisis. Save for Tencent, our basket of proposed companies is trading at around 6-10x forward P/E, compared to the historical average of 10-12x P/E.
Exhibit 121. Performance of the gaming basket
Price at end of year NTES SNDA PWRDSOHU/ CYOU Tencent Total
Change (%)
Nasdaq % change for the
same period
Price at 31 Dec 06 18.69 21.67 N/A S:24.00 27.70
Price at 31 Dec 07 18.96 33.34 27.88 S:54.52 60.00
Price at 31 Dec 08 22.10 32.36 17.25 S:47.34 50.00
Price at 31 Dec 09 37.62 52.61 39.44 C:33.21 168.70
Current price 38.18 39.53 23.70 C:29.41 174.00
Yearly return 2007 (%) 1.4 53.9 N/A 127.2 116.6
Yearly return 2008 (%) 16.6 (2.9) (38.1) (13.2) (16.7)
Yearly return 2009 (%) 70.2 62.6 128.6 39.0* 237.4
Yearly return 2010 (%) 1.5 (24.9) (39.9) (11.4) 3.1
Investing amount Jan 1, 2007 25,000 25,000 25,000 25,000 100,000
Value at Dec 31, 2007 25,361 38,463 56,792 54,152 174,768 74.8 9.8
Investing amount Jan 1, 2008 20,000 20,000 20,000 20,000 20,000 100,000
Value at Dec 31, 2008 23,312 19,412 12,374 17,366 16,667 89,132 (10.9) (40.5)
Investing amount Jan 1, 2009 20,000 20,000 20,000 20,000 20,000 100,000
Value at Dec 31, 2009 34,045 32,515 45,728 27,800 67,480 207,568 107.6 43.9
Investing amount Jan 1, 2010 20,000 20,000 20,000 20,000 20,000 100,000
Value at current price 20,298 15,028 12,018 17,712 20,628 85,683 (14.3) 10.1
* 39% is the return on SOHU from Jan 2009 to Mar 2009, compounded with the return on CYOU from Apr 2009 to Dec 2009, as we switched from SOHU to CYOU upon the latter’s IPO.
Pricing as of 30 Nov 2010 for US listed companies and 1 Dec for HK listed companies.
Source: Nomura research
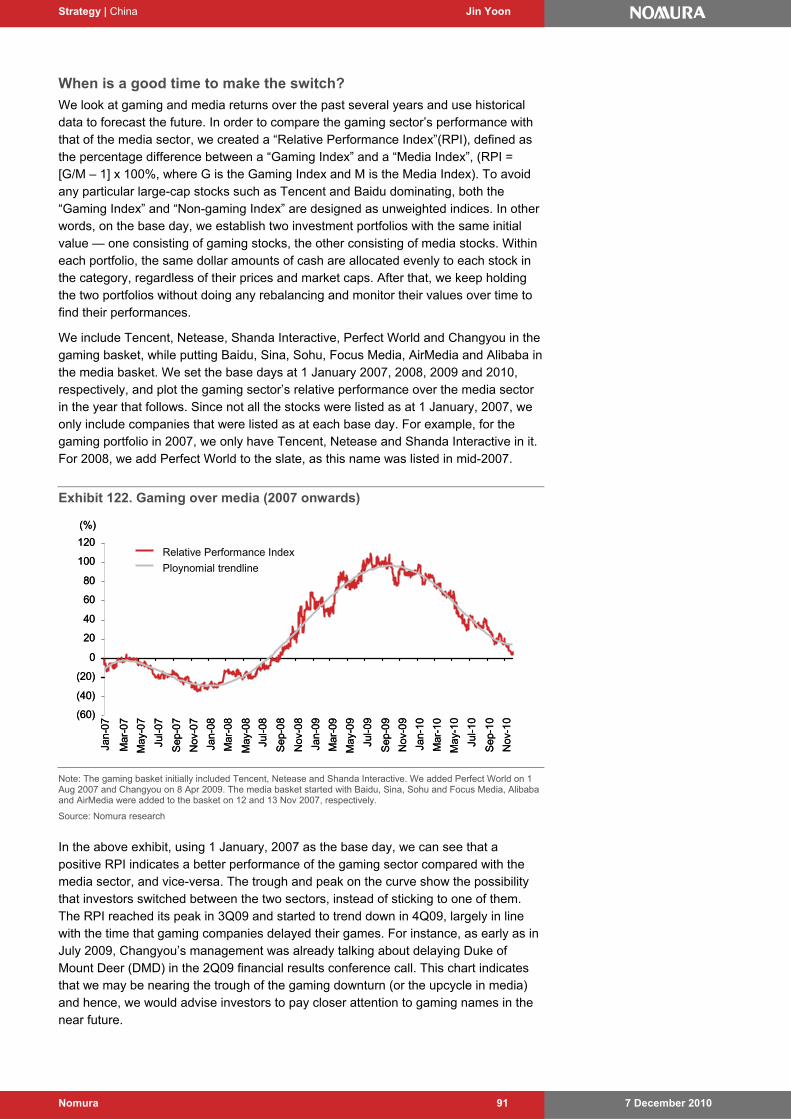
Strategy | China Jin Yoon
7 December 2010 Nomura 91
When is a good time to make the switch?
We look at gaming and media returns over the past several years and use historical data to forecast the future. In order to compare the gaming sector’s performance with that of the media sector, we created a “Relative Performance Index”(RPI), defined as the percentage difference between a “Gaming Index” and a “Media Index”, (RPI = [G/M – 1] x 100%, where G is the Gaming Index and M is the Media Index). To avoid any particular large-cap stocks such as Tencent and Baidu dominating, both the “Gaming Index” and “Non-gaming Index” are designed as unweighted indices. In other words, on the base day, we establish two investment portfolios with the same initial value — one consisting of gaming stocks, the other consisting of media stocks. Within each portfolio, the same dollar amounts of cash are allocated evenly to each stock in the category, regardless of their prices and market caps. After that, we keep holding the two portfolios without doing any rebalancing and monitor their values over time to find their performances.
We include Tencent, Netease, Shanda Interactive, Perfect World and Changyou in the gaming basket, while putting Baidu, Sina, Sohu, Focus Media, AirMedia and Alibaba in the media basket. We set the base days at 1 January 2007, 2008, 2009 and 2010, respectively, and plot the gaming sector’s relative performance over the media sector in the year that follows. Since not all the stocks were listed as at 1 January, 2007, we only include companies that were listed as at each base day. For example, for the gaming portfolio in 2007, we only have Tencent, Netease and Shanda Interactive in it. For 2008, we add Perfect World to the slate, as this name was listed in mid-2007.
Exhibit 122. Gaming over media (2007 onwards)
(60)
(40)
(20)
0
20
40
60
80
100
120
Jan-
07
Mar
-07
May
-07
Jul-0
7
Sep
-07
Nov
-07
Jan-
08
Mar
-08
May
-08
Jul-0
8
Sep
-08
Nov
-08
Jan-
09
Mar
-09
May
-09
Jul-0
9
Sep
-09
Nov
-09
Jan-
10
Mar
-10
May
-10
Jul-1
0
Sep
-10
Nov
-10
Relative Performance Index
Ploynomial trendline
(%)
(60)
(40)
(20)
0
20
40
60
80
100
120
Jan-
07
Mar
-07
May
-07
Jul-0
7
Sep
-07
Nov
-07
Jan-
08
Mar
-08
May
-08
Jul-0
8
Sep
-08
Nov
-08
Jan-
09
Mar
-09
May
-09
Jul-0
9
Sep
-09
Nov
-09
Jan-
10
Mar
-10
May
-10
Jul-1
0
Sep
-10
Nov
-10
Relative Performance Index
Ploynomial trendline
(%)
Note: The gaming basket initially included Tencent, Netease and Shanda Interactive. We added Perfect World on 1 Aug 2007 and Changyou on 8 Apr 2009. The media basket started with Baidu, Sina, Sohu and Focus Media, Alibaba and AirMedia were added to the basket on 12 and 13 Nov 2007, respectively.
Source: Nomura research
In the above exhibit, using 1 January, 2007 as the base day, we can see that a positive RPI indicates a better performance of the gaming sector compared with the media sector, and vice-versa. The trough and peak on the curve show the possibility that investors switched between the two sectors, instead of sticking to one of them. The RPI reached its peak in 3Q09 and started to trend down in 4Q09, largely in line with the time that gaming companies delayed their games. For instance, as early as in July 2009, Changyou’s management was already talking about delaying Duke of Mount Deer (DMD) in the 2Q09 financial results conference call. This chart indicates that we may be nearing the trough of the gaming downturn (or the upcycle in media) and hence, we would advise investors to pay closer attention to gaming names in the near future.
Strategy | China Charlene Liu
7 December 2010 Nomura 92
Macau gaming
Action Off a VIP-driven high base in 2010F, we think mass market will take over as the
main growth driver in 2011F. Aside from bringing faster growth, we think that what mass market business lacks in glamour, it makes up for with margin and cashflow sustainability. We forecast 2011F GGR growth of 18% for Macau, and see the table cap improving clarity on supply and earnings. Our top picks are the dominant mass market players offering attractive valuations, namely SJM and Sands China.
Catalysts Macau stands to benefit from continued infrastructure enhancement, a potential
increase in foreign labour approvals and China consumption growth.
Anchor themes
Cashflow sustainability is what we are looking for in 2011F. We favour stocks with an enduring competitive advantage, resilient qualities that can help to counter a downturn and relatively inexpensive valuations.
Mass market wins hands down Macau gaming revenue growth of 18% y-y in 2011F
Macau’s underlying story continues to be China, with growth this year of more than 50% y-y amid a surge in Chinese consumption and diversion of liquidity from China. Specifically, strong VIP revenue growth has been driven by a mix of: 1) the opening of new VIP facilities; 2) property tightening measures encouraging liquidity to exit China; 3) the robust economy helping to speed up the repayment cycle for gamblers; and 4) new sources of funding. For next year, we think the base effect will make it tough for the VIP segment to register much growth. The mass market segment, however, will likely continue to see growth on increased connectivity to China. We see potential upside to our 18% pa gross gaming revenue (GGR) growth forecast from the opening of Galaxy Macau and infrastructure enhancements.
Long-lasting structural change favours high-margin mass market
The sort of VIP revenue growth seen last year is contingent on the sustainability of junket liquidity, which investors have no systematic way of gauging. For 2011F, we expect stronger growth from mass market business on structural changes from infrastructure enhancements, which should have a more lasting impact and thus improve earnings visibility. Moreover, while mass market business, which we see as the growth driver for 2011F, may look modest at the top line, it generates margins that are 3-4x those of VIP business, on our estimates.
Favourable supply-demand dynamics enhance earnings visibility
With table numbers capped by the Macau government at 5,500 through 2013F (extended from 2012F), we estimate supply growth will be kept in check at a healthy 13% spread over the next three years. Therefore, provided demand growth exceeds that range, the operational environment will likely remain favourable for gaming operators. Future supply-demand dynamics should help investors to gain a better sense of earnings expectations for the industry.
BUY mass market dominant players
SJM and Sands China offer investors access to the faster-growing mass market GGR in 2011F at attractive valuations. Approval of Cotai land (likely by year-end) for SJM and further foreign labour approvals for Sands China are upcoming potential catalysts for the stocks. We recommend accumulating on any pullbacks.
Analyst Charlene Liu
+852 2252 6134
Stocks for action Our top BUYs in the Macau gaming space are SJM and Sands China, both dominant mass market players with attractive-looking valuations.
Stock Rating
Local price
(1 Dec)Price
target
SJM (880 HK) BUY 12.18 15
Sands China (1928 HK)
BUY 17.40 20
Pricing as of 1 December, 2010; local currency
NEUTRAL
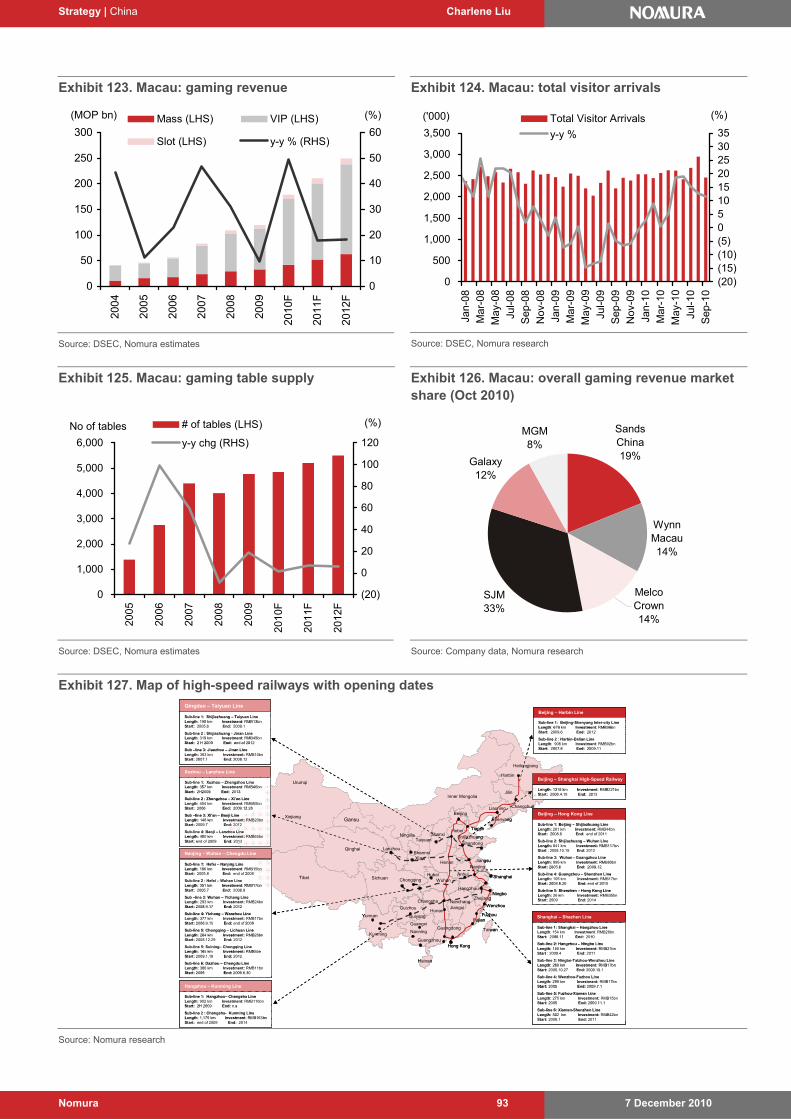
Strategy | China Charlene Liu
7 December 2010 Nomura 93
Exhibit 123. Macau: gaming revenue
0
50
100
150
200
250
300
2004
2005
2006
2007
2008
2009
2010
F
2011
F
2012
F
0 %
10
20
30
40
50
60 Mass (LHS) VIP (LHS)
Slot (LHS) y-y % (RHS)
(MOP bn) (%)
Source: DSEC, Nomura estimates
Exhibit 124. Macau: total visitor arrivals
0
500
1,000
1,500
2,000
2,500
3,000
3,500
Jan-
08
Mar
-08
May
-08
Jul-0
8
Sep
-08
Nov
-08
Jan-
09
Mar
-09
May
-09
Jul-0
9
Sep
-09
Nov
-09
Jan-
10
Mar
-10
May
-10
Jul-1
0
Sep
-10
('000)
(20)(15)(10)(5)05101520253035
Total Visitor Arrivals
y-y %
4
(%)
Source: DSEC, Nomura research
Exhibit 125. Macau: gaming table supply
0
1,000
2,000
3,000
4,000
5,000
6,000
2005
2006
2007
2008
2009
2010
F
2011
F
2012
F
No of tables
(20)
0
20
40
60
80
100
120
# of tables (LHS)
y-y chg (RHS)
(%)
Source: DSEC, Nomura estimates
Exhibit 126. Macau: overall gaming revenue market share (Oct 2010)
Sands China19%
Wynn Macau14%
SJM33%
Galaxy12%
MGM8%
Melco Crown14%
Source: Company data, Nomura research
Exhibit 127. Map of high-speed railways with opening dates
Harbin
Changchun
Shenyang
Tianjin
Beijing
Shanghai
Hangzhou
Taiwan
GuangzhouHong Kong
Nanning
Taiyuan
NanchangChangsha
Guiyang
Chongqing
Kunming
Urumqi
Xian
Lanzhou
Heilongjiang
Jilin
Liaoning
HebeiShanxi
Shandong
Anhui
Zhejiang
Fujian
Jiangxi
Hubei
Hunan
GuangdongGuangxi
Hainan
Yunnan
Guizhou
Sichuan
Shannxi
Ningxia
Gansu
Qinghai
Tibet
Xinjiang
Inner Mongolia
Henan Jiangsu
Ningbo
Wenzhou
Fuzhou
Beijing – Harbin Line
Sub-line 1: Beijing-Shenyang Inter-city LineLength: 676 km Investment: RMB96bnStart: 2009.6 End: 2012
Sub-line 2 : Harbin-Dalian LineLength: 906 km Investment: RMB92bnStart: 2007.8 End: 2009.11
Beijing – Shanghai High-Speed Railway
Length: 1318 km Investment: RMB221bnStart: 2008.4.18 End: 2013
Beijing – Hong Kong Line
Sub-line 1: Beijing – Shijiazhuang LineLength: 281 km Investment: RMB44bn Start: 2008.6 End: end of 2011
Sub-line 2: Shijiazhuang – Wuhan LineLength: 841 km Investment: RMB117bn Start : 2008.10.15 End: 2012
Sub-line 3: Wuhan - Guangzhou LineLength: 995 km Investment: RMB93bn Start: 2005.6 End: 2009.12
Sub-line 4: Guangzhou – Shenzhen LineLength: 105 km Investment: RMB17bn Start: 2008.8.20 End: end of 2010
Sub-line 5: Shenzhen – Hong Kong LineLength: 26 km Investment: RMB35bnStart: 2009 End: 2014
Shanghai – Shezhen Line
Sub-line 1: Shanghai – Hangzhou LineLength: 154 km Investment: RMB26bnStart: 2008.11 End: 2010
Sub-line 2: Hangzhou – Ningbo LineLength: 150 km Investment: RMB21bn Start : 2009.4 End: 2011
Sub-line 3: Ningbo-Taizhou-Wenzhou LineLength: 268 km Investment: RMB17bnStart: 2005.10.27 End: 2009.10.1
Sub-line 4: Wenzhou-Fuzhou LineLength: 298 km Investment: RMB17bnStart: 2005 End: 2009.7.1
Sub-line 5: Fuzhou-Xiamen LineLength: 275 km Investment: RMB15bn Start: 2005 End: 2009.11.1
Sub-line 6: Xiamen-Shenzhen LineLength: 502 km Investment: RMB42bn Start: 2008.1 End: 2011
Xuzhou – Lanzhou Line
Sub-line 1: Xuzhou – Zhengzhou LineLength: 357 km Investment: RMB46bn Start: 2H2009 End: 2013
Sub-line 2 : Zhengzhou – Xi’an LineLength: 454 km Investment: RMB55bnStart: 2006 End: 2009.12.28
Sub –line 3: Xi’an – Baoji LineLength: 148 km Investment: RMB20bnStart: 2009.7 End: 2012
Sub-line 4: Baoji – Lanzhou LineLength: 400 km Investment: RMB65bnStart: end of 2009 End: 2013
Qingdao – Taiyuan Line
Sub-line 1: Shijiazhuang – Taiyuan LineLength: 190 km Investment: RMB13bnStart: 2005.6 End: 2009.1
Sub-line 2 : Shijiazhuang - Jinan LineLength: 319 km Investment: RMB45bnStart: 2 H 2009 End: end of 2012
Sub –line 3: Jiaozhou – Jinan LineLength: 363 km Investment: RMB10bnStart: 2007.1 End: 2008.12
Nanjing – Wuhan – Chengdu Line
Sub-line 1: Hefei – Nanjing LineLength: 166 km Investment: RMB15bnStart: 2005.8 End: end of 2008
Sub-line 2 : Hefei – Wuhan LineLength: 351 km Investment: RMB17bnStart: 2005.7 End: 2008.9
Sub –line 3: Wuhan – Yichang LineLength: 293 km Investment: RMB24bnStart: 2008.9.17 End: 2012
Sub-line 4: Yichang – Wanzhou LineLength: 377 km Investment: RMB17bnStart: 2006.9.15 End: end of 2009
Sub-line 5: Chongqing – Lichuan LineLength: 264 km Investment: RMB26bnStart: 2008.12.29 End: 2012
Sub-line 5: Suining– Chongqing LineLength: 165 km Investment: RMB5bnStart: 2009.1.18 End: 2012
Sub-line 6: Dazhou – Chengdu LineLength: 386 km Investment: RMB11bnStart: 2005 End: 2009.6.30
Hangzhou – Kunming Line
Sub-line 1: Hangzhou– Changsha LineLength: 902 km Investment: RMB116bnStart: 2H 2009 End: n.a
Sub-line 2 : Changsha- Kunming LineLength: 1,175 km Investment: RMB163bnStart: end of 2009 End: 2014
Nanjing
Wuhan
Shijiazhuang
Source: Nomura research
7 December 2010 Nomura 94
Strategy | China Cheng Khoo
Oil and Gas
Action Sinopec is our near-term top pick in the China oil and gas sector, due to appealing
valuations, upside in petrochem earnings, and a likely rerating of the stock in line with its improving returns, despite our assumption of low refining margins. Reaffirm BUY rating and price target of HK$9.60, based on ROACE/WACC (14.3%/10.3%).
Catalysts The next catalyst could be when the government improves the oil product pricing
mechanism or VAT on oil products, which we believe could be towards end-2010F or early 2011F.
Anchor themes We believe the chemical sector is poised to enter a Golden Age, benefiting from
rising demand and restrained capacity additions over the next two years. This should result in improved margins and petrochem sector earnings.
Policies and regulatory changes Regulations and taxes
We believe there are several outstanding regulatory changes which could impact the sector in 2011. These include changes in the pricing mechanism for refined oil products and natural gas which, if implemented, should result in a favourable outcome for oil companies. In terms of taxes, there are outstanding changes in: 1) implementing nationwide resource tax; 2) raising the hurdle rate of the windfall tax (currently at US$40/bbl); and 3) VAT on refined oil products and consumption tax. We believe that if the government were to implement a resource tax on oil crude oil and natural gas production, it would most likely raise the hurdle rate of the windfall tax. We think this would likely be relatively neutral for Petrochina and Sinopec, though much depends on the hurdle rate of the windfall tax. This does, however, present an uncertainty for CNOOC, since we cannot verify if it will be required to pay the resource tax. As for the revamp on the VAT on oil products + consumption tax, the likely outcome should be favourable to Sinopec and Petrochina, we believe.
Gas pricing mechanism
The government increased domestic wellhead gas prices by RMB230 per ‘000 cm, or around 25% on average, effective June 2010. This was a positive step for domestic gas producers such as Petrochina and Sinopec. However, the domestic price, which averages US$4.6/mcf, is still below the imported price. In particular, the price of gas imported from Turkmenistan was contracted at around RMB3/m3 but the selling price was set at only RMB1.8/m3. Since the volume imported from Central Asia was a modest 5-6bcm, the overall price increase should, we think, offset the price difference for gas from Central Asia. We think the government will further increase the selling price of gas from Turkmenistan as import volumes increase, though there is a risk that the timing of the increase may not be later rather than sooner, considering inflation and the lag in the downstream price increases. Eventually, we expect the government to introduce a pricing mechanism that tracks alternative fuel prices. We believe this could be the next catalyst for Petrochina’s share price, without which the stock may not perform.
Stocks for action Sinopec is our near-term top pick in the China oil and gas sector.
BULLISH
Stock RatingLocal price
Price target
Petrochina (857 HK)
BUY 9.74 13.0
Sinopec (386 HK) BUY 7.28 9.60
CNOOC (883 HK) BUY 16.98 19.50
Shanghai Petrochem (338 HK)
BUY 3.90 4.20
Kunlun Energy (135 HK)
BUY 11.54 13.50
Priced as 1 December, 2010
Analysts Cheng Khoo
+852 2252 6180
Gordon Wai
+852 2252 6176
Strategy | China Cheng Khoo
7 December 2010 Nomura 95
Expecting an improved oil product pricing mechanism
We believe the government is likely to modify the mechanism by shortening the number of days (currently 22 working days) and narrowing the trigger (currently 4% of oil price fluctuation), which we think should be positive for their refining sector. While the government has not given specific timing for the change, we believe it is possible that the new measures will be announced at the end of 2010F or early 2011F.
Since the introduction of the pricing mechanism at end-2008, the NDRC followed the mechanism strictly in 1H09 but then found that margins were extremely high. Since 1H09, margins have fallen and prices are now in line with regional levels, indicating the government has already reset prices from the initially high levels. Going forward, we believe margins are likely to be in line with regional levels and price changes will take into consideration regional product prices rather than just crude oil prices.
Our view is that the government is unlikely to let the refiners incur losses, since losses would deter future investment in the sector, which would ultimately lead to a shortage in the system. However, we think it is unlikely that the government will allow windfall profits, such as those in 1H09, especially in light of the inflationary environment. We think the government will probably lower the VAT burden on the refiners and allow a narrow margin that moves more in line with international prices.
On our reading, future product price hikes will be beneficial to Sinopec, Shanghai Pet, Petrochina and Kunlun Energy. Even though Kunlun Energy is not a refiner, CNG prices are linked to gasoline prices at a ratio of 1:0.75.
Oil price to edge up
Weakness in the US dollar, abundant money supply and, potentially, higher inflation expectations that could come with QE-2, plus strengthening in oil fundamentals via higher demand in 2011F, could fuel higher oil prices. We believe oil prices could reach US$100/bbl in the coming year. We forecast oil prices will average US$95/bbl in 2011F, up around 20% y-y. CNOOC, being the only pure E&P company in China, will likely see its share price trade higher with oil prices, in our view.
Petrochemicals – transition year before entering a Golden Age
We believe the chemical sector is poised to enter a Golden Age, benefiting from rising demand and restrained capacity additions over the next two years. We believe that rising consumption growth in China brought about by favourable government policies, structural factors and the 12th Five-year Plan are likely to result in stronger chemical demand growth. In terms of supply, we think we are close to passing the peak of new cracker start-ups. The last phase of ethylene expansion will likely be over by early 2011F, we believe, after which we expect the sector to transition into a Golden Age for petrochemicals. We project margins across a range of key products will be strong in 2011F. For gearing to petrochemicals, we are most positive on Shanghai Pet (BUY) followed by Sinopec (BUY) and Petrochina (BUY).
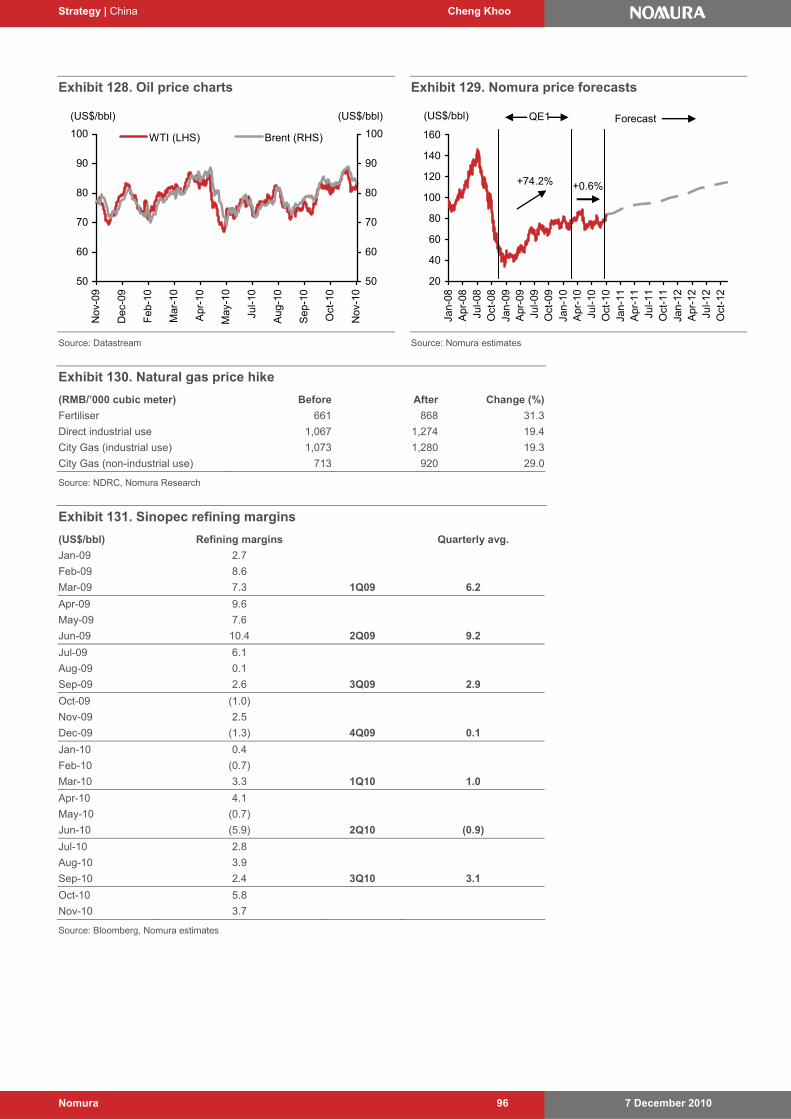
Strategy | China Cheng Khoo
7 December 2010 Nomura 96
Exhibit 128. Oil price charts
50
60
70
80
90
100
Nov
-09
Dec
-09
Feb
-10
Mar
-10
Apr
-10
May
-10
Jul-1
0
Aug
-10
Sep
-10
Oct
-10
Nov
-10
(US$/bbl)
50
60
70
80
90
100
(US$/bbl)
WTI (LHS) Brent (RHS)
Source: Datastream
Exhibit 129. Nomura price forecasts
20
40
60
80
100
120
140
160
Jan-
08A
pr-0
8Ju
l-08
Oct
-08
Jan-
09A
pr-0
9Ju
l-09
Oct
-09
Jan-
10A
pr-1
0Ju
l-10
Oct
-10
Jan-
11A
pr-1
1Ju
l-11
Oct
-11
Jan-
12A
pr-1
2Ju
l-12
Oct
-12
(US$/bbl) QE1
+74.2% +0.6%
Forecast
Source: Nomura estimates
Exhibit 130. Natural gas price hike
(RMB/’000 cubic meter) Before After Change (%)
Fertiliser 661 868 31.3
Direct industrial use 1,067 1,274 19.4
City Gas (industrial use) 1,073 1,280 19.3
City Gas (non-industrial use) 713 920 29.0
Source: NDRC, Nomura Research
Exhibit 131. Sinopec refining margins
(US$/bbl) Refining margins Quarterly avg.
Jan-09 2.7
Feb-09 8.6
Mar-09 7.3 1Q09 6.2
Apr-09 9.6
May-09 7.6
Jun-09 10.4 2Q09 9.2
Jul-09 6.1
Aug-09 0.1
Sep-09 2.6 3Q09 2.9
Oct-09 (1.0)
Nov-09 2.5
Dec-09 (1.3) 4Q09 0.1
Jan-10 0.4
Feb-10 (0.7)
Mar-10 3.3 1Q10 1.0
Apr-10 4.1
May-10 (0.7)
Jun-10 (5.9) 2Q10 (0.9)
Jul-10 2.8
Aug-10 3.9
Sep-10 2.4 3Q10 3.1
Oct-10 5.8
Nov-10 3.7
Source: Bloomberg, Nomura estimates
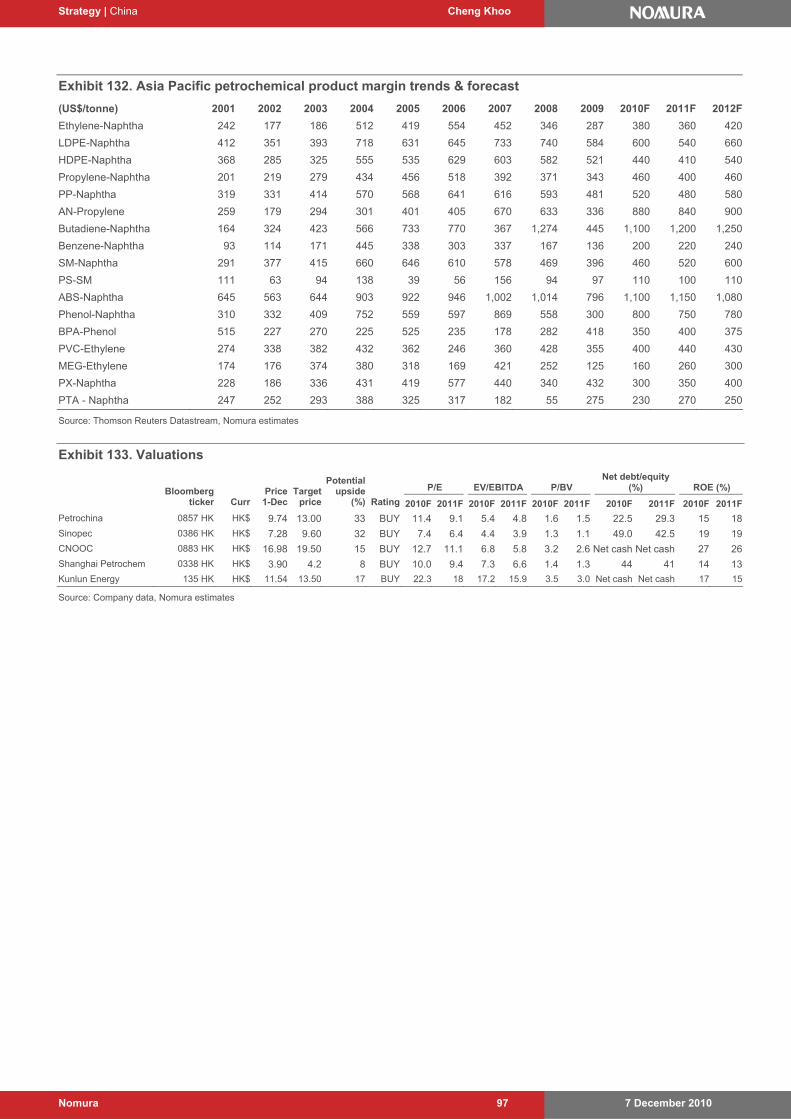
Strategy | China Cheng Khoo
7 December 2010 Nomura 97
Exhibit 132. Asia Pacific petrochemical product margin trends & forecast
(US$/tonne) 2001 2002 2003 2004 2005 2006 2007 2008 2009 2010F 2011F 2012F
Ethylene-Naphtha 242 177 186 512 419 554 452 346 287 380 360 420
LDPE-Naphtha 412 351 393 718 631 645 733 740 584 600 540 660
HDPE-Naphtha 368 285 325 555 535 629 603 582 521 440 410 540
Propylene-Naphtha 201 219 279 434 456 518 392 371 343 460 400 460
PP-Naphtha 319 331 414 570 568 641 616 593 481 520 480 580
AN-Propylene 259 179 294 301 401 405 670 633 336 880 840 900
Butadiene-Naphtha 164 324 423 566 733 770 367 1,274 445 1,100 1,200 1,250
Benzene-Naphtha 93 114 171 445 338 303 337 167 136 200 220 240
SM-Naphtha 291 377 415 660 646 610 578 469 396 460 520 600
PS-SM 111 63 94 138 39 56 156 94 97 110 100 110
ABS-Naphtha 645 563 644 903 922 946 1,002 1,014 796 1,100 1,150 1,080
Phenol-Naphtha 310 332 409 752 559 597 869 558 300 800 750 780
BPA-Phenol 515 227 270 225 525 235 178 282 418 350 400 375
PVC-Ethylene 274 338 382 432 362 246 360 428 355 400 440 430
MEG-Ethylene 174 176 374 380 318 169 421 252 125 160 260 300
PX-Naphtha 228 186 336 431 419 577 440 340 432 300 350 400
PTA - Naphtha 247 252 293 388 325 317 182 55 275 230 270 250
Source: Thomson Reuters Datastream, Nomura estimates
Exhibit 133. Valuations
P/E EV/EBITDA P/BV Net debt/equity
(%) ROE (%)
Bloomberg
ticker
Curr Price 1-Dec
Target
price
Potentialupside
(%)
Rating 2010F 2011F 2010F 2011F 2010F 2011F 2010F 2011F 2010F 2011F
Petrochina 0857 HK HK$ 9.74 13.00 33 BUY 11.4 9.1 5.4 4.8 1.6 1.5 22.5 29.3 15 18
Sinopec 0386 HK HK$ 7.28 9.60 32 BUY 7.4 6.4 4.4 3.9 1.3 1.1 49.0 42.5 19 19
CNOOC 0883 HK HK$ 16.98 19.50 15 BUY 12.7 11.1 6.8 5.8 3.2 2.6 Net cash Net cash 27 26
Shanghai Petrochem 0338 HK HK$ 3.90 4.2 8 BUY 10.0 9.4 7.3 6.6 1.4 1.3 44 41 14 13
Kunlun Energy 135 HK HK$ 11.54 13.50 17 BUY 22.3 18 17.2 15.9 3.5 3.0 Net cash Net cash 17 15
Source: Company data, Nomura estimates
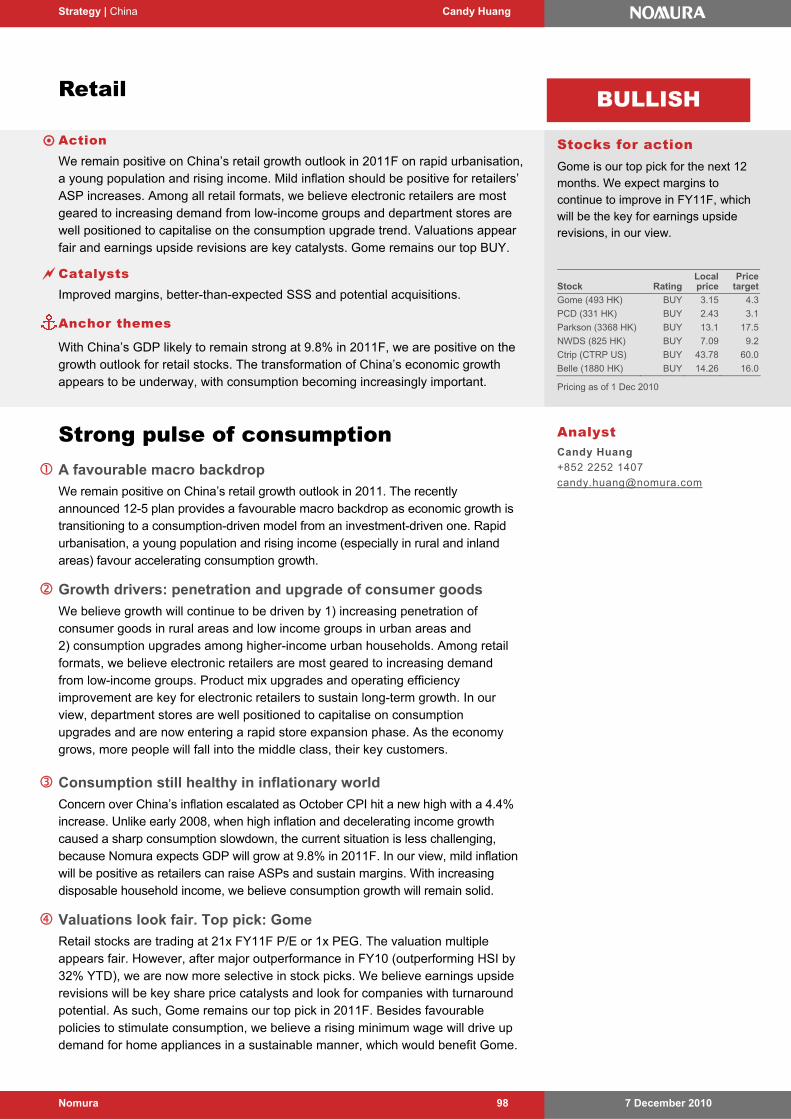
Strategy | China Candy Huang
7 December 2010 Nomura 98
Retail
Action We remain positive on China’s retail growth outlook in 2011F on rapid urbanisation,
a young population and rising income. Mild inflation should be positive for retailers’ ASP increases. Among all retail formats, we believe electronic retailers are most geared to increasing demand from low-income groups and department stores are well positioned to capitalise on the consumption upgrade trend. Valuations appear fair and earnings upside revisions are key catalysts. Gome remains our top BUY.
Catalysts Improved margins, better-than-expected SSS and potential acquisitions.
Anchor themes
With China’s GDP likely to remain strong at 9.8% in 2011F, we are positive on the growth outlook for retail stocks. The transformation of China’s economic growth appears to be underway, with consumption becoming increasingly important.
Strong pulse of consumption A favourable macro backdrop
We remain positive on China’s retail growth outlook in 2011. The recently announced 12-5 plan provides a favourable macro backdrop as economic growth is transitioning to a consumption-driven model from an investment-driven one. Rapid urbanisation, a young population and rising income (especially in rural and inland areas) favour accelerating consumption growth.
Growth drivers: penetration and upgrade of consumer goods
We believe growth will continue to be driven by 1) increasing penetration of consumer goods in rural areas and low income groups in urban areas and 2) consumption upgrades among higher-income urban households. Among retail formats, we believe electronic retailers are most geared to increasing demand from low-income groups. Product mix upgrades and operating efficiency improvement are key for electronic retailers to sustain long-term growth. In our view, department stores are well positioned to capitalise on consumption upgrades and are now entering a rapid store expansion phase. As the economy grows, more people will fall into the middle class, their key customers.
Consumption still healthy in inflationary world
Concern over China’s inflation escalated as October CPI hit a new high with a 4.4% increase. Unlike early 2008, when high inflation and decelerating income growth caused a sharp consumption slowdown, the current situation is less challenging, because Nomura expects GDP will grow at 9.8% in 2011F. In our view, mild inflation will be positive as retailers can raise ASPs and sustain margins. With increasing disposable household income, we believe consumption growth will remain solid.
Valuations look fair. Top pick: Gome
Retail stocks are trading at 21x FY11F P/E or 1x PEG. The valuation multiple appears fair. However, after major outperformance in FY10 (outperforming HSI by 32% YTD), we are now more selective in stock picks. We believe earnings upside revisions will be key share price catalysts and look for companies with turnaround potential. As such, Gome remains our top pick in 2011F. Besides favourable policies to stimulate consumption, we believe a rising minimum wage will drive up demand for home appliances in a sustainable manner, which would benefit Gome.
Analyst Candy Huang
+852 2252 1407
Stocks for action Gome is our top pick for the next 12 months. We expect margins to continue to improve in FY11F, which will be the key for earnings upside revisions, in our view.
BULLISH
Stock RatingLocal price
Price target
Gome (493 HK) BUY 3.15 4.3
PCD (331 HK) BUY 2.43 3.1
Parkson (3368 HK) BUY 13.1 17.5
NWDS (825 HK) BUY 7.09 9.2
Ctrip (CTRP US) BUY 43.78 60.0
Belle (1880 HK) BUY 14.26 16.0
Pricing as of 1 Dec 2010
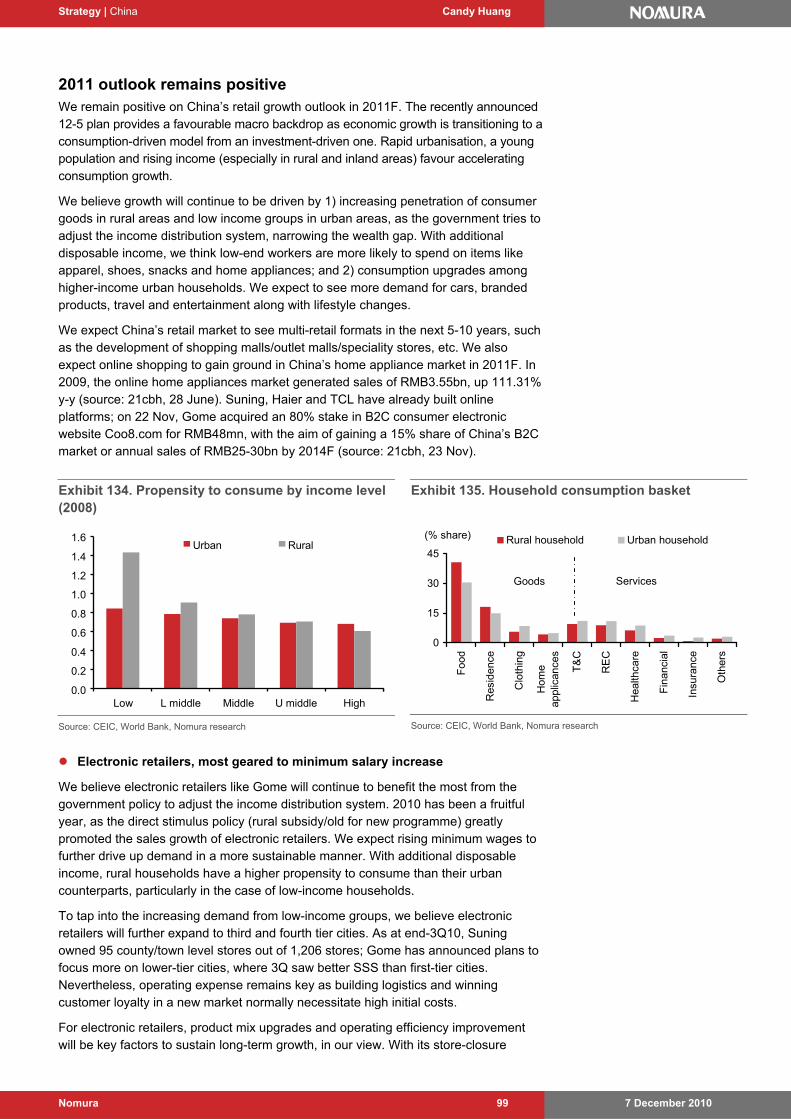
Strategy | China Candy Huang
7 December 2010 Nomura 99
2011 outlook remains positive We remain positive on China’s retail growth outlook in 2011F. The recently announced 12-5 plan provides a favourable macro backdrop as economic growth is transitioning to a consumption-driven model from an investment-driven one. Rapid urbanisation, a young population and rising income (especially in rural and inland areas) favour accelerating consumption growth.
We believe growth will continue to be driven by 1) increasing penetration of consumer goods in rural areas and low income groups in urban areas, as the government tries to adjust the income distribution system, narrowing the wealth gap. With additional disposable income, we think low-end workers are more likely to spend on items like apparel, shoes, snacks and home appliances; and 2) consumption upgrades among higher-income urban households. We expect to see more demand for cars, branded products, travel and entertainment along with lifestyle changes.
We expect China’s retail market to see multi-retail formats in the next 5-10 years, such as the development of shopping malls/outlet malls/speciality stores, etc. We also expect online shopping to gain ground in China’s home appliance market in 2011F. In 2009, the online home appliances market generated sales of RMB3.55bn, up 111.31% y-y (source: 21cbh, 28 June). Suning, Haier and TCL have already built online platforms; on 22 Nov, Gome acquired an 80% stake in B2C consumer electronic website Coo8.com for RMB48mn, with the aim of gaining a 15% share of China’s B2C market or annual sales of RMB25-30bn by 2014F (source: 21cbh, 23 Nov).
Exhibit 134. Propensity to consume by income level (2008)
0.0
0.2
0.4
0.6
0.8
1.0
1.2
1.4
1.6
Low L middle Middle U middle High
Urban Rural
0.0
0.2
0.4
0.6
0.8
1.0
1.2
1.4
1.6
Low L middle Middle U middle High
Urban Rural
Source: CEIC, World Bank, Nomura research
Exhibit 135. Household consumption basket
0
15
30
45
Foo
d
Res
iden
ce
Clo
thin
g
Hom
eap
plic
ance
s
T&
C
RE
C
Hea
lthca
re
Fin
anci
al
Insu
ranc
e
Oth
ers
Rural household Urban household
Goods Services
(% share)
Source: CEIC, World Bank, Nomura research
Electronic retailers, most geared to minimum salary increase
We believe electronic retailers like Gome will continue to benefit the most from the government policy to adjust the income distribution system. 2010 has been a fruitful year, as the direct stimulus policy (rural subsidy/old for new programme) greatly promoted the sales growth of electronic retailers. We expect rising minimum wages to further drive up demand in a more sustainable manner. With additional disposable income, rural households have a higher propensity to consume than their urban counterparts, particularly in the case of low-income households.
To tap into the increasing demand from low-income groups, we believe electronic retailers will further expand to third and fourth tier cities. As at end-3Q10, Suning owned 95 county/town level stores out of 1,206 stores; Gome has announced plans to focus more on lower-tier cities, where 3Q saw better SSS than first-tier cities. Nevertheless, operating expense remains key as building logistics and winning customer loyalty in a new market normally necessitate high initial costs.
For electronic retailers, product mix upgrades and operating efficiency improvement will be key factors to sustain long-term growth, in our view. With its store-closure
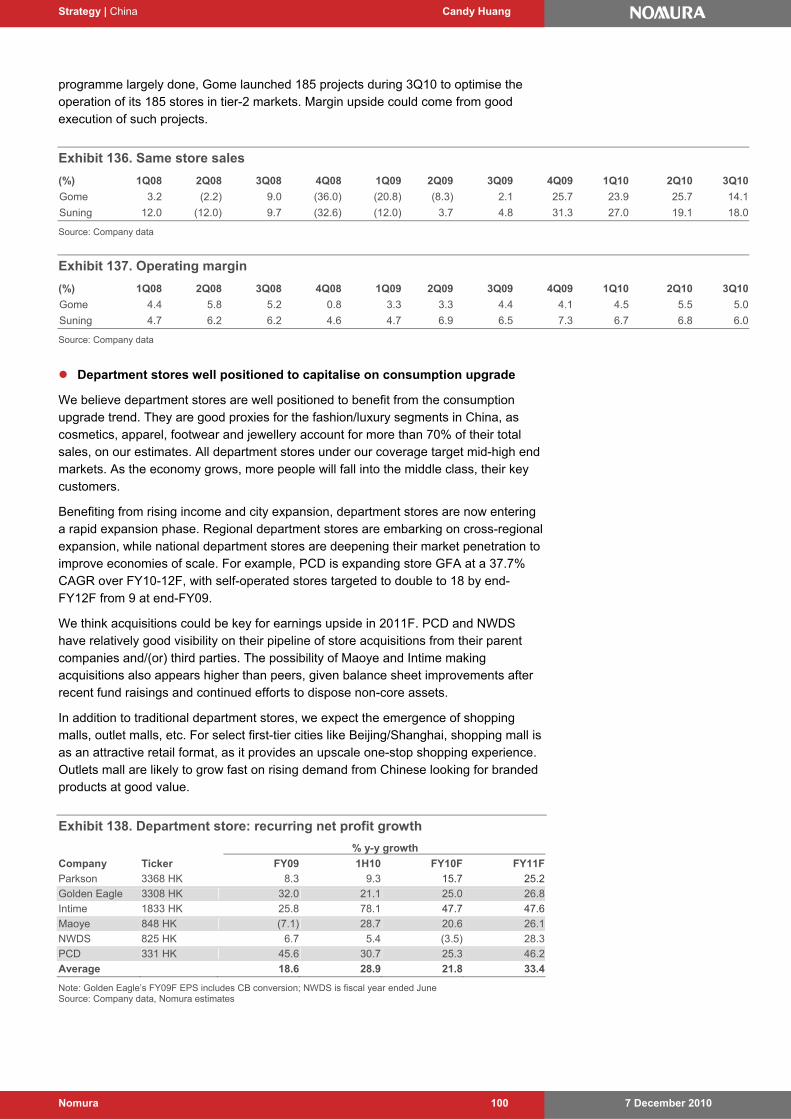
Strategy | China Candy Huang
7 December 2010 Nomura 100
programme largely done, Gome launched 185 projects during 3Q10 to optimise the operation of its 185 stores in tier-2 markets. Margin upside could come from good execution of such projects.
Exhibit 136. Same store sales
(%) 1Q08 2Q08 3Q08 4Q08 1Q09 2Q09 3Q09 4Q09 1Q10 2Q10 3Q10
Gome 3.2 (2.2) 9.0 (36.0) (20.8) (8.3) 2.1 25.7 23.9 25.7 14.1
Suning 12.0 (12.0) 9.7 (32.6) (12.0) 3.7 4.8 31.3 27.0 19.1 18.0 Source: Company data
Exhibit 137. Operating margin
(%) 1Q08 2Q08 3Q08 4Q08 1Q09 2Q09 3Q09 4Q09 1Q10 2Q10 3Q10
Gome 4.4 5.8 5.2 0.8 3.3 3.3 4.4 4.1 4.5 5.5 5.0
Suning 4.7 6.2 6.2 4.6 4.7 6.9 6.5 7.3 6.7 6.8 6.0 Source: Company data
Department stores well positioned to capitalise on consumption upgrade
We believe department stores are well positioned to benefit from the consumption upgrade trend. They are good proxies for the fashion/luxury segments in China, as cosmetics, apparel, footwear and jewellery account for more than 70% of their total sales, on our estimates. All department stores under our coverage target mid-high end markets. As the economy grows, more people will fall into the middle class, their key customers.
Benefiting from rising income and city expansion, department stores are now entering a rapid expansion phase. Regional department stores are embarking on cross-regional expansion, while national department stores are deepening their market penetration to improve economies of scale. For example, PCD is expanding store GFA at a 37.7% CAGR over FY10-12F, with self-operated stores targeted to double to 18 by end-FY12F from 9 at end-FY09.
We think acquisitions could be key for earnings upside in 2011F. PCD and NWDS have relatively good visibility on their pipeline of store acquisitions from their parent companies and/(or) third parties. The possibility of Maoye and Intime making acquisitions also appears higher than peers, given balance sheet improvements after recent fund raisings and continued efforts to dispose non-core assets.
In addition to traditional department stores, we expect the emergence of shopping malls, outlet malls, etc. For select first-tier cities like Beijing/Shanghai, shopping mall is as an attractive retail format, as it provides an upscale one-stop shopping experience. Outlets mall are likely to grow fast on rising demand from Chinese looking for branded products at good value.
Exhibit 138. Department store: recurring net profit growth
% y-y growth
Company Ticker FY09 1H10 FY10F FY11F
Parkson 3368 HK 8.3 9.3 15.7 25.2
Golden Eagle 3308 HK 32.0 21.1 25.0 26.8
Intime 1833 HK 25.8 78.1 47.7 47.6
Maoye 848 HK (7.1) 28.7 20.6 26.1
NWDS 825 HK 6.7 5.4 (3.5) 28.3
PCD 331 HK 45.6 30.7 25.3 46.2
Average 18.6 28.9 21.8 33.4
Note: Golden Eagle’s FY09F EPS includes CB conversion; NWDS is fiscal year ended June Source: Company data, Nomura estimates
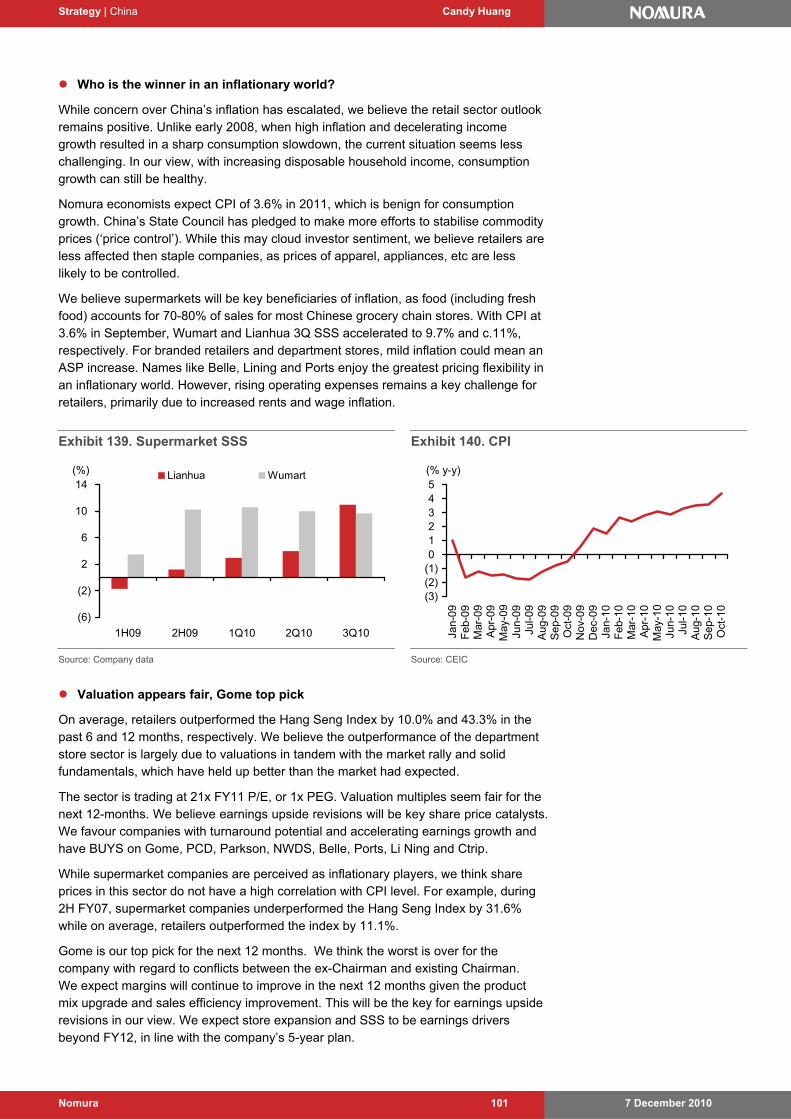
Strategy | China Candy Huang
7 December 2010 Nomura 101
Who is the winner in an inflationary world?
While concern over China’s inflation has escalated, we believe the retail sector outlook remains positive. Unlike early 2008, when high inflation and decelerating income growth resulted in a sharp consumption slowdown, the current situation seems less challenging. In our view, with increasing disposable household income, consumption growth can still be healthy.
Nomura economists expect CPI of 3.6% in 2011, which is benign for consumption growth. China’s State Council has pledged to make more efforts to stabilise commodity prices (‘price control’). While this may cloud investor sentiment, we believe retailers are less affected then staple companies, as prices of apparel, appliances, etc are less likely to be controlled.
We believe supermarkets will be key beneficiaries of inflation, as food (including fresh food) accounts for 70-80% of sales for most Chinese grocery chain stores. With CPI at 3.6% in September, Wumart and Lianhua 3Q SSS accelerated to 9.7% and c.11%, respectively. For branded retailers and department stores, mild inflation could mean an ASP increase. Names like Belle, Lining and Ports enjoy the greatest pricing flexibility in an inflationary world. However, rising operating expenses remains a key challenge for retailers, primarily due to increased rents and wage inflation.
Exhibit 139. Supermarket SSS
(6)
(2)
2
6
10
14
1H09 2H09 1Q10 2Q10 3Q10
(%) Lianhua Wumart
Source: Company data
Exhibit 140. CPI
(3)(2)(1)012345
Jan-
09F
eb-0
9M
ar-0
9A
pr-0
9M
ay-0
9Ju
n-09
Jul-0
9A
ug-0
9S
ep-0
9O
ct-0
9N
ov-0
9D
ec-0
9Ja
n-10
Feb
-10
Mar
-10
Apr
-10
May
-10
Jun-
10Ju
l-10
Aug
-10
Sep
-10
Oct
-10
(% y-y)
Source: CEIC
Valuation appears fair, Gome top pick
On average, retailers outperformed the Hang Seng Index by 10.0% and 43.3% in the past 6 and 12 months, respectively. We believe the outperformance of the department store sector is largely due to valuations in tandem with the market rally and solid fundamentals, which have held up better than the market had expected.
The sector is trading at 21x FY11 P/E, or 1x PEG. Valuation multiples seem fair for the next 12-months. We believe earnings upside revisions will be key share price catalysts. We favour companies with turnaround potential and accelerating earnings growth and have BUYS on Gome, PCD, Parkson, NWDS, Belle, Ports, Li Ning and Ctrip.
While supermarket companies are perceived as inflationary players, we think share prices in this sector do not have a high correlation with CPI level. For example, during 2H FY07, supermarket companies underperformed the Hang Seng Index by 31.6% while on average, retailers outperformed the index by 11.1%.
Gome is our top pick for the next 12 months. We think the worst is over for the company with regard to conflicts between the ex-Chairman and existing Chairman. We expect margins will continue to improve in the next 12 months given the product mix upgrade and sales efficiency improvement. This will be the key for earnings upside revisions in our view. We expect store expansion and SSS to be earnings drivers beyond FY12, in line with the company’s 5-year plan.
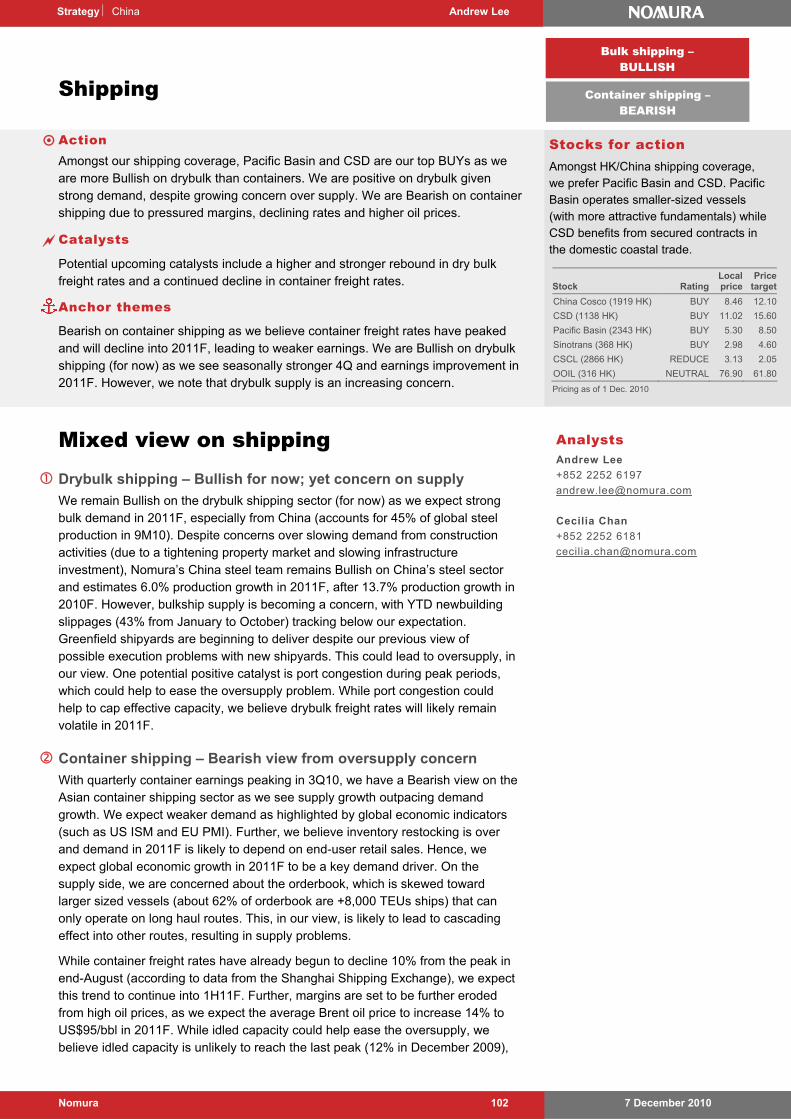
7 December 2010 Nomura 102
Strategy China Andrew Lee
Shipping
Action Amongst our shipping coverage, Pacific Basin and CSD are our top BUYs as we
are more Bullish on drybulk than containers. We are positive on drybulk given strong demand, despite growing concern over supply. We are Bearish on container shipping due to pressured margins, declining rates and higher oil prices.
Catalysts Potential upcoming catalysts include a higher and stronger rebound in dry bulk
freight rates and a continued decline in container freight rates.
Anchor themes Bearish on container shipping as we believe container freight rates have peaked
and will decline into 2011F, leading to weaker earnings. We are Bullish on drybulk shipping (for now) as we see seasonally stronger 4Q and earnings improvement in 2011F. However, we note that drybulk supply is an increasing concern.
Mixed view on shipping Drybulk shipping – Bullish for now; yet concern on supply
We remain Bullish on the drybulk shipping sector (for now) as we expect strong bulk demand in 2011F, especially from China (accounts for 45% of global steel production in 9M10). Despite concerns over slowing demand from construction activities (due to a tightening property market and slowing infrastructure investment), Nomura’s China steel team remains Bullish on China’s steel sector and estimates 6.0% production growth in 2011F, after 13.7% production growth in 2010F. However, bulkship supply is becoming a concern, with YTD newbuilding slippages (43% from January to October) tracking below our expectation. Greenfield shipyards are beginning to deliver despite our previous view of possible execution problems with new shipyards. This could lead to oversupply, in our view. One potential positive catalyst is port congestion during peak periods, which could help to ease the oversupply problem. While port congestion could help to cap effective capacity, we believe drybulk freight rates will likely remain volatile in 2011F.
Container shipping – Bearish view from oversupply concern
With quarterly container earnings peaking in 3Q10, we have a Bearish view on the Asian container shipping sector as we see supply growth outpacing demand growth. We expect weaker demand as highlighted by global economic indicators (such as US ISM and EU PMI). Further, we believe inventory restocking is over and demand in 2011F is likely to depend on end-user retail sales. Hence, we expect global economic growth in 2011F to be a key demand driver. On the supply side, we are concerned about the orderbook, which is skewed toward larger sized vessels (about 62% of orderbook are +8,000 TEUs ships) that can only operate on long haul routes. This, in our view, is likely to lead to cascading effect into other routes, resulting in supply problems.
While container freight rates have already begun to decline 10% from the peak in end-August (according to data from the Shanghai Shipping Exchange), we expect this trend to continue into 1H11F. Further, margins are set to be further eroded from high oil prices, as we expect the average Brent oil price to increase 14% to US$95/bbl in 2011F. While idled capacity could help ease the oversupply, we believe idled capacity is unlikely to reach the last peak (12% in December 2009),
Stocks for action Amongst HK/China shipping coverage, we prefer Pacific Basin and CSD. Pacific Basin operates smaller-sized vessels (with more attractive fundamentals) while CSD benefits from secured contracts in the domestic coastal trade.
Container shipping – BEARISH
Stock RatingLocal price
Price target
China Cosco (1919 HK) BUY 8.46 12.10
CSD (1138 HK) BUY 11.02 15.60
Pacific Basin (2343 HK) BUY 5.30 8.50
Sinotrans (368 HK) BUY 2.98 4.60
CSCL (2866 HK) REDUCE 3.13 2.05
OOIL (316 HK) NEUTRAL 76.90 61.80
Pricing as of 1 Dec. 2010
Analysts Andrew Lee
+852 2252 6197
Cecilia Chan
+852 2252 6181
Bulk shipping – BULLISH
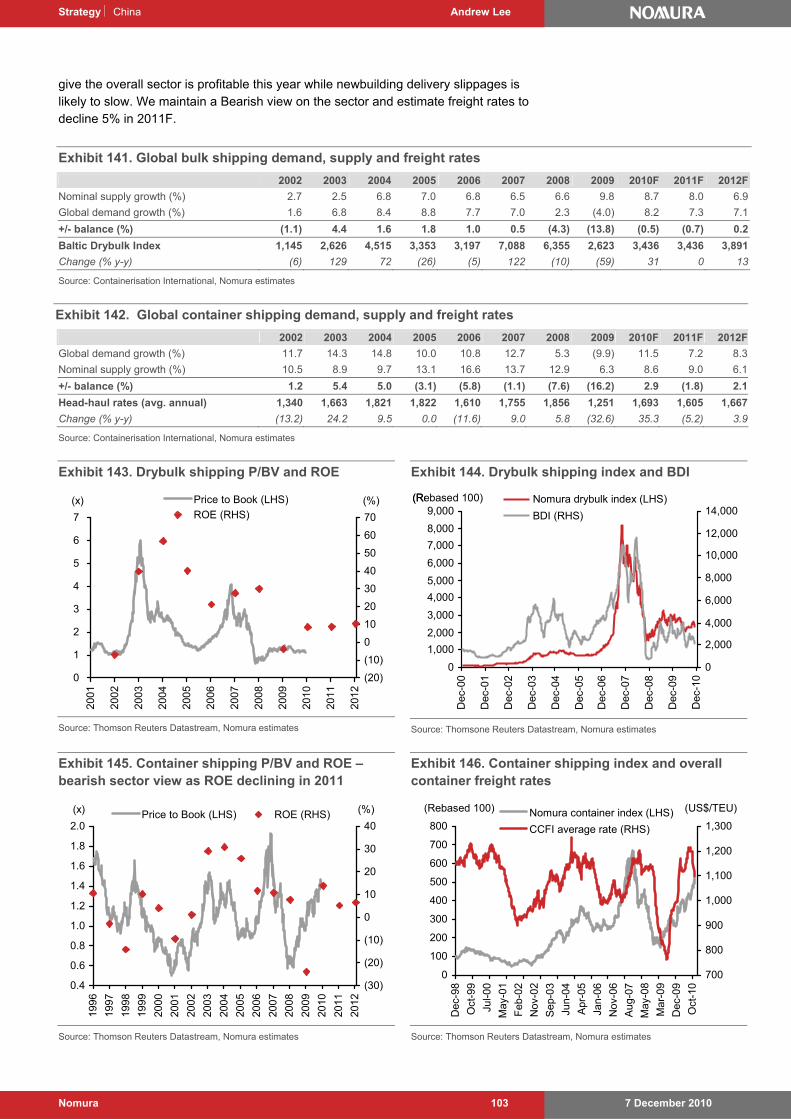
Strategy China Andrew Lee
7 December 2010 Nomura 103
give the overall sector is profitable this year while newbuilding delivery slippages is likely to slow. We maintain a Bearish view on the sector and estimate freight rates to decline 5% in 2011F.
Exhibit 141. Global bulk shipping demand, supply and freight rates
2002 2003 2004 2005 2006 2007 2008 2009 2010F 2011F 2012F
Nominal supply growth (%) 2.7 2.5 6.8 7.0 6.8 6.5 6.6 9.8 8.7 8.0 6.9
Global demand growth (%) 1.6 6.8 8.4 8.8 7.7 7.0 2.3 (4.0) 8.2 7.3 7.1
+/- balance (%) (1.1) 4.4 1.6 1.8 1.0 0.5 (4.3) (13.8) (0.5) (0.7) 0.2
Baltic Drybulk Index 1,145 2,626 4,515 3,353 3,197 7,088 6,355 2,623 3,436 3,436 3,891
Change (% y-y) (6) 129 72 (26) (5) 122 (10) (59) 31 0 13
Source: Containerisation International, Nomura estimates
Exhibit 142. Global container shipping demand, supply and freight rates
2002 2003 2004 2005 2006 2007 2008 2009 2010F 2011F 2012F
Global demand growth (%) 11.7 14.3 14.8 10.0 10.8 12.7 5.3 (9.9) 11.5 7.2 8.3
Nominal supply growth (%) 10.5 8.9 9.7 13.1 16.6 13.7 12.9 6.3 8.6 9.0 6.1
+/- balance (%) 1.2 5.4 5.0 (3.1) (5.8) (1.1) (7.6) (16.2) 2.9 (1.8) 2.1
Head-haul rates (avg. annual) 1,340 1,663 1,821 1,822 1,610 1,755 1,856 1,251 1,693 1,605 1,667
Change (% y-y) (13.2) 24.2 9.5 0.0 (11.6) 9.0 5.8 (32.6) 35.3 (5.2) 3.9
Source: Containerisation International, Nomura estimates
Exhibit 143. Drybulk shipping P/BV and ROE
0
1
2
3
4
5
6
7
2001
2002
2003
2004
2005
2006
2007
2008
2009
2010
2011
2012
(20)
(10)
0
10
20
30
40
50
60
70
Price to Book (LHS)
ROE (RHS)(x) (%)
Source: Thomson Reuters Datastream, Nomura estimates
Exhibit 144. Drybulk shipping index and BDI
0
1,000
2,000
3,000
4,000
5,000
6,000
7,000
8,000
9,000
Dec
-00
Dec
-01
Dec
-02
Dec
-03
Dec
-04
Dec
-05
Dec
-06
Dec
-07
Dec
-08
Dec
-09
Dec
-10
0
2,000
4,000
6,000
8,000
10,000
12,000
14,000Nomura drybulk index (LHS)
BDI (RHS)
(Rebased 100)
0
1,000
2,000
3,000
4,000
5,000
6,000
7,000
8,000
9,000
Dec
-00
Dec
-01
Dec
-02
Dec
-03
Dec
-04
Dec
-05
Dec
-06
Dec
-07
Dec
-08
Dec
-09
Dec
-10
0
2,000
4,000
6,000
8,000
10,000
12,000
14,000Nomura drybulk index (LHS)
BDI (RHS)
(Rebased 100)
Source: Thomsone Reuters Datastream, Nomura estimates
Exhibit 145. Container shipping P/BV and ROE – bearish sector view as ROE declining in 2011
0.4
0.6
0.8
1.0
1.2
1.4
1.6
1.8
2.0
1996
1997
1998
1999
2000
2001
2002
2003
2004
2005
2006
2007
2008
2009
2010
2011
2012
(30)
(20)
(10)
0
10
20
30
40Price to Book (LHS) ROE (RHS)(x) (%)
Source: Thomson Reuters Datastream, Nomura estimates
Exhibit 146. Container shipping index and overall container freight rates
0
100
200
300
400
500
600
700
800
Dec
-98
Oct
-99
Jul-0
0
May
-01
Feb
-02
Nov
-02
Sep
-03
Jun-
04
Apr
-05
Jan-
06
Nov
-06
Aug
-07
May
-08
Mar
-09
Dec
-09
Oct
-10
700
800
900
1,000
1,100
1,200
1,300Nomura container index (LHS)
CCFI average rate (RHS)
(US$/TEU)(Rebased 100)
Source: Thomson Reuters Datastream, Nomura estimates
Strategy | China Josephine Ho
7 December 2010 Nomura 104
Steel
Action We believe steel prices will be range-bound through 4Q10F, with short supply from
power rationing and slowing demand towards year-end. We expect China steel production to slow in 2011F, given the increasing focus on environmental protection. We remain selectively positive on the China/Taiwan steel sector, with BUYs on Angang and China Steel, and NEUTRALs on Baosteel and Maanshan.
Catalysts Steel demand growth, steel price movements, government policy changes, interest
rate changes and changes in raw material prices.
Anchor themes
Steel equities in China/Taiwan will likely see range-trading, as iron ore spot prices tend to move in tandem with steel prices. A major boost to steel makers’ margins is unlikely if iron ore contract prices are reviewed on a monthly basis, as is being proposed by iron ore miners.
Favour integrated players Steel prices likely to be range-bound through 4Q10F
We are confident that steel mills under our coverage will register better earnings in 4Q10F than in 3Q10, given a recovery in China’s average steel prices of 2.2-6.3% q-q in 4Q10F. However, we expect steel prices to be range-bound for the rest of the year, owing to a mix of inventory de-stocking, short supply from power rationing, slowing demand towards year-end, and China’s tight monetary policies. The downside risks to steel prices should be limited at current levels, in our view, given: 1) continuing inventory de-stocking; 2) decreased crude output; and 3) high raw material costs.
Moderate production growth expected into 2011F
China is raising the bar in terms of environmental protection. We believe that tightening environmental standards and government controls are likely to slow steel capacity and production growth during the 12th Five-year Plan (FYP). One recent example is the power rationing in the steel sector and some other energy-intensive industries since August. As a result, China’s daily crude output has dropped since August to 1.6mt in October, down 2.8% y-y. While China is likely to end power rationing at the end of this year or early next year, we believe the authorities will keep a close eye on steel capacity and production growth to ensure that China reaches its energy-saving targets under the 12th FYP. As such, we expect moderate production growth over 2011-12F of 6.0% pa and 8.0% pa to 685mt and 739mt, respectively. Backed by more disciplined supply and China’s push for industry consolidation, we expect the average steel industry utilisation rate to improve from 85% in 2010F to 89.1% in 2012F.
Industry consolidation is no solution for margin contraction
We believe consolidation would only marginally benefit the Chinese steel industry. Rather, the key issue, in our view, is China’s dependence on iron ore imports. With our global mining team recently extending the peak of the iron ore cycle to 2012F (from 2011F), we expect Chinese steel mill margins to move sideways. Thus, we look for steel equities as a whole to be range-bound over the next two years.
Analyst Josephine Ho
+852 2252 2177
Stocks for action Angang looks best positioned in our China/Taiwan steel space, given its semi-integration to iron ore. China Steel, a low-beta steel stock, tends to outperform peers when the steel cycle turns.
BULLISH
Stock Rating PricePrice
target
Angang (347 HK)
BUY HK$11.34 HK$16.00
China Steel (2002 TT)
BUY NT$31.35 NT$37.0
Baosteel (600019 CH)
NEUTRAL RMB6.29 RMB7.00
Pricing as of 1 December, 2010; local currency
Strategy | China Josephine Ho
7 December 2010 Nomura 105
Still selectively positive on China steel sector
China steel equities have underperformed the market by 12-13% in the past month, mainly on disappointing 3Q10 results (we believe now fully priced in) and low earnings visibility for 2011F from uncertainties in the property sector (17% of steel demand) and iron ore price moves. Based on our recent rentals and mining field trip, we believe the property market could be a swing factor for steel demand going into 2011F. However, according to 21 CBH (18 November), China plans to build 13mn social welfare apartments in 2011-12F, completing 6.8mn units in 2011F and 6.2mn units in 2012F. If this target is achieved, it should help to partially offset a potential decline in demand from the commercial property sector.
On the cost front, the floating pricing system has taken away the inventory gains that the steel industry used to enjoy. As it is likely to continue to be a seller’s market for iron ore in 2011F, we believe steel mills with mining assets will gain a cost advantage amidst spiralling iron ore prices.
That said, our top pick in our China steel universe remains Angang, for its semi-integration to iron ore and strength in flat steel making. We also like China Steel, for its low share-price volatility and stable dividend payout ratio. On the other hand, we remain NEUTRAL on Baosteel and Maanshan, given: 1) Maanshan’s weak execution and 2) Baosteel’s mixed product outlook.
Exhibit 147. Hot-rolled coil (HRC) prices, since 2004
HRC
0
2,000
4,000
6,000
8,000
Jan-
04
Jul-
04
Jan-
05
Jul-
05
Jan-
06
Jul-
06
Jan-
07
Jul-
07
Jan-
08
Jul-
08
Jan-
09
Jul-
09
Jan-
10
Jul-
10
(RMB/t)
Current price=4,532
Average price=4,354 HRC
0
2,000
4,000
6,000
8,000
Jan-
04
Jul-
04
Jan-
05
Jul-
05
Jan-
06
Jul-
06
Jan-
07
Jul-
07
Jan-
08
Jul-
08
Jan-
09
Jul-
09
Jan-
10
Jul-
10
(RMB/t)
Current price=4,532
Average price=4,354
Source: Mysteel, Nomura research
Exhibit 148. Rebar prices, since 2004
0
2,000
4,000
6,000
Jan-
04
Jul-0
4
Jan-
05
Jul-0
5
Jan-
06
Jul-0
6
Jan-
07
Jul-0
7
Jan-
08
Jul-0
8
Jan-
09
Jul-0
9
Jan-
10
Jul-1
0
(RMB/t)
Current price=4,547
Average price=3,747
Rebar
0
2,000
4,000
6,000
Jan-
04
Jul-0
4
Jan-
05
Jul-0
5
Jan-
06
Jul-0
6
Jan-
07
Jul-0
7
Jan-
08
Jul-0
8
Jan-
09
Jul-0
9
Jan-
10
Jul-1
0
(RMB/t)
Current price=4,547
Average price=3,747
Rebar
Source: Mysteel, Nomura research
7 December 2010 Nomura 106
Telecom Services | China Danny Chu, CFA
Telecom services
Action On our channel checks, we remain positive that China Unicom’s 3G business is
moving in the right direction: 1) launching affordable smartphones for mass market;and 2) capturing high-ARPU corporate customers. Our near-term pecking order remains China Unicom (BUY) > China Mobile (BUY) > China Telecom (NEUTRAL), given strong momentum in 3G net adds at Unicom.
Catalysts Better-than-expected financial results, growth of DPS in absolute terms, increase in
market share and higher-than-expected subscriber growth are potential catalysts.
Anchor themes Gradual blossoming of smartphone usage, rising mobile data usage and maturing
3G network coverage will put telecom operators back on the growth track.
Smartphones to drive 3G penetration Variety and affordability of smartphones to continue to improve
When compared to 2010, we expect the variety of smartphones to increase in 2011. At the same time, due to improved economies of scale, we expect ASP of smartphones to decline further in China. This should lower switching costs for the mass market segment of 2G subscribers and drive up volume of 2G mobile subscribers migrating to the 3G mobile platform.
The thunder of MNP, but little rain on the horizon
We believe the government’s key priority still lies with achieving technological superiority (eg, TD-SCDMA, TD-LTE), despite the beginning of the commercial phase of mobile number portability (MNP) in Hainan province and Tianjin effective 22 November. With China Mobile spearheading the effort in promoting both proprietary technologies, we expect the government to provide a benign operating environment for China Mobile in return.
China Mobile could be the first to launch 4G service
Having gained sound knowledge of 4G technology through the rollout of TD-LTE at the Shanghai World Expo, China Mobile appears to have the deepest knowledge base in next-generation technology compared to the other two operators. We would not be surprised to see China Mobile be the first to launch 4G service in China.
Top pick in the China telecom universe
China Unicom is our top pick in the Chinese telecom universe. Our relative order of preference is China Unicom > China Mobile > China Telecom.
Stocks for action BUY China Unicom, where we expect 3G monthly net adds to jump on iPhone 4 ‘mania’ in China. BUY China Mobile, where we expect a re-rating. We are NEUTRAL on China Telecom, on a lack of positive catalysts.
NEUTRAL
Analysts Danny Chu, CFA
+852 2252 6209
Leping Huang, PhD
+852 2252 1598
Stock Rating PricePrice
target
China Mobile (941 HK) BUY 78.10 95.00
China Telecom (728 HK)
NEUTRAL 3.95 4.80
China Unicom (762 HK) BUY 10.48 13.50
Pricing as of 1 December, 2010; local currency
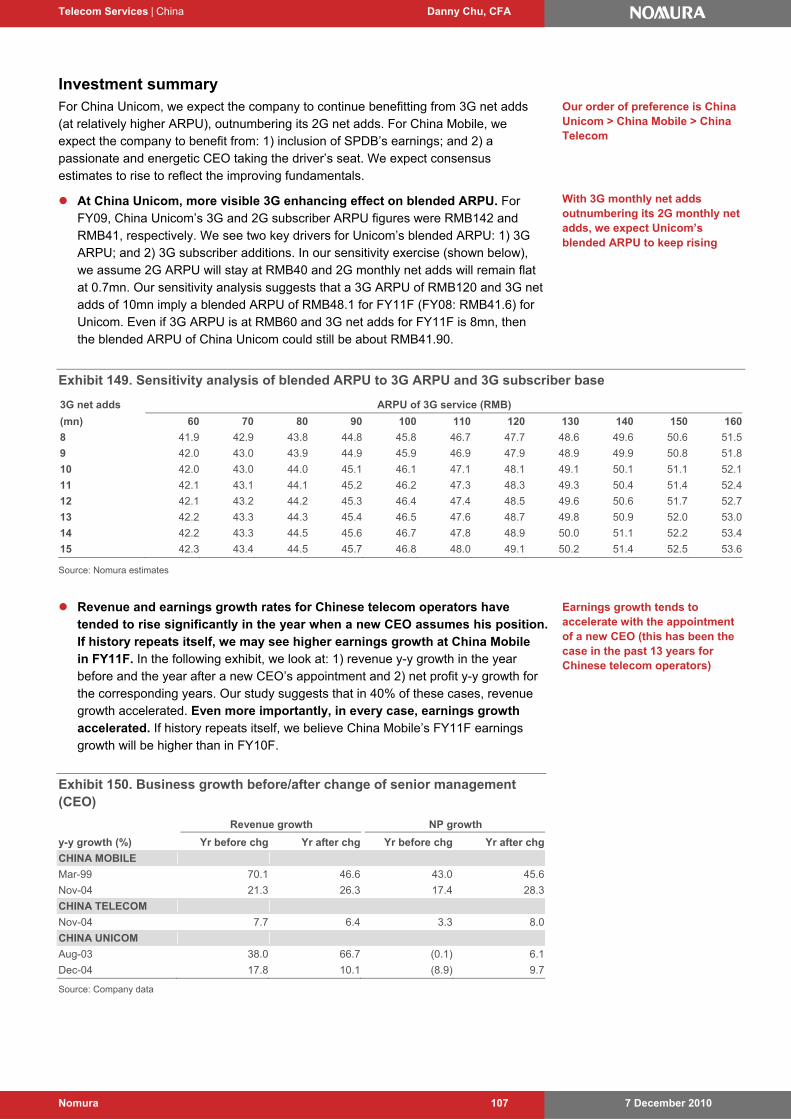
Telecom Services | China Danny Chu, CFA
7 December 2010 Nomura 107
Investment summary For China Unicom, we expect the company to continue benefitting from 3G net adds (at relatively higher ARPU), outnumbering its 2G net adds. For China Mobile, we expect the company to benefit from: 1) inclusion of SPDB’s earnings; and 2) a passionate and energetic CEO taking the driver’s seat. We expect consensus estimates to rise to reflect the improving fundamentals.
At China Unicom, more visible 3G enhancing effect on blended ARPU. For FY09, China Unicom’s 3G and 2G subscriber ARPU figures were RMB142 and RMB41, respectively. We see two key drivers for Unicom’s blended ARPU: 1) 3G ARPU; and 2) 3G subscriber additions. In our sensitivity exercise (shown below), we assume 2G ARPU will stay at RMB40 and 2G monthly net adds will remain flat at 0.7mn. Our sensitivity analysis suggests that a 3G ARPU of RMB120 and 3G net adds of 10mn imply a blended ARPU of RMB48.1 for FY11F (FY08: RMB41.6) for Unicom. Even if 3G ARPU is at RMB60 and 3G net adds for FY11F is 8mn, then the blended ARPU of China Unicom could still be about RMB41.90.
Exhibit 149. Sensitivity analysis of blended ARPU to 3G ARPU and 3G subscriber base
3G net adds ARPU of 3G service (RMB)
(mn) 60 70 80 90 100 110 120 130 140 150 160
8 41.9 42.9 43.8 44.8 45.8 46.7 47.7 48.6 49.6 50.6 51.5
9 42.0 43.0 43.9 44.9 45.9 46.9 47.9 48.9 49.9 50.8 51.8
10 42.0 43.0 44.0 45.1 46.1 47.1 48.1 49.1 50.1 51.1 52.1
11 42.1 43.1 44.1 45.2 46.2 47.3 48.3 49.3 50.4 51.4 52.4
12 42.1 43.2 44.2 45.3 46.4 47.4 48.5 49.6 50.6 51.7 52.7
13 42.2 43.3 44.3 45.4 46.5 47.6 48.7 49.8 50.9 52.0 53.0
14 42.2 43.3 44.5 45.6 46.7 47.8 48.9 50.0 51.1 52.2 53.4
15 42.3 43.4 44.5 45.7 46.8 48.0 49.1 50.2 51.4 52.5 53.6
Source: Nomura estimates
Revenue and earnings growth rates for Chinese telecom operators have tended to rise significantly in the year when a new CEO assumes his position. If history repeats itself, we may see higher earnings growth at China Mobile in FY11F. In the following exhibit, we look at: 1) revenue y-y growth in the year before and the year after a new CEO’s appointment and 2) net profit y-y growth for the corresponding years. Our study suggests that in 40% of these cases, revenue growth accelerated. Even more importantly, in every case, earnings growth accelerated. If history repeats itself, we believe China Mobile’s FY11F earnings growth will be higher than in FY10F.
Exhibit 150. Business growth before/after change of senior management (CEO)
Revenue growth NP growth
y-y growth (%) Yr before chg Yr after chg Yr before chg Yr after chg
CHINA MOBILE
Mar-99 70.1 46.6 43.0 45.6
Nov-04 21.3 26.3 17.4 28.3
CHINA TELECOM
Nov-04 7.7 6.4 3.3 8.0
CHINA UNICOM
Aug-03 38.0 66.7 (0.1) 6.1
Dec-04 17.8 10.1 (8.9) 9.7
Source: Company data
Our order of preference is China Unicom > China Mobile > China Telecom
With 3G monthly net adds outnumbering its 2G monthly net adds, we expect Unicom’s blended ARPU to keep rising
Earnings growth tends to accelerate with the appointment of a new CEO (this has been the case in the past 13 years for Chinese telecom operators)
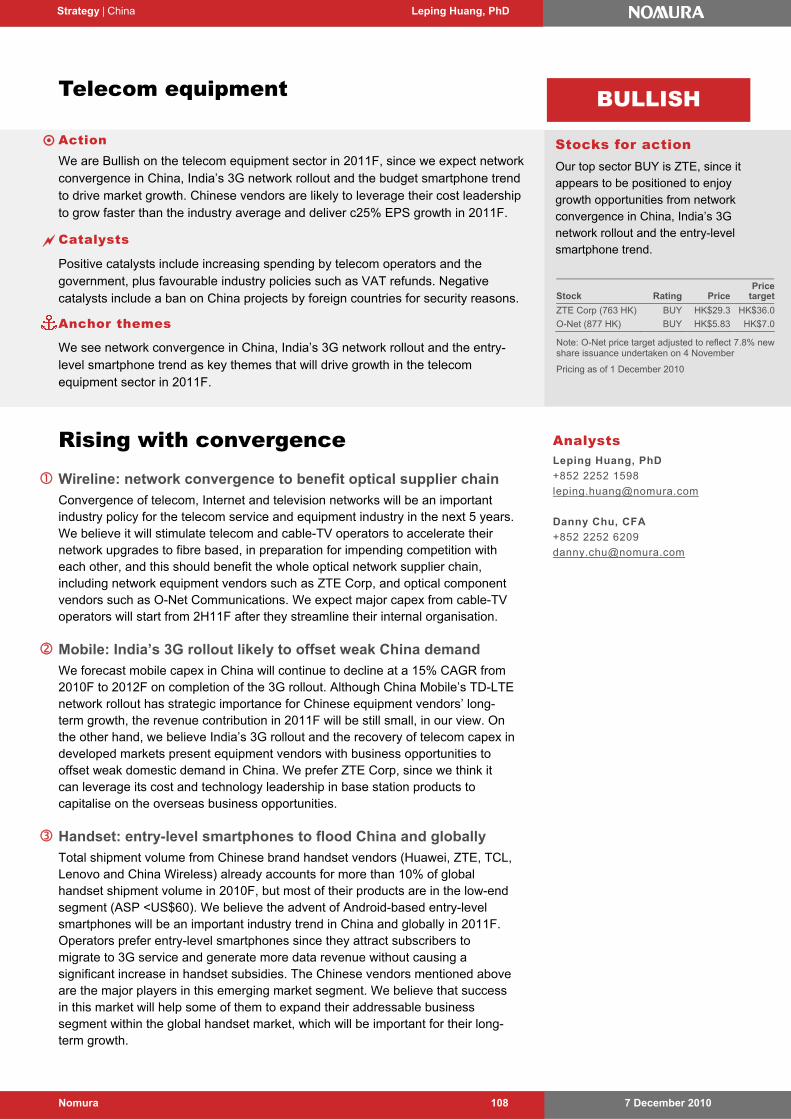
7 December 2010 Nomura 108
Strategy | China Leping Huang, PhD
Telecom equipment
Action We are Bullish on the telecom equipment sector in 2011F, since we expect network
convergence in China, India’s 3G network rollout and the budget smartphone trend to drive market growth. Chinese vendors are likely to leverage their cost leadership to grow faster than the industry average and deliver c25% EPS growth in 2011F.
Catalysts Positive catalysts include increasing spending by telecom operators and the
government, plus favourable industry policies such as VAT refunds. Negative catalysts include a ban on China projects by foreign countries for security reasons.
Anchor themes We see network convergence in China, India’s 3G network rollout and the entry-
level smartphone trend as key themes that will drive growth in the telecom equipment sector in 2011F.
Rising with convergence Wireline: network convergence to benefit optical supplier chain
Convergence of telecom, Internet and television networks will be an important industry policy for the telecom service and equipment industry in the next 5 years. We believe it will stimulate telecom and cable-TV operators to accelerate their network upgrades to fibre based, in preparation for impending competition with each other, and this should benefit the whole optical network supplier chain, including network equipment vendors such as ZTE Corp, and optical component vendors such as O-Net Communications. We expect major capex from cable-TV operators will start from 2H11F after they streamline their internal organisation.
Mobile: India’s 3G rollout likely to offset weak China demand
We forecast mobile capex in China will continue to decline at a 15% CAGR from 2010F to 2012F on completion of the 3G rollout. Although China Mobile’s TD-LTE network rollout has strategic importance for Chinese equipment vendors’ long-term growth, the revenue contribution in 2011F will be still small, in our view. On the other hand, we believe India’s 3G rollout and the recovery of telecom capex in developed markets present equipment vendors with business opportunities to offset weak domestic demand in China. We prefer ZTE Corp, since we think it can leverage its cost and technology leadership in base station products to capitalise on the overseas business opportunities.
Handset: entry-level smartphones to flood China and globally
Total shipment volume from Chinese brand handset vendors (Huawei, ZTE, TCL, Lenovo and China Wireless) already accounts for more than 10% of global handset shipment volume in 2010F, but most of their products are in the low-end segment (ASP <US$60). We believe the advent of Android-based entry-level smartphones will be an important industry trend in China and globally in 2011F. Operators prefer entry-level smartphones since they attract subscribers to migrate to 3G service and generate more data revenue without causing a significant increase in handset subsidies. The Chinese vendors mentioned above are the major players in this emerging market segment. We believe that success in this market will help some of them to expand their addressable business segment within the global handset market, which will be important for their long-term growth.
Stocks for action Our top sector BUY is ZTE, since it appears to be positioned to enjoy growth opportunities from network convergence in China, India’s 3G network rollout and the entry-level smartphone trend.
BULLISH
Analysts Leping Huang, PhD
+852 2252 1598
Danny Chu, CFA
+852 2252 6209
Stock Rating Price Price
target
ZTE Corp (763 HK) BUY HK$29.3 HK$36.0
O-Net (877 HK) BUY HK$5.83 HK$7.0
Note: O-Net price target adjusted to reflect 7.8% new share issuance undertaken on 4 November
Pricing as of 1 December 2010
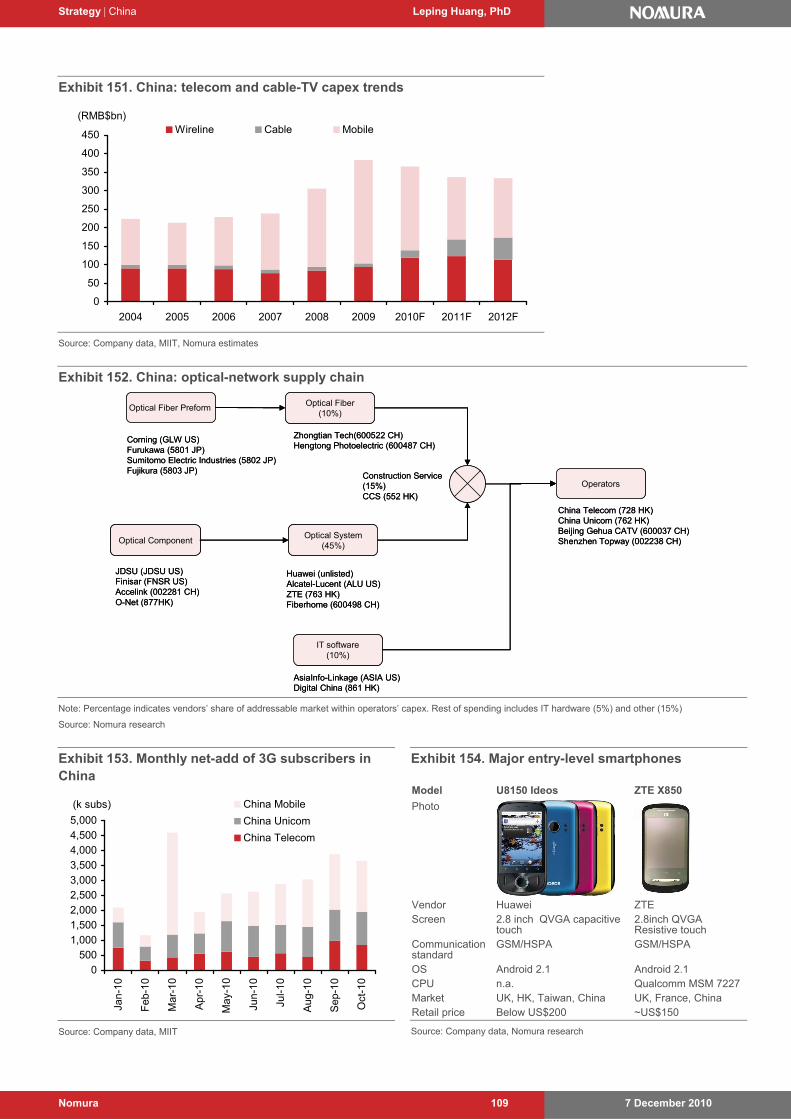
Strategy | China Leping Huang, PhD
7 December 2010 Nomura 109
Exhibit 151. China: telecom and cable-TV capex trends
0
50
100
150
200
250
300
350
400
450
2004 2005 2006 2007 2008 2009 2010F 2011F 2012F
(RMB$bn)Wireline Cable Mobile
Source: Company data, MIIT, Nomura estimates
Exhibit 152. China: optical-network supply chain
Operators
Optical Fiber(10%)
Optical System(45%)
Optical Component
Construction Service (15%)CCS (552 HK)
Zhongtian Tech(600522 CH)Hengtong Photoelectric (600487 CH)
Huawei (unlisted)Alcatel-Lucent (ALU US)ZTE (763 HK)Fiberhome (600498 CH)
JDSU (JDSU US)Finisar (FNSR US)Accelink (002281 CH)O-Net (877HK)
China Telecom (728 HK)China Unicom (762 HK)Beijing Gehua CATV (600037 CH)Shenzhen Topway (002238 CH)
Optical Fiber Preform
Corning (GLW US)Furukawa (5801 JP)Sumitomo Electric Industries (5802 JP)Fujikura (5803 JP)
IT software(10%)
AsiaInfo-Linkage (ASIA US)Digital China (861 HK)
Note: Percentage indicates vendors’ share of addressable market within operators’ capex. Rest of spending includes IT hardware (5%) and other (15%)
Source: Nomura research
Exhibit 153. Monthly net-add of 3G subscribers in China
0
500
1,000
1,500
2,000
2,500
3,000
3,500
4,000
4,500
5,000
Jan-
10
Feb
-10
Mar
-10
Apr
-10
May
-10
Jun-
10
Jul-1
0
Aug
-10
Sep
-10
Oct
-10
(k subs) China Mobile
China Unicom
China Telecom
Source: Company data, MIIT
Exhibit 154. Major entry-level smartphones
Model U8150 Ideos ZTE X850
Photo
Vendor Huawei ZTE Screen 2.8 inch QVGA capacitive
touch 2.8inch QVGA Resistive touch
Communication standard
GSM/HSPA GSM/HSPA
OS Android 2.1 Android 2.1 CPU n.a. Qualcomm MSM 7227 Market UK, HK, Taiwan, China UK, France, China Retail price Below US$200 ~US$150 Source: Company data, Nomura research
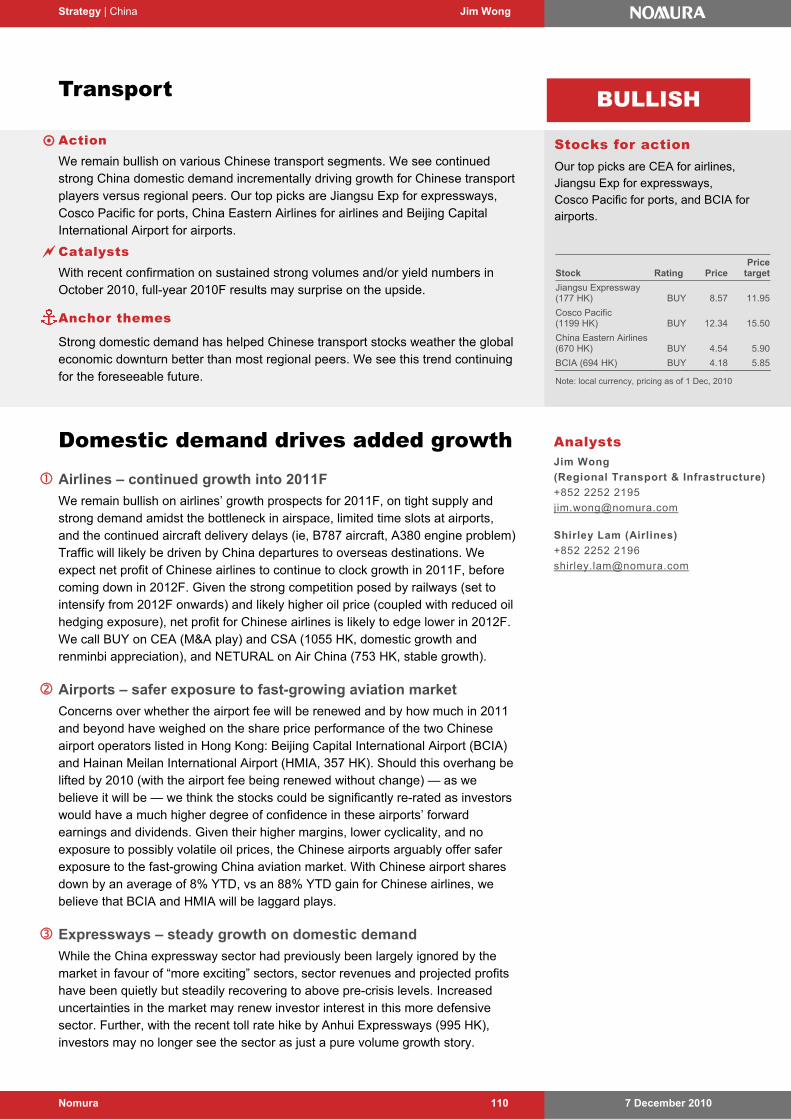
Strategy | China Jim Wong
7 December 2010 Nomura 110
Transport
Action We remain bullish on various Chinese transport segments. We see continued
strong China domestic demand incrementally driving growth for Chinese transport players versus regional peers. Our top picks are Jiangsu Exp for expressways, Cosco Pacific for ports, China Eastern Airlines for airlines and Beijing Capital International Airport for airports.
Catalysts With recent confirmation on sustained strong volumes and/or yield numbers in
October 2010, full-year 2010F results may surprise on the upside.
Anchor themes
Strong domestic demand has helped Chinese transport stocks weather the global economic downturn better than most regional peers. We see this trend continuing for the foreseeable future.
Domestic demand drives added growth Airlines – continued growth into 2011F
We remain bullish on airlines’ growth prospects for 2011F, on tight supply and strong demand amidst the bottleneck in airspace, limited time slots at airports, and the continued aircraft delivery delays (ie, B787 aircraft, A380 engine problem) Traffic will likely be driven by China departures to overseas destinations. We expect net profit of Chinese airlines to continue to clock growth in 2011F, before coming down in 2012F. Given the strong competition posed by railways (set to intensify from 2012F onwards) and likely higher oil price (coupled with reduced oil hedging exposure), net profit for Chinese airlines is likely to edge lower in 2012F. We call BUY on CEA (M&A play) and CSA (1055 HK, domestic growth and renminbi appreciation), and NETURAL on Air China (753 HK, stable growth).
Airports – safer exposure to fast-growing aviation market
Concerns over whether the airport fee will be renewed and by how much in 2011 and beyond have weighed on the share price performance of the two Chinese airport operators listed in Hong Kong: Beijing Capital International Airport (BCIA) and Hainan Meilan International Airport (HMIA, 357 HK). Should this overhang be lifted by 2010 (with the airport fee being renewed without change) — as we believe it will be — we think the stocks could be significantly re-rated as investors would have a much higher degree of confidence in these airports’ forward earnings and dividends. Given their higher margins, lower cyclicality, and no exposure to possibly volatile oil prices, the Chinese airports arguably offer safer exposure to the fast-growing China aviation market. With Chinese airport shares down by an average of 8% YTD, vs an 88% YTD gain for Chinese airlines, we believe that BCIA and HMIA will be laggard plays.
Expressways – steady growth on domestic demand
While the China expressway sector had previously been largely ignored by the market in favour of “more exciting” sectors, sector revenues and projected profits have been quietly but steadily recovering to above pre-crisis levels. Increased uncertainties in the market may renew investor interest in this more defensive sector. Further, with the recent toll rate hike by Anhui Expressways (995 HK), investors may no longer see the sector as just a pure volume growth story.
Analysts Jim Wong
(Regional Transport & Infrastructure)
+852 2252 2195
[email protected] Shirley Lam (Airlines)
+852 2252 2196
Stocks for action Our top picks are CEA for airlines, Jiangsu Exp for expressways, Cosco Pacific for ports, and BCIA for airports.
BULLISH
Stock Rating PricePrice
target
Jiangsu Expressway (177 HK) BUY 8.57 11.95
Cosco Pacific (1199 HK) BUY 12.34 15.50
China Eastern Airlines (670 HK) BUY 4.54 5.90
BCIA (694 HK) BUY 4.18 5.85
Note: local currency, pricing as of 1 Dec, 2010
Strategy | China Jim Wong
7 December 2010 Nomura 111
Expressways remain high-quality investments, in our view, providing sustainable earnings and dividend growth. Historical and updated company data confirm that growth in expressway traffic volumes is largely independent of growth in other modes of transport. Jiangsu Expressway is our top BUY for its larger market capitalisation, sustainability of forward EPS and DPS growth, and likely approval of a toll rate hike. We see Shenzhen Expressway (548 HK, BUY) as a recovery play.
Ports – domestic volumes add to incremental recovery
While the China port sector saw container throughput volumes decline in 2009 as a result of the global economic downturn, continued growth in domestic volumes has ensured that the volume deterioration has been less severe compared with that seen at most other ports around the Asia Pacific region. With China container port volume growth having averaged 20% for the first ten months of 2010, it is likely that the initial target of 10-15% volume growth for the full year of 2010F set at the beginning of the year will be exceeded. As for container box manufacturing and box leasing, side businesses for the larger China port operators, the continued shortage in box supply is expected to help sustain box leasing rates and sale prices at the current high levels for at least another year, which should further boost earnings for the China port operators in 2010. We rate COSCO Pacific and China Merchants Holdings International (144 HK) as BUYs, given that they have the most exposure to China’s container port and related segment.
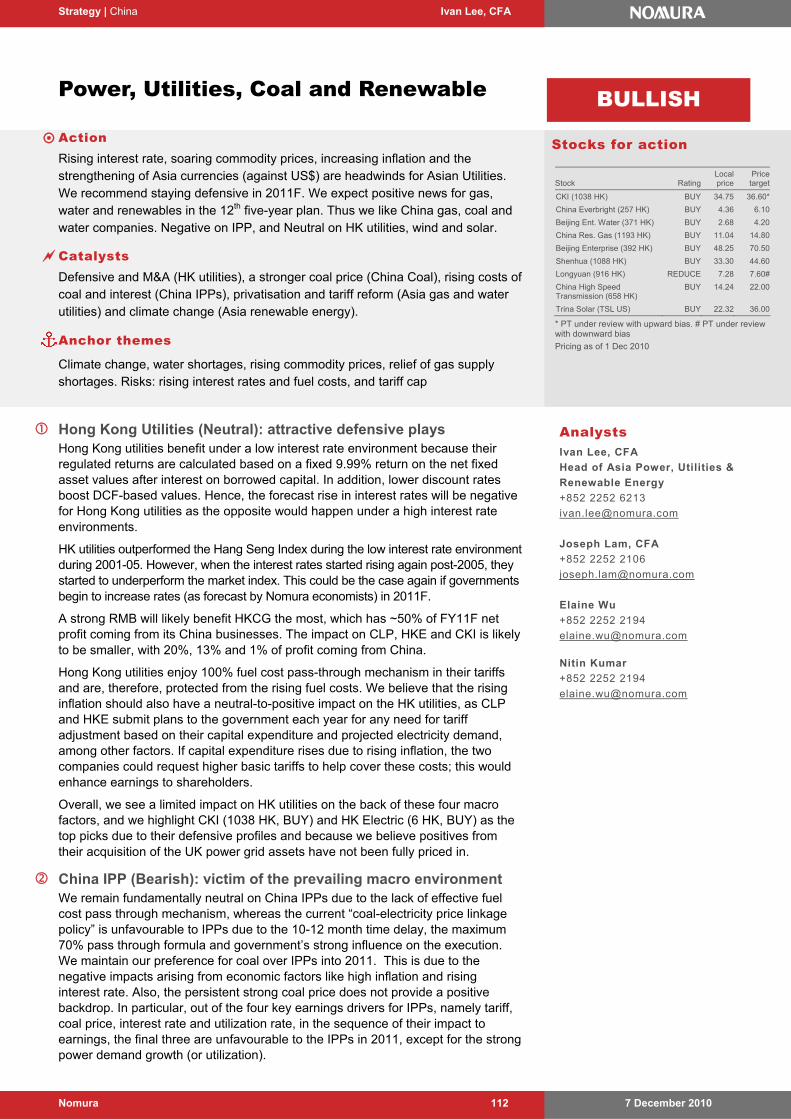
Strategy | China Ivan Lee, CFA
7 December 2010 Nomura 112
Power, Utilities, Coal and Renewable
Action Rising interest rate, soaring commodity prices, increasing inflation and the
strengthening of Asia currencies (against US$) are headwinds for Asian Utilities. We recommend staying defensive in 2011F. We expect positive news for gas, water and renewables in the 12th five-year plan. Thus we like China gas, coal and water companies. Negative on IPP, and Neutral on HK utilities, wind and solar.
Catalysts Defensive and M&A (HK utilities), a stronger coal price (China Coal), rising costs of
coal and interest (China IPPs), privatisation and tariff reform (Asia gas and water utilities) and climate change (Asia renewable energy).
Anchor themes
Climate change, water shortages, rising commodity prices, relief of gas supply shortages. Risks: rising interest rates and fuel costs, and tariff cap
Hong Kong Utilities (Neutral): attractive defensive plays Hong Kong utilities benefit under a low interest rate environment because their regulated returns are calculated based on a fixed 9.99% return on the net fixed asset values after interest on borrowed capital. In addition, lower discount rates boost DCF-based values. Hence, the forecast rise in interest rates will be negative for Hong Kong utilities as the opposite would happen under a high interest rate environments.
HK utilities outperformed the Hang Seng Index during the low interest rate environment during 2001-05. However, when the interest rates started rising again post-2005, they started to underperform the market index. This could be the case again if governments begin to increase rates (as forecast by Nomura economists) in 2011F.
A strong RMB will likely benefit HKCG the most, which has ~50% of FY11F net profit coming from its China businesses. The impact on CLP, HKE and CKI is likely to be smaller, with 20%, 13% and 1% of profit coming from China.
Hong Kong utilities enjoy 100% fuel cost pass-through mechanism in their tariffs and are, therefore, protected from the rising fuel costs. We believe that the rising inflation should also have a neutral-to-positive impact on the HK utilities, as CLP and HKE submit plans to the government each year for any need for tariff adjustment based on their capital expenditure and projected electricity demand, among other factors. If capital expenditure rises due to rising inflation, the two companies could request higher basic tariffs to help cover these costs; this would enhance earnings to shareholders.
Overall, we see a limited impact on HK utilities on the back of these four macro factors, and we highlight CKI (1038 HK, BUY) and HK Electric (6 HK, BUY) as the top picks due to their defensive profiles and because we believe positives from their acquisition of the UK power grid assets have not been fully priced in.
China IPP (Bearish): victim of the prevailing macro environment We remain fundamentally neutral on China IPPs due to the lack of effective fuel cost pass through mechanism, whereas the current “coal-electricity price linkage policy” is unfavourable to IPPs due to the 10-12 month time delay, the maximum 70% pass through formula and government’s strong influence on the execution. We maintain our preference for coal over IPPs into 2011. This is due to the negative impacts arising from economic factors like high inflation and rising interest rate. Also, the persistent strong coal price does not provide a positive backdrop. In particular, out of the four key earnings drivers for IPPs, namely tariff, coal price, interest rate and utilization rate, in the sequence of their impact to earnings, the final three are unfavourable to the IPPs in 2011, except for the strong power demand growth (or utilization).
BULLISH
Analysts Ivan Lee, CFA
Head of Asia Power, Utilities &
Renewable Energy
+852 2252 6213
Joseph Lam, CFA
+852 2252 2106
Elaine Wu
+852 2252 2194
[email protected] Nitin Kumar
+852 2252 2194
Stock RatingLocal price
Pricetarget
CKI (1038 HK) BUY 34.75 36.60*
China Everbright (257 HK) BUY 4.36 6.10
Beijing Ent. Water (371 HK) BUY 2.68 4.20
China Res. Gas (1193 HK) BUY 11.04 14.80
Beijing Enterprise (392 HK) BUY 48.25 70.50
Shenhua (1088 HK) BUY 33.30 44.60
Longyuan (916 HK) REDUCE 7.28 7.60#
China High Speed Transmission (658 HK)
BUY 14.24 22.00
Trina Solar (TSL US) BUY 22.32 36.00
* PT under review with upward bias. # PT under review with downward bias
Pricing as of 1 Dec 2010
Stocks for action
Strategy | China Ivan Lee, CFA
7 December 2010 Nomura 113
Due to the prevailing high inflation, while many IPPs have been loss making since 3Q10, the pressing tariff hike is likely to be delayed to early next year when CPI inflation falls below 3% and when the 2011 contract coal price negotiation finishes.
Also, we hold the view that even though there is a tariff hike, coal is the ultimate winner. This is because a higher contract coal price increase will likely be proposed in the next round of price negotiation given the prevailing 30% plus discount on the contract coal price to the spot price. In 2011, we expect the contract coal price to rise by 8% y-y. In addition, with the high gearing of the China IPPs, ranging from 114% to 607%, the expected 1% rise in interest rate in 2011 will negatively impact the IPPs’ bottom line. Therefore, though IPPs can benefit from strong power demand growth (9.8% in 2011, we estimate), there margins will be reduced dramatically in 2011 given that utilization is the least earnings sensitive factor.
Also, due to the lack of a proper fuel cost pass through policy, any tariff hike can be viewed as a short term positive and an opportunity to take profit. And last but not least, in the 12th five year plan, Beijing’s determination to reduce energy intensity and to create a low carbon economy do not bold well for IPPs.
Having said that, we believe a sector rerating is possible and is contingent on the implementation of a “power pooling” system. However, this is likely to happen in 3-4 years’ time, ie 2013-14, given the current government would not carry out a big reform close to the end of their term and the three preconditions of power pooling (sufficient power capacity, 5 well-connected regional power grids, and an energy bureau) are expected to be ready by that time, in our view. Therefore, without power pooling in place, we maintain our neutral view on the China IPPs. We dislike the sector; China Resources Power (836 HK, Buy) is our only BUY. We believe China Resources Power’s ROE spread over peers will expand amid market turbulence, given its superior cost control and lucrative coal portfolio.
China Water (Bullish): benefit from strong government supports Rising interest rates look negative for the highly geared China water sector, but the strengthening of the RMB would benefit companies that report their earnings in HKD. Rising commodity prices are neutral to water plays as raw water charges are passed onto customers. Rising inflation could slow the pace of water tariff hikes and hence be negative for water companies, but we believe the impact is limited given that water tariffs are the lowest among all utilities (1% of average household disposal income, compared with 2-8% for electricity bills and the 3% recommended by the Ministry of Hosing as an effective benchmark to reflect water conservation). In addition, water tariffs are determined by the local government, unlike the power tariff, which the central government sets. In conclusion, we see water, as a basic necessity at a low price, as immune to these macro factors.
Going into 2011F, we remain bullish on the China water sector as we think increased earnings visibility and still inexpensive valuations will drive a continued re-rating of China water and environmental stocks. We expect the sector to get a big new push from three “doubling” policies under the 12th Five-Year Plan (2011-15): doubling investment in waste-water treatment to RMB700bn, doubling the number of waste-to-energy (WTE) plants to 300, and doubling the water recycling rate to 10% of wastewater emissions. Although we think tap water suppliers have the best business model, we look towards 2011 with a preference for companies in wastewater/ WTE/ recycling, which we believe will experience higher growth rates of annual capacity growth rates of 10-20%. China Everbright International (257 HK, BUY) is our top pick for its strong track record and low gearing. We believe Sound Global (967 HK, BUY) deserves a re-rating for its transformation into an integrated wastewater play and its dual listing in Hong Kong. Guangdong Investment (270 HK, BUY) remains a defensive play, in our view. Beijing Enterprises Water (371 HK, BUY) and China Water Affairs (855 HK, BUY) provide more opportunities in asset acquisition and land disposal, we believe, though with somewhat more risk than CEI.
China gas distribution (Bullish): mid-to-large sized project M&A leads the way We are bullish on the gas distribution sector, given: 1) strong 20%-plus pa gas demand growth under the government’s support on gas usage; 2) with the commencement of new gas pipelines, such as Sichuan-to-East, West-to-East II, etc., more gas supply will
Strategy | China Ivan Lee, CFA
7 December 2010 Nomura 114
be flowing to China to fulfil the strong gas demand; 3) neutral impact from any potential gas pricing adjustments; and 4) more mid-to-large sized project M&A in the next few years.
Besides the favourable gas demand/supply matrix, we also see limited macro headwinds to the gas distribution sector. Based on the gas pricing history, any wellhead price hike would be followed by an end user price hike. As such, despite the concern on high CPI in the coming year, we believe the gas companies should be at least be able to maintain their absolute dollar margin. For interest rate hike risk, we estimate the impact to the gas distributors (except for China Gas Holdings) is limited, given their low gearing ratios.
In our coverage universe, China Resources Gas (1193 HK, Buy) and Beijing Enterprises (392 HK, Buy) are our top picks, given their potential to secure new projects in the coming years and be the market consolidators in the long term. We do not like China Gas Holdings (384 HK, Reduce), due to its exposure to the volatile LPG business, option dilution risks and the high gearing.
China coal (Bullish): strong coal demand vs. short-term tight supply We are long term fundamentally positive on the China coal sector given the strong pricing power and sustainable demand growth. We see the balanced-to-tight supply/ demand outlook leading to a higher coal price over the next two years. The strong GDP growth, rising power, steel and cement consumptions drive up coal demand; while industry consolidation and transportation bottlenecks (to be eased in 2014F) will cause short-term supply tightness. Given the large spot-to-contract price gap and demand/supply outlook, we expect the contract price to rise by 8% y-y, and the spot price to rise by 3% y-y in 2011F, with a stronger spot price in 4Q10-1Q11 due to winter (cold) restocking.
Although the near-term outlook is clouded by NDRC's policy intervention, we expect strong spot coal prices going into year-end and 1Q11, due to winter (cold) restocking, lapse of power rationing to high energy-insensitive industries (steel and cement) and potential positive news on volume and pricing during Jan contract coal price negotiations.
We like China Shenhua (1088 HK, Buy), given: 1) its vertically integrated business model which allows it to enhance third-party coal purchases and sales volumes, 2) it is a major beneficiary of the contract coal price increase in 2011F, 3) its improving sales-mix (to more spot) will drive up ASP and margin, and 4) its high production growth, driven by existing mines upgrades, greenfield projects and potential parent injection. Risks are a high CPI leading to government pressures on the 2011 contract price and a potential 5% resources tax; extreme weather causing seasonal tightness. We hold the view that any potential resource tax or electricity tariff hike will be imposed post the determination of the 2011 contract coal price, likely in January, given the CPI inflation pressure. Also, the net impact from a centralized resources tax should be minimal given a number of other local levies and taxes will be eliminated.
China wind (Neutral): prefer the component plays While we believe that policy support and growth here will remain strong, we see 2011F as a transitional one for players along the China wind value chain. We estimate that growth of annual wind capacity installation will start to slow from 100% y-y each year between 2007 and 2009 to around 15% y-y in 2010F and 2011F. As a majority of Chinese wind companies have been generating 70-90% of their wind revenues within China, those unable to start to bring in meaningful overseas revenue will, we believe, begin to see earnings growth slow significantly.
Besides slowing the growth rate of capacity installation (end demand) within China, we identify several other challenges: 1) grid connection bottlenecks; 2) overcapacity within certain segments such as blades and wind turbine generators (WTG); 3) the outlook for Clean Development Mechanism (CDM); and 4) quality concerns at Chinese equipment/component manufacturers, which generally have a short track record.
According to several National Development and Reform Commission (NDRC) officials and industry players, the Chinese government is likely to announce in 1Q11F a cumulative wind power capacity target of 150GW by 2020F, implying an 18% 11-year
Strategy | China Ivan Lee, CFA
7 December 2010 Nomura 115
CAGR. We believe that the Chinese wind industry could surpass this target and we remain confident about the clear visibility into wind demand growth in China.
Nonetheless, we adopt a more selective approach on stock picks and prefer equipment/component manufacturers that can start meaningful overseas sales and sustain a high earnings growth profile. We retain our conservative stance on wind turbine manufacturers and wind farm operators (Longyuan [916 HK, Reduce]) due to downward tariff pressure, falling turbine prices, uncertainty on CDM, grid connection bottleneck and increasing competition. Our top pick is China High Speed Transmission (CHST, 658 HK, Buy).
China solar (Neutral): too much of a good thing Over FY10, pure-play cell makers and wafer makers have benefitted from a surge in demand and thus ASP improvements, which are reflected in their relative outperformance within the solar sector. We believe pure-play cell and wafer makers are likely to see their earnings margins peak in 3Q10F, with continued bullish comments, as impacts from the changed industry dynamics are only starting to manifest, in our opinion. We expect 2011F to see three changes:
Undersupply to oversupply. Looking at the expansion plans of companies in the different segments of the value chain, we see mean available capacity across the chain at 23-24GW (+50% y-y) by end-2011F.
ASPs to see pressure across supply chain. With Germany likely to see an additional 12-14% cut in feed-in-tariffs from January, we believe ASP pressure will increase. We estimate a 12-18% y-y decline in module ASPs in 2011F.
Polysilicon industry enters oligopoly. With the exit of GCL Polysilicon from the pure polysilicon market, only three key suppliers remain – Hemlock, Wacker and OCI – in the market. As such, we expect pricing wars to be minimal and spot prices to revert to long-term pricing contracts.
Deteriorating demand-supply dynamics are likely to raise ASP pressure and we see module ASPs falling 12-18% y-y to US$1.4-1.5/W in 2011F from US$1.7-1.8/W currently. This will have a ripple effect across the solar value chain and we expect companies with better cost management to drive market-share gains, resulting in consolidation. We believe companies best positioned to ride the market dynamics in 2011F require key characteristics of: 1) better cost management, which favours companies with vertical integration; 2) R&D in cell-efficiency improvements – key to continued cost reductions in the segment, in our view; and 3) geographical sales diversification to capture demand from new growth markets as demand growth from Europe comes to a halt.
Within the solar industry, we believe vertically integrated players are best placed to stabilise margins, given: 1) streamlined cost structure; 2) better access to diversified end-markets; and 3) strong supplier relations.
We see companies with a pure-play business model as most vulnerable to ASP pressure, given they have reduced avenues for cost reductions and are exposed to market share shifts at their customers. Here, among the pure-play makers, we see a business model shifting towards increased vertical integration, which we believe is the right step forward.
We reaffirm our BUY ratings on Trina (Price target: US$36.0) and Yingli (Price target: US$ 15.0), as we see their margins as defensive due to the following: 1) they are leaders in vertical integration; 2) 2011F will see R&D efforts bearing fruit; and 3) their investments into improving their brand names. In our view, Suntech has the best brand name among China-based peers and a well-documented R&D programme, although its progress in 2010 has been disappointing due to balance sheet restructuring and execution delays in the launch of its high-efficiency Pluto cells. We see potential positive catalysts in 2011F from: 1) expected upstream integration into wafers; and 2) a wider Pluto cell launch looks to be on track in 2011F. We reaffirm our BUY on Suntech (Price target: US$11.0).
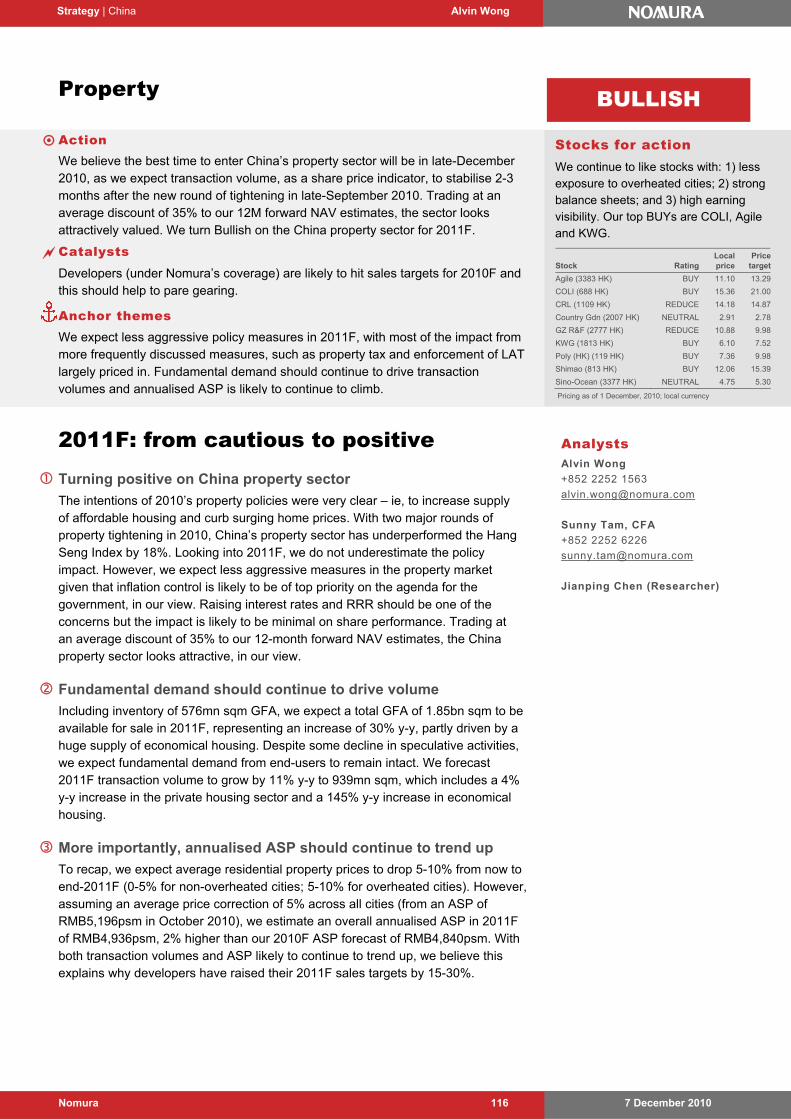
7 December 2010 Nomura 116
Strategy | China Alvin Wong
Property
Action We believe the best time to enter China’s property sector will be in late-December
2010, as we expect transaction volume, as a share price indicator, to stabilise 2-3 months after the new round of tightening in late-September 2010. Trading at an average discount of 35% to our 12M forward NAV estimates, the sector looks attractively valued. We turn Bullish on the China property sector for 2011F.
Catalysts Developers (under Nomura’s coverage) are likely to hit sales targets for 2010F and
this should help to pare gearing.
Anchor themes We expect less aggressive policy measures in 2011F, with most of the impact from
more frequently discussed measures, such as property tax and enforcement of LATlargely priced in. Fundamental demand should continue to drive transaction volumes and annualised ASP is likely to continue to climb.
2011F: from cautious to positive Turning positive on China property sector
The intentions of 2010’s property policies were very clear – ie, to increase supply of affordable housing and curb surging home prices. With two major rounds of property tightening in 2010, China’s property sector has underperformed the Hang Seng Index by 18%. Looking into 2011F, we do not underestimate the policy impact. However, we expect less aggressive measures in the property market given that inflation control is likely to be of top priority on the agenda for the government, in our view. Raising interest rates and RRR should be one of the concerns but the impact is likely to be minimal on share performance. Trading at an average discount of 35% to our 12-month forward NAV estimates, the China property sector looks attractive, in our view.
Fundamental demand should continue to drive volume
Including inventory of 576mn sqm GFA, we expect a total GFA of 1.85bn sqm to be available for sale in 2011F, representing an increase of 30% y-y, partly driven by a huge supply of economical housing. Despite some decline in speculative activities, we expect fundamental demand from end-users to remain intact. We forecast 2011F transaction volume to grow by 11% y-y to 939mn sqm, which includes a 4% y-y increase in the private housing sector and a 145% y-y increase in economical housing.
More importantly, annualised ASP should continue to trend up
To recap, we expect average residential property prices to drop 5-10% from now to end-2011F (0-5% for non-overheated cities; 5-10% for overheated cities). However, assuming an average price correction of 5% across all cities (from an ASP of RMB5,196psm in October 2010), we estimate an overall annualised ASP in 2011F of RMB4,936psm, 2% higher than our 2010F ASP forecast of RMB4,840psm. With both transaction volumes and ASP likely to continue to trend up, we believe this explains why developers have raised their 2011F sales targets by 15-30%.
Stocks for action We continue to like stocks with: 1) less exposure to overheated cities; 2) strong balance sheets; and 3) high earning visibility. Our top BUYs are COLI, Agile and KWG.
BULLISH
Stock RatingLocal price
Price target
Agile (3383 HK) BUY 11.10 13.29
COLI (688 HK) BUY 15.36 21.00
CRL (1109 HK) REDUCE 14.18 14.87
Country Gdn (2007 HK) NEUTRAL 2.91 2.78
GZ R&F (2777 HK) REDUCE 10.88 9.98
KWG (1813 HK) BUY 6.10 7.52
Poly (HK) (119 HK) BUY 7.36 9.98
Shimao (813 HK) BUY 12.06 15.39
Sino-Ocean (3377 HK) NEUTRAL 4.75 5.30
Pricing as of 1 December, 2010; local currency
Analysts Alvin Wong
+852 2252 1563
Sunny Tam, CFA
+852 2252 6226
Jianping Chen (Researcher)
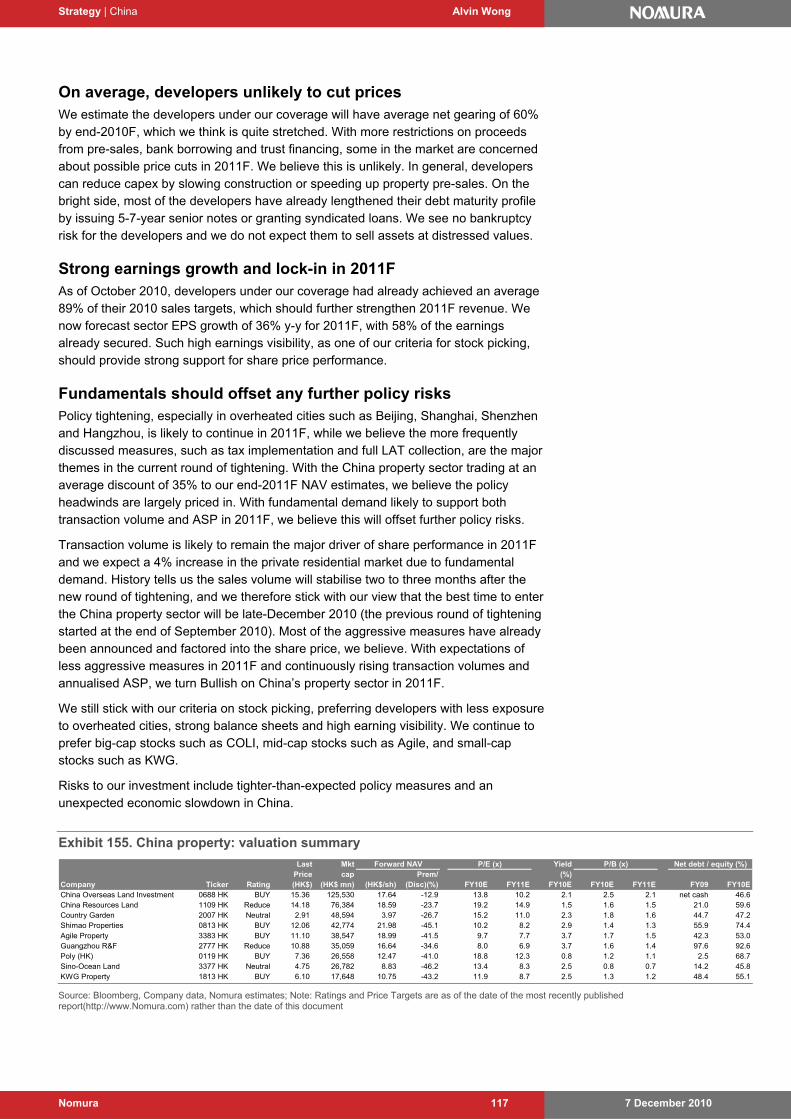
Strategy | China Alvin Wong
7 December 2010 Nomura 117
On average, developers unlikely to cut prices We estimate the developers under our coverage will have average net gearing of 60% by end-2010F, which we think is quite stretched. With more restrictions on proceeds from pre-sales, bank borrowing and trust financing, some in the market are concerned about possible price cuts in 2011F. We believe this is unlikely. In general, developers can reduce capex by slowing construction or speeding up property pre-sales. On the bright side, most of the developers have already lengthened their debt maturity profile by issuing 5-7-year senior notes or granting syndicated loans. We see no bankruptcy risk for the developers and we do not expect them to sell assets at distressed values.
Strong earnings growth and lock-in in 2011F As of October 2010, developers under our coverage had already achieved an average 89% of their 2010 sales targets, which should further strengthen 2011F revenue. We now forecast sector EPS growth of 36% y-y for 2011F, with 58% of the earnings already secured. Such high earnings visibility, as one of our criteria for stock picking, should provide strong support for share price performance.
Fundamentals should offset any further policy risks Policy tightening, especially in overheated cities such as Beijing, Shanghai, Shenzhen and Hangzhou, is likely to continue in 2011F, while we believe the more frequently discussed measures, such as tax implementation and full LAT collection, are the major themes in the current round of tightening. With the China property sector trading at an average discount of 35% to our end-2011F NAV estimates, we believe the policy headwinds are largely priced in. With fundamental demand likely to support both transaction volume and ASP in 2011F, we believe this will offset further policy risks.
Transaction volume is likely to remain the major driver of share performance in 2011F and we expect a 4% increase in the private residential market due to fundamental demand. History tells us the sales volume will stabilise two to three months after the new round of tightening, and we therefore stick with our view that the best time to enter the China property sector will be late-December 2010 (the previous round of tightening started at the end of September 2010). Most of the aggressive measures have already been announced and factored into the share price, we believe. With expectations of less aggressive measures in 2011F and continuously rising transaction volumes and annualised ASP, we turn Bullish on China’s property sector in 2011F.
We still stick with our criteria on stock picking, preferring developers with less exposure to overheated cities, strong balance sheets and high earning visibility. We continue to prefer big-cap stocks such as COLI, mid-cap stocks such as Agile, and small-cap stocks such as KWG.
Risks to our investment include tighter-than-expected policy measures and an unexpected economic slowdown in China.
Exhibit 155. China property: valuation summary
Last Mkt Forward NAV P/E (x) Yield P/B (x) Net debt / equity (%)Price cap Prem/ (%)
Company Ticker Rating (HK$) (HK$ mn) (HK$/sh) (Disc)(%) FY10E FY11E FY10E FY10E FY11E FY09 FY10EChina Overseas Land Investment 0688 HK BUY 15.36 125,530 17.64 -12.9 13.8 10.2 2.1 2.5 2.1 net cash 46.6China Resources Land 1109 HK Reduce 14.18 76,384 18.59 -23.7 19.2 14.9 1.5 1.6 1.5 21.0 59.6Country Garden 2007 HK Neutral 2.91 48,594 3.97 -26.7 15.2 11.0 2.3 1.8 1.6 44.7 47.2Shimao Properties 0813 HK BUY 12.06 42,774 21.98 -45.1 10.2 8.2 2.9 1.4 1.3 55.9 74.4Agile Property 3383 HK BUY 11.10 38,547 18.99 -41.5 9.7 7.7 3.7 1.7 1.5 42.3 53.0Guangzhou R&F 2777 HK Reduce 10.88 35,059 16.64 -34.6 8.0 6.9 3.7 1.6 1.4 97.6 92.6Poly (HK) 0119 HK BUY 7.36 26,558 12.47 -41.0 18.8 12.3 0.8 1.2 1.1 2.5 68.7Sino-Ocean Land 3377 HK Neutral 4.75 26,782 8.83 -46.2 13.4 8.3 2.5 0.8 0.7 14.2 45.8KWG Property 1813 HK BUY 6.10 17,648 10.75 -43.2 11.9 8.7 2.5 1.3 1.2 48.4 55.1
Source: Bloomberg, Company data, Nomura estimates; Note: Ratings and Price Targets are as of the date of the most recently published report(http://www.Nomura.com) rather than the date of this document
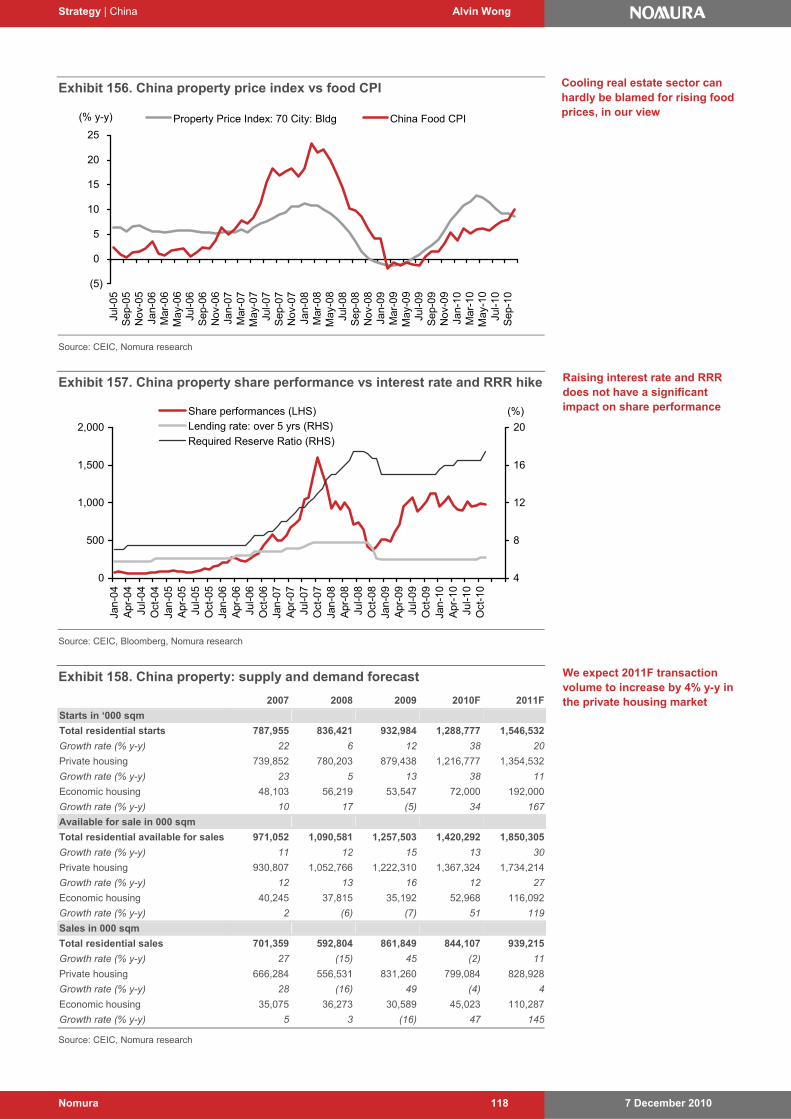
Strategy | China Alvin Wong
7 December 2010 Nomura 118
Exhibit 156. China property price index vs food CPI
(5)
0
5
10
15
20
25
Jul-0
5S
ep-0
5N
ov-0
5Ja
n-06
Mar
-06
May
-06
Jul-0
6S
ep-0
6N
ov-0
6Ja
n-07
Mar
-07
May
-07
Jul-0
7S
ep-0
7N
ov-0
7Ja
n-08
Mar
-08
May
-08
Jul-0
8S
ep-0
8N
ov-0
8Ja
n-09
Mar
-09
May
-09
Jul-0
9S
ep-0
9N
ov-0
9Ja
n-10
Mar
-10
May
-10
Jul-1
0S
ep-1
0
Property Price Index: 70 City: Bldg China Food CPI(% y-y)
Source: CEIC, Nomura research
Exhibit 157. China property share performance vs interest rate and RRR hike
0
500
1,000
1,500
2,000
Jan-
04A
pr-0
4Ju
l-04
Oct
-04
Jan-
05A
pr-0
5Ju
l-05
Oct
-05
Jan-
06A
pr-0
6Ju
l-06
Oct
-06
Jan-
07A
pr-0
7Ju
l-07
Oct
-07
Jan-
08A
pr-0
8Ju
l-08
Oct
-08
Jan-
09A
pr-0
9Ju
l-09
Oct
-09
Jan-
10A
pr-1
0Ju
l-10
Oct
-10
4
8
12
16
20
Share performances (LHS)
Lending rate: over 5 yrs (RHS)
Required Reserve Ratio (RHS)
(%)
Source: CEIC, Bloomberg, Nomura research
Exhibit 158. China property: supply and demand forecast
2007 2008 2009 2010F 2011F
Starts in ‘000 sqm
Total residential starts 787,955 836,421 932,984 1,288,777 1,546,532
Growth rate (% y-y) 22 6 12 38 20
Private housing 739,852 780,203 879,438 1,216,777 1,354,532
Growth rate (% y-y) 23 5 13 38 11
Economic housing 48,103 56,219 53,547 72,000 192,000
Growth rate (% y-y) 10 17 (5) 34 167
Available for sale in 000 sqm
Total residential available for sales 971,052 1,090,581 1,257,503 1,420,292 1,850,305
Growth rate (% y-y) 11 12 15 13 30
Private housing 930,807 1,052,766 1,222,310 1,367,324 1,734,214
Growth rate (% y-y) 12 13 16 12 27
Economic housing 40,245 37,815 35,192 52,968 116,092
Growth rate (% y-y) 2 (6) (7) 51 119
Sales in 000 sqm
Total residential sales 701,359 592,804 861,849 844,107 939,215
Growth rate (% y-y) 27 (15) 45 (2) 11
Private housing 666,284 556,531 831,260 799,084 828,928
Growth rate (% y-y) 28 (16) 49 (4) 4
Economic housing 35,075 36,273 30,589 45,023 110,287
Growth rate (% y-y) 5 3 (16) 47 145
Source: CEIC, Nomura research
Cooling real estate sector can hardly be blamed for rising food prices, in our view
Raising interest rate and RRR does not have a significant impact on share performance
We expect 2011F transaction volume to increase by 4% y-y in the private housing market
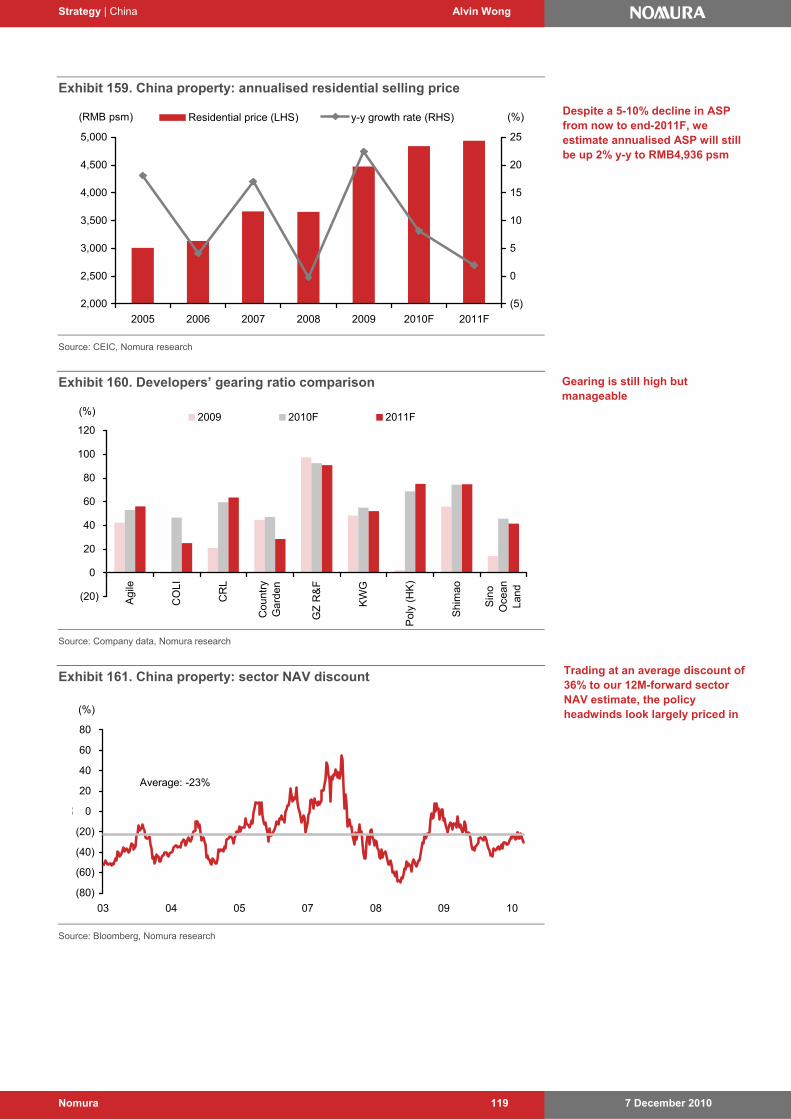
Strategy | China Alvin Wong
7 December 2010 Nomura 119
Exhibit 159. China property: annualised residential selling price
2,000
2,500
3,000
3,500
4,000
4,500
5,000
2005 2006 2007 2008 2009 2010F 2011F
(5)
0
5
10
15
20
25
Residential price (LHS) y-y growth rate (RHS) (%)(RMB psm)
Source: CEIC, Nomura research
Exhibit 160. Developers’ gearing ratio comparison
(20)
0
20
40
60
80
100
120
Ag
ile
CO
LI
CR
L
Cou
ntry
Gar
den
GZ
R&
F
KW
G
Pol
y (H
K)
Shi
mao
Sin
oO
cean
Land
2009 2010F 2011F(%)
Source: Company data, Nomura research
Exhibit 161. China property: sector NAV discount
(80)
(60)
(40)
(20)
% 0
20
40
60
80
03 04 05 07 08 09 10
Average: -23%
(%)
Source: Bloomberg, Nomura research
Despite a 5-10% decline in ASP from now to end-2011F, we estimate annualised ASP will still be up 2% y-y to RMB4,936 psm
Gearing is still high but manageable
Trading at an average discount of 36% to our 12M-forward sector NAV estimate, the policy headwinds look largely priced in

Strategy | China Henry Wu, CFA
7 December 2010 Nomura 120
This page has been intentionally left blank

Strategy | China Henry Wu, CFA
7 December 2010 Nomura 121
Stock picks
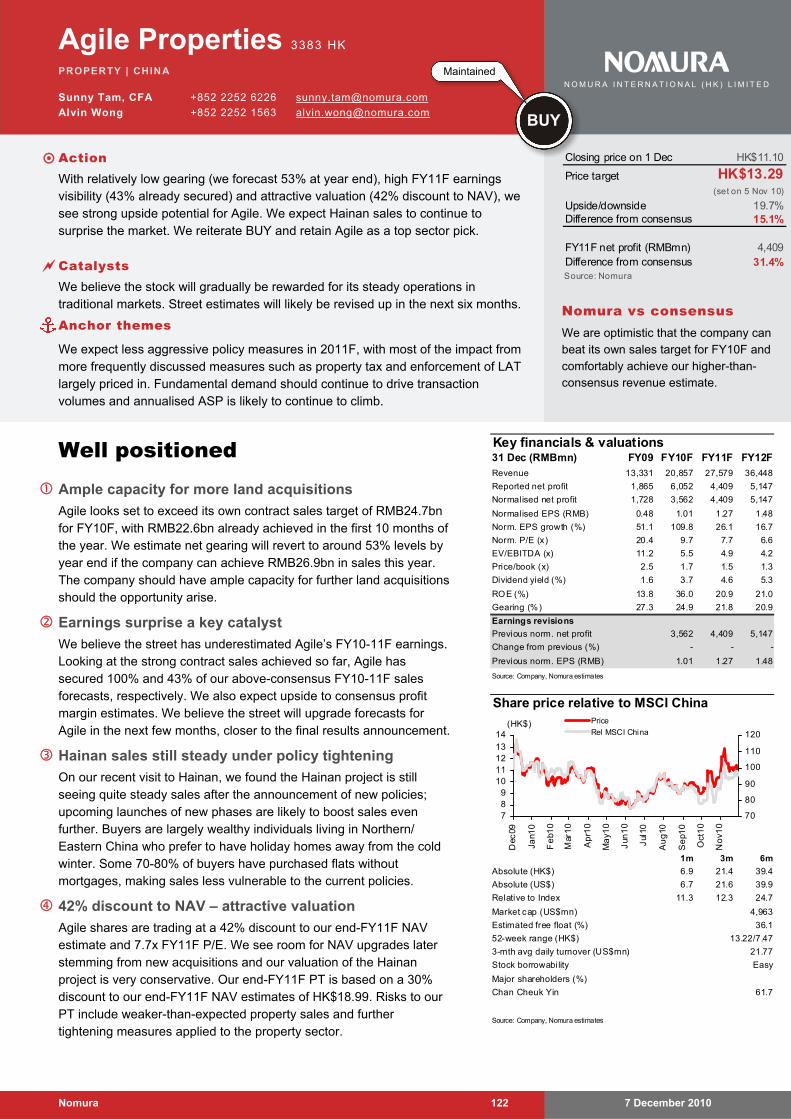
7 December 2010 Nomura 122
Agile Properties 3383 HK
PROPERTY | CHINA
Sunny Tam, CFA +852 2252 6226 [email protected]
Alvin Wong +852 2252 1563 [email protected]
Well positioned Ample capacity for more land acquisitions
Agile looks set to exceed its own contract sales target of RMB24.7bn for FY10F, with RMB22.6bn already achieved in the first 10 months of the year. We estimate net gearing will revert to around 53% levels by year end if the company can achieve RMB26.9bn in sales this year. The company should have ample capacity for further land acquisitions should the opportunity arise.
Earnings surprise a key catalyst
We believe the street has underestimated Agile’s FY10-11F earnings. Looking at the strong contract sales achieved so far, Agile has secured 100% and 43% of our above-consensus FY10-11F sales forecasts, respectively. We also expect upside to consensus profit margin estimates. We believe the street will upgrade forecasts for Agile in the next few months, closer to the final results announcement.
Hainan sales still steady under policy tightening
On our recent visit to Hainan, we found the Hainan project is still seeing quite steady sales after the announcement of new policies; upcoming launches of new phases are likely to boost sales even further. Buyers are largely wealthy individuals living in Northern/ Eastern China who prefer to have holiday homes away from the cold winter. Some 70-80% of buyers have purchased flats without mortgages, making sales less vulnerable to the current policies.
42% discount to NAV – attractive valuation
Agile shares are trading at a 42% discount to our end-FY11F NAV estimate and 7.7x FY11F P/E. We see room for NAV upgrades later stemming from new acquisitions and our valuation of the Hainan project is very conservative. Our end-FY11F PT is based on a 30% discount to our end-FY11F NAV estimates of HK$18.99. Risks to our PT include weaker-than-expected property sales and further tightening measures applied to the property sector.
Key financials & valuations31 Dec (RMBmn) FY09 FY10F FY11F FY12F
Revenue 13,331 20,857 27,579 36,448
Reported net profit 1,865 6,052 4,409 5,147
Normalised net profit 1,728 3,562 4,409 5,147
Normalised EPS (RMB) 0.48 1.01 1.27 1.48
Norm. EPS growth (%) 51.1 109.8 26.1 16.7
Norm. P/E (x) 20.4 9.7 7.7 6.6
EV/EBITDA (x) 11.2 5.5 4.9 4.2
Price/book (x) 2.5 1.7 1.5 1.3
Dividend yield (%) 1.6 3.7 4.6 5.3
ROE (%) 13.8 36.0 20.9 21.0
Gearing (%) 27.3 24.9 21.8 20.9
Earnings revisions
Previous norm. net profit 3,562 4,409 5,147
Change from previous (%) - - -
Previous norm. EPS (RMB) 1.01 1.27 1.48
Source: Company, Nomura estimates
Share price relative to MSCI China
1m 3m 6m
6.9 21.4 39.4
6.7 21.6 39.9
11.3 12.3 24.7
Easy
Source: Company, Nomura estimates
52-week range (HK$)
3-mth avg daily turnover (US$mn)
Stock borrowability
Major shareholders (%)
Chan Cheuk Yin 61.7
Absolute (HK$)
Absolute (US$)
Relative to Index
Estimated free float (%)
Market cap (US$mn) 4,963
36.1
13.22/7.47
21.77
789
10111213
14
Dec
09
Jan1
0
Fe
b10
Mar
10
Ap
r10
Ma
y10
Jun
10
Jul
10
Au
g10
Se
p10
Oct
10
No
v10
70
80
90
100
110
120
Price
Rel MSCI China(HK$)
Closing price on 1 Dec HK$11.10
Price target HK$13.29(set on 5 Nov 10)
Upside/downside 19.7%Difference from consensus 15.1%
FY11F net profit (RMBmn) 4,409Difference from consensus 31.4%Source: Nomura
Nomura vs consensus We are optimistic that the company can beat its own sales target for FY10F and comfortably achieve our higher-than-consensus revenue estimate.
Maintained
BUY
N O M U R A I N T E R N A T I O N A L ( H K ) L I M I T E D
Action With relatively low gearing (we forecast 53% at year end), high FY11F earnings
visibility (43% already secured) and attractive valuation (42% discount to NAV), we see strong upside potential for Agile. We expect Hainan sales to continue to surprise the market. We reiterate BUY and retain Agile as a top sector pick.
Catalysts We believe the stock will gradually be rewarded for its steady operations in
traditional markets. Street estimates will likely be revised up in the next six months.
Anchor themes
We expect less aggressive policy measures in 2011F, with most of the impact from more frequently discussed measures such as property tax and enforcement of LAT largely priced in. Fundamental demand should continue to drive transaction volumes and annualised ASP is likely to continue to climb.

Agile Properties Sunny Tam, CFA
7 December 2010 Nomura 123
Drilling down
Street earnings estimates too conservative? Consensus revenue forecasts for FY10-11F look conservative at RMB18.3bn and RMB22.5bn, respectively. With the company carrying forward RMB9.5bn from FY09 and achieving RMB22.6bn of its sales target in the first 10 months of 2010, it has already locked in 100% and 61% of consensus FY10-11F revenue forecasts (100% and 43% on our estimates). By the end of FY10F, the lock-in rate for FY11F revenue could be as high as 70-80%, which makes consensus earnings look far too conservative, in our view.
We also expect decent net margin improvement in 2010 -11. Revenue booked in 1H10 was mainly from sales in rather tough markets in FY09, with the ASP for booked revenue only at RMB8,122psm. Unrecognised revenue as of end-FY09 amounted to RMB9.5bn, with an ASP of RMB11,585psm, so the margin on those sales not yet booked should be considerably higher than in 1H10. Also, we expect the next batch of Hainan sales to be booked in 2H10F (with an estimated ASP of more than RMB20,000psm) to fetch net margins of ~26%, giving a boost to overall margins. We estimate around 25% of revenue booked in FY10F will come from Hainan.
Scale expansion taking shape Agile’s expansion in the past few years is gradually taking shape, with impressive success demonstrated in new markets (eg, Nanjing). It has also strengthened its brand recognition. New projects acquired in the past 1-2 years will gradually be ready for sales in the next few years, giving the company a strong base for growth, we believe. The company has maintained a relatively healthy balance sheet as compared with its peers, and should have ample capacity for further land acquisitions, in our view. The company is looking to further strengthen its position in Shanghai and Hainan, apart from recent acquisitions in Nanjing and Foshan.
Exhibit 162. Agile: NAV discount
(1.0)
(0.8)
(0.6)
(0.4)
(0.2)
0.0
0.2
0.4
0.6
06 07 08 09 10
Average: -29%
Source: Bloomberg, Nomura research
Exhibit 163. Agile: FY11F NAV forecast
(RMBmn) HK$/
share% of total
assets
Dev. prop/under dev’t
Residential 60,711 19.93 86.0
Commercial 331 0.11 0.5
Inv. prop/under dev’t
Office 1,345 0.44 1.9
Retail 1,509 0.50 2.1
Hotel prop under dev’t 6,659 2.19 9.4
Net debt (incl. land premium) (12,714) (4.17)
Total net asset 57,840
NAV/share 18.99 Source: Nomura research
Agile just needs to sell another RMB8.7bn to achieve street revenue estimates for FY11F, which we think can easily be achieved in a few months’ time
We expect decent sales growth in FY11F, even under tougher market conditions. Agile will have more new projects for launch next year (2011), which should help to gain market share
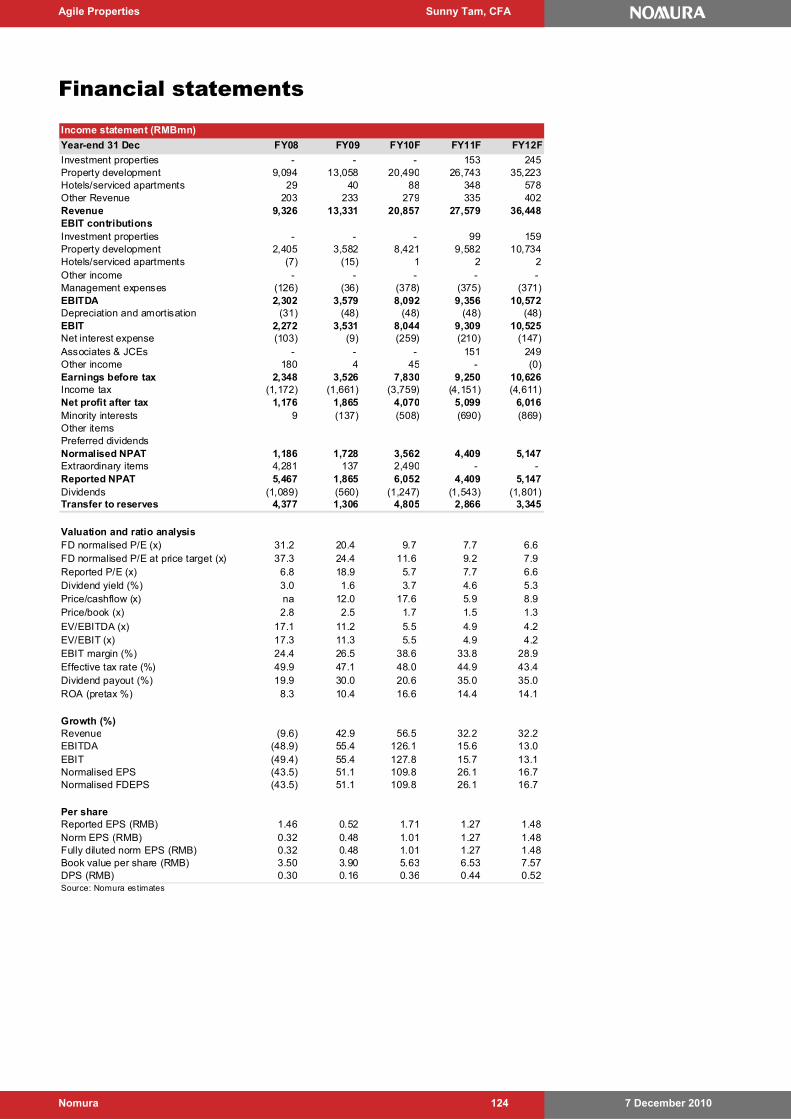
Agile Properties Sunny Tam, CFA
7 December 2010 Nomura 124
Financial statements
Income statement (RMBmn)
Year-end 31 Dec FY08 FY09 FY10F FY11F FY12F
Investment properties - - - 153 245Property development 9,094 13,058 20,490 26,743 35,223Hotels/serviced apartments 29 40 88 348 578Other Revenue 203 233 279 335 402Revenue 9,326 13,331 20,857 27,579 36,448EBIT contributionsInvestment properties - - - 99 159Property development 2,405 3,582 8,421 9,582 10,734Hotels/serviced apartments (7) (15) 1 2 2Other income - - - - - Management expenses (126) (36) (378) (375) (371)EBITDA 2,302 3,579 8,092 9,356 10,572Depreciation and amortisation (31) (48) (48) (48) (48)EBIT 2,272 3,531 8,044 9,309 10,525Net interest expense (103) (9) (259) (210) (147)Associates & JCEs - - - 151 249Other income 180 4 45 - (0)Earnings before tax 2,348 3,526 7,830 9,250 10,626Income tax (1,172) (1,661) (3,759) (4,151) (4,611)Net profit after tax 1,176 1,865 4,070 5,099 6,016Minority interests 9 (137) (508) (690) (869)Other itemsPreferred dividendsNormalised NPAT 1,186 1,728 3,562 4,409 5,147Extraordinary items 4,281 137 2,490 - - Reported NPAT 5,467 1,865 6,052 4,409 5,147Dividends (1,089) (560) (1,247) (1,543) (1,801)Transfer to reserves 4,377 1,306 4,805 2,866 3,345
Valuation and ratio analysisFD normalised P/E (x) 31.2 20.4 9.7 7.7 6.6 FD normalised P/E at price target (x) 37.3 24.4 11.6 9.2 7.9 Reported P/E (x) 6.8 18.9 5.7 7.7 6.6 Dividend yield (%) 3.0 1.6 3.7 4.6 5.3 Price/cashflow (x) na 12.0 17.6 5.9 8.9 Price/book (x) 2.8 2.5 1.7 1.5 1.3
EV/EBITDA (x) 17.1 11.2 5.5 4.9 4.2 EV/EBIT (x) 17.3 11.3 5.5 4.9 4.2 EBIT margin (%) 24.4 26.5 38.6 33.8 28.9 Effective tax rate (%) 49.9 47.1 48.0 44.9 43.4 Dividend payout (%) 19.9 30.0 20.6 35.0 35.0 ROA (pretax %) 8.3 10.4 16.6 14.4 14.1
Growth (%)Revenue (9.6) 42.9 56.5 32.2 32.2 EBITDA (48.9) 55.4 126.1 15.6 13.0 EBIT (49.4) 55.4 127.8 15.7 13.1 Normalised EPS (43.5) 51.1 109.8 26.1 16.7 Normalised FDEPS (43.5) 51.1 109.8 26.1 16.7
Per shareReported EPS (RMB) 1.46 0.52 1.71 1.27 1.48Norm EPS (RMB) 0.32 0.48 1.01 1.27 1.48Fully diluted norm EPS (RMB) 0.32 0.48 1.01 1.27 1.48Book value per share (RMB) 3.50 3.90 5.63 6.53 7.57DPS (RMB) 0.30 0.16 0.36 0.44 0.52Source: Nomura estimates
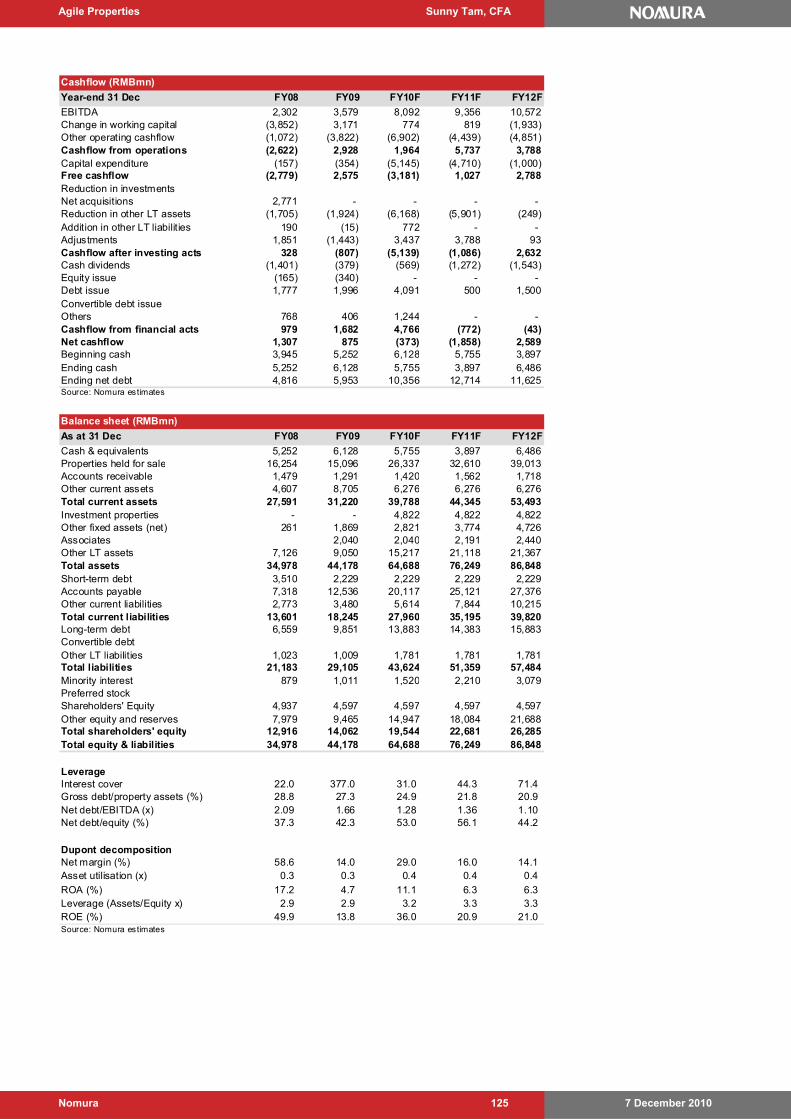
Agile Properties Sunny Tam, CFA
7 December 2010 Nomura 125
Cashflow (RMBmn)
Year-end 31 Dec FY08 FY09 FY10F FY11F FY12F
EBITDA 2,302 3,579 8,092 9,356 10,572Change in working capital (3,852) 3,171 774 819 (1,933)Other operating cashflow (1,072) (3,822) (6,902) (4,439) (4,851)Cashflow from operations (2,622) 2,928 1,964 5,737 3,788Capital expenditure (157) (354) (5,145) (4,710) (1,000)Free cashflow (2,779) 2,575 (3,181) 1,027 2,788Reduction in investmentsNet acquisitions 2,771 - - - - Reduction in other LT assets (1,705) (1,924) (6,168) (5,901) (249)Addition in other LT liabilities 190 (15) 772 - - Adjustments 1,851 (1,443) 3,437 3,788 93Cashflow after investing acts 328 (807) (5,139) (1,086) 2,632Cash dividends (1,401) (379) (569) (1,272) (1,543)Equity issue (165) (340) - - - Debt issue 1,777 1,996 4,091 500 1,500Convertible debt issueOthers 768 406 1,244 - - Cashflow from financial acts 979 1,682 4,766 (772) (43)Net cashflow 1,307 875 (373) (1,858) 2,589Beginning cash 3,945 5,252 6,128 5,755 3,897Ending cash 5,252 6,128 5,755 3,897 6,486Ending net debt 4,816 5,953 10,356 12,714 11,625Source: Nomura estimates
Balance sheet (RMBmn)
As at 31 Dec FY08 FY09 FY10F FY11F FY12F
Cash & equivalents 5,252 6,128 5,755 3,897 6,486Properties held for sale 16,254 15,096 26,337 32,610 39,013Accounts receivable 1,479 1,291 1,420 1,562 1,718Other current assets 4,607 8,705 6,276 6,276 6,276Total current assets 27,591 31,220 39,788 44,345 53,493Investment properties - - 4,822 4,822 4,822Other fixed assets (net) 261 1,869 2,821 3,774 4,726Associates 2,040 2,040 2,191 2,440Other LT assets 7,126 9,050 15,217 21,118 21,367Total assets 34,978 44,178 64,688 76,249 86,848Short-term debt 3,510 2,229 2,229 2,229 2,229Accounts payable 7,318 12,536 20,117 25,121 27,376Other current liabilities 2,773 3,480 5,614 7,844 10,215Total current liabilities 13,601 18,245 27,960 35,195 39,820Long-term debt 6,559 9,851 13,883 14,383 15,883Convertible debtOther LT liabilities 1,023 1,009 1,781 1,781 1,781Total liabilities 21,183 29,105 43,624 51,359 57,484Minority interest 879 1,011 1,520 2,210 3,079Preferred stockShareholders' Equity 4,937 4,597 4,597 4,597 4,597Other equity and reserves 7,979 9,465 14,947 18,084 21,688Total shareholders' equity 12,916 14,062 19,544 22,681 26,285Total equity & liabilities 34,978 44,178 64,688 76,249 86,848
LeverageInterest cover 22.0 377.0 31.0 44.3 71.4 Gross debt/property assets (%) 28.8 27.3 24.9 21.8 20.9 Net debt/EBITDA (x) 2.09 1.66 1.28 1.36 1.10 Net debt/equity (%) 37.3 42.3 53.0 56.1 44.2
Dupont decompositionNet margin (%) 58.6 14.0 29.0 16.0 14.1 Asset utilisation (x) 0.3 0.3 0.4 0.4 0.4
ROA (%) 17.2 4.7 11.1 6.3 6.3 Leverage (Assets/Equity x) 2.9 2.9 3.2 3.3 3.3 ROE (%) 49.9 13.8 36.0 20.9 21.0 Source: Nomura estimates
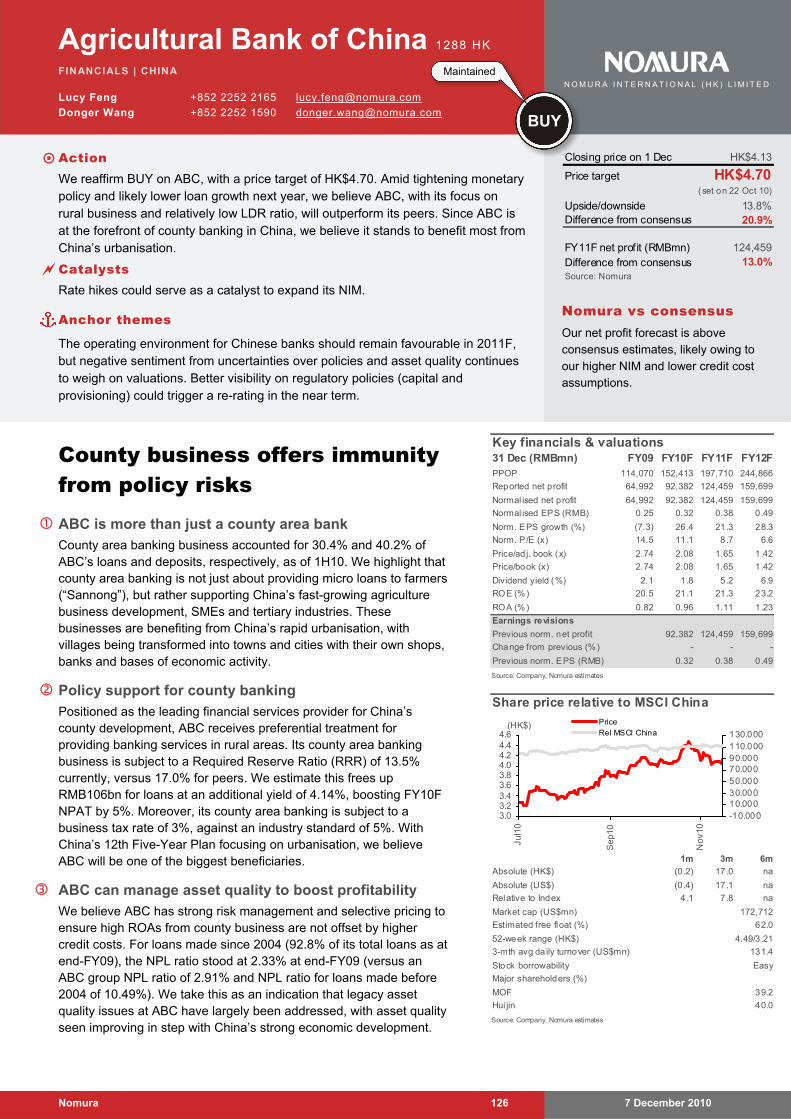
7 December 2010 Nomura 126
Agricultural Bank of China 1288 HK
FINANCIALS | CHINA
Lucy Feng +852 2252 2165 [email protected]
Donger Wang +852 2252 1590 [email protected]
County business offers immunity from policy risks
ABC is more than just a county area bank
County area banking business accounted for 30.4% and 40.2% of ABC’s loans and deposits, respectively, as of 1H10. We highlight that county area banking is not just about providing micro loans to farmers (“Sannong”), but rather supporting China’s fast-growing agriculture business development, SMEs and tertiary industries. These businesses are benefiting from China’s rapid urbanisation, with villages being transformed into towns and cities with their own shops, banks and bases of economic activity.
Policy support for county banking
Positioned as the leading financial services provider for China’s county development, ABC receives preferential treatment for providing banking services in rural areas. Its county area banking business is subject to a Required Reserve Ratio (RRR) of 13.5% currently, versus 17.0% for peers. We estimate this frees up RMB106bn for loans at an additional yield of 4.14%, boosting FY10F NPAT by 5%. Moreover, its county area banking is subject to a business tax rate of 3%, against an industry standard of 5%. With China’s 12th Five-Year Plan focusing on urbanisation, we believe ABC will be one of the biggest beneficiaries.
ABC can manage asset quality to boost profitability
We believe ABC has strong risk management and selective pricing to ensure high ROAs from county business are not offset by higher credit costs. For loans made since 2004 (92.8% of its total loans as at end-FY09), the NPL ratio stood at 2.33% at end-FY09 (versus an ABC group NPL ratio of 2.91% and NPL ratio for loans made before 2004 of 10.49%). We take this as an indication that legacy asset quality issues at ABC have largely been addressed, with asset quality seen improving in step with China’s strong economic development.
Key financials & valuations31 Dec (RMBmn) FY09 FY10F FY11F FY12FPPOP 114,070 152,413 197,710 244,866
Reported net profit 64,992 92,382 124,459 159,699
Normal ised net profit 64,992 92,382 124,459 159,699
Normal ised EPS (RMB) 0.25 0.32 0.38 0.49
Norm. EPS growth (%) (7.3) 26.4 21.3 28.3
Norm. P /E (x) 14.5 11.1 8.7 6.6
Price/ad j. book (x) 2.74 2.08 1.65 1.42
Price/book (x) 2.74 2.08 1.65 1.42
Dividend yield (%) 2.1 1.8 5.2 6.9
ROE (%) 20.5 21.1 21.3 23.2
ROA (%) 0.82 0.96 1.11 1 .23
Earnings revisions
Previous norm. net profit 92,382 124,459 159,699
Change from previous (%) - - -
Previous norm. EPS (RMB) 0.32 0.38 0.49
Source: Company, Nomura estimates
Share price relative to MSCI China
1m 3m 6m
(0.2) 17.0 na
(0.4) 17.1 na
4 .1 7 .8 na
Easy
Source: Company, Nomura estimates
172,712
62.0
4.49/3.21
131.4
Absolute (HK$)
Absolute (US$)
Relative to Index
Estimated free float (%)
Market cap (US$mn)
40.0
Major shareholders (%)
MOF 39.2
52-week range (HK$)
3-mth avg da ily turnover (US$mn)
Hui jin
Stock borrowability
3.03.23.43.63.84.04.24.44.6
Jul1
0
Sep
10
No
v10
-10.00010.00030.00050.00070.00090.000110.000130.000
PriceRel MSCI China
(HK$)
Closing price on 1 Dec HK$4.13
Price target HK$4.70(set on 22 Oct 10)
Upside/downside 13.8%Difference from consensus 20.9%
FY11F net profit (RMBmn) 124,459Difference from consensus 13.0%Source: Nomura
Nomura vs consensus Our net profit forecast is above consensus estimates, likely owing to our higher NIM and lower credit cost assumptions.
Maintained
BUY
Action We reaffirm BUY on ABC, with a price target of HK$4.70. Amid tightening monetary
policy and likely lower loan growth next year, we believe ABC, with its focus on rural business and relatively low LDR ratio, will outperform its peers. Since ABC is at the forefront of county banking in China, we believe it stands to benefit most from China’s urbanisation.
Catalysts Rate hikes could serve as a catalyst to expand its NIM.
Anchor themes
The operating environment for Chinese banks should remain favourable in 2011F, but negative sentiment from uncertainties over policies and asset quality continues to weigh on valuations. Better visibility on regulatory policies (capital and provisioning) could trigger a re-rating in the near term.
N O M U R A I N T E R N A T I O N A L ( H K ) L I M I T E D
Agricultural Bank of China Lucy Feng
7 December 2010 Nomura 127
Valuation Our price target of HK$4.70 is based on 2.2x P/BV applied to the average FY10F and FY11F BVPS. Our sustainable ROE is 16.6%. We use a Gordon Growth model (target P/BV= (sustainable ROE – long-term growth) / (cost of equity – long-term growth)) to derive our fair P/BV range, assuming a cost of equity of 12% and terminal growth rate of 8.3%. We derive our terminal growth rate by applying a 50% payout ratio to our long-term sustainable ROE assumption.
Investment risks Being one of the largest banks in China, ABC remains closely tied to the Chinese economy. We believe that a more severe-than-expected macro tightening could result in a sharp rise in bad debt costs. The government may implement certain policies specifically for ABC in county areas which might or might not be of benefit to ABC. A slowing economy would likely have negative implications for loan growth and asset quality. The concept of market and operations-related risks has only been introduced into China’s banking system in recent years, and the system itself is yet to go through a full credit cycle. Therefore, there is no historical data showing how Chinese banks may perform under a more testing credit environment.
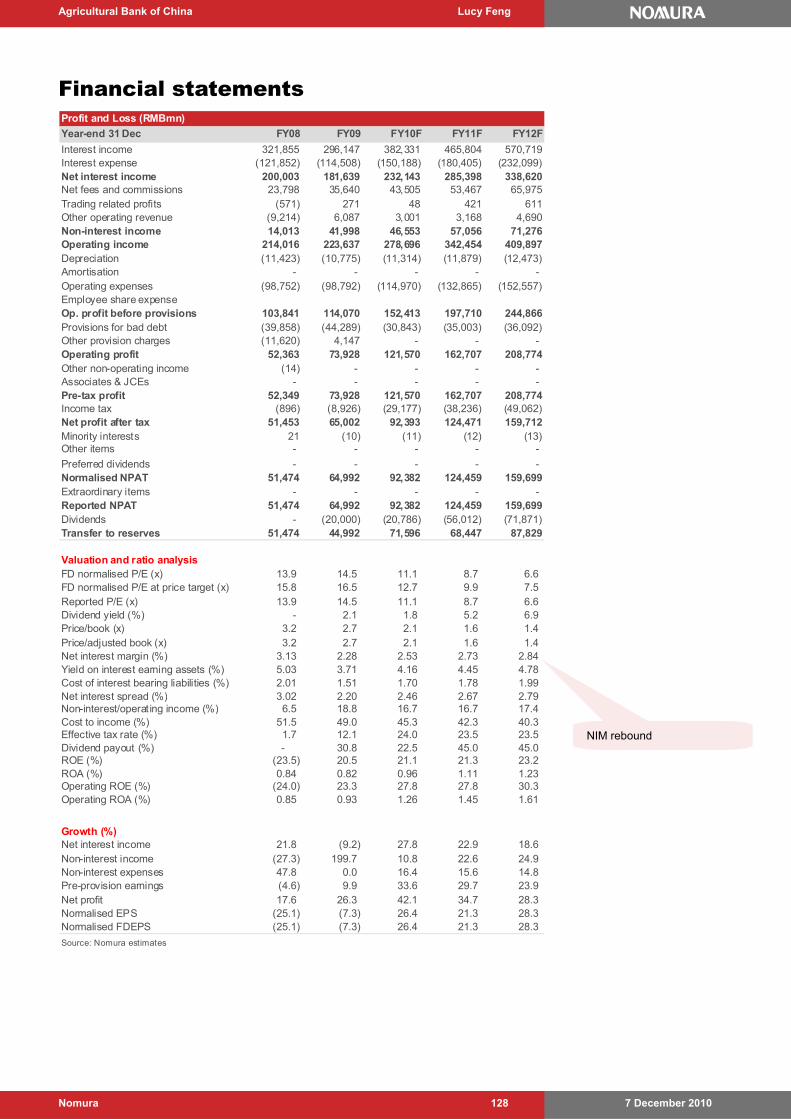
Agricultural Bank of China Lucy Feng
7 December 2010 Nomura 128
Financial statements Profit and Loss (RMBmn)
Year-end 31 Dec FY08 FY09 FY10F FY11F FY12F
Interest income 321,855 296,147 382,331 465,804 570,719Interest expense (121,852) (114,508) (150,188) (180,405) (232,099)Net interest income 200,003 181,639 232,143 285,398 338,620Net fees and commissions 23,798 35,640 43,505 53,467 65,975Trading related profits (571) 271 48 421 611Other operating revenue (9,214) 6,087 3,001 3,168 4,690Non-interest income 14,013 41,998 46,553 57,056 71,276Operating income 214,016 223,637 278,696 342,454 409,897Depreciation (11,423) (10,775) (11,314) (11,879) (12,473)Amortisation - - - - - Operating expenses (98,752) (98,792) (114,970) (132,865) (152,557)Employee share expenseOp. profit before provisions 103,841 114,070 152,413 197,710 244,866Provisions for bad debt (39,858) (44,289) (30,843) (35,003) (36,092)Other provision charges (11,620) 4,147 - - - Operating profit 52,363 73,928 121,570 162,707 208,774Other non-operating income (14) - - - - Associates & JCEs - - - - - Pre-tax profit 52,349 73,928 121,570 162,707 208,774Income tax (896) (8,926) (29,177) (38,236) (49,062)Net profit after tax 51,453 65,002 92,393 124,471 159,712Minority interests 21 (10) (11) (12) (13)Other items - - - - -
Preferred dividends - - - - - Normalised NPAT 51,474 64,992 92,382 124,459 159,699Extraordinary items - - - - - Reported NPAT 51,474 64,992 92,382 124,459 159,699Dividends - (20,000) (20,786) (56,012) (71,871)Transfer to reserves 51,474 44,992 71,596 68,447 87,829
Valuation and ratio analysisFD normalised P/E (x) 13.9 14.5 11.1 8.7 6.6 FD normalised P/E at price target (x) 15.8 16.5 12.7 9.9 7.5 Reported P/E (x) 13.9 14.5 11.1 8.7 6.6 Dividend yield (%) - 2.1 1.8 5.2 6.9 Price/book (x) 3.2 2.7 2.1 1.6 1.4 Price/adjusted book (x) 3.2 2.7 2.1 1.6 1.4 Net interest margin (%) 3.13 2.28 2.53 2.73 2.84 Yield on interest earning assets (%) 5.03 3.71 4.16 4.45 4.78 Cost of interest bearing liabilities (%) 2.01 1.51 1.70 1.78 1.99 Net interest spread (%) 3.02 2.20 2.46 2.67 2.79 Non-interest/operating income (%) 6.5 18.8 16.7 16.7 17.4 Cost to income (%) 51.5 49.0 45.3 42.3 40.3 Effective tax rate (%) 1.7 12.1 24.0 23.5 23.5 Dividend payout (%) - 30.8 22.5 45.0 45.0 ROE (%) (23.5) 20.5 21.1 21.3 23.2 ROA (%) 0.84 0.82 0.96 1.11 1.23 Operating ROE (%) (24.0) 23.3 27.8 27.8 30.3 Operating ROA (%) 0.85 0.93 1.26 1.45 1.61
Growth (%)Net interest income 21.8 (9.2) 27.8 22.9 18.6 Non-interest income (27.3) 199.7 10.8 22.6 24.9 Non-interest expenses 47.8 0.0 16.4 15.6 14.8 Pre-provision earnings (4.6) 9.9 33.6 29.7 23.9 Net profit 17.6 26.3 42.1 34.7 28.3 Normalised EPS (25.1) (7.3) 26.4 21.3 28.3 Normalised FDEPS (25.1) (7.3) 26.4 21.3 28.3
Source: Nomura estimates
NIM rebound
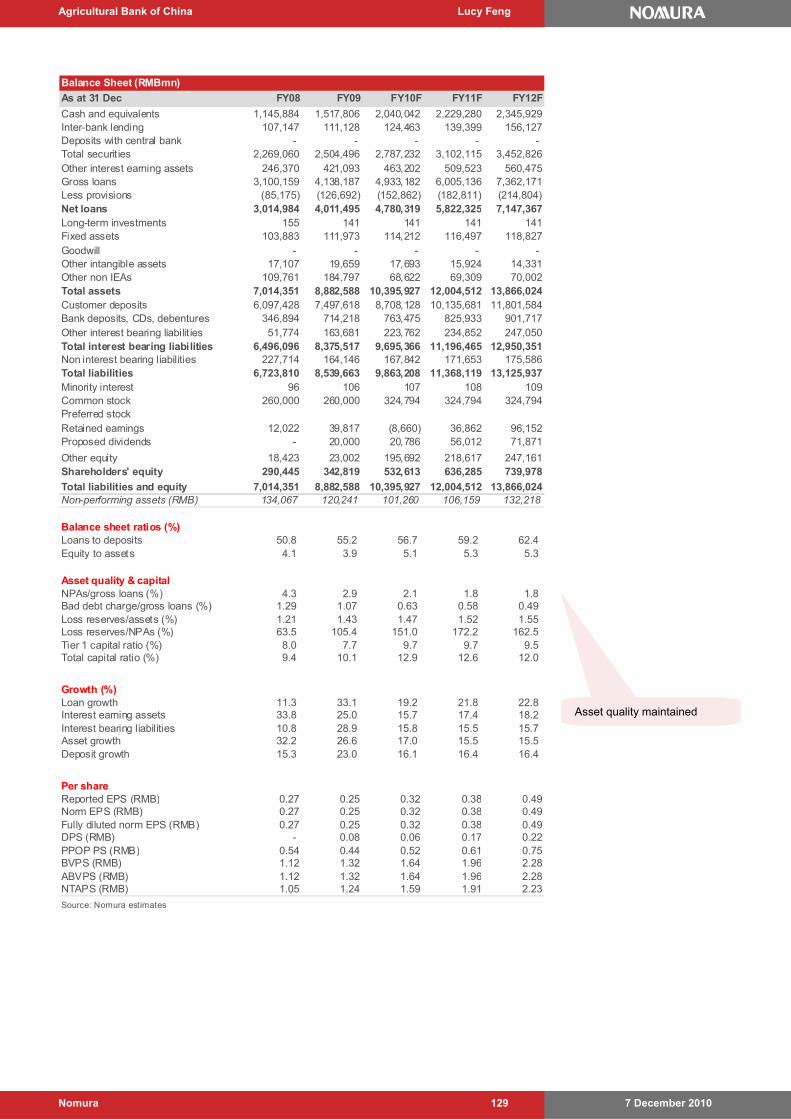
Agricultural Bank of China Lucy Feng
7 December 2010 Nomura 129
Balance Sheet (RMBmn)
As at 31 Dec FY08 FY09 FY10F FY11F FY12F
Cash and equivalents 1,145,884 1,517,806 2,040,042 2,229,280 2,345,929Inter-bank lending 107,147 111,128 124,463 139,399 156,127Deposits with central bank - - - - - Total securit ies 2,269,060 2,504,496 2,787,232 3,102,115 3,452,826Other interest earning assets 246,370 421,093 463,202 509,523 560,475Gross loans 3,100,159 4,138,187 4,933,182 6,005,136 7,362,171Less provisions (85,175) (126,692) (152,862) (182,811) (214,804)Net loans 3,014,984 4,011,495 4,780,319 5,822,325 7,147,367Long-term investments 155 141 141 141 141Fixed assets 103,883 111,973 114,212 116,497 118,827Goodwill - - - - - Other intangible assets 17,107 19,659 17,693 15,924 14,331Other non IEAs 109,761 184,797 68,622 69,309 70,002Total assets 7,014,351 8,882,588 10,395,927 12,004,512 13,866,024Customer deposits 6,097,428 7,497,618 8,708,128 10,135,681 11,801,584Bank deposits, CDs, debentures 346,894 714,218 763,475 825,933 901,717Other interest bearing liabilit ies 51,774 163,681 223,762 234,852 247,050Total interest bearing liabilities 6,496,096 8,375,517 9,695,366 11,196,465 12,950,351Non interest bearing liabilities 227,714 164,146 167,842 171,653 175,586Total liabilities 6,723,810 8,539,663 9,863,208 11,368,119 13,125,937Minority interest 96 106 107 108 109Common stock 260,000 260,000 324,794 324,794 324,794Preferred stockRetained earnings 12,022 39,817 (8,660) 36,862 96,152Proposed dividends - 20,000 20,786 56,012 71,871
Other equity 18,423 23,002 195,692 218,617 247,161Shareholders' equity 290,445 342,819 532,613 636,285 739,978
Total liabilities and equity 7,014,351 8,882,588 10,395,927 12,004,512 13,866,024Non-performing assets (RMB) 134,067 120,241 101,260 106,159 132,218
Balance sheet ratios (%)Loans to deposits 50.8 55.2 56.7 59.2 62.4 Equity to assets 4.1 3.9 5.1 5.3 5.3
Asset quality & capitalNPAs/gross loans (%) 4.3 2.9 2.1 1.8 1.8 Bad debt charge/gross loans (%) 1.29 1.07 0.63 0.58 0.49 Loss reserves/assets (%) 1.21 1.43 1.47 1.52 1.55 Loss reserves/NPAs (%) 63.5 105.4 151.0 172.2 162.5 Tier 1 capital ratio (%) 8.0 7.7 9.7 9.7 9.5 Total capital ratio (%) 9.4 10.1 12.9 12.6 12.0
Growth (%)Loan growth 11.3 33.1 19.2 21.8 22.8 Interest earning assets 33.8 25.0 15.7 17.4 18.2 Interest bearing liabilities 10.8 28.9 15.8 15.5 15.7 Asset growth 32.2 26.6 17.0 15.5 15.5 Deposit growth 15.3 23.0 16.1 16.4 16.4
Per shareReported EPS (RMB) 0.27 0.25 0.32 0.38 0.49Norm EPS (RMB) 0.27 0.25 0.32 0.38 0.49Fully diluted norm EPS (RMB) 0.27 0.25 0.32 0.38 0.49DPS (RMB) - 0.08 0.06 0.17 0.22PPOP PS (RMB) 0.54 0.44 0.52 0.61 0.75BVPS (RMB) 1.12 1.32 1.64 1.96 2.28ABVPS (RMB) 1.12 1.32 1.64 1.96 2.28NTAPS (RMB) 1.05 1.24 1.59 1.91 2.23
Source: Nomura estimates
Asset quality maintained
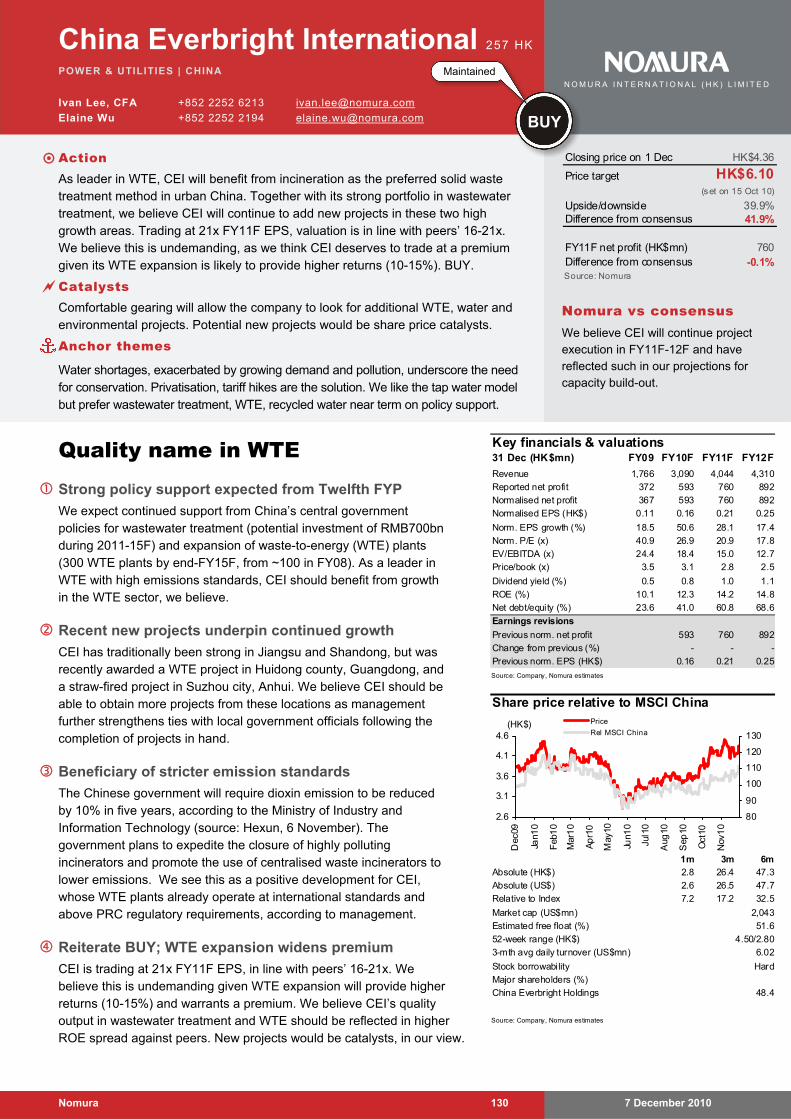
7 December 2010 Nomura 130
China Everbright International 257 HK
POWER & UTILITIES | CHINA
Ivan Lee, CFA +852 2252 6213 [email protected]
Elaine Wu +852 2252 2194 [email protected]
Quality name in WTE Strong policy support expected from Twelfth FYP
We expect continued support from China’s central government policies for wastewater treatment (potential investment of RMB700bn during 2011-15F) and expansion of waste-to-energy (WTE) plants (300 WTE plants by end-FY15F, from ~100 in FY08). As a leader in WTE with high emissions standards, CEI should benefit from growth in the WTE sector, we believe.
Recent new projects underpin continued growth
CEI has traditionally been strong in Jiangsu and Shandong, but was recently awarded a WTE project in Huidong county, Guangdong, and a straw-fired project in Suzhou city, Anhui. We believe CEI should be able to obtain more projects from these locations as management further strengthens ties with local government officials following the completion of projects in hand.
Beneficiary of stricter emission standards
The Chinese government will require dioxin emission to be reduced by 10% in five years, according to the Ministry of Industry and Information Technology (source: Hexun, 6 November). The government plans to expedite the closure of highly polluting incinerators and promote the use of centralised waste incinerators to lower emissions. We see this as a positive development for CEI, whose WTE plants already operate at international standards and above PRC regulatory requirements, according to management.
Reiterate BUY; WTE expansion widens premium
CEI is trading at 21x FY11F EPS, in line with peers’ 16-21x. We believe this is undemanding given WTE expansion will provide higher returns (10-15%) and warrants a premium. We believe CEI’s quality output in wastewater treatment and WTE should be reflected in higher ROE spread against peers. New projects would be catalysts, in our view.
Key financials & valuations31 Dec (HK$mn) FY09 FY10F FY11F FY12F
Revenue 1,766 3,090 4,044 4,310
Reported net profit 372 593 760 892
Normalised net profit 367 593 760 892
Normalised EPS (HK$) 0.11 0.16 0.21 0.25
Norm. EPS growth (%) 18.5 50.6 28.1 17.4
Norm. P/E (x) 40.9 26.9 20.9 17.8
EV/EBITDA (x) 24.4 18.4 15.0 12.7
Price/book (x) 3.5 3.1 2.8 2.5
Dividend yield (%) 0.5 0.8 1.0 1.1
ROE (%) 10.1 12.3 14.2 14.8
Net debt/equity (%) 23.6 41.0 60.8 68.6
Earnings revisions
Previous norm. net profit 593 760 892
Change from previous (%) - - -
Previous norm. EPS (HK$) 0.16 0.21 0.25
Source: Company, Nomura estimates
Share price relative to MSCI China
1m 3m 6m 2.8 26.4 47.3
2.6 26.5 47.7
7.2 17.2 32.5
Hard
Source: Company, Nomura estimates
2,043
51.6
4.50/2.80
6.02
Absolute (HK$)
Absolute (US$)
Relative to Index
Estimated free float (%)
Market cap (US$mn)
Major shareholders (%)
China Everbright Holdings 48.4
52-week range (HK$)
3-mth avg daily turnover (US$mn)
Stock borrowability
2.6
3.1
3.6
4.1
4.6
Dec
09
Jan1
0
Feb
10
Mar
10
Ap
r10
May
10
Jun1
0
Jul1
0
Aug
10
Sep
10
Oct
10
Nov
10
80
90
100
110
120
130
Price
Rel MSCI China(HK$)
Closing price on 1 Dec HK$4.36
Price target HK$6.10(set on 15 Oct 10)
Upside/downside 39.9%Difference from consensus 41.9%
FY11F net profit (HK$mn) 760Difference from consensus -0.1%Source: Nomura
Nomura vs consensus We believe CEI will continue project execution in FY11F-12F and have reflected such in our projections for capacity build-out.
Maintained
BUY
N O M U R A I N T E R N A T I O N A L ( H K ) L I M I T E D
Action As leader in WTE, CEI will benefit from incineration as the preferred solid waste
treatment method in urban China. Together with its strong portfolio in wastewater treatment, we believe CEI will continue to add new projects in these two high growth areas. Trading at 21x FY11F EPS, valuation is in line with peers’ 16-21x. We believe this is undemanding, as we think CEI deserves to trade at a premium given its WTE expansion is likely to provide higher returns (10-15%). BUY.
Catalysts Comfortable gearing will allow the company to look for additional WTE, water and
environmental projects. Potential new projects would be share price catalysts.
Anchor themes
Water shortages, exacerbated by growing demand and pollution, underscore the need for conservation. Privatisation, tariff hikes are the solution. We like the tap water model but prefer wastewater treatment, WTE, recycled water near term on policy support.
China Everbright International Ivan Lee, CFA
7 December 2010 Nomura 131
Drilling down
Well positioned to benefit from environmental protection policies Large exposure to WTE and WWT, with development in alternative energy We expect continued support from China’s central government policies for wastewater treatment (potential investment of RMB700bn during 2011-15F) and expansion of waste-to-energy (WTE) plants (300 WTE plants by end-FY15F, from ~100 in FY08). As a leader in WTE with high emissions standards, CEI should benefit from growth in the WTE sector.
China Everbright International (CEI) is a recognised leader in China’s WTE space, with a focus on developing environmental protection industrial parks, which often comprise various projects including methane-to-energy, wastewater treatment (WWT) and WTE. We expect WTE to remain the main revenue driver, contributing 65% of total FY10F revenue, followed by WWT at 26% of total.
Strong balance sheet; credit facility with ADB Net debt to equity as of June 2010 was 39%, which would give CEI room to further gear up to fund new projects. The company has credit facilities of US$200mn with Asia Development Bank, which we expect it to draw down in 2H10. We estimate this would increase gearing to 70%, within management’s guided gearing range of 60-70%. This loan will allow the company to fund HK$4.7bn of investments, on our estimate, assuming project level gearing of 67%. Therefore, we believe CEI’s RMB1bn-2bn capex pa is not under pressure.
CEI stands to benefit from stricter government requirements on WTE emission standards The Chinese government has drafted a document to require dioxin emission to be reduced by 10% in five years, according to Ministry of Industry and Information Technology (source: Hexun, 6 November 2010). The government plans to expedite the closure of highly polluting incinerators and promote the use of centralised waste incinerators to lower emissions. We see this as a positive development for CEI, whose WTE plants already operate at international standards and above the PRC regulatory requirements as per management.
Reiterate BUY CEI is trading at 21x FY11F EPS vs peers’ 16-21x. We think the valuation is undemanding as we believe WTE expansion should provide higher returns. Its quality output in both WWT and WTE should reflect higher ROE-spread against peers as the government raises the bar for environmental protection, in our view. Also, the company’s growth momentum remains strong. We believe potential new projects would be share price catalysts. Hence, we maintain our BUY rating.
Valuation methodology and investment risks: Our price target is derived using DCF, with a WACC of 10.0% and a 2% terminal growth rate. Our target price is subject to growth assumptions in treatment volumes (including tap water supply, wastewater treatment and waste-to-energy), tariffs, capacity and capex. Changes in the macro landscape and government regulations over the water industry may result in key changes in our forecasts, and hence our target price.
Potential investment of RMB700bn in China during 2011-15F
Net debt to equity as of June 2010 was 39%
Valuation is undemanding in our view
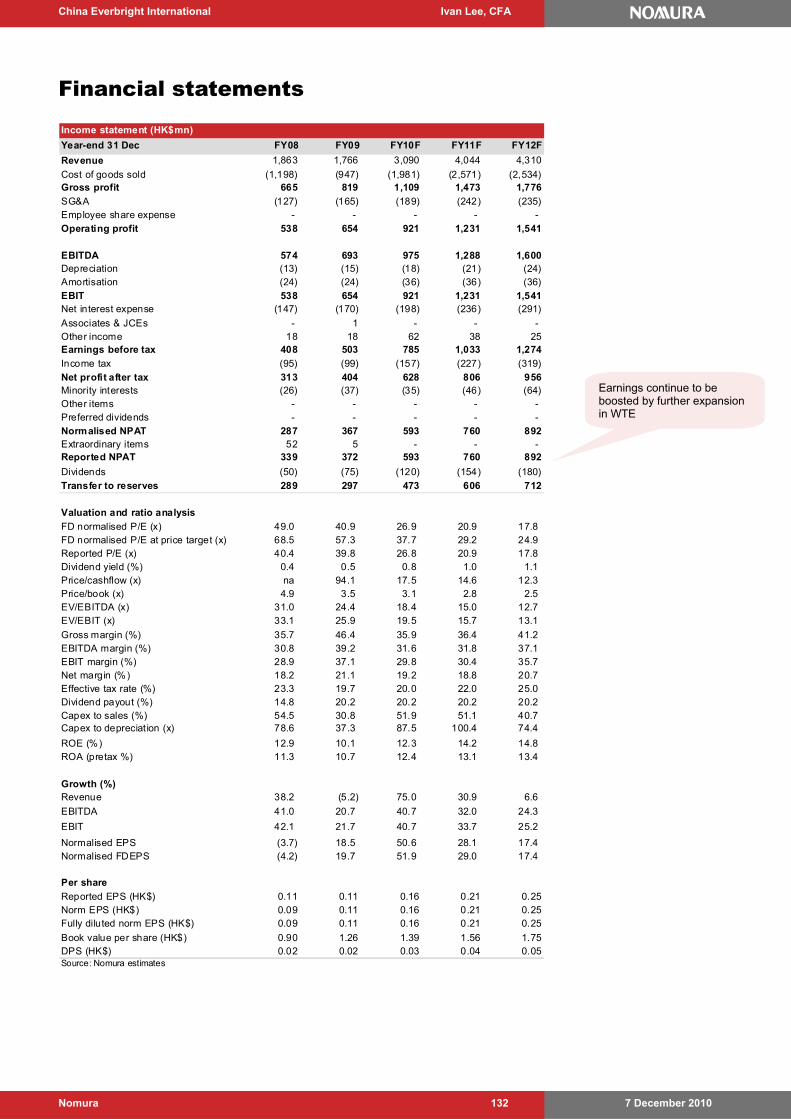
China Everbright International Ivan Lee, CFA
7 December 2010 Nomura 132
Financial statements
Earnings continue to be boosted by further expansion in WTE
Income statement (HK$mn)
Year-end 31 Dec FY08 FY09 FY10F FY11F FY12F
Revenue 1,863 1,766 3,090 4,044 4,310
Cost of goods sold (1,198) (947) (1,981) (2,571) (2,534)Gross profit 665 819 1,109 1,473 1,776
SG&A (127) (165) (189) (242) (235)Employee share expense - - - - - Operating profit 538 654 921 1,231 1,541
EBITDA 574 693 975 1,288 1,600Depreciation (13) (15) (18) (21) (24)Amortisation (24) (24) (36) (36) (36)EBIT 538 654 921 1,231 1,541Net interest expense (147) (170) (198) (236) (291)
Associates & JCEs - 1 - - - Other income 18 18 62 38 25Earnings before tax 408 503 785 1,033 1,274
Income tax (95) (99) (157) (227) (319)
Net profit after tax 313 404 628 806 956Minority interests (26) (37) (35) (46) (64)Other items - - - - - Preferred dividends - - - - - Normalised NPAT 287 367 593 760 892Extraordinary items 52 5 - - - Reported NPAT 339 372 593 760 892
Dividends (50) (75) (120) (154) (180)
Transfer to reserves 289 297 473 606 712
Valuation and ratio analysis
FD normalised P/E (x) 49.0 40.9 26.9 20.9 17.8 FD normalised P/E at price target (x) 68.5 57.3 37.7 29.2 24.9 Reported P/E (x) 40.4 39.8 26.8 20.9 17.8 Dividend yield (%) 0.4 0.5 0.8 1.0 1.1 Price/cashflow (x) na 94.1 17.5 14.6 12.3 Price/book (x) 4.9 3.5 3.1 2.8 2.5 EV/EBITDA (x) 31.0 24.4 18.4 15.0 12.7 EV/EBIT (x) 33.1 25.9 19.5 15.7 13.1
Gross margin (%) 35.7 46.4 35.9 36.4 41.2 EBITDA margin (%) 30.8 39.2 31.6 31.8 37.1 EBIT margin (%) 28.9 37.1 29.8 30.4 35.7 Net margin (%) 18.2 21.1 19.2 18.8 20.7 Effective tax rate (%) 23.3 19.7 20.0 22.0 25.0 Dividend payout (%) 14.8 20.2 20.2 20.2 20.2 Capex to sales (%) 54.5 30.8 51.9 51.1 40.7 Capex to depreciation (x) 78.6 37.3 87.5 100.4 74.4
ROE (%) 12.9 10.1 12.3 14.2 14.8 ROA (pretax %) 11.3 10.7 12.4 13.1 13.4
Growth (%)Revenue 38.2 (5.2) 75.0 30.9 6.6
EBITDA 41.0 20.7 40.7 32.0 24.3
EBIT 42.1 21.7 40.7 33.7 25.2
Normalised EPS (3.7) 18.5 50.6 28.1 17.4 Normalised FDEPS (4.2) 19.7 51.9 29.0 17.4
Per share
Reported EPS (HK$) 0.11 0.11 0.16 0.21 0.25Norm EPS (HK$) 0.09 0.11 0.16 0.21 0.25Fully diluted norm EPS (HK$) 0.09 0.11 0.16 0.21 0.25
Book value per share (HK$) 0.90 1.26 1.39 1.56 1.75DPS (HK$) 0.02 0.02 0.03 0.04 0.05Source: Nomura estimates
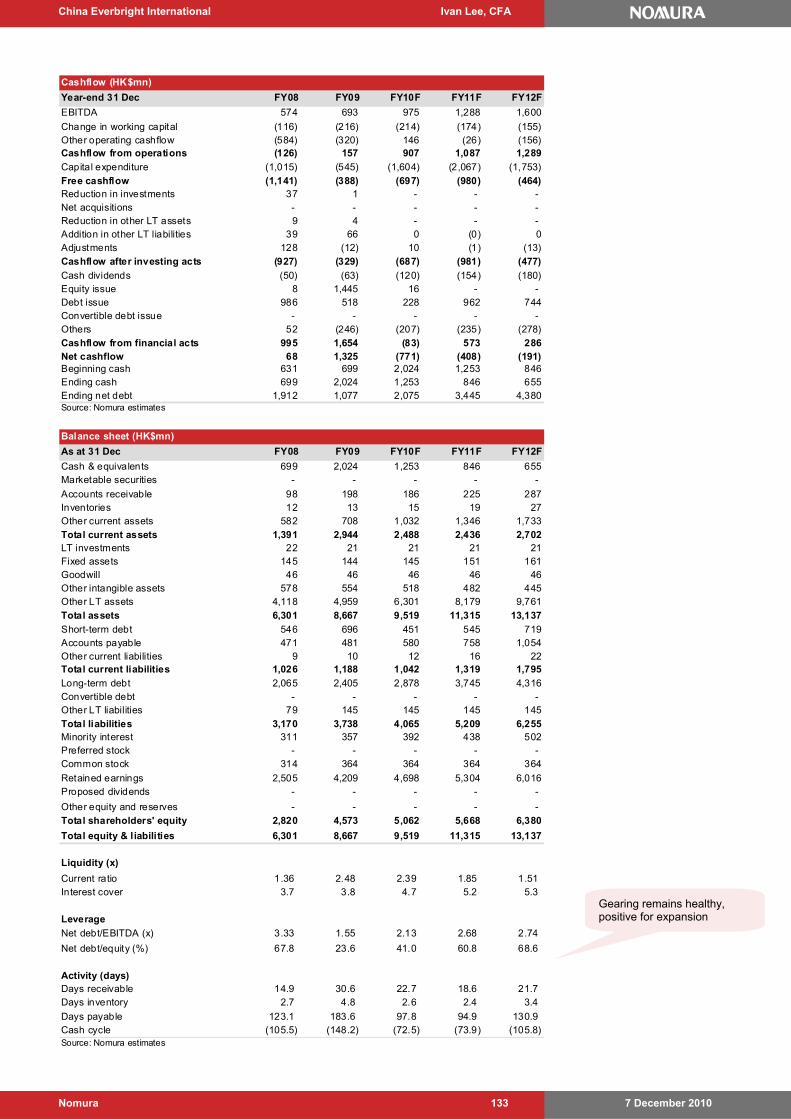
China Everbright International Ivan Lee, CFA
7 December 2010 Nomura 133
Gearing remains healthy, positive for expansion
Cashflow (HK$mn)
Year-end 31 Dec FY08 FY09 FY10F FY11F FY12F
EBITDA 574 693 975 1,288 1,600
Change in working capital (116) (216) (214) (174) (155)Other operating cashflow (584) (320) 146 (26) (156)Cashflow from operations (126) 157 907 1,087 1,289
Capital expenditure (1,015) (545) (1,604) (2,067) (1,753)
Free cashflow (1,141) (388) (697) (980) (464)Reduction in investments 37 1 - - - Net acquisitions - - - - - Reduction in other LT assets 9 4 - - - Addition in other LT liabilities 39 66 0 (0) 0Adjustments 128 (12) 10 (1) (13)Cashflow after investing acts (927) (329) (687) (981) (477)
Cash dividends (50) (63) (120) (154) (180)Equity issue 8 1,445 16 - - Debt issue 986 518 228 962 744Convertible debt issue - - - - - Others 52 (246) (207) (235) (278)Cashflow from financial acts 995 1,654 (83) 573 286Net cashflow 68 1,325 (771) (408) (191)Beginning cash 631 699 2,024 1,253 846Ending cash 699 2,024 1,253 846 655Ending net debt 1,912 1,077 2,075 3,445 4,380Source: Nomura estimates
Balance sheet (HK$mn)
As at 31 Dec FY08 FY09 FY10F FY11F FY12F
Cash & equivalents 699 2,024 1,253 846 655Marketable securities - - - - -
Accounts receivable 98 198 186 225 287Inventories 12 13 15 19 27Other current assets 582 708 1,032 1,346 1,733Total current assets 1,391 2,944 2,488 2,436 2,702LT investments 22 21 21 21 21Fixed assets 145 144 145 151 161Goodwill 46 46 46 46 46Other intangible assets 578 554 518 482 445Other LT assets 4,118 4,959 6,301 8,179 9,761
Total assets 6,301 8,667 9,519 11,315 13,137
Short-term debt 546 696 451 545 719Accounts payable 471 481 580 758 1,054Other current liabilities 9 10 12 16 22Total current liabilities 1,026 1,188 1,042 1,319 1,795
Long-term debt 2,065 2,405 2,878 3,745 4,316Convertible debt - - - - - Other LT liabilities 79 145 145 145 145
Total liabilities 3,170 3,738 4,065 5,209 6,255Minority interest 311 357 392 438 502Preferred stock - - - - - Common stock 314 364 364 364 364
Retained earnings 2,505 4,209 4,698 5,304 6,016Proposed dividends - - - - -
Other equity and reserves - - - - - Total shareholders' equity 2,820 4,573 5,062 5,668 6,380
Total equity & liabilities 6,301 8,667 9,519 11,315 13,137
Liquidity (x)
Current ratio 1.36 2.48 2.39 1.85 1.51 Interest cover 3.7 3.8 4.7 5.2 5.3
Leverage
Net debt/EBITDA (x) 3.33 1.55 2.13 2.68 2.74
Net debt/equity (%) 67.8 23.6 41.0 60.8 68.6
Activity (days)Days receivable 14.9 30.6 22.7 18.6 21.7 Days inventory 2.7 4.8 2.6 2.4 3.4
Days payable 123.1 183.6 97.8 94.9 130.9 Cash cycle (105.5) (148.2) (72.5) (73.9) (105.8) Source: Nomura estimates
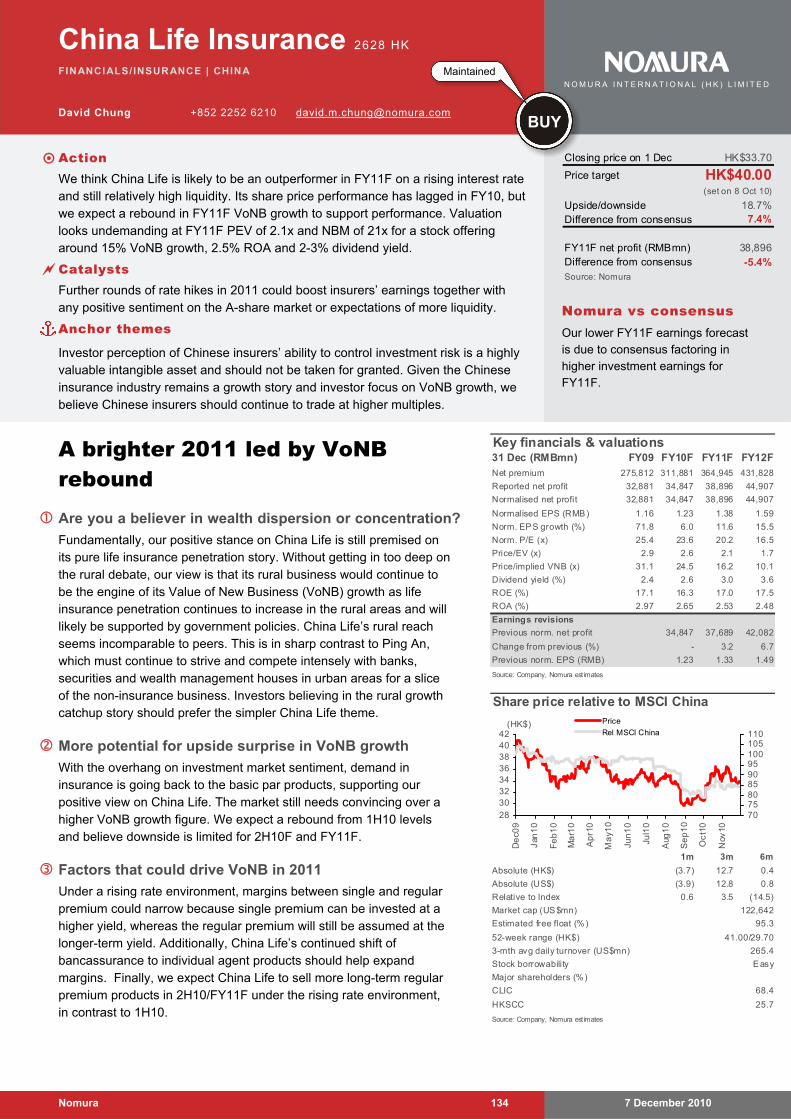
7 December 2010 Nomura 134
China Life Insurance 2628 HK
FINANCIALS/INSURANCE | CHINA
David Chung +852 2252 6210 [email protected]
A brighter 2011 led by VoNB rebound
Are you a believer in wealth dispersion or concentration?
Fundamentally, our positive stance on China Life is still premised on its pure life insurance penetration story. Without getting in too deep on the rural debate, our view is that its rural business would continue to be the engine of its Value of New Business (VoNB) growth as life insurance penetration continues to increase in the rural areas and will likely be supported by government policies. China Life’s rural reach seems incomparable to peers. This is in sharp contrast to Ping An, which must continue to strive and compete intensely with banks, securities and wealth management houses in urban areas for a slice of the non-insurance business. Investors believing in the rural growth catchup story should prefer the simpler China Life theme.
More potential for upside surprise in VoNB growth
With the overhang on investment market sentiment, demand in insurance is going back to the basic par products, supporting our positive view on China Life. The market still needs convincing over a higher VoNB growth figure. We expect a rebound from 1H10 levels and believe downside is limited for 2H10F and FY11F.
Factors that could drive VoNB in 2011
Under a rising rate environment, margins between single and regular premium could narrow because single premium can be invested at a higher yield, whereas the regular premium will still be assumed at the longer-term yield. Additionally, China Life’s continued shift of bancassurance to individual agent products should help expand margins. Finally, we expect China Life to sell more long-term regular premium products in 2H10/FY11F under the rising rate environment, in contrast to 1H10.
Key financials & valuations31 Dec (RMBmn) FY09 FY10F FY11F FY12F
Net premium 275,812 311,881 364,945 431,828
Reported net profit 32,881 34,847 38,896 44,907
Normalised net profit 32,881 34,847 38,896 44,907
Normalised EPS (RMB) 1.16 1.23 1.38 1.59
Norm. EPS growth (%) 71.8 6.0 11.6 15.5
Norm. P/E (x) 25.4 23.6 20.2 16.5
Price/EV (x) 2.9 2.6 2.1 1.7
Price/implied VNB (x) 31.1 24.5 16.2 10.1
Dividend yield (%) 2.4 2.6 3.0 3.6
ROE (%) 17.1 16.3 17.0 17.5
ROA (%) 2.97 2.65 2.53 2.48
Earnings revisions
Previous norm. net profit 34,847 37,689 42,082
Change from previous (%) - 3.2 6.7
Previous norm. EPS (RMB) 1.23 1.33 1.49
Source: Company, Nomura est imates
Share price relative to MSCI China
1m 3m 6m
(3.7) 12.7 0.4
(3.9) 12.8 0.8
0.6 3.5 (14.5)
Easy
Source: Company, Nomura est imates
122,642
95.3
41.00/29.70
265.4
Absolute (HK$)
Absolute (US$)
Relative to Index
Estimated free float (%)
Market cap (US$mn)
25.7
Major shareholders (%)
CLIC 68.4
52-week range (HK$)
3-mth avg daily turnover (US$mn)
HKSCC
Stock borrowability
2830323436384042
De
c09
Jan
10
Fe
b1
0
Ma
r10
Ap
r10
Ma
y10
Jun
10
Jul1
0
Aug
10
Se
p1
0
Oc
t10
Nov
10
707580859095100105110
Price
Rel MSCI China(HK$)
Closing price on 1 Dec HK$33.70
Price target HK$40.00(set on 8 Oct 10)
Upside/downside 18.7%Difference from consensus 7.4%
FY11F net profit (RMBmn) 38,896Difference from consensus -5.4%Source: Nomura
Nomura vs consensus Our lower FY11F earnings forecast is due to consensus factoring in higher investment earnings for FY11F.
Maintained
BUY
N O M U R A I N T E R N A T I O N A L ( H K ) L I M I T E D
Action We think China Life is likely to be an outperformer in FY11F on a rising interest rate
and still relatively high liquidity. Its share price performance has lagged in FY10, but we expect a rebound in FY11F VoNB growth to support performance. Valuation looks undemanding at FY11F PEV of 2.1x and NBM of 21x for a stock offering around 15% VoNB growth, 2.5% ROA and 2-3% dividend yield.
Catalysts Further rounds of rate hikes in 2011 could boost insurers’ earnings together with
any positive sentiment on the A-share market or expectations of more liquidity.
Anchor themes
Investor perception of Chinese insurers’ ability to control investment risk is a highly valuable intangible asset and should not be taken for granted. Given the Chinese insurance industry remains a growth story and investor focus on VoNB growth, we believe Chinese insurers should continue to trade at higher multiples.
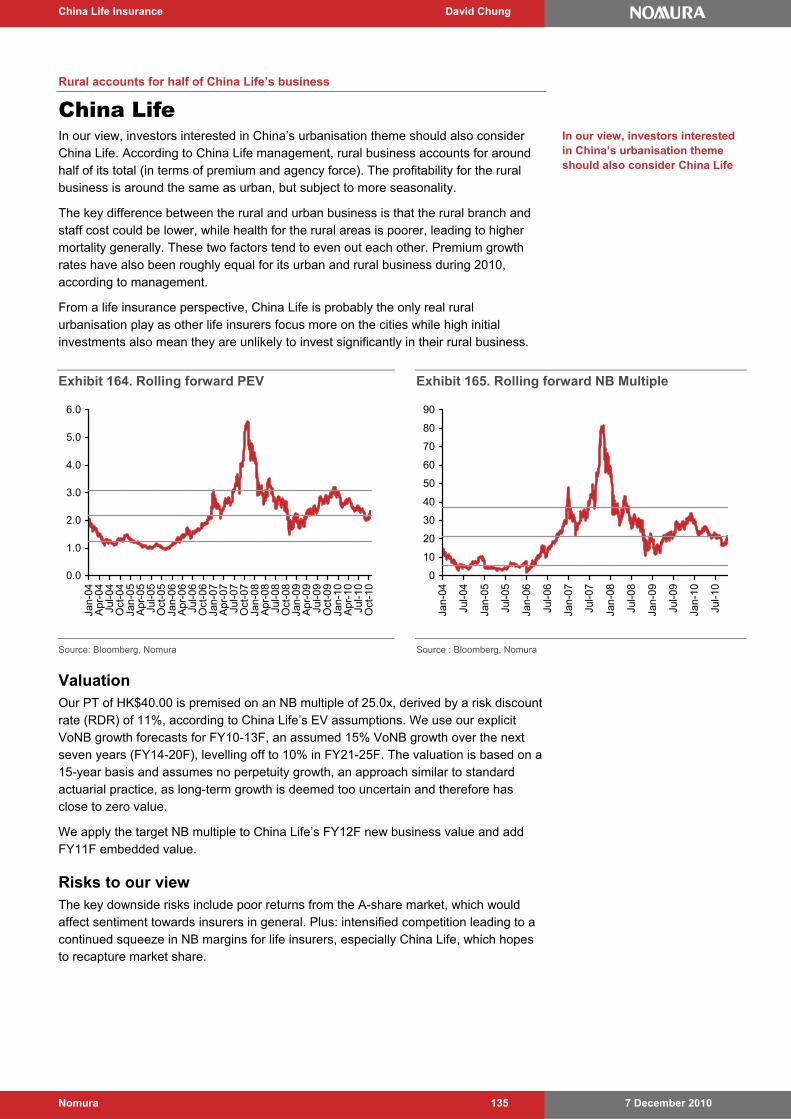
China Life Insurance David Chung
7 December 2010 Nomura 135
Rural accounts for half of China Life’s business
China Life In our view, investors interested in China’s urbanisation theme should also consider China Life. According to China Life management, rural business accounts for around half of its total (in terms of premium and agency force). The profitability for the rural business is around the same as urban, but subject to more seasonality.
The key difference between the rural and urban business is that the rural branch and staff cost could be lower, while health for the rural areas is poorer, leading to higher mortality generally. These two factors tend to even out each other. Premium growth rates have also been roughly equal for its urban and rural business during 2010, according to management.
From a life insurance perspective, China Life is probably the only real rural urbanisation play as other life insurers focus more on the cities while high initial investments also mean they are unlikely to invest significantly in their rural business.
Exhibit 164. Rolling forward PEV
0.0
1.0
2.0
3.0
4.0
5.0
6.0
Jan-
04A
pr-0
4Ju
l-04
Oct
-04
Jan-
05A
pr-0
5Ju
l-05
Oct
-05
Jan-
06A
pr-0
6Ju
l-06
Oct
-06
Jan-
07A
pr-0
7Ju
l-07
Oct
-07
Jan-
08A
pr-0
8Ju
l-08
Oct
-08
Jan-
09A
pr-0
9Ju
l-09
Oct
-09
Jan-
10A
pr-1
0Ju
l-10
Oct
-10
Exhibit 165. Rolling forward NB Multiple
0
10
20
30
40
50
60
70
80
90
Jan-
04
Jul-0
4
Jan-
05
Jul-0
5
Jan-
06
Jul-0
6
Jan-
07
Jul-0
7
Jan-
08
Jul-0
8
Jan-
09
Jul-0
9
Jan-
10
Jul-1
0
Source: Bloomberg, Nomura Source : Bloomberg, Nomura
Valuation Our PT of HK$40.00 is premised on an NB multiple of 25.0x, derived by a risk discount rate (RDR) of 11%, according to China Life’s EV assumptions. We use our explicit VoNB growth forecasts for FY10-13F, an assumed 15% VoNB growth over the next seven years (FY14-20F), levelling off to 10% in FY21-25F. The valuation is based on a 15-year basis and assumes no perpetuity growth, an approach similar to standard actuarial practice, as long-term growth is deemed too uncertain and therefore has close to zero value.
We apply the target NB multiple to China Life’s FY12F new business value and add FY11F embedded value.
Risks to our view The key downside risks include poor returns from the A-share market, which would affect sentiment towards insurers in general. Plus: intensified competition leading to a continued squeeze in NB margins for life insurers, especially China Life, which hopes to recapture market share.
In our view, investors interested in China’s urbanisation theme should also consider China Life
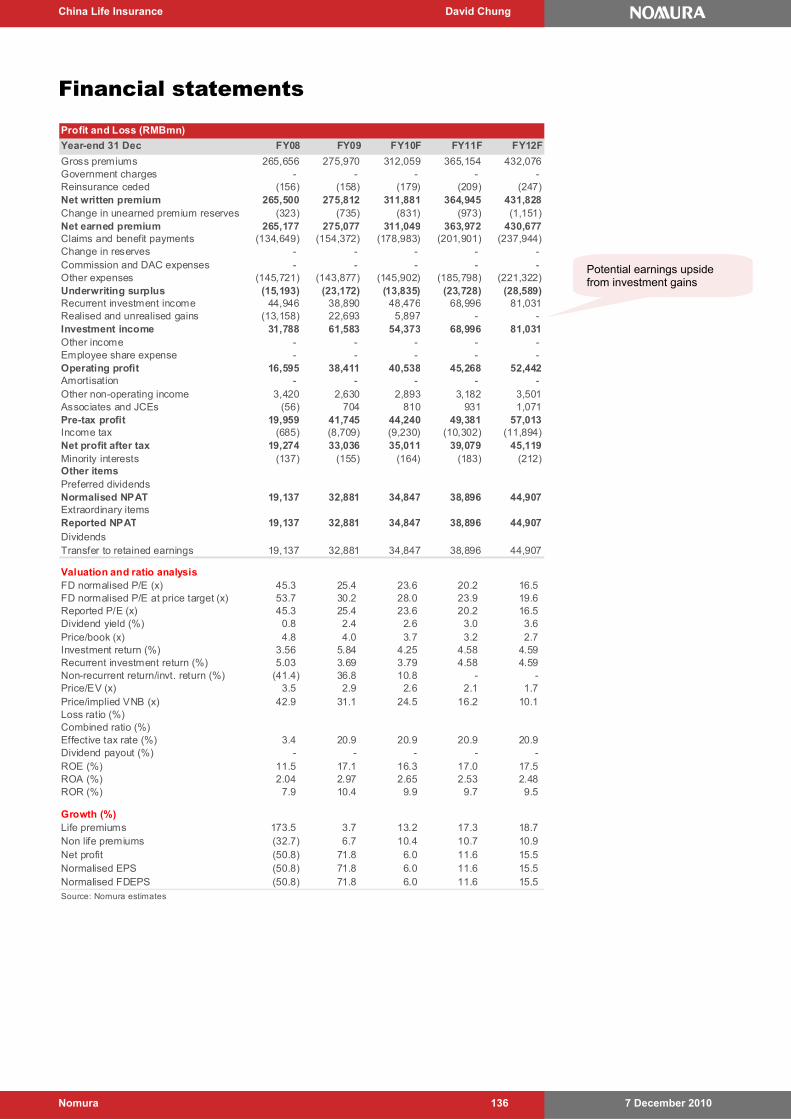
China Life Insurance David Chung
7 December 2010 Nomura 136
Financial statements
Profit and Loss (RMBmn)
Year-end 31 Dec FY08 FY09 FY10F FY11F FY12F
Gross premiums 265,656 275,970 312,059 365,154 432,076Government charges - - - - - Reinsurance ceded (156) (158) (179) (209) (247)Net written premium 265,500 275,812 311,881 364,945 431,828Change in unearned premium reserves (323) (735) (831) (973) (1,151)Net earned premium 265,177 275,077 311,049 363,972 430,677Claims and benefit payments (134,649) (154,372) (178,983) (201,901) (237,944)Change in reserves - - - - - Commission and DAC expenses - - - - - Other expenses (145,721) (143,877) (145,902) (185,798) (221,322)Underwriting surplus (15,193) (23,172) (13,835) (23,728) (28,589)Recurrent investment income 44,946 38,890 48,476 68,996 81,031Realised and unrealised gains (13,158) 22,693 5,897 - - Investment income 31,788 61,583 54,373 68,996 81,031Other income - - - - - Employee share expense - - - - - Operating profit 16,595 38,411 40,538 45,268 52,442Amortisation - - - - - Other non-operating income 3,420 2,630 2,893 3,182 3,501Associates and JCEs (56) 704 810 931 1,071Pre-tax profit 19,959 41,745 44,240 49,381 57,013Income tax (685) (8,709) (9,230) (10,302) (11,894)Net profit after tax 19,274 33,036 35,011 39,079 45,119Minority interests (137) (155) (164) (183) (212)Other itemsPreferred dividendsNormalised NPAT 19,137 32,881 34,847 38,896 44,907Extraordinary itemsReported NPAT 19,137 32,881 34,847 38,896 44,907DividendsTransfer to retained earnings 19,137 32,881 34,847 38,896 44,907
Valuation and ratio analysisFD normalised P/E (x) 45.3 25.4 23.6 20.2 16.5 FD normalised P/E at price target (x) 53.7 30.2 28.0 23.9 19.6 Reported P/E (x) 45.3 25.4 23.6 20.2 16.5 Dividend yield (%) 0.8 2.4 2.6 3.0 3.6 Price/book (x) 4.8 4.0 3.7 3.2 2.7 Investment return (%) 3.56 5.84 4.25 4.58 4.59 Recurrent investment return (%) 5.03 3.69 3.79 4.58 4.59 Non-recurrent return/invt. return (%) (41.4) 36.8 10.8 - - Price/EV (x) 3.5 2.9 2.6 2.1 1.7 Price/implied VNB (x) 42.9 31.1 24.5 16.2 10.1 Loss ratio (%)Combined ratio (%)Effective tax rate (%) 3.4 20.9 20.9 20.9 20.9 Dividend payout (%) - - - - - ROE (%) 11.5 17.1 16.3 17.0 17.5 ROA (%) 2.04 2.97 2.65 2.53 2.48 ROR (%) 7.9 10.4 9.9 9.7 9.5
Growth (%)Life premiums 173.5 3.7 13.2 17.3 18.7 Non life premiums (32.7) 6.7 10.4 10.7 10.9 Net profit (50.8) 71.8 6.0 11.6 15.5 Normalised EPS (50.8) 71.8 6.0 11.6 15.5 Normalised FDEPS (50.8) 71.8 6.0 11.6 15.5 Source: Nomura estimates
Potential earnings upside from investment gains
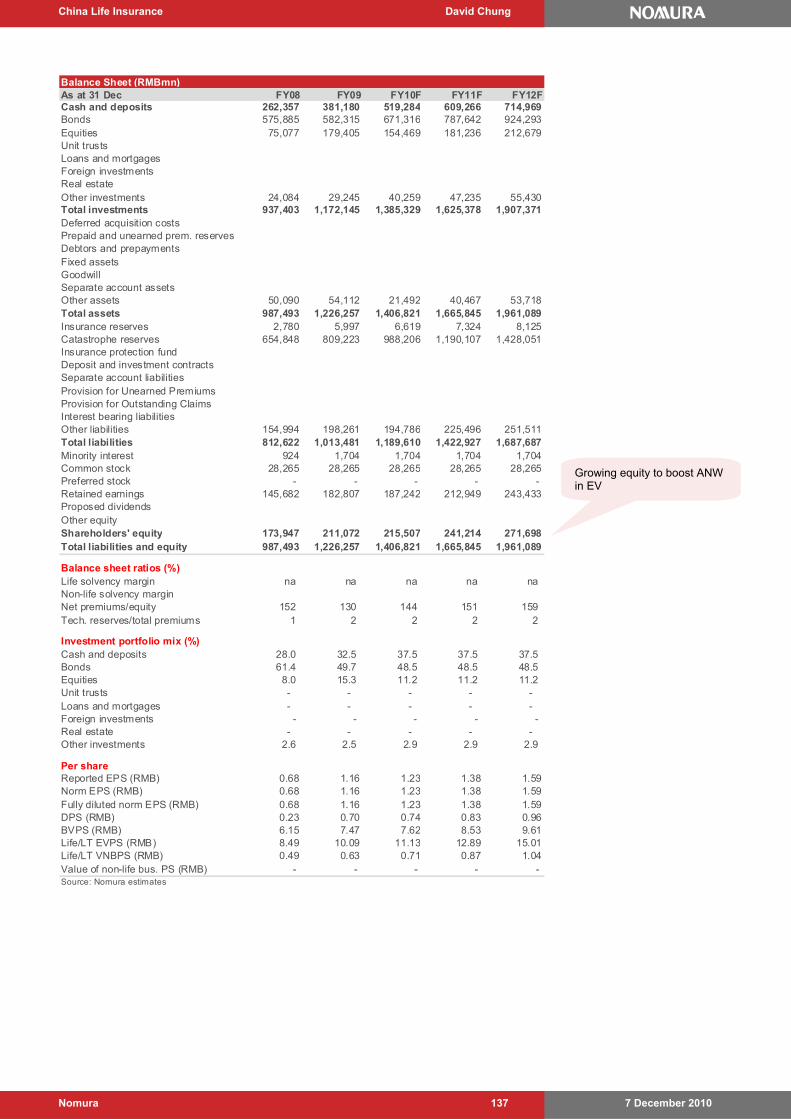
China Life Insurance David Chung
7 December 2010 Nomura 137
Balance Sheet (RMBmn)As at 31 Dec FY08 FY09 FY10F FY11F FY12FCash and deposits 262,357 381,180 519,284 609,266 714,969Bonds 575,885 582,315 671,316 787,642 924,293Equities 75,077 179,405 154,469 181,236 212,679Unit trustsLoans and mortgagesForeign investmentsReal estateOther investments 24,084 29,245 40,259 47,235 55,430Total investments 937,403 1,172,145 1,385,329 1,625,378 1,907,371Deferred acquisition costsPrepaid and unearned prem. reservesDebtors and prepaymentsFixed assetsGoodwillSeparate account assetsOther assets 50,090 54,112 21,492 40,467 53,718Total assets 987,493 1,226,257 1,406,821 1,665,845 1,961,089Insurance reserves 2,780 5,997 6,619 7,324 8,125Catastrophe reserves 654,848 809,223 988,206 1,190,107 1,428,051Insurance protection fundDeposit and investment contractsSeparate account liabilitiesProvision for Unearned PremiumsProvision for Outstanding ClaimsInterest bearing liabilitiesOther liabilities 154,994 198,261 194,786 225,496 251,511Total liabilities 812,622 1,013,481 1,189,610 1,422,927 1,687,687Minority interest 924 1,704 1,704 1,704 1,704Common stock 28,265 28,265 28,265 28,265 28,265Preferred stock - - - - - Retained earnings 145,682 182,807 187,242 212,949 243,433Proposed dividendsOther equityShareholders' equity 173,947 211,072 215,507 241,214 271,698Total liabilities and equity 987,493 1,226,257 1,406,821 1,665,845 1,961,089
Balance sheet ratios (%)Life solvency margin na na na na naNon-life solvency marginNet premiums/equity 152 130 144 151 159 Tech. reserves/total premiums 1 2 2 2 2
Investment portfolio mix (%)Cash and deposits 28.0 32.5 37.5 37.5 37.5 Bonds 61.4 49.7 48.5 48.5 48.5 Equities 8.0 15.3 11.2 11.2 11.2 Unit trusts - - - - - Loans and mortgages - - - - - Foreign investments - - - - - Real estate - - - - - Other investments 2.6 2.5 2.9 2.9 2.9
Per shareReported EPS (RMB) 0.68 1.16 1.23 1.38 1.59Norm EPS (RMB) 0.68 1.16 1.23 1.38 1.59Fully diluted norm EPS (RMB) 0.68 1.16 1.23 1.38 1.59DPS (RMB) 0.23 0.70 0.74 0.83 0.96BVPS (RMB) 6.15 7.47 7.62 8.53 9.61Life/LT EVPS (RMB) 8.49 10.09 11.13 12.89 15.01Life/LT VNBPS (RMB) 0.49 0.63 0.71 0.87 1.04Value of non-life bus. PS (RMB) - - - - - Source: Nomura estimates
Growing equity to boost ANW in EV
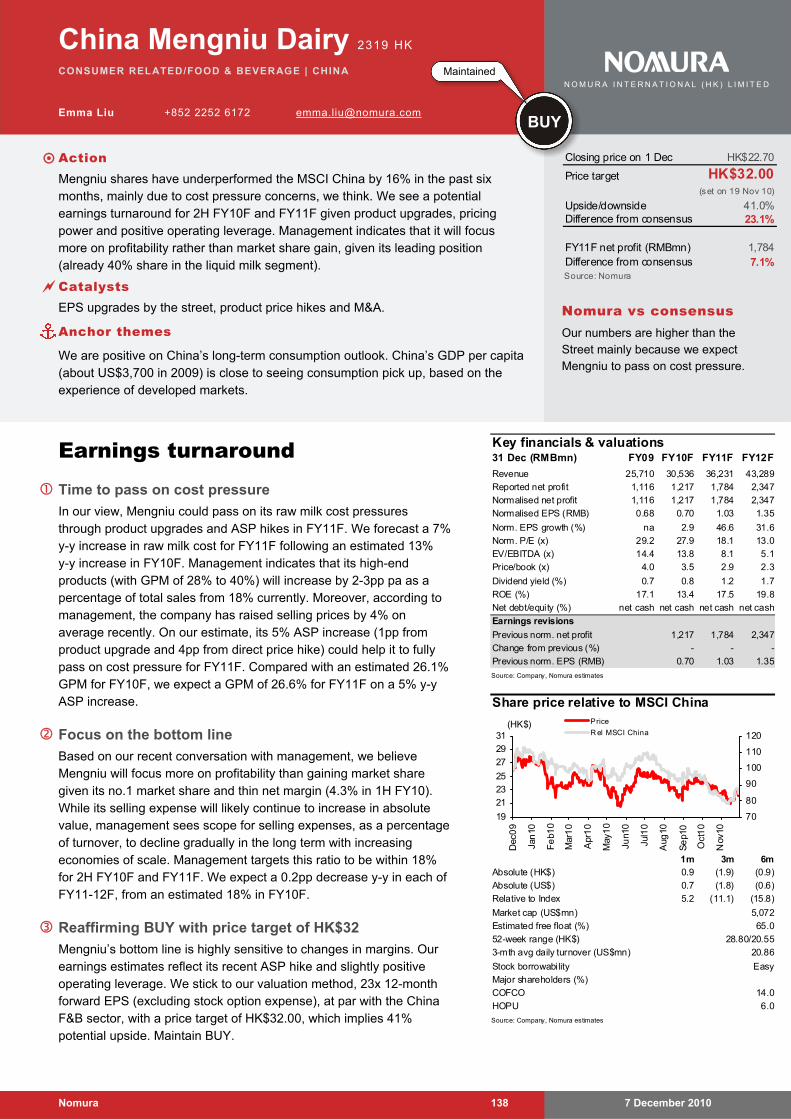
7 December 2010 Nomura 138
China Mengniu Dairy 2319 HK
CONSUMER RELATED/FOOD & BEVERAGE | CHINA
Emma Liu +852 2252 6172 [email protected]
Earnings turnaround Time to pass on cost pressure
In our view, Mengniu could pass on its raw milk cost pressures through product upgrades and ASP hikes in FY11F. We forecast a 7% y-y increase in raw milk cost for FY11F following an estimated 13% y-y increase in FY10F. Management indicates that its high-end products (with GPM of 28% to 40%) will increase by 2-3pp pa as a percentage of total sales from 18% currently. Moreover, according to management, the company has raised selling prices by 4% on average recently. On our estimate, its 5% ASP increase (1pp from product upgrade and 4pp from direct price hike) could help it to fully pass on cost pressure for FY11F. Compared with an estimated 26.1% GPM for FY10F, we expect a GPM of 26.6% for FY11F on a 5% y-y ASP increase.
Focus on the bottom line
Based on our recent conversation with management, we believe Mengniu will focus more on profitability than gaining market share given its no.1 market share and thin net margin (4.3% in 1H FY10). While its selling expense will likely continue to increase in absolute value, management sees scope for selling expenses, as a percentage of turnover, to decline gradually in the long term with increasing economies of scale. Management targets this ratio to be within 18% for 2H FY10F and FY11F. We expect a 0.2pp decrease y-y in each of FY11-12F, from an estimated 18% in FY10F.
Reaffirming BUY with price target of HK$32
Mengniu’s bottom line is highly sensitive to changes in margins. Our earnings estimates reflect its recent ASP hike and slightly positive operating leverage. We stick to our valuation method, 23x 12-month forward EPS (excluding stock option expense), at par with the China F&B sector, with a price target of HK$32.00, which implies 41% potential upside. Maintain BUY.
Key financials & valuations31 Dec (RMBmn) FY09 FY10F FY11F FY12F
Revenue 25,710 30,536 36,231 43,289
Reported net profit 1,116 1,217 1,784 2,347
Normalised net profit 1,116 1,217 1,784 2,347
Normalised EPS (RMB) 0.68 0.70 1.03 1.35
Norm. EPS growth (%) na 2.9 46.6 31.6
Norm. P/E (x) 29.2 27.9 18.1 13.0
EV/EBITDA (x) 14.4 13.8 8.1 5.1
Price/book (x) 4.0 3.5 2.9 2.3
Dividend yield (%) 0.7 0.8 1.2 1.7
ROE (%) 17.1 13.4 17.5 19.8
Net debt/equity (%) net cash net cash net cash net cash
Earnings revisions
Previous norm. net profit 1,217 1,784 2,347
Change from previous (%) - - -
Previous norm. EPS (RMB) 0.70 1.03 1.35
Source: Company, Nomura estimates
Share price relative to MSCI China
1m 3m 6m 0.9 (1.9) (0.9)
0.7 (1.8) (0.6)
5.2 (11.1) (15.8)
Easy
Source: Company, Nomura estimates
5,072
65.0
28.80/20.55
20.86
Absolute (HK$)
Absolute (US$)
Relative to Index
Estimated free float (%)
Market cap (US$mn)
6.0
Major shareholders (%)
COFCO 14.0
52-week range (HK$)
3-mth avg daily turnover (US$mn)
HOPU
Stock borrowability
19
21
23
25
27
29
31
Dec
09
Jan
10
Fe
b10
Mar
10
Apr
10
May
10
Jun1
0
Jul1
0
Aug
10
Se
p10
Oct
10
Nov
10
70
80
90
100
110
120
Price
R el MSCI China(HK$)
Closing price on 1 Dec HK$22.70
Price target HK$32.00(set on 19 Nov 10)
Upside/downside 41.0%Difference from consensus 23.1%
FY11F net profit (RMBmn) 1,784Difference from consensus 7.1%Source: Nomura
Nomura vs consensus Our numbers are higher than the Street mainly because we expect Mengniu to pass on cost pressure.
Maintained
BUY
N O M U R A I N T E R N A T I O N A L ( H K ) L I M I T E D
Action Mengniu shares have underperformed the MSCI China by 16% in the past six
months, mainly due to cost pressure concerns, we think. We see a potential earnings turnaround for 2H FY10F and FY11F given product upgrades, pricing power and positive operating leverage. Management indicates that it will focus more on profitability rather than market share gain, given its leading position (already 40% share in the liquid milk segment).
Catalysts EPS upgrades by the street, product price hikes and M&A.
Anchor themes
We are positive on China’s long-term consumption outlook. China’s GDP per capita (about US$3,700 in 2009) is close to seeing consumption pick up, based on the experience of developed markets.
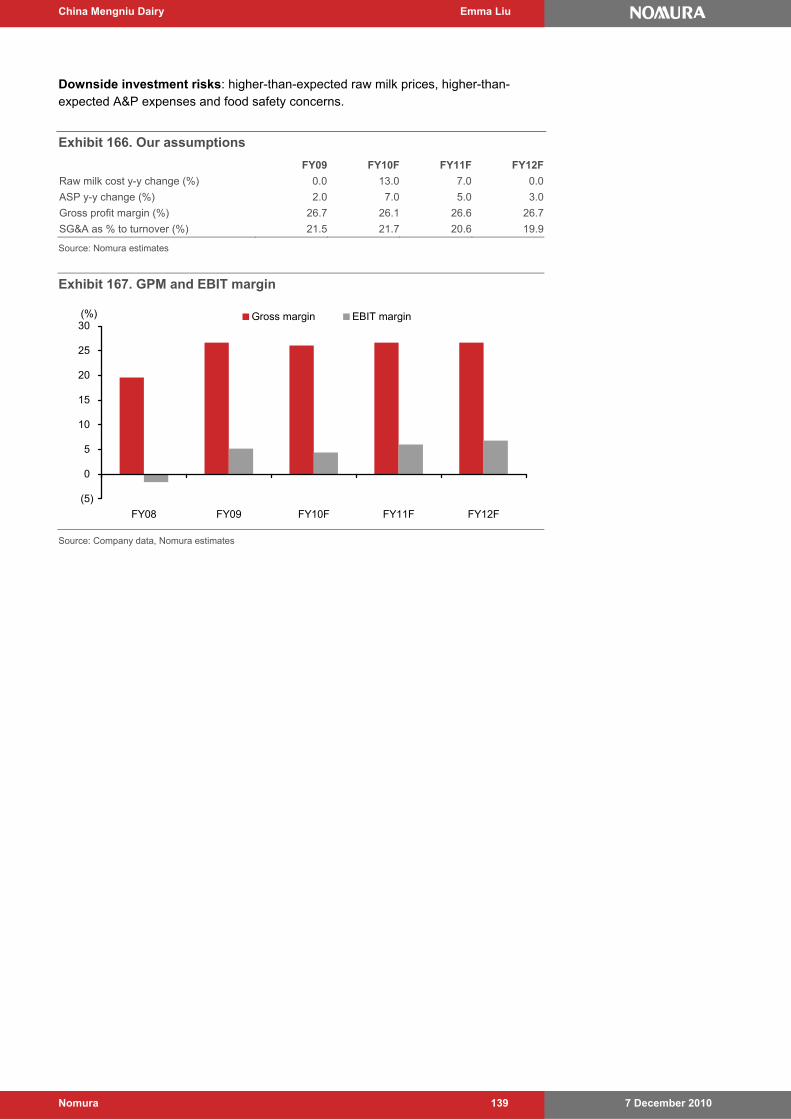
China Mengniu Dairy Emma Liu
7 December 2010 Nomura 139
Downside investment risks: higher-than-expected raw milk prices, higher-than-expected A&P expenses and food safety concerns.
Exhibit 166. Our assumptions
FY09 FY10F FY11F FY12F
Raw milk cost y-y change (%) 0.0 13.0 7.0 0.0
ASP y-y change (%) 2.0 7.0 5.0 3.0
Gross profit margin (%) 26.7 26.1 26.6 26.7
SG&A as % to turnover (%) 21.5 21.7 20.6 19.9
Source: Nomura estimates
Exhibit 167. GPM and EBIT margin
(5)
0
5
10
15
20
25
30
FY08 FY09 FY10F FY11F FY12F
(%) Gross margin EBIT margin
Source: Company data, Nomura estimates
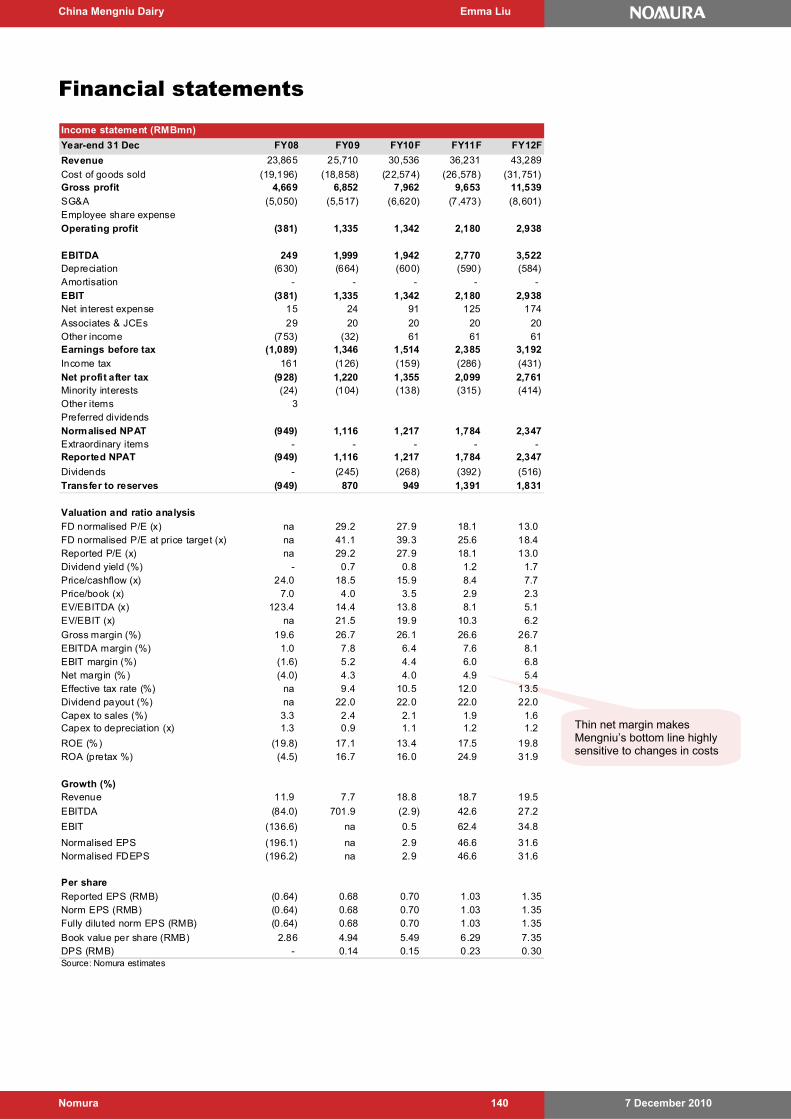
China Mengniu Dairy Emma Liu
7 December 2010 Nomura 140
Thin net margin makes Mengniu’s bottom line highly sensitive to changes in costs
Financial statements
Income statement (RMBmn)
Year-end 31 Dec FY08 FY09 FY10F FY11F FY12F
Revenue 23,865 25,710 30,536 36,231 43,289
Cost of goods sold (19,196) (18,858) (22,574) (26,578) (31,751)Gross profit 4,669 6,852 7,962 9,653 11,539
SG&A (5,050) (5,517) (6,620) (7,473) (8,601)Employee share expenseOperating profit (381) 1,335 1,342 2,180 2,938
EBITDA 249 1,999 1,942 2,770 3,522Depreciation (630) (664) (600) (590) (584)Amortisation - - - - - EBIT (381) 1,335 1,342 2,180 2,938Net interest expense 15 24 91 125 174
Associates & JCEs 29 20 20 20 20Other income (753) (32) 61 61 61Earnings before tax (1,089) 1,346 1,514 2,385 3,192
Income tax 161 (126) (159) (286) (431)
Net profit after tax (928) 1,220 1,355 2,099 2,761Minority interests (24) (104) (138) (315) (414)Other items 3Preferred dividendsNormalised NPAT (949) 1,116 1,217 1,784 2,347Extraordinary items - - - - - Reported NPAT (949) 1,116 1,217 1,784 2,347
Dividends - (245) (268) (392) (516)
Transfer to reserves (949) 870 949 1,391 1,831
Valuation and ratio analysis
FD normalised P/E (x) na 29.2 27.9 18.1 13.0 FD normalised P/E at price target (x) na 41.1 39.3 25.6 18.4 Reported P/E (x) na 29.2 27.9 18.1 13.0 Dividend yield (%) - 0.7 0.8 1.2 1.7 Price/cashflow (x) 24.0 18.5 15.9 8.4 7.7 Price/book (x) 7.0 4.0 3.5 2.9 2.3 EV/EBITDA (x) 123.4 14.4 13.8 8.1 5.1 EV/EBIT (x) na 21.5 19.9 10.3 6.2
Gross margin (%) 19.6 26.7 26.1 26.6 26.7 EBITDA margin (%) 1.0 7.8 6.4 7.6 8.1 EBIT margin (%) (1.6) 5.2 4.4 6.0 6.8 Net margin (%) (4.0) 4.3 4.0 4.9 5.4 Effective tax rate (%) na 9.4 10.5 12.0 13.5 Dividend payout (%) na 22.0 22.0 22.0 22.0 Capex to sales (%) 3.3 2.4 2.1 1.9 1.6 Capex to depreciation (x) 1.3 0.9 1.1 1.2 1.2
ROE (%) (19.8) 17.1 13.4 17.5 19.8 ROA (pretax %) (4.5) 16.7 16.0 24.9 31.9
Growth (%)Revenue 11.9 7.7 18.8 18.7 19.5
EBITDA (84.0) 701.9 (2.9) 42.6 27.2
EBIT (136.6) na 0.5 62.4 34.8
Normalised EPS (196.1) na 2.9 46.6 31.6 Normalised FDEPS (196.2) na 2.9 46.6 31.6
Per share
Reported EPS (RMB) (0.64) 0.68 0.70 1.03 1.35Norm EPS (RMB) (0.64) 0.68 0.70 1.03 1.35Fully diluted norm EPS (RMB) (0.64) 0.68 0.70 1.03 1.35
Book value per share (RMB) 2.86 4.94 5.49 6.29 7.35DPS (RMB) - 0.14 0.15 0.23 0.30Source: Nomura estimates
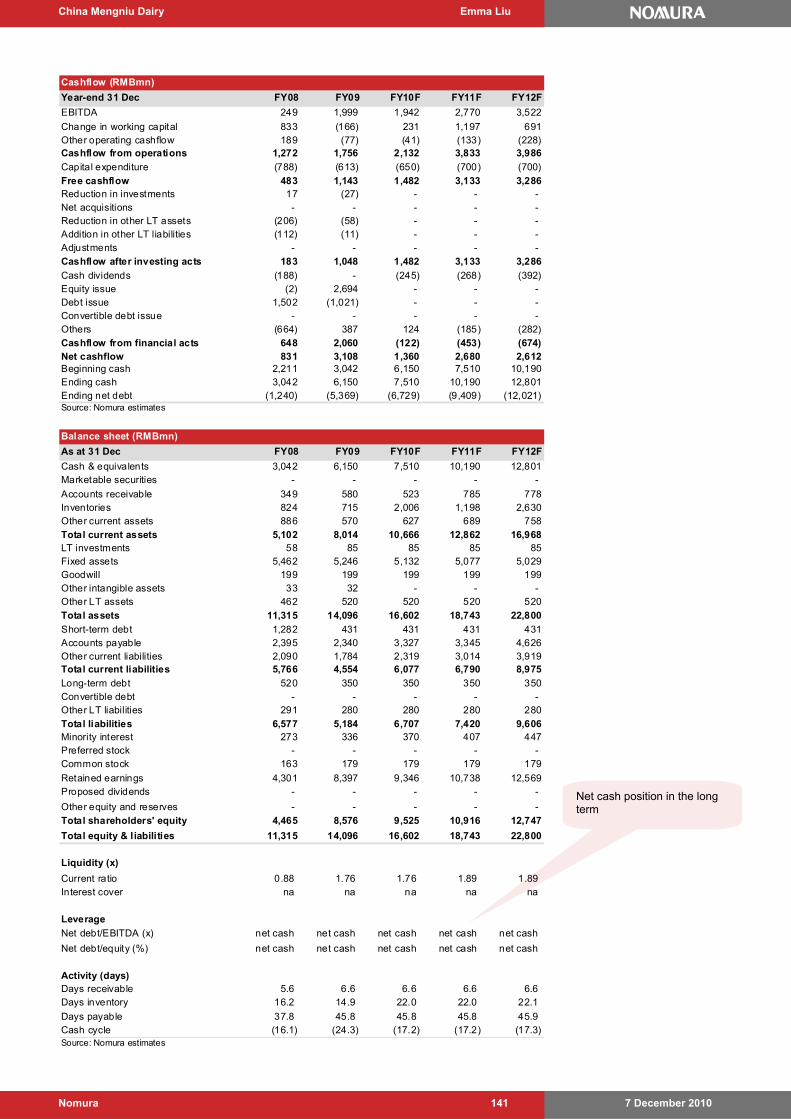
China Mengniu Dairy Emma Liu
7 December 2010 Nomura 141
Net cash position in the long term
Cashflow (RMBmn)
Year-end 31 Dec FY08 FY09 FY10F FY11F FY12F
EBITDA 249 1,999 1,942 2,770 3,522
Change in working capital 833 (166) 231 1,197 691Other operating cashflow 189 (77) (41) (133) (228)Cashflow from operations 1,272 1,756 2,132 3,833 3,986
Capital expenditure (788) (613) (650) (700) (700)
Free cashflow 483 1,143 1,482 3,133 3,286Reduction in investments 17 (27) - - - Net acquisitions - - - - - Reduction in other LT assets (206) (58) - - - Addition in other LT liabilities (112) (11) - - - Adjustments - - - - - Cashflow after investing acts 183 1,048 1,482 3,133 3,286
Cash dividends (188) - (245) (268) (392)Equity issue (2) 2,694 - - - Debt issue 1,502 (1,021) - - - Convertible debt issue - - - - - Others (664) 387 124 (185) (282)Cashflow from financial acts 648 2,060 (122) (453) (674)Net cashflow 831 3,108 1,360 2,680 2,612Beginning cash 2,211 3,042 6,150 7,510 10,190Ending cash 3,042 6,150 7,510 10,190 12,801Ending net debt (1,240) (5,369) (6,729) (9,409) (12,021)Source: Nomura estimates
Balance sheet (RMBmn)
As at 31 Dec FY08 FY09 FY10F FY11F FY12F
Cash & equivalents 3,042 6,150 7,510 10,190 12,801Marketable securities - - - - -
Accounts receivable 349 580 523 785 778Inventories 824 715 2,006 1,198 2,630Other current assets 886 570 627 689 758Total current assets 5,102 8,014 10,666 12,862 16,968LT investments 58 85 85 85 85Fixed assets 5,462 5,246 5,132 5,077 5,029Goodwill 199 199 199 199 199Other intangible assets 33 32 - - - Other LT assets 462 520 520 520 520
Total assets 11,315 14,096 16,602 18,743 22,800
Short-term debt 1,282 431 431 431 431Accounts payable 2,395 2,340 3,327 3,345 4,626Other current liabilities 2,090 1,784 2,319 3,014 3,919Total current liabilities 5,766 4,554 6,077 6,790 8,975
Long-term debt 520 350 350 350 350Convertible debt - - - - - Other LT liabilities 291 280 280 280 280
Total liabilities 6,577 5,184 6,707 7,420 9,606Minority interest 273 336 370 407 447Preferred stock - - - - - Common stock 163 179 179 179 179
Retained earnings 4,301 8,397 9,346 10,738 12,569Proposed dividends - - - - -
Other equity and reserves - - - - - Total shareholders' equity 4,465 8,576 9,525 10,916 12,747
Total equity & liabilities 11,315 14,096 16,602 18,743 22,800
Liquidity (x)
Current ratio 0.88 1.76 1.76 1.89 1.89 Interest cover na na na na na
Leverage
Net debt/EBITDA (x) net cash net cash net cash net cash net cash
Net debt/equity (%) net cash net cash net cash net cash net cash
Activity (days)Days receivable 5.6 6.6 6.6 6.6 6.6 Days inventory 16.2 14.9 22.0 22.0 22.1
Days payable 37.8 45.8 45.8 45.8 45.9 Cash cycle (16.1) (24.3) (17.2) (17.2) (17.3) Source: Nomura estimates
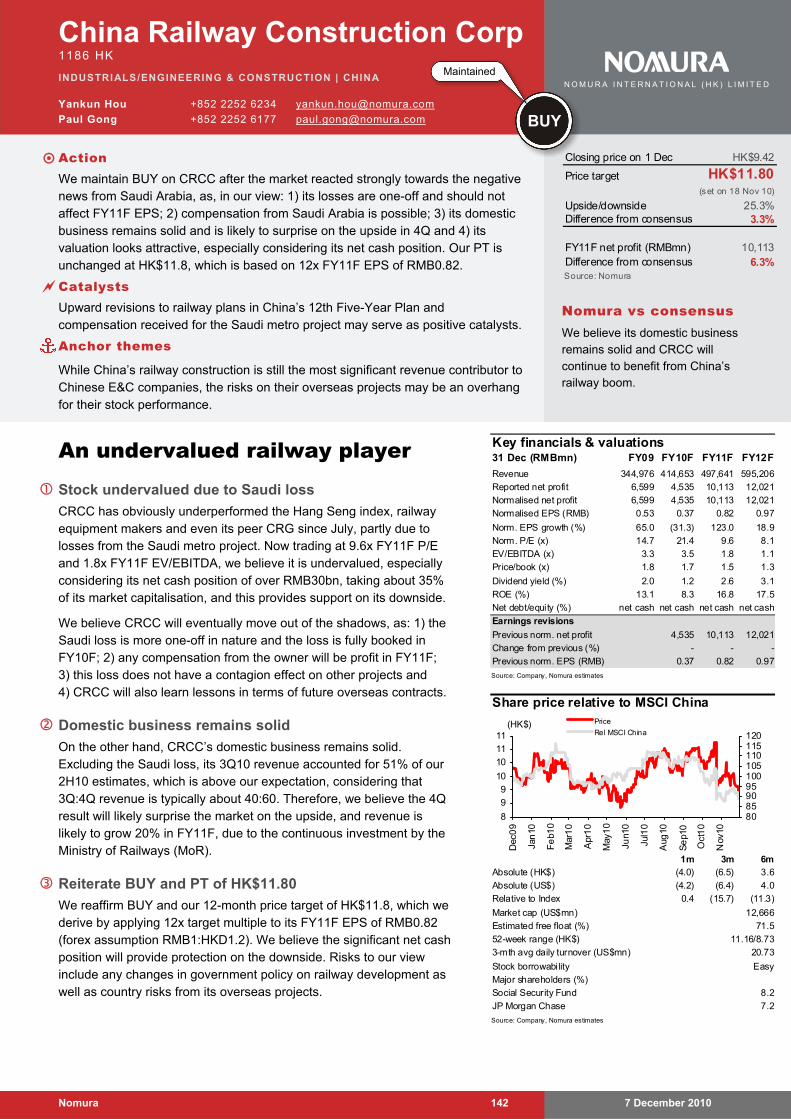
7 December 2010 Nomura 142
China Railway Construction Corp 1186 HK
INDUSTRIALS/ENGINEERING & CONSTRUCTION | CHINA
Yankun Hou +852 2252 6234 [email protected]
Paul Gong +852 2252 6177 [email protected]
An undervalued railway player Stock undervalued due to Saudi loss
CRCC has obviously underperformed the Hang Seng index, railway equipment makers and even its peer CRG since July, partly due to losses from the Saudi metro project. Now trading at 9.6x FY11F P/E and 1.8x FY11F EV/EBITDA, we believe it is undervalued, especially considering its net cash position of over RMB30bn, taking about 35% of its market capitalisation, and this provides support on its downside.
We believe CRCC will eventually move out of the shadows, as: 1) the Saudi loss is more one-off in nature and the loss is fully booked in FY10F; 2) any compensation from the owner will be profit in FY11F; 3) this loss does not have a contagion effect on other projects and 4) CRCC will also learn lessons in terms of future overseas contracts.
Domestic business remains solid
On the other hand, CRCC’s domestic business remains solid. Excluding the Saudi loss, its 3Q10 revenue accounted for 51% of our 2H10 estimates, which is above our expectation, considering that 3Q:4Q revenue is typically about 40:60. Therefore, we believe the 4Q result will likely surprise the market on the upside, and revenue is likely to grow 20% in FY11F, due to the continuous investment by the Ministry of Railways (MoR).
Reiterate BUY and PT of HK$11.80
We reaffirm BUY and our 12-month price target of HK$11.8, which we derive by applying 12x target multiple to its FY11F EPS of RMB0.82 (forex assumption RMB1:HKD1.2). We believe the significant net cash position will provide protection on the downside. Risks to our view include any changes in government policy on railway development as well as country risks from its overseas projects.
Key financials & valuations31 Dec (RMBmn) FY09 FY10F FY11F FY12F
Revenue 344,976 414,653 497,641 595,206
Reported net profit 6,599 4,535 10,113 12,021
Normalised net profit 6,599 4,535 10,113 12,021
Normalised EPS (RMB) 0.53 0.37 0.82 0.97
Norm. EPS growth (%) 65.0 (31.3) 123.0 18.9
Norm. P/E (x) 14.7 21.4 9.6 8.1
EV/EBITDA (x) 3.3 3.5 1.8 1.1
Price/book (x) 1.8 1.7 1.5 1.3
Dividend yield (%) 2.0 1.2 2.6 3.1
ROE (%) 13.1 8.3 16.8 17.5
Net debt/equity (%) net cash net cash net cash net cash
Earnings revisions
Previous norm. net profit 4,535 10,113 12,021
Change from previous (%) - - -
Previous norm. EPS (RMB) 0.37 0.82 0.97
Source: Company, Nomura estimates
Share price relative to MSCI China
1m 3m 6m (4.0) (6.5) 3.6
(4.2) (6.4) 4.0
0.4 (15.7) (11.3)
Easy
Source: Company, Nomura estimates
JP Morgan Chase
Stock borrowability
7.2
Major shareholders (%)
Social Security Fund 8.2
Absolute (HK$)
Absolute (US$)
Relative to Index
Estimated free float (%)
Market cap (US$mn) 12,666
71.5
52-week range (HK$)
3-mth avg daily turnover (US$mn)
11.16/8.73
20.73
8
9
9
10
10
11
11
Dec
09
Jan
10
Fe
b10
Mar
10
Apr
10
May
10
Jun1
0
Jul1
0
Aug
10
Se
p10
Oct
10
Nov
10
80859095100105110115120
Price
Rel MSCI China(HK$)
Closing price on 1 Dec HK$9.42
Price target HK$11.80(set on 18 Nov 10)
Upside/downside 25.3%Difference from consensus 3.3%
FY11F net profit (RMBmn) 10,113Difference from consensus 6.3%Source: Nomura
Nomura vs consensus We believe its domestic business remains solid and CRCC will continue to benefit from China’s railway boom.
Maintained
BUY
N O M U R A I N T E R N A T I O N A L ( H K ) L I M I T E D
Action We maintain BUY on CRCC after the market reacted strongly towards the negative
news from Saudi Arabia, as, in our view: 1) its losses are one-off and should not affect FY11F EPS; 2) compensation from Saudi Arabia is possible; 3) its domestic business remains solid and is likely to surprise on the upside in 4Q and 4) its valuation looks attractive, especially considering its net cash position. Our PT is unchanged at HK$11.8, which is based on 12x FY11F EPS of RMB0.82.
Catalysts Upward revisions to railway plans in China’s 12th Five-Year Plan and
compensation received for the Saudi metro project may serve as positive catalysts.
Anchor themes
While China’s railway construction is still the most significant revenue contributor to Chinese E&C companies, the risks on their overseas projects may be an overhang for their stock performance.
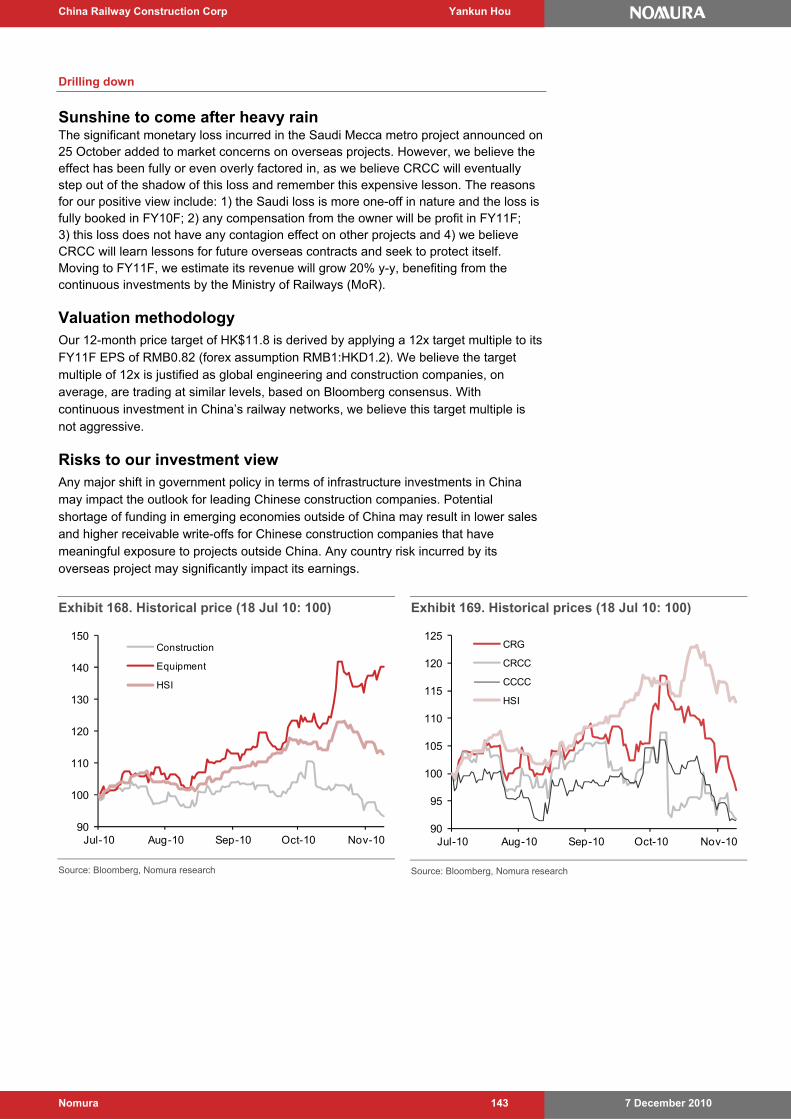
China Railway Construction Corp Yankun Hou
7 December 2010 Nomura 143
Drilling down
Sunshine to come after heavy rain The significant monetary loss incurred in the Saudi Mecca metro project announced on 25 October added to market concerns on overseas projects. However, we believe the effect has been fully or even overly factored in, as we believe CRCC will eventually step out of the shadow of this loss and remember this expensive lesson. The reasons for our positive view include: 1) the Saudi loss is more one-off in nature and the loss is fully booked in FY10F; 2) any compensation from the owner will be profit in FY11F; 3) this loss does not have any contagion effect on other projects and 4) we believe CRCC will learn lessons for future overseas contracts and seek to protect itself. Moving to FY11F, we estimate its revenue will grow 20% y-y, benefiting from the continuous investments by the Ministry of Railways (MoR).
Valuation methodology Our 12-month price target of HK$11.8 is derived by applying a 12x target multiple to its FY11F EPS of RMB0.82 (forex assumption RMB1:HKD1.2). We believe the target multiple of 12x is justified as global engineering and construction companies, on average, are trading at similar levels, based on Bloomberg consensus. With continuous investment in China’s railway networks, we believe this target multiple is not aggressive.
Risks to our investment view Any major shift in government policy in terms of infrastructure investments in China may impact the outlook for leading Chinese construction companies. Potential shortage of funding in emerging economies outside of China may result in lower sales and higher receivable write-offs for Chinese construction companies that have meaningful exposure to projects outside China. Any country risk incurred by its overseas project may significantly impact its earnings.
Exhibit 168. Historical price (18 Jul 10: 100)
90
100
110
120
130
140
150
Jul-10 Aug-10 Sep-10 Oct-10 Nov-10
Construction
Equipment
HSI
Source: Bloomberg, Nomura research
Exhibit 169. Historical prices (18 Jul 10: 100)
90
95
100
105
110
115
120
125
Jul-10 Aug-10 Sep-10 Oct-10 Nov-10
CRG
CRCC
CCCC
HSI
Source: Bloomberg, Nomura research
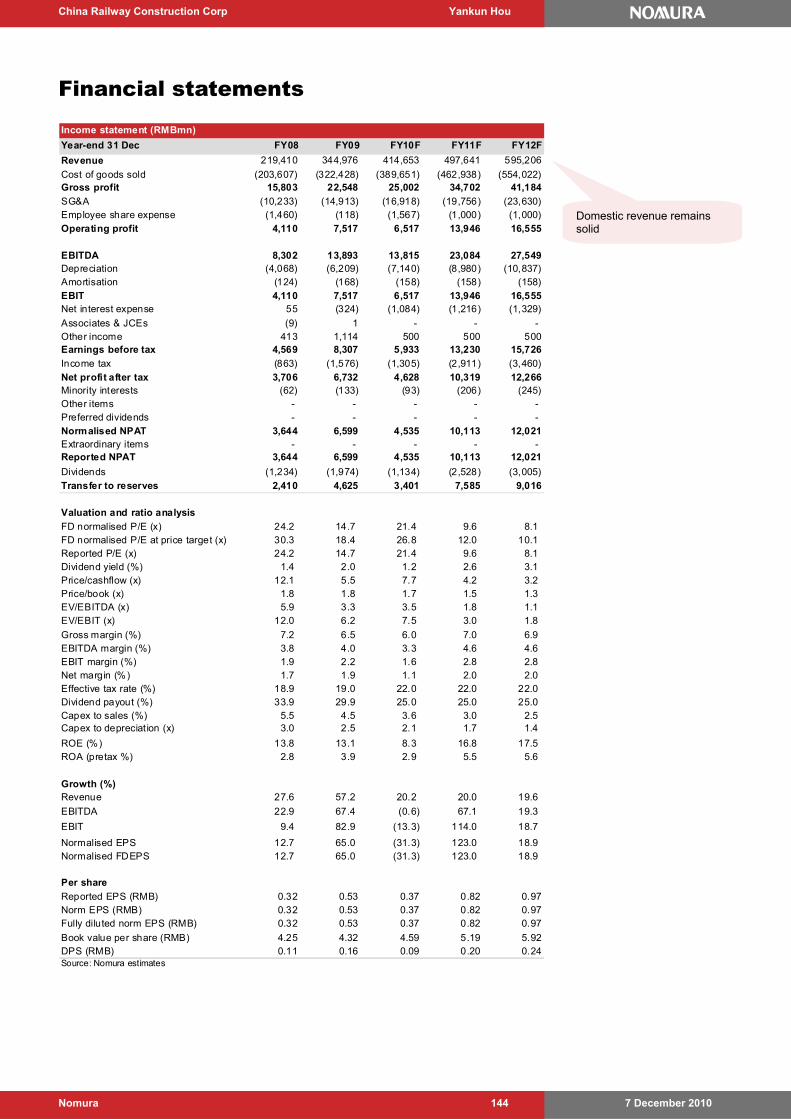
China Railway Construction Corp Yankun Hou
7 December 2010 Nomura 144
Financial statements
Income statement (RMBmn)
Year-end 31 Dec FY08 FY09 FY10F FY11F FY12F
Revenue 219,410 344,976 414,653 497,641 595,206
Cost of goods sold (203,607) (322,428) (389,651) (462,938) (554,022)Gross profit 15,803 22,548 25,002 34,702 41,184
SG&A (10,233) (14,913) (16,918) (19,756) (23,630)Employee share expense (1,460) (118) (1,567) (1,000) (1,000)Operating profit 4,110 7,517 6,517 13,946 16,555
EBITDA 8,302 13,893 13,815 23,084 27,549Depreciation (4,068) (6,209) (7,140) (8,980) (10,837)Amortisation (124) (168) (158) (158) (158)EBIT 4,110 7,517 6,517 13,946 16,555Net interest expense 55 (324) (1,084) (1,216) (1,329)
Associates & JCEs (9) 1 - - - Other income 413 1,114 500 500 500Earnings before tax 4,569 8,307 5,933 13,230 15,726
Income tax (863) (1,576) (1,305) (2,911) (3,460)
Net profit after tax 3,706 6,732 4,628 10,319 12,266Minority interests (62) (133) (93) (206) (245)Other items - - - - - Preferred dividends - - - - - Normalised NPAT 3,644 6,599 4,535 10,113 12,021Extraordinary items - - - - - Reported NPAT 3,644 6,599 4,535 10,113 12,021
Dividends (1,234) (1,974) (1,134) (2,528) (3,005)
Transfer to reserves 2,410 4,625 3,401 7,585 9,016
Valuation and ratio analysis
FD normalised P/E (x) 24.2 14.7 21.4 9.6 8.1 FD normalised P/E at price target (x) 30.3 18.4 26.8 12.0 10.1 Reported P/E (x) 24.2 14.7 21.4 9.6 8.1 Dividend yield (%) 1.4 2.0 1.2 2.6 3.1 Price/cashflow (x) 12.1 5.5 7.7 4.2 3.2 Price/book (x) 1.8 1.8 1.7 1.5 1.3 EV/EBITDA (x) 5.9 3.3 3.5 1.8 1.1 EV/EBIT (x) 12.0 6.2 7.5 3.0 1.8
Gross margin (%) 7.2 6.5 6.0 7.0 6.9 EBITDA margin (%) 3.8 4.0 3.3 4.6 4.6 EBIT margin (%) 1.9 2.2 1.6 2.8 2.8 Net margin (%) 1.7 1.9 1.1 2.0 2.0 Effective tax rate (%) 18.9 19.0 22.0 22.0 22.0 Dividend payout (%) 33.9 29.9 25.0 25.0 25.0 Capex to sales (%) 5.5 4.5 3.6 3.0 2.5 Capex to depreciation (x) 3.0 2.5 2.1 1.7 1.4
ROE (%) 13.8 13.1 8.3 16.8 17.5 ROA (pretax %) 2.8 3.9 2.9 5.5 5.6
Growth (%)Revenue 27.6 57.2 20.2 20.0 19.6
EBITDA 22.9 67.4 (0.6) 67.1 19.3
EBIT 9.4 82.9 (13.3) 114.0 18.7
Normalised EPS 12.7 65.0 (31.3) 123.0 18.9 Normalised FDEPS 12.7 65.0 (31.3) 123.0 18.9
Per share
Reported EPS (RMB) 0.32 0.53 0.37 0.82 0.97Norm EPS (RMB) 0.32 0.53 0.37 0.82 0.97Fully diluted norm EPS (RMB) 0.32 0.53 0.37 0.82 0.97
Book value per share (RMB) 4.25 4.32 4.59 5.19 5.92DPS (RMB) 0.11 0.16 0.09 0.20 0.24Source: Nomura estimates
Domestic revenue remains solid
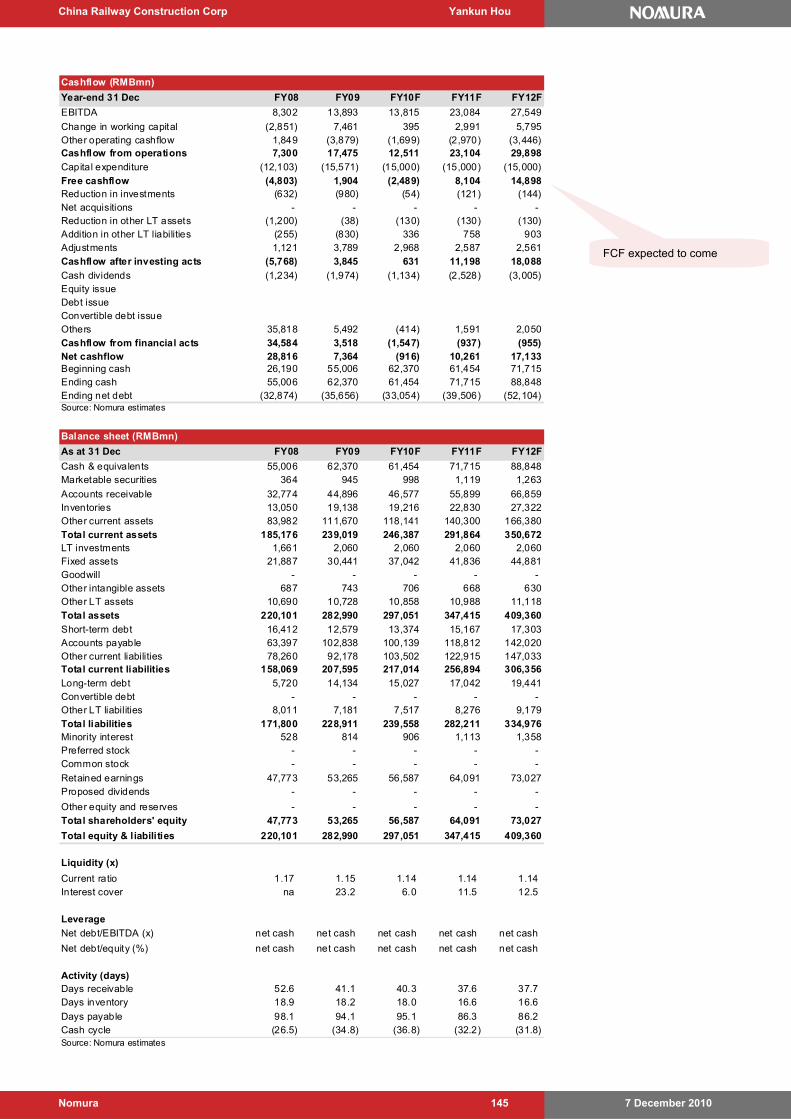
China Railway Construction Corp Yankun Hou
7 December 2010 Nomura 145
Cashflow (RMBmn)
Year-end 31 Dec FY08 FY09 FY10F FY11F FY12F
EBITDA 8,302 13,893 13,815 23,084 27,549
Change in working capital (2,851) 7,461 395 2,991 5,795Other operating cashflow 1,849 (3,879) (1,699) (2,970) (3,446)Cashflow from operations 7,300 17,475 12,511 23,104 29,898
Capital expenditure (12,103) (15,571) (15,000) (15,000) (15,000)
Free cashflow (4,803) 1,904 (2,489) 8,104 14,898Reduction in investments (632) (980) (54) (121) (144)Net acquisitions - - - - - Reduction in other LT assets (1,200) (38) (130) (130) (130)Addition in other LT liabilities (255) (830) 336 758 903Adjustments 1,121 3,789 2,968 2,587 2,561Cashflow after investing acts (5,768) 3,845 631 11,198 18,088
Cash dividends (1,234) (1,974) (1,134) (2,528) (3,005)Equity issueDebt issueConvertible debt issueOthers 35,818 5,492 (414) 1,591 2,050Cashflow from financial acts 34,584 3,518 (1,547) (937) (955)Net cashflow 28,816 7,364 (916) 10,261 17,133Beginning cash 26,190 55,006 62,370 61,454 71,715Ending cash 55,006 62,370 61,454 71,715 88,848Ending net debt (32,874) (35,656) (33,054) (39,506) (52,104)Source: Nomura estimates
Balance sheet (RMBmn)
As at 31 Dec FY08 FY09 FY10F FY11F FY12F
Cash & equivalents 55,006 62,370 61,454 71,715 88,848Marketable securities 364 945 998 1,119 1,263
Accounts receivable 32,774 44,896 46,577 55,899 66,859Inventories 13,050 19,138 19,216 22,830 27,322Other current assets 83,982 111,670 118,141 140,300 166,380Total current assets 185,176 239,019 246,387 291,864 350,672LT investments 1,661 2,060 2,060 2,060 2,060Fixed assets 21,887 30,441 37,042 41,836 44,881Goodwill - - - - - Other intangible assets 687 743 706 668 630Other LT assets 10,690 10,728 10,858 10,988 11,118
Total assets 220,101 282,990 297,051 347,415 409,360
Short-term debt 16,412 12,579 13,374 15,167 17,303Accounts payable 63,397 102,838 100,139 118,812 142,020Other current liabilities 78,260 92,178 103,502 122,915 147,033Total current liabilities 158,069 207,595 217,014 256,894 306,356
Long-term debt 5,720 14,134 15,027 17,042 19,441Convertible debt - - - - - Other LT liabilities 8,011 7,181 7,517 8,276 9,179
Total liabilities 171,800 228,911 239,558 282,211 334,976Minority interest 528 814 906 1,113 1,358Preferred stock - - - - - Common stock - - - - -
Retained earnings 47,773 53,265 56,587 64,091 73,027Proposed dividends - - - - -
Other equity and reserves - - - - - Total shareholders' equity 47,773 53,265 56,587 64,091 73,027
Total equity & liabilities 220,101 282,990 297,051 347,415 409,360
Liquidity (x)
Current ratio 1.17 1.15 1.14 1.14 1.14 Interest cover na 23.2 6.0 11.5 12.5
Leverage
Net debt/EBITDA (x) net cash net cash net cash net cash net cash
Net debt/equity (%) net cash net cash net cash net cash net cash
Activity (days)Days receivable 52.6 41.1 40.3 37.6 37.7 Days inventory 18.9 18.2 18.0 16.6 16.6
Days payable 98.1 94.1 95.1 86.3 86.2 Cash cycle (26.5) (34.8) (36.8) (32.2) (31.8) Source: Nomura estimates
FCF expected to come
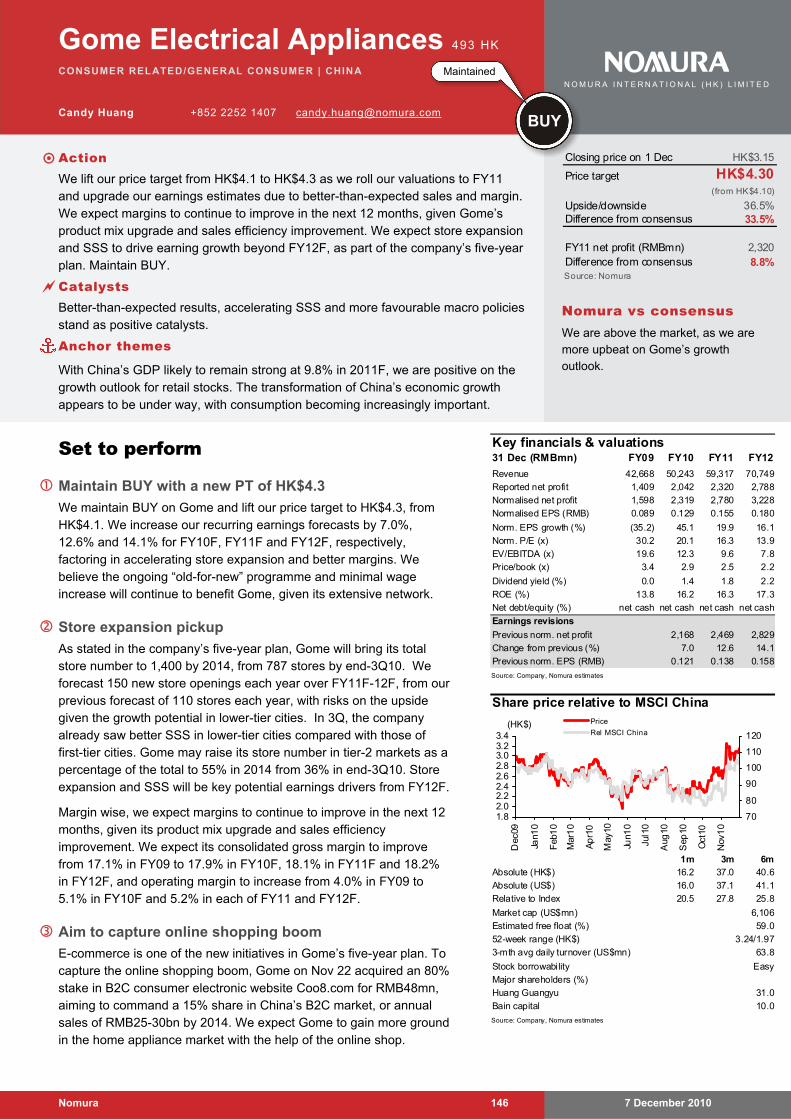
7 December 2010 Nomura 146
Gome Electrical Appliances 493 HK
CONSUMER RELATED/GENERAL CONSUMER | CHINA
Candy Huang +852 2252 1407 [email protected]
Set to perform
Maintain BUY with a new PT of HK$4.3
We maintain BUY on Gome and lift our price target to HK$4.3, from HK$4.1. We increase our recurring earnings forecasts by 7.0%, 12.6% and 14.1% for FY10F, FY11F and FY12F, respectively, factoring in accelerating store expansion and better margins. We believe the ongoing “old-for-new” programme and minimal wage increase will continue to benefit Gome, given its extensive network.
Store expansion pickup
As stated in the company’s five-year plan, Gome will bring its total store number to 1,400 by 2014, from 787 stores by end-3Q10. We forecast 150 new store openings each year over FY11F-12F, from our previous forecast of 110 stores each year, with risks on the upside given the growth potential in lower-tier cities. In 3Q, the company already saw better SSS in lower-tier cities compared with those of first-tier cities. Gome may raise its store number in tier-2 markets as a percentage of the total to 55% in 2014 from 36% in end-3Q10. Store expansion and SSS will be key potential earnings drivers from FY12F.
Margin wise, we expect margins to continue to improve in the next 12 months, given its product mix upgrade and sales efficiency improvement. We expect its consolidated gross margin to improve from 17.1% in FY09 to 17.9% in FY10F, 18.1% in FY11F and 18.2% in FY12F, and operating margin to increase from 4.0% in FY09 to 5.1% in FY10F and 5.2% in each of FY11 and FY12F.
Aim to capture online shopping boom
E-commerce is one of the new initiatives in Gome’s five-year plan. To capture the online shopping boom, Gome on Nov 22 acquired an 80% stake in B2C consumer electronic website Coo8.com for RMB48mn, aiming to command a 15% share in China’s B2C market, or annual sales of RMB25-30bn by 2014. We expect Gome to gain more ground in the home appliance market with the help of the online shop.
Key financials & valuations31 Dec (RMBmn) FY09 FY10 FY11 FY12
Revenue 42,668 50,243 59,317 70,749
Reported net profit 1,409 2,042 2,320 2,788
Normalised net profit 1,598 2,319 2,780 3,228
Normalised EPS (RMB) 0.089 0.129 0.155 0.180
Norm. EPS growth (%) (35.2) 45.1 19.9 16.1
Norm. P/E (x) 30.2 20.1 16.3 13.9
EV/EBITDA (x) 19.6 12.3 9.6 7.8
Price/book (x) 3.4 2.9 2.5 2.2
Dividend yield (%) 0.0 1.4 1.8 2.2
ROE (%) 13.8 16.2 16.3 17.3
Net debt/equity (%) net cash net cash net cash net cash
Earnings revisions
Previous norm. net profit 2,168 2,469 2,829
Change from previous (%) 7.0 12.6 14.1
Previous norm. EPS (RMB) 0.121 0.138 0.158
Source: Company, Nomura estimates
Share price relative to MSCI China
1m 3m 6m 16.2 37.0 40.6
16.0 37.1 41.1
20.5 27.8 25.8
Easy
Source: Company, Nomura estimates
6,106
59.0
3.24/1.97
63.8
Absolute (HK$)
Absolute (US$)
Relative to Index
Estimated free float (%)
Market cap (US$mn)
10.0
Major shareholders (%)
Huang Guangyu 31.0
52-week range (HK$)
3-mth avg daily turnover (US$mn)
Bain capital
Stock borrowability
1.82.02.22.42.62.83.03.23.4
Dec
09
Jan1
0
Feb
10
Mar
10
Ap
r10
May
10
Jun1
0
Jul1
0
Aug
10
Sep
10
Oct
10
Nov
10
70
80
90
100
110
120
Price
Rel MSCI China(HK$)
Closing price on 1 Dec HK$3.15
Price target HK$4.30(from HK$4.10)
Upside/downside 36.5%Difference from consensus 33.5%
FY11 net profit (RMBmn) 2,320Difference from consensus 8.8%Source: Nomura
Nomura vs consensus We are above the market, as we are more upbeat on Gome’s growth outlook.
Maintained
BUY
N O M U R A I N T E R N A T I O N A L ( H K ) L I M I T E D
Action We lift our price target from HK$4.1 to HK$4.3 as we roll our valuations to FY11
and upgrade our earnings estimates due to better-than-expected sales and margin. We expect margins to continue to improve in the next 12 months, given Gome’s product mix upgrade and sales efficiency improvement. We expect store expansion and SSS to drive earning growth beyond FY12F, as part of the company’s five-year plan. Maintain BUY.
Catalysts Better-than-expected results, accelerating SSS and more favourable macro policies
stand as positive catalysts.
Anchor themes
With China’s GDP likely to remain strong at 9.8% in 2011F, we are positive on the growth outlook for retail stocks. The transformation of China’s economic growth appears to be under way, with consumption becoming increasingly important.
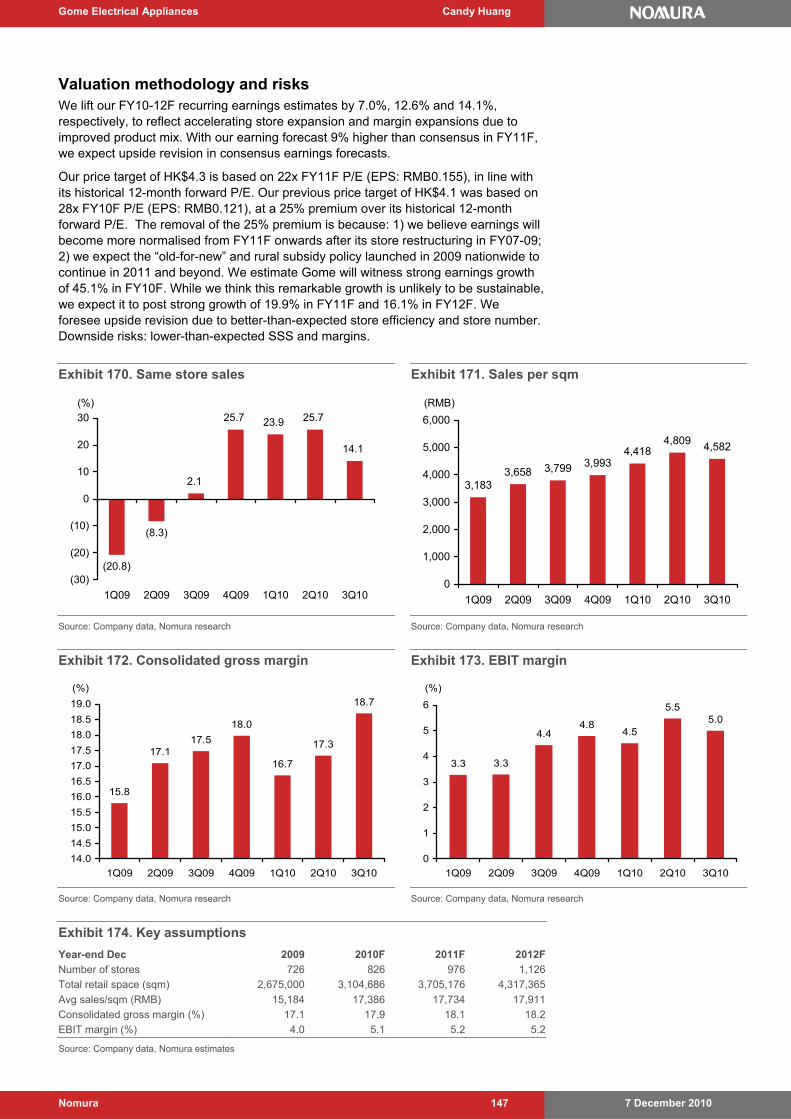
Gome Electrical Appliances Candy Huang
7 December 2010 Nomura 147
Valuation methodology and risks We lift our FY10-12F recurring earnings estimates by 7.0%, 12.6% and 14.1%, respectively, to reflect accelerating store expansion and margin expansions due to improved product mix. With our earning forecast 9% higher than consensus in FY11F, we expect upside revision in consensus earnings forecasts.
Our price target of HK$4.3 is based on 22x FY11F P/E (EPS: RMB0.155), in line with its historical 12-month forward P/E. Our previous price target of HK$4.1 was based on 28x FY10F P/E (EPS: RMB0.121), at a 25% premium over its historical 12-month forward P/E. The removal of the 25% premium is because: 1) we believe earnings will become more normalised from FY11F onwards after its store restructuring in FY07-09; 2) we expect the “old-for-new” and rural subsidy policy launched in 2009 nationwide to continue in 2011 and beyond. We estimate Gome will witness strong earnings growth of 45.1% in FY10F. While we think this remarkable growth is unlikely to be sustainable, we expect it to post strong growth of 19.9% in FY11F and 16.1% in FY12F. We foresee upside revision due to better-than-expected store efficiency and store number. Downside risks: lower-than-expected SSS and margins.
Exhibit 170. Same store sales
(20.8)
(8.3)
2.1
25.7 23.9 25.7
14.1
(30)
(20)
(10)
0
10
20
30
1Q09 2Q09 3Q09 4Q09 1Q10 2Q10 3Q10
(%)
Source: Company data, Nomura research
Exhibit 171. Sales per sqm
3,1833,658 3,799 3,993
4,4184,809
4,582
0
1,000
2,000
3,000
4,000
5,000
6,000
1Q09 2Q09 3Q09 4Q09 1Q10 2Q10 3Q10
(RMB)
Source: Company data, Nomura research
Exhibit 172. Consolidated gross margin
15.8
17.117.5
18.0
16.7
17.3
18.7
14.0
14.5
15.0
15.5
16.0
16.5
17.0
17.5
18.0
18.5
19.0
1Q09 2Q09 3Q09 4Q09 1Q10 2Q10 3Q10
(%)
Source: Company data, Nomura research
Exhibit 173. EBIT margin
3.3 3.3
4.44.8
4.5
5.55.0
0
1
2
3
4
5
6
1Q09 2Q09 3Q09 4Q09 1Q10 2Q10 3Q10
(%)
Source: Company data, Nomura research
Exhibit 174. Key assumptions
Year-end Dec 2009 2010F 2011F 2012F
Number of stores 726 826 976 1,126
Total retail space (sqm) 2,675,000 3,104,686 3,705,176 4,317,365
Avg sales/sqm (RMB) 15,184 17,386 17,734 17,911
Consolidated gross margin (%) 17.1 17.9 18.1 18.2
EBIT margin (%) 4.0 5.1 5.2 5.2
Source: Company data, Nomura estimates
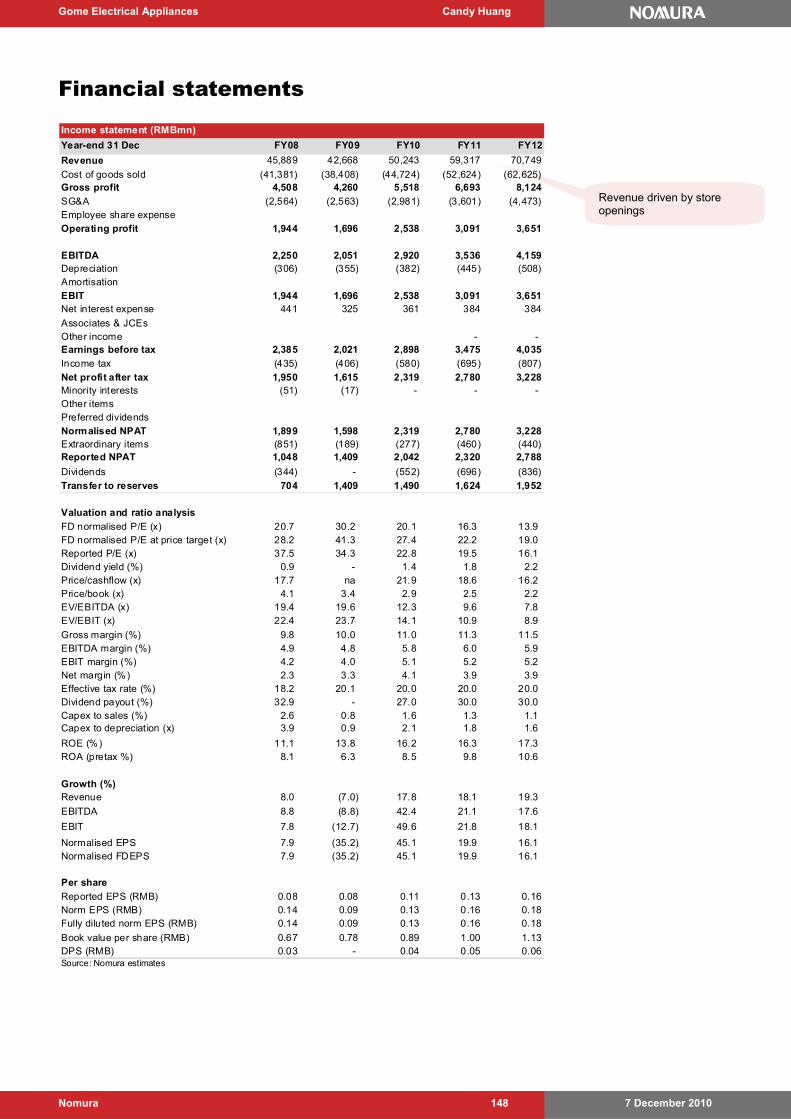
Gome Electrical Appliances Candy Huang
7 December 2010 Nomura 148
Revenue driven by store openings
Financial statements
Income statement (RMBmn)
Year-end 31 Dec FY08 FY09 FY10 FY11 FY12
Revenue 45,889 42,668 50,243 59,317 70,749
Cost of goods sold (41,381) (38,408) (44,724) (52,624) (62,625)Gross profit 4,508 4,260 5,518 6,693 8,124
SG&A (2,564) (2,563) (2,981) (3,601) (4,473)Employee share expenseOperating profit 1,944 1,696 2,538 3,091 3,651
EBITDA 2,250 2,051 2,920 3,536 4,159Depreciation (306) (355) (382) (445) (508)AmortisationEBIT 1,944 1,696 2,538 3,091 3,651Net interest expense 441 325 361 384 384
Associates & JCEsOther income - - Earnings before tax 2,385 2,021 2,898 3,475 4,035
Income tax (435) (406) (580) (695) (807)
Net profit after tax 1,950 1,615 2,319 2,780 3,228Minority interests (51) (17) - - - Other itemsPreferred dividendsNormalised NPAT 1,899 1,598 2,319 2,780 3,228Extraordinary items (851) (189) (277) (460) (440)Reported NPAT 1,048 1,409 2,042 2,320 2,788
Dividends (344) - (552) (696) (836)
Transfer to reserves 704 1,409 1,490 1,624 1,952
Valuation and ratio analysis
FD normalised P/E (x) 20.7 30.2 20.1 16.3 13.9 FD normalised P/E at price target (x) 28.2 41.3 27.4 22.2 19.0 Reported P/E (x) 37.5 34.3 22.8 19.5 16.1 Dividend yield (%) 0.9 - 1.4 1.8 2.2 Price/cashflow (x) 17.7 na 21.9 18.6 16.2 Price/book (x) 4.1 3.4 2.9 2.5 2.2 EV/EBITDA (x) 19.4 19.6 12.3 9.6 7.8 EV/EBIT (x) 22.4 23.7 14.1 10.9 8.9
Gross margin (%) 9.8 10.0 11.0 11.3 11.5 EBITDA margin (%) 4.9 4.8 5.8 6.0 5.9 EBIT margin (%) 4.2 4.0 5.1 5.2 5.2 Net margin (%) 2.3 3.3 4.1 3.9 3.9 Effective tax rate (%) 18.2 20.1 20.0 20.0 20.0 Dividend payout (%) 32.9 - 27.0 30.0 30.0 Capex to sales (%) 2.6 0.8 1.6 1.3 1.1 Capex to depreciation (x) 3.9 0.9 2.1 1.8 1.6
ROE (%) 11.1 13.8 16.2 16.3 17.3 ROA (pretax %) 8.1 6.3 8.5 9.8 10.6
Growth (%)Revenue 8.0 (7.0) 17.8 18.1 19.3
EBITDA 8.8 (8.8) 42.4 21.1 17.6
EBIT 7.8 (12.7) 49.6 21.8 18.1
Normalised EPS 7.9 (35.2) 45.1 19.9 16.1 Normalised FDEPS 7.9 (35.2) 45.1 19.9 16.1
Per share
Reported EPS (RMB) 0.08 0.08 0.11 0.13 0.16Norm EPS (RMB) 0.14 0.09 0.13 0.16 0.18Fully diluted norm EPS (RMB) 0.14 0.09 0.13 0.16 0.18
Book value per share (RMB) 0.67 0.78 0.89 1.00 1.13DPS (RMB) 0.03 - 0.04 0.05 0.06Source: Nomura estimates
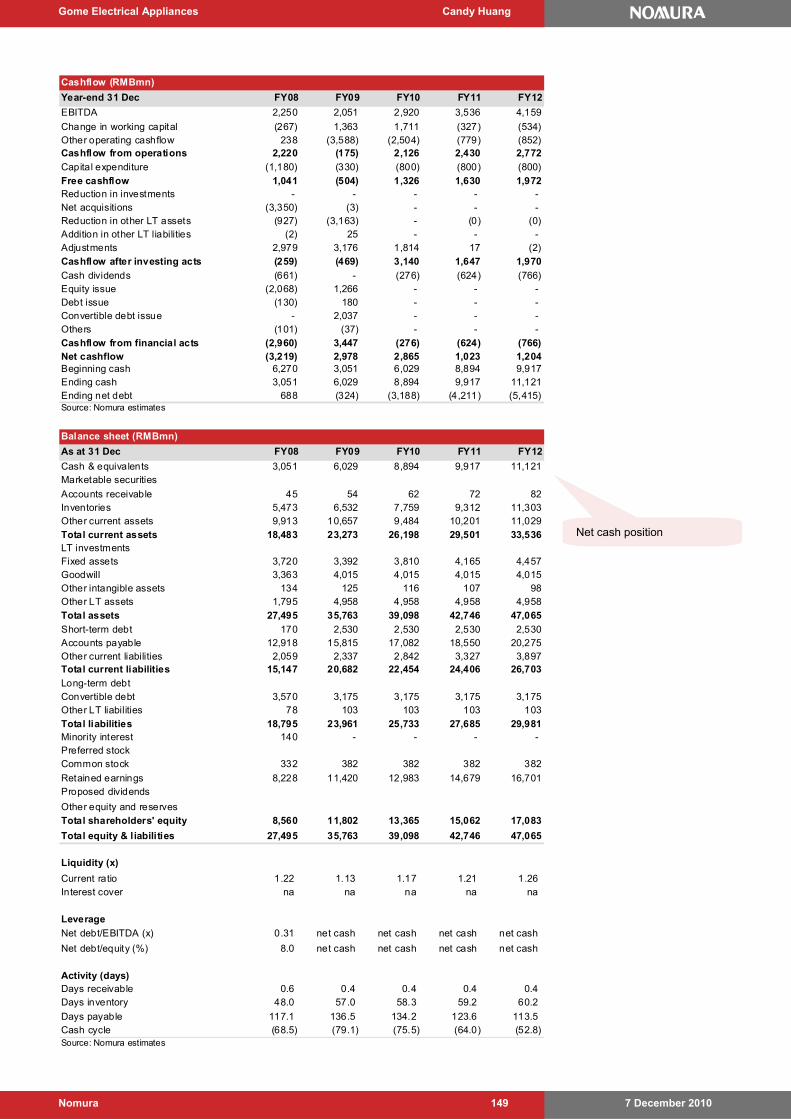
Gome Electrical Appliances Candy Huang
7 December 2010 Nomura 149
Cashflow (RMBmn)
Year-end 31 Dec FY08 FY09 FY10 FY11 FY12
EBITDA 2,250 2,051 2,920 3,536 4,159
Change in working capital (267) 1,363 1,711 (327) (534)Other operating cashflow 238 (3,588) (2,504) (779) (852)Cashflow from operations 2,220 (175) 2,126 2,430 2,772
Capital expenditure (1,180) (330) (800) (800) (800)
Free cashflow 1,041 (504) 1,326 1,630 1,972Reduction in investments - - - - - Net acquisitions (3,350) (3) - - - Reduction in other LT assets (927) (3,163) - (0) (0)Addition in other LT liabilities (2) 25 - - - Adjustments 2,979 3,176 1,814 17 (2)Cashflow after investing acts (259) (469) 3,140 1,647 1,970
Cash dividends (661) - (276) (624) (766)Equity issue (2,068) 1,266 - - - Debt issue (130) 180 - - - Convertible debt issue - 2,037 - - - Others (101) (37) - - - Cashflow from financial acts (2,960) 3,447 (276) (624) (766)Net cashflow (3,219) 2,978 2,865 1,023 1,204Beginning cash 6,270 3,051 6,029 8,894 9,917Ending cash 3,051 6,029 8,894 9,917 11,121Ending net debt 688 (324) (3,188) (4,211) (5,415)Source: Nomura estimates
Balance sheet (RMBmn)
As at 31 Dec FY08 FY09 FY10 FY11 FY12
Cash & equivalents 3,051 6,029 8,894 9,917 11,121Marketable securities
Accounts receivable 45 54 62 72 82Inventories 5,473 6,532 7,759 9,312 11,303Other current assets 9,913 10,657 9,484 10,201 11,029Total current assets 18,483 23,273 26,198 29,501 33,536LT investmentsFixed assets 3,720 3,392 3,810 4,165 4,457Goodwill 3,363 4,015 4,015 4,015 4,015Other intangible assets 134 125 116 107 98Other LT assets 1,795 4,958 4,958 4,958 4,958
Total assets 27,495 35,763 39,098 42,746 47,065
Short-term debt 170 2,530 2,530 2,530 2,530Accounts payable 12,918 15,815 17,082 18,550 20,275Other current liabilities 2,059 2,337 2,842 3,327 3,897Total current liabilities 15,147 20,682 22,454 24,406 26,703
Long-term debtConvertible debt 3,570 3,175 3,175 3,175 3,175Other LT liabilities 78 103 103 103 103
Total liabilities 18,795 23,961 25,733 27,685 29,981Minority interest 140 - - - - Preferred stockCommon stock 332 382 382 382 382
Retained earnings 8,228 11,420 12,983 14,679 16,701Proposed dividends
Other equity and reservesTotal shareholders' equity 8,560 11,802 13,365 15,062 17,083
Total equity & liabilities 27,495 35,763 39,098 42,746 47,065
Liquidity (x)
Current ratio 1.22 1.13 1.17 1.21 1.26 Interest cover na na na na na
Leverage
Net debt/EBITDA (x) 0.31 net cash net cash net cash net cash
Net debt/equity (%) 8.0 net cash net cash net cash net cash
Activity (days)Days receivable 0.6 0.4 0.4 0.4 0.4 Days inventory 48.0 57.0 58.3 59.2 60.2
Days payable 117.1 136.5 134.2 123.6 113.5 Cash cycle (68.5) (79.1) (75.5) (64.0) (52.8) Source: Nomura estimates
Net cash position
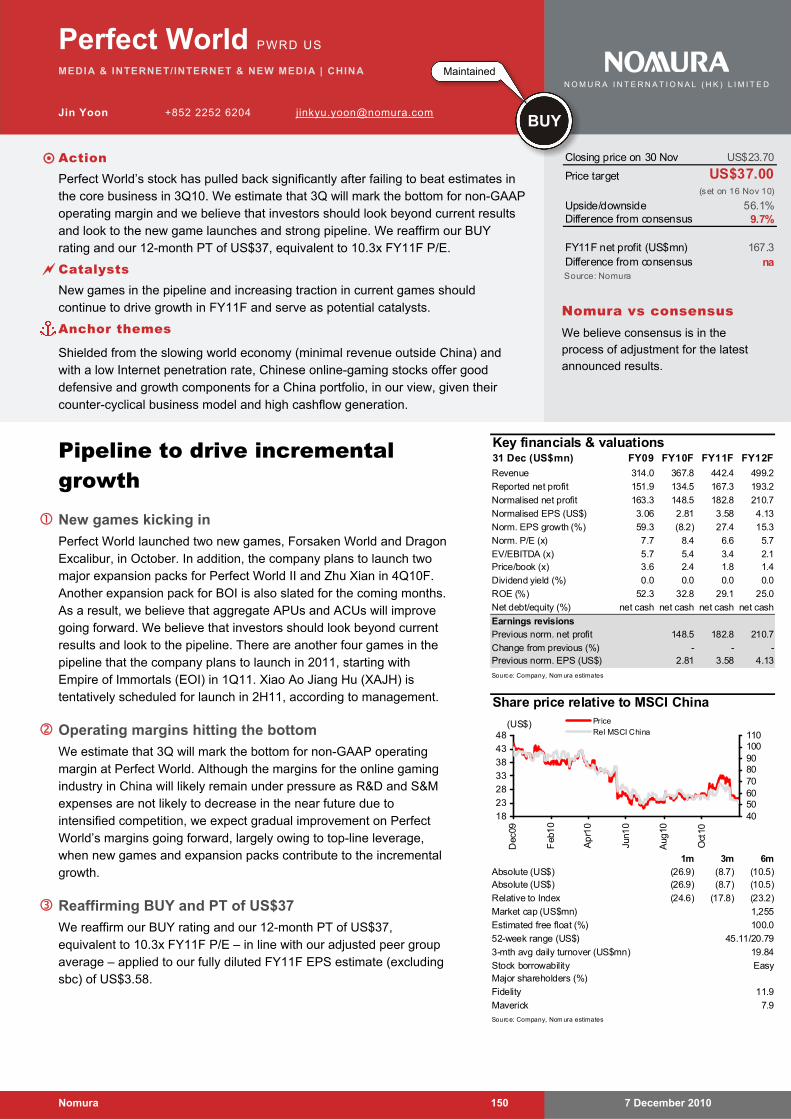
7 December 2010 Nomura 150
Perfect World PWRD US
MEDIA & INTERNET/INTERNET & NEW MEDIA | CHINA
Jin Yoon +852 2252 6204 [email protected]
Pipeline to drive incremental growth
New games kicking in
Perfect World launched two new games, Forsaken World and Dragon Excalibur, in October. In addition, the company plans to launch two major expansion packs for Perfect World II and Zhu Xian in 4Q10F. Another expansion pack for BOI is also slated for the coming months. As a result, we believe that aggregate APUs and ACUs will improve going forward. We believe that investors should look beyond current results and look to the pipeline. There are another four games in the pipeline that the company plans to launch in 2011, starting with Empire of Immortals (EOI) in 1Q11. Xiao Ao Jiang Hu (XAJH) is tentatively scheduled for launch in 2H11, according to management.
Operating margins hitting the bottom
We estimate that 3Q will mark the bottom for non-GAAP operating margin at Perfect World. Although the margins for the online gaming industry in China will likely remain under pressure as R&D and S&M expenses are not likely to decrease in the near future due to intensified competition, we expect gradual improvement on Perfect World’s margins going forward, largely owing to top-line leverage, when new games and expansion packs contribute to the incremental growth.
Reaffirming BUY and PT of US$37
We reaffirm our BUY rating and our 12-month PT of US$37, equivalent to 10.3x FY11F P/E – in line with our adjusted peer group average – applied to our fully diluted FY11F EPS estimate (excluding sbc) of US$3.58.
Key financials & valuations31 Dec (US$mn) FY09 FY10F FY11F FY12F
Revenue 314.0 367.8 442.4 499.2
Reported net profit 151.9 134.5 167.3 193.2
Normalised net profit 163.3 148.5 182.8 210.7
Normalised EPS (US$) 3.06 2.81 3.58 4.13
Norm. EPS growth (%) 59.3 (8.2) 27.4 15.3
Norm. P/E (x) 7.7 8.4 6.6 5.7
EV/EBITDA (x) 5.7 5.4 3.4 2.1Price/book (x) 3.6 2.4 1.8 1.4
Dividend yield (%) 0.0 0.0 0.0 0.0
ROE (%) 52.3 32.8 29.1 25.0
Net debt/equity (%) net cash net cash net cash net cash
Earnings revisionsPrevious norm. net profit 148.5 182.8 210.7
Change from previous (%) - - - Previous norm. EPS (US$) 2.81 3.58 4.13
Source: Company, Nom ura estimates
Share price relative to MSCI China
1m 3m 6m (26.9) (8.7) (10.5) (26.9) (8.7) (10.5)
(24.6) (17.8) (23.2)
Easy
Source: Company, Nom ura estimates
1,255
100.0
45.11/20.79
19.84
Absolute (US$)Absolute (US$)
Relative to Index
Estimated free float (%)
Market cap (US$mn)
7.9
Major shareholders (%)
Fidelity 11.9
52-week range (US$)
3-mth avg daily turnover (US$mn)
Maverick
Stock borrowability
18
23
28
33
38
43
48
Dec
09
Feb
10
Ap
r10
Jun1
0
Aug
10
Oct
10
405060708090100110
Price
Rel MSCI China(US$)
Closing price on 30 Nov US$23.70
Price target US$37.00(set on 16 Nov 10)
Upside/downside 56.1%Difference from consensus 9.7%
FY11F net profit (US$mn) 167.3Difference from consensus naSource: Nomura
Nomura vs consensus We believe consensus is in the process of adjustment for the latest announced results.
Maintained
BUY
N O M U R A I N T E R N A T I O N A L ( H K ) L I M I T E D
Action Perfect World’s stock has pulled back significantly after failing to beat estimates in
the core business in 3Q10. We estimate that 3Q will mark the bottom for non-GAAP operating margin and we believe that investors should look beyond current results and look to the new game launches and strong pipeline. We reaffirm our BUY rating and our 12-month PT of US$37, equivalent to 10.3x FY11F P/E.
Catalysts New games in the pipeline and increasing traction in current games should
continue to drive growth in FY11F and serve as potential catalysts.
Anchor themes
Shielded from the slowing world economy (minimal revenue outside China) and with a low Internet penetration rate, Chinese online-gaming stocks offer good defensive and growth components for a China portfolio, in our view, given their counter-cyclical business model and high cashflow generation.
Perfect World Jin Yoon
7 December 2010 Nomura 151
Investment summary and valuation
Key investment positives New games kicking in. The company launched two new games, Forsaken World
and Dragon Excalibur, in October. According to management, Forsaken World did better than expected (we believe ACUs continue to top 160K since release), while Dragon Excalibur is off to a slow start, with ACUs for that game topping 60K. Although we do not believe the two games will become hit games in China, we think they will provide much-needed incremental contributions to the top line, as the current games in the portfolio are stagnant, mainly driven by ARPU strength. We believe that the entire 1-5% q-q growth in guidance comes from the two new games, as we expect existing games to remain flat. In addition to the two new games, the company plans to launch two major expansion packs for Perfect World II and Zhu Xian in 4Q10F. Another expansion pack for BOI is also slated for the coming months. As a result, we believe that aggregate APUs and ACUs will improve going forward. We expect ARPU to decrease in 4Q10F due to the dilution effect of new games. The newly launched titles and upcoming expansion packs should be particularly impactful in 1Q11F and 2Q11F, in our view, and we believe that investors should look beyond current results and look to the pipeline. There are another four games in the pipeline that the company plans to launch in 2011, starting with Empire of Immortals (EOI) in 1Q11. Xiao Ao Jiang Hu (XAJH) is tentatively scheduled for launch in 2H11, according to management.
Hitting the bottom. We estimate that 3Q will mark the bottom for non-GAAP operating margin at Perfect World. While operating margins at 36.1% came in above our expectations, we expect gradual improvement going forward, hitting 42.3% in 3Q11F, largely owing to top-line leverage. We also believe that 3Q will be the trough for several key performing metrics such as APCs and APUs, as we expect contributions from the new games to drive traffic and momentum back to the company. We expect APCs and APUs to improve 5% and 7%, respectively, on a q-q basis, driven by new games such as Dragon Excalibur and Forsaken World. We do not expect significant contributions from declining legacy games; much of the incremental growth should come from the new games and expansion packs. However we believe that margins will likely remain under pressure, as R&D and S&M expenses are not likely to decrease in the near future.
Reaffirming BUY and PT of US$37 We believe that with the launch of new games, Perfect World should experience a gradual expansion in valuations as investors feel more comfortable with the prospect of a timely game launch. Furthermore, we note that gaming companies typically trade well ahead of actual game commercialisation, as evidenced below by Netease and Shanda Interactive. Netease shares were up 37% after Wrath of Lich King was approved but prior to commercialisation, and Shanda was up 157% in the run-up to commercialisation of AION.
We use P/E valuation to determine our price target rather than using a discounted cashflow (DCF) basis, because we believe this is the most suitable metric to determine the value of Chinese Internet companies given the business cyclicality, the lack of earnings visibility and the short history of China’s internet industry. We reaffirm our BUY rating and our 12-month price target of US$37, equivalent to 10.3x FY11F P/E, largely in line with our adjusted peer group average of 9.7x FY11F P/E applied to our fully diluted FY11 EPS estimate (excluding share-based compensation) of US$3.58. This implies potential upside of 56.1%. The valuation methodology is unchanged.
Investment risks. Company-specific risks to our price target and estimates include: 1) any delays in future gaming releases; 2) new games failing to generate material revenue; 3) declining performance of existing games, including the newly launched Fantasy Zhu Xian; and 4) minimal penetration in tier-3 and tier-4 cities in China.
PT now implies 10.3x FY11F P/E, largely in line with our adjusted peer group average
Despite headwind in the industry, new games are kicking in
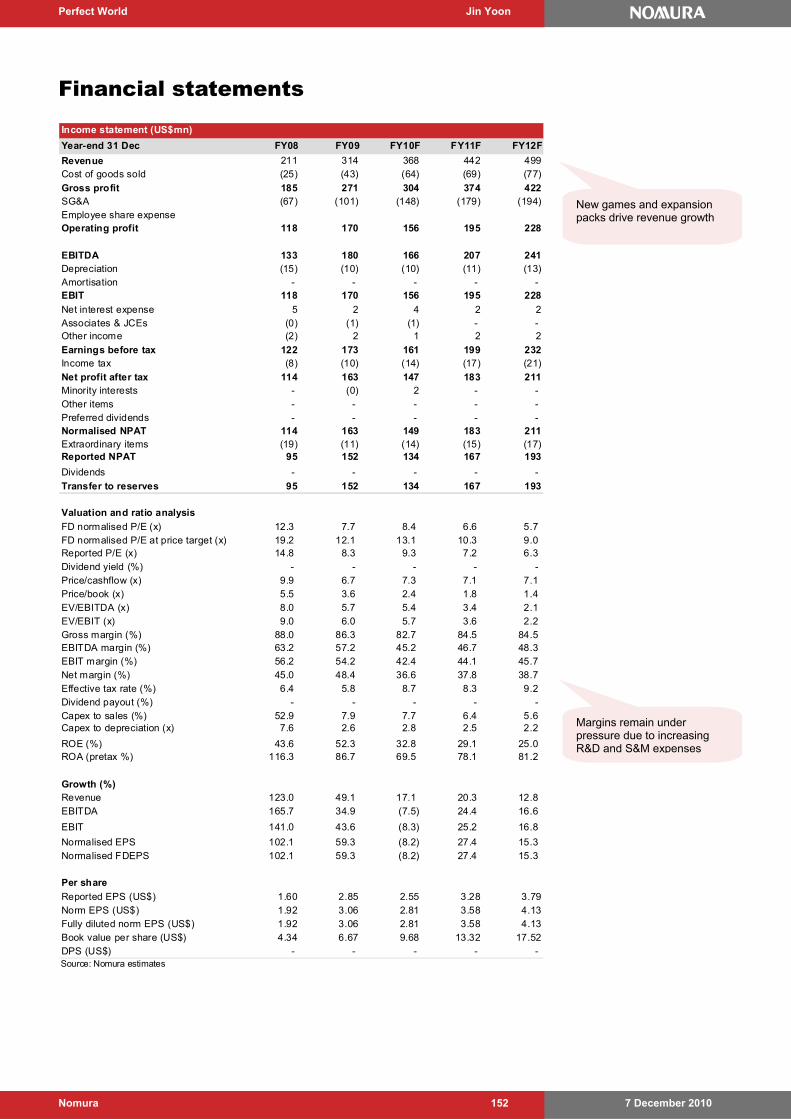
Perfect World Jin Yoon
7 December 2010 Nomura 152
Financial statements
Margins remain under pressure due to increasing R&D and S&M expenses
New games and expansion packs drive revenue growth
Income statement (US$mn)
Year-end 31 Dec FY08 FY09 FY10F FY11F FY12F
Revenue 211 314 368 442 499Cost of goods sold (25) (43) (64) (69) (77)
Gross profit 185 271 304 374 422SG&A (67) (101) (148) (179) (194)Employee share expenseOperating profit 118 170 156 195 228
EBITDA 133 180 166 207 241Depreciation (15) (10) (10) (11) (13)Amortisation - - - - - EBIT 118 170 156 195 228
Net interest expense 5 2 4 2 2Associates & JCEs (0) (1) (1) - - Other income (2) 2 1 2 2
Earnings before tax 122 173 161 199 232Income tax (8) (10) (14) (17) (21)
Net profit after tax 114 163 147 183 211Minority interests - (0) 2 - - Other items - - - - - Preferred dividends - - - - - Normalised NPAT 114 163 149 183 211Extraordinary items (19) (11) (14) (15) (17)Reported NPAT 95 152 134 167 193
Dividends - - - - -
Transfer to reserves 95 152 134 167 193
Valuation and ratio analysis
FD normalised P/E (x) 12.3 7.7 8.4 6.6 5.7 FD normalised P/E at price target (x) 19.2 12.1 13.1 10.3 9.0 Reported P/E (x) 14.8 8.3 9.3 7.2 6.3 Dividend yield (%) - - - - - Price/cashflow (x) 9.9 6.7 7.3 7.1 7.1 Price/book (x) 5.5 3.6 2.4 1.8 1.4 EV/EBITDA (x) 8.0 5.7 5.4 3.4 2.1 EV/EBIT (x) 9.0 6.0 5.7 3.6 2.2 Gross margin (%) 88.0 86.3 82.7 84.5 84.5 EBITDA margin (%) 63.2 57.2 45.2 46.7 48.3 EBIT margin (%) 56.2 54.2 42.4 44.1 45.7 Net margin (%) 45.0 48.4 36.6 37.8 38.7 Effective tax rate (%) 6.4 5.8 8.7 8.3 9.2 Dividend payout (%) - - - - - Capex to sales (%) 52.9 7.9 7.7 6.4 5.6 Capex to depreciation (x) 7.6 2.6 2.8 2.5 2.2
ROE (%) 43.6 52.3 32.8 29.1 25.0 ROA (pretax %) 116.3 86.7 69.5 78.1 81.2
Growth (%)Revenue 123.0 49.1 17.1 20.3 12.8 EBITDA 165.7 34.9 (7.5) 24.4 16.6
EBIT 141.0 43.6 (8.3) 25.2 16.8
Normalised EPS 102.1 59.3 (8.2) 27.4 15.3 Normalised FDEPS 102.1 59.3 (8.2) 27.4 15.3
Per share
Reported EPS (US$) 1.60 2.85 2.55 3.28 3.79Norm EPS (US$) 1.92 3.06 2.81 3.58 4.13Fully diluted norm EPS (US$) 1.92 3.06 2.81 3.58 4.13Book value per share (US$) 4.34 6.67 9.68 13.32 17.52DPS (US$) - - - - - Source: Nomura estimates
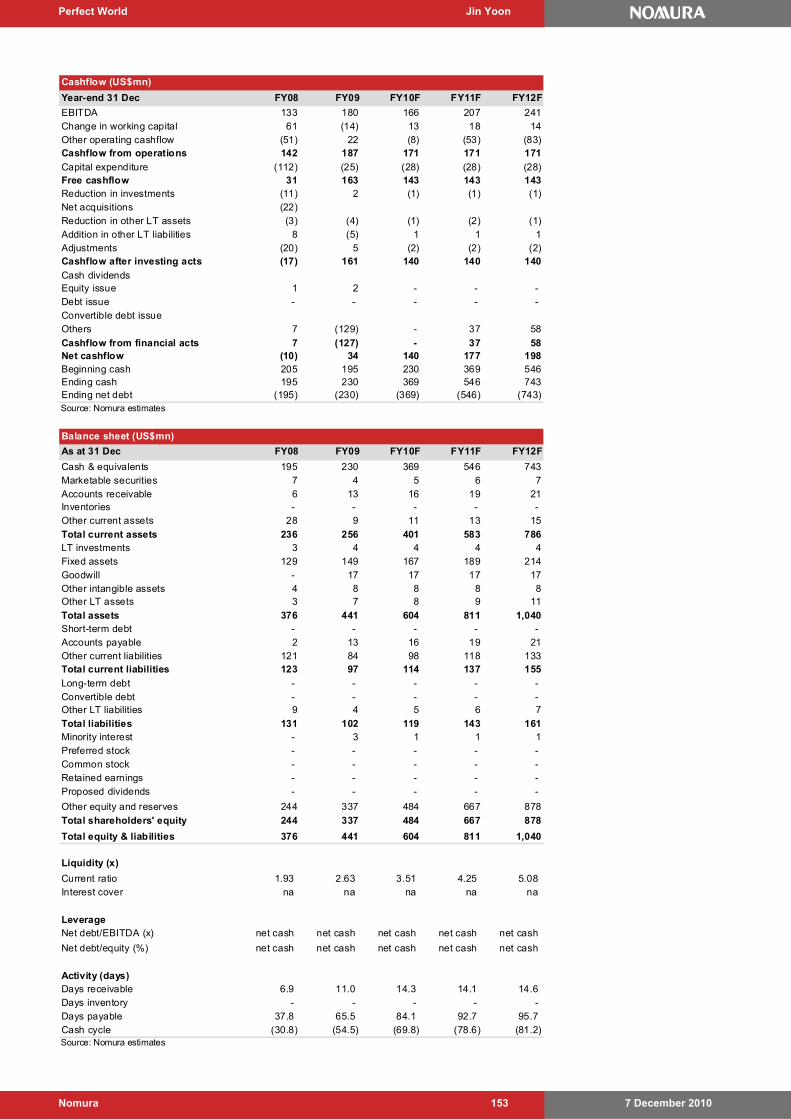
Perfect World Jin Yoon
7 December 2010 Nomura 153
Cashflow (US$mn)
Year-end 31 Dec FY08 FY09 FY10F FY11F FY12F
EBITDA 133 180 166 207 241Change in working capital 61 (14) 13 18 14Other operating cashflow (51) 22 (8) (53) (83)Cashflow from operations 142 187 171 171 171
Capital expenditure (112) (25) (28) (28) (28)Free cashflow 31 163 143 143 143Reduction in investments (11) 2 (1) (1) (1)Net acquisitions (22)Reduction in other LT assets (3) (4) (1) (2) (1)Addition in other LT liabilities 8 (5) 1 1 1Adjustments (20) 5 (2) (2) (2)Cashflow after investing acts (17) 161 140 140 140
Cash dividendsEquity issue 1 2 - - - Debt issue - - - - - Convertible debt issueOthers 7 (129) - 37 58
Cashflow from financial acts 7 (127) - 37 58Net cashflow (10) 34 140 177 198Beginning cash 205 195 230 369 546Ending cash 195 230 369 546 743Ending net debt (195) (230) (369) (546) (743)Source: Nomura estimates
Balance sheet (US$mn)
As at 31 Dec FY08 FY09 FY10F FY11F FY12F
Cash & equivalents 195 230 369 546 743Marketable securities 7 4 5 6 7Accounts receivable 6 13 16 19 21Inventories - - - - - Other current assets 28 9 11 13 15
Total current assets 236 256 401 583 786LT investments 3 4 4 4 4Fixed assets 129 149 167 189 214Goodwill - 17 17 17 17Other intangible assets 4 8 8 8 8Other LT assets 3 7 8 9 11
Total assets 376 441 604 811 1,040Short-term debt - - - - - Accounts payable 2 13 16 19 21Other current liabilities 121 84 98 118 133Total current liabilities 123 97 114 137 155
Long-term debt - - - - - Convertible debt - - - - - Other LT liabilities 9 4 5 6 7
Total liabilities 131 102 119 143 161Minority interest - 3 1 1 1Preferred stock - - - - - Common stock - - - - - Retained earnings - - - - - Proposed dividends - - - - -
Other equity and reserves 244 337 484 667 878
Total shareholders' equity 244 337 484 667 878
Total equity & liabilities 376 441 604 811 1,040
Liquidity (x)
Current ratio 1.93 2.63 3.51 4.25 5.08 Interest cover na na na na na
LeverageNet debt/EBITDA (x) net cash net cash net cash net cash net cash
Net debt/equity (%) net cash net cash net cash net cash net cash
Activity (days)Days receivable 6.9 11.0 14.3 14.1 14.6 Days inventory - - - - - Days payable 37.8 65.5 84.1 92.7 95.7 Cash cycle (30.8) (54.5) (69.8) (78.6) (81.2) Source: Nomura estimates
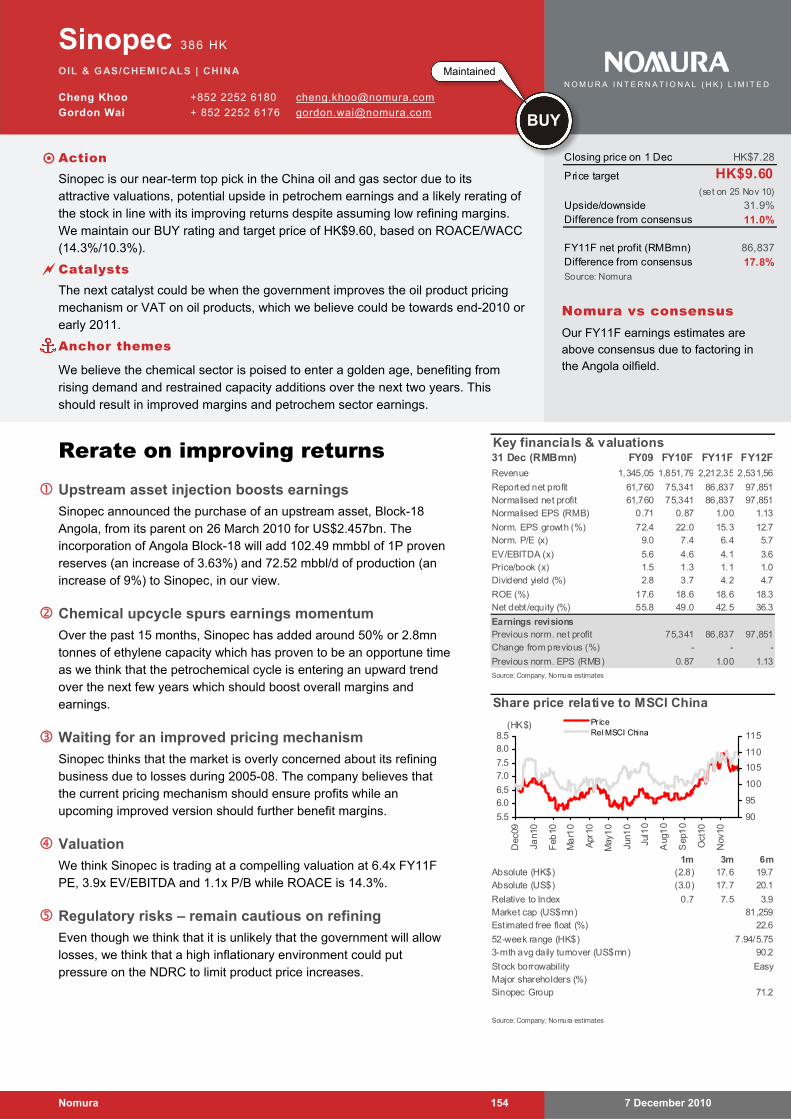
7 December 2010 Nomura 154
Sinopec 386 HK
OIL & GAS/CHEMICALS | CHINA
Cheng Khoo +852 2252 6180 [email protected]
Gordon Wai + 852 2252 6176 [email protected]
Rerate on improving returns Upstream asset injection boosts earnings
Sinopec announced the purchase of an upstream asset, Block-18 Angola, from its parent on 26 March 2010 for US$2.457bn. The incorporation of Angola Block-18 will add 102.49 mmbbl of 1P proven reserves (an increase of 3.63%) and 72.52 mbbl/d of production (an increase of 9%) to Sinopec, in our view.
Chemical upcycle spurs earnings momentum
Over the past 15 months, Sinopec has added around 50% or 2.8mn tonnes of ethylene capacity which has proven to be an opportune time as we think that the petrochemical cycle is entering an upward trend over the next few years which should boost overall margins and earnings.
Waiting for an improved pricing mechanism
Sinopec thinks that the market is overly concerned about its refining business due to losses during 2005-08. The company believes that the current pricing mechanism should ensure profits while an upcoming improved version should further benefit margins.
Valuation
We think Sinopec is trading at a compelling valuation at 6.4x FY11F PE, 3.9x EV/EBITDA and 1.1x P/B while ROACE is 14.3%.
Regulatory risks – remain cautious on refining
Even though we think that it is unlikely that the government will allow losses, we think that a high inflationary environment could put pressure on the NDRC to limit product price increases.
Key financials & valuations31 Dec (RMBmn) FY09 FY10F FY11F FY12F
Revenue 1,345,05 1,851,79 2,212,35 2,531,56
Reported net profit 61,760 75,341 86,837 97,851Normalised net profit 61,760 75,341 86,837 97,851Normalised EPS (RMB) 0.71 0.87 1.00 1.13
Norm. EPS growth (%) 72.4 22.0 15.3 12.7 Norm. P/E (x) 9.0 7.4 6.4 5.7
EV/EBITDA (x) 5.6 4.6 4.1 3.6Price/book (x) 1.5 1.3 1.1 1.0Dividend yield (%) 2.8 3.7 4.2 4.7
ROE (%) 17.6 18.6 18.6 18.3 Net debt/equity (%) 55.8 49.0 42.5 36.3
Earnings revisionsPrevious norm. net profit 75,341 86,837 97,851Change from previous (%) - - -
Previous norm. EPS (RMB) 0.87 1.00 1.13
Source: Company, Nomura estimates
Share price relative to MSCI China
1m 3m 6m (2.8) 17.6 19.7 (3.0) 17.7 20.1
0.7 7.5 3.9
Easy
Source: Company, Nomura estimates
81,25922.6
7.94/5.7590.2
Absolute (HK$)Absolute (US$)
Relative to Index
Estimated free float (%)Market cap (US$mn)
Major shareholders (%)Sinopec Group 71.2
52-week range (HK$)3-mth avg daily turnover (US$mn)
Stock borrowability
5.5
6.06.5
7.07.5
8.08.5
Dec
09
Jan1
0
Feb
10
Ma
r10
Apr
10
May
10
Jun1
0
Jul1
0
Aug
10
Sep
10
Oct
10
Nov
10
90
95
100
105
110
115
PriceRel MSCI China
(HK$)
Closing price on 1 Dec HK$7.28
Price target HK$9.60(set on 25 Nov 10)
Upside/downside 31.9%Difference from consensus 11.0%
FY11F net profit (RMBmn) 86,837Difference from consensus 17.8%Source: Nomura
Nomura vs consensus Our FY11F earnings estimates are above consensus due to factoring in the Angola oilfield.
Maintained
BUY
N O M U R A I N T E R N A T I O N A L ( H K ) L I M I T E D
Action Sinopec is our near-term top pick in the China oil and gas sector due to its
attractive valuations, potential upside in petrochem earnings and a likely rerating of the stock in line with its improving returns despite assuming low refining margins. We maintain our BUY rating and target price of HK$9.60, based on ROACE/WACC (14.3%/10.3%).
Catalysts The next catalyst could be when the government improves the oil product pricing
mechanism or VAT on oil products, which we believe could be towards end-2010 or early 2011.
Anchor themes
We believe the chemical sector is poised to enter a golden age, benefiting from rising demand and restrained capacity additions over the next two years. This should result in improved margins and petrochem sector earnings.
Sinopec Cheng Khoo
7 December 2010 Nomura 155
Drilling down
Refining Sinopec believes that the NDRC will likely continue to follow the mechanism until oil prices exceed US$130/bbl since the government said that oil prices have little indirect impact on CPI. The government is likely to modify the mechanism by shortening the number of days (currently 22 working days) and by narrowing the trigger (currently 4% of oil price fluctuation) which should be positive for the refining sector. While the government has not given a specific timing for the change, it is possible that the new measures will be announced at the end of 2010, we believe.
We think the government is unlikely to let the refiners suffer losses since losses will deter future investments in the sector which will cause shortages in the system. However, it is also unlikely that the government will allow windfall profits like in 1H09 especially in light of the inflationary environment. We think that the government will probably lower the VAT burden on the refiners and allow a narrow margin that moves more in line with international prices. Over the next two years, we are forecasting refining EBIT of around RMB4bn per quarter or RMB16bn per year indicating a marginal operating margin of 1.1%-1.3%.
Marketing We continue to think that the marketing sector will remain stable, growing in line with volume growth. If the government improves the pricing mechanism to discourage hoarding and demand swings, margins will likely remain stable.
Petrochem Sinopec has added 2.8 mn tonnes of ethylene capacity or around +50% over the past two years to around 9mn tonnes. However, there will be no more additions until 2013 when its 800kMt plant in Wuhan comes onstream. Since bottoming out in 2Q and 3Q10, product prices and margins have picked up strongly and the outlook for 4Q and 2011 is looking good. We believe there is significant upside to its chemical earnings over the next few years.
E+P Sinopec has injected its parent's Block 18 Angola asset to enhance its upstream business. The asset produces around 4mntonnes of crude oil per year or around 9% of its domestic production. Further injections are likely even though there is no time line. For future injections, Sinopec will select currently producing assets from "friendly" countries in our view. For domestic assets, oil production growth target is around 1-2% per year while targeting RRR of 1x. For natural gas, 2010 volume will likely jump 40% due to the new Puguang field. It will further contribute another 20% production growth in 2011F. The wellhead price in Puguang is RMB1.51/m3 while the transportation tariff was set at RMB0.86/m3, indicating a city gate price of RMB2.37/m3.
Earnings We are forecasting a 22% earnings increase in 2010F, 15% in 2011F and 13% in 2012F and believe that there could be potential upside to our forecast mainly on the back of a petrochemical upturn. Our 12-M target price of HK$9.60 is based on 2011F ROACE/WACC (14.3%/10.3%). In our view, Sinopec is trading at a compelling valuation of 6.4x FY11F PE, 3.9x EV/EBITDA and 1.1x P/B while ROACE is 14.3%.
Downside risks to our view include: 1) rising inflation; 2) chemical downcycle and 3) resources tax. Upside risks: 1) potential change in oil product pricing mechanism and 2) lifting of the windfall tax hurdle rate.
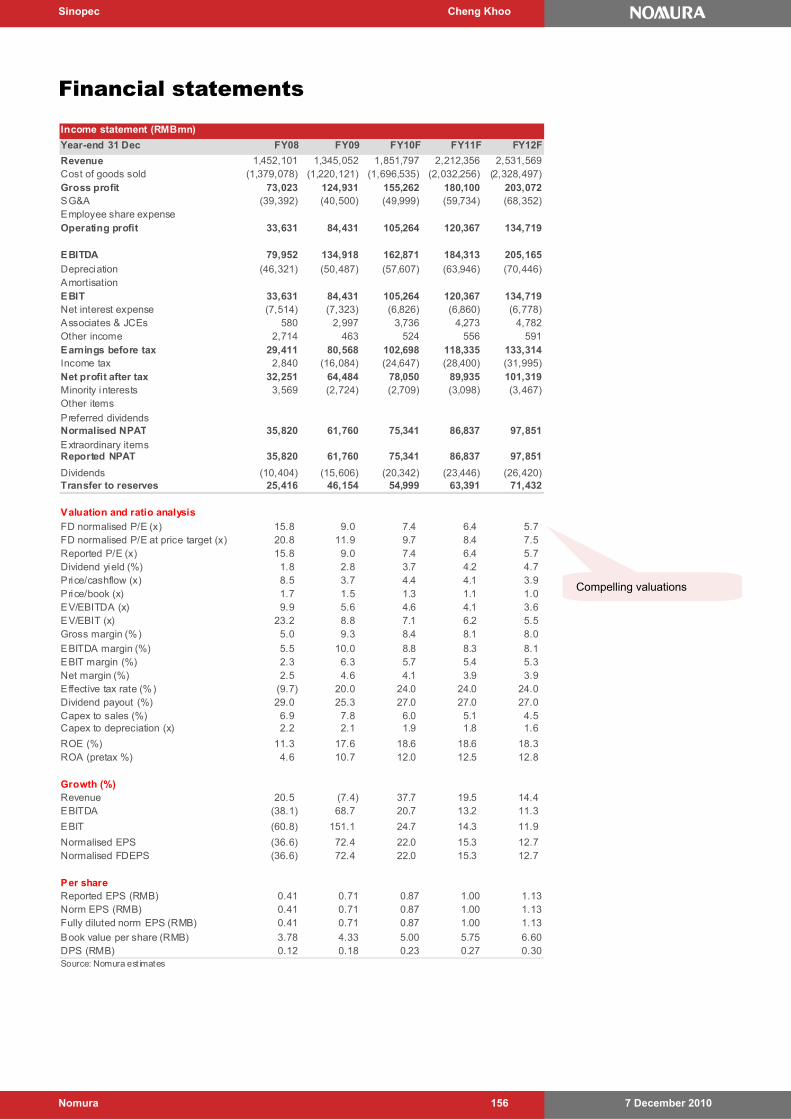
Sinopec Cheng Khoo
7 December 2010 Nomura 156
Financial statements
Income statement (RMBmn)
Year-end 31 Dec FY08 FY09 FY10F FY11F FY12F
Revenue 1,452,101 1,345,052 1,851,797 2,212,356 2,531,569Cost of goods sold (1,379,078) (1,220,121) (1,696,535) (2,032,256) (2,328,497)Gross profit 73,023 124,931 155,262 180,100 203,072SG&A (39,392) (40,500) (49,999) (59,734) (68,352)Employee share expenseOperating profit 33,631 84,431 105,264 120,367 134,719
EBITDA 79,952 134,918 162,871 184,313 205,165
Depreciation (46,321) (50,487) (57,607) (63,946) (70,446)AmortisationEBIT 33,631 84,431 105,264 120,367 134,719Net interest expense (7,514) (7,323) (6,826) (6,860) (6,778)Associates & JCEs 580 2,997 3,736 4,273 4,782Other income 2,714 463 524 556 591Earnings before tax 29,411 80,568 102,698 118,335 133,314Income tax 2,840 (16,084) (24,647) (28,400) (31,995)Net profit after tax 32,251 64,484 78,050 89,935 101,319Minority interests 3,569 (2,724) (2,709) (3,098) (3,467)Other items
Preferred dividendsNormalised NPAT 35,820 61,760 75,341 86,837 97,851
Extraordinary itemsReported NPAT 35,820 61,760 75,341 86,837 97,851
Dividends (10,404) (15,606) (20,342) (23,446) (26,420)Transfer to reserves 25,416 46,154 54,999 63,391 71,432
Valuation and ratio analysis
FD normalised P/E (x) 15.8 9.0 7.4 6.4 5.7 FD normalised P/E at price target (x) 20.8 11.9 9.7 8.4 7.5 Reported P/E (x) 15.8 9.0 7.4 6.4 5.7 Dividend yield (%) 1.8 2.8 3.7 4.2 4.7 Price/cashflow (x) 8.5 3.7 4.4 4.1 3.9 Price/book (x) 1.7 1.5 1.3 1.1 1.0 EV/EBITDA (x) 9.9 5.6 4.6 4.1 3.6 EV/EBIT (x) 23.2 8.8 7.1 6.2 5.5 Gross margin (%) 5.0 9.3 8.4 8.1 8.0
EBITDA margin (%) 5.5 10.0 8.8 8.3 8.1 EBIT margin (%) 2.3 6.3 5.7 5.4 5.3 Net margin (%) 2.5 4.6 4.1 3.9 3.9 E ffective tax rate (%) (9.7) 20.0 24.0 24.0 24.0 Dividend payout (%) 29.0 25.3 27.0 27.0 27.0 Capex to sales (%) 6.9 7.8 6.0 5.1 4.5 Capex to depreciation (x) 2.2 2.1 1.9 1.8 1.6
ROE (%) 11.3 17.6 18.6 18.6 18.3 ROA (pretax %) 4.6 10.7 12.0 12.5 12.8
Growth (%)Revenue 20.5 (7.4) 37.7 19.5 14.4 EBITDA (38.1) 68.7 20.7 13.2 11.3
EBIT (60.8) 151.1 24.7 14.3 11.9
Normalised EPS (36.6) 72.4 22.0 15.3 12.7 Normalised FDEPS (36.6) 72.4 22.0 15.3 12.7
Per shareReported EPS (RMB) 0.41 0.71 0.87 1.00 1.13Norm EPS (RMB) 0.41 0.71 0.87 1.00 1.13Fully diluted norm EPS (RMB) 0.41 0.71 0.87 1.00 1.13
Book value per share (RMB) 3.78 4.33 5.00 5.75 6.60DPS (RMB) 0.12 0.18 0.23 0.27 0.30Source: Nomura est imates
Compelling valuations
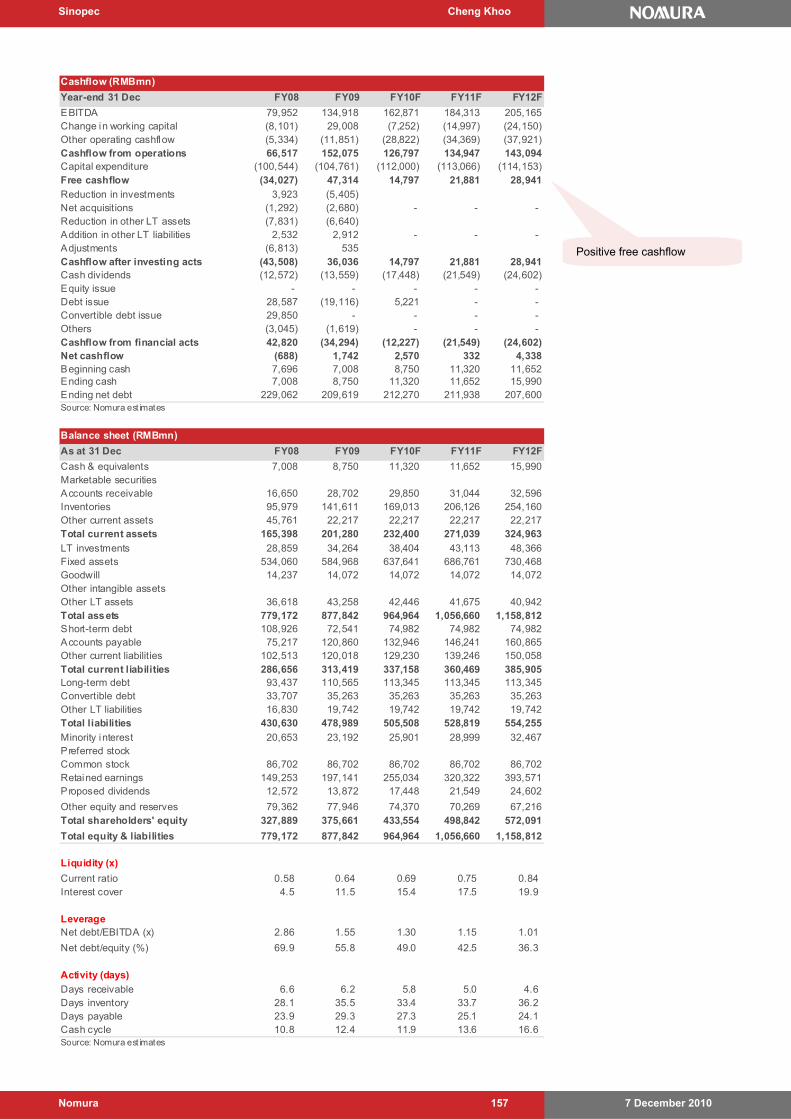
Sinopec Cheng Khoo
7 December 2010 Nomura 157
Cashflow (RMBmn)
Year-end 31 Dec FY08 FY09 FY10F FY11F FY12F
EBITDA 79,952 134,918 162,871 184,313 205,165Change in working capital (8,101) 29,008 (7,252) (14,997) (24,150)Other operating cashflow (5,334) (11,851) (28,822) (34,369) (37,921)Cashflow from operations 66,517 152,075 126,797 134,947 143,094Capital expenditure (100,544) (104,761) (112,000) (113,066) (114,153)Free cashflow (34,027) 47,314 14,797 21,881 28,941
Reduction in investments 3,923 (5,405)Net acquisitions (1,292) (2,680) - - - Reduction in other LT assets (7,831) (6,640)Addition in other LT liabilities 2,532 2,912 - - - Adjustments (6,813) 535Cashflow after investing acts (43,508) 36,036 14,797 21,881 28,941Cash dividends (12,572) (13,559) (17,448) (21,549) (24,602)Equity issue - - - - - Debt issue 28,587 (19,116) 5,221 - - Convertible debt issue 29,850 - - - - Others (3,045) (1,619) - - - Cashflow from financial acts 42,820 (34,294) (12,227) (21,549) (24,602)Net cashflow (688) 1,742 2,570 332 4,338Beginning cash 7,696 7,008 8,750 11,320 11,652Ending cash 7,008 8,750 11,320 11,652 15,990Ending net debt 229,062 209,619 212,270 211,938 207,600Source: Nomura est imates
Balance sheet (RMBmn)
As at 31 Dec FY08 FY09 FY10F FY11F FY12F
Cash & equivalents 7,008 8,750 11,320 11,652 15,990Marketable securitiesAccounts receivable 16,650 28,702 29,850 31,044 32,596Inventories 95,979 141,611 169,013 206,126 254,160Other current assets 45,761 22,217 22,217 22,217 22,217Total current assets 165,398 201,280 232,400 271,039 324,963
LT investments 28,859 34,264 38,404 43,113 48,366Fixed assets 534,060 584,968 637,641 686,761 730,468Goodwill 14,237 14,072 14,072 14,072 14,072Other intangible assetsOther LT assets 36,618 43,258 42,446 41,675 40,942Total assets 779,172 877,842 964,964 1,056,660 1,158,812Short-term debt 108,926 72,541 74,982 74,982 74,982Accounts payable 75,217 120,860 132,946 146,241 160,865Other current liabilities 102,513 120,018 129,230 139,246 150,058Total current liabilities 286,656 313,419 337,158 360,469 385,905Long-term debt 93,437 110,565 113,345 113,345 113,345Convertible debt 33,707 35,263 35,263 35,263 35,263Other LT liabilities 16,830 19,742 19,742 19,742 19,742Total liabilities 430,630 478,989 505,508 528,819 554,255
Minority interest 20,653 23,192 25,901 28,999 32,467Preferred stockCommon stock 86,702 86,702 86,702 86,702 86,702Retained earnings 149,253 197,141 255,034 320,322 393,571Proposed dividends 12,572 13,872 17,448 21,549 24,602
Other equity and reserves 79,362 77,946 74,370 70,269 67,216Total shareholders' equity 327,889 375,661 433,554 498,842 572,091
Total equity & liabilities 779,172 877,842 964,964 1,056,660 1,158,812
Liquidity (x)
Current ratio 0.58 0.64 0.69 0.75 0.84 Interest cover 4.5 11.5 15.4 17.5 19.9
LeverageNet debt/EBITDA (x) 2.86 1.55 1.30 1.15 1.01
Net debt/equity (%) 69.9 55.8 49.0 42.5 36.3
Activity (days)
Days receivable 6.6 6.2 5.8 5.0 4.6 Days inventory 28.1 35.5 33.4 33.7 36.2 Days payable 23.9 29.3 27.3 25.1 24.1 Cash cycle 10.8 12.4 11.9 13.6 16.6 Source: Nomura est imates
Positive free cashflow
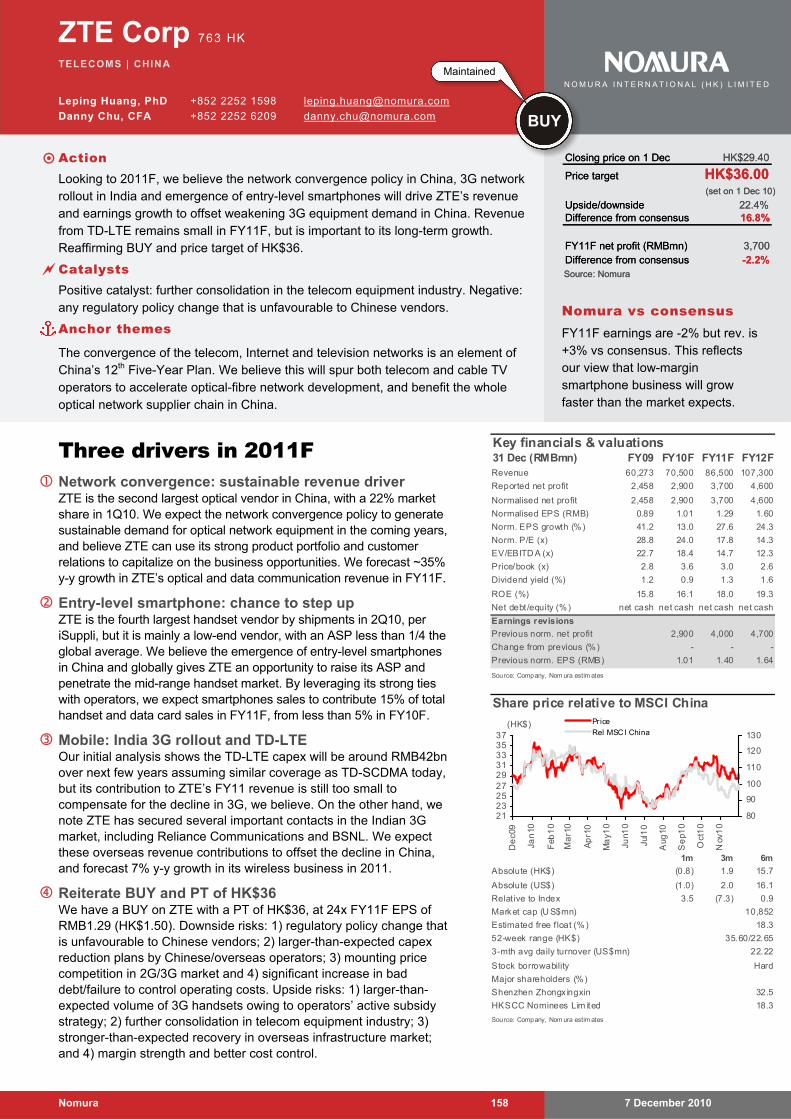
7 December 2010 Nomura 158
ZTE Corp 763 HK
TELECOMS | CHINA
Leping Huang, PhD +852 2252 1598 [email protected]
Danny Chu, CFA +852 2252 6209 [email protected]
Three drivers in 2011F Network convergence: sustainable revenue driver
ZTE is the second largest optical vendor in China, with a 22% market share in 1Q10. We expect the network convergence policy to generate sustainable demand for optical network equipment in the coming years, and believe ZTE can use its strong product portfolio and customer relations to capitalize on the business opportunities. We forecast ~35% y-y growth in ZTE’s optical and data communication revenue in FY11F.
Entry-level smartphone: chance to step up ZTE is the fourth largest handset vendor by shipments in 2Q10, per iSuppli, but it is mainly a low-end vendor, with an ASP less than 1/4 the global average. We believe the emergence of entry-level smartphones in China and globally gives ZTE an opportunity to raise its ASP and penetrate the mid-range handset market. By leveraging its strong ties with operators, we expect smartphones sales to contribute 15% of total handset and data card sales in FY11F, from less than 5% in FY10F.
Mobile: India 3G rollout and TD-LTE Our initial analysis shows the TD-LTE capex will be around RMB42bn over next few years assuming similar coverage as TD-SCDMA today, but its contribution to ZTE’s FY11 revenue is still too small to compensate for the decline in 3G, we believe. On the other hand, we note ZTE has secured several important contacts in the Indian 3G market, including Reliance Communications and BSNL. We expect these overseas revenue contributions to offset the decline in China, and forecast 7% y-y growth in its wireless business in 2011.
Reiterate BUY and PT of HK$36 We have a BUY on ZTE with a PT of HK$36, at 24x FY11F EPS of RMB1.29 (HK$1.50). Downside risks: 1) regulatory policy change that is unfavourable to Chinese vendors; 2) larger-than-expected capex reduction plans by Chinese/overseas operators; 3) mounting price competition in 2G/3G market and 4) significant increase in bad debt/failure to control operating costs. Upside risks: 1) larger-than-expected volume of 3G handsets owing to operators’ active subsidy strategy; 2) further consolidation in telecom equipment industry; 3) stronger-than-expected recovery in overseas infrastructure market; and 4) margin strength and better cost control.
Key financials & valuations31 Dec (RMBmn) FY09 FY10F FY11F FY12FRevenue 60,273 70,500 86,500 107,300
Reported net profit 2,458 2,900 3,700 4,600
Normalised net profit 2,458 2,900 3,700 4,600
Normalised EPS (RMB) 0.89 1.01 1.29 1.60
Norm. EPS growth (%) 41.2 13.0 27.6 24.3
Norm. P/E (x) 28.8 24.0 17.8 14.3
EV/EBITD A (x) 22.7 18.4 14.7 12.3
Price/book (x) 2.8 3.6 3.0 2.6
Dividend yield (%) 1.2 0.9 1.3 1.6
ROE (%) 15.8 16.1 18.0 19.3
Net debt/equity (%) net cash net cash net cash net cash
Earnings revisions
Previous norm. net profit 2,900 4,000 4,700
Change from previous (%) - - -
Previous norm. EPS (RMB) 1.01 1.40 1.64
Source: Company, Nom ura estim ates
Share price relative to MSCI China
1m 3m 6m
(0.8) 1.9 15.7
(1.0) 2.0 16.1
3.5 (7.3) 0.9
Hard
Source: Company, Nom ura estim ates
52-week range (HK$)
3-mth avg daily turnover (US$mn)
HKSCC Nominees Lim ited
Stock borrowability
18.3
Major shareholders (%)
Shenzhen Zhongx ingxin 32.5
Absolute (HK$)
Absolute (US$)
Relat ive to Index
Estimated free f loat (%)
Market cap (U S$mn) 10,852
18.3
35.60/22.65
22.22
212325272931333537
De
c09
Jan
10
Feb
10
Ma
r10
Ap
r10
Ma
y10
Jun1
0
Jul1
0
Aug
10
Se
p10
Oct
10
Nov
10
80
90
100
110
120
130
Price
Rel MSCI China(HK$)
Closing price on 1 Dec HK$29.40
Price target HK$36.00(set on 1 Dec 10)
Upside/downside 22.4%Difference from consensus 16.8%
FY11F net profit (RMBmn) 3,700Difference from consensus -2.2%Source: Nomura
Closing price on 1 Dec HK$29.40
Price target HK$36.00(set on 1 Dec 10)
Upside/downside 22.4%Difference from consensus 16.8%
FY11F net profit (RMBmn) 3,700Difference from consensus -2.2%Source: Nomura
Nomura vs consensus FY11F earnings are -2% but rev. is +3% vs consensus. This reflects our view that low-margin smartphone business will grow faster than the market expects.
Maintained
BUY
N O M U R A I N T E R N A T I O N A L ( H K ) L I M I T E D
Action Looking to 2011F, we believe the network convergence policy in China, 3G network
rollout in India and emergence of entry-level smartphones will drive ZTE’s revenue and earnings growth to offset weakening 3G equipment demand in China. Revenue from TD-LTE remains small in FY11F, but is important to its long-term growth. Reaffirming BUY and price target of HK$36.
Catalysts Positive catalyst: further consolidation in the telecom equipment industry. Negative:
any regulatory policy change that is unfavourable to Chinese vendors.
Anchor themes
The convergence of the telecom, Internet and television networks is an element of China’s 12th Five-Year Plan. We believe this will spur both telecom and cable TV operators to accelerate optical-fibre network development, and benefit the whole optical network supplier chain in China.
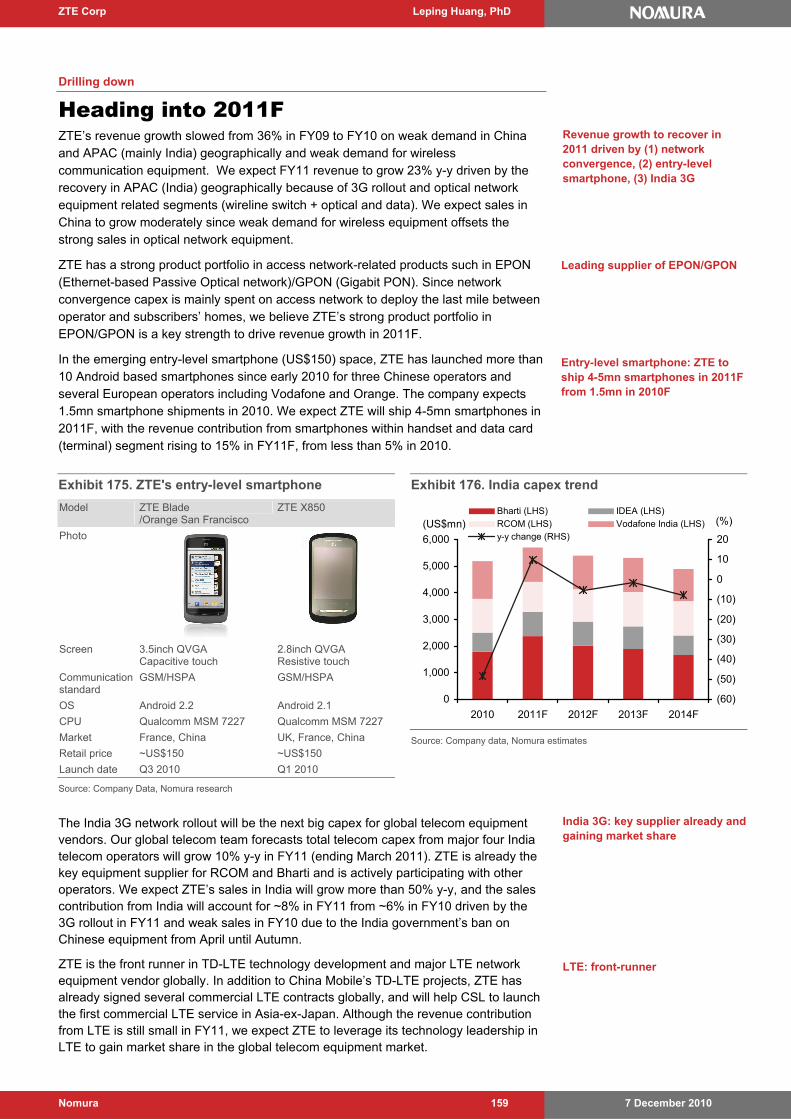
ZTE Corp Leping Huang, PhD
7 December 2010 Nomura 159
Drilling down
Heading into 2011F ZTE’s revenue growth slowed from 36% in FY09 to FY10 on weak demand in China and APAC (mainly India) geographically and weak demand for wireless communication equipment. We expect FY11 revenue to grow 23% y-y driven by the recovery in APAC (India) geographically because of 3G rollout and optical network equipment related segments (wireline switch + optical and data). We expect sales in China to grow moderately since weak demand for wireless equipment offsets the strong sales in optical network equipment.
ZTE has a strong product portfolio in access network-related products such in EPON (Ethernet-based Passive Optical network)/GPON (Gigabit PON). Since network convergence capex is mainly spent on access network to deploy the last mile between operator and subscribers’ homes, we believe ZTE’s strong product portfolio in EPON/GPON is a key strength to drive revenue growth in 2011F.
In the emerging entry-level smartphone (US$150) space, ZTE has launched more than 10 Android based smartphones since early 2010 for three Chinese operators and several European operators including Vodafone and Orange. The company expects 1.5mn smartphone shipments in 2010. We expect ZTE will ship 4-5mn smartphones in 2011F, with the revenue contribution from smartphones within handset and data card (terminal) segment rising to 15% in FY11F, from less than 5% in 2010.
Exhibit 175. ZTE's entry-level smartphone
Model ZTE Blade /Orange San Francisco
ZTE X850
Photo
Screen 3.5inch QVGA Capacitive touch
2.8inch QVGA Resistive touch
Communication standard
GSM/HSPA GSM/HSPA
OS Android 2.2 Android 2.1
CPU Qualcomm MSM 7227 Qualcomm MSM 7227
Market France, China UK, France, China
Retail price ~US$150 ~US$150
Launch date Q3 2010 Q1 2010 Source: Company Data, Nomura research
Exhibit 176. India capex trend
0
1,000
2,000
3,000
4,000
5,000
6,000
2010 2011F 2012F 2013F 2014F
(US$mn)
(60)
(50)
(40)
(30)
(20)
(10)
0
10
20
(%)Bharti (LHS) IDEA (LHS)RCOM (LHS) Vodafone India (LHS)y-y change (RHS)
Source: Company data, Nomura estimates
The India 3G network rollout will be the next big capex for global telecom equipment vendors. Our global telecom team forecasts total telecom capex from major four India telecom operators will grow 10% y-y in FY11 (ending March 2011). ZTE is already the key equipment supplier for RCOM and Bharti and is actively participating with other operators. We expect ZTE’s sales in India will grow more than 50% y-y, and the sales contribution from India will account for ~8% in FY11 from ~6% in FY10 driven by the 3G rollout in FY11 and weak sales in FY10 due to the India government’s ban on Chinese equipment from April until Autumn.
ZTE is the front runner in TD-LTE technology development and major LTE network equipment vendor globally. In addition to China Mobile’s TD-LTE projects, ZTE has already signed several commercial LTE contracts globally, and will help CSL to launch the first commercial LTE service in Asia-ex-Japan. Although the revenue contribution from LTE is still small in FY11, we expect ZTE to leverage its technology leadership in LTE to gain market share in the global telecom equipment market.
Entry-level smartphone: ZTE to ship 4-5mn smartphones in 2011F from 1.5mn in 2010F
LTE: front-runner
India 3G: key supplier already and gaining market share
Revenue growth to recover in 2011 driven by (1) network convergence, (2) entry-level smartphone, (3) India 3G
Leading supplier of EPON/GPON
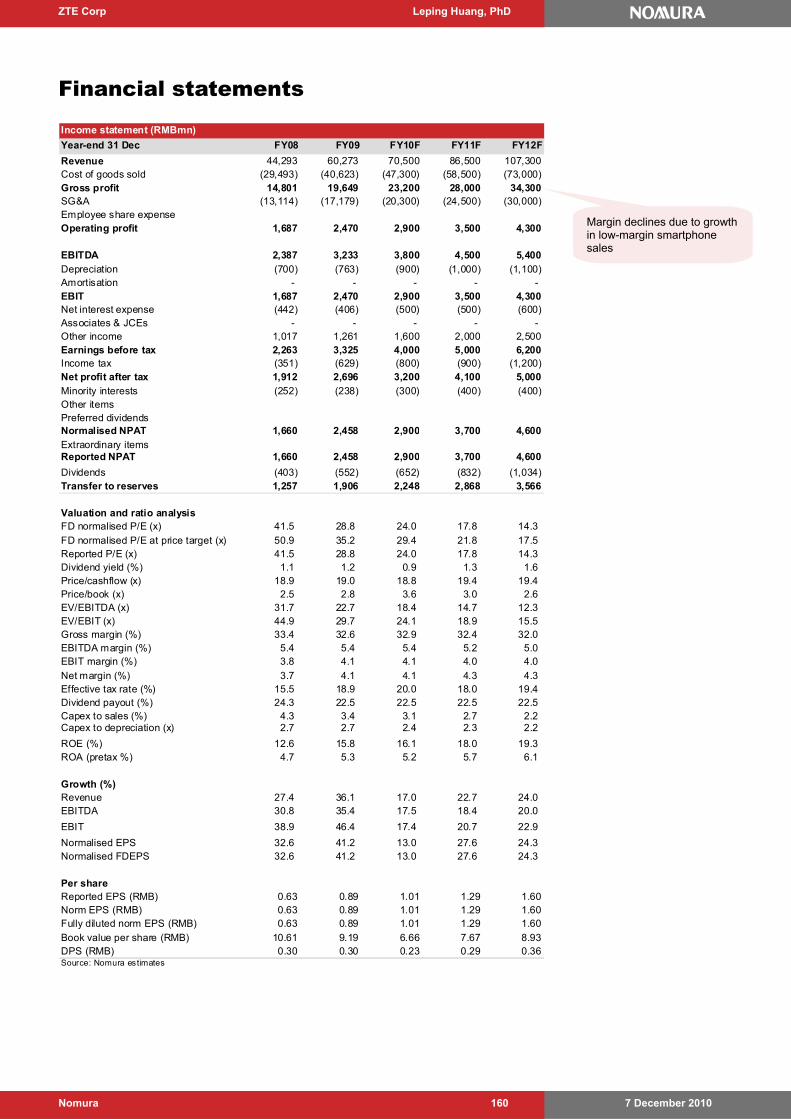
ZTE Corp Leping Huang, PhD
7 December 2010 Nomura 160
Financial statements
Margin declines due to growth in low-margin smartphone sales
Income statement (RMBmn)
Year-end 31 Dec FY08 FY09 FY10F FY11F FY12F
Revenue 44,293 60,273 70,500 86,500 107,300Cost of goods sold (29,493) (40,623) (47,300) (58,500) (73,000)Gross profit 14,801 19,649 23,200 28,000 34,300SG&A (13,114) (17,179) (20,300) (24,500) (30,000)Employee share expenseOperating profit 1,687 2,470 2,900 3,500 4,300
EBITDA 2,387 3,233 3,800 4,500 5,400Depreciation (700) (763) (900) (1,000) (1,100)Amortisation - - - - - EBIT 1,687 2,470 2,900 3,500 4,300Net interest expense (442) (406) (500) (500) (600)Associates & JCEs - - - - - Other income 1,017 1,261 1,600 2,000 2,500Earnings before tax 2,263 3,325 4,000 5,000 6,200Income tax (351) (629) (800) (900) (1,200)Net profit after tax 1,912 2,696 3,200 4,100 5,000Minority interests (252) (238) (300) (400) (400)Other itemsPreferred dividendsNormalised NPAT 1,660 2,458 2,900 3,700 4,600Extraordinary itemsReported NPAT 1,660 2,458 2,900 3,700 4,600
Dividends (403) (552) (652) (832) (1,034)Transfer to reserves 1,257 1,906 2,248 2,868 3,566
Valuation and ratio analysisFD normalised P/E (x) 41.5 28.8 24.0 17.8 14.3
FD normalised P/E at price target (x) 50.9 35.2 29.4 21.8 17.5 Reported P/E (x) 41.5 28.8 24.0 17.8 14.3 Dividend yield (%) 1.1 1.2 0.9 1.3 1.6 Price/cashflow (x) 18.9 19.0 18.8 19.4 19.4 Price/book (x) 2.5 2.8 3.6 3.0 2.6 EV/EBITDA (x) 31.7 22.7 18.4 14.7 12.3 EV/EBIT (x) 44.9 29.7 24.1 18.9 15.5 Gross margin (%) 33.4 32.6 32.9 32.4 32.0 EBITDA margin (%) 5.4 5.4 5.4 5.2 5.0 EBIT margin (%) 3.8 4.1 4.1 4.0 4.0
Net margin (%) 3.7 4.1 4.1 4.3 4.3 Effective tax rate (%) 15.5 18.9 20.0 18.0 19.4 Dividend payout (%) 24.3 22.5 22.5 22.5 22.5 Capex to sales (%) 4.3 3.4 3.1 2.7 2.2 Capex to depreciation (x) 2.7 2.7 2.4 2.3 2.2
ROE (%) 12.6 15.8 16.1 18.0 19.3 ROA (pretax %) 4.7 5.3 5.2 5.7 6.1
Growth (%)Revenue 27.4 36.1 17.0 22.7 24.0 EBITDA 30.8 35.4 17.5 18.4 20.0
EBIT 38.9 46.4 17.4 20.7 22.9
Normalised EPS 32.6 41.2 13.0 27.6 24.3 Normalised FDEPS 32.6 41.2 13.0 27.6 24.3
Per shareReported EPS (RMB) 0.63 0.89 1.01 1.29 1.60Norm EPS (RMB) 0.63 0.89 1.01 1.29 1.60Fully diluted norm EPS (RMB) 0.63 0.89 1.01 1.29 1.60
Book value per share (RMB) 10.61 9.19 6.66 7.67 8.93DPS (RMB) 0.30 0.30 0.23 0.29 0.36Source: Nomura estimates
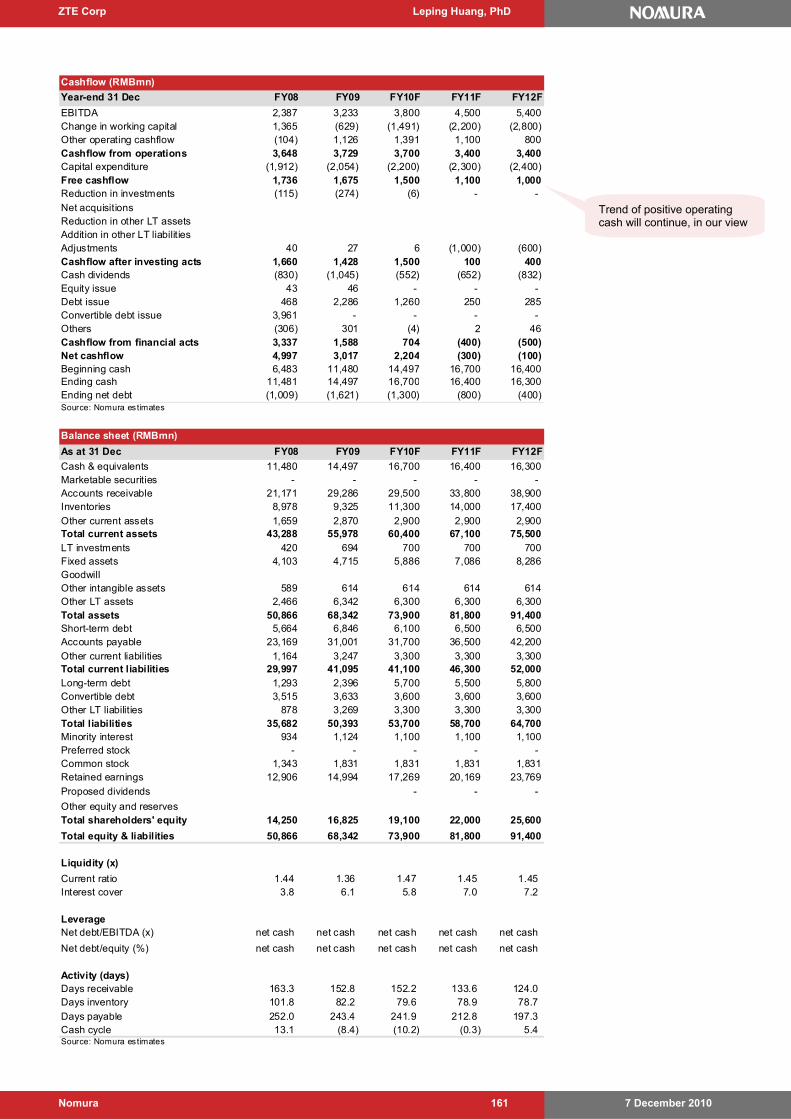
ZTE Corp Leping Huang, PhD
7 December 2010 Nomura 161
Trend of positive operating cash will continue, in our view
Cashflow (RMBmn)
Year-end 31 Dec FY08 FY09 FY10F FY11F FY12F
EBITDA 2,387 3,233 3,800 4,500 5,400Change in working capital 1,365 (629) (1,491) (2,200) (2,800)Other operating cashflow (104) 1,126 1,391 1,100 800Cashflow from operations 3,648 3,729 3,700 3,400 3,400Capital expenditure (1,912) (2,054) (2,200) (2,300) (2,400)Free cashflow 1,736 1,675 1,500 1,100 1,000Reduction in investments (115) (274) (6) - -
Net acquisitionsReduction in other LT assetsAddition in other LT liabilitiesAdjustments 40 27 6 (1,000) (600)Cashflow after investing acts 1,660 1,428 1,500 100 400Cash dividends (830) (1,045) (552) (652) (832)Equity issue 43 46 - - - Debt issue 468 2,286 1,260 250 285Convertible debt issue 3,961 - - - - Others (306) 301 (4) 2 46Cashflow from financial acts 3,337 1,588 704 (400) (500)Net cashflow 4,997 3,017 2,204 (300) (100)Beginning cash 6,483 11,480 14,497 16,700 16,400Ending cash 11,481 14,497 16,700 16,400 16,300Ending net debt (1,009) (1,621) (1,300) (800) (400)Source: Nomura estimates
Balance sheet (RMBmn)
As at 31 Dec FY08 FY09 FY10F FY11F FY12F
Cash & equivalents 11,480 14,497 16,700 16,400 16,300Marketable securities - - - - - Accounts receivable 21,171 29,286 29,500 33,800 38,900Inventories 8,978 9,325 11,300 14,000 17,400
Other current assets 1,659 2,870 2,900 2,900 2,900Total current assets 43,288 55,978 60,400 67,100 75,500LT investments 420 694 700 700 700Fixed assets 4,103 4,715 5,886 7,086 8,286GoodwillOther intangible assets 589 614 614 614 614Other LT assets 2,466 6,342 6,300 6,300 6,300Total assets 50,866 68,342 73,900 81,800 91,400Short-term debt 5,664 6,846 6,100 6,500 6,500Accounts payable 23,169 31,001 31,700 36,500 42,200
Other current liabilities 1,164 3,247 3,300 3,300 3,300Total current liabilities 29,997 41,095 41,100 46,300 52,000Long-term debt 1,293 2,396 5,700 5,500 5,800Convertible debt 3,515 3,633 3,600 3,600 3,600Other LT liabilities 878 3,269 3,300 3,300 3,300Total liabilities 35,682 50,393 53,700 58,700 64,700Minority interest 934 1,124 1,100 1,100 1,100Preferred stock - - - - - Common stock 1,343 1,831 1,831 1,831 1,831Retained earnings 12,906 14,994 17,269 20,169 23,769
Proposed dividends - - -
Other equity and reservesTotal shareholders' equity 14,250 16,825 19,100 22,000 25,600
Total equity & liabilities 50,866 68,342 73,900 81,800 91,400
Liquidity (x)
Current ratio 1.44 1.36 1.47 1.45 1.45 Interest cover 3.8 6.1 5.8 7.0 7.2
LeverageNet debt/EBITDA (x) net cash net cash net cash net cash net cash
Net debt/equity (%) net cash net cash net cash net cash net cash
Activity (days)Days receivable 163.3 152.8 152.2 133.6 124.0 Days inventory 101.8 82.2 79.6 78.9 78.7
Days payable 252.0 243.4 241.9 212.8 197.3 Cash cycle 13.1 (8.4) (10.2) (0.3) 5.4 Source: Nomura estimates
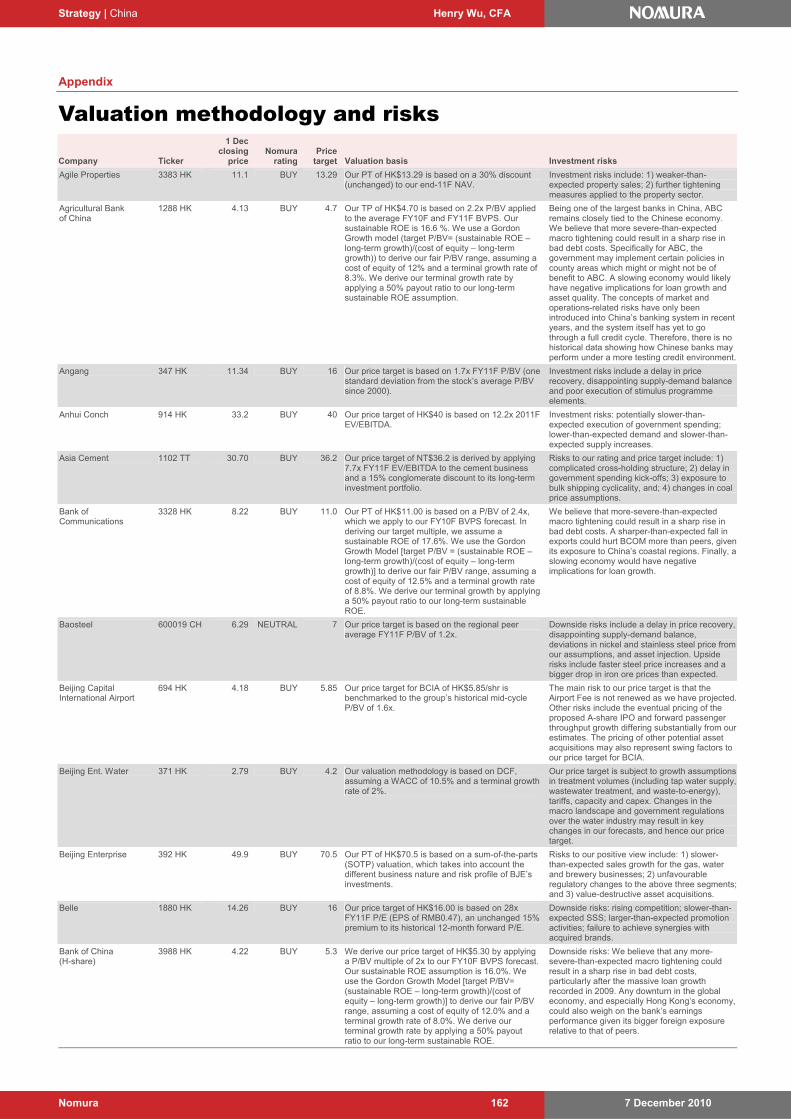
7 December 2010 Nomura 162
Strategy | China Henry Wu, CFA
Appendix
Valuation methodology and risks
Company Ticker
1 Dec closing
price Nomura
rating Price
target Valuation basis Investment risks
Agile Properties 3383 HK 11.1 BUY 13.29 Our PT of HK$13.29 is based on a 30% discount (unchanged) to our end-11F NAV.
Investment risks include: 1) weaker-than-expected property sales; 2) further tightening measures applied to the property sector.
Agricultural Bank of China
1288 HK 4.13 BUY 4.7 Our TP of HK$4.70 is based on 2.2x P/BV applied to the average FY10F and FY11F BVPS. Our sustainable ROE is 16.6 %. We use a Gordon Growth model (target P/BV= (sustainable ROE – long-term growth)/(cost of equity – long-term growth)) to derive our fair P/BV range, assuming a cost of equity of 12% and a terminal growth rate of 8.3%. We derive our terminal growth rate by applying a 50% payout ratio to our long-term sustainable ROE assumption.
Being one of the largest banks in China, ABC remains closely tied to the Chinese economy. We believe that more severe-than-expected macro tightening could result in a sharp rise in bad debt costs. Specifically for ABC, the government may implement certain policies in county areas which might or might not be of benefit to ABC. A slowing economy would likely have negative implications for loan growth and asset quality. The concepts of market and operations-related risks have only been introduced into China’s banking system in recent years, and the system itself has yet to go through a full credit cycle. Therefore, there is no historical data showing how Chinese banks may perform under a more testing credit environment.
Angang 347 HK 11.34 BUY 16 Our price target is based on 1.7x FY11F P/BV (one standard deviation from the stock’s average P/BV since 2000).
Investment risks include a delay in price recovery, disappointing supply-demand balance and poor execution of stimulus programme elements.
Anhui Conch 914 HK 33.2 BUY 40 Our price target of HK$40 is based on 12.2x 2011F EV/EBITDA.
Investment risks: potentially slower-than-expected execution of government spending; lower-than-expected demand and slower-than-expected supply increases.
Asia Cement 1102 TT 30.70 BUY 36.2 Our price target of NT$36.2 is derived by applying 7.7x FY11F EV/EBITDA to the cement business and a 15% conglomerate discount to its long-term investment portfolio.
Risks to our rating and price target include: 1) complicated cross-holding structure; 2) delay in government spending kick-offs; 3) exposure to bulk shipping cyclicality, and; 4) changes in coal price assumptions.
Bank of Communications
3328 HK 8.22 BUY 11.0 Our PT of HK$11.00 is based on a P/BV of 2.4x, which we apply to our FY10F BVPS forecast. In deriving our target multiple, we assume a sustainable ROE of 17.6%. We use the Gordon Growth Model [target P/BV = (sustainable ROE – long-term growth)/(cost of equity – long-term growth)] to derive our fair P/BV range, assuming a cost of equity of 12.5% and a terminal growth rate of 8.8%. We derive our terminal growth by applying a 50% payout ratio to our long-term sustainable ROE.
We believe that more-severe-than-expected macro tightening could result in a sharp rise in bad debt costs. A sharper-than-expected fall in exports could hurt BCOM more than peers, given its exposure to China’s coastal regions. Finally, a slowing economy would have negative implications for loan growth.
Baosteel 600019 CH 6.29 NEUTRAL 7 Our price target is based on the regional peer average FY11F P/BV of 1.2x.
Downside risks include a delay in price recovery, disappointing supply-demand balance, deviations in nickel and stainless steel price from our assumptions, and asset injection. Upside risks include faster steel price increases and a bigger drop in iron ore prices than expected.
Beijing Capital International Airport
694 HK 4.18 BUY 5.85 Our price target for BCIA of HK$5.85/shr is benchmarked to the group’s historical mid-cycle P/BV of 1.6x.
The main risk to our price target is that the Airport Fee is not renewed as we have projected. Other risks include the eventual pricing of the proposed A-share IPO and forward passenger throughput growth differing substantially from our estimates. The pricing of other potential asset acquisitions may also represent swing factors to our price target for BCIA.
Beijing Ent. Water 371 HK 2.79 BUY 4.2 Our valuation methodology is based on DCF, assuming a WACC of 10.5% and a terminal growth rate of 2%.
Our price target is subject to growth assumptions in treatment volumes (including tap water supply, wastewater treatment, and waste-to-energy), tariffs, capacity and capex. Changes in the macro landscape and government regulations over the water industry may result in key changes in our forecasts, and hence our price target.
Beijing Enterprise 392 HK 49.9 BUY 70.5 Our PT of HK$70.5 is based on a sum-of-the-parts (SOTP) valuation, which takes into account the different business nature and risk profile of BJE’s investments.
Risks to our positive view include: 1) slower-than-expected sales growth for the gas, water and brewery businesses; 2) unfavourable regulatory changes to the above three segments; and 3) value-destructive asset acquisitions.
Belle 1880 HK 14.26 BUY 16 Our price target of HK$16.00 is based on 28x FY11F P/E (EPS of RMB0.47), an unchanged 15% premium to its historical 12-month forward P/E.
Downside risks: rising competition; slower-than-expected SSS; larger-than-expected promotion activities; failure to achieve synergies with acquired brands.
Bank of China (H-share)
3988 HK 4.22 BUY 5.3 We derive our price target of HK$5.30 by applying a P/BV multiple of 2x to our FY10F BVPS forecast. Our sustainable ROE assumption is 16.0%. We use the Gordon Growth Model [target P/BV= (sustainable ROE – long-term growth)/(cost of equity – long-term growth)] to derive our fair P/BV range, assuming a cost of equity of 12.0% and a terminal growth rate of 8.0%. We derive our terminal growth rate by applying a 50% payout ratio to our long-term sustainable ROE.
Downside risks: We believe that any more-severe-than-expected macro tightening could result in a sharp rise in bad debt costs, particularly after the massive loan growth recorded in 2009. Any downturn in the global economy, and especially Hong Kong’s economy, could also weigh on the bank’s earnings performance given its bigger foreign exposure relative to that of peers.
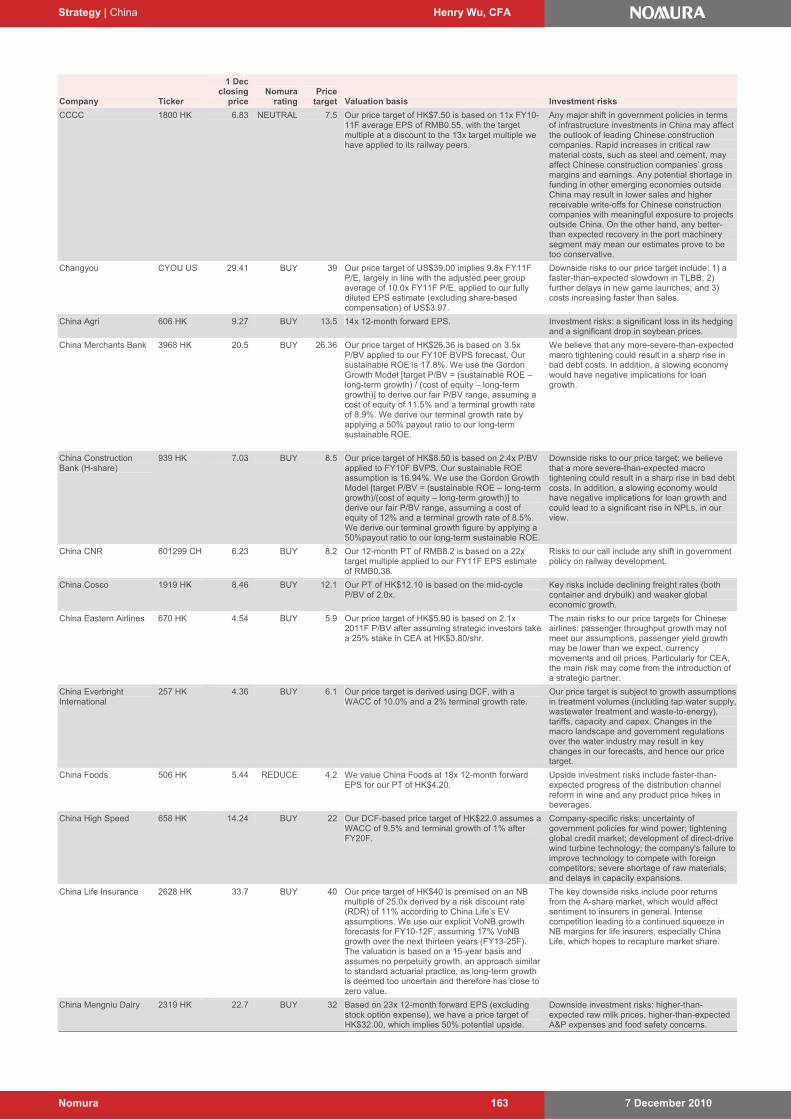
Strategy | China Henry Wu, CFA
7 December 2010 Nomura 163
Company Ticker
1 Dec closing
price Nomura
rating Price
target Valuation basis Investment risks
CCCC 1800 HK 6.83 NEUTRAL 7.5 Our price target of HK$7.50 is based on 11x FY10-11F average EPS of RMB0.55, with the target multiple at a discount to the 13x target multiple we have applied to its railway peers.
Any major shift in government policies in terms of infrastructure investments in China may affect the outlook of leading Chinese construction companies. Rapid increases in critical raw material costs, such as steel and cement, may affect Chinese construction companies’ gross margins and earnings. Any potential shortage in funding in other emerging economies outside China may result in lower sales and higher receivable write-offs for Chinese construction companies with meaningful exposure to projects outside China. On the other hand, any better-than expected recovery in the port machinery segment may mean our estimates prove to be too conservative.
Changyou CYOU US 29.41 BUY 39 Our price target of US$39.00 implies 9.8x FY11F P/E, largely in line with the adjusted peer group average of 10.0x FY11F P/E, applied to our fully diluted EPS estimate (excluding share-based compensation) of US$3.97.
Downside risks to our price target include: 1) a faster-than-expected slowdown in TLBB; 2) further delays in new game launches; and 3) costs increasing faster than sales.
China Agri 606 HK 9.27 BUY 13.5 14x 12-month forward EPS. Investment risks: a significant loss in its hedging and a significant drop in soybean prices.
China Merchants Bank 3968 HK 20.5 BUY 26.36 Our price target of HK$26.36 is based on 3.5x P/BV applied to our FY10F BVPS forecast. Our sustainable ROE is 17.8%. We use the Gordon Growth Model [target P/BV = (sustainable ROE – long-term growth) / (cost of equity – long-term growth)] to derive our fair P/BV range, assuming a cost of equity of 11.5% and a terminal growth rate of 8.9%. We derive our terminal growth rate by applying a 50% payout ratio to our long-term sustainable ROE.
We believe that any more-severe-than-expected macro tightening could result in a sharp rise in bad debt costs. In addition, a slowing economy would have negative implications for loan growth.
China Construction Bank (H-share)
939 HK 7.03 BUY 8.5 Our price target of HK$8.50 is based on 2.4x P/BV applied to FY10F BVPS. Our sustainable ROE assumption is 16.94%. We use the Gordon Growth Model [target P/BV = (sustainable ROE – long-term growth)/(cost of equity – long-term growth)] to derive our fair P/BV range, assuming a cost of equity of 12% and a terminal growth rate of 8.5%. We derive our terminal growth figure by applying a 50%payout ratio to our long-term sustainable ROE.
Downside risks to our price target: we believe that a more severe-than-expected macro tightening could result in a sharp rise in bad debt costs. In addition, a slowing economy would have negative implications for loan growth and could lead to a significant rise in NPLs, in our view.
China CNR 601299 CH 6.23 BUY 8.2 Our 12-month PT of RMB8.2 is based on a 22x target multiple applied to our FY11F EPS estimate of RMB0.38.
Risks to our call include any shift in government policy on railway development.
China Cosco 1919 HK 8.46 BUY 12.1 Our PT of HK$12.10 is based on the mid-cycle P/BV of 2.0x.
Key risks include declining freight rates (both container and drybulk) and weaker global economic growth.
China Eastern Airlines 670 HK 4.54 BUY 5.9 Our price target of HK$5.90 is based on 2.1x 2011F P/BV after assuming strategic investors take a 25% stake in CEA at HK$3.80/shr.
The main risks to our price targets for Chinese airlines: passenger throughput growth may not meet our assumptions, passenger yield growth may be lower than we expect, currency movements and oil prices. Particularly for CEA, the main risk may come from the introduction of a strategic partner.
China Everbright International
257 HK 4.36 BUY 6.1 Our price target is derived using DCF, with a WACC of 10.0% and a 2% terminal growth rate.
Our price target is subject to growth assumptions in treatment volumes (including tap water supply, wastewater treatment and waste-to-energy), tariffs, capacity and capex. Changes in the macro landscape and government regulations over the water industry may result in key changes in our forecasts, and hence our price target.
China Foods 506 HK 5.44 REDUCE 4.2 We value China Foods at 18x 12-month forward EPS for our PT of HK$4.20.
Upside investment risks include faster-than-expected progress of the distribution channel reform in wine and any product price hikes in beverages.
China High Speed 658 HK 14.24 BUY 22 Our DCF-based price target of HK$22.0 assumes a WACC of 9.5% and terminal growth of 1% after FY20F.
Company-specific risks: uncertainty of government policies for wind power; tightening global credit market; development of direct-drive wind turbine technology; the company's failure to improve technology to compete with foreign competitors; severe shortage of raw materials; and delays in capacity expansions.
China Life Insurance 2628 HK 33.7 BUY 40 Our price target of HK$40 is premised on an NB multiple of 25.0x derived by a risk discount rate (RDR) of 11% according to China Life’s EV assumptions. We use our explicit VoNB growth forecasts for FY10-12F, assuming 17% VoNB growth over the next thirteen years (FY13-25F). The valuation is based on a 15-year basis and assumes no perpetuity growth, an approach similar to standard actuarial practice, as long-term growth is deemed too uncertain and therefore has close to zero value.
The key downside risks include poor returns from the A-share market, which would affect sentiment to insurers in general. Intense competition leading to a continued squeeze in NB margins for life insurers, especially China Life, which hopes to recapture market share.
China Mengniu Dairy 2319 HK 22.7 BUY 32 Based on 23x 12-month forward EPS (excluding stock option expense), we have a price target of HK$32.00, which implies 50% potential upside.
Downside investment risks: higher-than-expected raw milk prices, higher-than-expected A&P expenses and food safety concerns.
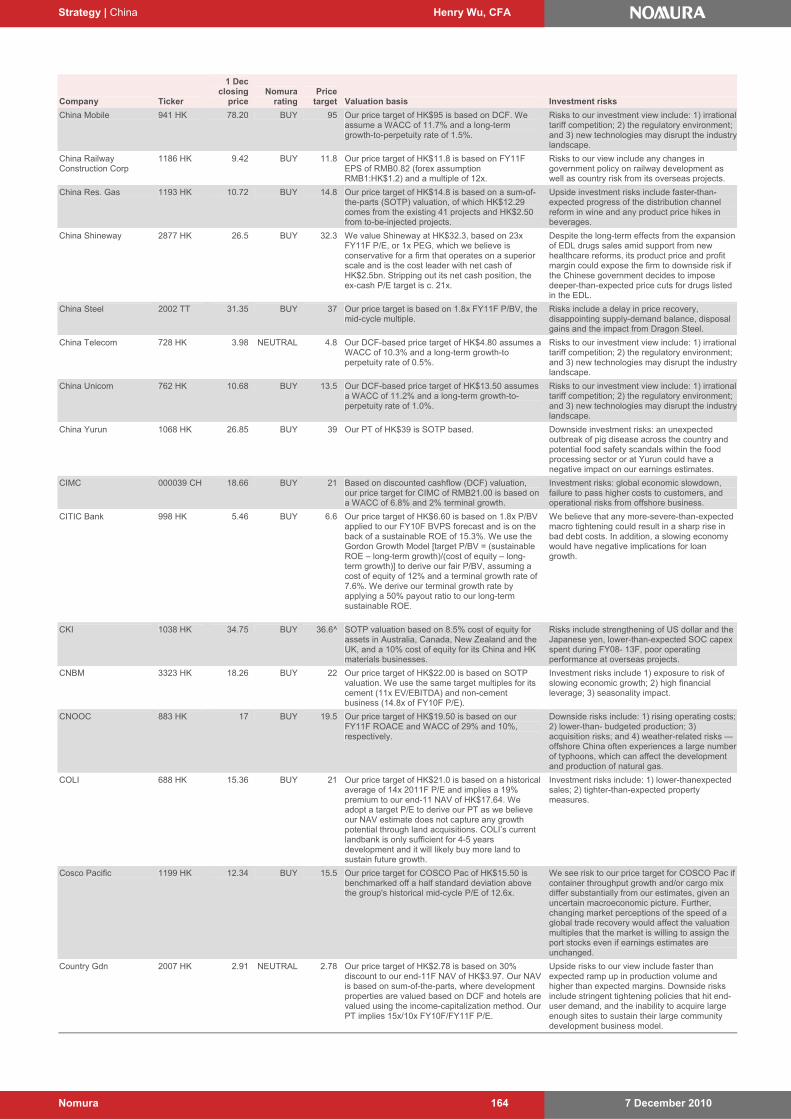
Strategy | China Henry Wu, CFA
7 December 2010 Nomura 164
Company Ticker
1 Dec closing
price Nomura
rating Price
target Valuation basis Investment risks
China Mobile 941 HK 78.20 BUY 95 Our price target of HK$95 is based on DCF. We assume a WACC of 11.7% and a long-term growth-to-perpetuity rate of 1.5%.
Risks to our investment view include: 1) irrational tariff competition; 2) the regulatory environment; and 3) new technologies may disrupt the industry landscape.
China Railway Construction Corp
1186 HK 9.42 BUY 11.8 Our price target of HK$11.8 is based on FY11F EPS of RMB0.82 (forex assumption RMB1:HK$1.2) and a multiple of 12x.
Risks to our view include any changes in government policy on railway development as well as country risk from its overseas projects.
China Res. Gas 1193 HK 10.72 BUY 14.8 Our price target of HK$14.8 is based on a sum-of-the-parts (SOTP) valuation, of which HK$12.29 comes from the existing 41 projects and HK$2.50 from to-be-injected projects.
Upside investment risks include faster-than-expected progress of the distribution channel reform in wine and any product price hikes in beverages.
China Shineway 2877 HK 26.5 BUY 32.3 We value Shineway at HK$32.3, based on 23x FY11F P/E, or 1x PEG, which we believe is conservative for a firm that operates on a superior scale and is the cost leader with net cash of HK$2.5bn. Stripping out its net cash position, the ex-cash P/E target is c. 21x.
Despite the long-term effects from the expansion of EDL drugs sales amid support from new healthcare reforms, its product price and profit margin could expose the firm to downside risk if the Chinese government decides to impose deeper-than-expected price cuts for drugs listed in the EDL.
China Steel 2002 TT 31.35 BUY 37 Our price target is based on 1.8x FY11F P/BV, the mid-cycle multiple.
Risks include a delay in price recovery, disappointing supply-demand balance, disposal gains and the impact from Dragon Steel.
China Telecom 728 HK 3.98 NEUTRAL 4.8 Our DCF-based price target of HK$4.80 assumes a WACC of 10.3% and a long-term growth-to perpetuity rate of 0.5%.
Risks to our investment view include: 1) irrational tariff competition; 2) the regulatory environment; and 3) new technologies may disrupt the industry landscape.
China Unicom 762 HK 10.68 BUY 13.5 Our DCF-based price target of HK$13.50 assumes a WACC of 11.2% and a long-term growth-to-perpetuity rate of 1.0%.
Risks to our investment view include: 1) irrational tariff competition; 2) the regulatory environment; and 3) new technologies may disrupt the industry landscape.
China Yurun 1068 HK 26.85 BUY 39 Our PT of HK$39 is SOTP based. Downside investment risks: an unexpected outbreak of pig disease across the country and potential food safety scandals within the food processing sector or at Yurun could have a negative impact on our earnings estimates.
CIMC 000039 CH 18.66 BUY 21 Based on discounted cashflow (DCF) valuation, our price target for CIMC of RMB21.00 is based on a WACC of 6.8% and 2% terminal growth.
Investment risks: global economic slowdown, failure to pass higher costs to customers, and operational risks from offshore business.
CITIC Bank 998 HK 5.46 BUY 6.6 Our price target of HK$6.60 is based on 1.8x P/BV applied to our FY10F BVPS forecast and is on the back of a sustainable ROE of 15.3%. We use the Gordon Growth Model [target P/BV = (sustainable ROE – long-term growth)/(cost of equity – long-term growth)] to derive our fair P/BV, assuming a cost of equity of 12% and a terminal growth rate of 7.6%. We derive our terminal growth rate by applying a 50% payout ratio to our long-term sustainable ROE.
We believe that any more-severe-than-expected macro tightening could result in a sharp rise in bad debt costs. In addition, a slowing economy would have negative implications for loan growth.
CKI 1038 HK 34.75 BUY 36.6^ SOTP valuation based on 8.5% cost of equity for assets in Australia, Canada, New Zealand and the UK, and a 10% cost of equity for its China and HK materials businesses.
Risks include strengthening of US dollar and the Japanese yen, lower-than-expected SOC capex spent during FY08- 13F, poor operating performance at overseas projects.
CNBM 3323 HK 18.26 BUY 22 Our price target of HK$22.00 is based on SOTP valuation. We use the same target multiples for its cement (11x EV/EBITDA) and non-cement business (14.8x of FY10F P/E).
Investment risks include 1) exposure to risk of slowing economic growth; 2) high financial leverage; 3) seasonality impact.
CNOOC 883 HK 17 BUY 19.5 Our price target of HK$19.50 is based on our FY11F ROACE and WACC of 29% and 10%, respectively.
Downside risks include: 1) rising operating costs; 2) lower-than- budgeted production; 3) acquisition risks; and 4) weather-related risks — offshore China often experiences a large number of typhoons, which can affect the development and production of natural gas.
COLI 688 HK 15.36 BUY 21 Our price target of HK$21.0 is based on a historical average of 14x 2011F P/E and implies a 19% premium to our end-11 NAV of HK$17.64. We adopt a target P/E to derive our PT as we believe our NAV estimate does not capture any growth potential through land acquisitions. COLI’s current landbank is only sufficient for 4-5 years development and it will likely buy more land to sustain future growth.
Investment risks include: 1) lower-thanexpected sales; 2) tighter-than-expected property measures.
Cosco Pacific 1199 HK 12.34 BUY 15.5 Our price target for COSCO Pac of HK$15.50 is benchmarked off a half standard deviation above the group's historical mid-cycle P/E of 12.6x.
We see risk to our price target for COSCO Pac if container throughput growth and/or cargo mix differ substantially from our estimates, given an uncertain macroeconomic picture. Further, changing market perceptions of the speed of a global trade recovery would affect the valuation multiples that the market is willing to assign the port stocks even if earnings estimates are unchanged.
Country Gdn 2007 HK 2.91 NEUTRAL 2.78 Our price target of HK$2.78 is based on 30% discount to our end-11F NAV of HK$3.97. Our NAV is based on sum-of-the-parts, where development properties are valued based on DCF and hotels are valued using the income-capitalization method. Our PT implies 15x/10x FY10F/FY11F P/E.
Upside risks to our view include faster than expected ramp up in production volume and higher than expected margins. Downside risks include stringent tightening policies that hit end-user demand, and the inability to acquire large enough sites to sustain their large community development business model.
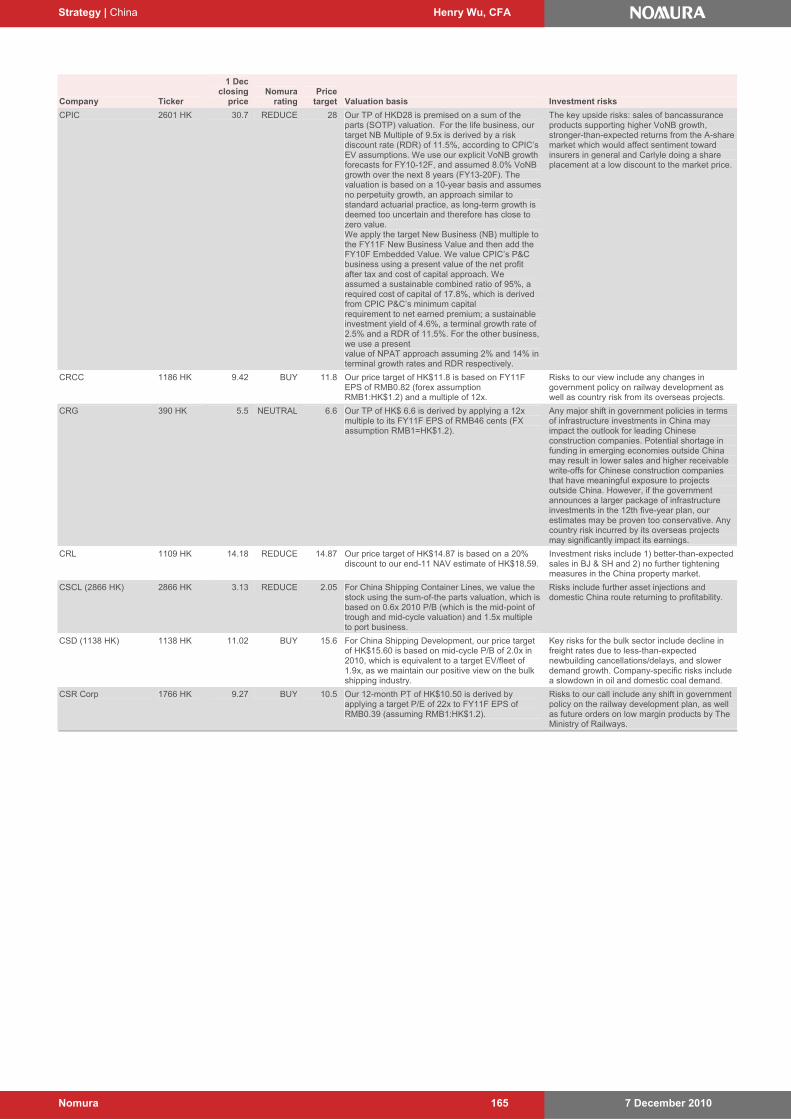
Strategy | China Henry Wu, CFA
7 December 2010 Nomura 165
Company Ticker
1 Dec closing
price Nomura
rating Price
target Valuation basis Investment risks
CPIC 2601 HK 30.7 REDUCE 28 Our TP of HKD28 is premised on a sum of the parts (SOTP) valuation. For the life business, our target NB Multiple of 9.5x is derived by a risk discount rate (RDR) of 11.5%, according to CPIC’s EV assumptions. We use our explicit VoNB growth forecasts for FY10-12F, and assumed 8.0% VoNB growth over the next 8 years (FY13-20F). The valuation is based on a 10-year basis and assumes no perpetuity growth, an approach similar to standard actuarial practice, as long-term growth is deemed too uncertain and therefore has close to zero value. We apply the target New Business (NB) multiple to the FY11F New Business Value and then add the FY10F Embedded Value. We value CPIC’s P&C business using a present value of the net profit after tax and cost of capital approach. We assumed a sustainable combined ratio of 95%, a required cost of capital of 17.8%, which is derived from CPIC P&C’s minimum capital requirement to net earned premium; a sustainable investment yield of 4.6%, a terminal growth rate of 2.5% and a RDR of 11.5%. For the other business, we use a present value of NPAT approach assuming 2% and 14% in terminal growth rates and RDR respectively.
The key upside risks: sales of bancassurance products supporting higher VoNB growth, stronger-than-expected returns from the A-share market which would affect sentiment toward insurers in general and Carlyle doing a share placement at a low discount to the market price.
CRCC 1186 HK 9.42 BUY 11.8 Our price target of HK$11.8 is based on FY11F EPS of RMB0.82 (forex assumption RMB1:HK$1.2) and a multiple of 12x.
Risks to our view include any changes in government policy on railway development as well as country risk from its overseas projects.
CRG 390 HK 5.5 NEUTRAL 6.6 Our TP of HK$ 6.6 is derived by applying a 12x multiple to its FY11F EPS of RMB46 cents (FX assumption RMB1=HK$1.2).
Any major shift in government policies in terms of infrastructure investments in China may impact the outlook for leading Chinese construction companies. Potential shortage in funding in emerging economies outside China may result in lower sales and higher receivable write-offs for Chinese construction companies that have meaningful exposure to projects outside China. However, if the government announces a larger package of infrastructure investments in the 12th five-year plan, our estimates may be proven too conservative. Any country risk incurred by its overseas projects may significantly impact its earnings.
CRL 1109 HK 14.18 REDUCE 14.87 Our price target of HK$14.87 is based on a 20% discount to our end-11 NAV estimate of HK$18.59.
Investment risks include 1) better-than-expected sales in BJ & SH and 2) no further tightening measures in the China property market.
CSCL (2866 HK) 2866 HK 3.13 REDUCE 2.05 For China Shipping Container Lines, we value the stock using the sum-of-the parts valuation, which is based on 0.6x 2010 P/B (which is the mid-point of trough and mid-cycle valuation) and 1.5x multiple to port business.
Risks include further asset injections and domestic China route returning to profitability.
CSD (1138 HK) 1138 HK 11.02 BUY 15.6 For China Shipping Development, our price target of HK$15.60 is based on mid-cycle P/B of 2.0x in 2010, which is equivalent to a target EV/fleet of 1.9x, as we maintain our positive view on the bulk shipping industry.
Key risks for the bulk sector include decline in freight rates due to less-than-expected newbuilding cancellations/delays, and slower demand growth. Company-specific risks include a slowdown in oil and domestic coal demand.
CSR Corp 1766 HK 9.27 BUY 10.5 Our 12-month PT of HK$10.50 is derived by applying a target P/E of 22x to FY11F EPS of RMB0.39 (assuming RMB1:HK$1.2).
Risks to our call include any shift in government policy on the railway development plan, as well as future orders on low margin products by The Ministry of Railways.
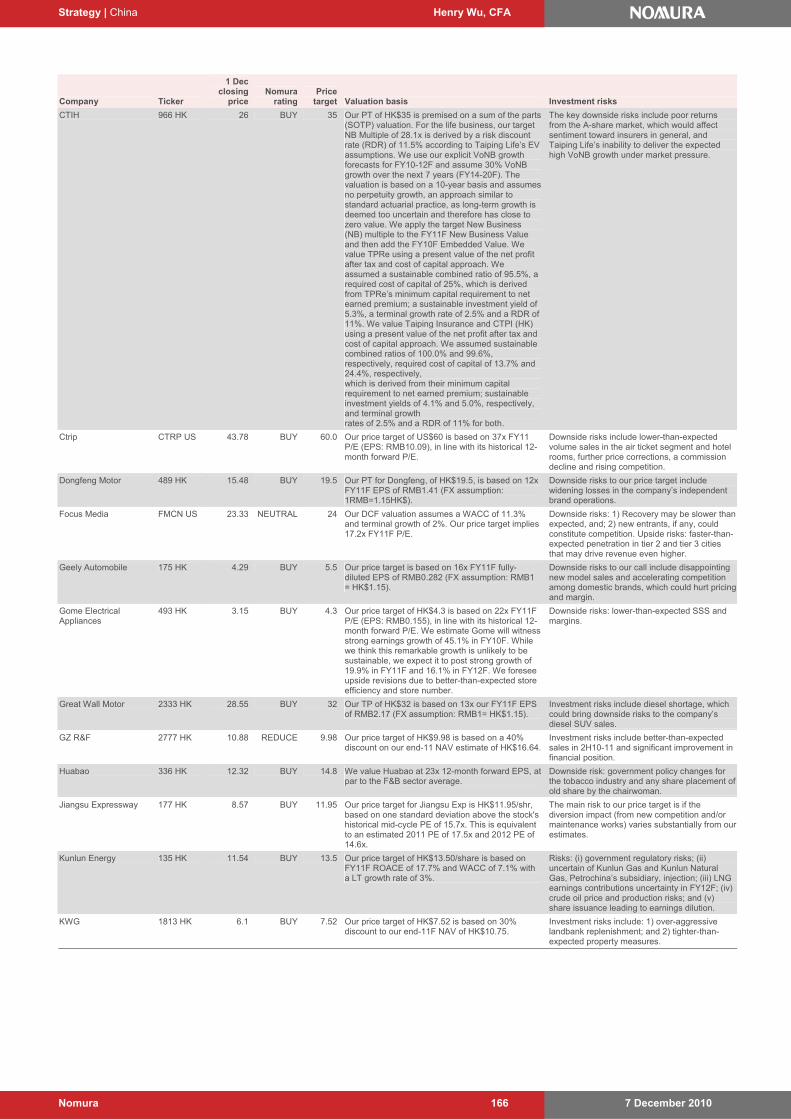
Strategy | China Henry Wu, CFA
7 December 2010 Nomura 166
Company Ticker
1 Dec closing
price Nomura
rating Price
target Valuation basis Investment risks
CTIH 966 HK 26 BUY 35 Our PT of HK$35 is premised on a sum of the parts (SOTP) valuation. For the life business, our target NB Multiple of 28.1x is derived by a risk discount rate (RDR) of 11.5% according to Taiping Life’s EV assumptions. We use our explicit VoNB growth forecasts for FY10-12F and assume 30% VoNB growth over the next 7 years (FY14-20F). The valuation is based on a 10-year basis and assumes no perpetuity growth, an approach similar to standard actuarial practice, as long-term growth is deemed too uncertain and therefore has close to zero value. We apply the target New Business (NB) multiple to the FY11F New Business Value and then add the FY10F Embedded Value. We value TPRe using a present value of the net profit after tax and cost of capital approach. We assumed a sustainable combined ratio of 95.5%, a required cost of capital of 25%, which is derived from TPRe’s minimum capital requirement to net earned premium; a sustainable investment yield of 5.3%, a terminal growth rate of 2.5% and a RDR of 11%. We value Taiping Insurance and CTPI (HK) using a present value of the net profit after tax and cost of capital approach. We assumed sustainable combined ratios of 100.0% and 99.6%, respectively, required cost of capital of 13.7% and 24.4%, respectively, which is derived from their minimum capital requirement to net earned premium; sustainable investment yields of 4.1% and 5.0%, respectively, and terminal growth rates of 2.5% and a RDR of 11% for both.
The key downside risks include poor returns from the A-share market, which would affect sentiment toward insurers in general, and Taiping Life’s inability to deliver the expected high VoNB growth under market pressure.
Ctrip CTRP US 43.78 BUY 60.0 Our price target of US$60 is based on 37x FY11 P/E (EPS: RMB10.09), in line with its historical 12-month forward P/E.
Downside risks include lower-than-expected volume sales in the air ticket segment and hotel rooms, further price corrections, a commission decline and rising competition.
Dongfeng Motor 489 HK 15.48 BUY 19.5 Our PT for Dongfeng, of HK$19.5, is based on 12x FY11F EPS of RMB1.41 (FX assumption: 1RMB=1.15HK$).
Downside risks to our price target include widening losses in the company’s independent brand operations.
Focus Media FMCN US 23.33 NEUTRAL 24 Our DCF valuation assumes a WACC of 11.3% and terminal growth of 2%. Our price target implies 17.2x FY11F P/E.
Downside risks: 1) Recovery may be slower than expected, and; 2) new entrants, if any, could constitute competition. Upside risks: faster-than-expected penetration in tier 2 and tier 3 cities that may drive revenue even higher.
Geely Automobile 175 HK 4.29 BUY 5.5 Our price target is based on 16x FY11F fully-diluted EPS of RMB0.282 (FX assumption: RMB1 = HK$1.15).
Downside risks to our call include disappointing new model sales and accelerating competition among domestic brands, which could hurt pricing and margin.
Gome Electrical Appliances
493 HK 3.15 BUY 4.3 Our price target of HK$4.3 is based on 22x FY11F P/E (EPS: RMB0.155), in line with its historical 12-month forward P/E. We estimate Gome will witness strong earnings growth of 45.1% in FY10F. While we think this remarkable growth is unlikely to be sustainable, we expect it to post strong growth of 19.9% in FY11F and 16.1% in FY12F. We foresee upside revisions due to better-than-expected store efficiency and store number.
Downside risks: lower-than-expected SSS and margins.
Great Wall Motor 2333 HK 28.55 BUY 32 Our TP of HK$32 is based on 13x our FY11F EPS of RMB2.17 (FX assumption: RMB1= HK$1.15).
Investment risks include diesel shortage, which could bring downside risks to the company’s diesel SUV sales.
GZ R&F 2777 HK 10.88 REDUCE 9.98 Our price target of HK$9.98 is based on a 40% discount on our end-11 NAV estimate of HK$16.64.
Investment risks include better-than-expected sales in 2H10-11 and significant improvement in financial position.
Huabao 336 HK 12.32 BUY 14.8 We value Huabao at 23x 12-month forward EPS, at par to the F&B sector average.
Downside risk: government policy changes for the tobacco industry and any share placement of old share by the chairwoman.
Jiangsu Expressway 177 HK 8.57 BUY 11.95 Our price target for Jiangsu Exp is HK$11.95/shr, based on one standard deviation above the stock's historical mid-cycle PE of 15.7x. This is equivalent to an estimated 2011 PE of 17.5x and 2012 PE of 14.6x.
The main risk to our price target is if the diversion impact (from new competition and/or maintenance works) varies substantially from our estimates.
Kunlun Energy 135 HK 11.54 BUY 13.5 Our price target of HK$13.50/share is based on FY11F ROACE of 17.7% and WACC of 7.1% with a LT growth rate of 3%.
Risks: (i) government regulatory risks; (ii) uncertain of Kunlun Gas and Kunlun Natural Gas, Petrochina’s subsidiary, injection; (iii) LNG earnings contributions uncertainty in FY12F; (iv) crude oil price and production risks; and (v) share issuance leading to earnings dilution.
KWG 1813 HK 6.1 BUY 7.52 Our price target of HK$7.52 is based on 30% discount to our end-11F NAV of HK$10.75.
Investment risks include: 1) over-aggressive landbank replenishment; and 2) tighter-than-expected property measures.
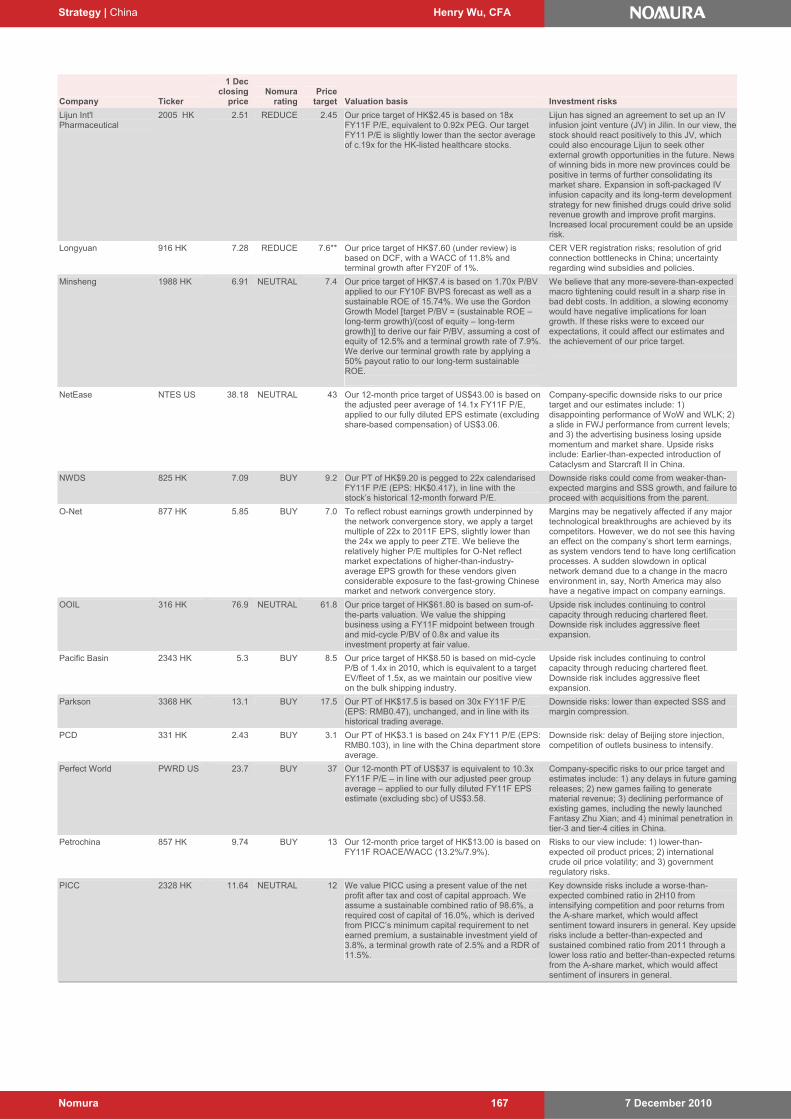
Strategy | China Henry Wu, CFA
7 December 2010 Nomura 167
Company Ticker
1 Dec closing
price Nomura
rating Price
target Valuation basis Investment risks
Lijun Int'l Pharmaceutical
2005 HK 2.51 REDUCE 2.45 Our price target of HK$2.45 is based on 18x FY11F P/E, equivalent to 0.92x PEG. Our target FY11 P/E is slightly lower than the sector average of c.19x for the HK-listed healthcare stocks.
Lijun has signed an agreement to set up an IV infusion joint venture (JV) in Jilin. In our view, the stock should react positively to this JV, which could also encourage Lijun to seek other external growth opportunities in the future. News of winning bids in more new provinces could be positive in terms of further consolidating its market share. Expansion in soft-packaged IV infusion capacity and its long-term development strategy for new finished drugs could drive solid revenue growth and improve profit margins. Increased local procurement could be an upside risk.
Longyuan 916 HK 7.28 REDUCE 7.6** Our price target of HK$7.60 (under review) is based on DCF, with a WACC of 11.8% and terminal growth after FY20F of 1%.
CER VER registration risks; resolution of grid connection bottlenecks in China; uncertainty regarding wind subsidies and policies.
Minsheng 1988 HK 6.91 NEUTRAL 7.4 Our price target of HK$7.4 is based on 1.70x P/BV applied to our FY10F BVPS forecast as well as a sustainable ROE of 15.74%. We use the Gordon Growth Model [target P/BV = (sustainable ROE – long-term growth)/(cost of equity – long-term growth)] to derive our fair P/BV, assuming a cost of equity of 12.5% and a terminal growth rate of 7.9%. We derive our terminal growth rate by applying a 50% payout ratio to our long-term sustainable ROE.
We believe that any more-severe-than-expected macro tightening could result in a sharp rise in bad debt costs. In addition, a slowing economy would have negative implications for loan growth. If these risks were to exceed our expectations, it could affect our estimates and the achievement of our price target.
NetEase NTES US 38.18 NEUTRAL 43 Our 12-month price target of US$43.00 is based on the adjusted peer average of 14.1x FY11F P/E, applied to our fully diluted EPS estimate (excluding share-based compensation) of US$3.06.
Company-specific downside risks to our price target and our estimates include: 1) disappointing performance of WoW and WLK; 2) a slide in FWJ performance from current levels; and 3) the advertising business losing upside momentum and market share. Upside risks include: Earlier-than-expected introduction of Cataclysm and Starcraft II in China.
NWDS 825 HK 7.09 BUY 9.2 Our PT of HK$9.20 is pegged to 22x calendarised FY11F P/E (EPS: HK$0.417), in line with the stock’s historical 12-month forward P/E.
Downside risks could come from weaker-than-expected margins and SSS growth, and failure to proceed with acquisitions from the parent.
O-Net 877 HK 5.85 BUY 7.0 To reflect robust earnings growth underpinned by the network convergence story, we apply a target multiple of 22x to 2011F EPS, slightly lower than the 24x we apply to peer ZTE. We believe the relatively higher P/E multiples for O-Net reflect market expectations of higher-than-industry-average EPS growth for these vendors given considerable exposure to the fast-growing Chinese market and network convergence story.
Margins may be negatively affected if any major technological breakthroughs are achieved by its competitors. However, we do not see this having an effect on the company’s short term earnings, as system vendors tend to have long certification processes. A sudden slowdown in optical network demand due to a change in the macro environment in, say, North America may also have a negative impact on company earnings.
OOIL 316 HK 76.9 NEUTRAL 61.8 Our price target of HK$61.80 is based on sum-of-the-parts valuation. We value the shipping business using a FY11F midpoint between trough and mid-cycle P/BV of 0.8x and value its investment property at fair value.
Upside risk includes continuing to control capacity through reducing chartered fleet. Downside risk includes aggressive fleet expansion.
Pacific Basin 2343 HK 5.3 BUY 8.5 Our price target of HK$8.50 is based on mid-cycle P/B of 1.4x in 2010, which is equivalent to a target EV/fleet of 1.5x, as we maintain our positive view on the bulk shipping industry.
Upside risk includes continuing to control capacity through reducing chartered fleet. Downside risk includes aggressive fleet expansion.
Parkson 3368 HK 13.1 BUY 17.5 Our PT of HK$17.5 is based on 30x FY11F P/E (EPS: RMB0.47), unchanged, and in line with its historical trading average.
Downside risks: lower than expected SSS and margin compression.
PCD 331 HK 2.43 BUY 3.1 Our PT of HK$3.1 is based on 24x FY11 P/E (EPS: RMB0.103), in line with the China department store average.
Downside risk: delay of Beijing store injection, competition of outlets business to intensify.
Perfect World PWRD US 23.7 BUY 37 Our 12-month PT of US$37 is equivalent to 10.3x FY11F P/E – in line with our adjusted peer group average – applied to our fully diluted FY11F EPS estimate (excluding sbc) of US$3.58.
Company-specific risks to our price target and estimates include: 1) any delays in future gaming releases; 2) new games failing to generate material revenue; 3) declining performance of existing games, including the newly launched Fantasy Zhu Xian; and 4) minimal penetration in tier-3 and tier-4 cities in China.
Petrochina 857 HK 9.74 BUY 13 Our 12-month price target of HK$13.00 is based on FY11F ROACE/WACC (13.2%/7.9%).
Risks to our view include: 1) lower-than-expected oil product prices; 2) international crude oil price volatility; and 3) government regulatory risks.
PICC 2328 HK 11.64 NEUTRAL 12 We value PICC using a present value of the net profit after tax and cost of capital approach. We assume a sustainable combined ratio of 98.6%, a required cost of capital of 16.0%, which is derived from PICC’s minimum capital requirement to net earned premium, a sustainable investment yield of 3.8%, a terminal growth rate of 2.5% and a RDR of 11.5%.
Key downside risks include a worse-than-expected combined ratio in 2H10 from intensifying competition and poor returns from the A-share market, which would affect sentiment toward insurers in general. Key upside risks include a better-than-expected and sustained combined ratio from 2011 through a lower loss ratio and better-than-expected returns from the A-share market, which would affect sentiment of insurers in general.
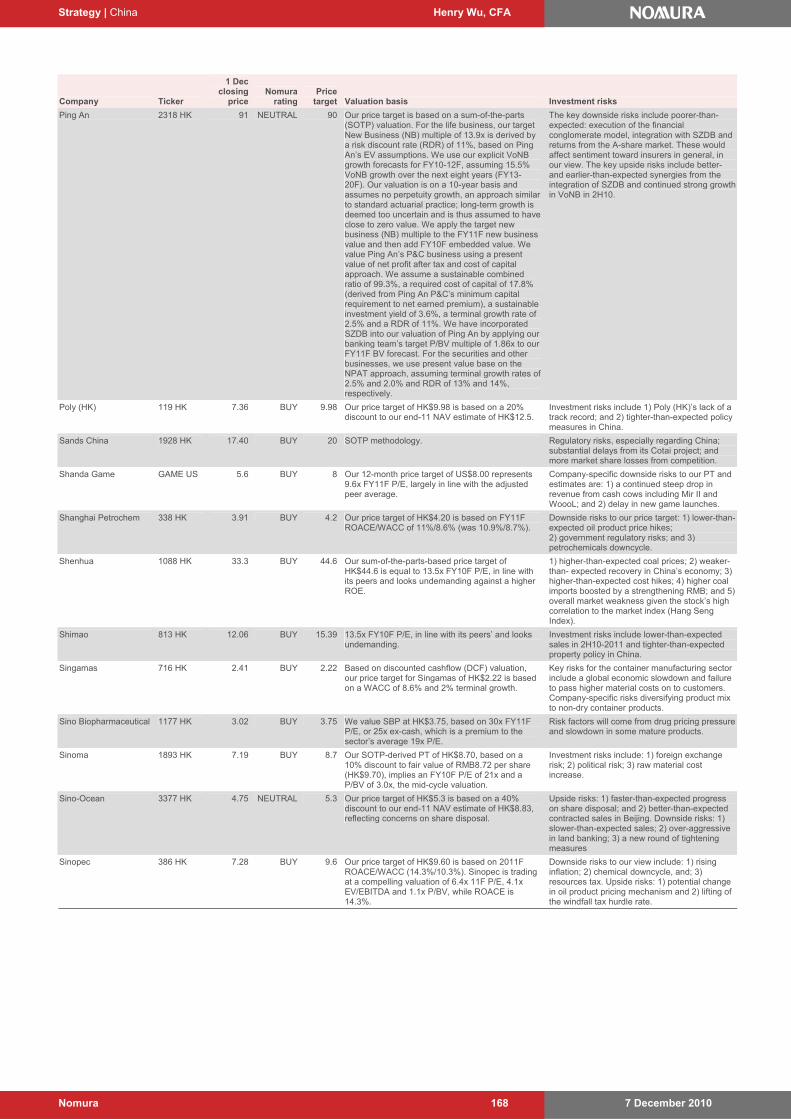
Strategy | China Henry Wu, CFA
7 December 2010 Nomura 168
Company Ticker
1 Dec closing
price Nomura
rating Price
target Valuation basis Investment risks
Ping An 2318 HK 91 NEUTRAL 90 Our price target is based on a sum-of-the-parts (SOTP) valuation. For the life business, our target New Business (NB) multiple of 13.9x is derived by a risk discount rate (RDR) of 11%, based on Ping An’s EV assumptions. We use our explicit VoNB growth forecasts for FY10-12F, assuming 15.5% VoNB growth over the next eight years (FY13-20F). Our valuation is on a 10-year basis and assumes no perpetuity growth, an approach similar to standard actuarial practice; long-term growth is deemed too uncertain and is thus assumed to have close to zero value. We apply the target new business (NB) multiple to the FY11F new business value and then add FY10F embedded value. We value Ping An’s P&C business using a present value of net profit after tax and cost of capital approach. We assume a sustainable combined ratio of 99.3%, a required cost of capital of 17.8% (derived from Ping An P&C’s minimum capital requirement to net earned premium), a sustainable investment yield of 3.6%, a terminal growth rate of 2.5% and a RDR of 11%. We have incorporated SZDB into our valuation of Ping An by applying our banking team’s target P/BV multiple of 1.86x to our FY11F BV forecast. For the securities and other businesses, we use present value base on the NPAT approach, assuming terminal growth rates of 2.5% and 2.0% and RDR of 13% and 14%, respectively.
The key downside risks include poorer-than-expected: execution of the financial conglomerate model, integration with SZDB and returns from the A-share market. These would affect sentiment toward insurers in general, in our view. The key upside risks include better- and earlier-than-expected synergies from the integration of SZDB and continued strong growth in VoNB in 2H10.
Poly (HK) 119 HK 7.36 BUY 9.98 Our price target of HK$9.98 is based on a 20% discount to our end-11 NAV estimate of HK$12.5.
Investment risks include 1) Poly (HK)’s lack of a track record; and 2) tighter-than-expected policy measures in China.
Sands China 1928 HK 17.40 BUY 20 SOTP methodology. Regulatory risks, especially regarding China; substantial delays from its Cotai project; and more market share losses from competition.
Shanda Game GAME US 5.6 BUY 8 Our 12-month price target of US$8.00 represents 9.6x FY11F P/E, largely in line with the adjusted peer average.
Company-specific downside risks to our PT and estimates are: 1) a continued steep drop in revenue from cash cows including Mir II and WoooL; and 2) delay in new game launches.
Shanghai Petrochem 338 HK 3.91 BUY 4.2 Our price target of HK$4.20 is based on FY11F ROACE/WACC of 11%/8.6% (was 10.9%/8.7%).
Downside risks to our price target: 1) lower-than-expected oil product price hikes; 2) government regulatory risks; and 3) petrochemicals downcycle.
Shenhua 1088 HK 33.3 BUY 44.6 Our sum-of-the-parts-based price target of HK$44.6 is equal to 13.5x FY10F P/E, in line with its peers and looks undemanding against a higher ROE.
1) higher-than-expected coal prices; 2) weaker-than- expected recovery in China’s economy; 3) higher-than-expected cost hikes; 4) higher coal imports boosted by a strengthening RMB; and 5) overall market weakness given the stock’s high correlation to the market index (Hang Seng Index).
Shimao 813 HK 12.06 BUY 15.39 13.5x FY10F P/E, in line with its peers’ and looks undemanding.
Investment risks include lower-than-expected sales in 2H10-2011 and tighter-than-expected property policy in China.
Singamas 716 HK 2.41 BUY 2.22 Based on discounted cashflow (DCF) valuation, our price target for Singamas of HK$2.22 is based on a WACC of 8.6% and 2% terminal growth.
Key risks for the container manufacturing sector include a global economic slowdown and failure to pass higher material costs on to customers. Company-specific risks diversifying product mix to non-dry container products.
Sino Biopharmaceutical 1177 HK 3.02 BUY 3.75 We value SBP at HK$3.75, based on 30x FY11F P/E, or 25x ex-cash, which is a premium to the sector’s average 19x P/E.
Risk factors will come from drug pricing pressure and slowdown in some mature products.
Sinoma 1893 HK 7.19 BUY 8.7 Our SOTP-derived PT of HK$8.70, based on a 10% discount to fair value of RMB8.72 per share (HK$9.70), implies an FY10F P/E of 21x and a P/BV of 3.0x, the mid-cycle valuation.
Investment risks include: 1) foreign exchange risk; 2) political risk; 3) raw material cost increase.
Sino-Ocean 3377 HK 4.75 NEUTRAL 5.3 Our price target of HK$5.3 is based on a 40% discount to our end-11 NAV estimate of HK$8.83, reflecting concerns on share disposal.
Upside risks: 1) faster-than-expected progress on share disposal; and 2) better-than-expected contracted sales in Beijing. Downside risks: 1) slower-than-expected sales; 2) over-aggressive in land banking; 3) a new round of tightening measures
Sinopec 386 HK 7.28 BUY 9.6 Our price target of HK$9.60 is based on 2011F ROACE/WACC (14.3%/10.3%). Sinopec is trading at a compelling valuation of 6.4x 11F P/E, 4.1x EV/EBITDA and 1.1x P/BV, while ROACE is 14.3%.
Downside risks to our view include: 1) rising inflation; 2) chemical downcycle, and; 3) resources tax. Upside risks: 1) potential change in oil product pricing mechanism and 2) lifting of the windfall tax hurdle rate.
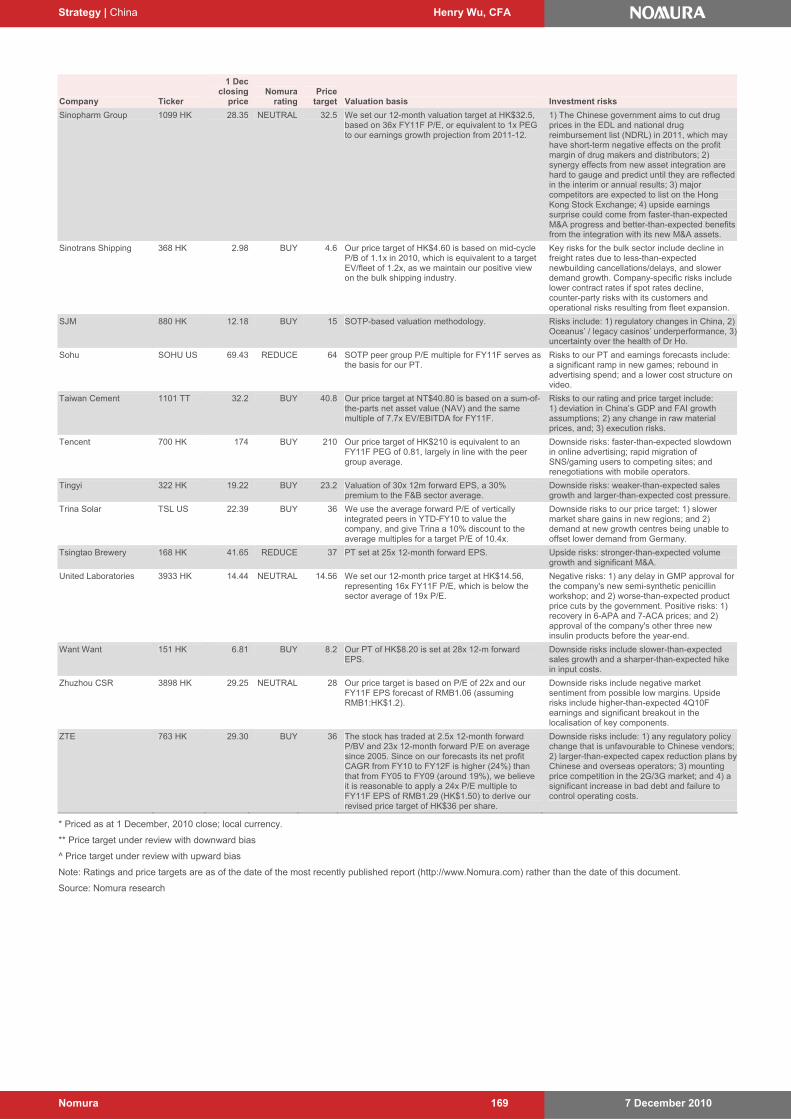
Strategy | China Henry Wu, CFA
7 December 2010 Nomura 169
Company Ticker
1 Dec closing
price Nomura
rating Price
target Valuation basis Investment risks
Sinopharm Group 1099 HK 28.35 NEUTRAL 32.5 We set our 12-month valuation target at HK$32.5, based on 36x FY11F P/E, or equivalent to 1x PEG to our earnings growth projection from 2011-12.
1) The Chinese government aims to cut drug prices in the EDL and national drug reimbursement list (NDRL) in 2011, which may have short-term negative effects on the profit margin of drug makers and distributors; 2) synergy effects from new asset integration are hard to gauge and predict until they are reflected in the interim or annual results; 3) major competitors are expected to list on the Hong Kong Stock Exchange; 4) upside earnings surprise could come from faster-than-expected M&A progress and better-than-expected benefits from the integration with its new M&A assets.
Sinotrans Shipping 368 HK 2.98 BUY 4.6 Our price target of HK$4.60 is based on mid-cycle P/B of 1.1x in 2010, which is equivalent to a target EV/fleet of 1.2x, as we maintain our positive view on the bulk shipping industry.
Key risks for the bulk sector include decline in freight rates due to less-than-expected newbuilding cancellations/delays, and slower demand growth. Company-specific risks include lower contract rates if spot rates decline, counter-party risks with its customers and operational risks resulting from fleet expansion.
SJM 880 HK 12.18 BUY 15 SOTP-based valuation methodology. Risks include: 1) regulatory changes in China, 2) Oceanus’ / legacy casinos’ underperformance, 3) uncertainty over the health of Dr Ho.
Sohu SOHU US 69.43 REDUCE 64 SOTP peer group P/E multiple for FY11F serves as the basis for our PT.
Risks to our PT and earnings forecasts include: a significant ramp in new games; rebound in advertising spend; and a lower cost structure on video.
Taiwan Cement 1101 TT 32.2 BUY 40.8 Our price target at NT$40.80 is based on a sum-of-the-parts net asset value (NAV) and the same multiple of 7.7x EV/EBITDA for FY11F.
Risks to our rating and price target include: 1) deviation in China’s GDP and FAI growth assumptions; 2) any change in raw material prices, and; 3) execution risks.
Tencent 700 HK 174 BUY 210 Our price target of HK$210 is equivalent to an FY11F PEG of 0.81, largely in line with the peer group average.
Downside risks: faster-than-expected slowdown in online advertising; rapid migration of SNS/gaming users to competing sites; and renegotiations with mobile operators.
Tingyi 322 HK 19.22 BUY 23.2 Valuation of 30x 12m forward EPS, a 30% premium to the F&B sector average.
Downside risks: weaker-than-expected sales growth and larger-than-expected cost pressure.
Trina Solar TSL US 22.39 BUY 36 We use the average forward P/E of vertically integrated peers in YTD-FY10 to value the company, and give Trina a 10% discount to the average multiples for a target P/E of 10.4x.
Downside risks to our price target: 1) slower market share gains in new regions; and 2) demand at new growth centres being unable to offset lower demand from Germany.
Tsingtao Brewery 168 HK 41.65 REDUCE 37 PT set at 25x 12-month forward EPS. Upside risks: stronger-than-expected volume growth and significant M&A.
United Laboratories 3933 HK 14.44 NEUTRAL 14.56 We set our 12-month price target at HK$14.56, representing 16x FY11F P/E, which is below the sector average of 19x P/E.
Negative risks: 1) any delay in GMP approval for the company's new semi-synthetic penicillin workshop; and 2) worse-than-expected product price cuts by the government. Positive risks: 1) recovery in 6-APA and 7-ACA prices; and 2) approval of the company's other three new insulin products before the year-end.
Want Want 151 HK 6.81 BUY 8.2 Our PT of HK$8.20 is set at 28x 12-m forward EPS.
Downside risks include slower-than-expected sales growth and a sharper-than-expected hike in input costs.
Zhuzhou CSR 3898 HK 29.25 NEUTRAL 28 Our price target is based on P/E of 22x and our FY11F EPS forecast of RMB1.06 (assuming RMB1:HK$1.2).
Downside risks include negative market sentiment from possible low margins. Upside risks include higher-than-expected 4Q10F earnings and significant breakout in the localisation of key components.
ZTE 763 HK 29.30 BUY 36 The stock has traded at 2.5x 12-month forward P/BV and 23x 12-month forward P/E on average since 2005. Since on our forecasts its net profit CAGR from FY10 to FY12F is higher (24%) than that from FY05 to FY09 (around 19%), we believe it is reasonable to apply a 24x P/E multiple to FY11F EPS of RMB1.29 (HK$1.50) to derive our revised price target of HK$36 per share.
Downside risks include: 1) any regulatory policy change that is unfavourable to Chinese vendors; 2) larger-than-expected capex reduction plans by Chinese and overseas operators; 3) mounting price competition in the 2G/3G market; and 4) a significant increase in bad debt and failure to control operating costs.
* Priced as at 1 December, 2010 close; local currency.
** Price target under review with downward bias
^ Price target under review with upward bias
Note: Ratings and price targets are as of the date of the most recently published report (http://www.Nomura.com) rather than the date of this document.
Source: Nomura research
Strategy | China Henry Wu, CFA
7 December 2010 Nomura 170
CONTACTS
STRATEGY
Sean Darby 852 2252 2182 [email protected]
Amy Lee 852 2252 2181 [email protected]
Mixo Das 852 2252 1424 [email protected]
CHINA
Henry Wu 852 2252 2122 [email protected]
Yang Luo 852 2252 2141 [email protected]
Michael Shen 852 2252 2140 [email protected]
QUANTITATIVE STRATEGY
Sandy Lee 852 2252 2101 [email protected]
Yasuhiro Shimizu 852 2252 2107 [email protected]
Kenneth Chan 852 2252 2104 [email protected]
Rico Kwan 852 2252 2102 [email protected]
Tacky Cheng 852 2252 2105 [email protected]
Desmond Chan 852 2252 2110 [email protected]
SECTOR
BANKS & OTHER FINANCIALS
Lucy Feng 852 2252 2165 [email protected]
David Chung 852 2252 6210 [email protected]
Ben Huang 852 2252 6242 [email protected]
Donger Wang 852 2252 1590 [email protected]
Sunny Ding 852 2252 1559 [email protected]
CONSUMER
Candy Huang 852 2252 1407 [email protected]
Cherry Liu 852 2252 2183 [email protected]
Emma Liu 852 2252 6172 [email protected]
Anita Chu 852 2252 1425 [email protected]
GAMING
Charlene Liu 852 2252 6134 [email protected]
HEALTHCARE / PHARMACEUTICAL
Gideon Lo 852 2252 6190 [email protected]
AUTOS & AUTO PARTS
Yankun Hou 852 2252 6234 [email protected]
Ming Xu 852 2252 1569 [email protected]
INDUSTRIALS
Yankun Hou 852 2252 6234 [email protected]
Paul Gong 852 2252 6177 [email protected]
INFRASTRUCTURE
Jim Wong 852 2252 2195 [email protected]
Yankun Hou 852 2252 6234 [email protected]
Paul Gong 852 2252 6177 [email protected]
INSURANCE
David Chung 852 2252 6210 [email protected]
INTERNET/MEDIA
Jin Yoon 852 2252 6204 [email protected]
George Meng 852 2252 1409 [email protected]
METALS & MINING / BASIC MATERIALS
Josephine Ho 852 2252 2177 [email protected]
Jialong Shi 852 2252 1594 [email protected]
OIL & GAS AND CHEMICAL
Cheng Khoo 852 2252 6180 [email protected]
Gordon Wai 852 2252 6176 [email protected]
Yong Liang Por 852 2252 6220 [email protected]
Michael Lo 852 2252 6225 [email protected]
POWER, UTILITIES & RENEWABLE ENERGY
Ivan Lee 852 2252 6213 [email protected]
Joseph Lam 852 2252 2106 [email protected]
Daniel Raats 852 2252 2197 [email protected]
Nitin Kumar 65 6433 6967 [email protected]
Matty Zhao 852 2252 1397 [email protected]
Alan Hon 852 2252 2193 [email protected]
Elaine Wu 852 2252 2194 [email protected]
Zi Ying Xia 852 2252 1552 [email protected]
TRANSPORTATION
Jim Wong 852 2252 2195 [email protected]
Shirley Lam 852 2252 2196 [email protected]
Andrew Lee 852 2252 6197 [email protected]
Cecilia Chan 852 2252 6181 [email protected]
PROPERTY / REITS
Paul Louie 852 2252 6189 [email protected]
Perveen Wong 852 2252 6254 [email protected]
Alvin Wong 852 2252 1563 [email protected]
Sunny Tam 852 2252 6226 [email protected]
Jianping Chen 852 2252 2139 [email protected]
TELECOMMUNICATIONS
Danny Chu 852 2252 6209 [email protected]
Leping Huang 852 2252 1598 [email protected]

Strategy | China Henry Wu, CFA
7 December 2010 Nomura 171
Strategy | China Henry Wu, CFA
7 December 2010 Nomura 172
Any Authors named on this report are Research Analysts unless otherwise indicated
ANALYST CERTIFICATIONS
I, Henry Wu, hereby certify (1) that the views expressed in this Research report accurately reflect my personal views about any or all of the subject securities or issuers referred to in this Research report, (2) no part of my compensation was, is or will be directly or indirectly related to the specific recommendations or views expressed in this Research report and (3) no part of my compensation is tied to any specific investment banking transactions performed by Nomura Securities International, Inc., Nomura International plc or any other Nomura Group company.
Conflict-of-interest disclosures Important disclosures may be accessed through the following website: http://www.nomura.com/research/Disclosures/public/main.asp. If you have difficulty with this site or you do not have a password, please contact your Nomura Securities International, Inc. salesperson (1-877-865-5752) or email [email protected] for assistance.
Online availability of research and additional conflict-of-interest disclosures:
Nomura Japanese Equity Research is available electronically for clients in the US on NOMURA.COM, REUTERS, BLOOMBERG and THOMSON ONE ANALYTICS. For clients in Europe, Japan and elsewhere in Asia it is available on NOMURA.COM, REUTERS and BLOOMBERG.
Important disclosures may be accessed through the left hand side of the Nomura Disclosure web page http://www.nomura.com/research or requested from Nomura Securities International, Inc., on 1-877-865-5752. If you have any difficulties with the website, please email [email protected] for technical assistance.
The analysts responsible for preparing this report have received compensation based upon various factors including the firm's total revenues, a portion of which is generated by Investment Banking activities.
Industry Specialists identified in some Nomura research reports are senior employees within the Firm who are responsible for the sales and trading effort in the sector for which they have coverage. Industry Specialists do not contribute in any manner to the content of research report in which their names appear..
Distribution of Ratings:
Nomura Global Equity Research has 1878 companies under coverage.
48% have been assigned a Buy rating which, for purposes of mandatory disclosures, are classified as a Buy rating; 41% of companies with this rating are investment banking clients of the Nomura Group*.
37% have been assigned a Neutral rating which, for purposes of mandatory disclosures, is classified as a Hold rating; 54% of companies with this rating are investment banking clients of the Nomura Group*.
13% have been assigned a Reduce rating which, for purposes of mandatory disclosures, are classified as a Sell rating; 16% of companies with this rating are investment banking clients of the Nomura Group*.
As at 30 September 2010. *The Nomura Group as defined in the Disclaimer section at the end of this report.
Strategy | China Henry Wu, CFA
7 December 2010 Nomura 173
Explanation of Nomura's equity research rating system in Europe, Middle East and Africa, US and Latin America for ratings published from 27 October 2008:
The rating system is a relative system indicating expected performance against a specific benchmark identified for each individual stock. Analysts may also indicate absolute upside to price target defined as (fair value - current price)/current price, subject to limited management discretion. In most cases, the fair value will equal the analyst's assessment of the current intrinsic fair value of the stock using an appropriate valuation methodology such as discounted cash flow or multiple analysis, etc.
Stocks:
A rating of 'Buy', indicates that the analyst expects the stock to outperform the Benchmark over the next 12 months.
A rating of 'Neutral', indicates that the analyst expects the stock to perform in line with the Benchmark over the next 12 months.
A rating of 'Reduce', indicates that the analyst expects the stock to underperform the Benchmark over the next 12 months.
A rating of 'RS-Rating Suspended', indicates that the rating and target price have been suspended temporarily to comply with applicable regulations and/or firm policies in certain circumstances including when Nomura is acting in an advisory capacity in a merger or strategic transaction involving the company.
Benchmarks are as follows: United States/Europe: Please see valuation methodologies for explanations of relevant benchmarks for stocks (accessible through the left hand side of the Nomura Disclosure web page: http://www.nomura.com/research);Global Emerging Markets (ex-Asia): MSCI Emerging Markets ex-Asia, unless otherwise stated in the valuation methodology.
Sectors:
A "Bullish" stance, indicates that the analyst expects the sector to outperform the Benchmark during the next 12 months. A "Neutral" stance, indicates that the analyst expects the sector to perform in line with the Benchmark during the next 12 months. A "Bearish" stance, indicates that the analyst expects the sector to underperform the Benchmark during the next 12 months. Benchmarks are as follows: United States: S&P 500; Europe: Dow Jones STOXX® 600; Global Emerging Markets (ex-Asia): MSCI Emerging Markets ex-Asia.
Explanation of Nomura’s equity research rating system for Asian companies under coverage ex Japan published from 30 October 2008 and in Japan from 6 January 2009:
Stocks:
Stock recommendations are based on absolute valuation upside (downside), which is defined as (Price Target – Current Price) / Current Price, subject to limited management discretion. In most cases, the Price Target will equal the analyst’s 12-month intrinsic valuation of the stock, based on an appropriate valuation methodology such as discounted cash flow, multiple analysis, etc. A "Buy" recommendation indicates that potential upside is 15% or more. A "Neutral" recommendation indicates that potential upside is less than 15% or downside is less than 5%. A "Reduce" recommendation indicates that potential downside is 5% or more. A rating of "RS" or "Rating Suspended" indicates that the rating and target price have been suspended temporarily to comply with applicable regulations and/or firm policies in certain circumstances including when Nomura is acting in an advisory capacity in a merger or strategic transaction involving the subject company. • Stocks labelled as "Not rated" or shown as "No rating" are not in Nomura's regular research coverage. Sectors:
A "Bullish" rating means most stocks in the sector have (or the weighted average recommendation of the stocks under coverage is) a positive absolute recommendation. A "Neutral" rating means most stocks in the sector have (or the weighted average recommendation of the stocks under coverage is) a neutral absolute recommendation. A "Bearish" rating means most stocks in the sector have (or the weighted average recommendation of the stocks under coverage is) a negative absolute recommendation.
Strategy | China Henry Wu, CFA
7 December 2010 Nomura 174
Explanation of Nomura's equity research rating system in Japan published prior to 6 January 2009 (and ratings in Europe, Middle East and Africa, US and Latin America published prior to 27 October 2008):
Stocks:
A rating of "1", or "Strong buy", indicates that the analyst expects the stock to outperform the Benchmark by 15% or more over the next six months. A rating of "2", or "Buy", indicates that the analyst expects the stock to outperform the Benchmark by 5% or more but less than 15% over the next six months. A rating of "3", or "Neutral", indicates that the analyst expects the stock to either outperform or underperform the Benchmark by less than 5% over the next six months. A rating of "4", or "Reduce", indicates that the analyst expects the stock to underperform the Benchmark by 5% or more but less than 15% over the next six months. A rating of "5", or "Sell", indicates that the analyst expects the stock to underperform the Benchmark by 15% or more over the next six months. Stocks labeled "Not rated" or shown as "No rating" are not in Nomura's regular research coverage. Nomura might not publish additional research reports concerning this company, and it undertakes no obligation to update the analysis, estimates, projections, conclusions or other information contained herein.
Sectors:
A "Bullish" stance, indicates that the analyst expects the sector to outperform the Benchmark during the next six months. A "Neutral" stance, indicates that the analyst expects the sector to perform in line with the Benchmark during the next six months. A "Bearish" stance, indicates that the analyst expects the sector to underperform the Benchmark during the next six months. Benchmarks are as follows: Japan: TOPIX; United States: S&P 500, MSCI World Technology Hardware & Equipment; Europe, by sector — Hardware/Semiconductors: FTSE W Europe IT Hardware; Telecoms: FTSE W Europe Business Services; Business Services: FTSE W Europe; Auto & Components: FTSE W Europe Auto & Parts; Communications equipment: FTSE W Europe IT Hardware; Ecology Focus: Bloomberg World Energy Alternate Sources; Global Emerging Markets: MSCI Emerging Markets ex-Asia.
Explanation of Nomura's equity research rating system for Asian companies under coverage ex Japan published prior to 30 October 2008:
Stocks:
Stock recommendations are based on absolute valuation upside (downside), which is defined as (Fair Value - Current Price)/Current Price, subject to limited management discretion. In most cases, the Fair Value will equal the analyst's assessment of the current intrinsic fair value of the stock using an appropriate valuation methodology such as Discounted Cash Flow or Multiple analysis etc. However, if the analyst doesn't think the market will revalue the stock over the specified time horizon due to a lack of events or catalysts, then the fair value may differ from the intrinsic fair value. In most cases, therefore, our recommendation is an assessment of the difference between current market price and our estimate of current intrinsic fair value. Recommendations are set with a 6-12 month horizon unless specified otherwise. Accordingly, within this horizon, price volatility may cause the actual upside or downside based on the prevailing market price to differ from the upside or downside implied by the recommendation. A "Strong buy" recommendation indicates that upside is more than 20%. A "Buy" recommendation indicates that upside is between 10% and 20%. A "Neutral" recommendation indicates that upside or downside is less than 10%. A "Reduce" recommendation indicates that downside is between 10% and 20%. A "Sell" recommendation indicates that downside is more than 20%.
Sectors:
A "Bullish" rating means most stocks in the sector have (or the weighted average recommendation of the stocks under coverage is) a positive absolute recommendation. A "Neutral" rating means most stocks in the sector have (or the weighted average recommendation of the stocks under coverage is) a neutral absolute recommendation. A "Bearish" rating means most stocks in the sector have (or the weighted average recommendation of the stocks under coverage is) a negative absolute recommendation. Price targets
Price targets, if discussed, reflect in part the analyst's estimates for the company's earnings. The achievement of any price target may be impeded by general market and macroeconomic trends, and by other risks related to the company or the market, and may not occur if the company's earnings differ from estimates.
Strategy | China Henry Wu, CFA
7 December 2010 Nomura 175
DISCLAIMERS
This publication contains material that has been prepared by the Nomura entity identified on the banner at the top or the bottom of page 1 herein and, if applicable, with the contributions of one or more Nomura entities whose employees and their respective affiliations are specified on page 1 herein or elsewhere identified in the publication. Affiliates and subsidiaries of Nomura Holdings, Inc. (collectively, the 'Nomura Group'), include: Nomura Securities Co., Ltd. ('NSC') Tokyo, Japan; Nomura International plc, United Kingdom; Nomura Securities International, Inc. ('NSI'), New York, NY; Nomura International (Hong Kong) Ltd., Hong Kong; Nomura Financial Investment (Korea) Co., Ltd., Korea (Information on Nomura analysts registered with the Korea Financial Investment Association ('KOFIA') can be found on the KOFIA Intranet at http://dis.kofia.or.kr ); Nomura Singapore Ltd., Singapore (Registration number 197201440E, regulated by the Monetary Authority of Singapore); Nomura Securities Singapore Pte Ltd., Singapore (Registration number 198702521E, regulated by the Monetary Authority of Singapore); Capital Nomura Securities Public Company Limited; Nomura Australia Ltd., Australia (ABN 48 003 032 513), regulated by the Australian Securities and Investment Commission and holder of an Australian financial services licence number 246412; P.T. Nomura Indonesia, Indonesia; Nomura Securities Malaysia Sdn. Bhd., Malaysia; Nomura International (Hong Kong) Ltd., Taipei Branch, Taiwan; Nomura Financial Advisory and Securities (India) Private Limited, Mumbai, India (Registered Address: Ceejay House, Level 11, Plot F, Shivsagar Estate, Dr. Annie Besant Road, Worli, Mumbai- 400 018, India; SEBI Registration No: BSE INB011299030, NSE INB231299034, INF231299034, INE 231299034).
THIS MATERIAL IS: (I) FOR YOUR PRIVATE INFORMATION, AND WE ARE NOT SOLICITING ANY ACTION BASED UPON IT; (II) NOT TO BE CONSTRUED AS AN OFFER TO SELL OR A SOLICITATION OF AN OFFER TO BUY ANY SECURITY IN ANY JURISDICTION WHERE SUCH OFFER OR SOLICITATION WOULD BE ILLEGAL; AND (III) BASED UPON INFORMATION THAT WE CONSIDER RELIABLE.
NOMURA GROUP DOES NOT WARRANT OR REPRESENT THAT THE PUBLICATION IS ACCURATE, COMPLETE, RELIABLE, FIT FOR ANY PARTICULAR PURPOSE OR MERCHANTABLE AND DOES NOT ACCEPT LIABILITY FOR ANY ACT (OR DECISION NOT TO ACT) RESULTING FROM USE OF THIS PUBLICATION AND RELATED DATA. TO THE MAXIMUM EXTENT PERMISSIBLE ALL WARRANTIES AND OTHER ASSURANCES BY NOMURA GROUP ARE HEREBY EXCLUDED AND NOMURA GROUP SHALL HAVE NO LIABILITY FOR THE USE, MISUSE, OR DISTRIBUTION OF THIS INFORMATION.
Opinions expressed are current opinions as of the original publication date appearing on this material only and the information, including the opinions contained herein, are subject to change without notice. Nomura is under no duty to update this publication. If and as applicable, NSI's investment banking relationships, investment banking and non-investment banking compensation and securities ownership (identified in this report as 'Disclosures Required in the United States'), if any, are specified in disclaimers and related disclosures in this report. In addition, other members of the Nomura Group may from time to time perform investment banking or other services (including acting as advisor, manager or lender) for, or solicit investment banking or other business from, companies mentioned herein. Further, the Nomura Group, and/or its officers, directors and employees, including persons, without limitation, involved in the preparation or issuance of this material may, to the extent permitted by applicable law and/or regulation, have long or short positions in, and buy or sell, the securities (including ownership by NSI, referenced above), or derivatives (including options) thereof, of companies mentioned herein, or related securities or derivatives. In addition, the Nomura Group, excluding NSI, may act as a market maker and principal, willing to buy and sell certain of the securities of companies mentioned herein. Further, the Nomura Group may buy and sell certain of the securities of companies mentioned herein, as agent for its clients.
Investors should consider this report as only a single factor in making their investment decision and, as such, the report should not be viewed as identifying or suggesting all risks, direct or indirect, that may be associated with any investment decision. Please see the further disclaimers in the disclosure information on companies covered by Nomura analysts available at www.nomura.com/research under the 'Disclosure' tab. Nomura Group produces a number of different types of research product including, among others, fundamental analysis, quantitative analysis and short term trading ideas; recommendations contained in one type of research product may differ from recommendations contained in other types of research product, whether as a result of differing time horizons, methodologies or otherwise; it is possible that individual employees of Nomura may have different perspectives to this publication.
NSC and other non-US members of the Nomura Group (i.e. excluding NSI), their officers, directors and employees may, to the extent it relates to non-US issuers and is permitted by applicable law, have acted upon or used this material prior to, or immediately following, its publication.
Foreign-currency-denominated securities are subject to fluctuations in exchange rates that could have an adverse effect on the value or price of, or income derived from, the investment. In addition, investors in securities such as ADRs, the values of which are influenced by foreign currencies, effectively assume currency risk.
The securities described herein may not have been registered under the US Securities Act of 1933, and, in such case, may not be offered or sold in the United States or to US persons unless they have been registered under such Act, or except in compliance with an exemption from the registration requirements of such Act. Unless governing law permits otherwise, you must contact a Nomura entity in your home jurisdiction if you want to use our services in effecting a transaction in the securities mentioned in this material.
This publication has been approved for distribution in the United Kingdom and European Union as investment research by Nomura International plc ('NIPlc'), which is authorized and regulated by the UK Financial Services Authority ('FSA') and is a member of the London Stock Exchange. It does not constitute a personal recommendation, as defined by the FSA, or take into account the particular investment objectives, financial situations, or needs of individual investors. It is intended only for investors who are 'eligible counterparties' or 'professional clients' as defined by the FSA, and may not, therefore, be redistributed to retail clients as defined by the FSA. This publication may be distributed in Germany via Nomura Bank (Deutschland) GmbH, which is authorized and regulated in Germany by the Federal Financial Supervisory Authority ('BaFin'). This publication has been approved by Nomura International (Hong Kong) Ltd. ('NIHK'), which is regulated by the Hong Kong Securities and Futures Commission, for distribution in Hong Kong by NIHK. This publication has been approved for distribution in Australia by Nomura Australia Ltd, which is authorized and regulated in Australia by the Australian Securities and Investment Commission ('ASIC'). This publication has also been approved for distribution in Malaysia by Nomura Securities Malaysia Sdn Bhd. In Singapore, this publication has been distributed by Nomura Singapore Limited ('NSL') and/or Nomura Securities Singapore Pte Ltd ('NSS'). NSL and NSS accepts legal responsibility for the content of this publication, where it concerns securities, futures and foreign exchange, issued by their foreign affiliates in respect of recipients who are not accredited, expert or institutional investors as defined by the Securities and Futures Act (Chapter 289). Recipients of this publication should contact NSL or NSS (as the case may be) in respect of matters arising from, or in connection with, this publication. Unless prohibited by the provisions of Regulation S of the U.S. Securities Act of 1933, this material is distributed in the United States, by Nomura Securities International, Inc., a US-registered broker-dealer, which accepts responsibility for its contents in accordance with the provisions of Rule 15a-6, under the US Securities Exchange Act of 1934.
Strategy | China Henry Wu, CFA
7 December 2010 Nomura 176
This publication has not been approved for distribution in the Kingdom of Saudi Arabia or to clients other than 'professional clients' in the United Arab Emirates by Nomura Saudi Arabia, Nomura International plc or any other member of the Nomura Group, as the case may be. Neither this publication nor any copy thereof may be taken or transmitted or distributed, directly or indirectly, by any person other than those authorised to do so into the Kingdom of Saudi Arabia or in the United Arab Emirates or to any person located in the Kingdom of Saudi Arabia or to clients other than 'professional clients' in the United Arab Emirates. By accepting to receive this publication, you represent that you are not located in the Kingdom of Saudi Arabia or that you are a 'professional client' in the United Arab Emirates and agree to comply with these restrictions. Any failure to comply with these restrictions may constitute a violation of the laws of the Kingdom of Saudi Arabia or the United Arab Emirates.
No part of this material may be (i) copied, photocopied, or duplicated in any form, by any means; or (ii) redistributed without the prior written consent of the Nomura Group member identified in the banner on page 1 of this report. Further information on any of the securities mentioned herein may be obtained upon request. If this publication has been distributed by electronic transmission, such as e-mail, then such transmission cannot be guaranteed to be secure or error-free as information could be intercepted, corrupted, lost, destroyed, arrive late or incomplete, or contain viruses. The sender therefore does not accept liability for any errors or omissions in the contents of this publication, which may arise as a result of electronic transmission. If verification is required, please request a hard-copy version.
Additional information available upon request
NIPlc and other Nomura Group entities manage conflicts identified through the following: their Chinese Wall, confidentiality and independence policies, maintenance of a Restricted List and a Watch List, personal account dealing rules, policies and procedures for managing conflicts of interest arising from the allocation and pricing of securities and impartial investment research and disclosure to clients via client documentation.
Disclosure information is available at the Nomura Disclosure web page: http://www.nomura.com/research/pages/disclosures/disclosures.aspx
CH80-90
Nomura Asian Equity Research Group
Hong Kong Nomura International (Hong Kong) Limited 30/F Two International Finance Centre, 8 Finance Street, Central, Hong Kong Tel: +852 2536 1111 Fax: +852 2536 1820
Singapore
Nomura Singapore Limited 5 Temasek Boulevard #11-01, Suntec Tower Five, Singapore 038985, Singapore Tel: +65 6433 6288 Fax: +65 6433 6169
Taipei Nomura International (Hong Kong) Limited, Taipei Branch 17th Floor, Walsin Lihwa Xinyi Building, No.1, Songzhi Road, Taipei 11047, Taiwan, R.O.C. Tel: +886 2 2176 9999 Fax: +886 2 2176 9900
Seoul Nomura Financial Investment (Korea) Co., Ltd. 17th floor, Seoul Finance Center, 84 Taepyeongno 1-ga, Jung-gu, Seoul 100-768, Korea Tel: +82 2 3783 2000 Fax: +82 2 3783 2500
Kuala Lumpur Nomura Securities Malaysia Sdn. Bhd. Suite No 16.5, Level 16, Menara IMC, 8 Jalan Sultan Ismail, 50250 Kuala Lumpur, Malaysia Tel: +60 3 2027 6811 Fax: +60 3 2027 6888
India Nomura Financial Advisory and Securities (India) Private Limited Ceejay House, Level 11, Plot F, Shivsagar Estate, Dr. Annie Besant Road, Worli, Mumbai- 400 018, India Tel: +91 22 4037 4037 Fax: +91 22 4037 4111
Indonesia PT. Nomura Indonesia Suite 209A, 9th Floor, Sentral Senayan II Building Jl. Asia Afrika No. 8, Gelora Bung Karno, Jakarta 10270, Indonesia Tel: +62 21 2991 3300 Fax: +62 21 2991 3333
Sydney Nomura Australia Ltd. Level 25, Governor Phillip Tower, 1 Farrer Place, Sydney NSW 2000 Tel: +61 2 8062 8000 Fax: +61 2 8062 8362
Tokyo Equity Research Department Financial & Economic Research Center Nomura Securities Co., Ltd. 17/F Urbannet Building, 2-2, Otemachi 2-chome Chiyoda-ku, Tokyo 100-8130, Japan Tel: +81 3 5255 1658 Fax: +81 3 5255 1747, 3272 0869
Caring for the environment: to receive only the electronic versions of our research, please contact your sales representative.