Embed Size (px)
DESCRIPTION
China a Tough Market for Overseas Security Systems Integrators
Citation preview

China a Tough Market for Overseas Security Systems Integrators
Despite the big market share held by overseas security equipment brands in the China market, local companies dominate the Chinese security systems integration market and this situation is not forecast to change in the next few years. This is reflected by the lastest research from IMS Research (www.imsresearch.com ), “The China Market for Security Systems Integration – 2011 Edition.” According to the report, there was only one overseas company present in the top 15 service providers. The major problem for overseas systems integrators is that they only have opportunities in a limited number of end-user industries, such as commercial and manufacturing. It’s hard for them to win projects that have government investment, such as railways or utilities – which are forecast to have the highest growth potential over the next five years. This situation is further compounded by the fact that some qualifications necessary for bidding in certain industries are only open to local companies. That said, the China Security Systems Integration market is forecast to be worth over $13 billion in 2014 and overseas systems integrators should not be discouraged. Senior research analyst, Bo Zhang, describes the commonalities of successful overseas systems integrators in the report: “They are normally focused on high-end commercial buildings and manufacturing facilities. Typically they have global accounts who want to extend their business operations into China. These projects are not ones that local systems integrators can win. Furthermore, some overseas systems integrators also cooperate with local systems integrators on projects that are funded by local capital investment. Cooperation with overseas design companies and project management companies in China is very important.”
Joint Venture
A joint venture (JV) is a business agreement in which parties agrees to develop, for a finite time, a new entity and new assets by contributing equity. They exercise control over the enterprise and consequently share revenues, expenses and assets. There are other types of companies such as JV limited by guarantee, joint ventures limited by guarantee with partners holding shares.
With individuals, when two or more persons come together to form a temporary partnership for the purpose of carrying out a particular project, such partnership can also be called a joint venture where the parties are "co-venturers".
The venture can be for one specific project only - when the JV is referred to more correctly as a consortium (as the building of the Channel Tunnel) - or a continuing business relationship. The consortium JV (also known as a cooperative agreement) is formed where one party seeks technological expertise or technical service arrangements, franchise and brand use agreements,

management contracts, rental agreements, for one-time contracts. The JV is dissolved when that goal is reached.
Some major joint ventures include Dow Corning, MillerCoors, Sony Ericsson, Penske Truck Leasing, Norampac, and Owens-Corning.
A joint venture takes place when two parties come together to take on one project. In a joint venture, both parties are equally invested in the project in terms of money, time, and effort to build on the original concept. While joint ventures are generally small projects, major corporations also use this method in order to diversify. A joint venture can ensure the success of smaller projects for those that are just starting in the business world or for established corporations. Since the cost of starting new projects is generally high, a joint venture allows both parties to share the burden of the project, as well as the resulting profits.
Since money is involved in a joint venture, it is necessary to have a strategic plan in place. In short, both parties must be committed to focusing on the future of the partnership, rather than just the immediate returns. Ultimately, short term and long term successes are both important. In order to achieve this success, honesty, integrity, and communication within the joint venture are necessary.
Partner Selection
While the following offers some insight to the process of joining up with a committed partner to form a JV, it is often difficult to determine whether the commitments come from a known and distinguishable party or an intermediary. This is particularly so when the language barrier exists and one is unfamiliar with local customs, especially in approaches to government, often the deciding body for the formation of a JV or dispute settlement.
The ideal process of selecting a JV partner emerges from:
screening of prospective partners short listing a set of prospective partners and some sort of ranking due diligence – checking the credentials of the other party availability of appreciated or depreciated property contributed to the joint venture the most appropriate structure and invitation/bid foreign investor buying an interest in a local company
Companies are also called JVs in cases where there are dominant partners together with participation of the public. There may also be cases where the public shareholding is substantial but the founding partners retain their identity. These companies may be 'public' or 'private' companies. It would be out of place to describe them, except to say there are many in India.
Further consideration relates to starting a new legal entity ground up. Such an enterprise is sometimes called 'an incorporated JV', one 'packaged' with technology contracts (knowhow, patents, trademarks and copyright), technical services and assisted-supply arrangements.

The consortium JV (also known as a cooperative agreement) is formed where one party seeks technological expertise or technical service arrangements, franchise and brand use agreements, management contracts, rental agreements, for 'one-time' contracts, e.g., for construction projects. They dissolve the JV when that goal is reached.
Company incorporation
A JV can be brought about in the following major ways:
Foreign investor buying an interest in a local company Local firm acquiring an interest in an existing foreign firm Both the foreign and local entrepreneurs jointly forming a new enterprise Together with public capital and/or bank debt
What are the Advantages of forming a Joint Venture?
Provide companies with the opportunity to gain new capacity and expertise Allow companies to enter related businesses or new geographic markets or gain new
technological knowledge access to greater resources, including specialised staff and technology sharing of risks with a venture partner Joint ventures can be flexible. For example, a joint venture can have a limited life span and
only cover part of what you do, thus limiting both your commitment and the business' exposure.
In the era of divestiture and consolidation, JV’s offer a creative way for companies to exit from non-core businesses.
Companies can gradually separate a business from the rest of the organisation, and eventually, sell it to the other parent company. Roughly 80% of all joint ventures end in a sale by one partner to the other.
The Disadvantages of Joint Ventures
It takes time and effort to build the right relationship and partnering with another business can be challenging. Problems are likely to arise if:
The objectives of the venture are not 100 per cent clear and communicated to everyone involved.
There is an imbalance in levels of expertise, investment or assets brought into the venture by the different partners.

Different cultures and management styles result in poor integration and co-operation. The partners don't provide enough leadership and support in the early stages. Success in a joint venture depends on thorough research and analysis of the objectives.
3. Design of the Study
a. Description of Research Design and Procedures Used b. Sources of Data c. Sampling Procedures d. Methods and Instruments of Data Gathering e. Statistical Treatment
4. Analysis of Data
contains:
a. text with appropriate b. tables and c. figures
5. Summary and Conclusions
a. Restatement of the Problem b. Description of Procedures c. Major Findings (reject or fail to reject Ho) d. Conclusions e. Recommendations for Further Investigation
Report Outline
I. Review Objectives
a. Market Potential
b. Operational
c. Marketing

d. Sales Catalog
II. Overview and Methodology of the research process
III. Current Adhesive Customer Profile
a. Demographics
b. Concentrations
c. Average Annual Product Usage
IV. North American Market
a. Demographics
b. Trends
c. Current Market Conditions
V. Identify the… Message - Challenge - Opportunities
a. The Markets Priorities and Concerns
i. Motivators and De-Motivators
ii. Opportunities
iii. API’s Advantages
b. Market Segment Challenges
i. Competitors
ii. Alternatives
iii. Technology
VI. Company Analysis (Confidential - NOT AVAILABLE )
VII. Market Risk vs. Reward Analysis
VIII. Preliminary Recommendations (Confidential - NOT
AVAILABLE )
a. Target Companies

b. Target Regions
c. Advertising Channels
d. Other Marketing Channels
© 2008 David Strader, SMG – No reproduction without written authorization
5 Questions to be answered by the research.
Operational Questions
1) Will current production capacity of 4,000 units per month
adequately satisfy potential US demand? Alternatives?
2) Are our current sales reps prepared for this market?
3) Will additional sales reps be necessary? Alternatives?
4) How does the market now buy adhesives?
a) Direct from the manufacturer
b) Captive Sales Reps
c) Telephone/Fax
d) Internet
e) Wholesalers and/or Independent Distributors
Marketing Questions
1) What Associations and Trade Groups have influence in the market?
2) Are there publications and / or web portals with high market
segment readership?
3) How do other products “go to market” within the segment?
4) Level of market sophistication?
5) Is there seasonality to the business as well as the buy/sell cycle?
The Prospect Catalog

1) Identify and profile “A” prospects for the new line
2) Provide a directory of all manufacturers with more than $1,000,000
in sales of wood products requiring adhesives in the manufacturing
process
© 2008 David Strader, SMG – No reproduction without written authorization
6 Methodology
This research was conducted over a 90 day period in the first quarter of
2XXX by our Research Team. The information is of a proprietary nature
and upon final payment becomes the property of the research sponsors.
The information contained in this report will not be made available to
others without the express permission of the research sponsor. Sources
of information include:
9 Public information via Annual Reports to Shareholders as well as other
Government Reports which are available for public review
9 Company marketing information, advertising, company press releases,
and state and local news sources
9 Subscription based information (i.e. D&B, Business Credit Reports,
Thomas, Info USA, etc.)
9 On-Line research including third party references
9 Trade Associations, Directories and Publications
9 One on one telephone interviews with both current customers and
prospects
9 Various private industry sources
Every effort is made to provide accurate information. The information

provided is “best available” on the day the data was gathered. Changes in
personnel, company products and operations change daily. Previous
projects indicate the most volatile information will be found with changes in
personnel and company operations reported in the Prospect Directory.
The Strategic Marketing Group
David Strader
© 2008 David Strader, SMG – No reproduction without written authorization
7 (Modified for Confidentiality)
Current Customer Profile
API currently provides adhesives and environmentally safe lubrication
products for the wood manufacturing industry. The primary product line
for API has focused in the plywood, veneer and all wood paneling
manufacturing markets. You currently have twelve current customers that
are also manufacturers of wood flooring and use the new adhesive
formula. Based on the research of the entire Wood Flooring Manufacturing
sector current customers fall into a cross section of manufacturers with
more than $1 Million in sales from the manufacture of solid, veneered and
laminate flooring products.
Adhesive Usage Estimate: Rule of thumb adhesive usage is 100 units
for every 1 Million board feet of flooring manufactured. (Hard Wood vs.
Soft Wood and stabilizing sub stratus will also impact usage.)
Your Current Sales Profile: The adhesive has been sold as second sale
through your sales reps while servicing existing accounts. Re-supply has
primarily been accommodated through fax and phone calls to your service

center. The typical order is two unbroken cartons (4 units per carton).
Shipments are fulfilled via UPS. Primary reason for trying… “Your other
products work so well…” Reason for continuing to order “It works so
well…”
Customers tell us that your new adhesive is an improvement over the
other brands they have used and that they intend to continue to use the
product until something better [Researchers Comment “Cheaper that
works as well” ]
OBSERVATION: Based on telephone interviews 75% of current
customers stated the primary considerations for ordering a one or
two weeks supply 1) Shelf Life Concerns, 2) No Price Break for larger
quantities. The average order is for 2 cartons. Average Monthly use
is almost 4.5 cartons. Evaluate the benefits of a more aggressive
pricing structure for larger orders. If you can move your customers
to order one months supply instead of one or two weeks inventory it
should reduce administration and handling cost by 50% or more.
This will be more critical as demand for your product grows.
[Statistical Report of customer interviews unavailable]
© 2008 David Strader, SMG – No reproduction without written authorization
8 Customer Comments:
A telephone interview was conducted with your contact person at each
company that now uses your new formula (For a sample of the interview
guide see Appendix). A summary of the data we collected and few
highlights of quotes from our interviews follow.

Plant Manager:
“The first time we used the adhesive the guys on the line thought it wasn’t any good
because it did not smell like anything else we have ever used… the problem really was
that it did not smell at all!”
“It works very well. We won’t ship anything that would give us a bad name so we made
up a few boards and put it on the shop floor and worked it over pretty good. You name it
we spilled it on the test floor… we even drove a truck or two over it multiple times to
make sure. This new stuff holds up.”
Mill Owner:
“We ordered 1 gallon to test it out. The first time we used it we applied the adhesive by
hand and ran the flooring through the cold press. Just to see how fast it would grab we
started pulling it apart.., the adhesive held almost right away. After a couple minutes we
could not pull apart the layers. We have to be more careful now when we set up
machines because there are no “start over’s” if set up is bad, it sets to fast to salvage the
wood and the cores.”
Production Floor Manager:
“The service is great. We knew it would be we have been using their other products for
years and have been very satisfied. If we get into a bind and need more adhesive they
can get it delivered by the next morning. Can’t beat the product or the service….”
Plant Manager:
“We have one problem with the new adhesive. You cannot forget to put the cap back on
if you don’t use a full bottle. It only takes an hour and the top skims over and you cannot
get anything usable after that. The fast set is great for production, but the operators have
to be on the ball or we end up throwing away half a bottle with every startup.”

Production Manager:
“The biggest concern we have is shelf life. We had a problem right away with forgetting
to cap the bottles and ended up throwing away a lot of spoiled product. Our machines
take 1 and ½ gallons at start up and that will do an entire shift of normal production. That
half gallon left behind gets thrown away a lot. I love the product, Steve and Ron on the
floor love they don’t have to gag anymore from the smell. If I could make one suggestion
could you put it in either ½ gallon or 1 ½ gallon jugs so we don’t have to remember to cap
the adhesive before we finish set up?”
© 2008 David Strader, SMG – No reproduction without written authorization
9 Current Customer Demographics
2
2 1
1
1
1
1
3
Typical Customer Profile (Excluding Appalachia and Duke Lumber)
Finished Product Sales: $ 2.5 Million
Production: 4.5 Million Board Feet
Employee Count: 14
Log to Finish: 72%
Geographic Location
Manufacturing Locations: Upper Midwest

Sales Volume: Tennessee and West Virginia
Sales Coverage: Excellent Coverage through the Fort Wayne and
Knoxville Offices
OBSERVATION: Current customers of the new adhesive can be
easily serviced through your current sales reps. The members of
your sale staff assigned to these accounts have longstanding
relationships with both purchasing and production staff at each
facility.
It is important to note that your customers consistently give very
high marks to your sales team. 100% of respondents during our
telephone interviews praised the personal service and quick
response they now receive from your sales reps.
© 2008 David Strader, SMG – No reproduction without written authorization
10 Typical API Customer Adhesive Use and Expenditure (Annual Estimate)
Adhesive Usage: 314 Units
Adhesive Expenditures: $ 6,913
Sources of New Information (Listed by Importance)
1. Trade Associations
(a) National Wood Flooring Manufacturers Association
(b) National Oak Flooring Manufacturers Association
(c) National Hardwood Lumber Association
(d) Wood Products Manufacturing Association
2. Networking
3. Sales Reps/Vendors

4. Trade Publications (Limited Readership Reported)
(a) Southern Lumberman
(b) Wood Digest
Current Customer Usage and Market Comparison
(Annual Estimates)
Current Customers
Flooring
Revenue
(In Millions)
Board Feet
(In Millions)
Estimated
Adhesive
Usage
(Units)
Estimated
Adhesive
Expense
Appalachian2
$ 50.20 88.0 8,794 $193,468
Duke Lumber $ 40.20 70.0 7,035 $154,770
Quality Hardwood $ 6.80 12.0 1,196 $ 26,312
Brandon Co $ 3.10 5.3 528 $ 11,616
Mastercraft $ 3.00 5.2 528 $ 11,616

Cheat River $ 1.70 2.9 296 $ 6,512
Custom C&M $ 1.60 2.8 281 $ 6,182
Ecotek $ 1.60 2.8 281 $ 6,182
Kasper $ 1.60 2.8 281 $ 6,182
Unlimited $ 1.60 2.8 281 $ 6,182
Smooth $ 1.20 2.1 211 $ 4,642
Grizzly Ridge $ 0.84 1.4 141 $ 3,102
Totals $113 198 19,853 $436,766
Average (w/o top three) $ 1.80 3.12 314.22 $ 6,913
US Market Average $ 2.10 3.1 312 $ 6,864
2
Second largest manufacturer by sales in the US and API’s largest single customer for both
lubricants and adhesives
© 2008 David Strader, SMG – No reproduction without written authorization
11 North American Market
76
4
35
27
10
8
3
© 2008 David Strader, SMG – No reproduction without written authorization
12

16
29
5
24
14
7
7
4
4
1
12
6
14
16 6
3 2
5
More than 50MM $10MM - $25MM
$25MM to $50MM $5 MM - $ 9 MM
$1 MM - $ 5 MM
Less than $1 MM
State Sales Legend
23
12
8

5
4
2
3
1
2
2
1 1
1
2
1
1
The US Wood Floor Manufacturing
Market Summary:
No large national companies dominate this market segment. With the
exception of three companies all manufacturers operate within a single
state. The largest manufacturer is Columbia with group sales of almost
$117 million and manufacturing and distribution locations in Virginia, West
Virginia and Arkansas. Many manufacturers also manufacture and market
niche wood products. A majority of manufacturers’ sell their wood flooring
products under various brand names that may or may not be sold on a
national basis. Only the largest manufacturers provide products for
national brands or distribute their product through a national channel
(Home Depot, Lowes, etc.)

Industry experts predict a strong future for wood floor products. Consumer
demand fueled by improvements in the durability of finish, moisture
resistant characteristics and product stability is driving this continued
strong outlook. In addition to the domestic business there is a growing world wide demand
for wood flooring. The export market is strong and continues to grow
especially for exotic woods and European spec. ready to install flooring.
The one common element in floor manufacture today is a need for high
durability adhesives and or other bonding techniques that meet both
European and US EPA standards.
Wood flooring Production In the US
99 mbf (1975)
1,207 mbf (1955)
1,102 mbf (1965)
75 mbf (1985)
658 mbf (1995)
875 mbf (2005)
-
100
200
300
400
500
600
700

800
900
1,000
1,100
1,200
1,300
Year
Million Board Feet
1950's 1960's 1970's 1980's 1990's 2000's
Perspectives from the National Wood Flooring Association
(Condensation of Reports)
The $2.6 billion (retail dollars) U.S. wood flooring market has made
significant inroads in the domestic floor coverings industry over the past
two decades. The inroads were stimulated by growing consumer
acceptance of high-end hard surface flooring, as well as more diverse
offerings by wood flooring manufacturers. Manufacturers now offer a wide
range of species, colors, and custom-type designs. The industry has also
stimulated demand with easier and less costly to install products such as
prefinished, engineered, and glueless wood floors. These new products
and technologies have increased competitive pressures, especially from
foreign-based manufacturers. This has led to a sluggish industry bottom
line performance.
© 2008 David Strader, SMG – No reproduction without written authorization
13 Industry Trends

U.S. shipments, exports, and price trends for hardwood and softwood
flooring products continue to rise. Even in a slowing housing market the
outlook for hardwood flooring remains strong due to continued demands in
remodeling and commercial construction market segments. Market trends
are especially strong for prefinished and engineered wood products, and
for exotics, rustics, and other hardwood products.
Importation of “Ready to Install” Wood Flooring
Globally manufacturing capacity for wood flooring is significant. This could
be troublesome for US manufacturers, especially noting the increased
demand for more exotic woods that cannot be grown domestically. As of
the end of 2006 international suppliers of finished product accounted for
10% of the US and Canadian markets. An in depth analysis of
international competition paints a much brighter picture for North American
Manufacturers.
(Sources: Various Industry Articles published by NWFA from 7/2005 thru 9/2006)
International Conditions
Industry and independent research has noted that even though
international manufacturing has a large capacity to produce product, the
raw timber required for flooring is in very short supply. Several factors
have influenced the availability of timber. 1) Growing environmental
pressure to preserve standing timber 2) Protectionism of foreign
governments attempting to maintain large timber reserves for rapidly
growing internal demand (China has limited export to 5% of domestically
grown timber products). 3) US competition for exotic raw timber.

1) Environmental Movement – the growing pressure from international
groups like Green Peace and Save the Forest have begun to make
inroads in developing nations. The impact is especially noted in
Southeast Asia and the Pacific Rim with the shut down of many
logging operations in the Philippines, Viet Nam and other smaller
lumber producing nations. Flooring and wood product Manufacturers
in Japan, Taiwan, and even in mainland China have changed over to
other non timber related manufacturing succumbing to the shortage of
#1 grade raw hardwoods.
2) Protectionism - India began preserving its limited timber resources
more than a decade ago, others are now following suit. The most
notable change has been China. As vast areas of timber have been
lost never to recover due to poor management has lead to an abrupt
© 2008 David Strader, SMG – No reproduction without written authorization
14 shift away from using domestically grown lumber for export. As noted
earlier the Chinese have now quietly limit export of wood products to
5% of all domestic timber harvested. The primary source of timber for
China is now Viet Nam, Burma and Thailand. Other sources include
South America and Eastern Africa, area’s where competition for raw
timber has driven the price to all time highs.
3) Timber Supply - As the American market continues to trend for more
exotic looks US and Canadian manufactures have taken to importing
raw timber to meet demand. As the North American market has shown
a willingness to pay the increased costs related to exotic lumber

products North American timber buyers have had no reluctance to
outbid others for raw timber. The import of raw timber followed by the
manufacturing and distributing finished product has helped maintain
the domestic manufacturers’ strength. North American Production
efficiencies along with an effective marketing and distribution structure
place foreign competitors at a distinct disadvantage in the North
American market.
© 2008 David Strader, SMG – No reproduction without written authorization
15 Market Statistics
S1
$106.75
$94.36
$64.66
$59.70
$55.74
$54.79
$41.29
$35.96
$30.49
$26.93
$25.87
$22.86
$20.65
$15.71

$14.78
$14.38
$13.75
$12.89
$12.55
$10.94
$9.27
$6.96
$6.63
$6.00
$5.69
$5.54
$4.55
$4.24
$4.22
$3.54
$3.06
$2.41
$1.98
$1.80
$1.61
$1.61
$1.01
$0.80

$0.59
$0.20
$0.17
IL, 76
WV, 5
AR, 14
VA, 7
SC, 29
TN, 16
KY, 4
MO, 15
AZ, 6
GA, 27
TX, 24
CA, 23
NY, 14
WI, 12
WA, 10
NC, 16
FL, 12
NJ, 8
MI, 7
NH, 2
MN, 4

MT, 8
MA, 5
ID, 3
PA, 4
IN, 5
OH, 6
AL, 3
OR, 3
NE, 2
MS, 4
CT, 1
CO, 2
OK, 2
DE, 1
KS, 1
MD, 1
NM, 2
AK, 1
UT, 1
IA, 1
0
20
40
60

80
100
120
Sales in Millions
Facilities Per State
The concentration of facilities does not necessarily correlate with the
potential size of the market for adhesives or lubricants. As illustrated by
the above chart Illinois has the largest number of wood flooring
manufacturers and the produces the largest volume of wood flooring, but
West Virginia is the second largest producer with only five very large
manufacturers (one of which you already control from both lubrication and
adhesive products). Compare West Virginia to its neighbor Ohio (27th) that
has 6 Manufacturers but only 4.5 million in sales volume. To maximize
sales and marketing efficiencies a careful plan will need to be developed
using multiple avenues to aggressively go after the business.
© 2008 David Strader, SMG – No reproduction without written authorization
16 Wholesale Flooring Sales and Adhesive Usage By State
State Manufacturers Sales Volume* Usage (Gal.)
Illinois IL 76 106.75 18,681
West Virginia WV 5 94.36 16,512
Arkansas AR 14 64.66 11,315
Virginia VA 7 59.70 10,447
South Carolina SC 29 55.74 9,754
Tennessee TN 16 54.79 9,588

Kentucky KY 4 41.29 7,225
Missouri MO 15 35.96 6,293
Arizona AZ 6 30.49 5,336
Georgia GA 27 26.93 4,713
Texas TX 24 25.87 4,528
California CA 23 22.86 4,000
New York NY 14 20.65 3,614
Wisconsin WI 12 15.71 2,749
Washington WA 10 14.78 2,587
North Carolina NC 16 14.38 2,517
Florida FL 12 13.75 2,405
New Jersey NJ 8 12.89 2,256
Michigan MI 7 12.55 2,196
New Hamp. NH 2 10.94 1,915
Minnesota MN 4 9.27 1,622
Montana MT 8 6.96 1,218
Massachusetts MA 5 6.63 1,161
Idaho ID 3 6.00 1,050
Pennsylvania PA 4 5.69 996
Indiana IN 5 5.54 969
Ohio OH 6 4.55 795
Alabama AL 3 4.24 741
Oregon OR 3 4.22 739
Nebraska NE 2 3.54 620

Mississippi MS 4 3.06 535
Connecticut CT 1 2.41 422
Colorado CO 2 1.98 347
Oklahoma OK 2 1.80 314
Delaware DE 1 1.61 281
Kansas KS 1 1.61 281
Maryland MD 1 1.01 176
New Mexico NM 2 0.80 141
Alaska AK 1 0.59 103
Utah UT 1 0.20 35
Iowa IA 1 0.17 30
TOTALS 387 $806.90 141,208
* Flooring Sales In Millions of Dollars
© 2008 David Strader, SMG – No reproduction without written authorization
17 From purely a logistics and selling efficiency point of view accessing this
market from current offices rather than reaching to the west coast or
opening new offices to cover Minnesota, Wisconsin and Iowa would not be
a path to follow. Covering your current territory with a more focused
approach has the potential to maximize your current production
capabilities.
Top 10 Manufacturers
COMPANY STATE EE # SALES Credit Rating
Columbia Flooring AR 260 $ 52,260,000 A+
Appalachian Custom Dry Kilns WV 250 $ 50,250,000 A

Somerset Hardwood Flooring KY 200 $ 40,200,000 A
Jim Duke & Assoc TN 200 $ 40,200,000 B
Columbia Flooring WV 200 $ 40,200,000 A+
Columbia Flooring VA 120 $ 24,120,000 A+
Keyci Flooring Experts Inc VA 99 $ 19,899,000 C+
Carpet One Desert Floors AZ 45 $ 13,275,000 A+
Ozark Mountain Hardwood Inc MO 60 $ 12,060,000 A
Top 10 Total Sales $ 292,464,000.00
Estimated Adhesive Use (in Units) 102,362 (8,530 Mo.)
Columbia Flooring Group Summary
Columbia Flooring AR 260 $ 52,260,000.00 A+
Columbia Flooring WV 200 $ 40,200,000.00 A+
Columbia Flooring VA 120 $ 24,120,000.00 A+
Group Totals 580 $ 116,580,000.00
The top ten manufacturers account for more than 35% of all flooring
produced in the United States (Columbia with three locations account for
over 14%). API currently serves two of the top 10 (Appalachian Custom
and Duke Lumber). It is possible to utilize all of your production capacity
with a focus only on the top ten. However Columbia has not been open to
repeated attempts to open a dialogue. Shipping distance creates an
inventory and shipping problem for Carpet One in Arizona. Any marketing
strategy to focus exclusively in the top ten must take those factors into
consideration.
© 2008 David Strader, SMG – No reproduction without written authorization

18 Message - Challenges - Opportunities
Introducing your new adhesive to current customers is the most
straightforward approach to growing sales. Your service levels, product
performance and brand strength within this group is very strong. However
you have already placed your product in all but two of your current
customers that manufacture wood flooring.
Historically your markets have focused on lubrication of wood cutting
equipment with sawmills and high end furniture manufacturing as your
core constituency. API knows those markets well and continues to
experience strong sales in these two market segments. To successfully
access this new market some reconnaissance is important.
Wood Floor Manufacturing Priorities and Concerns
Discussions with industry experts as well as your customers have
uncovered some important factors to keep in mind. There are three types
of flooring manufactures: Log to Floor, Floor Mfg. only and Antique Wood
Floor manufacturing. Each type of manufacturer have common
circumstances and unique to their process conditions as related to the use
of adhesives in the manufacturing process. Those that are in the ‘Log to
Floor’ process have all the same concerns you are familiar with in the raw
timber processing market, but once the log has been dried and begins the
process of becoming flooring the situation changes. As for those that do
not use their own raw timber there are some important factors to keep in
mind.
‘Log to Floor’ Manufacturers

These producers make up a large segment of the market. They are the
oldest and generally the best candidates for API to market its entire
product line. This group tends to have family ownership that is involved in
day to day operations and have strong loyalty to suppliers and are steady
producers of wood products.
Flooring Only Manufacturers
With few exceptions (Appalachian (WV), Duke (TN) and Somerset (KY))
these are the largest manufacturers and rely on multiple sources for rough
sawn, floor grade lumber to provide the raw material for their operation.
These producers tend to have staff turnover and are very sensitive to
© 2008 David Strader, SMG – No reproduction without written authorization
19 consistent delivery and availability of product to meet a variable need.
This group also produces multiple flooring options that include, solid
hardwood, veneer, exotic and laminated flooring retailed under multiple
brand names with varying quality and production standards.
Antique and Reclaimed Wood Flooring Manufacturers
These are a unique group of producers and are primarily found in the
Northeastern US. Raw material is not new timber but reclaimed timber
from old warehouses, manufacturing facilities and barns. In most cases
they use larger amounts of adhesive in that the top layer of wood used in
the process is dryer and absorbs more adhesive that higher moisture
content lumber. This is one of the fastest growing segments of the
market. Traditionally API has not marketed to this group of
manufacturers.

For easier comparison we have condensed our findings into a Quick
Reference Guide found on the next page.
© 2008 David Strader, SMG – No reproduction without written authorization
20 Quick Reference Guide
Legend:
Marketing Quick
Reference Guide
Log to
Floor
Flooring
Only Antique
Motivators
Delivery Guarantee Y Y Y
Overnight Shipping Available - Y -
On Site Technical Help Y N Y
Competitive Pricing Y Y Y
EPA & EU Approval Y Y+ -
Easy Ordering Y Y Y
Secondary Products Y N N
De-motivators
Product Delay Y+ Y+ Y+
Online or 800 number support N Y Y
Automated Re-Ordering Systems Y Y Y
Inconsistent Product Y Y Y

Spoilage Y Y Y
Inconvenient Packaging Y - Y
API Advantages
Delivery Guarantee Y Y Y
Overnight Shipping Y Y Y
On Site Technical Help Y Y Y
Fresh Product Y Y Y
“Y+” = Deal Maker/Killer “Y”= Important Factor
“-“= Neutral “N” Unimportant
© 2008 David Strader, SMG – No reproduction without written authorization
21 Market Segment Challenges
The market is small without the potential for unlimited sales. Adhesives
and other manufacturing chemicals are primarily provided by 3M. There is
little advertising or marketing done with API’s product types so there is
little pattern for how others “go to market” with this manufacturing group.
Adhesives are very important to the production of engineered flooring.
Today 87% of the market is classified as engineered flooring utilizing
multiple layers of wood bonded together to create a durable and stable
flooring product. Adhesives that do not perform well or that are not
approved by the EPA are not well received by those taking a long term
view of their market. Very few short term producers survived the turmoil of
the 70’s and 80’s.
API’s primary challenge is to create opportunities to tell their message to
the key decision makers in the market. In about half the industry it will be

the owner/operator. As you attempt to access larger manufacturers you
will have more than one decision maker to win over: Engineer, Production
Manager, and Quality Control. No competitor now has a strong hold of the
market. 3M is ignoring the market and CPI is for all practical purposes in
the market by default.
Even with the strong dissatisfaction with 3M the brand loyalty and image
maintains a strong hold. The product works well, it is currently EPA
approved, and the manufacturers are comfortable with the product. Based
on discussions with manufacturers there is openness to new options but
any approach will be met with some skepticism.
© 2008 David Strader, SMG – No reproduction without written authorization
22 Competitor Quick
Reference Guide API 3M CPI
Motivators
Delivery Guarantee Y N N
Overnight Shipping Available Y Y -
On Site Technical Help Y N N
Competitive Pricing Y N Y
EPA & EU Approval Y Y -
Easy Ordering Y Y -
Secondary Products Y Y N
De-motivators
Product Delay N Y -
Online or 800 number support Y Y Y

Automated Re-Ordering Systems N Y Y
Inconsistent Product N N Y
Spoilage Y Y -
Inconvenient Packaging Y N Y
“Y”= Yes |”N”= No | “-“= Unknown
Specific Analysis and Recommendations
for this Segment Not Available for Public
Review
© 2008 David Strader, SMG – No reproduction without written authorization
23 Market Risk vs. Reward Analysis
Current Capabilities vs. Market Potential
Concerns over production capacity and meeting future demand are well
founded. The highly proprietary nature of the production system of this
new adhesive makes third party manufacturing unacceptable. Forecasting
the timing required to add production capacity to meet demand is
important to minimizing market risk due to unmet demand for product after
the initial sale. (See 3M competitive summary for an example)
Current Customer Production Annual Monthly
Deliveries (Units) 19,853 1,654
Sales Volume $ 436,766 $ 36,397
Sales Margin3
109,192 9,099
Remaining Available Capacity
Units 28,152 2,346

Potential Revenue $ 619,236 $ 5,1603
Potential Sales Margin3
$ 154,812 $ 12,901
Maximum Current Production Capacity (80% Utilization)
Units 48,000 4,000
Potential Revenue $ 1,056,000 $ 88,000
Potential Sales Margin3
$ 264,000 $ 22,000
Analysis - Based on the current market you will maximize production
capabilities with a 40% market share. Your current market share is 16%.
We believe you can safely double sales before adding additional
production capacity.
OBSERVATION: Based on the locations of your current sales offices
you can meet the 40% share by focusing on expanding sales with
other customers and developing new clients within the reach of your
current sales offices.
3
Based on current sales margin target of 25% of sales
© 2008 David Strader, SMG – No reproduction without written authorization
24 - Company Capabilities Review &
Analysis,
- Risk vs. Reward Analysis
- Specific Operating and Marketing
Recommendations

- Preliminary Implementation Plan
– CONFIDENTIAL –
NOT AVAILABLE FOR PUBLIC
REVIEW
© 2008 David Strader, SMG – No reproduction without written authorization
25 Leading Trade Associations for Wood
Floor Mfg
A world wide membership of more than 3500 and is a
leading voice for Wood Floor manufacturers.
Hardwood Council, The - Founded in 1993, the Hardwood
Council is a coalition of 11 hardwood lumber and product
associations. The Council provides technical information on North
American hardwood applications for builders, architects, interior
designers and remodelers.
Hardwood Manufacturers Association - HMA is a non-profit
national trade association of more than 150 U.S. hardwood lumber
producers and processors in 34 states.
Maple Flooring Manufacturers Association - Since 1897 the
Maple Flooring Manufacturers Association has established itself as
the authoritative source of technical and general information on
maple sports flooring and has attracted a membership of
manufacturing mills, installation contractors, distributors and allied
product manufacturers who subscribe to the high standards for
which the association stands.

National Hardwood Lumber Association - NHLA is a non-profit
trade association made up of more than 1,700 member firms who
produce, sell and use hardwood lumber.
National Oak Flooring Manufacturers Association - Since 1909 the
principal function of NOFMA has been to formulate and administer industry
standards on hardwood flooring.
World Floor Covering Association - The World Floor Covering Association
is a recognized industry leader in legislative advocacy, marketing research
and education.
© 2008 David Strader, SMG – No reproduction without written authorization
26 © 2008 David Strader, SMG – No reproduction without written authorization
27
Top 10 Manufactures Analysis and Sales Lead Catalog follows this page.
China’s Foreign Investment Policy Movements and Their ImpactsIn order to create a favorable investment environment and to encourage overseas firms to invest in China, since the year of 1979 the Chinese government has gradually set up a relatively complete legal system, and constituted a foreign investment policy system, which mainly includes industrial policies, regional policies, tax policies and financial polices.
As for the legal framework, the main laws and regulations for foreign investments in China include:
Major Foreign Investment Laws and Regulations
* The law of P.R.C. on Chinese-Foreign Equity Joint Ventures and its implementation regulations;
* The law of P.R.C. on Chinese-Foreign Contractual Joint Ventures and its implementation regulations;
* The law of P.R.C. on Wholly Foreign-Owned Enterprise and its implementation regulations;
* The law of P.R.C. on Foreign-invested enterprises, the income tax and its implementation regulations;

* Provisions on Guiding Foreign Investment Direction; Industrial Catalogue for Foreign Investment; Catalogue of Advantageous Sectors for Foreign Investment in Central and Western Regions;
* The law of P.R.C on the Protection Taiwan Compatriots' Investment.
(Note: the related laws and regulations also apply to the investments from Hong Kong, Macao and Taiwan in China mainland.)
General Laws and Regulations
* The Company Law of the People's Republic of China;
* The Contract Law of the People's Republic of China;
* The Insurance Law of the People's Republic of China;
* The Arbitration Law of the People's Republic of China;
* The Labor Law of the People's Republic of China;
* Provisional Regulations of the People's Republic of China on value-added Tax;
* Provisional Regulations of the People's Republic of China on Consumption Tax;
* Provisional Regulations of the People's Republic of China on Business Tax.
International Treaties
* Bilateral Investment Treaties;
* Bilateral Agreement on the Avoidance of Double Taxation.
Forms of Foreign InvestmentChinese-Foreign Equity Joint Ventures, China-Foreign Contractual Joint Ventures, Wholly Foreign-Owned Enterprise is the three main forms of Foreign Direct Investment in China for absorbing foreign capital. Other investment forms include Share Company with Foreign Investment, Foreign Invested Holding Company, Joint Exploitation, BOT, etc.
1. Chinese-Foreign Equity Joint Ventures
Chinese-Foreign Equity Joint Ventures are also called as Share Company with Foreign Investment. They are enterprises jointly established within Chinese territory by foreign companies' enterprises, other economic entities or individuals on one side and Chinese companies, enterprises or other economic entities on the other side. An equity joint venture shall be invested and operated jointly by both foreign and Chinese investors, who shall share the profits and losses, as well as risks, in proportion to their respective shares in the registered capital. Chinese-Foreign Equity Joint Ventures are Limited Liability Company, and possess the status of Chinese legal person. In such an enterprise, the proportion of the investment contributed by the

foreign party shall in general not be less than 25% of the total. The partner could offer cash or other kinds of things instead such as building, workshop, machinery, industrial property right, special technique, and field utilization right. The profits and other legal interests that foreign investors have shared can be remit out or reinvest in China.
2. Chinese-Foreign Contractual Joint Ventures
Chinese-Foreign Contractual Joint Ventures are enterprises Jointly established within Chinese territories by foreign companies, enterprises, other economic entities or individuals and Chinese companies, enterprises or other economic entities, according to their cooperative conditions. The both parties to a contractual joint venture should prescribe in the contract their respective conditions, rights, obligations, incomes distribution, responsibilities for risks and debts, the company management and negotiations on the property transaction at the expiration. When establishing China-Foreign Contractual Joint Ventures, the foreign party usually provides all or major part of capital, while the Chinese party provides land, factory buildings, certain usable machines and facilities, and in some cases a certain amount of capital as well. Chinese-Foreign Contractual Joint Ventures may posses the status of conventional person or not.
HOMEGROWN SUPPLIERS STILL DOMINATE THE CHINESE SECURITY MARKET BUT ARE THINGS
ABOUT TO CHANGE?The Physical Security Industry has undergone significant structural changes in the last 3 years and this accelerated in 2012 driven by the need to combat the worst trading conditions for decades.
The structure of the business has morphed not just to compensate or accommodate but also to meet and beat the challenge and deliver growth. Our report “The Physical Security Business in 2012” - http://memoori.com/physical-security-2012 forecasts growth of 4% across the globe in product sales in 2013 but that will depend on much higher levels of growth in Asia and particularly China.In this article we take a look at both the demand and supply side of the physical security industry and how it is shaping up in China and why we are about to see much more two way trading between the West and China.
China – The Fastest Growing and soon to be the Largest Market in the WorldDespite a fall in GDP growth in the last few years demand for physical security in China has forged ahead delivering a CAGR of some 25 to 30% over the last 5 years, the highest growth recorded in our industry and there is no indication that growth will fall off in the near future.
One of the reasons for this is that the penetration of security systems in China is still remarkably low. The GDP per capita in 2012 is projected at $6,120, and sales per capita was $2.4 per capita showing that the potential for future growth is enormous and would have to grow 6 times to

equal the current penetration level in North America. So why is it that US and European manufacturers are not making a better job of exploiting the Chinese market? Conversely why is it that Chinese manufacturers are having difficulty in establishing a solid presence in the developed markets of the world with the exception of delivering through OEM (Own Equipment Manufacturers) channels.
China is developing a strong indigenous manufacturing supply industry and in particular two companies Hikvision and Dahua are growing fast increasing their share of the local market. They have also been taking product business away from Taiwanese and Korean manufacturers in western markets.
Hikvision sales in 2012 were somewhere around $1.2 billion, a growth of 40% over 2011 and of this export product sales of DVR/ camera equipment was around 35%. The majority of growth has come from domestic acquisitions, of access control, guarding services and specialist vertical market systems integration companies. They are developing a similar model to Honeywell and Schneider of developing a systems and product business separately.
Hikvision’s latest Q1~Q3 report showed total assets around US$2b. At per share value of about RMB$32 (http://stockhq.ccstock.cn/pages/stockhome/002415.html) and about 2 billion shares available (2,008,611,611 at the end of Sept 2012) giving it a valuation of US$10 billion. We don’t have any recent info on the cash flow, but judging from the 2011 report and the growth rate of 40%, it could be around US$1.2 billion. So Hikvision (ranked by IMS Research as the world’s largest supplier of DVR and video surveillance equipment) could also soon become one of the world’s largest suppliers of security systems.Technology and Getting the Marketing Message Across is ImperativeThere is little point in comparing Hikvision ‘s success with that of Axis Communications the No1 supplier of IP surveillance networking cameras, because their business models are quite different, but it does beg the question of why Axis with its technological leadership has not yet made a bigger impact on the world’s fastest growing market. One of the reasons could be that analogue systems are still flavor of the month in China and as such it is difficult to make the breakthrough with IP systems because the distribution channels are still immature. Local manufactures rather late in the race are now moving ahead with this technology but are way behind the western early adopters. Does this now leave the door wide open for Axis communications and other specialist manufacturers of IP products?
Some 15 years ago fire detection systems in China moved almost overnight to analogue addressable systems that cost double the price and no local manufactures could supply them. Imported products flooded in and the local system installers quickly learn how to install them. Although moving from analogue to IP requires more skill, it will happen, and in China it will come quickly. Price is no longer king in western markets but cost of ownership made up of many factors is; and this will also apply in China as IP takes hold and offers many different and improved solutions.
So our take on the Pelco / Hikvision rumor is that it is nothing to do with M&A at this time but using Pelco’s IP technology for the Chinese market pushed through Hikvision channels of distribution and Hikvision products into the US market through Pelco’s channels of distribution.

Neither has established themselves in each other’s backyard, despite a lot of time, money and energy being spent and here is an opportunity for them to do it in a joint market that our report predicts will account for 60% of the world’s market by 2017. If the alliance works they can then join together to become the No 1 Video Surveillance manufacturer / system supplier in the world if it suits both parties.
Whilst China is about to become the largest market in the world and although it is dominated by indigenous manufacturers it does not have one company that strides the international stage comfortably with products at the leading edge. Hikvision come closest and its alliance with Schneider which was announced in July 2012 is one part of its strategy to change this. We think others will follow.
http://www.memoori.com/homegrown-suppliers-still-dominate-the-chinese-security-market-but-are-things-about-to-change/
Chinese Security market enjoys buoyant growth between 2006-2008
June 2009

Figure 1: Geographic distribution of IBC(s) in China 2008The Chinese IBC(s) systems market experienced buoyant growth between 2006-2008. Overall, the market for Security Systems was valued at RMB 21.8 billion in 2008, of which the total product market was worth RMB 14.4 billion.
CCTV/Video Surveillance was the largest segment, accounting for 72 per cent of the IBC(s) market; followed by Access Controls market with 15 per cent and the Intruder Alarms market holding 14 per cent. Excellent growth was reported in IBC(s) systems during the period of 2006-2008. Double-digit growth was recorded in the Chinese economy over the last few years and the impressive growth in the new construction sector has contributed greatly to the development of the security market. In 2008, the value of the CCTV/Video Surveillance market, at hardware ex-factory prices, was estimated at RMB 10,213 million. The Surveillance market has out-performed the Access Controls and Intruder Alarms market in terms of both value and growth.
Combating crime is one of the main drivers of the demand of IBC(s) and the authorities have been introducing a range of measures, most notably the "Safe Cities" scheme. This is because China's extremely dense and increasing population has resulted in the increase of crime during the past decade.
A strong move towards comprehensive networked systems that require more sophisticated supervisory controls has been noted. Demand for Security Management systems has been steady, especially where access control and CCTV are integrated, therefore increasing the value added systems business.
Despite very favourable trading conditions, imported IBC(s) products struggle to compete on price with local manufactured products at the medium to low end of the market. However, imported products are being used on more sophisticated and high quality projects, particularly on foreign financed projects. During 2009-2010 the growth of the Chinese market is expected to slowdown, feeling the impact of the economic crisis, but it is expected to return to its fast paced growth from 2011.The Beijing region accounts for the largest market share, accounting for 29 per cent of the total business. Government, public and industrial sectors are the main sections in the Beijing region whereas the Guangdong region is more geared towards the commercial sector. The Shanghai region has witnessed significant growth during the past few years and now takes 22 per cent of the total Chinese market. Currently the West region (Sichuan, Shaanxi and Chongqing area)

takes nine per cent of the total market, but it is likely to experience further growth in five years time.
Analysis of 2012 Chinese Motorcycle IndustryBy David McMullan, International Editor ChinaMotor Magazine
Friday, February 22, 2013
Share
RSS
Font:
The state of the Chinese motorcycle industry in 2012 was described dramatically by the Chinese government as
'walking on thin ice, and in great difficulty'. The market was dismal, sales were falling, and motorcycle output and
sales were slumping; motorcycle sales in some areas of China experienced declines of up to 50% year on year,
setting an historic low.
According to CAAM statistics, the output and sales of the Chinese motorcycle industry (including export) between

January and October were 19.505 million units and 19.5772 million units, down 11.94% and 11.86% year-on-year
respectively. The output and sales of two-wheeled motorcycles were 17.5872 million units and 17.6607 million units,
down 12.99% and 12.94% year-on-year. The output and sales of motor-tricycles were 1.9178 million units and 1.9165
million units, down 0.96% and 0.43% from 2011.
The Chinese motorcycle industry had enjoyed rapid development since China's ‘reform and opening up’ in the 1980s
but that development began to slow down after a recession hit 2008 and the slump became ever more obvious after
the implementation of National III emission standards in China in 2011. Other problems still compound the progress
of the industry; problems like the banning or limiting the use of motorcycles in Chinese cities' has seriously affected
motorcycle sales in urban Chinese areas, the all too homogeneous products, unitary marketing methods and the slow
reform and transformation of the industry all added to the misery of the industry in 2012.
Top Tier Companies Not Exempt from Crisis
Established Chinese motorcycle enterprises are beginning to struggle to survive. CAAM statistics show that of the top
20 motorcycle manufacturers (as of October 2012), only six companies experienced sales increases year-on-year,
these being only slight increases. The other 14 companies suffered various drops (of up to 30%). Those who suffered
the biggest decline were mostly first-tier companies.
Chinese motorcycle enterprises faced varied difficulties in 2012, and competition on the domestic market grew fiercer
as sales networks were shifted from urban to rural areas. Meanwhile, factors such as soaring raw material prices and
rising labor and operation costs further affect the profits of motorcycle enterprises. The dismal general economic
climate has also greatly affected import/export market purchasing power and caused a significant motorcycle sales
decline. This greatly hindered the development of numerous motorcycle enterprises, and many were forced to reduce
expenditure in activities, product R & D, and marketing. Some motorcycle manufacturers were even forced into
liquidation putting the stability of the Chinese motorcycle industry in unprecedented difficulty.
Some leading Chinese independent motorcycle manufacturers were still trying to find ways to fight back, notably
Qjiang changing to a high-end product strategy, Lifan's e-commerce business and Jianshe's MOTOMAN concept and
series of products.

The Ban & Limitation on the Use of Motorcycles
The banning and limiting the use of motorcycles in Chinese cities is an old topic. It is also the key factor impeding the
development of the Chinese motorcycle industry.
There was no sign of a lift of the ban in 2012; on the contrary the Chinese government expanded the ban to more
cities and urban centers. Further complicating the problem is the fact that more and more rural areas are urbanizing
and therefore falling under the jurisdiction of urban governments causing bigger areas and more consumers to be hit
by the motorcycle ban.
In many cities motorcycle retail is becoming rare. This decrease of motorcycle retail trade greatly reduces distributors'
benefits and many secondary level distributors have found it hard to survive and many have moved over to the
growing auto or EV industries.
As purchasing power in rural areas is generally weaker, manufacturers have paid less attention to quality and more to
reducing prices in an effort to maximize profits, thus hindering progressive research and development having a
negative knock-on effect for the export industry.

The Impact of Electric Vehicles and Ordinary Family Cars Significant
Multi-industry competition (auto, EV and motorcycle competition) became increasingly apparent in 2012. The
infamous 'battery crisis' which troubled the electric vehicle industry was solved by early 2012 boosting its
development. Meanwhile, many Chinese electric vehicle manufacturers further strengthened their urban and rural
sales networks and developed new markets posing a significant threat to the profits of the Chinese motorcycle
industry. In urban centers where motorcycle riding is still permitted many consumers who had originally intended to
buy conventional motorcycles have chosen to buy electric vehicles that are light, environmentally friendly and more
economical.
The General Administration of Quality Supervision, Inspection and Quarantine of China and the Standardization
Administration of China modified the national standards (Motor Vehicle Safety Technical Requirements GB7258-
2004) and put them in to effect on September 1st. This revision has further improved the quality of Chinese EV and
posed a further challenge to the conventional industry.
Joint-Venture Motorcycle Manufacturers and Tricycle Manufacturers the Exception
In early 2012 when the sales of most of the Chinese motorcycle manufacturers were plummeting, China's four major
joint-venture motorcycle manufacturers, Wuyang-Honda, Jianshe-Yamaha, Sundiro-Honda, Jinan-Suzuki, all made
high profile announcements stating that they had set their sales targets at 1 million units per year within three years,
and were the first to positively act against the market downturn.
Wuyang-Honda put their own ‘1 million units' plan forward at their annual summit early in 2012 to celebrate the 20th
anniversary of its establishment. Jianshe-Yamaha held a grand 'ice-breaking' ceremony at their national distributor
meeting in June, and set a similar target. The other two joint-venture motorcycle manufacturers, not willing to be left
behind, set their target to reach sales of 1 million units per annum within three years.
According to the latest statistics, the total sales of Wuyang-Honda between January and October 2012 were 800,000
units, up 9.48% year-on-year; the total sales of Sundiro-Honda were 770,000 units, up 11.05% year-on-year, Jinan-
Suzuki and Jianshe-Yamaha sales were the equal of 2011.

The collective launch of the strategies of joint-venture motorcycle manufacturers will inevitably arouse a new round of
market competition which may change the pattern of the Chinese motorcycle market and encourage growth.
The output and domestic sales of motor-tricycles has enjoyed a steady increase in 2012. Motor-tricycles are used as
both transport and production tools in China as they designed to be used as passenger and freight transports. Their
practicality is greatly favored by Chinese farmers and private small business owners in towns.
Along with the fast development of the motor-tricycle industry, its status and market have been gradually improving.
More and more major motorcycle enterprises begin to pay attention to motor-tricycles and manufacturers including
Lifan, Zongshen, Dayun, Dayang, Yinxiang, Summit, and Wanhoo have increased financial input in to motor-tricycle
production in 2012 to augment their product lineup and improve existing technologies. The potential of the motor-
tricycle market is growing thanks to the implementation of government subsidies and the steady income increase of
Chinese farmers.
There are Currently Around 900 Million Farmers Living and Working in China.
Government forecasts project a demand for about 75 million motor-tricycles on the provision that 1 in 3 farming
families will eventually purchase. It will take 20 to 25 years for Chinese motorcycle manufacturers to meet projected
market demands. The current annual motor-tricycle output capacity is 4 million units so it is very likely that we will see
more of the major motorcycle factories taking advantage of this growing market.
(Original in Chinese) July 8, 2011: in the Chinese Automobile Industries Manufacturing Committee's monthly meeting report, there were numbers from Motorcycle Manufacturing Industry as well. According to the reporter, the numbers for domestic motorcycle sales is in steady decline while exports of motorcycles has created to an all time high for June, 2011.Sales of motorcycle domestically was 2,320,800 units in June, a decline of 1.25% from May, 2011. A decline of 13.95% from the same period last year. Sales of two wheeled motorcycles were 2,114,600 units and the rest were three wheeled motorcycles.First half of 2011 sees a sales of 11,959,600 units of two wheeled motorcycles, a decline of 9.98%( comparing to last half of 2010, I assume). Sales of three wheeled motorcycles were 1,167,700 units, an increase of 10.39%.Other than a decline of sales, all the major indecators were in decline as well. Of the 104 Chinese Motorcycle manufacturers, they produced RMB500,140,000,000 worth of motorcycles from Jan.-May, 2011. a decline of 0.86% (did not say comparing to what period). Sales was RMB505,720,000,000, and increase of 0.49% (again, did not say comparing to what period). Profits were RMB12,280,000,000, a decrease of 32.58% (again, did not say comparing to what period or my Chinese is not good enough to understand-同比下降 32.58%). Under the soft domestic market for motorcycles, the motorcycle manufacturers were all increasing their export business. There were 4,921,800 units exported during the first 6 months of 2011, an increase of 26.57%, with an all time high of 995,500 units in June, 2011, an increase of 8.77%. The last

all time high was in August, 2008.I am pretty bad with the big numbers, I donot deal with them too much. The Western World use 1K as base unit while the Chinese uses 10K. Therefore, I may be off by a factor of 10. I did go through these numbers more than twice.Am I reading this right, the "bike free guys" in China are winning while the reset of the world is moving from cars to motorcycles? I know that some bike manufacturings are not investing to get a C3 certfication for their dirt bikes. It is not worth their while, they only sold a few when it was C2.This is a bad trend, we all need to go out and buy new bikes to support the bike manufacturing industry and domistic sales. I've done my part, I order a new Shineray250 with C3 certification. It should be here in two weeks or so.
http://www.mychinamoto.com/forums/showthread.php?3641-The-Chinese-Motorcycle-Manufacturing-Industry
http://www.chinamotorcycle.com/
May 2011 sales Motorcycle Industry OverviewSource: China Association of Automobile Manufacturers
May, the motorcycle industry sales continue to run low, production and sales chain and are down year on year; 1-5 months, industry-wide sales of more than 10 million motorcycles, up showing some decline.
May the whole situation, complete the motorcycle industry-wide sales 2,310,400 and 2,292,300, down 2.99% and 0.78%, down 17.29% and 11.86%, of which: two motorcycle sales 2,100,900 and 2,089,500, a decline of 3.28% and 0.63%, down 18.83% and 12.89%; three sales of 209,400 motorcycles and 202,800, approximately the same output with the previous month, sales declined slightly, sales were up by 2.16% and 0.46% . January to May, the industry completed motorcycle sales exceeded 10 million, to 10,768,300 and 10,777,900, down 9.80% and 7.79%, of which: two motorcycle sales 9,811,600 and 9,829,500, an down 11.39% and 9.20%; three sales of 956,600 motorcycles and 948,400, an increase of 10.56% and 9.77%. Tricycle sales performance was better than two-wheeled vehicle.
Details of two May motorcycle, the motorcycle models in two varieties, cross bike still had a high proportion of scooter production and marketing chain showed some growth. In May, sales of 1.274 million across the bike and 1,262,900, down 6.22% and 4.19%, down 19.15% and 8.57%; Cub sales 504,600 and 501,500, a slight decrease production chain, sales slight increase, sales were down 11.61% year on year and 15.07%; scooter sales 322,300 and 325,100, growth of 7.40% and 12.39%, down 22.65% and 19.67%.
Details of three-wheeled motorcycle May, all models in the three varieties of motorcycles, three-wheeled motorcycle absolute share month of sales 208,400 and 201,700, approximately the same output with the previous month, sales declined slightly, slightly year on year sales growth. In May, sales of general cargo tricycles and 118 500 123 700, representing total sales are tricycle 59.34% and 58.76%; ordinary passenger tricycle sales 84700 and 83200, are accounted for 40.64% of total sales tricycle and 41.23%.
January to May, general cargo tricycle sales 562,300 and 556,500, an increase of 15.70% and 13.89%, which 100ml <displacement = 150ml sales 394,800 and 392,000, accounting for freight tricycle 70.22% of total sales and 70.44%. Sales of 390,800 ordinary passenger tricycle and 388,300, an

increase of 37.70% and 38.79%, which 100ml <displacement = 150m1 sales 246,800 and 245,100, accounting for total sales of passenger tricycle 63.15% and 63.13%.
Motorcycle Enterprise (Group) of May, sales of the top ten motorcycle Enterprise (Group) for the Grand River, Loncin, Lifan, northern enterprises, construction shares, Zongshen, Guangzhou Grand Canal, silver Xiang, Qianjiang and new continents Honda, sales were 189,900, 175,700, 155,000, 133,900, 116,100, 115,300, 88300, 83000, 78900 and 75900. Compared with the previous month, in addition to sales growth in three companies, the other seven companies decreased to varying degrees; compared with last year is still three up 7 down, in which the Yangtze River, north of Enterprise, Construction Company and Qianjiang four business sales declined more significantly, a decline of more than 20%. In May, the 10 companies total sales of 1.2119 million, accounting for 52.87% of total motorcycle sales.
Summary
As the largest motorcycle producer and consumer in the world, China has recently entered an adjustment phase of retracement after more than a decade of rapid growth. On the one hand, under the circumstances of the enforcement of National III emission standards as well as the rising market demand for motor vehicles, electric vehicles and other substitutes, Chinese motorcycle enterprises are facing the pressure of product structure adjustment; on the other hand, as domestic demand growth for motorcycles glides, Chinese motorcycle enterprises have made more efforts to expand export market.
In 2011, China’s motorcycle sales volume reached 26.93 million, involving export volume of 11.39 million with a proportion of 42.29%, 8.29 percentage points higher over the previous year. Currently, China’s motorcycle export market is primarily concentrated in Asia, Latin America, etc.. In the motorcycle market of these regions, Japanese brands such as Honda, Suzuki, Yamaha and Kawasaki constitute dominant competitors. As the Chinese motorcycle production technology is mainly introduced from Japan, domestic motorcycle manufacturers enjoy no technical advantage in the competition of the export market at all, chiefly dependent on the price competition, which is obviously shown in the motorcycle markets of Vietnam, Indonesia, Brazil and other countries.
In terms of the industrial pattern, the Chinese motorcycle industry characterizes not a high concentration degree, still accompanied by fierce market competition. In 2011, top ten Chinese producers accounted for a total of 53.35% of the industry’s sales volume, while Jiangmen Dachangjiang Group Co., Ltd. in the first position merely held an 8.98% share. Due to lack of core technologies for engine, competition in domestic motorcycle industry is more reflected in the price competition, leading to a low level of average profit margin at the moment. Against the background of sluggish domestic demand, in the next few years, Chinese motorcycle industry will face a reshuffle and industrial integration is expected to speed up.
Global and China Motorcycle Industry Report, 2012 is mainly divided into two parts. First, to analyze the industrial pattern, major markets, competitive landscape and leading players of global motorcycle industry; second, to analyze the production and marketing scale, competitive structure and major enterprises of China motorcycle industry, as well as to predict the development tendency of the motorcycle market over the next few years.
Jiangmen Dachangjiang Group Co., Ltd., China’s largest motorcycle manufacturer, is oriented by home sales. In 2011, the motorcycle export volume only occupied 18.27% of the company’s sales volume. Its motorcycle production technology is introduced from Japan-based Suzuki, and the parent company Haojue possesses China’s largest motorcycle joint venture with Suzuki, namely, Changzhou Haojue

Suzuki Motorcycle Co., Ltd..
Loncin Industries Ltd. is the largest motorcycle exporter in China, with motorcycle export volume accounting for 57.26% of the company’s sales volume in 2011. Committed to the diversified development, the company has enriched motorcycle product line in addition to the extension to upstream motorcycle engine product field. Motorcycle production line projects under construction in 2012 primarily include electric motorcycles and electric four-wheel all-terrain motorcycles; meanwhile, the company will further strengthen the production capacity of three-wheel motorcycle.
Made in China: The Chinese motorcycle industry is bigger and growing faster than most people realise. Shaun Lennard reports
CIMAMotor
Chinese business leaders riding MV Agustas in Beijing, while Italians commute on Chinese scooters in Rome? Yes, when it comes to China and motorcycles, the paradigm has shifted in the past couple of years while the rest of us weren't really looking.
In reality, there's still a long way to go, but I suspect that the views of most people in Australia about Chinese motorcycles are far removed from the reality.
When I was invited to attend the 11th China International Motorcycle Trade Exhibition - known as CIMAMotor - I jumped at the chance. You don't need to have travelled to cities like Bangkok, Ho Chi Minh City or Manila to know the importance of motorcycles in Southeast Asia. But the opportunity to visit the city that produces more motorcycles than anywhere else in the world was one I wasn't going to miss.
While the words 'Chinese motorcycle industry' spark preconceived views for many in Australia, I headed beyond the 'no-visa-required' boundary of Hong Kong expecting to be surprised. And I was.
Chongqing is around 1700km west of Shanghai, located where the Jialing River runs into the Yangtze. It's a city as old as London - it's been a commercial hub on a major river for well over 2000 years. Total population today pushing 28 million. That's okay; I hadn't heard of it a year ago either…
I arrived in Chongqing the evening prior to the show's opening, and was presented with a comprehensive array of background information. The show catalogue was almost 200 pages thick - packed with information on each of the

exhibitors. The first thing that became obvious was that this wasn't going to be an exhibition made up entirely of 150cc machines I had never heard of.
Current annual motorcycle production in China is around 25 million units - of which half are destined for export. I've always found large 'annual' figures even more impressive when you convert them to daily. So that 25 million is over 68,000 new machines a day. Day in, day out. Certainly makes you wonder about the wisdom of some in the road safety arena from places like Australia, who lecture on reducing the number of motorcycles on the roads of Southeast Asia and many other corners of the world!
We've all heard the stories of Chinese 'copies' of Japanese bikes. In what might be a multi-million-dollar (yuan?) example of 'If you can't beat them, join them', each of the four major Japanese manufacturers now has direct linkages with Chinese manufacturers. For the Chinese companies, this brings access to Japanese technology and quality. For the Japanese, it brings access to a significant emerging market. So in a sea of commuter motorcycles, machines such as Honda's CBR1000RR Fireblade and the Kawasaki ZX-10R were prominently displayed.
Suzuki's connection with Haojue is one such example. Established in 1992, Suzuki Haojue now exports to 70 countries and has 12,000 staff.
These relationships have led many Chinese manufacturers to now look beyond the traditional 150cc engine, with 600cc touring and sportsbikes now starting to feature. The Chinese see a huge potential for growth in recreational motorcycling. When you hear that they are completing 10,000km of four-lane highway each year, this is no surprise.
The show-stopper for Honda was the RC-E ('E' for electric) prototype race bike that had debuted at the 2011 Tokyo Motor Show. A similar machine had been raced by John McGuinness at the last Isle of Man TT. Electric bikes weren't a major feature of the show, but it's certainly something you'd expect to see more of in future years.
The tie-ups aren't restricted to Japanese manufacturers. Piaggio has partnered with Zongshen, with Vespas and Moto Guzzis amongst the fully imported models on display.
Harley-Davidson is a newcomer to the Chinese market and total sales to date are no more than a few hundred. But there are already 12 dealerships and six HOG chapters. A new store opened in Chongqing the week of the exhibition.
The executives from H-D China spoke of their vision of selling "the American dream of freedom on a highway on a Harley-Davidson". Yes, the world is a changing place.
There were also many component producers at the exhibition, including very highly regarded brands. This included top-end European component manufacturers such as Continental and Italian giant Magneti Marelli.
These companies are among those working at the forefront of developing ITS - Intelligent Transport Systems. Most riders in Australia might only know Continental as a tyre company, but Continental employs - are you ready - 169,000 people worldwide. If you still believe that ABS on motorcycles is a government-inspired dream, think again.
One of the most interesting 'links' is with Benelli. Except this isn't a link - it's direct ownership. Benelli has been owned by Chinese company Zhejiang Qianjiang since 2005. QJ, as it is known, talks in terms of "world-class brands, European design, Japanese quality… at Chinese cost". So as well as the Italian-produced machines, the Benelli name is attached to a range of smaller, locally produced machines. I wonder if I imported one of these, whether that qualifies for full membership of the Italian Motorcycle Club of Tasmania?
The tag of most unusual machines at the show would have to go to the German-produced Kodlin 'Murdercycles'. Fred Kodlin has been building unique custom bikes for over 30 years, but CIMA2012 was Kodlin's launch into the Asian market. And the crowd was not disappointed, with some awe-inspiring creations on display.
Kodlin's 'JFK' was awarded Custom Bike of the Year in 2007 and after seeing this machine in the metal, that's no surprise. The double rear wheel with centre-driven chain is the most unusual aspect of a most unusual machine. And the writing of the Presidential Oath of Office in the paintwork was something else again.
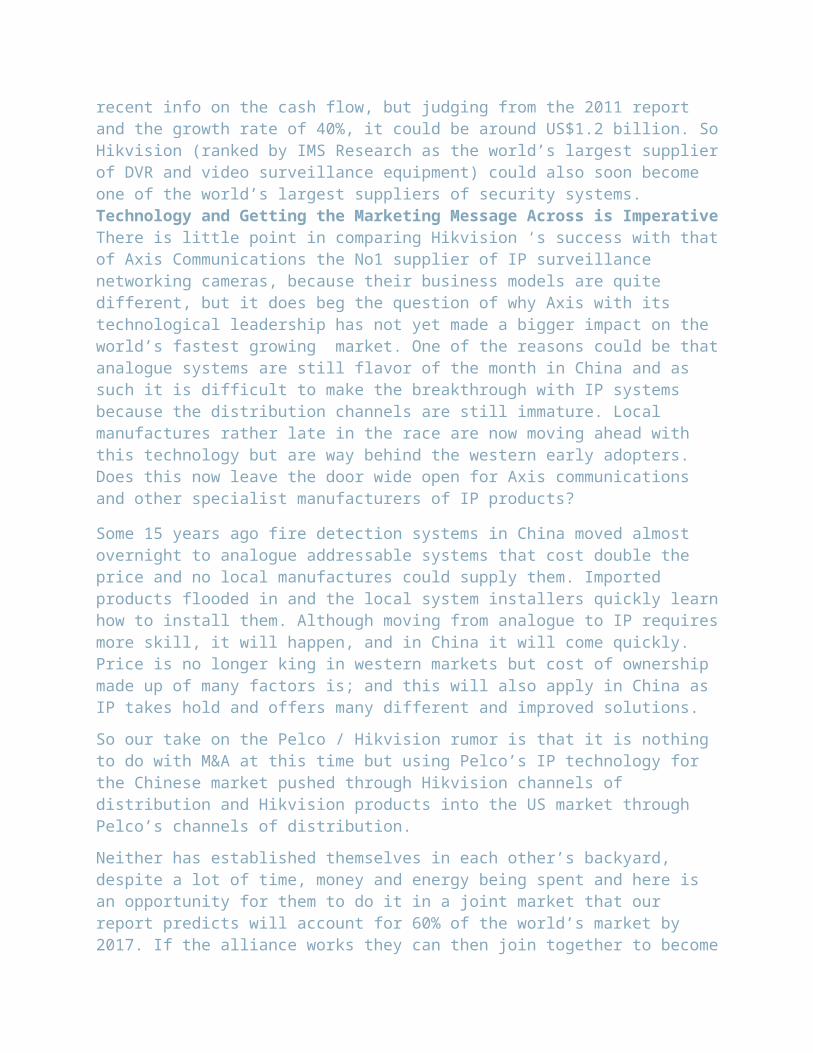
My trip also included a tour of the Lifan factory, in the nearby countryside. Lifan was founded just 20 years ago as a small automotive workshop. Today, the company is one of the largest producers of cars and motorcycles in China, with almost 16,000 employees.
The Saturday morning tour of the factory was impressive. Clean - immaculate, actually - uniformed workers, computers everywhere and very accessible to visitors. One of my colleagues remarked that this factory was barely a couple of years behind what you see in Japan.
Lifan ran a national competition in 2011 - a bit like Survivor. It wanted to find who was the best - or they called "sharpest" - customer. Riders entered the competition with a string of amazing rides on Lifan motorcycles to every far-flung corner of China.
In addition to its headquarters near Chongqing, Lifan also has motorcycle factories in Vietnam, Thailand and Turkey.
Lifan has a partnership with a company that will surprise many - MV Agusta. This is another example of a Chinese manufacturer working with a European manufacturer with a strong reputation for quality in design and build.
I was informed that one of Lifan's main car models has just passed the Australian Design Rule testing, so motorcycles could follow.
Perhaps the greatest irony in painting China as the emerging motorcycle capital of the world is the widely reported ban of bikes from the centre of most of China's major cities. The background to this would fill another story, but the most important thing to note is that this is under review. The virtual elimination of two-stroke engines, combined with environmental pressures including congestion that has to be seen to be believed, is seeing talks at many levels of government to change the city rules.
When I spoke at the 1st International Motorcyclists Forum in Europe two years ago, I remember hearing the estimate of worldwide motorcycle ownership being between 200 and 300 million. In China alone, though, its own estimate is 200 million motorcycles, with most owned in country and rural districts.
So my assessment, and what does all of this mean for Australia? Along with many people, I hope to see motorcycling become more and more popular in Australia. Melbourne is never going to be Ho Chi Minh City, but a key part of increased interest in commuter motorcycling will see a significant increase in Chinese road bikes in Australia. And this won't necessarily be as competitors for the Japanese and European scooters - more a broadening and an increasing in size of the market.
As for China, when I read future reports about Chinese police riding Harley-Davidsons I'll know that the Great Wall is really no more than an iconic structure in the country's north, and that we truly have a global motorcycle industry.
Finally, thanks to my hosts in Chongqing, including the guides at the Lifan factory and also to my translator, university student Jing, for all their assistance.
http://www.trademotorcycles.com.au/news-reviews/2013/4/bike-news-chinese-motorcycle-industry-growth/
http://beforeitsnews.com/business/2013/03/motorcycle-industry-in-china-forecasts-for-2016-2493286.html

Executive Summary
This report was
This report was commissioned to examine why the sales volume of Choice Chocolate has dropped over the past two years since its peak in 1998 and to recommend ways of increasing the volume.
The research draws attention to the fact that in 1998, the market share of Choice Chocolate was 37%. The shares of their key competitors such as Venus and Bradbury were 22% and 18% respectively. The size of the chocolate market then was $36 million. Over the next two years, although Choice Chocolate retained its market share the volume of sales in the whole market decreased to $29 million. Further investigations reveal that this market shrinkage coincided with an increase in health awareness amongst consumers who regard the milk and sugar ingredients in chocolate as negative;moreover, since the second half of 1999, an increasing number of rival ‘health candies’ had appeared on the market. These claimed to offer the consumers a healthy alternative. These factors appear to be the major causes of the decreased sales volume of Choice Chocolate.
Slim Choice is the latest chocolate range put forward by the R & D Department of Choice Chocolate. The report evaluates this range and concludes that it would be an ideal candidate to meet the challenge presented by the market and could satisfy the new consumer demand since it uses significantly reduced milk and sugar ingredients and is endorsed by renowned health experts. According to 97% of the 2000 subjects tested recently, it also retains the same flavour as the original range.
It is recommended: that Choice Chocolate take immediate measures
to launch and promote Slim Choice alongside its existing product range; that Slim Choice adopt a fresh and healthy
image; that part of the launch campaign contains
product endorsement statements by renowned health experts; that Slim Choice be available in health food
Terms of referenceStatement of problem/ topic
Formal language appropriate to report writing
Key findings summarised
Problem solution summarised
Recommendations summaris

shops as well as in traditional chocolate retail outlets