Embed Size (px)
Citation preview

China risks
We attach a one-in-three probability to China
experiencing a hard economic landing commencing before the end of 2014.
We define “hard landing” as an abrupt slowdown in real GDP growth to an average of 5% y-o-y or less over four consecutive quarters.
We discuss six key reasons why the risk of a China hard landing happening in the next three years appears to have increased.
We launch Nomura’s China Stress Index (CSI), which uses 18 indicators to summarize the macro risks in a single measure.
Our global strategy teams conduct a “what if” exercise, discussing trading recommendations and stock ideas for this non-trivial risk scenario.
GLOBAL ECONOMICS AND
STRATEGY
Novem ber 2011
AN
CH
OR
RE
PO
RT
Any portion of this report that has
been prepared by a trading desk
analyst is not a product of the
Fixed Income Research
Department and is not covered by
the Research Analyst certification
provided in Appendix A-1. For
additional information concerning
the role of Trading Desk Analysts,
please see the important conflicts
disclosures beginning at page
101 of this report.
November 2011
Research analysts
Economist
Rob Subbaraman
+852 2536 7435
Strategist
Kevin Gaynor
[email protected] +44 (0) 20 710 27800
China economy

Nomura | Asia Special Report November 2011
2
Foreword ........................................................................................................... 3
Executive summary ......................................................................................... 4
Introduction – Six reasons to worry .............................................................. 5
Defining a hard economic landing ................................................................. 8
Defining a “hard landing” ................................................................................ 8
Triggers and timing ........................................................................................ 8
Policy responses ............................................................................................ 8
Perceived likelihood ..................................................................................... 10
Nomura’s China Stress Index (CSI) ............................................................. 11
1. Overinvestment and excessive credit ..................................................... 13
Box 1: Fuzzy numbers .............................................................................. 14
Box 2: China‟s challenging GDP arithmetic .............................................. 17
Box 3: Lessons from Japan on the return and cost of capital .................. 19
2. Rudimentary monetary architecture ........................................................ 22
Box 4: Shadow banking in the US and China compared ......................... 26
3. The privileged state-owned enterprises .................................................. 28
Box 5: Investment is high, but savings are even higher ........................... 30
Box 6: The Akerlof market for lemons problem applied to China ............. 31
4. Unintended consequences of financial liberalization ............................ 33
Box 7: A chronology of China‟s capital account liberalization .................. 34
Box 8: Risks associated with financial liberalization: lessons from Japan 38
5. The Lewis turning point ............................................................................ 39
6. The setting in of growing pains ............................................................... 43
Demographic challenges .............................................................................. 43
Box 9: China‟s hukou household registration system .............................. 46
Rising inequality and an aspiring middle class ............................................ 46
Resource and environmental strains ........................................................... 51
Pricing a China hard landing – Strategy perspectives .............................. 56
Global macro perspectives ........................................................................... 59
Global equity perspective ............................................................................. 64
Asia-ex Japan FX perspective ..................................................................... 67
Implications for Asia regional equities…………………………………………69
China equities – the risk…………………………………………………….......73
Chinese credits – already reflecting the risks of a China hard landing ........ 91
References ...................................................................................................... 94
Appendix: The Construction of Nomura‟s China Stress Index ....................... 97
Nomura | Asia Special Report November 2011
3
Foreword
We are pleased to present Nomura‟s Anchor report on China, in which our
economists, strategists, equity and political analysts assess the medium-term
risk of a hard landing – a critical issue for today‟s global economy.
At Nomura, we pride ourselves in producing research of the highest standard.
Historically, we have had a strong presence across Asia, and in recent years
we have increased our footprint in Europe and the United States to become
Asia‟s leading global investment bank. Our roots in Asia allow us to see first-
hand the breakneck speed at which the region‟s economies are emerging –
and contributing over half of global GDP growth.
China leads the world in the growth stakes, but the risks in our view have risen
and should no longer be ignored. Our base case is that China's economy will
average growth of about 8.5% in 2012-14, but we judge that the risks of a
temporary interruption that pushes growth far below potential are rising. We
define a so-called “hard landing” as an abrupt slowdown in real GDP growth to
average 5% or less for at least one year. This report discusses six key factors
that lead us to attach a one-in-three likelihood that China‟s economy
commences a hard landing before the end of 2014.
How would this non-trivial risk of a hard landing in China impact global
financial markets? Our global and Asian equity, FX, rates and credit strategy
teams assess the macro implications and present trading recommendations
and specific stock ideas to this risk scenario.
How can investors calibrate the risk of this hard landing scenario? In this
report we launch Nomura‟s China Stress Index (CSI) which we will update
quarterly. The exact probability of a hard landing is necessarily a matter for
investor judgment, but the CSI will give investors an important indication of risk.
Nomura‟s Anchor series of reports underscore our dedication to produce
thematic, long-term studies, involving cross-region and cross-division
collaboration among our global markets research teams.
We welcome your feedback as we continue our tradition of collaborative work
to deliver unique investment insight and ideas to our clients.
Hideyuki Takahashi Paul Norris
Head of Global Research Head of Global Markets Research
Nomura | Asia Special Report November 2011
4
Executive summary1
This study takes China‟s still enormous economic development
potential as a given and focuses on the risks and challenges that lie
ahead – for the economy‟s meteoric rise has been associated with a
build-up of fundamental imbalances.
We define a hard economic landing in China as an abrupt slowdown in
real GDP growth to an average of 5% y-o-y or less over four
consecutive quarters.
While our base case is that China's economy will average growth of
about 8.5% in 2012-14, we discuss six compelling reasons why the
risk of a hard landing has increased. We attach a one-in-three
likelihood that a hard landing commences before the end of 2014.
Overinvestment and excessive credit. China's investment is almost
half of GDP, while domestic credit is nearly 1.5x GDP, or 1.8x if the
shadow banking sector is included. Empirical literature shows that
investment booms are more likely to trigger a crisis if they are
associated with credit booms. China ticks both of these boxes.
A rudimentary monetary architecture, centered on controlling the
exchange rate is not very effective in managing an economy that is
rapidly becoming more open and sophisticated, and has resulted in a
cost of capital that is too low and a financial sector that is repressed.
The privileged state-owned enterprises receive preferential
government subsidies and bank financing, yet they are capital
intensive, inefficient and crowd out smaller private enterprises.
Unintended consequences of financial liberalization.
Internationalization of the renminbi is adding pressure for China to
accelerate financial liberalization, but this is not without risks, such as
falling credit standards as banks overly compete with one another.
The Lewis turning point, associated with a dwindling supply of
surplus labour from the countryside, is likely upon China, which could
trigger a serious outbreak of inflation.
The setting in of growing pains from worsening demographics and
increasing strains on natural resources and the environment. These
growing pains will almost certainly cause the economy's growth
potential to slow over this decade, making it more challenging to
implement structural reforms and address high income inequality.
China's economy is now so big and complex that many of its structural
problems are becoming more interrelated. Also, many of its critical
reforms are becoming unavoidably connected, making it more difficult
to continue undertaking individual reforms gradually and in isolation.
The government would no doubt do all in its power to respond, but the
question is how large, quick and effective a policy stimulus would be.
On all three counts, we judge that it would be less than in 2008.
We are well aware that picking the exact timing of a hard landing is
devilishly difficult. The key will be whether the risk of a hard landing
rises or falls in the future. Enter Nomura's new proprietary tool, our
China Stress Index, which uses 18 indicators to summarize the macro
risks in a single measure.
Please refer to the summary pages 56-58 for strategy perspectives,
trading recommendations and stock ideas should the non-trivial risk of
a China hard landing impact global financial markets.
1 The authors of particular parts are accredited in their respective sections, but specific mention should be made
of Zhiwei Zhang, Chi Sun, Alastair Newton, Simon Flint, Pradeep Mohinani, Michael Kurtz, Ian Scott, Chien-hua Chen and Qilong Zhang. We are grateful to Candy Cheung and Wendy Chen for data analysis; David Vincent and Kenneth Persing for editing; and Jay Chandrasekharan for coordinating the equity analysts. We are also indebted to Zhiwei Zhang, Paul Sheard and Paul Norris for providing helpful comments on early drafts.

Nomura | Asia Special Report November 2011
5
Introduction – Six reasons to worry
China has made remarkable achievements in development, but it
remains the largest developing country in the world. Population,
resources and the environment have put great pressure on our
economic and social development, and there is lack of adequate
balance, coordination or sustainability in our development.
President Hu Jinato, Boao Forum for Asia, Hainan, China, 15 April 2011.
China‟s economy has averaged 10% real growth since it launched its reforms
and began to open up in 1978. In 2010 it surpassed Japan to become the
world‟s second-largest economy (Figure 1).2 Yet China is still a poor country:
its nominal GDP per capita of USD4,400 in 2010 is similar to that of Japan in
1975, suggesting that there is still lots of room to urbanize, industrialize and
move up the value-added ladder (Figure 2).3 However, as China‟s leaders
readily admit, the economy‟s meteoric rise has been associated with a build-up
of fundamental problems: the export- and investment-led growth model is
reaching its limits; macro and industrial policies need a major overhaul; the
once seemingly endless supply of cheap rural labour migrating to the cities is
diminishing; and there are the growing challenges of worsening demographics,
high income inequality, resource shortages and environmental degradation.
Fig. 1: China’s long-run real GDP growth
Source: CEIC and Nomura Global Economics.
Fig. 2: Nominal GDP per capita: China vs Japan
Source: CEIC and Nomura Global Economics.
This study takes China‟s still enormous economic development potential as a
given and focuses on the macro risks and challenges that lie ahead.
Our base case is that China's economy will average growth of about 8.5% in
2012-14, but we judge that the risks of a temporary interruption that pushes
growth far below potential are rising. We define a so-called economic “hard
landing” as an abrupt slowdown in real GDP growth to an average of 5% y-o-y
or less over four consecutive quarters. Six factors lead us to attach a one-in-
three likelihood that a China hard landing commences before the end of 2014.
1. Overinvestment and excessive credit
2. Rudimentary monetary architecture
3. The privileged state-owned enterprises (SOEs)
4. Unintended consequences of financial liberalization
5. The Lewis turning point
6. The setting in of growing pains
2 To compare the sizes of economies we convert nominal GDP into USD at market exchange rates.
3 GDP per capita in constant prices is a more appropriate yardstick to compare real purchasing power, but such
data on a consistent basis are only available back to 1960. World Bank data show that in 1960, Japan's real GDP per capita (USD7,241) was still higher than China's real GDP per capita (USD2,423) in 2010, suggesting that China's current real average standard of living is more on par with Japan's before the 1960s.
-30
-20
-10
0
10
20
30
1950 1960 1970 1980 1990 2000 2010
% y-o-y
0
5,000
10,000
15,000
20,000
25,000
30,000
35,000
40,000
45,000
1970 1975 1980 1985 1990 1995 2000 2005 2010
China
Japan
USD
China's economy still has lots of room to develop, but fundamental problems have built up
Six factors lead us to attach a one-in-three likelihood that a China hard landing commences before the end of 2014

Nomura | Asia Special Report November 2011
6
While there may be many tell-tale warning signs that a hard landing is coming,
the trickiest part is getting the timing right. The conventional wisdom seems to
be that, because of political incentives, a hard landing, should there be one,
would not occur until after the transition to China‟s fifth generation of leaders in
early 2013.4 The analysis of Eichengreen, Park and Shin (2011) adds some
support to this view. They analyse a sample of 41 fast-growing economies
over the period 1957 to 2007 and find that on average these economies slow
significantly when GDP per capita on a purchasing power parity basis hits
USD16,740 – which China is unlikely to reach until 2015, at the earliest.5
However, they also show that a low consumption-to-GDP ratio, higher and
more volatile inflation, a rising old-age dependency ratio and an undervalued
exchange rate are important features that typically increase the chances of a
sharp slowdown – and China has all of these.
While we are well aware that picking the exact timing of a hard landing is
devilishly difficult, we find some compelling reasons why the risk of it
happening in the next three years should no longer be ignored.
The empirical literature on the causes of financial crises offers some pertinent
lessons to China. The first is that an extended period of high GDP growth can
mask the build-up of underlying financial problems, in part because the most
robust leading indicator of financial crises – the debt-to-GDP ratio – is flattered.
Lesson number two is that investment booms are more likely to trigger a crisis
if they are associated with credit booms. China ticks both of these boxes:
investment (public and private) comprises nearly half of GDP and domestic
credit is almost 1.5x GDP, or 1.8x if the shadow banking sector is included.
The second reason relates to China's stage of economic development – the
economy has become so big and complex that many of its structural problems
are becoming more interrelated. For example, a rudimentary monetary
architecture, centering on controlling the exchange rate, has resulted in a cost
of capital that is too low and a financial sector that is severely repressed. The
too-low cost of capital has fueled overinvestment, while the financial
repression has given rise to a flourishing shadow banking sector. Another
example is the generous government and bank support given to the less
efficient and capital-intensive state-owned enterprise (SOE) sector, which
leads to wasteful investment of scarce resources, environmental degradation
and credit rationing to private small to medium-sized enterprises (SMEs).
Rather than any one of these factors alone, we believe it is the combination of
various imbalances and interactions among them that increases the likelihood
of a major setback.
Third, increasing strains on natural resources and the environment, together
with demographic changes rapidly turning unfavorable, are causing growing
pains to set in that will almost certainly cause the economy's potential growth
to slow over the course of this decade and inflation to be structurally higher. In
an environment of slowing trend growth and higher structural inflation,
structural problems festering below the surface can bubble up to the surface,
and implementing reforms can be more challenging. For instance, removing
the generous government subsidies to SOEs, can become politically more
divisive as power and economic privilege needs to be wrested from local
governments, the SOEs and the banks.
Fourth, historically the government has implemented reforms incrementally.
However, China has reached a stage of development at which many of its
critical reforms are unavoidably connected, making it more difficult to
undertake individual reforms gradually and in isolation. For example,
internationalizing the renminbi and moving to a more flexible exchange rate
4 For example, according to a Bloomberg global survey on 29 September 2011, 1,031 of its subscribers were
asked about the chances of China‟s economy slowing below 5% growth: 12% of respondents believed it will happen within the next year, 47% within the next 2-5 years and the remainder thought longer than 5 years, or that it would never happen. 5 Specifically, the authors identify 43 cases where rapidly growing economies slow significantly – that is, real
GDP growth shifts down by at least 2 percentage points – and calculate that, on average, the tipping point is when GDP per capita (on a purchasing power parity basis) is USD16,740.
The empirical literature on the causes of financial crises offers some pertinent lessons to China
China‟s economy has become so big and complex that many of its structural problems are becoming more interrelated
Increasing strains on natural resources, the environment, and demographics are causing growing pains to set in
It is becoming more difficult to undertake individual reforms gradually and in isolation

Nomura | Asia Special Report November 2011
7
regime are adding pressure on China to press ahead with capital account
liberalization and interest rate deregulation. But without adequate safeguards,
financial deregulation can pressure banks to engage in overly aggressive
competition, lowering overall credit standards. Another example is China‟s
shrinking supply of young, rural surplus labour which is starting to accelerate
wage growth. One proposed reform is to relax the rigid hukou household
registration system, giving city migrants the same rights as locals so as to
encourage greater labour mobility and faster urbanization. But without other
reforms this could exacerbate other problems, such as environmental
degradation and social tensions. We see the pressure building to make more
broad-based wholesale reforms, but given growing inter-linkages of various
reforms, big changes will carry greater risks. Politically, it is hard to envisage
substantial change before the next generation of leaders takes the helm in
March 2013.

Nomura | Asia Special Report November 2011
8
Defining a hard economic landing
The term “China hard landing” is too often a throw-away line that means
different things to different people. We provide a precise definition of what we
regard as a hard economic landing in China. In addition – and with a large
dose of humility – we present our views on the likelihood, timing and
description of a hard economic landing, were it to occur.
Defining a “hard landing”
We define a hard economic landing in China as an abrupt slowdown in real
GDP growth to an average of 5% y-o-y or less over four consecutive quarters.
In economists‟ parlance we would regard this as a deep recession. On our
estimate of China‟s potential GDP growth being around 8%, our hard landing
definition means GDP growth being at least 3 percentage points (pp) below
potential, which we would regard as equivalent to a contraction in real GDP in
the US, on average, over four consecutive quarters. Note that under our
definition, China‟s real GDP growth could average 4.9% y-o-y for four quarters
in a row, or it could plunge to negative year-on-year growth in one quarter (a
low probability event, but one that we do not rule out) before rebounding to
over 5% y-o-y in subsequent quarters – but for the four quarters, averaging
below 5%. The last time China experienced a hard economic landing by this
definition was when real GDP growth slowed from 11.3% y-o-y in 1988 to
4.1% in 1989 and 3.8% in 1990, before rebounding to 9.2% in 1991. From Q4
1999, China started publishing quarterly real GDP data, and since then the
lowest average growth on a four-quarter rolling basis was 7.5% y-o-y in Q4
2001.
Triggers and timing
Although the advanced economies falling back into recession would hurt
China‟s exports, the economy is too domestic driven, in our view, for external
shocks to directly cause a hard landing. The more likely cause would be a
major pullback in investment from its current very high share of almost half of
GDP. Within gross capital formation, investments in property (24% of total)
and infrastructure (28% of total) appear the most vulnerable components.
Examples of potential triggers of an investment-led downturn include: 1) a
correction in what appears to be an overheated property market; 2) policy
mistakes, for instance the People‟s Bank of China (PBC) underestimating
inflation and having to play catch-up via aggressive tightening; 3) unforeseen
shocks, such as social unrest or a deadly pandemic; and 4) simply “investment”
fatigue setting in. Whatever the trigger, a major pullback in investment would
be likely to cause a steep rise in non-performing loans (NPLs) given that
China‟s domestic credit-to-GDP ratio is also at an extraordinarily high 1.5x, or
1.8x once the shadow banking sector is taken into account. Through losses of
wealth, confidence and jobs there would likely be large indirect knock-on
effects to household consumption.
It terms of timing, there is an argument that, because of political incentives, a
hard landing would not be allowed to happen until after the leadership
transition in March 2013. However, we would not rule out it happening earlier,
given: 1) the ratios of investment to GDP and credit to GDP are so high; 2)
support from exports is likely to be less than before; 3) the economy has
become so large and complex that many of the structural problems are
becoming more interrelated; and 4) policy responses are likely less effective
than before.
Policy responses
In response to the global financial crisis China implemented a RMB4trn (13%
of 2008 GDP) fiscal stimulus; put the steady appreciation of the CNY/USD
exchange rate, that has been in train since July 2005, on hold; cut the bank
Our definition is an abrupt slowdown in real GDP growth to an average of 5% y-o-y or less over four consecutive quarters
The most likely cause would be a major pullback in investment, but there are many potential triggers

Nomura | Asia Special Report November 2011
9
reserve requirement ratio (RRR) by 250bp; and cut the benchmark 1yr lending
rate by 216bp. We have no doubt that the government would again do all in its
power to respond to signs of a hard landing, but the question is how large,
quick and effective a policy stimulus would be. On all three counts, we judge
that it would be less than in 2008.
On monetary policy, we would expect aggressive cuts in the bank RRR and
CNY/USD appreciation to once again be halted (if there were to be large net
capital outflows rather than allowing CNY/USD depreciation, we would expect
the PBC to drawdown its USD3.2trn of FX reserves to keep CNY/USD stable).
On the other hand, we see a higher hurdle than in 2008 for the PBC to cut the
benchmark 1yr lending rate aggressively. One reason is because of greater
inflation pressures today, with CPI inflation currently much higher (6.1% y-o-y
in September 2011) than the 2.5% in 4Q 2008. Moreover, core CPI inflation,
which excludes food and energy items, has also risen steadily over the past
two years to 2.4% y-o-y in Q3 2011, the highest since the government began
publishing the data in 2005, suggesting that a structural inflation problem is
emerging (see Asia Special Report, China: The case for structurally higher
inflation. 21 September 2011). Another reason is what we believe is growing
recognition among China‟s policymakers that interest rates were set
fundamentally too low in the past, and that this cheap cost of capital
contributed to overinvestment. As such, we would expect to see greater official
resistance to rate cuts than in the past.
On fiscal policy, we would expect another stimulus package and, to avoid the
economy becoming more unbalanced, there would likely be more focus on
consumption-boosting measures. However, fiscal stimulus aimed at
consumption tends to be less effective than public investment, because any
increase in household income can be saved rather than spent.
Therefore, we would expect a fiscal stimulus package to again be dominated
by public investment, but again believe it would be less effective than that
seen in 2008-09, for three reasons.
First, while China certainly has room for fiscal stimulus, it has less room than it
did before. Central government debt is still low at around 20% of GDP, but the
build-up of local government debt in recent years has lifted general
government debt (central plus local) to around 50% of GDP. On top of this are
the government‟s contingent future liabilities, including future losses related to
NPLs and unfunded pension liabilities which, if all were to be recognized in
2011, would lift the general government debt to 85% of GDP, according to the
IMF (2011a, p.47).
Second, the speed of implementation would likely be slower than in 2008-09.
Before the global financial crisis, the economy was overheating, forcing the
National Development Reform Commission (NDRC) to turn down a large
number of new investment projects by SOEs and local governments. So when
the global financial crisis hit, China had many large off-the-shelf investment
projects ready to go and so could boost investment quickly. This is no longer
the case.6
Third, given that government-influenced investment comprises about one-third
of total investment, to avoid a fall in total investment public investment must
grow by twice as much as any decline in private investment growth. The
government “doubling up” with another public-led investment boom could
heighten concerns over misallocated, wasteful investment, increasing fears of
an even bigger hard landing further out – the private response could be to pull
back investment even more.
6 The growth of newly started fixed-asset investment projects was 28.7% y-o-y in 2007, but the NDRC‟s rejection
of new projects caused the growth rate to plunge to -2.9% y-o-y in Jan-July 2008; the NDRC reversed course after the global financial crisis hit, and the pent-up demand caused the growth rate to rebound to over 80% y-o-y in Jan-Oct 2009. The growth of newly started fixed-asset investment projects was 23.1% y-o-y in Jan-Aug 2011, and there is now much less pent-up demand.
We see a higher hurdle than in 2008 for the PBC to cut the benchmark 1yr lending rate aggressively
Another public-led investment boom could heighten concerns over misallocated, wasteful investment
The speed of implementation would likely be slower than in 2008-09
China still has room for fiscal stimulus, but less than in 2008

Nomura | Asia Special Report November 2011
10
Perceived likelihood
Drawing together the strands of the analysis we have done on the six main
macro risks in China, our overall assessment is that the chance of a hard
economic landing has increased in recent years. We attach a one-in-three
probability of real GDP growth falling to an average of 5% y-o-y or less over
four consecutive quarters sometime between now and the end of 2014. While
our baseline modal (i.e., most likely outcome) forecast – to which we attach
the residual two-third probability – is for China‟s real GDP to grow by an
average of 8.5% in 2012-14. We are aware of the non-trivial tail risk of a much
worse outcome which, as we explain in the final chapter, would have severe
repercussions for the global economy and financial markets.
Interestingly, this year there has been a significant sell-off in China‟s equity
and credit markets, yet most China economists have not significantly
downgraded their GDP forecasts. For example, the latest 10 October survey of
18 market economists by Consensus Economics Inc. shows that the
consensus forecast of China‟s real GDP growth is 8.5% in 2012 and 8.4% in
2013, while the IMF‟s latest forecast (released in September) is 9.0% in 2012.
The way we would reconcile this gap is that economists forecast the modal, or
most likely, outcome, whereas the financial market tends to take a weighted-
average probability of different possible outcomes. If we apply our baseline
and hard-landing probabilities to the market method {(8.5*0.66)+(5.0*0.33)}, it
gives a weighted-average GDP growth forecast of at most 7.3% in 2012-14. In
other words, like-for-like, our forecasts are probably not that dissimilar to what
the market is pricing in – the key will be whether the risk of a hard landing rises
or falls going forward, which brings us to Nomura‟s new proprietary tool – our
China Stress Index (CSI).
We attach a one-in-three probability to our definition of a hard landing commencing sometime between now and the end of 2014

Nomura | Asia Special Report November 2011
11
Nomura‟s China Stress Index (CSI)
To more closely monitor the risks of a hard landing in China‟s economy, we
have constructed a macro China Stress Index, or CSI for short. The CSI is
made up of 18 indicators that quantify the macro risks in China into one
summary measure. We selected the 18 indicators by using two main criteria:
• Importance: Each indicator signals an important risk factor that we
believe is not fully captured by other indicators in the CSI. We try to capture,
among others, the risks associated with over- and mal-investment, particularly
in the property market; excessive credit and the problems created by the
rudimentary monetary architecture; structural inflation risks associated with the
Lewis turning point; and the increasing challenges arising from high income
inequality and environmental degradation.
• Availability: A challenge not only in China, but in all developing
economies is the paucity of the data. We chose indicators that are sourced
from official statistics and that have a time series of over a decade, so that the
CSI has a reasonably long history for statistical inference (the CSI begins in
January 2000). For the indicators that are available only on an annual or
quarterly basis, monthly series were interpolated from the longer-frequency
data.
To construct the CSI, the 18 indicators are first standardized and then
weighted. The weights, to some extent, are subjective, but they are grounded
in our analysis in the following chapter and international experience of the
common causes of emerging market crises. Most variables have weights of 3-
5%, while two have 8% weights (property loans/total loans and residential
property price index/long-run trend) and three have 10% weights (gross capital
formation/GDP, domestic credit/GDP and new shadow banking funding/ new
total social financing). The CSI is indexed to 100 in January 2000. For more
technical details on the methodology in constructing the CSI, please see the
Appendix: The construction of Nomura‟s China Stress Index.
The CSI indicates that risks in China‟s macro economy have been on a broad
uptrend, and more noticeably since the global financial crisis. In Q2 2011, the
CSI rose to its highest level since it was first compiled, but in Q3 it eased
slightly, mainly because of a decline in the flow of new shadow banking
funding (Figure 3). One limitation of the CSI is that it does not give a
probability of a hard economic landing. To do so would require a reference
variable measuring past episodes of hard economic landings in China, the
obvious one being real GDP. Yet in the past 20 years China‟s GDP growth has
not fallen below 5% and before then the causes of hard landings in GDP were
influenced heavily by social and political unrest.
We could have used panel data on GDP from other countries showing hard
economic landing experiences internationally, but in our view China‟s economy
is too special for this exercise to give credible results. So what the CSI tells us
is: 1) the direction of overall macro risk; and 2) how fast the risk has changed
compared to history.
The CSI is made up of 18 indicators that quantify the macro risks in China into one summary measure
The CSI indicates that risks in China‟s economy have been on a broad uptrend, more noticeably since the global financial crisis

Nomura | Asia Special Report November 2011
12
Fig. 3: Nomura’s China Stress Index
Note: The last data point is September 2011. Source: PBC; National Bureau of Statistics and Nomura Global Economics. For details of construction, see the Appendix: The construction of Nomura‟s China Stress Index
A closer look at the components reveals that rapid increases in residential
housing starts relative to sales, residential property prices, gross capital
formation, property loans and domestic credit have been the main recent
drivers (Figure 4). We are under no illusions that the CSI has its limitations and
needs to be treated with caution. The results of the CSI, which we will update
on a quarterly basis, should always be open to interpretation, and used as a
tool among many others for analysis of China macro risks.
Fig. 4: The five biggest drivers of the CSI over Jan 2007-Sep 2011 (contribution to the increase in the CSI index over this period)
Note: Unit is percentage point. Source: PBC; National Bureau of Statistics and Nomura Global Economics. For details of CSI construction, see Appendix: The construction of Nomura‟s China Stress Index.
Fig. 1
99.5
100.0
100.5
101.0
101.5
102.0
Jan-01 Jan-03 Jan-05 Jan-07 Jan-09 Jan-11
Jan 2000=100
0 0.05 0.1 0.15 0.2
Residential housing starts less sales
Residential property price deviation from long-run linear trend
Gross capital formation/GDP
Property loans/total loans
Domestic credit/GDP
Housing starts relative to sales, property prices, gross capital formation, property loans and domestic credit have been the main recent drivers

Nomura | Asia Special Report November 2011
13
1. Overinvestment and excessive credit
Since the early 1960s the share of total investment (public and private gross
capital formation) in China‟s GDP has trended upwards, a normal course of
economic development as poor countries start with a small capital stock
ensuring a high return on capital and hence a high rate of investment. Former
leader Deng Xiaoping endorsed this trend during his famous South China tour
in 1992, by espousing the benefits of an open economy, setting China firmly
on the path of export- and investment-led growth. China‟s share of investment
in GDP rose from 35.3% in 2000 to a relatively high 43.9% in 2008, before
surging to 47.5% in 2009 and to 48.6% in 2010 (Figure 5). By the end of 2010,
we estimate that more than half of China‟s total gross capital formation was
related to property (23.8%) and infrastructure (27.7%). This year, property
investment has continued to surge, to 13% of GDP in Q3 2011 (Figure 6).
Fig. 5: Investment and consumption shares of nominal GDP
Source: CEIC and Nomura Global Economics.
Fig. 6: Property investment share of nominal GDP
Source: China's NBS and Nomura Global Economics.
In international and historic terms, China is now an outlier: no other large
economy has had such a high investment-to-GDP ratio for so long. The
highest investment ratio in the US since 1929 was 26.2% in 1941. Surveying
Japan, Korea, Singapore and Thailand, four Asian countries that have
experienced rapid economic take-offs, their highest investment ratios typically
lasted seven to eight years – and none ever reached the levels seen in China
(Figure 7). 2011 will be the ninth consecutive year that China‟s investment
ratio has been over 40%. Undoubtedly there are questions marks over the
quality of Chinese data – some claim that China‟s official investment ratio is
overstated because the services sector and hence consumption are likely
underestimated; on the other hand, aggregating the investment data for
China‟s 31 provinces suggests that the official national investment-to-GDP
ratio could be 7pp too low (see Box 1: Fuzzy numbers).
10
20
30
40
50
60
70
1954 1962 1970 1978 1986 1994 2002 2010
Investment
Household consumption
% GDP
3
6
9
12
15
Sep-97 Sep-99 Sep-01 Sep-03 Sep-05 Sep-07 Sep-09 Sep-11
% of GDP
The share of investment in China‟s GDP has risen to almost half
China is now an outlier: no other large economy has had such a high investment-to-GDP ratio for so long

Nomura | Asia Special Report November 2011
14
Fig. 7: Asian investment-to-GDP ratios – during economic take-off periods
Note: t=numbers of years from the starting year, eg. For China, the starting year is 2002. The data are in nominal terms and investment is the sum of public and private gross capital formation. Source: China Statistical Yearbook; CEIC and Nomura Global Economics.
Fig. 2
Box 1: Fuzzy numbers
The quality of China‟s statistics is improving, but large gaps remain. Following the completion of its first Financial
Stability Assessment Program (FSAP) of China in July 2011, the IMF noted that a “full assessment of these various
risks is, however, hampered by serious data gaps, weakness in the infrastructure and constraints on the FSAP
team‟s access to confidential data”, IMF (2011a, p.11). Some of the glaring examples include the official urban
unemployment rate hovering within such a tight range of 4.0-4.3% for the past nine years, and how in 2010 real
GDP growth in 29 of the 31 provinces was above the national GDP growth of 10.3%. There have also been several
sizable upward revisions to China‟s GDP, mainly due to under-reporting of the size of the services sector and
hence consumption. The biggest revision was in 2005 after the first national economic census, when 2004 nominal
GDP was revised up by 16.8% in one fell swoop, with the share of services in GDP revised up from 31.9% to
40.7%. It is possible that the services sector and consumption will be revised up again, and the investment-to-GDP
ratio revised down, but then again it is also possible that the starting position is a higher investment-to-GDP ratio
than officially reported. GDP data are available by province and aggregating the gross capital formation and the
GDP data for the 31 provinces, we arrive at an investment-to-GDP ratio of 55.7% in 2010, a full 7pp higher than the
national investment-GDP ratio (see Figure 8).
Fig. 8: An alternative measure of the investment-to-GDP ratio
Source: CEIC and Nomura Global Economics.
Fig. 3
The recent jump in China's investment ratio to almost half of GDP was driven
by a conscious policy response to the global financial crisis, but the
fundamental reason why the investment ratio has been so high for so long has
more to do with serious factor cost distortions.
The high priority on internal rebalancing of the economy – that is, lowering the
investment ratio and raising the consumption ratio – is not a new initiative; in
fact it was a key goal of the 11th Five-Year Plan (2006-10) unveiled in early
20
25
30
35
40
45
50
t t+1 t+2 t+3 t+4 t+5 t+6 t+7 t+8 t+9 t+10
China, 2002 -11e
Japan, 1966 -75
Korea, 1988 -98
Singapore, 1978 -88
Thailand, 1989 -98
% of GDP
0
10
20
30
40
50
60
1954 1962 1970 1978 1986 1994 2002 2010
Sum of provinces
National
% GDP

Nomura | Asia Special Report November 2011
15
2006. However, the global financial crisis of 2008 was a huge unexpected
shock, causing China‟s export performance to swing from 23% y-o-y growth in
Q3 2008 to a 24% y-o-y contraction in Q2 2009. Fearing major knock-on
effects to the domestic economy from firms cutting jobs and capex, the
authorities gave the go-ahead to a credit-financed investment boom. China's
real estate developers, SOEs and local governments took heed, ramping up
investment in property and infrastructure, putting rebalancing efforts in China
firmly on the back burner.
However, the more fundamental reason for China's persistently high
investment-to-GDP ratio is the large difference between the return on, and
cost of, capital. The bank lending rate has historically been artificially
controlled far below the return on capital needed to support an industry-led,
export-orientated growth model. A simple approximation of the return on
capital is nominal GDP growth, which averaged 18.5% in the 1990s and 14.6%
in the 2000s, compared with the benchmark 1yr bank lending rate of 9.4% in
the 1990s and 5.8% in the 2000s. This large gap gave producers a big
incentive to invest. To more formally estimate China's return on capital, we
follow a similar methodology to the Bank of Japan (2011) and Bai et al (2006).
Qualitatively, the results are similar to that of using nominal GDP growth,
indicating the large wedge between the return on, and cost of, capital of over
10pp over the past three decades (Figure 9). Even five years ago, Aziz (2006)
found that China‟s low cost of capital was quantitatively an important factor in
explaining why the investment-to-GDP ratio was high, and back in 2006 the
ratio was “only” 42%.7
Fig. 9: The difference between the return on, and cost of, capital
Note: The aggregate return on capital is measured using approximated data on the share of capital in total income, the capital stock-to-output ratio and the depreciation rate of capital. The cost of capital is estimated using the 1yr bank lending rate. Source: CEIC; China Statistical Yearbook; Development and Research Center under the State Council; and Nomura Global Economics.
The big question is not if, but when, China‟s investment and consumption
ratios re-balance – and will it happen in a gradual, policy-controlled way, or will
the process involve one or more episodes that are abrupt and beyond the
control of policymakers, causing major disruptions to the economy and
markets? International experience shows that rebalancing is never easy, as it
usually means redistributing income and power from vested interests that have
benefited from the old model – in China, notably large SOEs and local
governments (see chapter: The privileged state-owned enterprises). Of all the
main components in GDP, investment is typically the largest swing factor and
in most Asian countries it usually contracts at least one year each decade. Yet
7 The flipside of China's high investment-to-GDP ratio is a low consumption-to-GDP ratio, which is partly
because Chinese households have a high motive for precautionary saving, but also the share of wages in national income is low relative to profits. SOEs historically provided generous social welfare benefits to their workers, so the downsizing of SOEs in the late 1990s meant that workers needed to save more of their income to pay for their own healthcare, education and pensions. Also, while urbanization has boosted incomes of rural migrant workers, the stringent hukou household registration system has provided them with scant social welfare benefits in the cities where they live, increasing their precautionary savings. The very low or negative real interest rate on bank saving deposits has also forced households to save more than they otherwise might have.
0
5
10
15
20
25
30
% Difference (percentage points)
Return on capital
Cost of capital
The fundamental reason for the high investment-to-GDP ratio is the large difference between the return on, and cost of, capital
At almost half of GDP, China‟s investment is now so large that were it to stop growing it would cut real GDP growth in half

Nomura | Asia Special Report November 2011
16
China's investment has not fallen since 1990 in volume terms and not since
1976 in value terms (Figure 10). At almost half of GDP, China‟s investment is
now so large that were it to stop growing, let alone turn negative, it would cut
real GDP growth in half (see Box 2: China‟s challenging GDP arithmetic). The
timing of rebalancing is also now less favourable for China, as besides
investment and consumption, the third engine of growth – exports – is unlikely
to be firing on a full cylinder given the crisis-scarred economies of the US and
Europe.
Fig. 10: Identifying the years when real gross capital formation contracted
1940s 1950s 1960s 1970s 1980s 1990s 2000s
China Nominal n.a. 1955: -2% 1967:-25% 1976:-7%
1960-62:-95% 1972:-3%
Real* n.a. 1955:-2% 1967-68: -27% 1976: -9% 1981: -2% 1990: -1%
1960-62:-109% 1972: -2%
Hong Kong Real n.a. n.a. 1966-68: -38% 1989: -5% 1998-99: -32% 2008: -1%
1985: -5% 1996: -3% 2005: -1%
1982-83: -7% 2001: -5%
India Real n.a. 1957-59: -8% 1967-68: -9% 1979: -10% 1981: -4% 1996: -1% 2008: -6%
1952: -26% 1961: -2% 1974: -10% 1991: -16% 2000-01: -6%
Indonesia Real n.a. n.a. n.a. 1988: -5% 1998-99: -62% 2002: -4%
Japan Real n.a. 1974-75: -12% 1983: -3% 1998-99: -16% 2008-09: -23%
1980: -1% 1992-94: -10% 2001-03: -13%
Korea Real n.a. n.a. n.a. 1975: -4% 1980: -17% 1997-98: -32% 2009: -13%
1972: -10% 1992: -1%
Malaysia Real n.a. n.a. n.a. n.a. 1985-87: -32% 1998-99: -47% 2008-09: -17%
2005: -2%
2003: -2%
2001: -9%
Philippines Real 1956: -1% 1962: -1% 1970: -4% 1984-85: -69% 1998-99: -29% 2009: -9%
1952: -3% 1960: -11% 1980: -4% 1991: -17% 2006: -15%
1949-50: -30% 2004: -2%
Singapore Real n.a. n.a. 1964: -3% 1977: -4% 1988: -3% 1998: -24% 2009: -19%
1975: -5% 1985-86: -18% 2001-03: -57%
Taiwan Real n.a. 1955: -15% 1975: -7% 1985: -8% 2007-09: -30%
1982: -5% 2001: -24%
Thailand Real n.a. n.a. n.a. n.a. 1985-86: -8% 1997-98: -73% 2009: -25%
1982: -7% 2006: -4%
Source: CEIC and Nomura Global Economics. Note: The shaded areas are decades when real gross capital formation falls. For China, official data on real gross capital formation are not available and so Nomura‟s proxy is nominal gross capital formation deflated by the fixed-asset investment deflator back to 1990 and before that, deflated by the GDP deflator.

Nomura | Asia Special Report November 2011
17
Box 2: China’s challenging GDP arithmetic8
With investment making up almost half of GDP, China‟s economy is vulnerable to an investment slump for
whatever reason: a banking crisis; the central bank hiking aggressively having fallen behind the curve in fighting
inflation; unforeseen shocks, such as social unrest or a deadly pandemic; or simply because “investment” fatigue
sets in. To illustrate China‟s challenging GDP arithmetic consider the numbers. We expect real investment to grow
by 11.3% in 2011, contributing 5.5pp to GDP growth of 9.2%. However, if real investment were to grow by only 5%
it would contribute 2.4pp and, assuming (conservatively) unchanged contributions from net exports and
consumption, GDP growth would be just 6.1%. If real investment growth were to slow to 0%, it would make no
contribution to GDP and so GDP growth would more than halve to 3.7%.
However, carefully calibrating a rebalancing of GDP growth toward consumption is no easy feat. To illustrate, for
the share of household consumption in GDP to rise, consumption growth must outpace GDP growth. Yet we
estimate that real household consumption has grown at a double-digit rate in only three of the past 14 years and
over the past decade has averaged about 9% growth, whereas real GDP has averaged 10.3% growth. To raise the
household consumption-to-GDP ratio from 34% in 2010 to 40% by 2020, and assuming real GDP grows 8% pa this
decade, then real household consumption would need to grow consistently by 10% pa over 2010-20. To turn
consumption into an engine of growth, China needs to do more than simply beef up social welfare spending to
reduce precautionary household savings. It needs to transfer a massive amount of income from the still heavily
state-subsidized corporate sector to households (see chapter: The privileged state-owned enterprises) and end
financial repression, which has given rise to negative real deposit rates (see chapter: Rudimentary monetary
architecture).
As Japan's experience shows, the large positive gap between the return on,
and the cost of, capital does not last forever (see Box 3: Lessons from Japan
on the return and cost of capital). China‟s large gap could soon start to narrow,
possibly quite sharply, because of a simultaneous fall in the return on capital
and a rise in the cost of capital. The return on capital could start falling simply
because the enormity of investment is causing the capital stock to accumulate
at such a rate that capital is rapidly becoming less scarce. Total nominal
investment (i.e. gross capital formation) is set to total some USD3.5trn in 2011,
3x larger than in 2006 and 7x larger than in 2001. Another reason to expect
the return on capital to soon start to fall is the strong international evidence
that investment booms are often associated with a misallocation of capital,
especially in emerging markets. This seems a particular risk in China given: 1)
the banking sector does not have much experience in gauging credit risk; 2) a
massive shadow banking sector has emerged, which is difficult to measure, let
alone regulate; and 3) the fact that much of the investment in recent years has
been government-led, which tends to be less productive than private
investment, and in big infrastructure projects, which can take many years to
break even.9 A third reason is that China's heavy investment can also run into
diminishing returns from a social perspective, as capital intensive industries
pollute the environment and create fewer job opportunities.
Meanwhile, China's cost of capital has been increasing and we expect it to rise
further. The benchmark 1yr bank lending rate has risen from 5.31% in October
2010 to 6.56%, and this likely understates the effective cost of capital as banks
are charging a record 61.2% of their new loans above the benchmark lending
rate; in the shadow banking sector borrowing costs can be several times
higher. While the central bank has paused its rate hiking cycle, we expect it to
resume hiking in 2012. China needs higher interest rates to contain what we
see as structural inflation problems caused by accelerating labour costs (see
chapter: The Lewis turning point); the urgent need for the government to
8 The phrase “China‟s challenging GDP arithmetic” was coined by Paul Sheard, Nomura‟s global chief economist,
back in 2009 (see the Global Letter, “China‟s challenging GDP arithmetic” in the Global Economic Weekly Monitor, 25 September 2009). 9 A good micro example is China building – in just three years – the world‟s longest and fastest high-speed rail
network, which according to data from the International Union of Railways extends to 6,300km, an achievement that had produced considerable national pride. The collision of two new high-speed trains outside the city of Wenzhou on 23 July, which killed 40 and injured 191, stoked public anger and a media frenzy that the breakneck development of high-speed rail had cut corners – indeed, China‟s Railways Ministry is the manufacturer, operator and regulator of the network. As a result, Beijing has suspended approvals of new high-speed lines and its original ambitious program of having a further 4,339km of high-speed rail under construction by 2012 – more under construction over this period than that of the rest of the world put together – is now unlikely to be achieved.
As Japan's experience shows, the large positive gap between the return on, and the cost of, capital does not last forever

Nomura | Asia Special Report November 2011
18
unwind generous subsidies to SOEs and to stop underpricing factor inputs
such as land, water and energy; and a likely continued multi-year surge in food
prices (see our Special Report, The coming surge in food prices, 8 September
2010). Higher interest rates would also be a natural result of accelerating the
evolution of China's monetary policy framework, from administrative measures
to more market-price-based instruments (see chapter: Rudimentary monetary
architecture). A key risk is policy errors, for example falling behind the curve in
fighting inflation and needing to catch up via aggressive rate hikes, leading to
a sharp rise in the cost of capital at a time when the return on capital could be
falling.10
10
Firms should adjust their capital stock so that its marginal productivity equals its user cost. As interest rates increase, firms scale back investment for which the expected return is insufficient to cover the higher financing costs. Using micro data on listed Chinese firms over 2002-07, Conway, Herd and Chalaux (2010) found empirically that capital spending is negatively influenced by higher interest rates.

Nomura | Asia Special Report November 2011
19
Box 3: Lessons from Japan on the return and cost of capital
Similar to China in the last two decades, Japan achieved high GDP growth over the period 1955 to 1970, averaging
9.7% and, like China today, Japan‟s economy became increasingly unbalanced, with a rising investment-to-GDP
ratio and falling consumption-to-GDP ratio, reaching 35.5% and 59.7% respectively in 1970 (Figure 11). Domestic
rebalancing in Japan began after 1970. According to a recent study by researchers Fukumoto and Muto (2011) at
the Bank of Japan, the main trigger of rebalancing was a decline in the return on capital and a rise in the cost of
capital. In the 1950s, Japan had a small capital stock and so the return on capital was higher than 20%, but the
rapid accumulation of capital drove down the marginal productivity of capital. An undeveloped financial sector led to
some misallocation during the investment boom, while the development “catch up” to advanced foreign technology
was virtually complete in the early 1970s. All these factors contributed to a decline in the return on capital in the
late 1960s and early 1970s.
Meanwhile, the bank lending rate was highly regulated in the 1950-60s and was kept very low to support an
industry-led growth model. However, in the early 1970s Japan experienced an outbreak of inflation, in part driven
by the 1973-74 oil crisis, but also the flow of surplus rural labour moving to the cities started to diminish in the
1960s, leading to increased worker bargaining power and a surge in real wages, the so-called Lewis turning point
(Minami, 1973). All this led to monetary policy tightening and a rise in bank lending rates and the cost of capital. So
in the early 1970s, Japan faced a marked narrowing in the difference between the return and cost of capital,
significantly reducing firms‟ incentives to maintain high rates of investment (Figure 12).
Fig. 11: Japan's investment and consumption shares of GDP
Source: Bank of Japan (2011).
Fig. 12: Japan’s difference between the return and cost of capital
Source: Bank of Japan (2011).
What accentuates the macro risks of China's investment boom is the credit
boom associated with it. One of the relatively few robust findings to emerge
from the empirical literature on leading indicators of banking crises is that rapid
domestic credit growth increases the likelihood of a problem (Kaminsky and
Reinhart, 1999). In a survey of credit booms in 28 emerging market economies
during 1970-2002, the IMF (2004) estimates that about 75% of the credit
booms were associated with a banking crisis. More pertinent to China, Borio
10
20
30
40
50
60
70Gross fixed capital formation
Consumption
% of nominal GDP
0
5
10
15
20
25
30
35
%Difference (percentage points)
Return on capital
Bank lending rate
What accentuates the macro risks of China's investment boom is the credit boom associated with it

Nomura | Asia Special Report November 2011
20
and Lowe (2002) use annual data since 1960 for 34 countries to show
empirically that an investment boom by itself may pose little threat to the
stability of the financial system. Rather, it is the combination of various
imbalances, in particular the simultaneous interactions of rapid credit growth,
rapid increases in asset prices and an investment boom – rather than any one
of these alone – that increases the likelihood of problems.
Analysis of China's recent credit boom has tended to focus on local
government borrowing, where the data are opaque. Local governments are not
allowed to directly incur debt, and so finance infrastructure projects by
borrowing from banks. To do so, they set up over 6,500 Local Government
Financing Vehicles (LGFVs). The latest official estimate of local government
debt outstanding was RMB10.7trn, or 27% of 2010 GDP, as at June 2011 by
the State Audit Office, although some private estimates are much higher.11
Whatever the true figure of local government debt is, a broader analysis can
be gleaned from IMF data which show that total domestic credit (private and
government) surged from 121% of GDP in Q4 2008 to 147% in Q2 2011, a
level that is not far from the peak in 2003 (Figure 13). Moreover, China's
credit-to-GDP ratio stands as an outlier compared with other countries of a
similar income level (Figure 14).
Fig. 13: Domestic credit-to-GDP ratio
Source: IMF; CEIC and Nomura Global Economics.
Fig. 4
Fig. 14: Credit-to-GDP ratio versus GDP per Capita
Source: IMF Global Financial Stability Report, September 2011.
Fig. 5
China's credit boom over 1998-2003 led to a banking crisis. As far as we know,
the earliest official data on the NPL ratio of the major commercial banks was
23.6% in 2002, but this excludes a large volume of bad loans, of over 15% of
GDP, that were carved out and transferred to newly created asset
management companies a few years earlier.12
Since 2002, the official NPL
ratio has steadily declined and by June 2011 stood at just 1.0% for all
commercial banks. However, given that China's credit-to-GDP ratio has
surged to just shy of the record high in 2003, there is little doubt that the NPL
ratio will rise again –the question is by how much.
Reflecting the paucity of data and the uncertainties involved, estimating how
high NPLs may rise and the potential fiscal cost of recapitalizing the banks can
vary widely.13
To be sure, compared to a decade ago China‟s banks today are
better capitalized, have higher loan-loss provisioning and face more stringent
11
In July 2010, the China Banking Regulatory Commission (CBRC) first estimated total local government debt outstanding at RMB7.7trn but raised its estimate in November 2010 to RMB9.1trn. The latest estimate in June 2011 by the State Audit office was even higher, at RMB10.7trn, or 27% of 2010 GDP – albeit still far short of the RMB20trn projected by Professor Victor Shih at Northwestern University. 12
Before the establishment of asset management companies, unofficial estimates put the peak NPL ratio in 1999-2000 at about 40%, or higher. The OECD estimates that the total cost to the government of recapitalizing the banking sector in the early 2000s was some 30% of GDP (OECD 2005). 13
The State Audit Office sent a warning in June 2011, when after a lengthy audit of the five major banks it found that RMB58bn, or 17% of total loans outstanding, violated regulations, such as new loans granted for unapproved projects or used to repay existing debt. Rating agency Moody‟s expects China‟s NPL ratio to rise to 8-12% in coming years. In July 2011, the official auditor of Liaoning province reported in a speech that 85% of LGFVs in Liaoning had insufficient income in 2010 to cover debt-servicing payments.
50
60
70
80
90
100
110
120
130
140
150
160
Jun-81 Jun-86 Jun-91 Jun-96 Jun-01 Jun-06 Jun-11
% of GDP
China
Cyprus
0
50
100
150
200
250
300
350
0 10 20 30 40 50 60 70
Cre
dit to
GD
P, e
nd
-2010
(%
)
GDP per capita, 2009 (PPP, thousands of US$)
China's credit-to-GDP ratio stands as an outlier compared with other countries of a similar income level
China‟s banks today are better capitalized, have higher loan-loss provisioning, but…
There is little doubt that the NPL ratio will rise again – the question is by how much

Nomura | Asia Special Report November 2011
21
regulations and supervision.14
But on the other hand, we see two important
reasons for concern: 1) a big and largely unregulated shadow banking sector
has emerged in recent years, estimated to be almost as large as the official
banking sector (see chapter: Rudimentary monetary architecture); and 2) this
time, both local governments and property developers are heavily indebted,
which raises the risk of a vicious spiral if there is a major correction in property
prices given that 30-40% of local government revenue is made up of proceeds
from land sales and other property-related activities.15
According to official
data, nationwide property prices have risen 60% since the end of 2006 (IMF
2011c). This has fueled speculative property investment and an ominous sign
is the large gap that has opened up between the combined floor space of
residential, office and commercial property that builders have started work on,
compared to the floor space sold (Figure 15).16
In a back-of-the-envelope exercise simply to illustrate how much estimates can
vary, if we assume that China's NPL ratio rises from 1% to 10% and that 70%
of these loans could be recovered, then the cost to the banking sector – or
failing that, the government – would be RMB1.6trn, or 3.6% of 2011 GDP
(Figure 16). However, under more drastic scenarios of higher NPLs and lower
recovery rates, it is possible that the total cost could be over 30% of 2011 GDP.
Fig. 15: Difference between floor space started and floor space sold:
Source: CEIC and Nomura Global Economics.
Fig. 16: Assessing the cost of potential financial sector problems, % of GDP
Loan recovery rate, %
30 40 50 60 70
NPL
ratio,
%
10 8.3 7.1 5.9 4.7 3.6
20 16.6 14.2 11.8 9.5 7.1
30 24.9 21.3 17.8 14.2 10.7
40 33.1 28.4 23.7 18.9 14.2
50 41.4 35.5 29.6 23.7 17.8
Note: % of estimated 2011 GDP. Source: CEIC and Nomura Global Economics.
14
In May 2011, the CBRC ordered systemically important banks to have bad-loan provisions that are no less than 2.5% of total outstanding credit by the end of 2013 and 150% of non-performing debt. 15
This year, tighter credit conditions have led property developers to seek other, more expensive, forms of financing in the shadow banking sector, notably new entrusted loans. Lucy Fung, Nomura‟s China Bank analyst, estimates that of the RMB702.8bn of new entrusted loans in Jan-Jun 2011, 46% were granted to property developers at an average interest rate of 15.8% and at an average duration of 11.3 months. Stress tests by ratings agency Standard & Poor‟s (2011) estimate that the property developers could absorb a 10% decline in property sales in 2012. But if property sales fell by 30% in 2012, more than half of the 30 developers rated by S&P would have “weak liquidity”, which according to S&P‟s definition means overarching credit risk and an issuer credit rating at the “B” level or lower. 16
The increasing use of desperate sales gimmicks by property developers is one micro-level sign that property supply has moved ahead of demand. For example, at this year's Shanghai Autumn Property Exhibition, to exploit the law which prohibits the purchase of more than two residential apartments, so-called “Soho” apartments – offices equipped with private bathroom and kitchens – have been marketed as they are not classed as homes (South China Morning Post, 6 October 2011).
0
500
1,000
1,500
2,000
2,500
Dec-96 Dec-99 Dec-02 Dec-05 Dec-08 Dec-11
Floor space started
Floor space sold
Millions of Sq. meters, 12m rolling sum
… a big and largely unregulated shadow banking sector has emerged in recent years

Nomura | Asia Special Report November 2011
22
2. Rudimentary monetary architecture
China‟s monetary policy, by evolving too slowly toward market price-based
instruments, is losing its effectiveness in managing an economy that is rapidly
becoming more open and sophisticated. In the words of the OECD, “after three
decades of liberalization, product markets have become increasingly
competitive and market forces are now generally the main determinant of price
formation and market behaviour”, OECD (2005, p.102). The PBC needs to
place less emphasis on quantity-based instruments such as the bank reserve
requirement ratio (RRR), central bank bill issuance, credit quotas and bank
window guidance, and instead adopt the interest rate as the primary policy tool.
A precondition for this is a more flexible exchange rate. Market-based
instruments are less distortionary and can have powerful indirect economy-
wide effects by enhancing competition, efficiency and risk management.
At the root of the problem is China‟s inflexible exchange rate, which
significantly hinders the PBCs ability to tailor monetary policy to domestic
objectives. The essential problem stems from Professor Robert Mundell‟s
“Impossible Trinity”: that a country can simultaneously choose two, but not all
three, of a managed exchange rate, an open capital account and monetary
policy autonomy. With capital flowing more freely, China risks losing more
control over its monetary policy if it continues to heavily manage the exchange
rate. A rigid exchange rate reduces the central bank‟s ability to use market
instruments such as interest rates to manage aggregate credit growth and
instead perpetuates a reliance on administrative measures such as credit
quotas, hindering efforts to make the banking system more commercially
orientated.
China‟s inflexible exchange rate regime requires the PBC to conduct
substantial open market operations to sterilize, or “mop up” excess domestic
liquidity arising from FX intervention, which has increased FX reserves to an
extraordinary USD3.2trn as at September 2011.17
The sterilization measures
include aggressively issuing low-yielding central bank bills and raising the
RRR of large banks 12 times since January 2010, from 15.5% to 21.5%, an
all-time high.18
Meanwhile, the benchmark 1yr bank lending interest rate has
been increased only five times, from 5.31% to 6.56% (Figure 17). While the
PBC is successfully sterilizing its FX intervention, it is repressing the free-
functioning intermediation role of the banking sector.
Fig. 17: Bank reserve requirement ratio and the benchmark bank lending rate
Source: CEIC and Nomura Global Economics.
17
The massive accumulation of FX reserves to USD3.2trn is not necessarily costless. The larger the stock of FX reserves the greater the potential quasi-fiscal cost if the return earned on the foreign assets is less than the interest paid on the PBC‟s sterilization bills. The PBC could also incur substantial capital losses on its balance sheet if USD was to crash, leaving it with negative capital. The PBC could try and recapitalize itself by earning profits from increased seigniorage, i.e. printing more currency; or it could be recapitalized by the government but at the cost of losing some of its monetary policy independence and heightening the risk of a major inflation problem. 18
Combining these two sterilization measures, we estimate that the PBC has effectively "locked up" nearly one-quarter of total bank deposits that otherwise could have been used for more profitable commercial business, such as lending.
0
5
10
15
20
25
Oct-91 Oct-95 Oct-99 Oct-03 Oct-07 Oct-11
Benchmark 1yr bank lending rate
Bank reserve requirement ratio
%
China‟s monetary policy is losing its effectiveness in managing an economy that is rapidly becoming more open and sophisticated
While the PBC is successfully sterilizing its FX intervention, it is repressing the free-functioning intermediation role of the banking sector
At the root of the problem is China‟s inflexible exchange rate

Nomura | Asia Special Report November 2011
23
Fig. 6 The PBCs sterilization operations impose considerable cost on the banking
sector. China maintains an interest rate ceiling on bank deposits, which
currently ranges from 3.50% for 1yr savings deposits to 5.50% for 5yr deposits.
So, the requirement that 21.5% of deposits for large banks be reserved at the
PBC earning only 1.62% interest is akin to an implicit tax on the banking sector,
restricting banks from allocating a larger portion of their portfolios to higher-
yielding loans and investments.
One way to help ease this financial repression is to allow a wide margin
between the benchmark bank lending and deposit rates, which traditionally is
what China has done. In the last decade, the spread between the 1yr bank
lending and saving deposit rates averaged 3.4% – substantially higher than
the 1.4% average in the 1990s. However, fat margins simply shift the cost of
financial repression from the banks to depositors, which means most
households given a lack of alternative investment opportunities. This has been
particularly onerous on depositors in the past year because of the sharp rise in
inflation. For a third time in the past eight years (after 2004 and 2008) the real
rate of return on 1yr bank saving deposits has sunk deep into negative territory,
averaging -2.5% in Jan-Sep 2011 (Figure 18). The IMF (2011a, p.34) finds that
a 1pp increase in the real rate of return on bank deposits lowers the urban
household saving rate by 0.6pp.
Fig. 18: 1yr inflation-adjusted real deposit rate
Source: CEIC and Nomura Global Economics.
Fig. 7
It should come as no surprise then, that despite waves of macro-prudential
tightening measures, it has proved difficult to cool speculation in the property
market. Moreover, with negative inflation-adjusted returns, banks have been
finding it more difficult to attract deposits and so are turning to wealth-
management products, which typically are loans repackaged as short-term
investment vehicles and are held off-balance sheet. These products are
typically short term, maturing within one month, and can offer annualized
returns of about 8%, more than double that on 1yr bank deposits. According to
Xinhua news agency, by mid-2011 China had RMB7trn in outstanding wealth
management products, triple the amount at the end of 2010. With bank assets
mainly tied to longer-term loans, there is a growing problem of duration
mismatch between bank assets and liabilities.
Perhaps in response, in this latest tightening cycle the PBC has hiked interest
rates on longer-term bank deposits by a larger magnitude, which has shifted
some of the costs of financial repression back to the banks. For example,
since September 2010 the 1yr bank deposit rate been increased by 125bp,
and the 5yr rate by 190bp, while the benchmark 5yr or longer lending rate has
been increased by only 114bp. Interestingly, this seems to be forcing banks to
price credit risk more actively by charging borrowing rates that are higher than
official benchmark rates on more of their loans: in June 2011, a record-high
61.2% of loans were priced above benchmark rates, versus 44.3% in
-5
-4
-3
-2
-1
0
1
2
3
4
5
6
7
Sep-97 Sep-99 Sep-01 Sep-03 Sep-05 Sep-07 Sep-09 Sep-11
% p.a.
One way to help ease this financial repression is to allow a wide interest rate margin, but this shifts the repression from the banks to depositors
Negative real bank deposit rates have contributed to property market speculation and the explosion of wealth-management products
Nomura | Asia Special Report November 2011
24
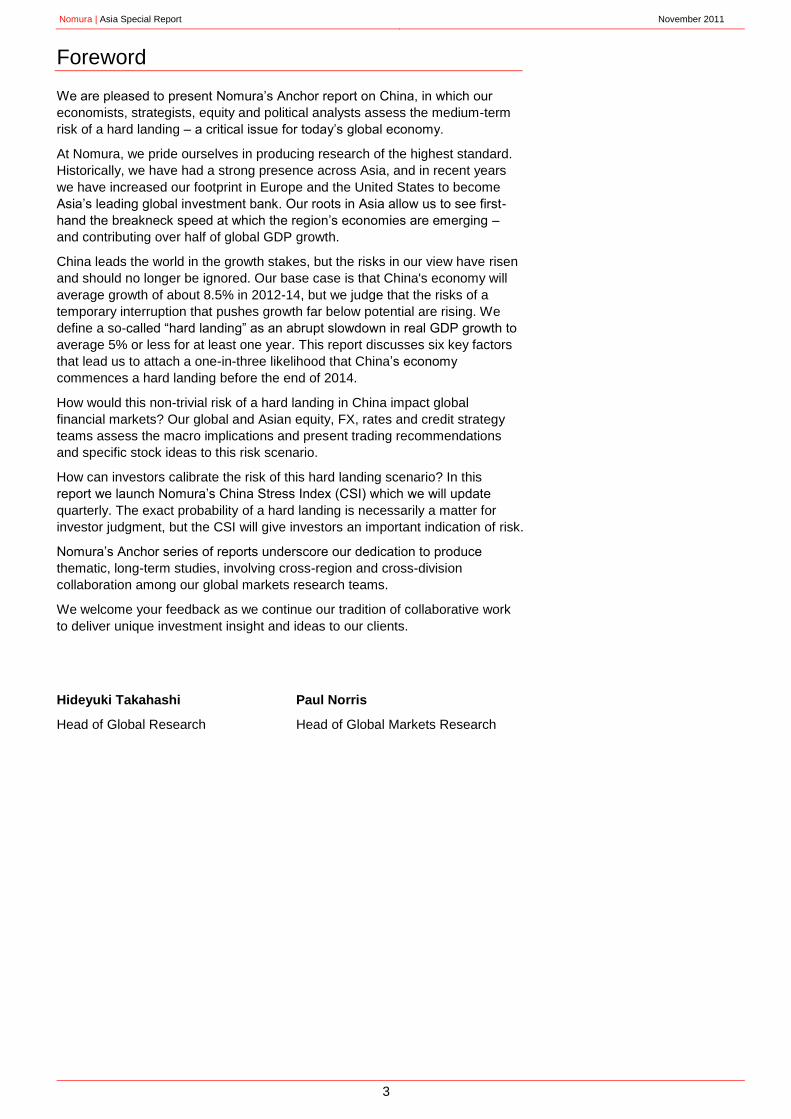
September 2010 (Figure 19).19
Yet with an obligation to lend to large SOEs,
banks are increasingly rationing credit to private companies, forcing them to
borrow in the shadow banking sector at punitively higher interest rates (see
chapter: The privileged state-owned enterprises).
Fig. 19: Proportion of new bank loans charged above the benchmark lending rate
Source: CEIC and Nomura Global Economics.
Fig. 8
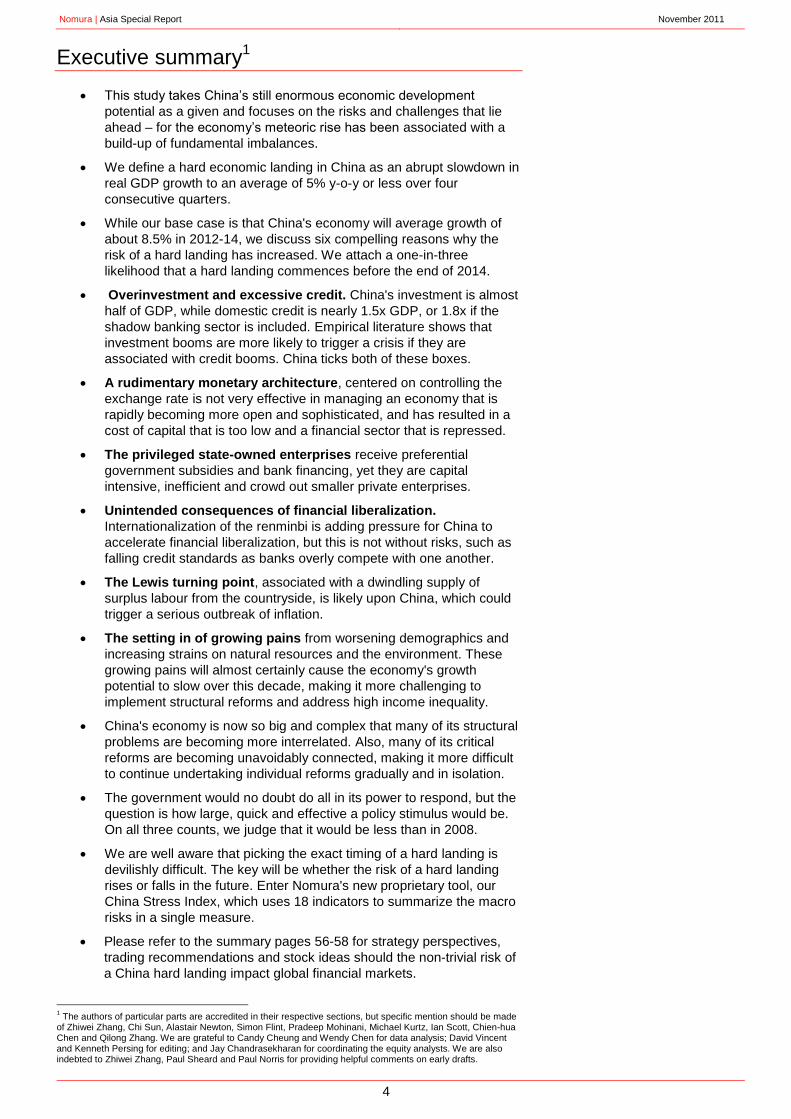
Financial repression is also encouraging off-balance sheet bank activities,
disintermediation and other less-regulated activities outside the official banking
system. In an attempt to monitor informal financing activities, the PBC
introduced a new statistic in February 2011 called “total social financing”,
which in addition to net new bank loans includes net new trust loans, bank
acceptance bills, corporate bonds, non-financial corporate equity and funding
from insurers (see Box 4: Shadow banking in the US and China compared).
The total social financing statistic likely still does not capture all informal
financing activities, but even so, the results are revealing. Outside net new
bank loans, the sum of other forms of financing more than tripled from
RMB1.9trn in 2008 to RMB6.3trn in 2010 – although the annualized rate in
Jan-Sep 2011 had eased to RMB5.5trn. Add on net new bank loans, which
totaled an annualized RMB7.6trn in Jan-Sep 2011 and total social financing
was RMB13.1trn, with the shadow banking sector comprising a stunning 42%
of the total. A sign of the costs of financial repression, movements in the bank
RRR are closely correlated with the aggregate data on net new non-bank
financing activities (Figure 20).
Fig. 20: Bank RRR and net new bank loans and other forms of financing
Note: Jan-Sep 2011 is an annualized figure. Source: CEIC and Nomura Global Economics.
19
On 1 January 2004, the PBC deregulated commercial bank lending rates, allowing banks to charge 0.9-2.0x the benchmark 1yr lending rate. On 29 October 2004 the ceiling on commercial bank lending rates was scrapped altogether (except for credit cooperatives).
30
35
40
45
50
55
60
65
Jun-05 Jun-06 Jun-07 Jun-08 Jun-09 Jun-10 Jun-11
% share
0
5
10
15
20
25
0
3
6
9
12
15
18
2002 2003 2004 2005 2006 2007 2008 2009 2010 Jan-Sep 2011
Net new bank loans, lhs
Net new other forms of financing, lhs
Bank reserve requirement ratio, rhs
RMBbn %
Financial repression is also encouraging off-balance sheet bank activities and other less-regulated activities outside the official banking system
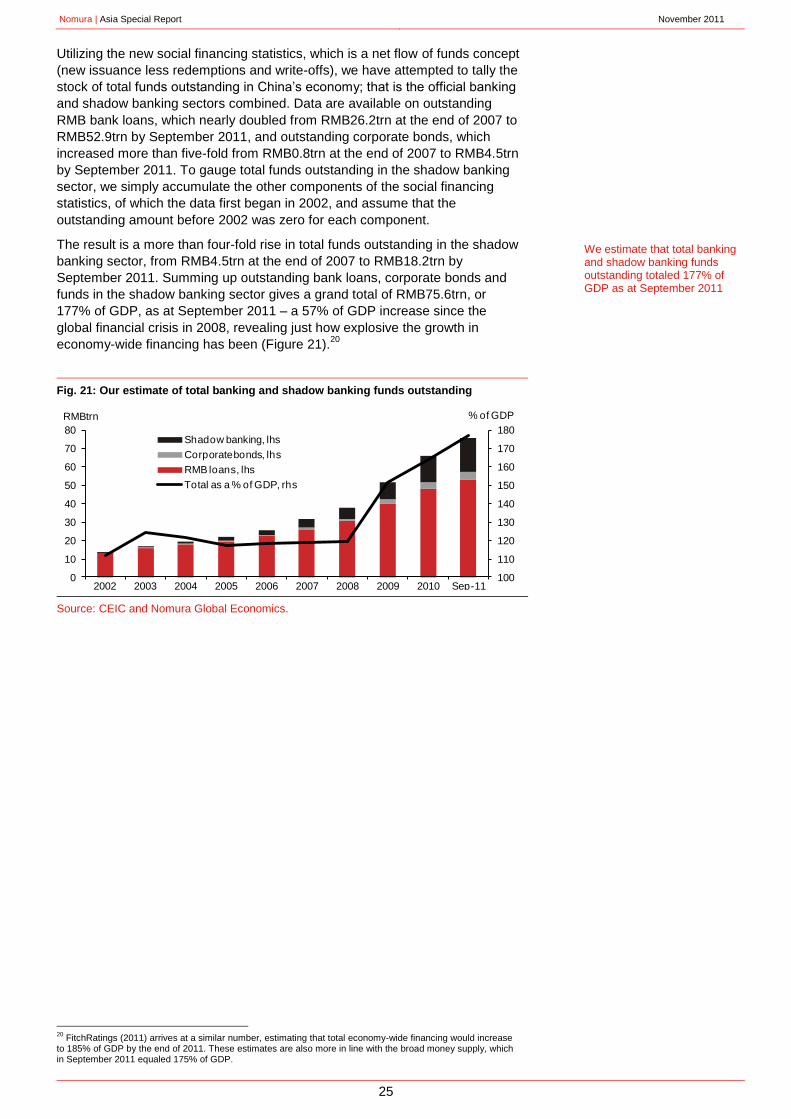
Nomura | Asia Special Report November 2011
25
Utilizing the new social financing statistics, which is a net flow of funds concept
(new issuance less redemptions and write-offs), we have attempted to tally the
stock of total funds outstanding in China‟s economy; that is the official banking
and shadow banking sectors combined. Data are available on outstanding
RMB bank loans, which nearly doubled from RMB26.2trn at the end of 2007 to
RMB52.9trn by September 2011, and outstanding corporate bonds, which
increased more than five-fold from RMB0.8trn at the end of 2007 to RMB4.5trn
by September 2011. To gauge total funds outstanding in the shadow banking
sector, we simply accumulate the other components of the social financing
statistics, of which the data first began in 2002, and assume that the
outstanding amount before 2002 was zero for each component.
The result is a more than four-fold rise in total funds outstanding in the shadow
banking sector, from RMB4.5trn at the end of 2007 to RMB18.2trn by
September 2011. Summing up outstanding bank loans, corporate bonds and
funds in the shadow banking sector gives a grand total of RMB75.6trn, or
177% of GDP, as at September 2011 – a 57% of GDP increase since the
global financial crisis in 2008, revealing just how explosive the growth in
economy-wide financing has been (Figure 21).20
Fig. 21: Our estimate of total banking and shadow banking funds outstanding
Source: CEIC and Nomura Global Economics.
Fig. 9
20
FitchRatings (2011) arrives at a similar number, estimating that total economy-wide financing would increase to 185% of GDP by the end of 2011. These estimates are also more in line with the broad money supply, which in September 2011 equaled 175% of GDP.
100
110
120
130
140
150
160
170
180
0
10
20
30
40
50
60
70
80
2002 2003 2004 2005 2006 2007 2008 2009 2010 Sep-11
Shadow banking, lhs
Corporate bonds, lhs
RMB loans, lhs
Total as a % of GDP, rhs
RMBtrn % of GDP
We estimate that total banking and shadow banking funds outstanding totaled 177% of GDP as at September 2011

Nomura | Asia Special Report November 2011
26
Box 4: Shadow banking in the US and China compared
To the best of our knowledge, McCulley (2007) coined the term “shadow banking system”. To quote Pozar, Adian,
Ashcraft and Boesky (2010, pp,13-14) “the shadow banking system decomposes the simple process of deposit-
funded, hold-to-maturity lending conducted by banks into a more complex, wholesale-funded securitization-based
lending process that is performed by a variety of non-bank financial intermediaries, or shadow banks. Shadow
banking transforms risky, long-term loans into seemingly credit-free, short-term, money-like instruments through a
granular set of steps (Figure 22), which in the US includes loan origination, loan warehousing, ABS issuance, ABS
warehousing, ABS CDO issuance, ABS intermediation and wholesale funding”. On the eve of the global financial
crisis, the volume of credit intermediated in the US by the shadow banking system was nearly USD20trn, nearly
twice as large as the USD11trn of credit intermediated by the traditional banking system. Even today, the US
shadow banking system is about the same size as the traditional banking system.
In China, non-bank financial intermediation occurs through credit-related trust products, wealth management-
related trust products, lease financing and credit guarantees. But the biggest form of shadow banking is in
entrusted loans, in which a bank acts as an agent on a third-party loan between a depositor and a borrower, and
books a fee.
Figure. 22: Illustrative examples in the US of the steps, entities and funding techniques involved in shadow credit intermediation
Function Shadow banks Shadow banks' funding*
Step (1) Loan origination Finance companies CP, MTNs, bonds
Step (2) Loan warehousing Single and multi-seller conduits ABCP
Step (3) ABS issuance SPVs, structured by broker-dealers ABS
Step (4) ABS warehousing Hybrid, TRS/repo conduits, broker-dealers' trading books
ABCP, repo
Step (5) ABS CDO issuance SPVs, structured by broker-dealers ABS CDOs, CDO-squareds
Step (6) ABS intermediation LPFCs, SIVs, securities arbitrage conduits, credit hedge funds
ABCP, MTN, repo
Step (7) Wholesale funding 2(a)-7 MMMFs, enhanced cash funds, securities lenders, etc.
$1 NAV shares (shadow bank "deposits")
Source: “Shadow banking”, Federal Reserve Bank of New York Staff Report No. 458, July 2010.
Fig. 10
The growth of shadow banking presents new challenges for China‟s
policymakers. One is that the bank RRR, loan quotas and other quantitative-
based monetary policy instruments aimed at the official banking sector are
becoming less effective as they target what is a shrinking share of the overall
financial system. Another is that, almost by definition, the different types of off-
bank balance sheet or non-bank financial activities are less regulated,
heightening the risk of too much credit being generated and of credit being
misallocated.
Adding to these challenges is the opaqueness of the data, suggesting that
China‟s shadow banking sector could be a lot larger than the official social
financing statistic suggests. FitchRatings argues that the official social
financing statistic fails to fully capture some RMB3.5trn of shadow banking
activity, including letters of credit from domestic trust companies, lending by
domestic non-bank financial institutions and financial claims on mainland
entities by Hong Kong-based banks.21
The latter has mushroomed in recent
years as Chinese companies and banks seek cheaper funding overseas. We
estimate that Mainland China-related exposure of Hong Kong financial
institutions has nearly tripled from HKD1.1trn in 1Q 2009 to HKD3.7trn in Q2
2011, equivalent to 27.2% of the total assets of Hong Kong banks (Figure
23).22
21
A micro example of the flourishing "underground market" for loanable funds can be gleaned from the advertisements on the back pages of city newspapers, often listing only a single mobile phone number next to names such as "Easy Heaven Investments" and "Treasure Beautiful Gold Credit", Financial Times, 10 October 2011. 22
To put this surge in Hong Kong bank mainland-related claims into perspective, from 1Q 2009 to 2Q 2011, domestic property-related lending by Hong Kong banks rose by HKD410bn to HKD1.7trn, or 13% of the total assets of Hong Kong banks.
The growth of shadow banking presents new challenges for China‟s policymakers
Adding to these challenges is the opaqueness of the data

Nomura | Asia Special Report November 2011
27
Fig. 23: Hong Kong financial institutions’ exposure to the mainland
Source: HKMA and Nomura Global Economics.
Fig. 11
0
5
10
15
20
25
30
-
500
1,000
1,500
2,000
2,500
3,000
3,500
4,000
Mar-07 Sep-07 Mar-08 Sep-08 Mar-09 Sep-09 Mar-10 Sep-10 Mar-11
HK financial institutions' external claims on banks in the mainland (LHS)
Hong Kong financial institutions' mainland-related non-bank exposure (LHS)
Hong Kong financial institutions' mainland-related exposure as a % of total assets (RHS)
HK$bn %

Nomura | Asia Special Report November 2011
28
3. The privileged state-owned enterprises
At their peak in 1978, state-owned enterprises (SOEs) produced 78% of total
industrial output and employed 60% of the non-farm workforce. While the
authorities closed thousands of SOEs in the late 1990s, thousands remain,
including many of China‟s largest companies with oligopoly power in many
important sectors. By 2009, despite accounting for only 4.7% of the total
number of firms, SOEs employed 21% of the total non-farm workforce,
produced 27% of gross output in the industrial sector and controlled an eye-
popping 44% of the stock of fixed assets, highlighting their capital intensity
(Figure 24). The massive fiscal stimulus following the global financial crisis
seems to have benefited SOEs more than non-SOEs, given that most large
construction and transportation companies – and the steel and cement
companies supplying them – are SOEs.
Fig. 24: The SOE share of total urban employment and stock of fixed assets
Source: CEIC and Nomura Global Economics.
Fig. 12
The performance of China‟s SOEs is puzzling in two respects. One is that
labour productivity, or output per worker, in the SOE sector has been much
stronger than in the private sector, whereas in most other countries it is the
opposite. In 1999 to 2007, labour productivity averaged 5.6% per year in the
SOE sector, versus 3.6% per year in the private sector (OECD, 2005, p.110).
However, the SOE sector‟s high labour productivity is misleading, as it is
driven by: 1) large declines in employment and 2) massive capital
accumulation (Figure 25).
By contrast, growth in total factor productivity (TFP) – measuring output gains
over and above increases in inputs of labour and capital – has been relatively
weak in China‟s SOE sector, at less than two-thirds of that in the private sector
(OECD, 2005, p.111). TFP is driven by innovation by new technologies and
managerial skill and is a better gauge than labour productivity of real efficiency
gains.
0
10
20
30
40
50
60
70
80
90
1950 1960 1970 1980 1990 2000 2010
Share of total urban employment
Share of total stock of assets of industrial enterprises
% share
The massive fiscal stimulus following the global financial crisis seems to have benefited SOEs more than non-SOEs
The SOE sector‟s growth in total factor productivity has been relatively weak
The SOE sector‟s high labour productivity is misleading, as it is driven by: 1) large declines in employment and 2) massive capital accumulation

Nomura | Asia Special Report November 2011
29
Fig. 25: Industrial structure of SOEs and private firms – a comparison
1998 2003 2007
Employment Average number of employees
Public sector 662.1 716.8 887.9
Non-state sector 250.0 229.0 200.0
Capacity intensity 000 yuan per employee
Public sector 82.2 193.5 364.0
Non-state sector 51.6 68.1 97.7
Inventory % of annual sales
Public sector 27.2 16.2 12.6
Non-state sector 19.7 13.5 11.0
Long-term liabilities % of total assets
Public sector 22.2 19.1 17.1
Non-state sector 11.3 8.0 6.9
Exports % of total exports by sector
Public sector 25.7 13.7 9.8
Non-state sector 74.3 86.3 90.2
Subsidies % of value added
Public sector 2.1 1.5 0.8
Non-state sector 0.6 0.9 0.7
Source: Product Market Regulation and Competition in China” - OECD Economics Department Working Papers No. 823, 2010
Fig. 13
A related puzzle is that, despite relatively low TFP, the SOE sector as a whole
has remained profitable, with high retained earnings to plough back into new
investments. This is because after almost 30 years of economic reforms, while
nearly all product markets have been liberalized, the factor markets remain
heavily distorted through a raft of generous government subsidies to SOEs
(see Box 5: Investment is high, but savings are even higher). Subsidies
include low effective tax rates; under-pricing key inputs, such as energy, water,
land, and capital; keeping the RMB undervalued;23
allowing low or no dividend
payouts; charging little or no royalties on resource extraction; barriers to entry
in some industries; and only lightly enforcing environmental protection,
workers rights and work place safety (e.g., coal mines).24
One study estimates that these factor market distortions could be costing the
economy almost 10% of GDP in terms of lost efficiency (Huang 2010). Another
study of a sample of over 3,000 firms shows empirically that private firms,
where managers have complete de facto autonomy in corporate decisions
from the state, do indeed have better operating efficiency under various
metrics (Gan et al, 2008). In contrast, despite preferential treatment, many of
the smaller SOEs still make losses or barely break even – in 2007, one in five
SOEs earned a negative return (Conway, Herd, Chaalaux, 2010, p.19).
Government support for the massive yet inefficient use of capital by SOEs is
likely contributing to wasteful investment of scarce resources and
environmental degradation, and goes completely against efforts to rebalance
GDP growth from investment to consumption (see chapter: The setting in of
growing pains).
23
The latest estimates of the IMF‟s Consultative Group on Exchange Rates indicate that the RMB is undervalued by 3-23%, IMF (2011a, p.18). 24
In China, all land belongs to the state and local governments who have the discretion to sell industrial land use rights to companies for up to 50 years. In many cases the industrial land is provided cheaply or even free to companies in order to attract investment. The price of water in China is about one-third of the global average, while the cost of electricity is also relatively low (IMF 2011a, p. 20).
Despite relatively low total factor productivity, SOEs as a whole have remained profitable due to a raft of generous government subsidies
Government support for the capital-intensive goes completely against efforts to rebalance GDP growth from investment to consumption

Nomura | Asia Special Report November 2011
30
Box 5: Investment is high, but savings are even higher
China‟s gross domestic investment rose from an already high 35.3% of GDP in 2000 to 48.6% in 2010, but gross
domestic savings rose even more, from 37% of GDP to 53.9% over the same period.25
China‟s saving rate is the
highest in the world, and on IMF estimates, gross savings can be roughly decomposed into three sectors: that done
by households (23% of GDP), by corporates (21%) and by government (10%). Household savings have been high
for decades, the causes of which are relatively well known: a high precautionary motive to save because of
inadequate social welfare, including healthcare, pensions, unemployment benefits and education; a low return on
bank deposits and the lack of diversification opportunities for financial assets.
On the other hand, saving in the corporate sector, which reflects retained earnings and hence corporate
profitability, has increased markedly in the past decade, to almost the same level as household savings. The rise in
corporate saving reflects oligopoly or monopoly power in some industries and government intervention to artificially
repress the prices of labour, land, capital, resources and environmental protection. A low dividend policy also
explains a high level of retained earnings.
Government saving has also been rising and is high by global standards, reflecting robust fiscal revenues and land
sales. Given that the current account surplus is, by a GDP accounting identity, the excess of gross domestic saving
over investment, from the above analysis it follows that China needs to reduce corporate and household savings to
narrow its current account surplus (5.2% of GDP in 2010). RMB appreciation is just one of many reforms available
to achieve this.
China‟s potential output growth looks set to slow this decade, because of a
shrinking labour force and limited room to increase an already very high
contribution of capital (see chapter: The setting in of growing pains). To ensure
that the slowdown in potential growth is gradual, China needs to focus more
on TFP improvements by reducing SOE subsidies and creating a more
competitive business landscape, particularly given that the low-hanging fruit of
productivity gains from surplus rural labour migrating to the cities is set to
diminish (see chapter: The Lewis turning point). However, after the 2008
global financial crisis, the authorities did the reverse, resorting to even greater
interventionist policies to quickly revive the economy by instigating a massive
credit-fueled investment boom. These interventionist policies were to the
advantage of the less efficient, capital intensive, SOE-related sectors, and so
have exacerbated China‟s structural industry problems.
A more enduring challenge to reforming China‟s industry structure relates to
an asymmetric information problem in the banking sector, which is being
exacerbated by the recent tightening of monetary policy. Unlike past monetary
policy tightening cycles, this one differs for China‟s banks in two respects: 1)
the bank RRR is at a record high 21.5% and the interest rate margin squeeze
is more severe, indicating a larger-than-usual impact on the banks; but 2)
commercial bank lending rates, which started being gradually deregulated in
2004, are no longer subject to a ceiling.26
The second point is important
because it provides a valve to ease the financial repression facing banks by
allowing them to price credit risk more actively, charging higher lending rates
for riskier customers. And for the first time they are starting to do so: in June
2011, a record-high 61.2% of new loans were priced above benchmark lending
rates. However, the problem is that China‟s banks are pricing credit in an
increasingly distortionary way, creating a loan market that is segmented
between SOEs and non-SOEs.
China‟s four largest banks, which are still majority state-owned, maintain a
strong bias to lend to SOEs, largely irrespective of credit risk (Yeung 2009,
Podpiera 2006). Rightly or wrongly, the SOEs are still perceived by the banks
to have implicit government backing. So, it has been the mostly private SMEs
that have borne the brunt of the credit tightening – and even more so than in
25
From the accounting identity, gross domestic savings is equal to gross domestic investment plus the current account balance. Hence China‟s savings are higher than investment because of a current account surplus of 5.2% of GDP in 2010. 26
Until 2004, interest rates set by commercial banks were not permitted to be more than 10% above the benchmark lending rate, but the band has been progressively widened and commercial bank lending rates are now only subject only to a floor, while deposit rates are subject to a ceiling.
China‟s potential output growth looks set to slow this decade, increasing the urgency to boost total factor productivity
China‟s four largest banks, which are still majority state-owned, maintain a strong bias to lend to SOEs, largely irrespective of credit risk
A more enduring challenge to reforming China‟s industry structure relates to an asymmetric information problem in the banking sector

Nomura | Asia Special Report November 2011
31
the past as banks are more actively starting to price credit risk. Yet at the
grassroots level, China‟s bank loan officers still lack the skill and experience to
properly assess credit risk – a task compounded by opaque company
reporting data.27
This is creating a serious asymmetric information problem for
China‟s lenders who are under increasing pressure not to make bad loans. As
a result, creditworthy SMEs are being charged too high borrowing rates in
relation to what they perceive to be their credit risk, thereby encouraging them
to opt out of the loanable funds market and hence lowering the overall credit
standard of the non-SOE loan market. This can have a snowballing effect.
Nobel Prize laureate George Akerlof‟s famous “market for lemons” effect is
starting to appear in China‟s non-SOE loans market (see Box 6: The Akerlof
market for lemons problem applied to China).
Box 6: The Akerlof market for lemons problem applied to China
George Akerlof won the Nobel Prize in economics in 2001 for his work showing how markets can break down in the
presence of asymmetric (or unequal) information. The example Akerlof used was of the used car market, where
sellers have better knowledge of whether their car is a good or a bad one (a “lemon”). This kind of asymmetric
information also exists in China‟s bank loan market. Many of China‟s bank loan officers do not have the expertise
or information to properly price risk. The best guess of the car buyer (the China bank) is that the car (the loan) is of
average quality, and so he/she will only be willing to pay the price (charge an interest rate) of a car (loan) of
average quality. This means, however, that owners of good cars (borrowers of high credit standard) will not place
their cars (seek loans) in the used car market (in the banking sector). But that in turn lowers the average quality of
cars (loans) in the market (banking sector), causing buyers (China banks) to revise downward their expectations of
quality. Now even owners of moderately good cars (borrowers of good credit standard) are unable to sell (borrow)
at a fair price, causing, in the worst case, the market to seize up.
Meanwhile, a growing number of SMEs with very low credit standards have
been denied bank credit altogether, and not being able to access the debt or
equity markets, this leaves them no choice than to turn to the less regulated
shadow banking sector, where the asymmetric information problem is even
more lopsided. A growing number of SMEs have to rely on non-formal
financing sources, such pawn loans, micro credit companies and even loan
sharks, which bear much higher funding costs. According to the PBC, the
average informal lending rate in the city of Wenzhou – the country's SME hub
– rose to 25.4% pa in September 2011 from 13.0% pa in December 2009
(Figure 26), while local media report that the uncollateralized black market
lending rate is as high as 10% per month, up from 5% per month last year.28
27
Perhaps the most publicized Chinese company accounting fraud case this year was Sino-Forest, which listed on the Toronto stock exchange in 1994, overstating its forestry holdings in Yunnan province by some USD900m. But this is one example of more than two dozen listed Chinese companies that have shown accounting discrepancies or seen their auditors resign so far this year, according to an article by David Pilling in the Financial Times, 1 September 2011. 28
According to the PBC's Wenzhou branch office, underground banking in the city is estimated to have reached RMB110bn by June 2011, equivalent to 18% of formal bank loans outstanding, see http://zj.people.com.cn/GB/15228039.html.
A growing number of SMEs have been denied bank credit altogether and have to turn to the less regulated shadow banking sector

Nomura | Asia Special Report November 2011
32
Fig. 26: Informal lending rate in Wenzhou vs. official benchmark lending rate
Source: CEIC; www.wenzhou.gov.cn; Nomura Global Economics estimates.
Fig. 14
The segmentation of China‟s credit market, through priority lending to large
SOEs at the expense of SMEs, poses serious risks to the economy. For not
only are the SMEs, on average, more productive than SOEs, they are also in
many ways the life and blood of the economy: in 2009, China‟s 431,000 SMEs
generated two-thirds of total industrial output, paid two-thirds of tax revenues
and employed over three-quarters of the workforce (Figure 27). In recent
months, the government has urged banks to relax credit standards to SMEs
but the quid pro quo could be higher bank NPLs.29
Fig. 27: Gauging the importance of SMEs to the economy, 2009
Number of Enterprises
Gross industrial
output value
Total Assets
Revenue Total
profits Employment
unit current prices RMB bn RMB bn RMB bn „00 persons
Total 43,4364 54,831 49,369 54,252 3,454 8,831
Large enterprises 3,259 17,581 19,312 18,070 1,090 2,044
Medium enterprises
38,036 15,937 15,796 15,505 1,137 2,788
Small enterprises 393,074 21,313 14,261 20,677 1,228 4,000
SME 431,110 37,250 30,057 36,182 2,365 6,788
% of total: SME 99 68 61 67 69 77
*Note: SMEs are classified on the official definition which is based on employment, revenue and total capital size, which varies by industry. For example, SMEs by employment size are defined as <2,000 persons for industry, <3,000 for construction, < 200 for wholesale, <500 for retail sales, <3,000 for transportation, <1,000 for postal service and <800 for accommodation and catering. Source: China Statistical Yearbook 2010.
Fig. 15
29
In late September 2011, the city government of Wenzhou set a ceiling on the interest rate of loans made by non-bank financial institutions at 4x the benchmark lending rate (6.56%), while for banks the ceiling for the interest rate on loans to SMEs was set at 1.3x the benchmark lending rate. More significantly, the State Council on 12 October 2011 ruled that nationwide bank loan growth to small enterprises should not be lower than overall loan growth; bank loans of RMB5m or less to small enterprises can be treated as retail loans in determining credit risk weights and can be excluded from the banks aggregate loan-to-deposit calculation.
0
5
10
15
20
25
30
Sep-07 Sep-08 Sep-09 Sep-10 Sep-11
Wenzhou informal lending rate
Benchmark official bank lending rate
% p.a.
The segmentation of China‟s credit market, through priority lending to large SOEs at the expense of SMEs, poses serious risks to the economy

Nomura | Asia Special Report November 2011
33
4. Unintended consequences of financial liberalization
Based on international experience, the conventional view (see Johnson, 1998)
is that financial liberalization serves to enhance competition, increase the
efficiency of capital allocation and support long-term growth, but the
sequencing and initial conditions are important: if it happens too fast and
without a strong banking system and efficient accounting, regulatory,
supervisory and corporate governance frameworks, it can cause financial and
economic crises. China will go through a series of financial sector reforms in
the next five years. One advantage is that China can learn from the
experiences of financial crises in other emerging markets and, indeed, this has
likely contributed to its gradualist approach to financial liberalization so far. On
the other hand, pressures are building for China to accelerate financial
liberalization, as it is linked with other reforms, despite structural problems and
challenges in the domestic economy.
China's 12th Five-Year Plan, unveiled in March 2011, listed capital account
liberalization, renminbi internationalization and interest rate deregulation as
policy priorities. While these reforms are interrelated and indeed necessary for
China to make its financial system more efficient and its monetary policy more
effective, they do entail macro risks given the unbalanced domestic economy,
with excessive investment and credit, including the flourishing shadow banking
sector.
In recent years, China has made progress on capital account liberalization,
particularly in relation to the internationalization of the renminbi. This, in some
ways, is a natural development given the sheer size of China‟s economy and
the exponential rise in its international trade (China‟s combined exports and
imports totaled USD3.3trn in 2010, 6x larger than in 2000). Indeed, with a
more open and rapidly growing economy, together with the, albeit gradual,
move to a more flexible exchange rate, it has become a challenge to restrict
non-FDI, or so-called “hot money” capital inflows.30
In 2009-10, simply by
subtracting the current account surplus and net FDI inflows from the balance
of payments surplus, we estimate that other forms of net capital inflows totaled
USD108bn. These loopholes are not easy to control as the “desirable” flows
are mingled with the “undesirable” flows, and it may be difficult to distinguish
the two. Meanwhile, perhaps motivated by recently becoming the world's
second-largest economy, or perhaps over concerns of its exposure to foreign
financial assets (China‟s FX reserves totaled USD3.2trn in September 2011),
China seems to have made a clear policy shift to accelerate the use of the
renminbi in international trade and finance (see Box 7: A chronology of China‟s
capital account liberalization).
30
For instance, firms can move capital to China by overstating export receipts and/or understating import expenses. Expectations of CNY/USD appreciation can also fuel speculative hot-money capital inflows.
Zhiwei Zhang
+852 2536 7433
Chi Sun
+852 2536 7705
Pressures are building for China to accelerate financial liberalization
China seems to have made a clear policy shift to accelerate the use of the renminbi in international trade and finance

Nomura | Asia Special Report November 2011
34
Box 7: A chronology of China’s capital account liberalization
Date announced Liberalization measure
1980 Liberalized FDI in four Special Economic Zones
1996 Current account transactions were liberalized
1999 FDI liberalization extended to all provinces, but subject to limits varying by sector
2001 Under WTO commitment, the services sector is opened up to FDI, including the financial sector
2002 Opening the domestic capital market for selected Qualified Foreign Institutional Investors (QFII)
2004 The approval requirement for firms' overseas investment was repealed
2004 Allowing Hong Kong residents to open RMB deposit accounts at Hong Kong banks
2005 RMB de-pegged from USD; daily trading range of CNY/USD is set at 0.3%
2006 Opening investment abroad for selected Qualified Domestic Institutional Investors (QDII)
2007 CNY/USD daily trading range expanded to 0.5%
2007 Domestic financial institutions allowed to issue RMB-denominated bonds in Hong Kong subject to
approval
2008 Domestic commercial banks allowed to provide loans to firms for use in cross-border M&A
2009 Local firms allowed to register the source of their foreign exchange financing after their investment overseas rather than requiring approval in advance
2009 Introduced RMB as a cross-border trade settlement currency, but restricted to trade between five Chinese cities (Shanghai, Shenzhen, Guangzhou, Dongguan and Zhuhai) and Hong Kong, Macau and ASEAN countries (open to all Chinese importers but only a small number of exporting firms)
2010 RMB as cross-border trade settlement currency program was expanded to include trade transactions between Chinese firms in 20 provinces and cities and the rest of the world. The number of Chinese exporting firms who may participate in the program was also expanded
2010 Foreign companies were authorized to issue RMB-denominated bonds in Hong Kong
2010 Renminbi transactions in Hong Kong were further relaxed to allow: 1) renminbi lending for any purpose; 2) renminbi remittance to mainland by companies subject to approval by China's government
2010 Hong Kong banks involved in renminbi cross-border trade settlement allowed to access the on-shore interbank bond market
2010 Allowed export companies to keep their export revenues overseas (introduced to export companies in Beijing, Guangdong, Shenzhen, Shandong, Jiangsu first in October 2010 and expanded nationwide on 1 January 2011)
2011 US companies and residents can trade renminbi in US branches of Bank of China. Individual accounts can convert US$4000 a day into renminbi (annual quota is US$10,000)
2011 Introduced pilot scheme on allowing qualified foreign institutions to make private equity investment in China
2011* To launch Renminbi QFII, which would allow foreign investors to invest in mainland securities with an initial quota size of RMB20bn
To expand the renminbi trade settlement scheme nationwide
To allow Hong Kong firms to invest directly into mainland China using renminbi
To expand Treasury bond sales in Hong Kong
To launch an ETF linked to Hong Kong stocks in mainland China
2011 Allowed Hong Kong listed companies to raise renminbi through share placements or rights issues. Investment banks are also allowed to issue RMB-denominated derivative warrants based on renminbi shares
Note: * These planned measures were announced by Vice Premier Li Keqiang during a special visit to Hong Kong on 17 August 2011, but have yet to be fully implemented.
Source: Nomura Global Economics.

Nomura | Asia Special Report November 2011
35
Over the past year, the offshore use of the renminbi has grown tremendously.
Renminbi trade settlement has surged from almost zero in 2009 to 10% of
China‟s total trade in June 2011 (Figure 28), while trade settled in renminbi
through banks in Hong Kong has increased 35x from RMB27bn (USD4bn) in
H1 2010 to RMB953bn (USD146bn) in H1 2011, comprising one-third of total
trade between Hong Kong and China (including offshore trade). At the same
time, renminbi deposits in Hong Kong have grown exponentially from
RMB103.7bn (USD15bn) in July 2010 to RMB609bn (USD95bn) in August
2011, equivalent to 6.8% of total deposits in Hong Kong (Figure 29).
Fig. 28: RMB usage for trade settlement
Source: CEIC and Nomura Global Economics.
Fig. 16
Fig. 29: RMB deposits in Hong Kong
Source: CEIC and Nomura Global Economics.
Fig. 17
However, the range and accessibility of renminbi financial instruments outside
China is still small relative to the volume of renminbi that is building up
offshore, leaving much of the renminbi being deposited at the Hong Kong
clearing bank earning a low return. As a result, internationalization of the
renminbi is adding pressure for China to accelerate capital account
liberalization. China‟s government has allowed about RMB50bn (USD7bn) in
Hong Kong to be invested in China‟s interbank bond markets, a similar amount
to return as inward FDI and plans are underway to launch an RMB-based QFII
(Qualified Foreign Institutional Investors) scheme of RMB20bn (USD3bn) to
invest in China‟s capital markets (IMF, 2011a, p.14). However, if the renminbi
is to become truly an international currency, China‟s capital controls will have
to be eliminated so that foreign investors can freely invest in RMB-
denominated assets and easily repatriate their capital and income.
Yet even following the best practice of carefully sequencing capital account
liberalization31
, the lessons from other emerging markets, including those in
Asia in the late 1990s, is that foreign capital can come pouring in, whether it be
foreign portfolio investment or China's banks and companies stepping up
borrowing from overseas. Without a strong regulatory infrastructure and
appropriate safeguards, capital can be misallocated, fueling rapid credit growth,
asset price bubbles and an overheated economy. The economic boom can
then turn to bust, through diminished competitiveness, a worsening current
account, rising NPLs and a loss of investor confidence triggering capital flight.
With a war chest of FX reserves and a large current account surplus, China is
not, in our opinion, vulnerable to a balance of payments crisis, but that does
not rule out the possibility of large net capital outflows and a drawdown in FX
reserves – particularly given that China's M2 money supply has swelled to
175% of GDP as of September 2011. Indeed, a freer capital account amid
severe financial repression can increase the incentive for China's savers to
flee negative real bank deposit rates in favour of higher returns abroad.
31
Although certain rules about sequencing capital account liberalization – for example, countries should liberalize long-term flows before short-term flows, and foreign direct investment before portfolio investment – have the appeal of simplicity, the fungibility of capital makes their practical application difficult.
0
2
4
6
8
10
12
Mar-10 Jun-10 Sep-10 Dec-10 Mar-11 Jun-11
% of China's total trade
0
200
400
600
800
0
1
2
3
4
5
6
7
Aug-04 Aug-05 Aug-06 Aug-07 Aug-08 Aug-09 Aug-10 Aug-11
Total amount of RMB deposits in
Hong Kong, rhs
RMB deposits as a % share of total
Hong Kong deposits, lhs
RMB bn%
Internationalization of the renminbi is adding pressure for China to accelerate capital account liberalization
Based on international experience, if capital account liberalization happens too fast, without appropriate safeguards, it can cause financial crises
Renminbi deposits in Hong Kong have grown exponentially from USD15bn in July 2010 to USD95bn in August 2011

Nomura | Asia Special Report November 2011
36
Faster capital account liberalization can also speed up domestic financial
deregulation. With freer capital movement it will become more difficult for the
PBC to both manage the exchange rate and have autonomy over monetary
policy. With the exceptions of small and very open economies, like Singapore
and Hong Kong, the conventional macro policy approach under a freer capital
account is to gradually relinquish control over the exchange rate and focus
instead on setting domestic interest rates. Indeed, quantitative-based
monetary policy instruments, such as credit quotas, are easier to circumvent
under a freer capital account (for example, by companies increasing borrowing
from overseas), undermining their effectiveness.
However, if the primary instrument of monetary policy is to be the policy
interest rate, to be effective in influencing the price of money and credit it
becomes necessary to deregulate bank deposit and lending rates.32
China still
imposes a floor on bank commercial lending rates (0.9x the benchmark 1yr
lending rate) and a ceiling on bank deposit rates. While deregulating these
interest rates should increase the efficacy of monetary policy, it is not without
risks. Without strong regulatory and supervisory frameworks, interest rate
deregulation can pressure banks to engage in overly aggressive competition to
attract customers and maintain market share.33
By raising deposit rates and
cutting lending rates it can shrink the profit margins of banks; worse still, it
could also encourage them to start taking on riskier loans to compensate for
the drop in profits. The overall loan quality in the banking system would decline,
heightening the risk of a financial crisis.
Another risk related to financial liberalization can stem from developing the
local private debt markets. Until 2004, China‟s private debt market was small
and heavily regulated, but since then regulations have been relaxed and debt
issuance by non-finance firms more than tripled to RMB1.5trn (USD226bn) in
2010 (Figure 30).
There are a number of advantages in deepening the debt market in tandem
with capital account liberalization and interest rate deregulation. Deeper debt
markets can: 1) help absorb larger capital inflows; 2) develop a yield curve and
increase the potency of monetary policy; and 3) diversify credit risks away
from the banks. However, developing the private bond market can increase
competition between banks, as large companies choose to increase borrowing
directly from investors by issuing debt. Without adequate supervision, losing
market share of high-grade corporate customers to the bond market could
pressure banks to lower their credit standards to attract new customers. This
happened in Japan in the 1980s and contributed to its unprecedented asset
price bubble (see Box 8: Risks associated with financial liberalization: lessons
from Japan).
32
In China's current credit tightening cycle there has been a surge in mainland institutions borrowing from Hong Kong banks and debt issuance in Hong Kong's bond market. 33
Rather than interest rate deregulation, the risk could stem from other forms of financial deregulation, such as relaxing controls on the issuance of new lending products which can be counterproductive when complimentary factors – such as commercially orientated loan officers and consumer familiarity with the risks of new financial products – are lacking. For example, domestic financial liberalization in Korea resulted in a crisis in 2003 when credit card debt as a share of GDP more than tripled between 1999 and 2002, and the average number of credit cards for every adult in the country rose from one to three.
Faster capital account liberalization can also speed up domestic financial deregulation
Losing market share to the bond market could pressure banks to take on riskier loans to attract new customers
Another risk related to financial liberalization can stem from developing the local private debt markets
Interest rate deregulation can pressure banks to engage in aggressive competition, leading to a drop in credit standards

Nomura | Asia Special Report November 2011
37
Fig. 30: Bond issuance by Chinese firms
Note: Commercial paper issuance was allowed from May 2005 for maturities of 1yr and below. Issuance of so-called medium-term notes was allowed from April 2008. Source: China Government Securities Depository Trust & Clearing Co. Ltd.
Fig. 18
0
200
400
600
800
1,000
1,200
1,400
1,600
1,800
2004 2005 2006 2007 2008 2009 2010 Jan-Sep 2011
RMB bn
Middle-term notes Asset-backed securities
Commercial paper Corporate bonds
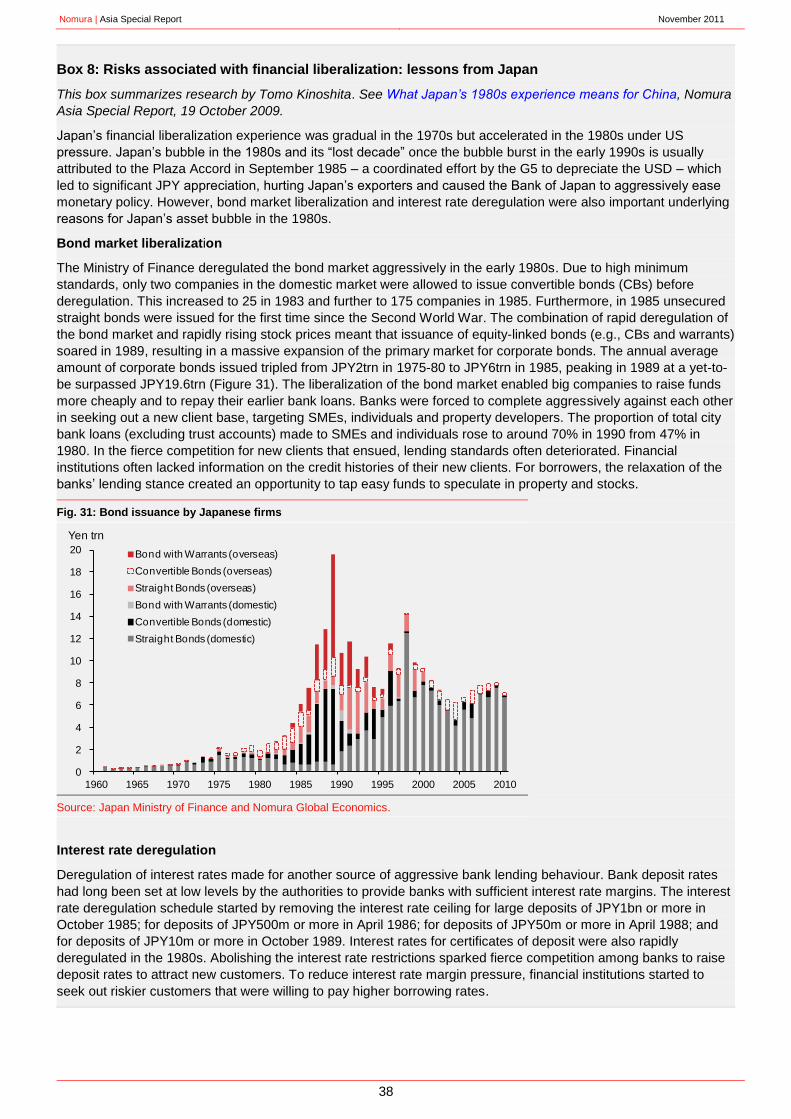
Nomura | Asia Special Report November 2011
38
Box 8: Risks associated with financial liberalization: lessons from Japan
This box summarizes research by Tomo Kinoshita. See What Japan‟s 1980s experience means for China, Nomura
Asia Special Report, 19 October 2009.
Japan‟s financial liberalization experience was gradual in the 1970s but accelerated in the 1980s under US
pressure. Japan‟s bubble in the 1980s and its “lost decade” once the bubble burst in the early 1990s is usually
attributed to the Plaza Accord in September 1985 – a coordinated effort by the G5 to depreciate the USD – which
led to significant JPY appreciation, hurting Japan‟s exporters and caused the Bank of Japan to aggressively ease
monetary policy. However, bond market liberalization and interest rate deregulation were also important underlying
reasons for Japan‟s asset bubble in the 1980s.
Bond market liberalization
The Ministry of Finance deregulated the bond market aggressively in the early 1980s. Due to high minimum
standards, only two companies in the domestic market were allowed to issue convertible bonds (CBs) before
deregulation. This increased to 25 in 1983 and further to 175 companies in 1985. Furthermore, in 1985 unsecured
straight bonds were issued for the first time since the Second World War. The combination of rapid deregulation of
the bond market and rapidly rising stock prices meant that issuance of equity-linked bonds (e.g., CBs and warrants)
soared in 1989, resulting in a massive expansion of the primary market for corporate bonds. The annual average
amount of corporate bonds issued tripled from JPY2trn in 1975-80 to JPY6trn in 1985, peaking in 1989 at a yet-to-
be surpassed JPY19.6trn (Figure 31). The liberalization of the bond market enabled big companies to raise funds
more cheaply and to repay their earlier bank loans. Banks were forced to complete aggressively against each other
in seeking out a new client base, targeting SMEs, individuals and property developers. The proportion of total city
bank loans (excluding trust accounts) made to SMEs and individuals rose to around 70% in 1990 from 47% in
1980. In the fierce competition for new clients that ensued, lending standards often deteriorated. Financial
institutions often lacked information on the credit histories of their new clients. For borrowers, the relaxation of the
banks‟ lending stance created an opportunity to tap easy funds to speculate in property and stocks.
Fig. 31: Bond issuance by Japanese firms
Source: Japan Ministry of Finance and Nomura Global Economics.
Interest rate deregulation
Deregulation of interest rates made for another source of aggressive bank lending behaviour. Bank deposit rates
had long been set at low levels by the authorities to provide banks with sufficient interest rate margins. The interest
rate deregulation schedule started by removing the interest rate ceiling for large deposits of JPY1bn or more in
October 1985; for deposits of JPY500m or more in April 1986; for deposits of JPY50m or more in April 1988; and
for deposits of JPY10m or more in October 1989. Interest rates for certificates of deposit were also rapidly
deregulated in the 1980s. Abolishing the interest rate restrictions sparked fierce competition among banks to raise
deposit rates to attract new customers. To reduce interest rate margin pressure, financial institutions started to
seek out riskier customers that were willing to pay higher borrowing rates.
0
2
4
6
8
10
12
14
16
18
20
1960 1965 1970 1975 1980 1985 1990 1995 2000 2005 2010
Bond with Warrants (overseas)
Convertible Bonds (overseas)
Straight Bonds (overseas)
Bond with Warrants (domestic)
Convertible Bonds (domestic)
Straight Bonds (domestic)
Yen trn

Nomura | Asia Special Report November 2011
39
5. The Lewis turning point
Over the past decade, China‟s urban population has increased by about 20m
per year while its rural population has fallen by 13m per year, largely through
migration. The seemingly endless supply of cheap rural labour migrating to the
cities has helped contain average wages. However, Nobel Prize-winning
economist Arthur Lewis (1915-91) observed that in developing economies a
point is reached when the supply of surplus rural labour starts to diminish,
strengthening the wage bargaining power of industrial workers. This has
become known as the Lewis turning point (LTP) and in a stylized chart can be
thought of as a “kink” in the labour supply curve when wages can take-off
(Figure 32). In the early stage of economic development, the manufacturing
labour supply curve can be elastic, that is flat – increased labour demand does
not affect the wage level – but as the economy develops there will be a point
when the manufacturing labour supply curve will kink because of a diminishing
supply of surplus rural labour.
Fig. 32: A stylized diagram of the Lewis turning point
Source: Nomura and inspired by Stephen Jen at SLJ Macro Partners
Fig. 19
Surveying the recent literature, empirical studies have reached no firm
conclusions on whether China is at the LTP.34
Taking a different approach, we
find an interesting pattern in countries that have already passed the LTP. In
Japan it was in 1965 when employment in the secondary sector
(manufacturing and construction) overtook that in the primary sector (mostly
agriculture) that real manufacturing wages started to surge (Figure 33). A
strikingly similar phenomenon happened in Korea in 1987. In China,
employment is still largest in the primary sector, but on current trends it will be
overtaken by employment in the secondary sector in 2015.
34
Knight, Deng and Li (2011), Zhang, Yang and Wang (2010) and Cai and Wang (2008) conclude that China is at, or near, the LTP. On the other hand, work by Minami and Ma (2010), Du and Wang (2010), Wang (2010) and Garnaut (2010) conclude that the LTP has yet to be reached.
Labour pool
Wages
D1
D2
Laboursupply
LewisPoint
The Lewis turning point is when the supply of surplus rural labour starts to diminish, raising the wage bargaining power of industrial workers
Empirical studies have reached no firm conclusions on whether or not China is at the LTP

Nomura | Asia Special Report November 2011
40
Fig. 33: Primary, secondary and tertiary employment and real wage growth
Japan South Korea China
Source: Japan‟s Ministry of Internal Affairs and Communications and Ministry of Health and Labour; CEIC and Nomura Global Economics.
Fig. 20
At first glance it would appear that China is near, but not yet at, the LTP, and it
is true that lower-end manufacturing is moving inland to areas where labour is
more plentiful and cheaper. However, we believe that most of the recent
empirical studies have ignored three critical factors that, taken together,
suggest to us that the LTP is upon China.
The first is demographics (see chapter: The setting in of growing pains). Based
on projections by the United Nations, China‟s 15-24 year-old age cohort will
fall from 16.8% of the total population in 2010 to 14.6% in 2015 and 12.8% in
2020, resulting in there being fewer young, productive workers willing to leave
the countryside to work in factories. In contrast, the 15-24 age cohort was
20.3% in Japan in 1965 and 21.1% in Korea in 1985.
Second, the focus should be on total labour benefits, not just wages. China‟s
wages are growing strongly: in 2010, the average wage grew by 13.3% and
the average minimum wage jumped 22.9% and by a similar magnitude in 2011,
but other components of labour compensation have surged even more. As in
Japan in the early 1970s, there are signs that China‟s workers are becoming
increasing aware of their “fair share” of entitlements – from social welfare
benefits to better working conditions – as evidenced by the surge in the
number of labour disputes.35
It is intriguing that there was a structural break in
China‟s labour disputes in 2008, and the same pattern happened in Japan in
the early 1970s, coinciding with the wage surge there (Figure 34).36
35
According to research by Huang (2010), if companies strictly follow policies on social welfare contributions, commonly the payrolls of migrant workers would have to rise by at least 35-40%, including contributions to pensions (20% of payroll), medical insurance (6%), employment benefit (2%), work injury insurance (1%), maternity benefit (0.8%) and housing entitlements (5-10%). 36
In the early 1970s Japan experienced an outbreak of inflation, in part driven by the 1973-74 oil crisis, but also the flow of surplus rural labour moving to the cities started to diminish in the 1960s, leading to increased worker bargaining power, as evidenced by the surge in labour disputes, not only for higher wages but also better working conditions – the so-called Lewis turning point (Minami, 1973).
-10
-5
0
5
10
15
20
0
10
20
30
40
50
60
1954 1968 1982 1996 2010
Employment, Mn % y-o-y
-20
-15
-10
-5
0
5
10
15
20
25
0
2
4
6
8
10
12
14
16
18
20
1978 1986 1994 2002 2010
Employment, Mn % y-o-y
-20
-15
-10
-5
0
5
10
15
20
25
0
50
100
150
200
250
300
350
400
450
1953 1969 1985 2001 2017
Employment, Mn % y-o-y
F
-10
-5
0
5
10
15
20
0
10
20
30
40
50
60
1954 1962 1970 1978 1986 1994 2002 2010
Real wage growth, rhs Primary, lhs Secondary, lhs Tertiary, lhs
Employment, Mn % y-o-y
We believe that most studies have ignored three factors that, taken together, suggest to us that the LTP is upon China
The second is to focus on total labour benefits, not just wages
The first is demographics

Nomura | Asia Special Report November 2011
41
Fig. 34: Number of labour disputes – Japan versus China
Source: Bank of Japan; China‟s Ministry of Human Resources and Social Security and Nomura Global Economics.
Fig. 21
This may have been triggered in part by China‟s new labour laws in 2008 and
the exponential increase in user-penetration of the internet and mobile phones.
The new labour laws have empowered low-paid workers by making it
mandatory to have written labour contracts, enforcing the payment of overtime,
paying salaries on time, and being enrolled in a social security program. It is
also now easier for workers to file complaints against employers in the
arbitration tribunals or courts. If we aggregate data measuring compensation
of labour in China‟s 31 provinces, which is based on the income measure of
GDP, it shows that this broader measure of firms‟ labour costs grew much
faster than average national wages in 2008-09, although both series returned
to a similar rate of still-fast growth of around 16-17% last year (Figure 35).
Fig. 35: Growth in wages versus total labour compensation
Source: CEIC and Nomura Global Economics.
Fig. 22
The third reason is the rising opportunity costs of migrating from the
agricultural sector, if food prices keep rising, lifting incomes in the countryside.
Food prices have soared in recent years and we expect them to continue to
climb, underpinned by burgeoning demand from the world‟s rapidly developing
– and most populated – economies. In these economies, diets are changing
towards a higher calorie intake, while agricultural supply faces many
constraints and uncertainties, such as greater use of biofuels, global warming
and increasing water scarcity (see Special Report, The coming surge in food
prices, Nomura Global Economics, 8 September 2010).
The rigid hukou household registration system, by making it extremely difficult
for rural migrants to obtain a permanent urban resident permit and thereby
gain the same access to the deepening social welfare systems as locals, could
also become a growing constraint on urbanization, as costs in the cities rise.
-6
-3
0
3
6
9
12
0
2
4
6
8
10
12
1960 1970 1980 1990 2000 2010
No. of labour disputes in Japan in thousands, lhsNo. of labour disputes in China in 100 thousands, lhsJapan's real wage growth, rhs
Number % y-o-y
0
5
10
15
20
25
30
35
1994 1996 1998 2000 2002 2004 2006 2008 2010
Wages
Total labour compensation
% y-o-y
This may have been triggered in part by China‟s new labour laws in 2008
The third reason is the rising opportunity costs of migrating from the agricultural sector

Nomura | Asia Special Report November 2011
42
A surge in wages is no doubt positive for household consumption and helps
facilitate internal rebalancing, but if it happens too fast, particularly if
productivity growth fades, then it can eat into profit margins, erode export
competitiveness and, if passed on to consumers, trigger a serious outbreak of
inflation. Indeed, because of the LTP, but also due to the need to deregulate
the government's underpricing of key natural resources and a likely multi-year
surge in food prices, our base case is that CPI inflation will average around 5%
from 2011 to 2015, compared to 2% over the past decade, see Asia Special
Report, China: The case for structurally higher inflation. 21 September 2011.

Nomura | Asia Special Report November 2011
43
6. The setting in of growing pains
China is starting to face growing pains from worsening demographics and
increasing strains on natural resources and the environment. This will almost
certainly cause the economy's potential growth to slow over the course of this
decade, and inflation to be structurally higher. The combination of slower trend
growth but higher structural inflation creates a more challenging environment
to implement much-needed reforms. For example, it will likely become
politically more difficult to remove the myriad government subsidies to the
relatively less efficient, capital intensive SOE-related sectors. Yet failing to
reform the SOE sector will make it tougher to increase the efficient usage of
natural resources, reduce environmental degradation and rebalance GDP
growth away from investment towards consumption. This combination can also
make it more challenging to address China's high income inequality, while the
experience of other emerging economies is that slower trend growth can
cause problems festering below the surface – such as hidden bad debts – to
bubble up to the surface.
Demographic challenges
China is in the midst of a huge demographic shift. A rapidly ageing population,
a shrinking labour force and a sex ratio heavily skewed toward males are
creating new challenges (Figure 36). The one-child family policy37
was
introduced in 1978 and has brought the fertility rate down to about 1.6.
Because of low fertility and rising life expectancy, the UN projects the share of
people aged over 60 in the total population to rise from 12.3% in 2010 to
15.1% in 2015 and to 17.4% in 2020, increasing the number of 60+ year-olds
over this period by 76m. Meanwhile, the share of 15-24 year-olds in the total
population is projected to fall from 16.8% in 2010 to 14.6% in 2015 and to
12.8% in 2020, decreasing the number of 15-24 year-olds over this period by
47m. China‟s age pyramid is projected by the UN to change shape
dramatically in the next two decades (Figures 37 and 38), while the World
Bank (2011a) expects total employment to start to shrink from around 2015.
Fig. 36: Key demographics indicators and projections for China, by the United Nations
2000 2005 2010 2015 2020 2025 2030
Population, millions 1269 1308 1341 1370 1388 1395 1393
Working age population, millions 857 923 971 996 989 981 960
Median age, years 29.7 32.2 34.5 36.2 38.1 40.1 42.5
Young population aged 15-24, % total 15.5 17.0 16.8 14.6 12.8 11.7 11.4
Elderly population aged 60+, % total 10.2 10.9 12.3 15.1 17.4 20.2 24.4
Old age dependency ratio - aged 65+, % 15-64 10.4 10.7 11.3 13.0 16.8 19.9 23.9
Child dependency ratio - aged 0-14, % 15-64 37.7 31.0 26.9 24.5 23.5 22.3 21.2
Total dependency ratio - aged 0-14 and 65+, % 15-65 48.1 41.7 38.2 37.5 40.3 42.2 45.1
Fertility rate, child births per woman 1.80 1.70 1.64 1.56 1.51 1.53 1.58
Net reproduction rate, No. of daughters per woman 0.78 0.73 0.71 0.69 0.68 0.69 0.72
Population sex ratio, males per 100 females 107.5 107.8 108.0 108.0 107.8 107.5 107.1
Sex ratio at birth, No. of male births per one female 1.18 1.21 1.20 1.18 1.16 1.15 1.14
Source: United Nations and Nomura Global Economics.
Fig. 23
37
China‟s one-child policy officially restricts married, urban couples to having only one child, although it allows exemptions in several cases, including for rural couples, ethnic minorities and parents without any siblings themselves.
Alastair Newton
+44 20 710 23940
China is facing growing pains from worsening demographics and increasing strains on natural resources and the environment
China faces a rapidly ageing population, a shrinking labour force and a sex ratio heavily skewed toward males

Nomura | Asia Special Report November 2011
44
Fig. 37: Age pyramid, 2010
Source: United Nations and Nomura Global Economics
Fig. 24
Fig. 38: Age pyramid, 2030
Source: United Nations and Nomura Global Economics 7, 2011
Fig. 25
China‟s rapidly ageing population will increase the strain on the country‟s
relatively undeveloped health and pension systems, and could increase
tensions in society (see section in this chapter: Rising inequality and an
aspiring middle class). Young urban couples, many of them without siblings,
will find themselves with four parents to look after and will themselves have
only one child (known in China as the 4-2-1 phenomenon). Perhaps the more
alarming concern for population sustainability is the large imbalance between
baby girls and boys. Women are bearing only 0.71 girls over their lifetime, well
below the replacement figure of just over unity. In 2010, there were 51m more
men than woman in the country. The sex ratio among newborns is 120 boys
for every 100 girls, the highest in the world (Figure 39). At this rate, there will
not be enough brides for as many as one-fifth of today‟s baby boys when they
get to marrying age, heightening the risk of social tensions.
Fig. 39: Country rankings of sex ratio at birth
Source: United Nations and Nomura Global Economics.
Fig. 26
As a result of China‟s ageing population, potential output growth looks set to
slow, possibly quite sharply in the next 5-10 years. The contribution of labour
to China‟s potential output growth is estimated by the World Bank to have
declined from an average of 3.3pp in 1978-94 to 1.0pp in 1995-2009, and is
projected to decline further to -0.5pp in 2016-20 (Figure 40). In the past two
decades, the decreasing contribution of labour to China‟s potential output
growth was not a major concern as it was offset by capital deepening, with
capital accumulation adding a hefty 5.8pp to potential growth in 1995-2009.
But capital deepening has lifted the investment-to-GDP ratio to an
extraordinarily high level of almost 50%, limiting the scope for further increases
in the contribution of capital to potential output growth. The implication is that
China‟s potential output growth, which has been remarkably stable in the last
three decades, could slow abruptly this decade unless total factor productivity
(TFP) can be boosted, i.e. unless China uses its labour and capital more
70 60 50 40 30 20 10 0 10 20 30 40 50 60 70
0-4
10-14
20-24
30-34
40-44
50-54
60-64
70-74
80-84
90-94
100+
Millions
Female Male
70 60 50 40 30 20 10 0 10 20 30 40 50 60 70
0-4
10-14
20-24
30-34
40-44
50-54
60-64
70-74
80-84
90-94
100+
Millions
Female Male
102
105
108
111
114
117
120
Ch
ina
Ko
rea
Ind
ia
Ho
ng K
ong
Gre
ece
Irela
nd
Sin
gapore
Austr
alia
Czech
…
Den
mark
Germ
an
y
Italy
Jap
an
Mala
ysia
Neth
erl
ands
New
Zeala
nd
Ph
ilip
pin
es
Po
lan
d
Po
rtug
al
Russia
Sp
ain
Sw
ed
en
Th
ailand
Bra
zil
Can
ad
a
Co
lom
bia
Eg
yp
t
Fin
land
Fra
nce
Icela
nd
Ind
onesia
Mexic
o
No
rway
Pakis
tan
Sw
itzerl
an
d
Turk
ey
UK
US
Vie
tnam
Arg
en
tina
Sri
Lan
ka
Saud
i A
rabia
So
uth
Afr
ica
Number of male births per 100 female births
The rapidly ageing population will increase the strain on the relatively undeveloped health and pension systems, and could increase tensions in society
The prospect of a shrinking workforce means that China‟s potential output growth is likely to slow, possibly quite sharply in the next 5-10 years

Nomura | Asia Special Report November 2011
45
efficiently. The World Bank is not optimistic, projecting China‟s potential output
growth to slow from an average of 9.6% in 1995-2009 to 8.4% in 2010-15 and
to 7.0% in 2016-20. If potential growth slows too sharply, excess demand
could fuel runaway inflation and/or swing the current account into deficit.38
Fig. 40: Estimates of potential output growth – past and future
% y-o-y 1978-94 1995-2009 2010-15 2016-20
Potential output growth 9.9 9.6 8.4 7.0
Employment growth 3.3 1.0 0.2 -0.5
Labour productivity growth 6.4 8.6 8.2 7.5
- From total factor productivity (TFP) growth 3.0 2.7 2.3 2.3
- From capital deepening 3.4 5.8 5.9 5.2
Source: Kuijs, L., “China Through 2020: A Macroeconomic Scenario”, World Bank, China Research Working Paper No. 9, June 2009.
To try to avoid a shrinking workforce, new policies could be implemented. For
example, China‟s hukou household registration system, which discriminates
against the social rights of migrant workers, could be relaxed (see Box 9:
China‟s hukou household registration system). Relaxing the hukou system,
which links most health and education benefits to the area where the person is
registered rather than living, should help ease the wide income inequalities
and encourage more labour mobility and faster urbanization. In turn, this could
boost TFP given that productivity in agriculture is about 6x less than in the rest
of the economy. Urbanization also creates larger cities, which generate
economies of scale due to specialization, information spillovers and clustering.
In the countryside, it would also facilitate the much-needed consolidation of
farmland holdings, providing economies of scale and greater scope for
modernization, hence boosting agriculture productivity.
However, the challenge is that these reforms, while helping to encourage
urbanization and labour mobility, risk generating other negative externalities.
Already, with half of the 1.3bn population living in urban areas, the strain on
the bigger cities is intensifying in terms of resource constraints, environmental
concerns and social tensions. A good example is Beijing, the capital city,
where the population has soared from 15.4mn in 2005 to 19.6mn in 2010, a
cumulative increase of 27.5%, dwarfing the 2.5% increase in the nationwide
population over this five-year period (Figure 41). No surprise the authorities in
Beijing are introducing stringent measures to limit motor vehicle ownership,
and in August 2011 shut down 23 schools for migrants across the capital.
38
As economies develop it is common for the initial high rates of TFP growth to slow, as productivity “catch up” and the flow of surplus labour from the less productive agricultural sector to the more productive manufacturing and services sectors starts to ease. More specifically for China, the recent investment boom has been led by public infrastructure projects, of which the return on capital tends to be relatively lower than private investments and can take longer to be realized. One hope to lifting China‟s TFP is from a boost in human capital. The number of university graduates rose more than 6x between 2000 and 2010 to 384mn, although a large share are struggling to find jobs.
China could relax the hukou household registration system to encourage urbanization, but at the risk of generating other negative externalities

Nomura | Asia Special Report November 2011
46
Fig. 41: Cumulative population growth, 2005-10
Source: CEIC and Nomura Global Economics.
Fig. 27
Box 9: China’s hukou household registration system
China‟s household registration system, or hukou, was introduced in the 1950s to keep as many people as possible
in farming, in order to maximize food production. It was also an element of the government‟s social control
structure, in part to control the pace of urbanization. Starting in the late 1990s, restrictions were eased to allow
migrants to register as temporary urban residents and the right of police to expel unofficial migrants was abolished
in 2003. However, the main problem remains: migrants do not have the same social rights as locals with
permanent resident permits. Many migrants are not entitled to pensions or medical care; their children cannot
attend local public schools. They cannot enjoy a housing subsidy. Overall the hukou system is still very much in
force, acting as a major constraint on migration and hence on urbanization, attributing to income inequality.
Another reform could involve relaxing the 1978 one-child policy, but it would
take decades to have an impact on employment and risks exacerbating
China‟s social, resource and environmental problems. Allowing greater
immigration or increasing the official retirement age – which is currently 60 for
men and 50 for women, and has not been changed since 1951 – would likely
have a more immediate impact on employment. However, the former would
also strain China‟s resources and environment, while the latter would not be a
politically popular move ahead of the transition to the fifth generation of
leaders in early 2013.
Rising inequality and an aspiring middle class
Events in the Middle East and North Africa (MENA) at the start of this year
triggered a good deal of thought over other countries which could be
vulnerable to similar outbreaks of civil unrest. At the forefront of the protests in
Tunisia and Egypt in particular were middle-class, relatively well educated and
often un- or under-employed urban youth. However, despite comparisons
between Tahrir Square in 2011 and Tiananmen Square in 1989, we see major
differences between the MENA and contemporary China – and little, if any,
risk of “contagion”.
In essence, rising incomes and living standards have so far satisfied the
aspirations of China‟s growing middle class without the need for political
reform. However, if the gap between rich and poor and between cities and
countryside continues to widen, the government could find itself under
increasing pressure from the less well-off to distribute wealth more evenly,
particularly as social media has become a powerful tool for the underclass to
mobilise and to share its grievances.
Rising inequality could threaten social stability
Bo Xilai, Chinese Communist Party (CCP) chief in the municipality of
Chongqing, was described by British newspaper The Independent in 2010 as
-10-505
101520253035
Sh
an
ghai
Beijin
g
Tia
njin
Guan
gdong
Zh
ejiang
Xin
jiang
Tib
et
Sh
an
xi
Nin
gxia
Jia
ngsu
Hebei
Hain
an
Fujian
Hun
an
Lia
on
ing
Qin
ghai
Sh
an
dong
Mo
ng
olia
Jia
ngxi
Yun
nan
Ch
ongqin
g
Natio
nal
Jilin
Sh
aan
xi
Heilo
ngjiang
Hubei
Hen
an
Guan
gxi
Gan
su
Sic
huan
An
hui
Guiz
ho
u
Cumulative growth, %
However, rising inequalities within China could spur increasing civil unrest…
There is little if any risk of contagion to China from the “Arab Spring”
Rising living standards have so far satisfied the aspirations of China‟s growing middle class

Nomura | Asia Special Report November 2011
47
“China‟s most charismatic politician”.39
Certainly, he has proved himself to be
adept at striking a chord with “ordinary” Chinese through a combination of his
crackdown on corruption in Chongqing since he assumed his current post in
2007 and his media-savvy skills. So, it is in our view safe to assume that with
his July 2011 public statement in support of greater social equality – “dividing
the cake up well in addition to making the cake bigger” – he was again striking
a chord with many Chinese which, while arguably populist, nevertheless has a
firm foundation in contemporary China.
Indeed, President Hu Jintao seemingly made a similar point during his joint
press conference in Washington with President Barack Obama in January
2011. Asked about human rights in China, he placed great emphasis on
economic rights, highlighting the fact that China still has over 250mn citizens
living close to the poverty line despite the tremendous strides it has made in
poverty alleviation over the past three decades or so.
The data support these concerns. Notably, in a study published in 2002 not
long before the handover of power to the current (“fourth generation”)
leadership, Newton and Subbaraman (2002) noted that China‟s “Gini
coefficient – a common measure of income inequality – rose from 28.8 in 1981
to 38.8 in 1995, and has risen further to 39.0 in 1999, close to internationally
recognised danger levels”. According to the United Nations‟ 2010 Human
Development Report, as we look forward to the handover of power to the fifth
generation leadership a year or so from now, China‟s Gini coefficient has risen
still further to 41.5 in 2005 (latest data available).40
By a widely recognised
yardstick, inequality is therefore now at a level where it may pose a significant
risk to social stability. On simpler but more timely yardsticks of income
inequality, China‟s average household income in urban areas has increased to
more than three times that in rural areas; and within urban areas, average
income of households in the top 20% income decile have risen to more than
eight times that of households in the bottom 20% income decile (Figures 42
and 43).
Fig. 42: Urban-rural household income ratio
Source: CEIC and Nomura Global Economics.
Fig. 28
Fig. 43: A gauge of urban household income inequality: the ratio of highest and lowest income deciles
Source: CEIC and Nomura Global Economics.
Fig. 29
One way of addressing this issue would be through the adoption of more
redistributive policies – which some commentators (e.g. the Economist
Intelligence Unit (EIU) in an article published on 30 September 2011) have
suggested Bo Xilai (who is experimenting with a property tax in Chongqing)
was advocating as part of what has become known as the “Chongqing model”,
marrying leftist rhetoric/policies with a strong anti-corruption drive. This
approach is widely seen as an alternative to the so-called “Guangdong model”
promoted by, among others, Wang Yang, head of the CCP in Guangdong
39
“Bo Xilai, China's most charismatic politician, makes a bid for power” by Clifford Coonan, The Independent, 8 March 2010. 40
The Gini coefficient ranges theoretically from 0, when everyone has exactly the same income, to 100 when a single individual receives all the income of a society.
1.5
2.0
2.5
3.0
3.5
1978 1982 1986 1990 1994 1998 2002 2006 2010
Ratio
2
4
6
8
10
1985 1990 1995 2000 2005 2010
Urban income ratio: top 10%/bottom 10%
Urban income ratio: top 20%/bottom 20%
Ratio
… and standard measures support the view that there may be some risk to social stability
Calls for more redistributive policies in response do not enjoy universal support

Nomura | Asia Special Report November 2011
48
province and Bo Xilai‟s predecessor in Chongqing, which adopts a more liberal
approach both politically and economically – but one which, in our view, has
the potential to generate greater public dissatisfaction.
In effect, with both Bo Xilai and Wang Yang widely seen as potential
candidates for promotion to the Politburo Standing Committee next year, these
contrasting approaches can be viewed as a de facto election issue.
Furthermore, with others, including Premier Wen Jiabao and his predecessor
Zhu Rongji (calling, respectively, for bolder political reform and faster
economic reform) recently weighing in, this appears to be an ideological
struggle which may be a key determinant in the make-up of the fifth generation
leadership and the policies it pursues.
But how extensive is social unrest in reality?
Gauging the true extent of “social unrest” in China is far from straightforward.
The international press frequently cites numbers from 80,000 upwards per
year for “mass incidents” – the majority historically revolving around
environmental issues (where the Green movement has emerged over the past
decade as the most notably organised manifestation of civil society in China).
However, the definition of “mass incident” is not clear-cut and official reporting
may not be entirely reliable; furthermore, the Ministry of Public Security has
not published data since it cited 87,000 incidents of “public order disturbances”
(a broader category than “mass incident”) in 2005.
However, as Will Freeman of GaveKal Dragonomics noted in an article
published last year:
“Anecdotal evidence over the last five years suggests a rise in „anger-venting‟ mass incidents – large-scale, often violent, riots that erupt from seemingly minor incidents and reflect general discontent rather than specific rights violations.”
41
Although we agree that there is no reason to believe that even the upper
estimates of social unrest pose an immediate threat to the CCP‟s grip on
power, we also accept that no government can be sure of its longevity in the
face of increasing unrest and a failure to address the underlying causes.
Stress in the city
According to China‟s 2010 census, around 670mn people now live in towns
and cities – almost exactly half the total population. History (including recent
events in the MENA) teaches us that it is urban, rather than rural, unrest to
which regimes are especially vulnerable. However, the continued existence of
the hukou household registration system (see Box 9: China‟s hukou household
registration system) means that in today‟s China there is a significant overlap
between “rural” and “urban” citizenship.
The hukou system officially restricts labour mobility thereby effectively
discriminating against farmers moving to work in the city. According to the
OECD (2011, pp.163-165), China‟s 2005 census estimated the total number of
rural-to-urban migrants without a local hukou at 74mn and unofficial migrants
in urban areas at 39% of the urban labour force in 2005 (Figure 44). Total
labour compensation of migrant workers without a hukou is sometimes only
half of that of urban residents, even if they perform the same job functions,
according to research by Huang Yiping (2010).
41
“The accuracy of China‟s „mass incidents‟”, Will Freeman, Financial Times, 2 March 2010.
Gauging the true extent of social unrest remains difficult…
… but we see no reason to believe that the CCP‟s grip on power is currently under threat
We believe that the hukou system helps perpetuate inequality in the cities…

Nomura | Asia Special Report November 2011
49
Fig. 44: Origin and destination of unofficial migrants
Absolute number (millions)
Coming from urban areas
Coming from rural areas
Total
Population
Living in urban areas 52.6 73.6 126.3
Living in rural areas 5.2 18.1 23.4
Total 57.9 91.8 149.6
Employment
Living in urban areas 45.2 61.7 106.9
Living in rural areas 4.9 15.0 19.9
Total 50.1 76.7 126.8
As % of population or employment living in an area
Population
Living in urban areas 13.1 22.5 9.4
Living in rural areas 2.4 3.1 0.7
Total 7.0 11.4 4.4
Employment
Living in urban areas 16.5 22.6 39.1
Living in rural areas 1.0 3.1 4.1
Total 6.6 10.1 16.7
Source: "China" - OECD Economic Surveys, Volume 2010/6, February 2010.
Fig. 30
If the status quo persists, the tensions to which these inequalities inevitably
give rise look set to deepen. According to a report published early in 2011 by
China‟s National Population and Family Planning Commission, the next
decade will see a further 100mn Chinese migrate from rural to urban areas.
Indeed, another recent report – this one by the Hong Kong-based China
Labour Bulletin – claimed that the so-called “new generation” workforce, i.e.
workers born since 1980 who account for nearly half of the total number of
internal migrants, is the driving force behind increasing labour unrest and
strikes in an at least a partly successful quest for better pay and conditions.
In response, as the EIU notes in its May 2011 “Risk Briefing” on China, the
authorities have adopted a range of policies which are broadly supportive of
workers, at least in part to try to address discontent arising from socio-
economic inequality. These include: raising the minimum wage, improving
labour regulation and permitting local unionisation and a degree of collective
bargaining. There is some recent evidence that, despite the authorities‟ efforts
to prevent a mass labour movement from developing, modern communications
are facilitating wider cooperation (e.g. the recent case of industrial action by
cab drivers which spread to a number of cities). However, the EIU continues to
place only a “moderate probability” on a labour movement emerging in the
foreseeable future which could pose a significant challenge to the government.
No taxation without representation?
On the other hand, reform of the status quo – whatever its direction – stands to
run into headwinds from constituencies which benefit from, and therefore
favour, the current system.
Notable among these is China‟s burgeoning middle class, whose aspirations to
date have been satisfied without political reform. Indeed, it has long been our
view that the implicit understanding between China‟s leaders and its citizens is
that political reform would be a nettle to be grasped by the fifth generation
leadership, but not until the second half of its expected period of office, i.e.
from 2017 onwards – provided, that is, that the latter‟s expectation of
continuing economic betterment is fulfilled.
That said, as The Economist pointed out in its June 2011 special report on
China, the introduction of new and higher taxes on the middle classes – e.g.
as part of an overall more redistributive shift – may “stir demands for a say in
how their money is spent”.
… and that persisting with it risks increased labour and wider unrest…
… despite recent measures which are supportive of workers
Any reform of the status quo is likely to run into headwinds from vested interests…

Nomura | Asia Special Report November 2011
50
“Stepping stones” prevail for now
For the time being at least, just as is the case with labour policy, we believe
that Deng Xiaoping‟s famous analogy of crossing the river one stepping stone
at a time is likely to prevail. In particular, as The Economist put it in its June
2011 special report on China: “For now the party would rather deal with angry
underdogs than with an embittered bourgeoisie”.
This may in part at least account for the recent boost in spending on internal
security which, according to the 2011 annual budget unveiled on 5 March 2011,
is now higher and growing faster than defence spending. Another reason
behind this could be China‟s demographics, discussed in the previous section.
A recent book by science journalist Mara Hvistendahl (2011) examining the
implications of the gender imbalance in China (and in India) pointed to a
possible link with the expansion over the past several years of the paramilitary
People‟s Armed Police, military service being a safety valve historically for the
pressures which surplus male populations can create. Ms Hvistendahl goes on
to suggest that such imbalances can be as destabilising as climate change,
potentially sparking crime, cross-border trafficking and even wider conflict.
Indeed, she finds statistical evidence that crime, including violent crime, is
rising already in cities in China where the gender skew is greatest.42
As the EIU‟s May 2011 “Risk Briefing” reflects, local protests over a whole
range of issues – notably inflation, pay, factory closures, environmental issues
and corruption – are set to continue. Especially with no official channels such
as elections through which citizens can register their opinions, these can and
do act as a valuable safety valve. Furthermore, as with labour disputes,
modern communications (which already facilitate the organisation of social
unrest at the local level) bring with them a greater risk of “copycat” action and
even the emergence of a regional or national protest movement of some sort.
Nevertheless, as the EIU concludes “… rapid economic growth and the lack of
a figurehead… make a national uprising unlikely for the time being”.
Less haste, more speed
All that being said, an accident (attributed by the head of the official inquiry to
an as yet unspecified “design flaw”) near the eastern city of Wenzhou on 23
July 2011 involving two high-speed trains, in which 40 people were reportedly
killed, may have significant consequences on the aspirations of the middle
classes in particular (as well as being something of a set-back to China‟s high-
speed rail (HSR) programme).
HSR is a high prestige project which has enjoyed the full backing of the top
leadership and which is supposed to showcase China‟s ability to absorb and
improve imported technologies. Compounded by what is widely perceived as
the authorities‟ clumsy handling of the aftermath of the crash, both the press
(including the state-controlled media), despite official warnings to desist from
“negative reporting”, and China‟s weibo networks (i.e. the domestic equivalent
of twitter) have repeatedly and strongly challenged official statements and
even openly criticised the government.
Some commentators have suggested that the slow official response may
reflect high-level disagreement over how to handle the matter; and even that
this could, in turn, spill over into the selection process for the fifth generation
leadership.43
If that is correct, it may, in turn, bear on the speed with which the
fifth generation feels able or obliged to initiate some sort of political reform
process.
Quite how China will evolve politically is far from clear. But what is clear is that,
compounded by growing inequalities, the status quo looks increasingly
unsustainable in the medium-term and that evolution there will have to be if
something more wrenching is to be avoided.
42
Unnatural Selection: Choosing boys over girls, and the consequences of a world full of men, Mara Hvistendahl (Oxford University Press, 2011). 43
See, for example, “Curiouser”, The Economist, 6 August 2011.
… so reform is likely to remain incremental
China‟s gender imbalance could also pose a threat to stability
Overall, however, a national uprising remains unlikely, for the time being at least
Nevertheless, political reform may come more quickly than previously expected

Nomura | Asia Special Report November 2011
51
That is not to contradict our earlier suggestion that the “Arab Spring” was
unlikely to spread to China: indeed, far from it. But the chatter on the weibo
networks does appear to have been of a very different nature to the
established patterns of social unrest. It is, therefore, not impossible that the 23
July train disaster will be looked back upon in due course as a benchmark
moment in accelerating China‟s socio-political evolution.
Resource and environmental strains
Writing during the run-up to the handover of power to the 4th generation
leadership, Newton and Subbaraman (2002) noted that energy security would
be a top foreign policy priority for China in the following decade. Underpinning
this was the recognition that China‟s quest for “comprehensive national power”
(i.e. economic, political, military, technological, scientific and cultural) demands
continued high economic growth which, in turn, requires commodity security in
general and energy security in particular. As the fifth generation prepares to
take power, commodity security will, in our view, remain a very high foreign
and domestic policy priority for the foreseeable future. Critically, there is also
the added dimension of food – and therefore water – security, very much to
the fore. Furthermore, both energy and food/water security bear strongly on
yet another dimension – that of environmental security.
Food security to the fore
Guaranteeing food security for all its citizens confronts China with two
overarching challenges. First, even though it is one of the few countries on
track to meet its Millennium Development Goal target of halving hunger by
2015, the most recent food insecurity report of the Food and Agriculture
Organisation (FAO), for the period 2005-07, noted that around 10% of China‟s
population was affected by undernourishment. Second, in contrast to the early
1980s when food production was rooted in the subsistence level, rising
incomes over the past two decades in particular have stimulated increasing
demand – initially in urban areas, but now increasingly in the countryside too –
for non-staple foods.
Furthermore, food price inflation – the original cause of the protests in
Tiananmen Square in 1989 – remains a politically sensitive issue which, in our
view, stands to influence a raft of policy areas including agriculture,
environment, exchange rate and even defence. Reflecting at least some of
these challenges and speaking at a forum on urbanisation in March 2011, the
Secretary-General of China‟s National Development and Reform Commission,
Yang Weimin, commented that: “We should not excessively turn farmland into
urban areas. Grain security should be given priority.”
Official estimates put the minimum average requirement of grain per person
per year to meet not only subsistence but also animal feed and processing
requirements at 400kg. Coupled with its target of 95% self-sufficiency, this
suggests that China will need to produce at least 580mn tons of grain pa by
2020 (from 546mn tons in 2010). However, with 8.3mn hectares of arable land
lost to urbanisation since 1999 (i.e. around 6.5% of the country‟s total), as
Yang Weimin was suggesting, achieving this goal is being jeopardised by
urbanisation. Furthermore, loss of land to urbanisation is only part of the story.
Almost 30% of China‟s total land area is desert and, despite major efforts over
many years to counter land degradation, the rate of desertification nationwide
is currently running at (an admittedly significantly slower rate than was the
case a decade ago) a 250,000 hectares pa, largely due to human activities,
notably over-grazing.44
44
Furthermore – and directly related to the issue of food security – analysis of the composition of cereal production reveals that since the 1980s growth of output of corn (at 3.5% pa) – the key crop for the biofuel industry (as well as animal feed) – has been significantly faster than is the case for wheat (2.5%) and rice (1.2%). However, this growth in corn production has been achieved not simply through improved productivity but also through the reallocation of land out of rice and wheat into corn. Based on the experience of Japan, experts such as Robert Ash (2011) believe that China could be approaching a plateau in rice productivity and that switching
Commodity security, including food and water, remains a top priority
Undernourishment and dietary shifts both contribute to increasing food demand…
… and food price inflation remains a politically sensitive issue
China risks falling short of its target of 95% food self-sufficiency

Nomura | Asia Special Report November 2011
52
Land reform – A boost to productivity but politically challenging
In its report on monetary policy in the first quarter of 2011, the People‟s Bank
of China opined that:
The agricultural sector is still a weak link in the national economy facing a lot of problems and challenges… agricultural infrastructure is relatively backward, and the land-output ratio, resource utilization ratio and labour productivity are still low… It is becoming increasingly difficult to guarantee national food security and to supply the major agricultural products.
When in October 2008, the CCP‟s Central Committee promised “a new
upsurge” in rural reform, some hoped that the party had come to see land
ownership as the key to modernizing and collectivizing agriculture. Currently,
although all land is state-/collectively-owned, there is a vibrant market in
(relatively long lease) urban land which contrasts starkly with the tepid market
in rural land, where leases are restricted to a maximum of 30 years, mortgages
are not permitted and selling land usage rights is very difficult. As The
Economist put it in an article published shortly after the Central Committee‟s
announcement:
Chinese academics have long argued that a freer and better-regulated rural property market is essential if peasants are to enjoy more of the fruits of growth. They say it would encourage the consolidation of tiny, inefficient plots of land leased to farmers by collectives and allow peasants to cash in on their land‟s market value, enabling them to use the capital to go into business in the cities. Academics also think that a proper land market would protect farmers from indiscriminate land grabs by local officials who often take collective ownership to mean
control by themselves.45
However, as The Economist reports in an article on urbanisation published in
mid-2011:
Thorough going land reform, of the sort that would… encourage larger-scale farming… remains stuck. One obstacle is ideological… many in the party still regard collectivism as a sacred principle.
46
Furthermore, as The Economist concedes, restricting the ability of farmers to
detach themselves from their land also protects a valuable social safety net.
When an estimated 20mn workers were laid off in early 2009 as a result of the
global financial crisis, many were able to return to their family farms
maintained by their relatives, thereby significantly reducing the risk of unrest
on the city streets. Thus, despite the potential boon it would offer to agricultural
productivity, we see little prospect of real progress on land reform unless, or
until, an alternative social safety net is in place.
Nature will play its part
Even so, especially given the impressive record of the Ministry of Agriculture in
both policy formulation and R&D, China could conceivably boost production
consistent with achieving 95% self-sufficiency for some years to come.
However, underlined by this year‟s severe drought in Hebei, Henan, Jiangsu
and Shandong (four provinces which accounted for almost two-thirds of total
wheat output in 2009), natural disasters continue to threaten steady progress.
Such periodic droughts compound the underlying problems caused by uneven
distribution of water supply nationwide – in very simple terms, too much in the
land from rice to corn may therefore prove to be increasingly difficult unless China is prepared to import an increasing proportion of its rice. 45
“Promises, promises: A „breakthrough‟ in land reform? Or a damp squib?” The Economist, 16 October 2008. 46
“Where do you live?”, The Economist, 23 June 2011.
Land reform could boost productivity but remains politically challenging…
…and could threaten social stability
Natural disasters, especially drought, pose a continuing threat to productivity

Nomura | Asia Special Report November 2011
53
south (which is prone to flooding, although the incidence of drought is also
increasing in some parts) and too little in the North China Plain in particular, a
major cotton and wheat producing area where both surface and ground water
is being depleted to dangerous levels. The practical implications of this can be
illustrated by the fact that China went from being a net exporter of 1.9mn tons
of wheat in 2003 to a net importer of 6.5mn tons in 2004 due to drought
(Figure 45).
Fig. 45: China’s net imports of certain commodities in volume terms
Source: CEIC and Nomura Global Economics
Balancing priorities
In 2008, China consumed 43% of the world‟s coal (meeting 70% of its energy
demands) and 10% of its oil; it remains on target to overtake the US as the
world‟s largest consumer of energy within the next few years – and is already
the world‟s largest emitter of carbon (in volume terms, but if measured per
head of population, it is far from being the largest).
Sustaining economic growth without compromising the environment requires
leapfrogging to a low-carbon urbanisation model which focuses on clean
energy supply, compact city design, enhanced public transport, green
buildings and clean vehicles. Since anecdotal evidence consistently points to
environmental issues (which include air quality, water pollution and food
standards) as the biggest single cause of civil unrest throughout the past
decade, this also matters in terms of social stability. In response, China needs
to continue to increase energy efficiency and lift the share of low-carbon
technologies.
China already has the world‟s largest installed wind energy capacity, yet how
successful China is in meeting these challenges is of tremendous importance
both domestically and globally, a fact which is fully recognised by the
leadership – notably, as long ago as 2006 President Hu Jintao proposed a
“new energy security concept” at the G8+5 summit in St Petersburg noting the
need for “sustainable development of human society”.
Evidence from China itself over the past five years underlines that this is not
merely rhetoric. Good progress has been made toward a more resource-
efficient and environmentally friendly economy, and most targets are on track.
The efficiency of water use has increased; forest cover is expanding and the
long-standing uptrend of both SO2 and CO2 emissions has finally started to
reverse. However, with rapid economic growth, immense environmental
challenges remain. According to the World Bank, China accounts for 13 of the
world‟s 20 most polluted cities (admittedly down from 19 out of 23 in 2001).
Energy efficiency (the amount of energy per unit of output) has been improving,
but not by enough to achieve the targeted 20% reduction over 2006-10.
According to a study by the World Bank (2008), if China‟s economy grows by
7.2% pa and the average energy intensity remains around current levels for
the next 25 years, as experienced by other large economies during their early
-20
-15
-10
-5
0
5
10
15
20
25
Aug-99 Aug-01 Aug-03 Aug-05 Aug-07 Aug-09 Aug-11
Crude petroleum, 10m tonsSoybean, 10m tonsCereals, m tonsCopper, m tonsCoal, 10m tons
Tons
Balancing growth and environmental security poses major challenges…
… as China‟s leaders have been quick to recognize in concrete policy measures

Nomura | Asia Special Report November 2011
54
stage of industrialisation, China‟s energy consumption would reach around
12,750 million tonnes of coal equivalent by 2030 – about 87% of the world‟s
energy demand today.47
Entering international markets
China‟s impact on “hard” commodity markets over the past decade, especially
energy, is well documented. If the 95% self-sufficiency target does indeed
prove increasingly unattainable, a similarly dramatic impact on international
trade in food – and global food prices – over the course of the next decade
cannot, in our view, be ruled out.48
In an essay published earlier this year, Robert F. Ash concluded:
The Chinese government will find it increasingly difficult to continue to
fulfil its long-held target of maintaining 95% self-sufficiency in the
provision of basic foodstuffs. As this target is abandoned, China's
engagement in international grain markets will increase. This will prove
to be a watershed for China, which has previously never wavered in its
pursuit of basic food self-sufficiency. It may also prove to be a
watershed for international food security through the impact on world
cereal prices and supplies of China's emergence as a significant
player in world cereal markets…
However, the cereal whose imports are likely to rise most sharply is
corn. It is true that since 1996 China has, remarkably, been a net
exporter of corn. But it is striking that the scale of such exports has
contracted dramatically (from 16.4 million tons to a mere 0.05 million
between 2003 and 2009). Accelerating demand for corn for both feed
and biofuel is almost certain to outstrip domestic output growth in the
coming years, thereby forcing China to resort to purchases from
overseas – especially from Latin America and the United States – as a
permanent feature of its agricultural trade.
Resource security and conflict
Throughout history, resource security has been a major source of conflict –
and it is one to which we are certainly not immune today. Peter Gleick (2008)
identified over 50 occasions since the start of the 21st century where water had
been an issue in some form of, often violent, conflict ranging from Afghanistan
to Yemen.
Without wishing to dismiss the importance of the conflict in the Darfur region of
Sudan, which has been described by UN Secretary General Ban Ki-moon as
the first climate change war of the 21st century, the impact of climate change
on already stressed and/or disputed water resources may pose even bigger
challenges for the international community as a whole in the foreseeable future.
Notably, in his recent book Water: Asia‟s New Battleground, Brahma
Chellaney (2011) notes that China and India between them account for 37% of
the world‟s population but command only 10.8% of its water resources.
Furthermore, much of India‟s water comes from the (China-controlled) Tibetan
plateau (which is, in fact, a key source for all the countries in an arc from
Afghanistan to Vietnam). Combined with the gender imbalance common to
India and China, one has to be concerned about the possibility that,
exacerbated by climate change, water could indeed be the cause of a literal
battleground between Asia‟s two emerging superpowers in the not too distant
future.
47
The World Bank (2011a) estimates that if business as usual continues with respect to China‟s economic growth and energy efficiency, then by 2030 China is expected to import 75% of its oil and half of its gas. 48
A second and related trend is China‟s purchasing and leasing of large tracts of farmland in, in particular, sub-Saharan Africa. Accurate data on the scale of such investments are hard to come by, but a 2009 study prepared on behalf of the FAO and the UN estimated that nearly 2.5mn hectares of farmland had been allocated to foreign-owned entities in the five-year period since 2004 in just five African countries which the study considered. See Land grab or development opportunity? Agricultural investment and international land deals in Africa, by Lorenzo Cotula, Sonja Vermeulen, Rebeca Leonard and James Keeley (IIED/FAO/IFAD, 2009).
A decline in self-sufficiency could have a dramatic impact on global food prices
Historically, both climate change and resource security have caused violent conflict…

Nomura | Asia Special Report November 2011
55
Not that the definition of “conflict” should be restricted to acts of violence
and/or war. Ronald Findlay and Kevin O‟Rourke (2008) in their book Power
and Plenty note a close correlation historically between the end of hegemon
and rising protectionist pressures. While the economic justification – including
any possible link to competition for resources – to rising protectionist
pressures in the US is, at best, tenuous in our view, the recent passage
through the US Senate of the Brown-Schumer bill seeking to punish China for
its alleged “currency manipulation” clearly highlights the risk that history will
repeat itself.49
49
US presidential and congressional elections on 6 November 2012, which could encourage the House of Representatives to follow through on the Senate‟s recent action to pursue punishment of China over its alleged currency manipulation – and especially if US unemployment remains sticky.
… as well as rising protectionist pressures
Nomura | Asia Special Report November 2011
56
Pricing a China hard landing – Strategy perspectives
We discuss market implications of the economic scenario laid out above from
the perspectives of:
Global macro strategy
Global equity strategy
Regional FX strategy
Regional equity strategy
Regional equity sector by sector and country by country implications, and
Regional credit strategy
The key conclusions for strategy from the economic discussion are:
The size of the growth decline – a true growth recession.
The nature of the growth slowdown – capex-led and balance-sheet
constrained.
The ineffectiveness of policy – no rapid recovery.
The persistence of some of the causes – true change may be required on
a number of fronts.
Global macro perspectives
Growth expectations: Naturally, the initial impact in terms of market pricing
will be a rapid reassessment of the growth outlook for those economies and
global sectors most linked to China's investment cycle. Sectors ranging
from aerospace through elevators via shipping would be in the front line.
Countries like Germany, Sweden and Japan, which have at the aggregate
growth level benefited the most from China's capital spending cycle, are
most at risk of a substantial fall in growth expectations. Countries like Hong
Kong, Singapore and the Netherlands would be marked down from the
impact of lower global trade volumes. Australia, Canada, the Gulf, LatAm,
parts of sub-Sahara Africa, Russia, Mongolia and others would be liable to
terms-of-trade and volume shocks as commodity markets re-think the
demand/supply picture and re-price accordingly.
Inflation expectations: While measures of economic slack would increase
as Chinese demand slows, leading to markets pricing in medium-term
disinflationary pressures, a faster impact will be felt through lower
“consumer” commodity prices – i.e., oil, and by extension food prices, and
the potential for inventory dumping into the EU and US.
Policy response – limited ammunition, but expect more central bank
balance sheet expansion.
Current account and government deficits deteriorate – implications for the
EU bailout.
Risk and uncertainty premia increase – not just business-cycle risk, but
business-model risk as investors question the post-crisis policy and supply
chain environment.
Naïve modelling suggests the following hierarchy for returns: EM equities
(in USD terms) and commodities underperform the most. G7 stocks are
half as bad, US high yield and EMBIG bond returns are similar to each
other, but are both outperformed by IG. The USD index does well (and our
C10 index correspondingly badly), and implied vol as proxied by the VIX
rises. Rates markets offer a safe haven.

Nomura | Asia Special Report November 2011
57
Global equity market perspectives
Chinese stocks have already underperformed and de-rated markedly.
Despite this, global equity markets would be at risk and we highlight
consumer goods and commodity producing sectors (in particular, mining).
While Japanese stocks are not highly correlated to developments in China,
European markets are the most sensitive of the developed regions.
Asia ex-Japan FX perspectives
In a hard landing scenario, USD/CNY change is likely to be put on hold as
Chinese policymakers seek to avoid a tightening of monetary conditions.
However, depreciation is unlikely for a number of reasons: domestic capital
flight, being perceived as „exporting‟ their domestic economic strife (China
draws great credit from the fact that CNY was stable during both Asian and
global financial crises), undermining their efforts to internationalize CNY,
and of being provocative towards the US.
If a hard landing is taken as a globally important systemic event, the most
vulnerable currencies are unlikely to be those with the greatest
fundamental linkages with China (e.g. TWD), but those with inferior balance
sheets, the worst balance of payments profiles, and the least central bank
market power, of which Singapore ranks least vulnerable and India most
vulnerable on our analysis.
Asia ex-Japan equity perspectives
The hard landing scenario would undercut earnings expectations and
dramatically up-end investor confidence across the entire Asia region.
For earnings vulnerability, operational gearing is our guide, with India,
China itself, Malaysia and Australia at the higher end and Thailand,
Philippines and Vietnam at the lower.
In terms of valuations it is worth noting that the equity risk premium for Asia
ex-Japan stocks and a high China CDS spread suggests investors are
already discounting an extraordinary degree or risk. Nevertheless,
particular markets would still be quite vulnerable. Korea, Indonesia, Hong
Kong and Australia display a high beta to China equity risk, whereas Japan
would offer a relative regional safe haven.
Sector correlations with China are higher than country correlations, with
energy, materials and industrials sectors having the most linkage.
Classically defensive sectors such as utilities, staples and telcos show the
weakest betas.
Given the particular capital spending nature of the China scenario, one
would naturally also consider capital equipment names, construction
companies, banks and property companies.
We also run through each key regional equity market and sector risks on
separate pages.
Asia ex-Japan credit perspectives
From a credit perspective, we believe the four key areas of focus would be
the impact on the sovereign and its ratings, the banks and the availability of
credit with implications for the HY property sector and industrials, and lastly
the Chinese SOE space.
We would expect a significant underperformance of the highly levered
SOEs, whose investment grade ratings have been underpinned by
government support.

Nomura | Asia Special Report November 2011
58
Chinese HY industrials would likely underperform the large cap HY
property credits, impacted by significantly weaker earnings and credit
profiles.
Expect significantly more scrutiny over the default risk of the smaller cap
property credits.
The Hong Kong banks that have extended their balance sheets to Chinese
banks and SOEs would likely be dragged to wider spread levels once again,
though we believe some of these issues could be unfairly penalized.

Nomura | Asia Special Report November 2011
59
Global macro perspectives
It might be argued that the economic and policy scenario set out above has to
some extent already been priced into markets related to Chinese growth and
balance sheet health. Naturally, some downside skew has been attached to
China-linked assets since the risks we highlight are not, individually, new.
However, we would argue that our scenario is substantially more challenging
than the one generally set out to explain recent market moves and that market
participants have not fully thought through the implications of a persistent hard
landing for non-Asian assets. Moreover, disentangling the effects of the euro
area‟s crisis from market performance is non-trivial, and in some ways
Europe‟s impasse may be masking and diverting market concerns about China.
Given the inherent uncertainty around the timing and extent of our scenario,
specific trade recommendations are not sensible at this stage. Instead we
believe it appropriate to the tackle the issue from a largely top-down
perspective, following up with specific trade ideas on a regional and asset-
class basis as the nature, timing and extent of the risk evolves. But there is
much to think about even at a high level.
The key conclusions for strategy from the economic discussion are:
The size of the growth decline – a true growth recession.
The nature of the growth slowdown – capex-led and balance-sheet
constrained.
The ineffectiveness of policy – no rapid recovery.
The persistence of some of the causes – true change may be required on a
number of fronts.
From this perspective we can bunch the issues under four different exposure
headings:
1. Growth
Naturally, the initial impact in terms of market pricing will be a rapid
reassessment of the growth outlook for those economies and global sectors
most linked to China's investment cycle. Global growth estimates would be
reduced, but we would argue the timing of this increased hard landing risk
comes at a particularly difficult time for global activity – weaker than "normal"
post-crisis domestic demand growth in the West makes for a higher-than-
normal sensitivity to global manufacturing demand. Sectors ranging from
aerospace through elevators via shipping would be in the front line. Countries
like Germany, Sweden and Japan, which have at the aggregate growth level
benefited the most from China's capital spending cycle, are most at risk of a
substantial fall in growth expectations. Countries like Hong Kong, Singapore
and the Netherlands would be marked down from the impact of lower global
trade volumes. Australia, Canada, the Gulf, LatAm, parts of sub-Sahara Africa,
Russia, Mongolia and others would be liable to terms-of-trade and volume
shocks as commodity markets re-think the demand/supply picture and re-price
accordingly. Countries with relatively small manufacturing sectors as a ratio of
GDP and employment would be affected at the aggregate headline level
commensurately less, but even they – for example the US – have seen
important improvements in growth from global infrastructure growth, in
particular from China.
After the initial impact on these countries and sectors, markets would look
immediately to the policy response globally and from China. The scenario laid
out here suggests that while there would indeed be a policy response in China
it is unlikely to have a rapid or large positive impact on growth. A more serious
impact on risk assets would occur as medium-term growth expectations are
marked down. Moreover, it is not clear what conventional demand
management policy actions major Western economies could take, since fiscal
policy would appear to be unavailable and monetary policy is now almost
Kevin Gaynor
+44 (0) 20 710 27800
Martin Whetton
+61 (2) 8062 8611
Naka Matsuzawa
+81 3 6703 3864

Nomura | Asia Special Report November 2011
60
wholly reliant on the vague benefits of QE-style balance sheet expansion.
Thus, the multiplier effects of a China hard landing could be bigger than one
may initially think for short- and medium-term Western growth forecasts.
2. Supply chains and inflation
A demand shock for China is also a supply shock for the countries it supplies.
While measures of economic slack would increase as Chinese demand slows,
leading to markets pricing in medium-term disinflationary pressures, a faster
impact would be felt through lower “consumer” commodity prices – i.e., oil, and
by extension food prices, and the potential for inventory dumping into the EU
and US. This happened during the Asian currency crisis and led to quite rapid
durable goods price declines. While this softens the growth blow for Western
consumers it is only temporary and it squeezes some corporate margins. We
would expect headline CPI inflation expectations, in any event, to fall across
developed markets initially from the fall in global traded goods and commodity
prices.
Fig. 46: OECD measures of economic slack
Source: Nomura, OECD.
What is more difficult to gauge is the medium-term impact on supply chains
from a China shock of this scale and duration. Investors would naturally fear
inventory dumping turning into competitive devaluations across the region in
an effort to take a larger share of a slower growing global demand pie. This
would no doubt increase investor concern about protectionist measures and
tariff increases.
It would be natural to expect investors to predict an initial increase in China‟s
trade surplus in this scenario, adding to global imbalances rather than helping
to close them. At the same time, we should probably expect capital outflows
from China by both domestic and foreign investors. To keep the currency peg
intact, as our scenario suggests, would require a slower pace of reserve
accumulation, although perhaps by not as much as might be priced in if the
trade balance improves. Nevertheless, reserve accumulation globally would be
expected to slow, which could prove crucial to funding of Western government
deficits in capital account deficit economies.
3. Balance sheets
Which brings us on to balance sheet considerations. Slower growth in the
OECD would naturally imply higher unemployment, slower profit growth and
lower income and consumption tax revenues The result would be forecasts of
larger government deficits at the same time as smaller trade surpluses, or
larger trade deficits. If this is a 2012 story, the timing really could not be much
worse. Countries that have already undertaken substantial fiscal tightening
would see headline deficit improvement stall or even reverse. And those taking
on responsibility for joint fiscal support in the euro area for example would see
their own fiscal accounts deteriorate, thus undermining market confidence in
their ability to support further periphery or bank sector needs.
-6
-4
-2
0
2
4
6
8
10
1Q90 1Q93 1Q96 1Q99 1Q02 1Q05 1Q08 1Q11
Unemployment Rate (%)
Output Gap (%)

Nomura | Asia Special Report November 2011
61
Of course, this increase in government bond supply expectations would apply
equally well to the US, UK, Canada, Sweden and Australia. However, the
starting points for debt are substantially different – for example, compare and
contrast Australian and Canadian government debt. One could imagine the
political complications of a widening US federal deficit during an election year,
especially if another debt ceiling increase had to be passed.
Combine this backdrop with slower reserve accumulation and one has a
perfect set of conditions to drive term risk premia higher on weaker fiscal
countries. By extension, one also sees markets price in a higher cost of capital
for weaker corporate and financial balance sheet entities. Without doubt, more
central bank activism would be priced in, leading to the belly of curves
flattening along with weaker BEIs from lower commodity prices. Wider credit
spreads in investment grade and high yield would seem probable.
Financials would remain a source of pressure in this environment. China‟s
official data for external USD borrowing has increased quite substantially since
the 2008 crisis and most of the increase is short-term debt. Part of this is in the
form of trade credits, but by no means all. Naturally, markets would consider
which entities are most exposed to China credit risk from these loans and
would price accordingly.
Fig. 47: China external debt (USDbn)
Source: Datastream, Nomura.
4. Risk and uncertainty premia
While the growth and inflationary implications of a China hard landing are
reasonably clear, the bigger uncertainties will be around future policy regime
changes and therefore supply chain risks. One might call this a distinction
between business-cycle risk and business-model risk. Clearly the global
imbalances that have grown over the past 15 years are contributing and have
contributed to domestic imbalances in the US, China and the euro area. A
China hard landing would raise legitimate questions about what sort of global
architecture for trade and currencies will hold after the event. This, we would
argue, will only add to heightened levels of macroeconomic uncertainty
already in place, with the result that high risk premia and uncertainty premia
should be attached to risky cash flows. A hard landing would only increase
those risks.
Strategic conclusions
Modeling can only get one so far in terms of predicting returns. But in
circumstances such as this it can at least give some guidance on what to focus
on. A very simple VAR (vector auto regression) model of changes in China‟s
PMI index, total returns for US Treasuries, US IG, US HY, a commodity index,
G7 and EM equities, the EMBIG index and changes in the VIX index, produces
results that fit with one‟s priors as to how changes in Chinese growth might
influence and feed back on those asset classes. The cumulative six-month
0
50
100
150
200
250
300
350
400
450
500
1Q03 1Q04 1Q05 1Q06 1Q07 1Q08 1Q09 1Q10 1Q11
External Debt - Short term
External Debt - Long and medium term

Nomura | Asia Special Report November 2011
62
change in annual returns (or changes in terms of the VIX index) is shown in
Figure 48.
Fig. 48: Six-month cumulative response to a 1sd negative shock to Chinese growth
Source: Datastream, Nomura.
Now, one should not place too much emphasis on the numerical outcomes of
this – it is an extremely naïve and simple model. However, the hierarchy
seems fairly sensible: EM equities (in USD terms) and commodities
underperform the most. G7 stocks are half as bad, US high yield and EMBIG
bond returns are similar to each other, but are both outperformed by IG. The
USD index does well, or put another way, our Nomura C10 index would be a
sell, and implied vol as proxied by the VIX rises by 10 points or so.
Interestingly, the UST index does not do very much, a result that we do not put
too much emphasis on. In any event, this provides a starting point to think
about positioning for a China hard landing, that we believe is not too
controversial.
More specifically, our global fixed income strategists provide the following
colour:
Government bond curves would flatten as forward monetary policy rate
expectations are reduced and BEI expectations fall. Weaker government
markets, however, may see higher embedded risk premia leading to
underperformance relative to the peer group. Principal safe havens are JGBs,
AUD, SEK and NOK bonds. Certainly USTs also benefit despite open issues
around future funding costs as reserve growth slows, or flow of funds change
(perhaps offset by QE3?). Bunds naturally receive a safe-haven bid, but again
open issues would be raised about fiscal union and support of peripheral
bonds.
European credit markets would experience broad-based weakness within a
more macro „risk-off‟ environment, but decent balance sheet health and low
refinancing risks generally should help credit to outperform equities in such a
scenario. That said, the effect on equity valuations could still particularly weigh
on the more levered issuers and levered products, which would see high
yield/leveraged loans underperform Investment Grade corporates and
Financials. On a more micro level, the greatest impact in terms of sectors will,
we believe, be felt in the spreads of the more cyclical corporates, especially
those directly affected such as Mining and Oil, which in turn would also impact
Shipping (a sector already under pressure). Indirect impacts would be felt by
sectors and issuers which have been offsetting the weak recovery in Europe
thus far with growth in Emerging Markets, such as Luxury Goods companies
or some of the Chemical companies for example, but the effect on spreads
could differ markedly depending on a wide range of balance sheet health
profiles – luxury goods companies, for example, tend to have relatively strong
balance sheets which would help absorb some of these pressures from a
credit perspective, whereas the credit metrics of chemical companies, say,
could be more vulnerable.
-35
-30
-25
-20
-15
-10
-5
0
5
10
15
VIX USD Index
UST Index
US IG Index
EMBIG US HY Index
MSCI G7 MSCI EM GSCI Index

Nomura | Asia Special Report November 2011
63
The impact on Japan would be felt mostly through the economic channel (a
weaker economic outlook and further monetary easing) than the financial
channel. Chinese buying of JGBs has been increasing but is still too small to
affect the JGB market directly and Japanese bank lending exposure to China
is relatively small in their balance sheets. As such, we believe any negative
effects should be felt more by the equity market. As a result, banks‟ capacity to
buy the long- and super-long end of the curve would be hampered by valuation
losses on their equity holdings, so we would expect the yield curve to bull
steepen, kinked around the 7yr sector (=JGB futures).
Australia offers a particularly popular angle to address this risk. We would
expect AUD to take the first hit and is the most obvious trade, in our opinion.
After that, confirmation of a slowdown and the follow on effects of this should
cause the curve to steepen. More generally, USD, JPY and CHF all
outperform in the initial phase of a hard landing scenario, with the Nomura C10
index suffering commensurately.

Nomura | Asia Special Report November 2011
64
Global equity perspective
Before examining a “what if” scenario for global equities in the case of a hard
landing in the Chinese economy, it is important to first recognise that the
market is already attaching a heavy discount to Chinese stocks. As Figure 49
demonstrates, Chinese stocks have underperformed the global index by 18%
since mid-April 2011, and one has to go back to 2007 to see a period of trend
outperformance.
Fig. 49: Chinese equity market relative performance*
Chinese stocks have underperformed
*Versus FTSE World Developed (US$). Source: FTSE, Nomura Strategy research
Fig. 31
This underperformance has not been matched by a similarly poor earnings
trend so that the market has been heavily de-rated to the point where the
discount now being applied to the Chinese market is the largest since late
2005.
Fig. 50: Chinese market multiple relative to global developed market multiple*
*12 month forward PE. Source: IBES, FTSE, Nomura Strategy research
Fig. 32
Compared with other emerging markets, the Chinese market is also trading on
a sizeable 28% discount, as Figure 51 demonstrates.
Fig. 51: Chinese market multiple relative to global EMs*
*12 month forward PE. Source: IBES, FTSE, Nomura Strategy research
Fig. 33
0
100
200
300
400
500
600
700
800
Oct-01 Oct-03 Oct-05 Oct-07 Oct-09 Oct-11
31 Jul 00 = 100
0.3
0.5
0.7
0.9
1.1
1.3
1.5
1.7
1.9
Oct-01 Oct-03 Oct-05 Oct-07 Oct-09 Oct-11
Ratio
0.7
0.9
1.1
1.3
1.5
1.7
1.9
Oct-01 Oct-03 Oct-05 Oct-07 Oct-09 Oct-11
Ratio
Ian Scott
+44 (0) 20 710 22959
Robertas Stancikas
+44 (0) 20 710 23127
Chinese stocks have underperformed the world index
The market trades on a 32% discount to the global market multiple…
… and an 18% discount compared with global emerging markets

Nomura | Asia Special Report November 2011
65
That said, there is little doubt that a hard landing in China would have far
reaching consequences for global equities. Firstly, there are the stocks and
sectors with direct exposure. Here we would highlight Consumer Goods,
where stocks have been re-rated relative to their historic valuation norms
partly as a result of their exposure to China and other fast growing EM
economies.
Fig. 52: Global Consumer Goods sector 12M forward PE relative to market
The global consumer
Source: IBES, FTSE, Nomura Strategy research
Fig. 34
Elsewhere, commodity producing sectors have been the beneficiaries of
strong Chinese demand. Although the valuations attached to these commodity
producers are not as demanding as the global sectors exposed to the
consumer, there is little doubt that a hard landing in the Chinese economy
would have a detrimental impact on them.
Fig. 53: Relative performance of global oil and mining sectors
Source: FTSE, Nomura Strategy research
Fig. 35
Mining stocks have the most to lose, in our opinion. Mining companies have
invested heavily in recent years to expand capacity and if demand from China
is not forthcoming, those investments are unlikely to prove profitable. That said,
recent demand trends in China remain intact (Figure 54).
Fig. 54: Chinese copper import volumes and copper price
*Imports of copper ore and concentrate. Source: Datastream, Nomura Strategy research.
0.6
0.8
1
1.2
1.4
1.6
1.8
Oct-90 Oct-93 Oct-96 Oct-99 Oct-02 Oct-05 Oct-08 Oct-11
Ratio
80
120
160
200
240
280
Oct-01 Oct-03 Oct-05 Oct-07 Oct-09 Oct-11
Oil & Gas relative performance Basic Materials relative performance
31 Dec 99 = 100
0
2000
4000
6000
8000
10000
12000
0
10
20
30
40
50
60
70
80
Oct-93 Oct-96 Oct-99 Oct-02 Oct-05 Oct-08 Oct-11
$/TonTons
Net imports in tons*(LHS) Copper price per ton (RHS)
The global consumer goods sector has been re-rated relative to historic norms, partly as a result of exposure to Chinese growth
Of the commodity producers, mining companies have shown the highest sensitivity to developments in China
Copper demand remains relatively strong

Nomura | Asia Special Report November 2011
66
In the Oil sector, demand from China remains relative inelastic to movements
in the world price, so a hard landing would likely have much less impact on the
Oil sector than the miners.
Lastly, from a regional perspective, the Japanese market has the lowest
historic correlation to Chinese equities, typically acting as something of a safe
haven. US equities are the next least likely to be impacted, with European
stocks the most highly correlated of the developed markets outside Asia to
movements in Chinese stock prices. Figure 56 shows the relative performance
of a group of European companies heavily exposed to Chinese demand. Until
recently, the poor performance of Chinese stocks had little impact on the
relative performance of these China-linked companies. However, in recent
weeks they have become more closely correlated to the news flow from China.
Fig. 56: Relative performance of European stocks exposed to Chinese demand and the relative performance of Chinese equities
Source: FTSE, Datastream, Nomura Strategy research
Fig. 36 Despite their recent underperformance, the stocks described in Figure 56 also
trade on a substantial 24% premium to the wider European market. There is
little doubt that a hard landing in China would have far reaching consequences
for stocks well beyond the country itself.
Fig. 57: PE relative for Europe’s Chinese exposed stocks*
* PE for selected European stocks with high exposure to China relative to the European market Source: IBES, FTSE, Nomura Strategy research
50
70
90
110
130
150
Oct-07 Oct-08 Oct-09 Oct-10 Oct-11Asia Exposed European Stocks performance relative to Asia
Index, Oct 2007 = 100
0.6
0.7
0.8
0.9
1
1.1
1.2
1.3
1.4
1.5
1.6
Sep-95 Sep-99 Sep-03 Sep-07 Sep-11
Ratio
While Japanese stocks are lowly correlated with developments in China, European stocks show the highest sensitivity of any developed market outside Asia
European companies with strong links to China would be especially vulnerable since they trade on a significant premium to the European market
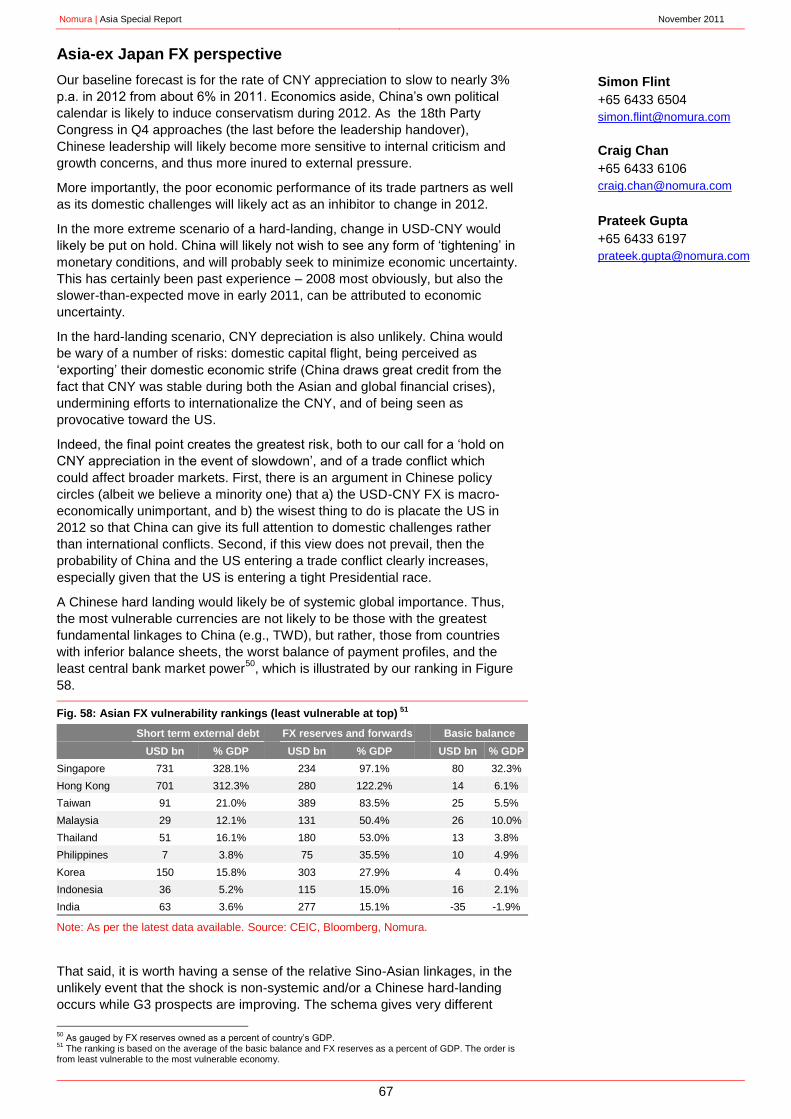
Nomura | Asia Special Report November 2011
67
Asia-ex Japan FX perspective
Our baseline forecast is for the rate of CNY appreciation to slow to nearly 3%
p.a. in 2012 from about 6% in 2011. Economics aside, China‟s own political
calendar is likely to induce conservatism during 2012. As the 18th Party
Congress in Q4 approaches (the last before the leadership handover),
Chinese leadership will likely become more sensitive to internal criticism and
growth concerns, and thus more inured to external pressure.
More importantly, the poor economic performance of its trade partners as well
as its domestic challenges will likely act as an inhibitor to change in 2012.
In the more extreme scenario of a hard-landing, change in USD-CNY would
likely be put on hold. China will likely not wish to see any form of „tightening‟ in
monetary conditions, and will probably seek to minimize economic uncertainty.
This has certainly been past experience – 2008 most obviously, but also the
slower-than-expected move in early 2011, can be attributed to economic
uncertainty.
In the hard-landing scenario, CNY depreciation is also unlikely. China would
be wary of a number of risks: domestic capital flight, being perceived as
„exporting‟ their domestic economic strife (China draws great credit from the
fact that CNY was stable during both the Asian and global financial crises),
undermining efforts to internationalize the CNY, and of being seen as
provocative toward the US.
Indeed, the final point creates the greatest risk, both to our call for a „hold on
CNY appreciation in the event of slowdown‟, and of a trade conflict which
could affect broader markets. First, there is an argument in Chinese policy
circles (albeit we believe a minority one) that a) the USD-CNY FX is macro-
economically unimportant, and b) the wisest thing to do is placate the US in
2012 so that China can give its full attention to domestic challenges rather
than international conflicts. Second, if this view does not prevail, then the
probability of China and the US entering a trade conflict clearly increases,
especially given that the US is entering a tight Presidential race.
A Chinese hard landing would likely be of systemic global importance. Thus,
the most vulnerable currencies are not likely to be those with the greatest
fundamental linkages to China (e.g., TWD), but rather, those from countries
with inferior balance sheets, the worst balance of payment profiles, and the
least central bank market power50
, which is illustrated by our ranking in Figure
58.
Fig. 58: Asian FX vulnerability rankings (least vulnerable at top) 51
Short term external debt FX reserves and forwards Basic balance
USD bn % GDP USD bn % GDP USD bn % GDP
Singapore 731 328.1% 234 97.1% 80 32.3%
Hong Kong 701 312.3% 280 122.2% 14 6.1%
Taiwan 91 21.0% 389 83.5% 25 5.5%
Malaysia 29 12.1% 131 50.4% 26 10.0%
Thailand 51 16.1% 180 53.0% 13 3.8%
Philippines 7 3.8% 75 35.5% 10 4.9%
Korea 150 15.8% 303 27.9% 4 0.4%
Indonesia 36 5.2% 115 15.0% 16 2.1%
India 63 3.6% 277 15.1% -35 -1.9%
Note: As per the latest data available. Source: CEIC, Bloomberg, Nomura.
That said, it is worth having a sense of the relative Sino-Asian linkages, in the
unlikely event that the shock is non-systemic and/or a Chinese hard-landing
occurs while G3 prospects are improving. The schema gives very different
50
As gauged by FX reserves owned as a percent of country‟s GDP. 51
The ranking is based on the average of the basic balance and FX reserves as a percent of GDP. The order is from least vulnerable to the most vulnerable economy.
Simon Flint
+65 6433 6504
Craig Chan
+65 6433 6106
Prateek Gupta
+65 6433 6197

Nomura | Asia Special Report November 2011
68
results, indicating that INR (for example) would be least effected, whilst TWD
would be most vulnerable (see Figure 59, which shows Chinese exports/GDP
for each Asian country).
Fig. 59: Asia rolling 12m exports to China / GDP
Note: As per the latest data available. Source: CEIC, Nomura.
Given a weaker-than-expected recovery and potential downside risk in
developed countries, external demand as a driver of China‟s growth now has
less of a boosting effect. Meanwhile, there are more domestic risks growing as
well, from local government debt issues to funding of micro, small and
medium-sized enterprises (MSME‟s) and the property market. China IRS
curves (deposit IRS, SHIBOR IRS and repo IRS) have all started to invert and
price in the potential for rate cuts – for example, the 5yr IRS indexed to the 1yr
deposit rate implies an average 1yr deposit rate in five years is 3.27%.
0%
5%
10%
15%
20%
TW KR MY SG TH PH ID HK IN
Latest 2004

Nomura | Asia Special Report November 2011
69
Implications for Asia regional equities Given China‘s key role as a demand driver for Asian goods and underwriter of
regional current account surpluses – and particularly given investor hopes that
Chinese private consumption will ramp-up structurally to help supplant the US
consumption growth ―lost‖ due to household balance sheet repair – we would
expect a Chinese ‗hard landing‘ scenario to undercut earnings expectations and
dramatically upend investor confidence across the entire Asia-Pacific region.
• In assessing earnings vulnerability, Operating Leverage (OL) would be a key
determinant in projecting the degree to which a collapse in top-line revenues
would transmit through to bottom-line profits. In the Figure below we rank the
Asia-Pacific markets in terms of aggregate OL:
Fig. 1: Asia-Pacific operating leverage and gearing
* Note: Operating leverage calculated as (Revenue - COGS) / (Revenue – COGS - SG&A). Aggregated for all members of the respective MSCI index ex banks/insurance/diversified financials.
Source: Bloomberg, Nomura Strategy research
図表 1
Fig. 1
• In assessing the scope for damage to valuations, it is useful to keep in mind
that ex-Japan Asian stocks are already discounting an extraordinary degree of
risk, as illustrated by the ‗equity risk premium‘ (i.e. the differential between the
consensus 12-month forward earnings yield and the available ―risk-free‖ cost
of / opportunity return on capital in the 10-year US Treasury market).
• At currently 8.0%, this compensation for equity risk-bearing is fully 2.5
standard deviations above its long-term mean of 4.3%. While this by no means
would alone insulate regional stocks from further volatility, it does suggest the
degree to which Chinese structural concerns have already embedded
themselves into asset values.
Fig. 2: MSCI Asia ex-Japan: Equity Risk Premium
Source: DataStream, Nomura Strategy research
図表 2
Fig. 2
Operating Leverage* Net Debt / Equity (%)
Asia Pacific 3.9 39.1
India 7.1 34.0
China 5.7 24.6
Malaysia 4.6 28.4
Australia 3.8 27.0
HK 3.4 18.7
Japan 3.3 54.4
Singapore 3.1 25.5
Korea 2.7 43.9
Taiwan 2.0 12.0
Indonesia 2.0 28.0
Thailand 1.9 48.6
Philippines 1.8 34.9
Vietnam 1.3 34.7
0%
1%
2%
3%
4%
5%
6%
7%
8%
9%
10%
May-0
1
Oct-
01
Mar-
02
Aug
-02
Jan
-03
Jun
-03
No
v-0
3
Ap
r-04
Sep
-04
Feb-0
5
Jul-
05
Dec-0
5
May-0
6
Oct-
06
Mar-
07
Aug
-07
Jan
-08
Jun
-08
No
v-0
8
Ap
r-09
Sep
-09
Feb-1
0
Jul-
10
Dec-1
0
May-1
1
Oct-
11
Equity Risk Prem (%) LT Avg.
+1 Std Dev. -1 Std Dev.
Research analysts:
Michael Kurtz +852 2252 2182 [email protected]
Mixo Das +852 2252 1424 [email protected]
Yiran Zhong +852 2252 1413 [email protected]

Nomura | Asia Special Report November 2011
70
Similarly, China‘s sovereign credit default swap (CDS) spread, at currently
137bp, stands fully 62bp above its 75bp January 2010-July 2011 average –
suggesting China investor perceptions have already grown substantially more
cautious.
Fig. 3: China Credit Default Spread
Source: Bloomberg, Nomura Strategy research
図表 3
Fig. 3
• Still, comparing current Asian equity index multiples to trough levels of the
past decade does suggests particular markets would still be quite vulnerable
(Figure below). Because earnings themselves become less reliable in times of
greater demand uncertainty, the results below are ranked according to the
more tangible Price-to-Book Value measure:
Fig. 4: Asia ex Japan market valuations versus historical trough
Source: DataStream, Nomura Strategy research
図表 4
Fig. 4
50
70
90
110
130
150
170
190
210
Jan-10 Apr-10 Jul-10 Oct-10 Jan-11 Apr-11 Jul-11 Oct-11
(bps)
Current % to Trough Trough
Date of
Trough Current % to Trough Trough
Date of
Trough
MSCI Asia ex-Japan 9.9 -21% 7.8 Oct-08 1.6 -25% 1.2 Sep-01
Indonesia 11.8 -69% 3.7 Apr-01 3.9 -79% 0.8 May-01
Philippines 13.4 -38% 8.4 Oct-08 2.6 -67% 0.9 Jan-03
Thailand 9.3 -40% 5.6 Oct-08 2.0 -50% 1.0 Nov-08
Taiwan 12.6 -24% 9.5 Aug-04 1.7 -37% 1.1 Jan-09
India 12.1 -32% 8.2 Oct-08 2.5 -36% 1.6 Sep-01
Korea 8.4 -29% 6.0 Mar-03 1.3 -35% 0.8 Dec-01
Malaysia 13.1 -28% 9.5 Oct-08 2.1 -34% 1.4 Jun-01
Singapore 11.5 -29% 8.2 Oct-08 1.5 -28% 1.1 Feb-09
China 7.7 -14% 6.6 Oct-08 1.5 -21% 1.2 May-03
HK 12.2 -26% 9.0 Oct-08 1.2 -21% 0.9 Feb-09
PER (since 2001) PBV (since 2001)

Nomura | Asia Special Report November 2011
71
Fig. 5: Asia ex Japan sector valuations versus historical trough
Source: DataStream, Nomura Strategy research
図表 5
Fig. 5
A look at recent years‘ statistical correlation between Asia-Pac indexes and
China H-shares also offers insight into where the risk of equity market contagion
may be greatest. In most cases these correlations also comport with our
fundamental sense as to how the real and financial effects of a China rollover
would propagate through the rest of the Asia-Pac region.
• Based on US$-denominated weekly returns since 2007, Korea and Indonesia
exhibit the Asia-Pac region‘s two highest-beta relationships with China H-
shares. This is interesting given the substantial disparity between these two
economies and markets: the former largely a high-value-added manufacturer
of capital goods and consumer durables, vs the latter predominantly a provider
to China of primary goods such as coal, natural gas, and ore. Yet in both
cases, the risks appear justified by China‘s rapidly increasing role in recent
years as a key export growth market. Indonesia‘s broader sensitivity to any
presumptive downdraft in global energy and commodity prices also places it
squarely atop the ‗endangered list‘.
Fig. 6: Asia-Pacific Country Index Correlations w/ China H-shares
Source: DataStream, Bloomberg, Nomura Strategy research
図表 6
Fig. 6
Current % to Trough Trough
Date of
Trough Current % to Trough Trough
Date of
Trough
Asia ex-Japan 9.9 -20% 7.8 Oct-08 1.6 -24% 1.2 Sep-01
Fd/Staples Rtl 16.9 -82% 3.0 Feb-01 2.9 -88% 0.4 Aug-01
Cons Svs 13.7 -25% 10.2 Oct-02 3.0 -77% 0.7 Sep-01
Health Care Equip & Serv 21.5 -64% 7.8 Jan-02 3.3 -76% 0.8 Mar-01
Auto & Compo 8.8 -43% 5.0 Mar-03 2.3 -67% 0.8 Jan-01
Software & Services 16.9 -37% 10.6 Nov-08 6.8 -63% 2.5 May-03
Div Fin 12.0 -28% 8.6 Oct-02 1.7 -61% 0.7 Sep-01
Household & Pers Prod 25.2 -52% 12.0 Apr-03 8.9 -53% 4.2 Jun-04
Pharmaceuticals 17.5 -40% 10.4 May-03 3.4 -51% 1.7 Jun-02
Cons Dur/App 9.4 -39% 5.7 Oct-01 1.3 -50% 0.6 Sep-01
Materials 7.7 -34% 5.1 Oct-08 1.4 -46% 0.8 Sep-01
Retailing 13.6 -45% 7.5 Oct-08 2.5 -46% 1.3 Jan-01
Commerical Serv & Supp 12.8 -28% 9.3 Oct-08 2.7 -46% 1.5 Aug-01
Fd/Bev/Tob 14.4 -40% 8.6 Mar-03 2.4 -42% 1.4 Apr-03
Energy 7.9 -37% 5.0 Oct-08 1.7 -37% 1.1 Jan-01
Transpt 12.3 -50% 6.2 Oct-08 1.2 -37% 0.7 Sep-01
Tech Hardware & Equip 10.8 -26% 8.0 Jul-08 1.5 -35% 1.0 Jan-09
Cap Goods 8.7 -25% 6.5 Oct-08 1.3 -35% 0.8 Oct-02
Media 15.3 -34% 10.0 Oct-08 3.3 -35% 2.2 Apr-09
Real Estate 8.9 -13% 7.7 Oct-08 0.8 -31% 0.5 May-03
Utilities 13.5 -33% 9.1 Mar-03 1.4 -29% 1.0 Nov-01
Semiconductors 11.5 -40% 7.0 Jun-04 1.8 -29% 1.3 Jan-09
Banks 7.5 -8% 6.9 Oct-11 1.4 -23% 1.0 Feb-09
Telecom 11.8 -26% 8.7 Mar-03 2.0 -12% 1.8 Feb-09
Insurance 11.9 -17% 9.8 Mar-03 1.8 -3% 1.7 Aug-01
PER (since 2001) PBV (since 2001)
R^2 Slope
MSCI Korea 0.56 0.80
MSCI Indonesia 0.52 0.74
MSCI India 0.48 0.66
MSCI Australia 0.53 0.63
MSCI Hong Kong 0.74 0.60
MSCI Singapore 0.65 0.60
MSCI Thailand 0.45 0.60
MSCI Taiwan 0.50 0.54
MSCI Philippines 0.38 0.48
MSCI New Zealand 0.37 0.42
MSCI Malaysia 0.46 0.37
MSCI Japan 0.36 0.34
vs. HSCEI

Nomura | Asia Special Report November 2011
72
• Although India offers the third-highest beta relationship with China over the
2007-11 period, this strikes us more as coincidental (based on generalized
BRICs risk tolerance/aversion) than fundamentally driven. Indeed, we would
be inclined to see India as comparatively more resilient in the Asian-regional
context to a China rollover, given still-modest trade linkages between the two
economies, and given prospective relief both on India‘s chronic current
account deficit / terms of trade, as well as on its recently problematic inflation
front if commodity prices were to recede.
• Also noteworthy as a potential comparative safe haven is Japan. Not only do
Japanese stocks exhibit the lowest-beta relationship with China H-shares
among the Asia-Pac markets, but Japan‘s domestic consumption-heavy GDP
composition may help insulate it from a Chinese demand slowdown.
Additionally – albeit tragically – the impact of 2011‘s Miyagi earthquake forced
markets already to substantially downgrade expectations for Japan.
• Among the riskiest markets in terms of historical return correlations are also
Australia and Hong Kong (i.e. the ‗pure‘ Hong Kong ex-China H-shares as found
in MSCI HK). Unlike in India‘s case, these seem explainable in terms of direct
real-economic (and in Hong Kong‘s case, also financial) linkages between those
geographies and China.
Of note, Asian equity China correlations are generally stronger at the sector
level than the country level (Figure below). Given China‘s predominant role as a
driver of global marginal demand for energy and commodities (as discussed
above in the Global context), within Asia-Pac it is the Energy, Materials and
Industrials sectors (at the GICS-1 level) that exhibit the strongest correlations
with H-shares.
• By contrast, lower-beta relationships (i.e. vs. H-share returns) are generally
found among the classically defensive sectors (e.g. Utilities, Staples, Telcos).
In other words, positive China-share performance should tend to be
associated with outperformance in ‗riskier‘ assets (as seems intuitively logical);
but a China-driven rollover could best be sidestepped within the Asian-regional
equity space through exposure in low-cyclical names (Staples, Health Care),
steady high dividend yielders (primarily among Asia‘s Telcos), and Utilities
where softer energy costs would offer the prospect of margin relief.
Fig. 7: Asia-Pacific Sector Correlations w/ China H-shares
Source: Bloomberg, Nomura Strategy research
図表 7
Fig. 7
R^2 Slope
Energy 0.79 0.83
Material 0.71 0.80
Industrial 0.75 0.79
Financials 0.82 0.72
MSCI Asia ex Japan 0.81 0.66
Consumer Disc 0.63 0.59
IT 0.48 0.54
Telco 0.70 0.51
Consumer Staples 0.62 0.48
Utilities 0.59 0.38
vs. HSCEI
Nomura | Asia Special Report November 2011
73
China equities – the risk Within China specifically, given the predominance of the investment component
of GDP, a "China slowdown" scenario would have to equate with a Chinese
investment slowdown.
• With this, the sectors most immediately adversely impacted would be those
tied to China's investment cycle: Commodities and Basic Materials (e.g.
Metals & Mining incl. Steel, Cement, etc.) as well as the Capital Equipment
names and, possibly, the Construction Companies, depending on whether
policymakers saw room to expand infrastructure project spending as a
counter-cyclical tool as they did in 2008-10 (which we see as less feasible a
second time, as discussed elsewhere).
• A dramatic slowdown in China‘s aggregate growth – alongside the credit
constraints and rising real cost of capital discussed elsewhere – would also
undermine the quality of assets in the domestic financial system. This would
hurt asset-rich balance sheets, not least in China's large, state-owned Banks;
and as such, composition of individual institutions‘ loan books and breakdown
of their lending activity would be a key differentiator. By similar token, many
Chinese property developers would find themselves under substantial financial
stress from a combination of falling property prices and slumping sales
volumes.
• The simultaneous cashflow constraints from a weaker Chinese economy along
with higher real cost of capital would make corporate balance sheets a key
differentiator generally. We would expect the market to favor lower-geared (or
net-cash) companies within any given sector, whereas higher gearing would
be discounted. Similarly, companies with imminent capital needs such as
near-term debt rollovers or refinancings would be discounted relative to those
whose funding were mostly long-term secured.
• Given that one tipping-point for a Chinese growth slowdown would presumably
be ongoing/deepening weakness in the external sector (i.e. global double-dip
risks), we would not expect export-driven China names (e.g. Shipping, Ports,
Tech, Contract Manufacturing & Logistics) to be particularly defensive. Rather,
"traditionally" defensive domestic names in Utilities (including Gas), Telecoms,
Health Care/Pharma, and Fertilizer would likely be the outperformers among
HK-listed China names.
• One area where Chinese policymakers may find some room to exercise
stimulus different than the largely infrastructure project-driven approach of
2009-10, would be domestic private consumption (for example through
targeted credit growth, taxation, wage policy, etc). As such, we are inclined to
regard domestic Consumer-sector stocks (both Discretionary and Staple) as
comparatively defensive – although already high valuations diminish these
attractions somewhat.
• One key litmus test as to the leadership's willingness to empower the domestic
private consumer may be the path of the RMB in any sustained slowdown
scenario: Were Chinese policymakers to (unexpectedly) avoid the temptation
to fall back on a stable (or weaker) RMB but rather allow appreciation to
continue, we believe it would signal a commitment to press ahead with
restructuring toward a more domestic/consumption-driven growth mix.
Taking the above considerations into effect, we present in the following two
Figures a short list of key Chinese names that we would expect to prove
respectively more vulnerable and more resilient:
Research analysts:
Michael Kurtz +852 2252 2182 [email protected]
Mixo Das +852 2252 1424 [email protected]
Yiran Zhong +852 2252 1413 [email protected] And the China Research Team
IMPORTANT: The sensitivity table below does not assess just the impact of a China hard
landing on the mentioned stocks, rather it takes a look at an extreme scenario including
recessions in the US and Europe. None of this is in our macro or industry or company
forecasts. Detailed assumptions are footnoted. See table in appendix for our current ratings.

Nomura | Asia Special Report November 2011
74
Fig. 8: MORE VULNERABLE: Chinese companies in most-impacted sectors with high gearing*
*Excludes Level I sectors: Consumer Disc. Staples, Healthcare, Utilities, Telcos; Net D/E > 50% (in most cases)
Source: Bloomberg, Nomura Strategy research
図表 8
Fig. 8
Fig. 9: MOST RESILIENT: Chinese companies in least-impacted sectors with positive net cash*
*Excludes Level I sectors: Financials, Energy, Industrial, Materials, level II sector: Tech; Net D/E < -20%
Source: Bloomberg, Nomura Strategy research
図表 9
Fig. 9
IMPORTANT: Our sensitivity analysis does not assess just the impact of a China hard landing on the mentioned stocks, rather it takes a look at an extreme scenario including recessions in the US and Europe. None of this is in our macro or industry or company
forecasts. The extreme case assumes (1) US real GDP falls 3% and euro area GDP falls 5%; (2) China‘s GDP growth falls to 5%; (3) Substantial commodity price declines by end 2012.
Base case and extreme case real GDP growth % assumptions: Australia (4.3, 0.5); China (8.6, 5.0); Hong Kong (4.5, -6.0); India (7.9, 3.0); Indonesia (7.0, 2.5); Malaysia (5.1, -5.8); New Zealand (3.5, 0.8); Philippines (5.7, 0.5); Singapore (5.3, -5.2);
South Korea (5.0, -3.0); Taiwan (5.0, -5.0); Thailand (4.7, -3.0).
TICKER Company Industry Group HK Market Cap ($mn) Sales ($mn) Net Debt / Equity
3323 HK CHINA NATIONAL BUILDING MA-H Building Materials 3,237 9,837 199
753 HK AIR CHINA LTD-H Airlines 3,610 13,376 174
1055 HK CHINA SOUTHERN AIRLINES CO-H Airlines 1,611 12,676 150
2777 HK GUANGZHOU R&F Real Estate 909 3,641 111
2600 HK ALUMINUM CORP OF CHINA LTD-H Mining 2,055 19,196 109
2883 HK CHINA OILFIELD SERVICES-H Oil&Gas Services 2,476 2,562 92
3333 HK EVERGRANDE REAL ESTATE GROUP Real Estate 5,824 8,677 88
267 HK CITIC PACIFIC LTD Iron/Steel 6,310 10,892 80
2318 HK PING AN INSURANCE GROUP CO-H Insurance 21,721 34,947 77
2007 HK COUNTRY GARDEN HOLDINGS CO Real Estate 6,144 4,480 59
1109 HK CHINA RESOURCES LAND LTD Real Estate 7,750 2,701 52
2866 HK CHINA SHIPPING CONTAINER-H Transportation 700 5,143 11
939 HK CHINA CONSTRUCTION BANK Banks 167,939 66,470 -
TICKER Company Industry Group HK Market Cap ($mn) Sales ($mn) Net Debt / Equity
1688 HK ALIBABA.COM LTD Internet 6,057 925 -169
700 HK TENCENT HOLDINGS LTD Internet 41,823 3,596 -77
168 HK TSINGTAO BREWERY CO LTD-H Beverages 3,683 3,183 -62
2238 HK GUANGZHOU AUTOMOBILE GROUP-HAuto Manufacturers 2,227 8,843 -61
2319 HK CHINA MENGNIU DAIRY CO Food 5,692 5,193 -58
489 HK DONGFENG MOTOR GRP CO LTD-H Auto Manufacturers 4,717 18,753 -55
941 HK CHINA MOBILE LTD Telecommunications 197,004 76,294 -45
1880 HK BELLE INTERNATIONAL HOLDINGS Retail 15,733 3,991 -30
151 HK WANT WANT CHINA HOLDINGS LTD Food 12,058 2,521 -24

Nomura | Asia Special Report November 2011
75
China risk: Australia
Risks to our current overall view
The sensitivity of the Australian equity market to a ―hard landing‖ in China (GDP growth
of 5% which means US GDP of -3% and Eurozone of -5%) and a substantial fall in
commodity prices would be dramatic, notwithstanding the fall in the equity market we
have already seen this year. Such a scenario, should it eventuate, could see Australian
GDP growth drop back to around 0.5%, assuming a vigorous policy response and a
coincident weakening in the A$, which there would inevitably be.
Key areas of impact if China has a hard landing
One of the hardest hit would be the metals and mining sector, which would be heavily
affected by the drop in US$ commodity prices, only partly mitigated by the likelihood of a
much weaker A$. The effect of this would also inevitably flow onto volumes as well as
demand would dry up, which would see capex programs scaled back or stopped, which
would then have a major knock effect on the mining services sector. Sector earnings of
the majors would enjoy some relative support from their low positions on the cost curve
but all the same sector growth would decline in our view at least as much as commodity
prices, with the junior and intermediate sectors in particular very hard hit. Many could
disappear. The share prices of the major miners more than halved in the 2008 global
financial crisis.
Also caught in this web would also be the mining services sector, which would hit the
likes of DOW and UGL. BLY would not escape as junior mining activity would slow and
exploration spend generally would be scaled back materially. ORI and IPL are resource
volume rather than price linked but an extended economic downturn would flow onto
volume ultimately in our view and sentiment would inevitably also take a knock.
The other key sector in the Australian market is Banks. Given its homogenous nature,
our worst case stress scenario sees the major banks with broadly similar downside risks
to FY12 earnings (22% - 28%) and share prices (29% - 35%). We assume a significant
increase in BDD‘s (175bps to NHL, consistent with the global financial crisis experience)
and no margin benefit (unlike the GFC) given a significant slowdown in China will reduce
banks‘ ability to re-price margins. In a relative sense, however, we do not expect the
banks to materially underperform the broader market under the extreme case scenario,
given their strong capital positions, robust balance sheets and strong underlying
franchises and market positions.
Relative beneficiaries of this scenario may be parts of the Consumer sector, Healthcare,
and Telstra has historically been a relative safe haven. Consumer Staples could benefit
on a relative basis from an ‗Armageddon‘ scenario impacting global growth, although we
note the absolute benefit is likely to be subdued. A lower AUD particularly against USD
could result in higher costs of goods sold which might be difficult to pass on to
consumers suffering the effects of lower GDP. On a relative basis we believe Coca-Cola
Amatil and Woolworths are likely to outperform. Treasury Wine Estates could benefit
from better transaction and translation rates, however, the absolute benefit would likely
be mitigated by lower sales. Consumer Discretionary could be adversely impacted by
slowing sales at the same time as COGS increase.
Fig. 10: Potentially most vulnerable and most resilient companies in coverage in the extreme case*
Most vulnerable companies Ticker Industry Most resilient companies Ticker Industry
Boart Longyear BLY AU Drilling equipment and services Amcor AMC AU Packaging
Bluescope Steel BSL AU Steel solutions AGL Energy AGK AU Power and gas
Onesteel OST AU Steel long products Coca-Cola Amatil CCL AU Food & beverages
Orica ORI AU Diversified chemicals Tabcorp Holdings TAH AU Gaming
Rio Tinto RIO AU Resources Telstra TLS AU Telecoms
BHP Billiton BHP AU Resources Woolworths WOW AU Retail
Note: Base case represents our current forecasts and TP
* Extreme case assumes (1) US real GDP falls 3% and euro area GDP falls 5%; (2) China‘s GDP growth falls to 5%; (3) Substantial commodity price declines by end 2012.
Base case and extreme case real GDP growth % assumptions: Australia (4.3, 0.5); China (8.6, 5.0); Hong Kong (4.5, -6.0); India (7.9, 3.0); Indonesia (7.0, 2.5); Malaysia (5.1, -5.8); New Zealand (3.5, 0.8); Philippines (5.7, 0.5); Singapore (5.3, -5.2); South Korea (5.0, -3.0); Taiwan (5.0, -5.0); Thailand (4.7, -3.0)
Source: Nomura estimates
Research analysts:
Richard Johnson +612 8062 8412 [email protected] And the Australia Research Team
IMPORTANT: The sensitivity table below does not assess just
the impact of a China hard landing on the mentioned stocks, rather it takes a look at
an extreme scenario including recessions in the US and Europe. None of this is in our
macro or industry or company forecasts. Detailed assumptions are footnoted. See table in
appendix for our current ratings.
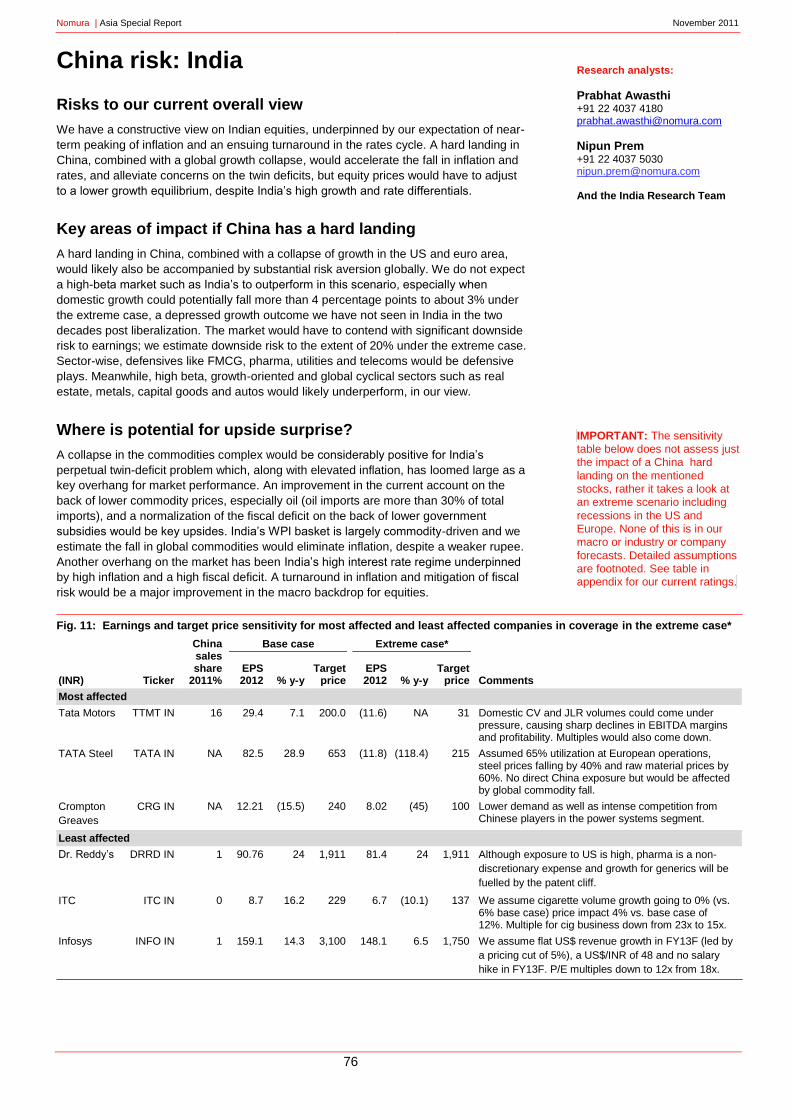
Nomura | Asia Special Report November 2011
76
China risk: India
Risks to our current overall view
We have a constructive view on Indian equities, underpinned by our expectation of near-
term peaking of inflation and an ensuing turnaround in the rates cycle. A hard landing in
China, combined with a global growth collapse, would accelerate the fall in inflation and
rates, and alleviate concerns on the twin deficits, but equity prices would have to adjust
to a lower growth equilibrium, despite India‘s high growth and rate differentials.
Key areas of impact if China has a hard landing
A hard landing in China, combined with a collapse of growth in the US and euro area,
would likely also be accompanied by substantial risk aversion globally. We do not expect
a high-beta market such as India‘s to outperform in this scenario, especially when
domestic growth could potentially fall more than 4 percentage points to about 3% under
the extreme case, a depressed growth outcome we have not seen in India in the two
decades post liberalization. The market would have to contend with significant downside
risk to earnings; we estimate downside risk to the extent of 20% under the extreme case.
Sector-wise, defensives like FMCG, pharma, utilities and telecoms would be defensive
plays. Meanwhile, high beta, growth-oriented and global cyclical sectors such as real
estate, metals, capital goods and autos would likely underperform, in our view.
Where is potential for upside surprise?
A collapse in the commodities complex would be considerably positive for India‘s
perpetual twin-deficit problem which, along with elevated inflation, has loomed large as a
key overhang for market performance. An improvement in the current account on the
back of lower commodity prices, especially oil (oil imports are more than 30% of total
imports), and a normalization of the fiscal deficit on the back of lower government
subsidies would be key upsides. India‘s WPI basket is largely commodity-driven and we
estimate the fall in global commodities would eliminate inflation, despite a weaker rupee.
Another overhang on the market has been India‘s high interest rate regime underpinned
by high inflation and a high fiscal deficit. A turnaround in inflation and mitigation of fiscal
risk would be a major improvement in the macro backdrop for equities.
Fig. 11: Earnings and target price sensitivity for most affected and least affected companies in coverage in the extreme case*
(INR) Ticker
China sales share
2011%
Base case Extreme case*
Comments EPS 2012 % y-y
Target price
EPS 2012 % y-y
Target price
Most affected
Tata Motors TTMT IN 16 29.4 7.1 200.0 (11.6) NA 31 Domestic CV and JLR volumes could come under pressure, causing sharp declines in EBITDA margins and profitability. Multiples would also come down.
TATA Steel TATA IN NA 82.5 28.9 653 (11.8) (118.4) 215 Assumed 65% utilization at European operations, steel prices falling by 40% and raw material prices by 60%. No direct China exposure but would be affected by global commodity fall.
Crompton
Greaves
CRG IN NA 12.21 (15.5) 240 8.02 (45) 100 Lower demand as well as intense competition from Chinese players in the power systems segment.
Least affected
Dr. Reddy‘s DRRD IN 1 90.76 24 1,911 81.4 24 1,911 Although exposure to US is high, pharma is a non-
discretionary expense and growth for generics will be
fuelled by the patent cliff.
ITC ITC IN 0 8.7 16.2 229 6.7 (10.1) 137 We assume cigarette volume growth going to 0% (vs. 6% base case) price impact 4% vs. base case of 12%. Multiple for cig business down from 23x to 15x.
Infosys INFO IN 1 159.1 14.3 3,100 148.1 6.5 1,750 We assume flat US$ revenue growth in FY13F (led by
a pricing cut of 5%), a US$/INR of 48 and no salary
hike in FY13F. P/E multiples down to 12x from 18x.
Note: Base case represents our current forecasts and TP
*Extreme case assumes (1) US real GDP falls 3% and euro area GDP falls 5%; (2) China‘s GDP growth falls to 5%; (3) Substantial commodity price declines by end 2012.
Base case and extreme case real GDP growth % assumptions: Australia (4.3, 0.5); China (8.6, 5.0); Hong Kong (4.5, -6.0); India (7.9, 3.0); Indonesia (7.0, 2.5); Malaysia (5.1, -5.8); New Zealand (3.5, 0.8); Philippines (5.7, 0.5); Singapore (5.3, -5.2); South Korea (5.0, -3.0); Taiwan (5.0, -5.0); Thailand (4.7, -3.0)
Source: Nomura estimates
Research analysts:
Prabhat Awasthi +91 22 4037 4180 [email protected]
Nipun Prem +91 22 4037 5030 [email protected] And the India Research Team
IMPORTANT: The sensitivity table below does not assess just the impact of a China hard
landing on the mentioned stocks, rather it takes a look at an extreme scenario including
recessions in the US and Europe. None of this is in our macro or industry or company
forecasts. Detailed assumptions are footnoted. See table in appendix for our current ratings.

Nomura | Asia Special Report November 2011
77
China risk: Indonesia
Risks to our current overall view
Despite the relatively closed economy and no sign of consumption slowdown to date, a
sharp fall in commodity prices would reduce disposable incomes in rural areas. This in
turn would hurt demand for discretionary items and lead to slower growth in
manufacturing. Under the extreme bearish scenario we would look toward staple
consumer plays such as Telkom Indonesia, Indosat, Gudang Garam, Jasa Marga, and
PGAS.
Key areas of impact if China has a hard landing
Domestic demand, especially for discretionary items such as cars, motorcycles and
clothing, would be hurt. There is also a risk of China products flooding the Indonesian
market at cheaper prices due to oversupply in China and the FTA with Indonesia.
A sharp fall in commodity prices could hit coal and plantation earnings hard.
Any disruption in funding due to a global liquidity crunch would be short term in nature.
Indonesian companies are low in leverage. The banking sector LDR is around 83%,
public debt to GDP is at 25% and banking system loans to GDP are less than 30%.
Policy response is likely to be easing through lowering interest rates (currently 6.5%
benchmark vs inflation of 4.6%), lowering reserve requirements (currently 8% and was
as low as 3% during the 2008 crisis), managed intervention in currency and bond
markets. Government can boost infrastructure spending given low fiscal deficit of 1.7%.
Expansion would slow and FDI would likely fall or be put on hold, as in 2008. Capital
formation accounts for about one-third of GDP. Credit underwriting would be tightened
and this would hurt consumption of large ticket items such as cars and motorcycles.
Where is potential for upside surprise?
Telecom sector could surprise on the upside as people travel less and communicate
more through phone or internet. Consumer companies with pricing power and high
commodity proportion in COGS would also benefit from easing cost pressure.
Fig. 12: Earnings and target price sensitivity for most affected and least affected companies in coverage in the extreme case*
(IDR) Ticker
China sales share
2011%
Base case Extreme case*
Comments EPS 2012 % y-y
Target price
EPS 2012 % y-y
Target price
Most affected
Bumi BUMI IJ 30 0.04 (USD)
154 4,750 Net loss N.A 750 High operating leverage to coal price plus geared balance sheet (280% net gearing) at high cost of funds.
Adaro
Energy
ADRO IJ 19 275 114 2,850 50 (61) 1,500 High operating leverage to coal price plus 43% net gearing.
Harum
Energy
HRUM IJ 26 924 61 11,000 350 (60) 5,000 High operating leverage to coal price. Net cash.
Astra Agro AALI IJ 0 2,013 2 28,400 425 (69) 9,000 High operating leverage to palm oil price. Net cash.
Astra
International
ASII IJ 0 4,821 16 72,000 2,500 (40) 35,000 Automotive sales could drop 30% or more if GDP growth slows to 2.5% and commodity prices collapse.
Least affected
Gudang
Garam
GGRM IJ 0 3,189 22 65,000 2,550 (2) 50,000 Demand proven to be relatively inelastic during crisis.
Telkom
Indonesia
TLKM IJ 0 629 4 8,700 598 (1) 6,000 Demand proven to be relatively inelastic during crisis.
Jasa Marga JSMR IJ 0 376 21 4,950 357 15 3,500 Demand proven to be relatively inelastic during crisis. Tariff increase is certain as it is regulated by law.
Note: Base case represents our current forecasts and TP
*Extreme case assumes (1) US real GDP falls 3% and euro area GDP falls 5%; (2) China‘s GDP growth falls to 5%; (3) Substantial commodity price declines by end 2012.
Base case and extreme case real GDP growth % assumptions: Australia (4.3, 0.5); China (8.6, 5.0); Hong Kong (4.5, -6.0); India (7.9, 3.0); Indonesia (7.0, 2.5); Malaysia (5.1, -5.8); New Zealand (3.5, 0.8); Philippines (5.7, 0.5); Singapore (5.3, -5.2); South Korea (5.0, -3.0); Taiwan (5.0, -5.0); Thailand (4.7, -3.0)
Source: Nomura estimates
Research analysts:
Wilianto Ie +62 21 2991 3341 [email protected] And the Indonesia Research Team
IMPORTANT: The sensitivity table below does not assess just
the impact of a China hard landing on the mentioned stocks, rather it takes a look at
an extreme scenario including recessions in the US and Europe. None of this is in our
macro or industry or company forecasts. Detailed assumptions are footnoted. See table in
appendix for our current ratings.

Nomura | Asia Special Report November 2011
78
China risk: South Korea
Risks to our current overall view
Although we currently remain positive on Korean equities‘ fundamentals and attractive
valuations, any sharp slowdown in the Chinese economy would likely affect the cyclical
Korean economy substantially, and in turn, the earnings growth of most Korean
companies. If a China hard landing scenario materializes a substantial drop in Korean
exports would not be avoidable, as 25% of Korean exports go to China and, at the same
time, the domestic industry would be hit too as 22% of tourists come from China. Under
the extreme case scenario, assuming a China hard landing and recession in the US and
Europe, our Korean economist‘s 2012F GDP forecast is expected to be cut from +5% to
-3%.
Historically, when the Korean economy was in or close to recession, the Korean equity
market got hit hard, plunging 42% in 1997 and 41% in 2008. We cannot rule out the
same magnitude of impact under the extreme case scenario as a substantial economic
downturn tends to come along with capital flight, weighing sharply on the Korean equity
market.
Key areas of impact if China has a hard landing
Our current sector recommendation focuses on earnings visibility as we believe
developed economies will grow slowly but not fall into a deep recession; also we don‘t
take account of a China hard landing in our base case scenario. However, under the
extreme case, we expect Korean telcos would be largely insulated from the economic
slowdown and domestic-consumption companies such as KT&G would be less
vulnerable to the downturn. At the same time, Korean financials would likely face lower
asset quality, low loan growth and high provisions, and hence would likely be affected
most.
Fig. 13: Earnings and target price sensitivity for most affected and least affected companies in coverage in the extreme case*
(KRW) Ticker
China sales share
2011%
Base case Extreme case*
Comments EPS 2012 % y-y
Target price
EPS 2012 % y-y
Target price
Most affected
Woori FG 053000 KS 0 2,828 12 18,000 617 (70) 4,900 Due to inferior asset quality (high NPL and low coverage
ratio), severe recession should result in greater provisioning.
KB FG 105560 KS 0 6.561 13.4 62,000 2,623 (61) 23,400 Pressure from macro slowdown, increased loan loss
provisions, interest rate cuts.
IBK 024110 KS 0 2,492 (15) 16,000 702 (76) 5,500 With SME concentrated loan portfolio, greater impact on
asset quality than peers in the case of recession.
Hana FG 086790 KS 0 4,745 (9) 54,000 2,194 (52) 19,400 Pressure from macro slowdown, increased loan loss
provisions, interest rate cuts. NIM should be more vulnerable
due to weak deposit franchise.
KEPCO 015760 KS 0 52 na 35,000 -1,330 na 15,000 Export-oriented Korea‘s power demand is highly sensitive to
China and global economic slowdown.
Least affected
KT&G 033780 KS 3 6,380# 10 66,000 6,577 10 65,010 Tobacco demand is relatively inelastic in response to
economic cycle. # Recent currency moves would imply 6,677.
Dongbu
Insurance
005830 KS 0 6,464 26 71,000 3,031 25 70,000 Less sensitive to interest rate cycle and their main product,
medical insurance, is stable in nature.
SKT 017670 KS 0 22,496 (1) 178,00
0
22,47
0
(1) 178,000 Korean telcos are largely insulated from the economic
slowdown.
KT 030200 KS 0 6,101 15 53,000 6,070 15 53,000 Korean telcos are largely insulated from the economic
slowdown.
LGU 032640 KS 0 793 (6) 6,000 793 (6) 6,000 Korean telcos are largely insulated from the economic
slowdown.
Note: Base case represents our current forecasts and TP
*Extreme case assumes (1) US real GDP falls 3% and euro area GDP falls 5%; (2) China‘s GDP growth falls to 5%; (3) Substantial commodity price declines by end 2012.
Base case and extreme case real GDP growth % assumptions: Australia (4.3, 0.5); China (8.6, 5.0); Hong Kong (4.5, -6.0); India (7.9, 3.0); Indonesia (7.0, 2.5); Malaysia (5.1, -5.8); New Zealand (3.5, 0.8); Philippines (5.7, 0.5); Singapore (5.3, -5.2); South Korea (5.0, -3.0); Taiwan (5.0, -5.0); Thailand (4.7, -3.0)
Source: Nomura estimates
Research analysts:
James Kim + 852 2252 6203 [email protected] And the Korea Research Team
IMPORTANT: The sensitivity
table below does not assess just the impact of a China hard landing on the mentioned
stocks, rather it takes a look at an extreme scenario including recessions in the US and
Europe. None of this is in our macro or industry or company forecasts. Detailed assumptions
are footnoted. See table in appendix for our current ratings.

Nomura | Asia Special Report November 2011
79
China risk: Malaysia
Risks to our current overall view
Malaysia is the third most open economy in Asia after Hong Kong and Singapore with
exports to GDP at 97% as at 2010. As part of the diversification strategy, Malaysia‘s
exports to Europe and the US have been tapering off with China becoming the largest
export destination in August. If China has a hard landing, we would see Malaysia‘s GDP
growth falling to -5.8% in 2012. In such a world, Malaysia would end up in a vulnerable
position. Its three key growth engines - the public/private sector economy, manufacturing
exports and commodity resources - would be in much weaker positions.
Key areas of impact if China has a hard landing
The hardest hit sector would be palm oil. The direct impact of any ST disruption could be
significant – China is the 3rd-biggest consumer of CPO, and has contributed 17% of the
growth in the past decade, with about a 60:40 split of usage for food and industrial. The
increasingly realistic prospect of a hard landing would also affect a whole bunch of
things: crude oil, currency, futures, all of which could cause CPO prices to move down
sharply in the ST either directly or via its substitutes. That said, PO will always have the
cost/yield advantage over soy oil (which the Chinese are also big consumers of and
which is far more expensive), and in tough times, people are more likely to switch to
cheaper oils, as was seen in 2009 — veg oil consumption growth remained steady, but
soy lost market share to palm. Industry average gross margin (upstream planters) has
never dipped below 25% in the past 20 years.
We are concerned about the impact on the banks too. In a severe slowdown, loans
growth could contract, margins squeezed (from a lower overnight policy rate) and credit
cost could rise. However, the direct impact is negligible. For example only 13% of Hong
Leong Bank‘s earnings are from China through Bank of Chengdu and 5% of Public
Bank‘s earnings are from its Hong Kong listed Public Financial Holdings.
Fig. 14: Earnings and target price sensitivity for most affected and least affected companies in coverage in the extreme case*
(MYR) Ticker
China Earnings
share 2011%
Base case Extreme case*
Comments EPS 2012 % y-y
Target price
EPS 2012 % y-y
Target price
Most affected
Maybank MAY MK n/a 0.66 (2) 6.85 0.34 (49) 3.24 Assuming 2012 credit cost rises to 100bps (base case: 47bps) and OPR cut to 2.0%
CIMB CIMB MK n/a 0.57 4 6.00 0.30 (44) 3.16 Assuming 2012 credit cost rises to 90bps (base case: 35bps) and OPR cut to 2.0%
Least affected
Telekom T MK <2 0.15 12 4.80 0.147 10 4.72 TM‘s exposures to North Asia are under 2%, primarily from its global business and hence we believe impact should be limited.
Note: Base case represents our current forecasts and TP
*Extreme case assumes (1) US real GDP falls 3% and euro area GDP falls 5%; (2) China‘s GDP growth falls to 5%; (3) Substantial commodity price declines by end 2012.
Base case and extreme case real GDP growth % assumptions: Australia (4.3, 0.5); China (8.6, 5.0); Hong Kong (4.5, -6.0); India (7.9, 3.0); Indonesia (7.0, 2.5); Malaysia (5.1, -5.8); New Zealand (3.5, 0.8); Philippines (5.7, 0.5); Singapore (5.3, -5.2); South Korea (5.0, -3.0); Taiwan (5.0, -5.0); Thailand (4.7, -3.0)
Source: Nomura estimates
Research analysts:
Wai Kee Choong +60 3 2027 6893 [email protected] And the Malaysia Research Team
IMPORTANT: The sensitivity table below does not assess just the impact of a China hard
landing on the mentioned stocks, rather it takes a look at an extreme scenario including
recessions in the US and Europe. None of this is in our macro or industry or company
forecasts. Detailed assumptions are footnoted. See table in appendix for our current ratings.
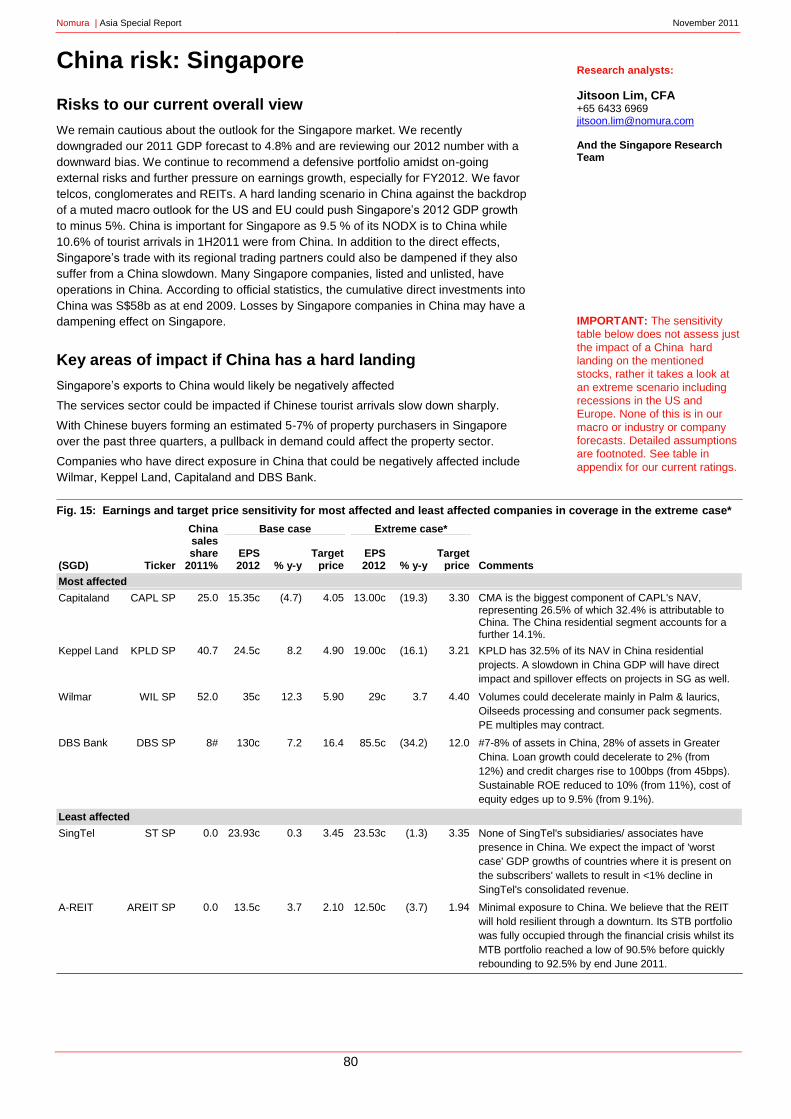
Nomura | Asia Special Report November 2011
80
China risk: Singapore
Risks to our current overall view
We remain cautious about the outlook for the Singapore market. We recently
downgraded our 2011 GDP forecast to 4.8% and are reviewing our 2012 number with a
downward bias. We continue to recommend a defensive portfolio amidst on-going
external risks and further pressure on earnings growth, especially for FY2012. We favor
telcos, conglomerates and REITs. A hard landing scenario in China against the backdrop
of a muted macro outlook for the US and EU could push Singapore‘s 2012 GDP growth
to minus 5%. China is important for Singapore as 9.5 % of its NODX is to China while
10.6% of tourist arrivals in 1H2011 were from China. In addition to the direct effects,
Singapore‘s trade with its regional trading partners could also be dampened if they also
suffer from a China slowdown. Many Singapore companies, listed and unlisted, have
operations in China. According to official statistics, the cumulative direct investments into
China was S$58b as at end 2009. Losses by Singapore companies in China may have a
dampening effect on Singapore.
Key areas of impact if China has a hard landing
Singapore‘s exports to China would likely be negatively affected
The services sector could be impacted if Chinese tourist arrivals slow down sharply.
With Chinese buyers forming an estimated 5-7% of property purchasers in Singapore
over the past three quarters, a pullback in demand could affect the property sector.
Companies who have direct exposure in China that could be negatively affected include
Wilmar, Keppel Land, Capitaland and DBS Bank.
Fig. 15: Earnings and target price sensitivity for most affected and least affected companies in coverage in the extreme case*
(SGD) Ticker
China sales share
2011%
Base case Extreme case*
Comments EPS 2012 % y-y
Target price
EPS 2012 % y-y
Target price
Most affected
Capitaland CAPL SP 25.0 15.35c (4.7) 4.05 13.00c (19.3) 3.30 CMA is the biggest component of CAPL's NAV, representing 26.5% of which 32.4% is attributable to China. The China residential segment accounts for a further 14.1%.
Keppel Land KPLD SP 40.7 24.5c 8.2 4.90 19.00c (16.1) 3.21 KPLD has 32.5% of its NAV in China residential
projects. A slowdown in China GDP will have direct
impact and spillover effects on projects in SG as well.
Wilmar WIL SP 52.0 35c 12.3 5.90 29c 3.7 4.40 Volumes could decelerate mainly in Palm & laurics,
Oilseeds processing and consumer pack segments.
PE multiples may contract.
DBS Bank DBS SP 8# 130c 7.2 16.4 85.5c (34.2) 12.0 #7-8% of assets in China, 28% of assets in Greater
China. Loan growth could decelerate to 2% (from
12%) and credit charges rise to 100bps (from 45bps).
Sustainable ROE reduced to 10% (from 11%), cost of
equity edges up to 9.5% (from 9.1%).
Least affected
SingTel ST SP 0.0 23.93c 0.3 3.45 23.53c (1.3) 3.35 None of SingTel's subsidiaries/ associates have
presence in China. We expect the impact of 'worst
case' GDP growths of countries where it is present on
the subscribers' wallets to result in <1% decline in
SingTel's consolidated revenue.
A-REIT AREIT SP 0.0 13.5c 3.7 2.10 12.50c (3.7) 1.94 Minimal exposure to China. We believe that the REIT
will hold resilient through a downturn. Its STB portfolio
was fully occupied through the financial crisis whilst its
MTB portfolio reached a low of 90.5% before quickly
rebounding to 92.5% by end June 2011.
Note: Base case represents our current forecasts and TP
*Extreme case assumes (1) US real GDP falls 3% and euro area GDP falls 5%; (2) China‘s GDP growth falls to 5%; (3) Substantial commodity price declines by end 2012.
Base case and extreme case real GDP growth % assumptions: Australia (4.3, 0.5); China (8.6, 5.0); Hong Kong (4.5, -6.0); India (7.9, 3.0); Indonesia (7.0, 2.5); Malaysia (5.1, -5.8); New Zealand (3.5, 0.8); Philippines (5.7, 0.5); Singapore (5.3, -5.2); South Korea (5.0, -3.0); Taiwan (5.0, -5.0); Thailand (4.7, -3.0)
Source: Nomura estimates
Research analysts:
Jitsoon Lim, CFA +65 6433 6969 [email protected] And the Singapore Research Team
IMPORTANT: The sensitivity table below does not assess just
the impact of a China hard landing on the mentioned stocks, rather it takes a look at
an extreme scenario including recessions in the US and Europe. None of this is in our
macro or industry or company forecasts. Detailed assumptions are footnoted. See table in
appendix for our current ratings.

Nomura | Asia Special Report November 2011
81
China risk: Taiwan
Risks to our current overall view
Any hard landing in China would be rapidly transmitted into Taiwan through multiple
channels. Still, we see low risk of a domestic financial crisis. Firstly, Taiwan‘s banks now
command the best balance sheet quality in decades. The NPL influx should likely be
manageable, given Taiwanese banks have not started commercial operations in China,
and are thus little directly exposed to corporate China. Secondly, corporate Taiwan is
normally debt-averse, with strong balance sheets, despite historically-high dividend
payouts. Lastly, thanks to the government policy of the intended economic isolation from
the mainland during 1996-2008, China has yet to become a significant factor in Taiwan‘s
domestic economy. Chinese liquidity is little involved in Taiwan‘s property market while
Chinese tourists contribute to only low-single digits of Taiwan‘s retail sales. That said, we
would expect Taiwan‘s property prices to experience a healthy correction of 10% on
average, as Taiwan‘s developers have mostly de-leveraged since the Lehman crisis and
face little pressure of inventory liquidation in a low interest rate environment.
Key areas of impact if China has a hard landing
Earnings downgrades would soon unfold from the tech sector, as China now accounts
for 20% of global tech end consumption. We note that the negative beta could be higher
in the handset foodchains (China equals 25%+ of global demand), followed by PCs and
TVs (20%+) and NBs (15%+).
On the other hand, selective non-tech plays (i.e., Taiwan Cement, Asia Cement, Airtac,
Taiwan Glass, Cheng Hsin Rubber, Gourmet Master), which normally derive over 50% of
revenue from China, would also be significantly affected on the downside.
Where is potential for upside surprise?
With Presidential elections on January 14th
2012, the KMT-led government will likely
react promptly and aggressively to boost the domestic economy, taking advantage of its
majority in the Legislative Yuan. We estimated that Taiwan‘s four major government
funds have maximum capacity of TWD1.2tn to engage in the share purchase program to
support the Taiex. More importantly, with little contingent liability from stable banking
system, Taiwan government also has well-reserved fiscal strength to launch counter-
cyclical infrastructure investments. Last but not least, we expect Taiwan to consider a
repeat of the issuance of shopping coupons to boost domestic consumption, if needed.
Fig. 16: Earnings and target price sensitivity for most affected and least affected companies in coverage in the extreme case*
(TWD) Ticker
China sales share
2011%
Base case Extreme case*
Comments EPS 2012 % y-y
Target price
EPS 2012 % y-y
Target price
Most affected
Asia Cement 1102 TT 45 2.85 (10.0) 34.6 2.21 (30.0) 22.5 Significant earnings exposure to China.
Synnex 2347 TT 60 5.80 31.5 90.0 3.53 (20.0) 76.5 Significant earnings exposure to China.
AirTAC 1590 TT 86 11.58 19.5 300.0 7.27 (25.0) 240.0 Significant earnings exposure to China.
Least affected
Taiwan Mobile 3045 TT 0 5.08 14.0 93.0 4.28 (4.0) 89.3 Diversified revenue stream.
President Chain Store 2912 TT 4 7.60 8.3 205.0 6.60 (6.0) 192.7 Govt may support domestic consumption.
Note: Base case represents our current forecasts and TP
*Extreme case assumes (1) US real GDP falls 3% and euro area GDP falls 5%; (2) China‘s GDP growth falls to 5%; (3) Substantial commodity price declines by end 2012.
Base case and extreme case real GDP growth % assumptions: Australia (4.3, 0.5); China (8.6, 5.0); Hong Kong (4.5, -6.0); India (7.9, 3.0); Indonesia (7.0, 2.5); Malaysia (5.1, -5.8); New Zealand (3.5, 0.8); Philippines (5.7, 0.5); Singapore (5.3, -5.2); South Korea (5.0, -3.0); Taiwan (5.0, -5.0); Thailand (4.7, -3.0)
Source: Nomura estimates
Research analysts:
Jesse Wang +886 2 2176 9977 [email protected] And the Taiwan Research Team
IMPORTANT: The sensitivity table below does not assess just the impact of a China hard
landing on the mentioned stocks, rather it takes a look at an extreme scenario including
recessions in the US and Europe. None of this is in our macro or industry or company
forecasts. Detailed assumptions are footnoted. See table in appendix for our current ratings.

Nomura | Asia Special Report November 2011
82
China risk: Asia banks
Risks to our current overall view
The financial sector will naturally be impacted by any seriously negative macro event
because of its large market capitalization, direct linkage to capital-intensive and export-
oriented industries and still fresh memories of the credit crunch in 2008-09. At the
moment, we are on average sitting on bullish recommendations spreads within most
markets in Asia, reflecting our house view that emerging markets should weather the
macro situation better and would potentially rebound strongly in the event of a short-term
shock. (We are Neutral in Australia where the drivers are different and bearish in
Malaysia on valuations.) A hard landing in China, accompanied by possible recessions in
the US and Europe, would – subject to valuation, obviously – see us turn very cautious.
Numbers would have to come down across the board to reflect loan growth concerns
and, especially in markets with high SME participation, rising credit costs. Our back-of-
the-envelope calculations are tabulated below:
Fig. 17: Earnings and target price sensitivity for most affected and least affected companies in coverage in the extreme case*
Ticker
Base case Extreme case*
Comments EPS 2012 % y-y
Target price
EPS 2012 % y-y
Target price
Most affected
Minsheng (HKD) 1988 HK 0.88 14.29 7.4 (1.2) (255.73) 3.7 589bps credit cost hike to 6.54%
BOC (HKD) 3988 HK 0.51 18.35 5.2 (0.51) (218.49) 2.3 539bps credit cost hike to 5.95%
Citic Bank (HKD) 998 HK 0.66 10 6.5 (0.71) (217.65) 2.8 527bps credit cost hike to 6.02%
CCB (HKD) 939 HK 0.76 18.07 7.02 (0.51) (179.78) 3.28 599bps credit cost hike to 6.61%
CRCB (HKD) 3618 HK 0.55 27.91 6.52 (0.33) (177.31) 1.52 694bps credit cost hike to 7.29%
ICBC (HKD) 1398 HK 0.69 23.21 7.5 (0.28) (150.82) 3.5 529bps credit cost hike to 5.69%
BEA (HKD) 23 HK 2.7 6% 24 (0.33) (113) 18 Weak profitability and thus big swing in earnings
WHB (HKD) 302 HK 6.52 -4% 84 (0.78) (112) 46 Weak profitability and thus big swing in earnings
DSF (HKD) 440 HK 4.3 8% 50 (0.09) (102) 18 Weak profitability and thus big swing in earnings
Woori FG (KRW) 053000 KS 2,828 12% 18,000 617 (70) 4,900 Due to inferior asset quality (high NPL and low coverage ratio), severe recession should result in greater provisioning
Least affected
CBA (AUD) CBA AU 4.43 5.4 53 3.36 (20) 36.72 Our worst case estimates incorporate i) a significant increase in BDD‘s (175bps to NHL which is consistent with the GFC experience) and we do not prescribe banks with any margin benefit (as they achieved throughout the crisis) given we expect a significant slowdown in China will reduce banks‘ ability to re-price margins.
WBC (AUD) WBC AU 2.13 4.6 24.5 1.64 (19.7) 17.4
NAB (AUD) NAB AU 2.63 7.5 30 2.05 (16.1) 20.91
BCA (IDR) BBCA IJ 416.2 7.9 6,700 322.7 (16.4) 5,200 135bps higher credit cost to 1.8%
Danamon (IDR) BDMN IJ 440.8 18.1 4,900 351.7 (5.8) 4,000 100bps higher credit cost to 3.5%
BRI (IDR) BBRI IJ 630.6 19.8 8,400 515.5 (2) 6,900 110bps higher credit cost to 3.5%
UOB (SGD) UOB SP 186c 11.8 21.9 162c (12.9) 19.7 4-5% of assets in China, 7% of assets in Greater China. Loan growth could decelerate to 6% (from 12%) and credit charges rise to 65bps (from 44bps). Sustainable ROE reduced to 12% (from 13%) while cost of equity remains at 9.6%.
Krung Thai Bank (THB)
KTB TB 2.04 15.4 23.2 1.79 (12.3) 20.3 Domestic. Loan growth could decelerate to 8% (from 12%) and credit charges rise to 65bps (from 48bps). Sustainable ROE reduced to 14% (from 15%) while cost of equity remains at 11.2%.
Kasikornbank (THB) KBANK TB 12.2 12.3 135.0 10.8 (11.5) 120.0 Domestic. Loan growth could decelerate to 5% (from 10%) and credit charges rise to 85bps (from 59bps). Sustainable ROE reduced to 15% (from 16%) while cost of equity remains at 11.5%.
Siam Commercial Bank (THB)
SCB TB 9.7 13.5 145.0 9.0 (7.2) 130.0 Domestic. Loan growth could decelerate to 8% (from 12%) and credit charges rise to 55bps (from 38bps). Sustainable ROE reduced to 16% (from 17%) while cost of equity remains at 10.5%.
Note: Base case represents our current forecasts and TP
*Extreme case assumes (1) US real GDP falls 3% and euro area GDP falls 5%; (2) China‘s GDP growth falls to 5%; (3) Substantial commodity price declines by end 2012.
Base case and extreme case real GDP growth % assumptions: Australia (4.3, 0.5); China (8.6, 5.0); Hong Kong (4.5, -6.0); India (7.9, 3.0); Indonesia (7.0, 2.5); Malaysia (5.1, -5.8); New Zealand (3.5, 0.8); Philippines (5.7, 0.5); Singapore (5.3, -5.2); South Korea (5.0, -3.0); Taiwan (5.0, -5.0); Thailand (4.7, -3.0)
Source: Nomura estimates
IMPORTANT: The sensitivity
table below does not assess just the impact of a China hard landing on the mentioned
stocks, rather it takes a look at an extreme scenario including recessions in the US and
Europe. None of this is in our macro or industry or company forecasts. Detailed assumptions
are footnoted. See table in appendix for our current ratings.
Research analysts: The Asia Banks Team

Nomura | Asia Special Report November 2011
83
China risk: Asia consumer-related
Risks to our current overall view
Domestic consumption is generally expected to be resilient in most markets in Asia in
the event of any negative macro event, reflecting our house view that emerging markets
should weather the macro situation better and would potentially rebound strongly in the
event of a short-term shock, aided by policy responses that would promote private
consumption as we saw in the 2008-09 crisis. However, there would be short-term
negative impact on earnings as consumer confidence will likely dip if markets go into a
tailspin in anticipation of a hard landing in China. Our forecasts would have to come
down across the board and we could see significant valuation multiple compression as
well. However, as the table below shows, there could be plenty of relative value in the
classic defensives of F&B, staples and tobacco. At the other end of the spectrum, high-
beta names may see their valuations change more dramatically than their earnings.
Fig. 18: Earnings and target price sensitivity for most affected and least affected companies in coverage in the extreme case*
Ticker
China sales share
2011%
Base case Extreme case*
Comments EPS 2012 % y-y
Target price
EPS 2012 % y-y
Target price
Most vulnerable (earnings change)
Esprit (HKD) 330 HK 8 0.51 (52) 8.90 (0.09) (109) 4.60 European exposure hurts.
Melco Crown (USD) MPEL US 100 0.15 174 17.5 (0.02) (132) 8.2 Extreme case assumes gaming revenue down 12%y-y in 2012, contracted target multiple of 10x across the board. MPEL has low margin VIP-skewed earnings model.
Astra Agro (IDR) AALI IJ 0 2,013 2 28,400 425 (69) 9,000 High operating leverage to palm oil price.
Galaxy Entertainment (HKD)
27 HK 100 1.07 56 21 0.55 (20) 11 VIP-centric earnings stream. Assumptions same as Melco.
Samsonite (HKD) 1910 HK 12 0.97 21 19.70 0.50 (36) 12.60 Asia/China growth story.
Prada (HKD) 1913 HK 32 (Asia) 2.09 24 40.30 1.19 (28) 19.80 Asia/China growth story.
Noble (USD) NOBL SP 10 0.12 22.4 2.50 0.07 (30) 1.60 Global supply chain impact.
Li & Fung (HKD) 494 HK 6 0.72 24 14.10 0.45 (23) 7.40 US exposure.
SJM Holdings (HKD) 880 HK 100 1.21 21 23 0.81 (18) 13.3 Assumptions same as Melco.
Most resilient (earnings change)
Want Want (HKD) 151 HK >90 USD0.038 26.5 HKD6.6 USD0.034 13.6 HKD5.9 Not the most defensive as mainly discretionary foods (snacks).
Tsingtao Brewery (HKD) 168 HK 97 CNY1.23 1.9 HKD34.0 CNY1.11 (8.3) HKD31.0 Beer.
Woolworths (AUD) WOW AU n.a. 180 3.3 30 170 (2.9) 29 Main impact likely to be on discretionary COGS.
China Mengniu (HKD) 2319 HK >90 CNY1.58 30 HKD34.0 CNY1.55 27.3 HKD33.0 Liquid milk is becoming a daily habit for most of the Chinese people.
Coca-Cola Amatil (AUD) CCL AU n.a. 80 11.1 13.00 76 5.5 12 An affordable product in the key Australian market.
China Yurun (HKD) 1068 HK 100 1.66 13.4 21.0 1.62 10.8 20.3 Pork is an essential item in Chinese daily meals.
Huabao International (HKD)
336 HK 100 0.58 11.8 11.7 0.57 9.7 11.4 Tobacco.
KT&G (KRW) 033780 KS 3 6,380# 10 66,000 6,577 10 65,010 Tobacco. # Recent currency moves would imply 6,677.
Treasury Wine Estates (AUD)
TWE AU n.m. 21 26.7 3.30 22 37.5 3.4 Lower AUD/USD benefits transaction and translation, which should offset lower demand.
Note: Base case represents our current forecasts and TP
*Extreme case assumes (1) US real GDP falls 3% and euro area GDP falls 5%; (2) China‘s GDP growth falls to 5%; (3) Substantial commodity price declines by end 2012.
Base case and extreme case real GDP growth % assumptions: Australia (4.3, 0.5); China (8.6, 5.0); Hong Kong (4.5, -6.0); India (7.9, 3.0); Indonesia (7.0, 2.5); Malaysia (5.1, -5.8); New Zealand (3.5, 0.8); Philippines (5.7, 0.5); Singapore (5.3, -5.2); South Korea (5.0, -3.0); Taiwan (5.0, -5.0); Thailand (4.7, -3.0)
Source: Nomura estimates
IMPORTANT: The sensitivity table below does not assess just
the impact of a China hard landing on the mentioned stocks, rather it takes a look at
an extreme scenario including recessions in the US and Europe. None of this is in our
macro or industry or company forecasts. Detailed assumptions are footnoted. See table in
appendix for our current ratings.
Research analysts: The Asia Consumer Team

Nomura | Asia Special Report November 2011
84
China risk: Asia healthcare
Risks to our current overall view
Healthcare expenditure was RMD1,720bn in 2009. Reform of the public hospital system
is one of the major policy targets of ongoing healthcare reform in China. China targets to
invest approximately CNY850bn to reform the healthcare system from 2009 to 2011, of
which about CNY100bn could be used to invest in the expansion of hospitals and basic
healthcare institutions in rural areas. If China has a hard landing, we would see a
potential slowing the reform agenda for China. We currently forecast as much as
CNY60bn could be spent on purchasing of medical equipment in 2011-13. Healthcare in
the rest of the region should be much more defensive, with Australia the most insulated.
Key areas of impact if China has a hard landing
Supply-demand and pricing: According to a United Nations forecast, China's aging
population is expected to increase at a 3.7% CAGR to more than 166mn over the age of
65 by 2020. Given the increased need for tests and treatments, we believe demand for
medical devices will be strong. We think pricing declines are likely to be muted.
Impact on funding: At the top of China's hospital system hierarchy, there are over 1,200
class-3 hospitals, of which over 760 are class-3A. Funding to these hospitals (which use
relatively more devices) would likely be minimally affected.
Policy and regulations: We continue to believe reform of the public hospital system is a
major policy target of the Chinese government and hence is unlikely to be impacted to a
great degree should China suffer a hard landing;
Industry evolution/development: Should there be a Chinese hard landing, the medical
equipment manufacturers, like Mindray (MR US), would likely face a higher risk of
slowdown than other segments as some smaller hospitals with restricted financial
positions may delay equipment investment or replacement cycles. However, a hard
landing in the economy would accelerate market concentration, which should benefit the
domestic market leaders at the expense of some smaller manufacturers.
Where is potential for upside surprise?
For 2011, we expect the market to benefit from the following major policy targets of the
NDRC and MOH: 1) the increase of two BMIS coverage ratios to over 90%; 2) increase
in per capital contribution in NRCMS to CNY200 a year; 3) increase in minimum
reimbursement ratio for in-patient treatment of not less than 70%; and 4) increase in the
maximum reimbursement amount equivalent to about 6x the average annual
salary/disposal income/ farmer income in the respective cities or counties. All this should
lead to volume growth in Chinese hospitals, and hence in Chinese medical device sales.
Fig. 19: Earnings and target price sensitivity for most affected and least affected companies in coverage in the extreme case*
Ticker
China sales share
2011%
Base case Extreme case*
Comments EPS 2012 % y-y
Target price
EPS 2012 % y-y
Target price
Most affected
Mindray (USD) MR US 40 1.82 20.1 34.0 1.59 7.0 25.50 50% revenues from exports.
United Labs (HKD) 3933 HK 70 0.41 (1.9) 6.4 0.38 (10.1) 5.94 30% revenues from exports.
Least affected
Primary Healthcare (AUD) PRY AU 0 0.24 16.9 3.8 0.24 16.9 3.80 No exposure to China.
Ramsay Health Care (AUD) RHC AU 0 1.29 18.7 21.0 1.29 18.7 21.00 No exposure to China.
Sonic Health Care (AUD) SHL AU 0 0.81 6.4 11.0 0.81 6.4 11.00 No exposure to China.
Note: Base case represents our current forecasts and TP
*Extreme case assumes (1) US real GDP falls 3% and euro area GDP falls 5%; (2) China‘s GDP growth falls to 5%; (3) Substantial commodity price declines by end 2012.
Base case and extreme case real GDP growth % assumptions: Australia (4.3, 0.5); China (8.6, 5.0); Hong Kong (4.5, -6.0); India (7.9, 3.0); Indonesia (7.0, 2.5); Malaysia (5.1, -5.8); New Zealand (3.5, 0.8); Philippines (5.7, 0.5); Singapore (5.3, -5.2); South Korea (5.0, -3.0); Taiwan (5.0, -5.0); Thailand (4.7, -3.0)
Source: Nomura estimates
Research analysts:
Dr David Stanton +612 8062 8410 [email protected]
Gideon Lo, CFA +852 2252 6190 [email protected] And the Asia healthcare team
IMPORTANT: The sensitivity table below does not assess just
the impact of a China hard landing on the mentioned stocks, rather it takes a look at
an extreme scenario including recessions in the US and Europe. None of this is in our
macro or industry or company forecasts. Detailed assumptions are footnoted. See table in
appendix for our current ratings.

Nomura | Asia Special Report November 2011
85
China risk: Asia power
Risks to our current overall view
In Asia, power companies in HK, India and Thailand enjoy fuel cost pass through and
fixed return on regulated asset bases, while firms in China, Korea and Malaysia do not
have that luxury, with earnings subjected to tariff, coal, demand and interest cost. HK
utilities should be defensive, whatever the economic situation. If China has a hard
landing, we would see a fall in fuel costs as a benefit for China and Indian IPPs, though
in general the fall in sales volume and margin in case of an unfavourable tariff response
shall be expected, apart from Perusahaan Gas Negara, whose volume depends more on
supply constraints, and Tenaga Nasional, which may be pleased to find itself relieved
partially from costly distillates to supplement supply shortfalls. Exchange movements
would pose a further impact on imported fuel, translated earnings and exports, to which
Korea is highly sensitive. Also, interest rates may fall; this could help high gearing stocks
like China IPPs and Korea Utilities, but the overall exposure on the sector appears to be
limited. In such a world, the impact on our investment stance might be largely neutral.
Key areas of impact if China has a hard landing
Fall in fuel prices benefiting China IPPs exposed to domestic fuel supply, and Tenaga
Nasional, Indian IPPs and Korea utilities exposed to imported fuel.
Slowing economic growth reduces power usage, and thus demand and sales.
Potential drop in interest rates: improve liquidity and cut interest expenses. Impact on
ability to secure funding appears limited unless situation persists and growth impairs.
Governments may hesitate to grant adequate tariff increases, leaving power generators
with no relief against weakened demand.
Little is expected to change in terms of the power industry and capacity structure.
Government unlikely to adjust plans for or influence over the industry for long term
stability. However if an economic slowdown persists, growth may be hurt as planned
capacity growth may not be fully implemented if power demand does not recover.
Where is potential for upside surprise?
Favorable tariff, coal price and interest rate movements would offset impacts from
decline in demand.
Fig. 20: Earnings and target price sensitivity for most affected and least affected companies in coverage in the extreme case*
(Local curr) Ticker
China sales share
2011%
Base case (Local $) Extreme case* (Local $)
Comments EPS 2012 % y-y
Target price
EPS 2012 % y-y
Target price
Most affected
Kepco 015760 KS 0 52 NA 35,000 (1,330) NA 15,000 Export-oriented Korea‘s power demand is highly sensitive to China and global economic slowdown.
Adani Power ADANI IN 0 15.7 NA 115 10.3 NA 110 Utilization levels would drop as we see a slowdown in industrial demand
Lanco Infra LANCI IN 0 3.7 NA 30 2.7 NA 29 Utilization levels would drop as we see a slowdown in industrial demand
Least affected
Perusahaan
Gas Negara
PGAS IJ 0 252.24 NA 3,900 252.24 NA 3,900 Volumes vary as a function of supply constraints instead of demand-pull factors
Ratchaburi
Generating
RATCH TB 0 3.97 NA 41 3.97 NA 41 Highly insulated power purchase agreements
Electricity
Generating
EGCO TB 0 11.82 NA 110 11.82 NA 110 Highly insulated power purchase agreements
Note: Base case represents our current forecasts and TP
*Extreme case assumes (1) US real GDP falls 3% and euro area GDP falls 5%; (2) China‘s GDP growth falls to 5%; (3) Substantial commodity price declines by end 2012.
Base case and extreme case real GDP growth % assumptions: Australia (4.3, 0.5); China (8.6, 5.0); Hong Kong (4.5, -6.0); India (7.9, 3.0); Indonesia (7.0, 2.5); Malaysia (5.1, -5.8); New Zealand (3.5, 0.8); Philippines (5.7, 0.5); Singapore (5.3, -5.2); South Korea (5.0, -3.0); Taiwan (5.0, -5.0); Thailand (4.7, -3.0)
Source: Nomura estimates
Research analysts:
Ivan Lee, CFA +852 2252 6213 [email protected]
Daniel Raats +852 2252 2197 [email protected]
Anirudh Gangahar +91 22 4037 4516 [email protected]
Keith Nam +82 2 3783 2342 [email protected]
Joseph Lam, CFA +852 2252 2106 [email protected]
And the Asia power team
IMPORTANT: The sensitivity table below does not assess just the impact of a China hard
landing on the mentioned stocks, rather it takes a look at an extreme scenario including
recessions in the US and Europe. None of this is in our macro or industry or company
forecasts. Detailed assumptions are footnoted. See table in appendix for our current ratings.

Nomura | Asia Special Report November 2011
86
China risk: Asia property
Three risks to consider
While property is perceived to be a local industry and driven by local demographics, past
crisis have shown that no markets are immune in the event of a system-wide correction.
Further, with increasing globalization, if China were to have a hard landing, we believe
demand across all asset classes and all regions would be affected. While demand would
be hit across the board, we believe some property markets would fare worse than
others. The three differentiating factors that would set the various markets apart are:
(1) Balance sheet strength – Would there be distress selling?
(2) Supply outlook – How much unproductive stock would need to be unloaded? and
(3) Valuations – Have stocks already priced in the downside?
Fig. 21: Gearing levels across the region
Source: Nomura Research Note: net-debt-to-equity for traditional property companies. For REITs gearing is defined as total debt-to-total assets
図表 10
Fig. 10
Fig. 22: How big is the supply overhang?
Source: Nomura Research
図表 11
Fig. 11
Fig. 23: Valuation: How much have current trailing PB already discounted?
Source: Nomura Research Note: Current PB as of October 14, 2011
図表 12
Fig. 12
Fig. 24: Most vulnerable, most resilient and best positioned
Source: Nomura Research
図表 13
Fig. 13
-12%
12% 16% 22% 27% 28% 33%
58% 62% 63%
-20%
0%
20%
40%
60%
80%
ID P
rop
ert
y
HK
Develo
pers
HK
Lan
dlo
rds
HK
RE
ITs
MY
Pro
pert
y
SG
RE
ITs
SG
Develo
per
s
IN P
rop
ert
y
CH
Pro
pert
y
TW
Pro
pert
y
Net gearing
2011 2012 Vs. Metric 2011 2012
HK office (mn sf) 0.86 1.01 20 Yr Avg 2.40 -64% -58%
MY housing (units) 72,054 86,733 8 Yr Avg 172,861 -58% -50%
HK retail (mn sf) 0.61 1.11 19 Yr Avg 1.23 -50% -10%
HK housing (units) 10,670 13,700 14 Yr Avg 19,064 -44% -28%
TW housing (Households) 70,610 63,549 5 Yr Avg 102,690 -31% -38%
ID office (mn sqm) 7.40 7.96 4 Yr Avg 6.63 12% 20%
ID retail (mn sqm) 5.27 5.56 4 Yr Avg 4.67 13% 19%
IN office (mn sf) 47.00 38.00 2 Yr Avg 41.50 13% -8%
SG housing (units) 9,469 10,407 17 Yr Avg 8,269 15% 26%
ID housing (ha) 181.96 185.46 4 Yr Avg 148.86 22% 25%
IN housing (mn sf) 250.00 250.00 2 Yr Avg 198.50 26% 26%
CH housing (mn sqm) 704.49 826.96 6 Yr Avg 523.61 35% 58%
SG office (mn sf) 2.80 1.41 30 Yr Avg 0.60 364% 134%
Surplus/Deficit to AvgCompletion
Average Avg PB
Hist. Avg SD
(x) Current P/B Vs. Avg +/- SD (x)
HK Landlords 20 Yr Avg 0.80 0.14 0.58 -28% -1.57
HK Developers 20 Yr Avg 1.17 0.28 0.78 -34% -1.40
CH Property 6 Yr Avg 2.24 1.15 1.25 -44% -0.86
SG Developers 10 Yr Avg 1.27 0.61 0.91 -29% -0.60
SG REITs 9 Yr Avg 1.03 0.20 0.96 -7% -0.36
IN Property 11 Yr Avg 3.17 4.25 1.73 -45% -0.34
ID Property 5 Yr Avg 2.31 0.57 2.22 -4% -0.15
TW Property 15 Yr Avg 1.26 0.64 1.28 2% 0.03
MY Property 11 Yr Avg 1.75 0.68 1.80 3% 0.07
Country Most vulnerable Most resilient Best positioned under base case
China Guangzhou R&F (2777 HK) China Overseas (688 HK) China Overseas (688 HK)
HK Wharf (4 HK) SHKP (16 HK) SHKP (16 HK)
India DLFLtd (DLF IN) Oberoi Realty (OBER IN) DLF Ltd (DLF IN)
Indonesia Agung Podomoro (APLN IJ) Bumi Serpong Damai (BSDE IJ) Ciputra Dev (CTRA IJ)
Malaysia Malaysian Resources (MRC MK) SP Setia (SPSB MK) Man Sing (MSGB MK)
Singapore CapitaLand (CAPL SP) A-REIT (AREIT SP) Keppel Land (KPLD SP)
Taiwan Huaku (2548 TT) Farglory (5522 TT) Farglory (5522 TT)
Research analysts:
Paul Louie +852 2252 6189 [email protected] And the Asia property team
IMPORTANT: Our sensitivity analysis does not assess just the impact of a China hard
landing on the mentioned stocks, rather it takes a look at an extreme scenario including
recessions in the US and Europe. None of this is in our
macro or industry or company
forecasts. See table in appendix for our current ratings
The extreme case assumes (1) US real GDP falls 3% and euro
area GDP falls 5%; (2) China‘s GDP growth falls to 5%; (3) Substantial commodity price
declines by end 2012.
Base case and extreme case real GDP growth % assumptions: Australia (4.3,
0.5); China (8.6, 5.0); Hong Kong (4.5, -6.0); India (7.9, 3.0); Indonesia (7.0, 2.5); Malaysia
(5.1, -5.8); New Zealand (3.5, 0.8); Philippines (5.7, 0.5); Singapore (5.3, -5.2); South
Korea (5.0, -3.0); Taiwan (5.0, -5.0); Thailand (4.7, -3.0).

Nomura | Asia Special Report November 2011
87
China risk: Asia renewables
Risks to our overall current view
Current views: bearish on solar; neutral on wind, nuclear and natural gas.
Asia governments would likely not alter renewable capacity targets despite a slowdown,
given strategic plans to diversify from coal. China wind, natural gas and nuclear
industries are armed with a favorable fuel mix from FYP12 and capacity targets from
NDRC‘s Roadmap. However, the solar industry has seen sharp falls in ASP and volume
growth while near term upsides are limited from severe demand headwinds, likely
subsidy cuts and new market penetration. If China has a hard landing, we would see
tighter regulation of financing across the solar sector and a sharp cut in utilization, while
with backing of government policy and limited exports, china wind and nuclear would
meet with little impact. Therefore, FY12F earnings would likely fall 20~25% across the
solar industry, with a potentially sharper impact in the event of worsening investor
sentiments, but sectors like wind, natural gas and nuclear would not be affected.
Key areas of impact if China has a hard landing
Solar: Sharp utilization cuts at 30~40% for solar industry as demand declines continue
amidst high channel inventories; Utilization cuts reduce supply in solar industry, but
supply-demand mismatch persists with supply 20~30% over demand.
Wind, nuclear and natural gas: FYP12 capacity/consumption targets would not be
affected.
Approvals for government subsidy program may slow down for solar industry, while it is
unlikely for the government to revise wind installation capacity and FYP12 fuel targets.
Tighter regulatory control on refinancing possible for all renewable companies.
Where is potential for upside surprise?
Sharper than expected drops in interest rates would favour valuation. Approvals for tariff
increases may relieve demand declines. Supply-side consolidation as higher-cost
producers are priced out of the market and demand elasticity may also remedy impacts
to the solar industry, given lower ASPs enabling stronger demand from new regions,
especially US, China, Japan, and India; albeit needs improved financing availability.
Fig. 25: Earnings and target price sensitivity for most affected and least affected companies in coverage in the extreme case*
Ticker
China sales share
2011%
Base case Extreme case*
Comments EPS 2012 % y-y
Target price
EPS 2012 % y-y
Target price
Most affected
LDK Solar
(USD)
LDK US 44 (0.78) NM 2.6 (1.00) NM 1.30 We see LDK‘s financing issues getting exacerbated in the extreme case.
Motech
(TWD)
6244 TT NA (5.30) NM 39.0 (7.00) NM 20.00 We expect pure play companies to bear the brunt in the extreme case.
JA Solar
(USD)
JASO US 52 (0.32) NM 2.0 (0.42) NM 1.05 We expect pure play companies to bear the brunt in the extreme case.
Least affected
GCL
(HKD)
3800 HK >90 0.20 (50.80) 2.5 0.16 (60.50) 1.50 GCL‘s lowest cost structure should help it remain breakeven in the extreme case.
Trina
(USD)
TSL US 9 (0.54) NM 7.0 (0.70) NM 4.00 Trina‘s lowest cost structure and good balance sheet could help the company through the downturn.
Yingli
YGE US 15 CNY
(5.61)
NM USD3.4 CNY
(7.00)
NM USD2.0 Yingli‘s lowest cost structure could help the company through the downturn.
Note: Base case represents our current forecasts and TP
*Extreme case assumes (1) US real GDP falls 3% and euro area GDP falls 5%; (2) China‘s GDP growth falls to 5%; (3) Substantial commodity price declines by end 2012.
Base case and extreme case real GDP growth % assumptions: Australia (4.3, 0.5); China (8.6, 5.0); Hong Kong (4.5, -6.0); India (7.9, 3.0); Indonesia (7.0, 2.5); Malaysia (5.1, -5.8); New Zealand (3.5, 0.8); Philippines (5.7, 0.5); Singapore (5.3, -5.2); South Korea (5.0, -3.0); Taiwan (5.0, -5.0); Thailand (4.7, -3.0)
Source: Nomura estimates
Research analysts:
Ivan Lee, CFA +852 2252 6213 [email protected]
Nitin Kumar +65 6433 6967 [email protected] And the Asia renewables team
IMPORTANT: The sensitivity
table below does not assess just the impact of a China hard landing on the mentioned
stocks, rather it takes a look at an extreme scenario including recessions in the US and
Europe. None of this is in our macro or industry or company forecasts. Detailed assumptions
are footnoted. See table in appendix for our current ratings.

Nomura | Asia Special Report November 2011
88
China risk: Asia technology
Risks to our current overall view
Basically, we expect 2012F IT industry growth in China to continue to outperform other
geographic markets due to still-low penetration of LCD TVs, PCs and smartphones. We
forecast China PC shipments will grow 11% y-y to 82mn units in 2012F vs. 4.7% y-y for
our global PC shipment growth forecast. We also expect 2012F LCD TV demand to grow
15% y-y to 49mn units in China, which is 5pps higher than global LCD TV demand
growth. In terms of handset demand in China, we expect 15% y-y growth to 550mn units
along with growing mobile subscribers. We expect 3G smartphone shipment volume to
grow 45% y-y, driven by operators‘ handset subsidy policies, accounting for 15% of
market volume in 2012F. We expect the white goods market to still see ~20% y-y volume
growth along with the rise of penetration rate in rural areas.
Key areas of impact if China has a hard landing
We expect PC and handset shipment growth would be 9% y-y, and 5% (similar to 2008),
respectively, which would extend the replacement cycle for PCs and handsets in
matured cities, although we expect rising demand from tier-4 to tier-6 cities should help
compensate. We see limited impact for smartphones in 2012 as the market is mainly
driven by operators‘ subsidy policies. LCD TV market growth could fall to 10%, the
lowest over the past several years, in our view. We expect white-goods market growth
could slow to around 10% due to the slower-than-expected income level growth.
LGD, the global no. 1 LCD panel maker, has cancelled its 8G line schedule and
Samsung has decided to move an existing 8G line in Korea to China rather than build a
new one as planned earlier. We could see other capex cuts along the supply chain.
We do not recommend any pure LCD names in the supply chain such as glass,
polarizer, and LED companies.
Two China LCD panel companies are ramping up their new 8G lines. However, we
anticipate that they may delay the full ramp up and all panel makers‘ profitability could be
negative in 2012F, following the big loss in 2011F.
Where is potential for upside surprise?
Microsoft‘s new OS Windows 8 official launch and rising interest in ultrabooks should
help boost replacement demand in 2H12. China may introduce new subsidies to
stimulate home appliance and TV demand in rural areas.
Fig. 26: Earnings and target price sensitivity for most affected and least affected companies in coverage in the extreme case*
Ticker
China sales share
2011%
Base case Extreme case*
Comments EPS 2012 % y-y
Target price
EPS 2012 % y-y
Target price
Most affected
TCL (HKD) 2618 HK 10 1.04 30 8 0.89 11 7 Smartphone sales are driven by operator
subsidies rather than the macro environment.
ZTE (HKD) 763 HK 50 1.28 21 28 1 (6) 22 Sells equipment and phones to operators.
Lenovo 992 HK 48 US3.4c 26 HKD5.1 USD2.8c 2 HKD4.0 75% earnings from China.
LGD (KRW) 034220 KS 25 85 na 24,000 68 na 21,000 Supplies panels to Chinese set makers.
Least affected
Acer (TWD) 2353 TT 14 2.33 na 27 1.7 na 20 Small exposure to China.
Samsung SDI
(KRW)
006400 KS 5 10,698 9.4 160,000 8,558 7.5 120,000 Minimal exposure to China.
LG Innotek
(KRW)
011070 KS 5 1,861 na 71,000 1,303 na 58,000 Minimal exposure to China.
Note: Base case represents our current forecasts and TP
*Extreme case assumes (1) US real GDP falls 3% and euro area GDP falls 5%; (2) China‘s GDP growth falls to 5%; (3) Substantial commodity price declines by end 2012.
Base case and extreme case real GDP growth % assumptions: Australia (4.3, 0.5); China (8.6, 5.0); Hong Kong (4.5, -6.0); India (7.9, 3.0); Indonesia (7.0, 2.5); Malaysia (5.1, -5.8); New Zealand (3.5, 0.8); Philippines (5.7, 0.5); Singapore (5.3, -5.2); South Korea (5.0, -3.0); Taiwan (5.0, -5.0); Thailand (4.7, -3.0)
Source: Nomura estimates
Research analysts:
James Kim +852 2252 6203 [email protected] And the Asia technology team
IMPORTANT: The sensitivity table below does not assess just the impact of a China hard
landing on the mentioned stocks, rather it takes a look at an extreme scenario including
recessions in the US and Europe. None of this is in our macro or industry or company
forecasts. Detailed assumptions are footnoted. See table in appendix for our current ratings.

Nomura | Asia Special Report November 2011
89
China risk: Asia telecoms
Risks to our current overall view
Overall we believe the Asian telecom sector should be relatively resilient to a macro
slowdown or a China hard-landing. YTD, Asian telcos is the only sector with positive
returns (up 3%) – although this may not continue (as the sector does not look
inexpensive at 14-15x P/E currently), but outperformance relative to other sectors and
markets would be likely. We continue to prefer liquid stocks, with stable yields and EPS
resilience. Our bias is also for stocks with network advantages, especially as data
economics can be challenging.
Key areas of impact if China has a hard landing
• Consumer spend on telcos could be adversely impacted – telco spend as a percentage
of GDP ranges from 3-6% across most Asian countries. The impact of a slowdown
could be more pronounced in the mid to low end pre-paid segment, both on net adds
and ARPUs. For China specifically, the impact could be more visible in factories along
the coastal areas which has a larger migrant population.
• There could be downward revisions to capex, although we are already anticipating a
drop in capex/sales from 20% in 2010 to 18% in 2012F. In the 2008 slowdown, there
weren‘t many downward revisions to capex or revenue/EBITDA guidance; however
now the penetration rates are 10-20% higher.
• We think telcos in China, India, Indonesia, Thailand and the Philippines could be more
exposed, while the rest should be more resilient.
Fig. 27: Earnings and target price sensitivity for most affected and least affected companies in coverage in the extreme case*
Ticker
China sales share
2011%
Base case Extreme case*
Comments
EPS 2012
(CNY) % y-y
Target price
(HKD)
EPS 2012
(CNY) % y-y
Target price
(HKD)
Most affected
China Unicom 762 HK 100 0.56 79.5 18.50 0.51 62.9 18.20 Revenue vulnerable due to low-ARPU.
Least affected
China Mobile 941 HK 100 6.46 2.7 90.00 6.11 (3.0) 89.60 Have more high-ARPU subscribers.
Note: Base case represents our current forecasts and TP
*Extreme case assumes (1) US real GDP falls 3% and euro area GDP falls 5%; (2) China‘s GDP growth falls to 5%; (3) Substantial commodity price declines by end 2012.
Base case and extreme case real GDP growth % assumptions: Australia (4.3, 0.5); China (8.6, 5.0); Hong Kong (4.5, -6.0); India (7.9, 3.0); Indonesia (7.0, 2.5); Malaysia (5.1, -5.8); New Zealand (3.5, 0.8); Philippines (5.7, 0.5); Singapore (5.3, -5.2); South Korea (5.0, -3.0); Taiwan (5.0, -5.0); Thailand (4.7, -3.0)
Source: Nomura estimates
Research analysts:
Sachin Gupta, CFA +65 6433 6968 [email protected]
Danny Chu, CFA +852 2252 6209 [email protected] And the Asia telecoms team
IMPORTANT: The sensitivity table below does not assess just the impact of a China hard
landing on the mentioned stocks, rather it takes a look at an extreme scenario including
recessions in the US and Europe. None of this is in our macro or industry or company
forecasts. Detailed assumptions are footnoted. See table in appendix for our current ratings.

Nomura | Asia Special Report November 2011
90
China risk: Asia transport
Risks to our current overall view
We currently have a negative view on shipping companies, a neutral to positive view on
airlines, expressways, and ports, and a positive view on airports. Our positive position on
airlines would be most at risk in a China hard landing scenario.
Key areas of impact if China has a hard landing
• Demand is expected to be impacted across the entire transport sector, nevertheless,
the impact to earnings is expected to be the largest for shipping companies and airlines
given thinner profit margins. Further, a hard landing may impact the pricing for both the
shippers and the airlines. In contrast, a hard landing is not expected to have any price
impact for airports and just minimal impact on the ports and expressways.
• While a hard landing may result in tighter funding, it is unlikely that the Chinese
transport companies would run into solvency issues given that most are state-owned
and historically had been bailed-out by the government in crisis situations.
• A hard landing may increase regulatory risk especially on pricing for the expressways.
Where is potential for upside surprise?
We believe that there is the possibility for an upside surprise for the expressways should
toll-rate cuts (which have been at least partially priced in given the official announcement
of a nation-wide toll-rate review at the beginning of this year) not materialize by May-
2012.
Fig. 28: Earnings and target price sensitivity for most affected and least affected companies in coverage in the extreme case*
Ticker
China sales share
2011%
Base case Extreme case*
Comments EPS 2012
(CNY) % y-y
Target price
(HKD) EPS 2012
(CNY) % y-y
Target price
(HKD)
Most affected
CEA 670 HK 80 0.39 (0.065) 4.65 (0.69) na 0.86 Target price of extreme case based on 2008's trough
valuation P/BV of 0.65x and assume CNY appreciation
to remain flat y-y in 2012F
CSCL 2866 HK na (0.19) na 1.20 (0.38) na 1.11 In a bear-case scenario, we assume overall 2012F
freight rates would decline by a further 5% on a y-y
basis while we assume all international freight rates in
2012F would decline by a further 10% from the base
case in an extreme bearish case.
Yang Ming 2609 TT na -TWD2.91 na TWD7.10 -TWD7.01 na TWD3.39 In a bear-case scenario, we assume overall 2012F
freight rates would decline by a further 5% on a y-y
basis while we assume all international freight rates in
2012F would decline by a further 10% from the base
case in an extreme bearish case.
Least affected
HHI 737 HK 100 HKD0.34 (3.5) 5.69 HKD0.29 (19.1) 3.18 Assuming the toll rate to remain stable post the toll rate
review in 2012 for calculating the extreme case's
earnings, while target price of extreme case to be
based on 2008's trough PE multiple of 11.2x and
assume earnings to decline by another 20% to reflect
the possible toll rate cut
BCIA 694 HK 100 0.27 53.6 5.85 0.17 (39.0) 2.86 Target price of extreme case to be based on historical
trough P/BV of 0.7x
Hopewell 54 HK 65 HKD2.00 52.3 32.60 HKD0.95 (28.1) 18.60 y-y chg% are calculated based on re-current earnings
Note: Base case represents our current forecasts and TP
*Extreme case assumes (1) US real GDP falls 3% and euro area GDP falls 5%; (2) China‘s GDP growth falls to 5%; (3) Substantial commodity price declines by end 2012.
Base case and extreme case real GDP growth % assumptions: Australia (4.3, 0.5); China (8.6, 5.0); Hong Kong (4.5, -6.0); India (7.9, 3.0); Indonesia (7.0, 2.5); Malaysia (5.1, -5.8); New Zealand (3.5, 0.8); Philippines (5.7, 0.5); Singapore (5.3, -5.2); South Korea (5.0, -3.0); Taiwan (5.0, -5.0); Thailand (4.7, -3.0)
Source: Nomura estimates
図表 14
Fig. 14
Research analysts:
Jim Wong +852 2252 2195 [email protected]
Andrew Lee +852 2252 6197 [email protected] And the Asia transport team
IMPORTANT: The sensitivity table below does not assess just the impact of a China hard
landing on the mentioned stocks, rather it takes a look at an extreme scenario including
recessions in the US and Europe. None of this is in our macro or industry or company
forecasts. Detailed assumptions are footnoted. See table in appendix for our current ratings.

Nomura | Asia Special Report November 2011
91
Chinese credits – already reflecting the risks of a China hard landing
From a credit perspective, when considering the direct consequences of a
China hard landing, we believe the four key areas of focus are the impact on
the sovereign and its ratings, the banks and the availability of credit, with
implications for the HY property sector and industrials, and lastly, the
repercussions for the Chinese SOE space. We believe the risks of a slowdown
are already starting to show in the recent underperformance of Chinese credit
across both HG and HY relative to the rest of the Asian credit universe. This
underperformance has been seen right through the sell-off since August
through September, and the much less convincing participation in the rally that
subsequently followed. In our view, a China hard landing would have the
following consequences for Chinese credit:
Significant underperformance of highly levered SOEs, whose
investment grade ratings have been underpinned by government
support;
Chinese HY industrials would underperform the large cap HY property
credits;
Significantly more scrutiny of the default risk of smaller cap property
credits; and
Hong Kong banks that have extended their balance sheets to Chinese
banks and SOEs would likely be dragged to wider levels, though we
believe the space could be unfairly penalized.
Ahead of a China hard landing playing out, we believe the signs would be
borne through the ripple effects of the tightening of onshore credit with an
explosion in shadow bank lending followed by a focus on the government‟s
ability to manage the knock-on consequences. Another area that will be
closely tracked will be the property sector, which has been on an uninterrupted
upward trajectory in terms of supply and prices. The supply overhang that has
been created is finally starting to result in prices and transaction volumes
crashing, particularly in top-tier cities.
On the back of the above views and backdrop we lay out our trade ideas on
China:
Sovereign – We expect CDS to remain highly volatile and subject to macro
headlines with likely buyers on any meaningful tightening as we saw at the end
of last week, where CDS went from a recent peak of 207bp down to the
current 140bp. We do not see much in terms of downward pressure on foreign
credit ratings. If there is any pressure we would expect it to come from Fitch‟s
This portion of the Report has been prepared by a Desk Analyst and is not a research report under U.S. law. The desk commentary portion of this report is not a product of the Fixed Income Research Department and is not covered by
the research analyst certification provided in Appendix A-1.
To our U.K. clients: this portion of the Report has been produced by and for the primary benefit of a trading desk.
As such, we do not hold out this Desk Commentary as being impartial in relation to the activities of this trading desk.
For additional information concerning the role of trading desk analysts, please see the important conflicts disclosures beginning at page 101 of this report.
Desk Analyst
Pradeep Mohinani
+852 2536 7030 [email protected]
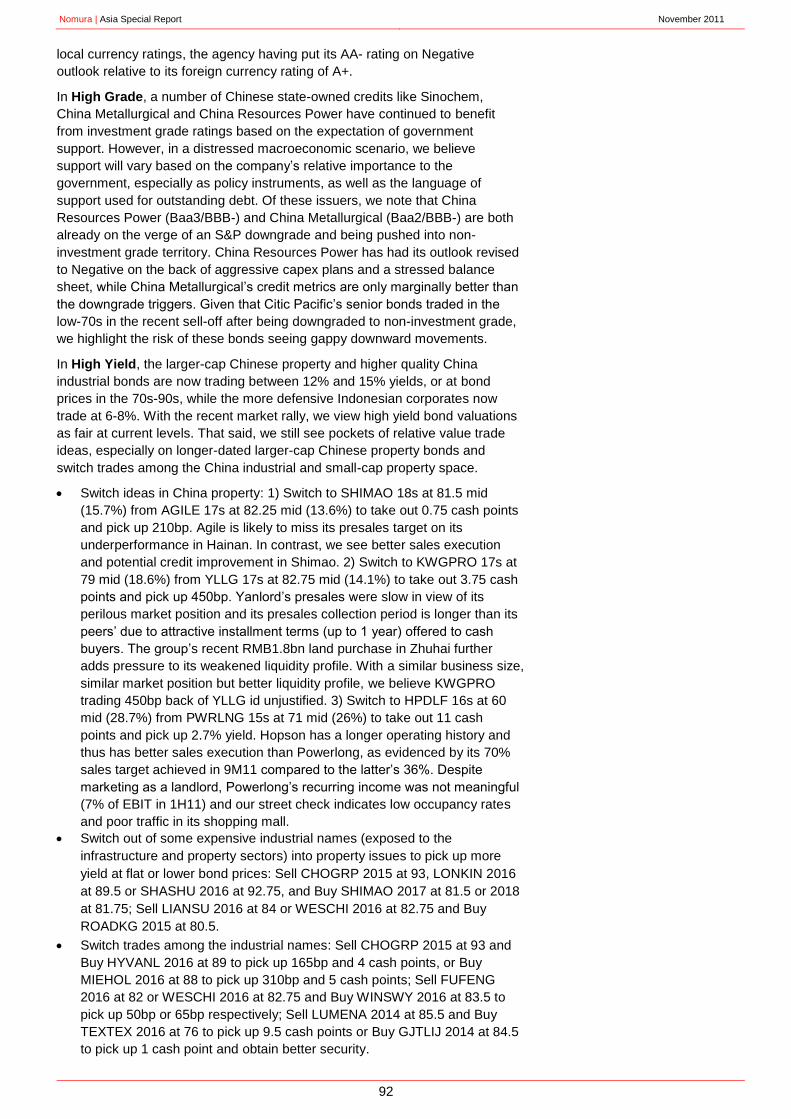
Nomura | Asia Special Report November 2011
92
local currency ratings, the agency having put its AA- rating on Negative
outlook relative to its foreign currency rating of A+.
In High Grade, a number of Chinese state-owned credits like Sinochem,
China Metallurgical and China Resources Power have continued to benefit
from investment grade ratings based on the expectation of government
support. However, in a distressed macroeconomic scenario, we believe
support will vary based on the company‟s relative importance to the
government, especially as policy instruments, as well as the language of
support used for outstanding debt. Of these issuers, we note that China
Resources Power (Baa3/BBB-) and China Metallurgical (Baa2/BBB-) are both
already on the verge of an S&P downgrade and being pushed into non-
investment grade territory. China Resources Power has had its outlook revised
to Negative on the back of aggressive capex plans and a stressed balance
sheet, while China Metallurgical‟s credit metrics are only marginally better than
the downgrade triggers. Given that Citic Pacific‟s senior bonds traded in the
low-70s in the recent sell-off after being downgraded to non-investment grade,
we highlight the risk of these bonds seeing gappy downward movements.
In High Yield, the larger-cap Chinese property and higher quality China
industrial bonds are now trading between 12% and 15% yields, or at bond
prices in the 70s-90s, while the more defensive Indonesian corporates now
trade at 6-8%. With the recent market rally, we view high yield bond valuations
as fair at current levels. That said, we still see pockets of relative value trade
ideas, especially on longer-dated larger-cap Chinese property bonds and
switch trades among the China industrial and small-cap property space.
Switch ideas in China property: 1) Switch to SHIMAO 18s at 81.5 mid
(15.7%) from AGILE 17s at 82.25 mid (13.6%) to take out 0.75 cash points
and pick up 210bp. Agile is likely to miss its presales target on its
underperformance in Hainan. In contrast, we see better sales execution
and potential credit improvement in Shimao. 2) Switch to KWGPRO 17s at
79 mid (18.6%) from YLLG 17s at 82.75 mid (14.1%) to take out 3.75 cash
points and pick up 450bp. Yanlord‟s presales were slow in view of its
perilous market position and its presales collection period is longer than its
peers‟ due to attractive installment terms (up to 1 year) offered to cash
buyers. The group‟s recent RMB1.8bn land purchase in Zhuhai further
adds pressure to its weakened liquidity profile. With a similar business size,
similar market position but better liquidity profile, we believe KWGPRO
trading 450bp back of YLLG id unjustified. 3) Switch to HPDLF 16s at 60
mid (28.7%) from PWRLNG 15s at 71 mid (26%) to take out 11 cash
points and pick up 2.7% yield. Hopson has a longer operating history and
thus has better sales execution than Powerlong, as evidenced by its 70%
sales target achieved in 9M11 compared to the latter‟s 36%. Despite
marketing as a landlord, Powerlong‟s recurring income was not meaningful
(7% of EBIT in 1H11) and our street check indicates low occupancy rates
and poor traffic in its shopping mall.
Switch out of some expensive industrial names (exposed to the
infrastructure and property sectors) into property issues to pick up more
yield at flat or lower bond prices: Sell CHOGRP 2015 at 93, LONKIN 2016
at 89.5 or SHASHU 2016 at 92.75, and Buy SHIMAO 2017 at 81.5 or 2018
at 81.75; Sell LIANSU 2016 at 84 or WESCHI 2016 at 82.75 and Buy
ROADKG 2015 at 80.5.
Switch trades among the industrial names: Sell CHOGRP 2015 at 93 and
Buy HYVANL 2016 at 89 to pick up 165bp and 4 cash points, or Buy
MIEHOL 2016 at 88 to pick up 310bp and 5 cash points; Sell FUFENG
2016 at 82 or WESCHI 2016 at 82.75 and Buy WINSWY 2016 at 83.5 to
pick up 50bp or 65bp respectively; Sell LUMENA 2014 at 85.5 and Buy
TEXTEX 2016 at 76 to pick up 9.5 cash points or Buy GJTLIJ 2014 at 84.5
to pick up 1 cash point and obtain better security.

Nomura | Asia Special Report November 2011
93
HK bank LT2 2020s will likely face high supply risk in the near term. A number
of banks such as Bank of East Asia and Citic Bank International have T2
refinancing needs in 1H12 and they recently established MTN programs
and/or conducted roadshows to prepare for any potential LT2 issuance to
refinance once the market stabilizes. There was even market speculation that
BOCHK was looking to issue a new 10yr LT2 earlier last week, according to
Reuters, although we do not see the rationale for such a move in the near term
given a solid total CAR of 17.6% and limited T2 refinancing needs until June
2013. The latest 3yr USD250 million CD issuance by China Merchant Bank
(BBB; the sixth-largest commercial bank in China) at MS+300bp could open
up the pipeline for more USD senior or LT2 issuance by other Chinese banks.
Against this backdrop of heavy supply pressure, we suggest investors take
advantage of the recent rally to switch out of the HK bank LT2 2020s
(particularly BNKEA 2020, CINDBK 2020, ICBCAS 2020 and FUBON 2020)
into short-dated HK bank UT2 Pnc12 or Pnc13 with reasonably attractive
YTCs (including BNKEA GBP 6.125% Pc12, CINDBK 9.125% Pnc12 and
WINHAN 9.375% Pnc13), which have lagged behind in the latest rally.

Nomura | Asia Special Report November 2011
94
References
Akerlof, G.(1970), “The Market for „Lemons‟: Quality Uncertainty and the
Market Mechanism,” Quarterly Journal of Economics, Vol. 84, No. 2, pp. 488–
500.
Ash, R. F. (2011), “Feeding Billions: Food Security in China”, International
Relations and Security Network/Swiss Federal Institute of Technology, 29
March 2011.
Aziz, J. (2006), “Rebalancing China‟s Economy: What Does Growth Theory
Tell Us?,” IMF Working Paper 06/291.
Bai, C.; C. Hsieh and Y. Qian (2006), "The Return to Capital in China", NBER
Working Paper No. 12755, December 2006.
Borio C., P. Lowe (2002), "Asset Prices, Financial Monetary Stability:
Exploring the Nexus", BIS Working Papers, No. 114, July 2002.
Cai, Fang and M. Wang (2008), “A Counterfactual Analysis on Unlimited
Surplus Labor in Rural China,” China & World Economy, Vol. 16, No. 1, pp.51-
65.
Chellaney, B. (2011), “Water: Asia‟s New Battleground”, Georgetown
University Press.
Conway, P., R. Herd and T. Chalaux (2010), “Reforming China‟s Monetary
Policy Framework to Meet Domestic Objectives”, OECD Economics
Department Working Papers No. 822, December 2010.
Yang, D. and M. Wang (2010), “Discussions on Potential Bias and Implications
of Lewis Turning Point,” China Economic Journal, Vol. 3, No. 2, pp.121-136.
Eichengreen, B., D. Park and K. Shin (2011), "When Fast Growing Economies
Slow Down: International Evidence and Implications for the People' Republic
of China", ADB Economics Working paper Series No. 262, June 2011.
Findlay, R. and K.H. O'Rourke (2008), “Power and Plenty”, Princeton
University Press.
FitchRatings (2011), “Chinese Banks: Growth of Leverage Still Outpacing GDP
Growth”, China Special Report, July 2011.
Fukumoto, T. and I. Muto (2011), “Rebalancing China‟s Economic Growth:
Some Insights from Japan‟s Experience”, Bank of Japan Working Paper
Series No. 11-E-5, July 2011.
Gan J.; Y. Guo and C. Xu (2008), "What makes Privatization Work? The Case
Study of China, Hong Kong University of Science and Technology, September
2008.
Garnaut, R. (2010), “Macro-Economic Implications of the Turning Point” China
Economic Journal, Vol. 3, No. 2, pp.181-190.
Gleick, P. H. (2008), “Water Conflict Chronology”, Pacific Institute for Studies
in Development, Environment and Security, 11 October 2008.
Herd, R., C. Pigott, and S. Hill (2010), “China‟s Financial Sector Reforms”,
OECD Economic Department Working Paper No. 747.

Nomura | Asia Special Report November 2011
95
Huang, Y. (2010), “China‟s Great Ascendancy and Structural Risks:
Consequences of Asymmetric market Liberalization, Asian-Pacific Economic
Literature, Vol. 24, Issue 1.
Hvistendahl , M. (2011), “Unnatural Selection: Choosing boys over girls, and
the consequences of a world full of men”, Oxford University Press, 2011.
IMF (2004), "Are Credit Booms in Emerging markets a Concern?", Chapter IV,
World Economic Outlook.
IMF (2011a), “People‟s Republic of China: 2011 Article IV Consultation”,
Country Report No. 11/192, July 2011.
IMF (2011b), “People‟s Republic of China: Spillover Report of the 2011 Article
IV Consultation and Selected Issues”, Country Report No. 11/193, July 2011.
IMF (2011c), "Gauging Financial Stability Risks in China", Box 1.5 in Global
Financial Stability Report, September 2011.
Johnson, B. (1998), "Sequencing Capital Account Liberalization", IMF Finance
and Development Magazine, Vol. 35, No. 4, December 1998.
Kaminsky G., C. Reinhart (1999), "The Twin Crises: The Causes of Banking
and Balance-of-payments Problems", American Economic Review, Vol. 89, No.
3, June 1999, PP. 473-500.
Kinoshita T. (2009), “What Japan‟s 1980s experience means for China",
Nomura Asia Special Report, 19 October 2009.
Knight, J., Q. Deng and S. Li (2011), “The Puzzle of Migrant Labour Shortage
and Rural Labor Surplus in China,” China Economic Review (forth-coming).
Kuijs, L. (2009), “China Through 2020 : A Macroeconomic Scenario” World
Bank China Research Working Paper No. 9, June 2009.
Lewis, A. (1954), “Economic Development with Unlimited Supplies of Labour”,
Manchester School of Economics and Social Studies, Vol. 22.
Minami, R. (1973), “The Turning Point in Economic Development: Japan‟s
Experience”, Economic Research Series No. 14, The Institute of Economic
Research Hitotsubashi University.
Minami, R. and X. Ma (2010), “The Lewis Turning Point of Chinese Economy:
Comparison with Japanese Experience”, China Economic Journal, Vol. 3, No.
2, pp.163-179.
Newton, A., R. Subbaraman (2002), “China: Gigantic Possibilities, Present
Realities”, Lehman Brothers, 21 January 2002.
OECD (2010), Economic Survey of China, OECD, Paris.
OECD (2005), Economic Survey of China, OECD, Paris.
Podpiera, R. (2006), “Progress in China‟s Banking Sector Reform: Has Bank
Behavior Changed?”, IMF Working Paper No 06/71.
Pozar, Z., T. Adrian, A. Ashcraft, H. Boesky (2010), “Shadow Banking”,
Federal Reserve Bank of New York Staff Report No. 458, July 2010.
Prasad, E.S. (2007), “Is the Chinese Growth Miracle Built to Last?, The
Institute for the Study of Labor Discussion Paper No. 2995.

Nomura | Asia Special Report November 2011
96
Standard and Poor‟s (2011), “Stress Tests Show a Big Sales Slump Could
Severely Strain the Liquidity of Many Rated Chinese Developers”, Global
Credit Portal, RatingsDirect, 26 September 2011.
Wang, M. (2010), “The Rise of Labor Cost and the Fall of Labor Input: Has
China Reached Lewis Turning Point?” China Economic Journal, Vol. 3, No. 2,
pp.137-153.
World Bank (2008), “Mid-term Evaluation of China‟s 11th Five Year Plan”,
Poverty Reduction and Economic Management Unit, 18 December 2008.
World Bank (2011a), “Securing the Present, Shaping the Future”, World Bank
East Asia and Pacific Economic Update 2011, Volume 1.
World Bank (2011b), “Global Economic Prospects: Maintaining Progress amid
Turmoil”, Volume 3, June 2011
Yeung, G. (2009), “How Banks in China make Lending Decisions”, Journal of
Contemporary China, Vol. 18, No. 59.
Zhiwei, Z., C. Sun and W. Chen (2011), "China: The case for structurally
higher inflation", Asia Special Report, Nomura Global Economics, 21
September 2011.

Nomura | Asia Special Report November 2011
97
Appendix: The Construction of Nomura‟s China Stress Index
From our analysis of China‟s macro challenges and risks, we identified 18
indicators to construct our China Stress Index, or CSI for short. The data are
monthly and start in January 2000. For the indicators that are available only on
a quarterly or annual basis, monthly series were interpolated from the longer
frequency data. CSI is then defined as a weighted average of standardized
indicators as follows:
Where CSIt is the composite CSI level at month t; wi is the weight for
the i-th indicator ; and σi are the sample mean and standard deviation of
the i-th indicator, respectively.
Notes: 1) The return on capital is estimated by % year-on-year nominal GDP growth and the cost of capital is approximated by the benchmark 1yr bank lending rate in % pa; 2) The real 1yr bank deposit rate is calculated by subtracting % y-o-y headline CPI inflation from the nominal 1yr bank deposit rate; 3) Average urban household income of the top 20% income decile as a
ratio to those in the bottom 20% income decile. Source: Nomura.
Indicators Data Frequency
Weighting Direction of increased risk
1 Gross capital formation, % of GDP Annual 10.0% Up
2 Difference between year-on-year growth rates of nominal fixed-asset investment and retail sales Monthly 5.0% Up
3 Real estate investment, % of GDP Monthly 5.0% Up
4 Residential housing starts less sales, 12-month rolling sum
Monthly 5.0% Up
5 Return on capital less cost of capital1 Monthly 5.0% Down
6 Real 1-year bank deposit interest rate2 Monthly 5.0% Down
7 Domestic credit, % of GDP Monthly 10.0% Up
8 Bank reserve requirement ratio, % Monthly 4.0% Up
9 Funding from shadow banking sector, % of total social financing Quarterly 10.0% Up
10 Property loans, % of total loans by official financial institutions
Quarterly 8.0% Up
11 Residential property price, % deviation from long-run linear trend Quarterly 8.0% Up
12 Lending attitude of banks as perceived by industrial enterprises, survey diffusion index Quarterly 3.0% Down
13 Industrial companies liability/asset ratio Quarterly 3.0% Up
14 CPI inflation, % year-on-year Monthly 5.0% Up
15 Inflation expectations, survey diffusion index Quarterly 5.0% Up
16 Industrial waste air emission per capita, cubic meters
Annual 3.0% Up
17 A gauge of urban income inequality3 Annual 3.0% Up
18 Number of nationwide labour disputes / total labor force
Annual 3.0% Up
Chien-Hua Chen
+852 2536 7429
Qilong Zhang
+852 2252 6191
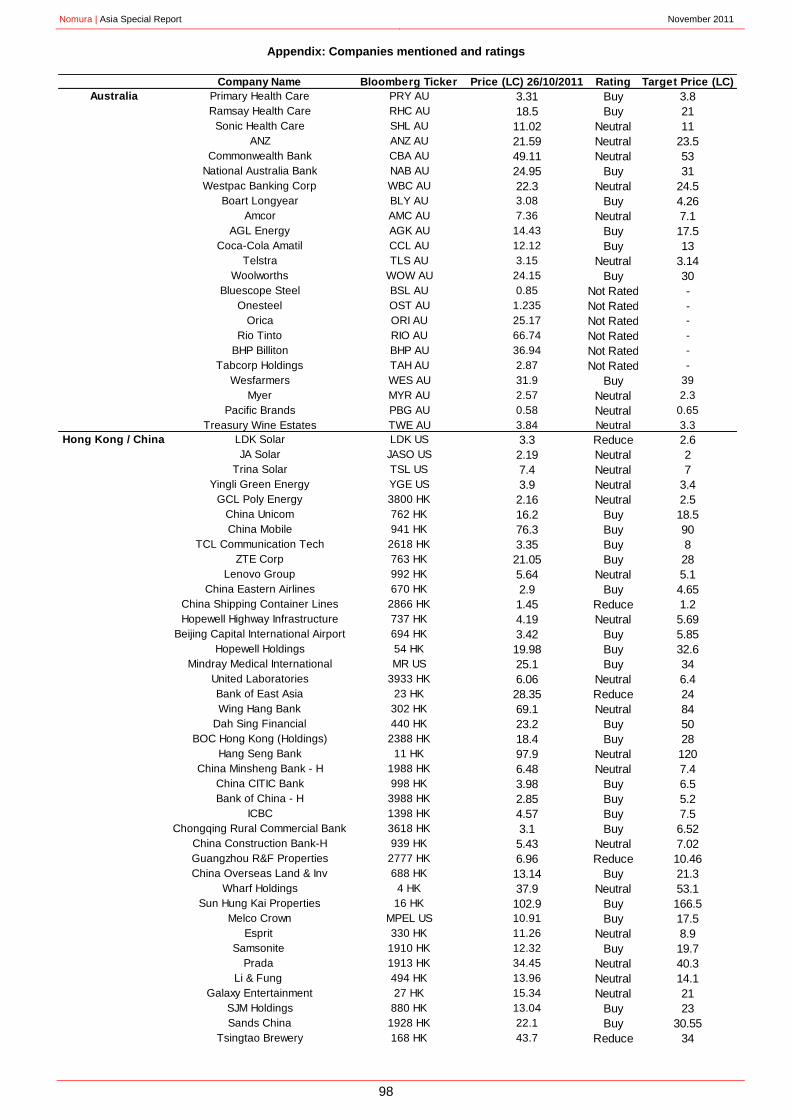
Nomura | Asia Special Report November 2011
98
Appendix: Companies mentioned and ratings
Company Name Bloomberg Ticker Price (LC) 26/10/2011 Rating Target Price (LC)
Australia Primary Health Care PRY AU 3.31 Buy 3.8
Ramsay Health Care RHC AU 18.5 Buy 21
Sonic Health Care SHL AU 11.02 Neutral 11
ANZ ANZ AU 21.59 Neutral 23.5
Commonwealth Bank CBA AU 49.11 Neutral 53
National Australia Bank NAB AU 24.95 Buy 31
Westpac Banking Corp WBC AU 22.3 Neutral 24.5
Boart Longyear BLY AU 3.08 Buy 4.26
Amcor AMC AU 7.36 Neutral 7.1
AGL Energy AGK AU 14.43 Buy 17.5
Coca-Cola Amatil CCL AU 12.12 Buy 13
Telstra TLS AU 3.15 Neutral 3.14
Woolworths WOW AU 24.15 Buy 30
Bluescope Steel BSL AU 0.85 Not Rated -
Onesteel OST AU 1.235 Not Rated -
Orica ORI AU 25.17 Not Rated -
Rio Tinto RIO AU 66.74 Not Rated -
BHP Billiton BHP AU 36.94 Not Rated -
Tabcorp Holdings TAH AU 2.87 Not Rated -
Wesfarmers WES AU 31.9 Buy 39
Myer MYR AU 2.57 Neutral 2.3
Pacific Brands PBG AU 0.58 Neutral 0.65
Treasury Wine Estates TWE AU 3.84 Neutral 3.3
Hong Kong / China LDK Solar LDK US 3.3 Reduce 2.6
JA Solar JASO US 2.19 Neutral 2
Trina Solar TSL US 7.4 Neutral 7
Yingli Green Energy YGE US 3.9 Neutral 3.4
GCL Poly Energy 3800 HK 2.16 Neutral 2.5
China Unicom 762 HK 16.2 Buy 18.5
China Mobile 941 HK 76.3 Buy 90
TCL Communication Tech 2618 HK 3.35 Buy 8
ZTE Corp 763 HK 21.05 Buy 28
Lenovo Group 992 HK 5.64 Neutral 5.1
China Eastern Airlines 670 HK 2.9 Buy 4.65
China Shipping Container Lines 2866 HK 1.45 Reduce 1.2
Hopewell Highway Infrastructure 737 HK 4.19 Neutral 5.69
Beijing Capital International Airport 694 HK 3.42 Buy 5.85
Hopewell Holdings 54 HK 19.98 Buy 32.6
Mindray Medical International MR US 25.1 Buy 34
United Laboratories 3933 HK 6.06 Neutral 6.4
Bank of East Asia 23 HK 28.35 Reduce 24
Wing Hang Bank 302 HK 69.1 Neutral 84
Dah Sing Financial 440 HK 23.2 Buy 50
BOC Hong Kong (Holdings) 2388 HK 18.4 Buy 28
Hang Seng Bank 11 HK 97.9 Neutral 120
China Minsheng Bank - H 1988 HK 6.48 Neutral 7.4
China CITIC Bank 998 HK 3.98 Buy 6.5
Bank of China - H 3988 HK 2.85 Buy 5.2
ICBC 1398 HK 4.57 Buy 7.5
Chongqing Rural Commercial Bank 3618 HK 3.1 Buy 6.52
China Construction Bank-H 939 HK 5.43 Neutral 7.02
Guangzhou R&F Properties 2777 HK 6.96 Reduce 10.46
China Overseas Land & Inv 688 HK 13.14 Buy 21.3
Wharf Holdings 4 HK 37.9 Neutral 53.1
Sun Hung Kai Properties 16 HK 102.9 Buy 166.5
Melco Crown MPEL US 10.91 Buy 17.5
Esprit 330 HK 11.26 Neutral 8.9
Samsonite 1910 HK 12.32 Buy 19.7
Prada 1913 HK 34.45 Neutral 40.3
Li & Fung 494 HK 13.96 Neutral 14.1
Galaxy Entertainment 27 HK 15.34 Neutral 21
SJM Holdings 880 HK 13.04 Buy 23
Sands China 1928 HK 22.1 Buy 30.55
Tsingtao Brewery 168 HK 43.7 Reduce 34
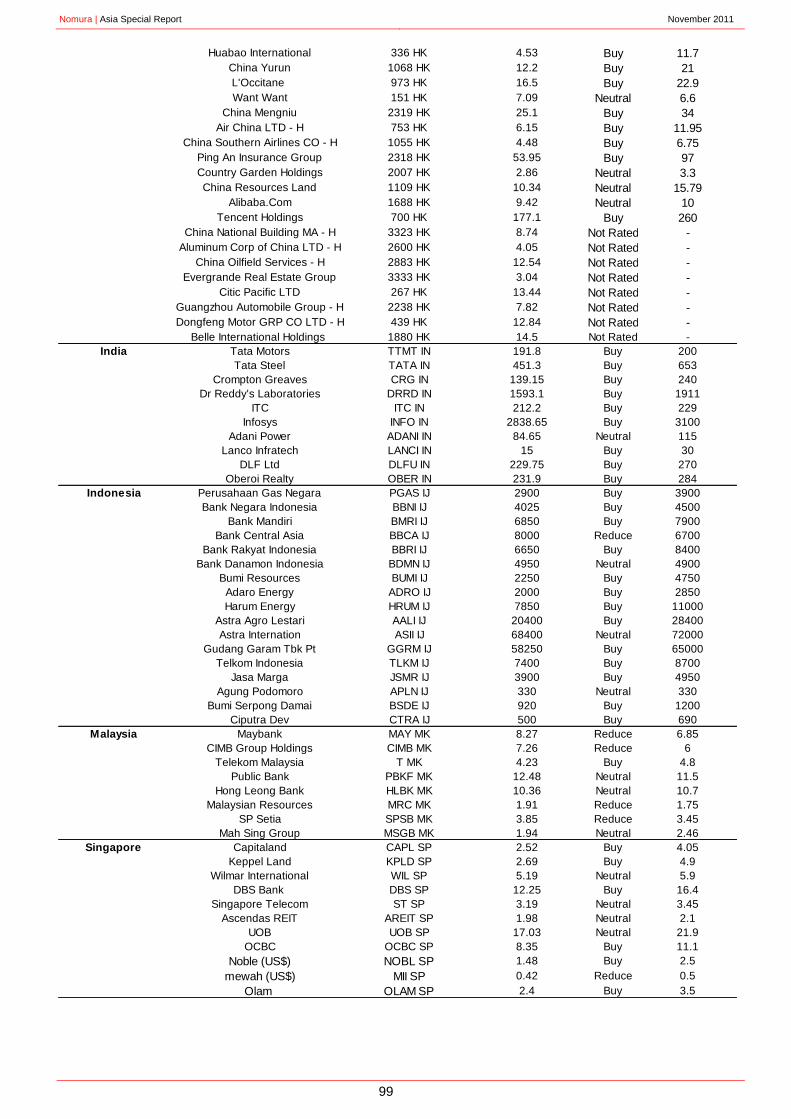
Nomura | Asia Special Report November 2011
99
Huabao International 336 HK 4.53 Buy 11.7
China Yurun 1068 HK 12.2 Buy 21
L'Occitane 973 HK 16.5 Buy 22.9
Want Want 151 HK 7.09 Neutral 6.6
China Mengniu 2319 HK 25.1 Buy 34
Air China LTD - H 753 HK 6.15 Buy 11.95
China Southern Airlines CO - H 1055 HK 4.48 Buy 6.75
Ping An Insurance Group 2318 HK 53.95 Buy 97
Country Garden Holdings 2007 HK 2.86 Neutral 3.3
China Resources Land 1109 HK 10.34 Neutral 15.79
Alibaba.Com 1688 HK 9.42 Neutral 10
Tencent Holdings 700 HK 177.1 Buy 260
China National Building MA - H 3323 HK 8.74 Not Rated -
Aluminum Corp of China LTD - H 2600 HK 4.05 Not Rated -
China Oilfield Services - H 2883 HK 12.54 Not Rated -
Evergrande Real Estate Group 3333 HK 3.04 Not Rated -
Citic Pacific LTD 267 HK 13.44 Not Rated -
Guangzhou Automobile Group - H 2238 HK 7.82 Not Rated -
Dongfeng Motor GRP CO LTD - H 439 HK 12.84 Not Rated -
Belle International Holdings 1880 HK 14.5 Not Rated -
India Tata Motors TTMT IN 191.8 Buy 200
Tata Steel TATA IN 451.3 Buy 653
Crompton Greaves CRG IN 139.15 Buy 240
Dr Reddy's Laboratories DRRD IN 1593.1 Buy 1911
ITC ITC IN 212.2 Buy 229
Infosys INFO IN 2838.65 Buy 3100
Adani Power ADANI IN 84.65 Neutral 115
Lanco Infratech LANCI IN 15 Buy 30
DLF Ltd DLFU IN 229.75 Buy 270
Oberoi Realty OBER IN 231.9 Buy 284
Indonesia Perusahaan Gas Negara PGAS IJ 2900 Buy 3900
Bank Negara Indonesia BBNI IJ 4025 Buy 4500
Bank Mandiri BMRI IJ 6850 Buy 7900
Bank Central Asia BBCA IJ 8000 Reduce 6700
Bank Rakyat Indonesia BBRI IJ 6650 Buy 8400
Bank Danamon Indonesia BDMN IJ 4950 Neutral 4900
Bumi Resources BUMI IJ 2250 Buy 4750
Adaro Energy ADRO IJ 2000 Buy 2850
Harum Energy HRUM IJ 7850 Buy 11000
Astra Agro Lestari AALI IJ 20400 Buy 28400
Astra Internation ASII IJ 68400 Neutral 72000
Gudang Garam Tbk Pt GGRM IJ 58250 Buy 65000
Telkom Indonesia TLKM IJ 7400 Buy 8700
Jasa Marga JSMR IJ 3900 Buy 4950
Agung Podomoro APLN IJ 330 Neutral 330
Bumi Serpong Damai BSDE IJ 920 Buy 1200
Ciputra Dev CTRA IJ 500 Buy 690
Malaysia Maybank MAY MK 8.27 Reduce 6.85
CIMB Group Holdings CIMB MK 7.26 Reduce 6
Telekom Malaysia T MK 4.23 Buy 4.8
Public Bank PBKF MK 12.48 Neutral 11.5
Hong Leong Bank HLBK MK 10.36 Neutral 10.7
Malaysian Resources MRC MK 1.91 Reduce 1.75
SP Setia SPSB MK 3.85 Reduce 3.45
Mah Sing Group MSGB MK 1.94 Neutral 2.46
Singapore Capitaland CAPL SP 2.52 Buy 4.05
Keppel Land KPLD SP 2.69 Buy 4.9
Wilmar International WIL SP 5.19 Neutral 5.9
DBS Bank DBS SP 12.25 Buy 16.4
Singapore Telecom ST SP 3.19 Neutral 3.45
Ascendas REIT AREIT SP 1.98 Neutral 2.1
UOB UOB SP 17.03 Neutral 21.9
OCBC OCBC SP 8.35 Buy 11.1
Noble (US$) NOBL SP 1.48 Buy 2.5
mewah (US$) MII SP 0.42 Reduce 0.5
Olam OLAM SP 2.4 Buy 3.5

Nomura | Asia Special Report November 2011
100
South Korea KEPCO 015760 KS 25100 Buy 35000
LG Display 034220 KS 24200 Neutral 24000
Samsung SDI 006400 KS 139000 Neutral 160000
LG Innotek 011070 KS 75200 Neutral 71000
Woori FG 053000 KS 10300 Buy 18000
KB Financial Group 105560 KS 42150 Buy 62000
Industrial Bank of Korea 024110 KS 14650 Neutral 16000
Hana Financial Group 086790 KS 39400 Buy 54000
KT&G Corp 033780 KS 76700 Neutral 66000
Dongbu Insurance 005830 KS 45900 Buy 71000
SK Telecom 017670 KS 161500 Buy 178000
KT Corp 030200 KS 37700 Buy 53000
LG Uplus Corp 032640 KS 7110 Neutral 6000
Taiwan Asia Cement 1102 TT 36.2 Reduce 32.6
Synnex Technology 2347 TT 73.1 Buy 90
AirTAC 1590 TT 167 Buy 300
Taiwan Mobile 3045 TT 86.5 Buy 102
Formosa International Hotels 2707 TT 455 Buy 550
President Chain Store 2912 TT 173 Buy 205
Motech Industries 6244 TT 59.2 Reduce 39
Acer Inc 2353 TT 35.65 Reduce 27
Yang Ming Marine 2609 TT 12.6 Reduce 7.1
First FHC 2892 TT 19.85 Buy 26.5
E. Sun FHC 2884 TT 14.75 Buy 20
Chinatrust FHC 2891 TT 19.35 Buy 28.3
Huaku Development 2548 TT 68.4 Buy 85
Farglory Land Development 5522 TT 50 Buy 67
Thailand Ratchaburi Generating RATCH TB 39.75 Buy 41
Electricity Generating EGCO TB 80 Buy 110
Bangkok Bank (BBL) BBL TB 143.5 Buy 188
Krungthai Bank (KTB) KTB TB 14.4 Buy 23.2
Kasikorn Bank (KBank) KBANK TB 118.5 Neutral 135
Siam Commercial Bank (SCB) SCB TB 108 Buy 145

Nomura | Asia Special Report November 2011
101
Important Conflicts Disclosures Relating to Sales or Trading Desk Material
Investors should be aware that Nomura engages or may engage in the following activities, which present conflicts of interest:
♦ The person distributing sales or trading desk material may have previously provided any ideas and strategies discussed in it to Nomura‟s traders, who may already have acted on them.
♦ Nomura does and seeks to do business with the companies referred to in sales or trading desk materials. Nomura and its officers, directors, partners and employees, including persons involved in the preparation or issuance of this material (subject to company policy), may from time to time maintain a long or short position in, or purchase or sell a position in, hold or act as market-makers or advisors, brokers or commercial and/or investment bankers in relation to the products discussed in sales or trading desk materials or in securities (or related securities, financial products, options, warrants, rights or derivatives), of companies mentioned in trading desk materials or be represented on the board of such companies. For securities or products recommended by a member of a sales or trading desk in which Nomura is not a market maker, Nomura usually provides bids and offers and may act as principal in connection with transactions involving such securities or products. Nomura may engage in these transactions in a manner that is inconsistent with or contrary to any recommendations made in sales or trading desk material.
♦ Members of a sales or trading desk are compensated based on, among other things, the profitability of Nomura‟s underwriting, sales and trading activity in securities or products of the relevant asset class, its fixed income department and its overall profitability.
♦ The person who prepares trading desk material and his or her household members are not permitted to own the securities, products or financial instruments mentioned.
♦ Nomura, through different sales or trading desks or its fixed income research department, may have issued, and may in the future issue, other reports that are inconsistent with, and reach different conclusions from the information presented. Those reports reflect the different assumptions, views and analytical methods of the persons who prepared them and Nomura is under no obligation to bring them to the attention of recipients of this communication.
Disclaimer Relating to Sales or Trading Desk Material
This material has been compiled by a Nomura Group sales or trading desk, and is made available to you through one of Nomura Group‟s global securities affiliates. “Nomura Group” is the global marketing name of Nomura Holdings, Inc. (Tokyo) and its direct and indirect subsidiaries worldwide. This information is neither investment research nor a research recommendation, and may not be relied upon as such. The desk‟s opinions may differ from views of Nomura Group's research department. This material is: (i) for your private information only, and we are not soliciting any action based upon it; (ii) not to be construed as an offer to sell or a solicitation to buy any security or financial instrument in any jurisdiction where such offer or solicitation may be illegal; and (iii) is based upon information that we consider reliable, however it should not be relied upon as such. All projections, valuations and statistical analyses are provided to assist the recipient in the evaluation of the matters described herein and, to the extent that they are based on historical information, should not be relied upon as an accurate prediction of future performance. Any prices, yields and opinions expressed are current opinions as of the date appearing on this material only and are subject to change without notice. Additional, important disclaimer information should be reviewed by following this link: http://www.nomura.com/americas/fi-disclaimer.shtml.
Nomura | Asia Special Report November 2011
102
Disclosure Appendix A-1
Any Authors named on this report are Research Analysts unless otherwise indicated
Analyst Certification
Each research analyst identified herein certifies that all of the views expressed in this report by such analyst accurately reflect his or her personal views about the subject securities and issuers. In addition, each research analyst identified on the cover page hereof hereby certifies that no part of his or her compensation was, is, or will be, directly or indirectly related to the specific recommendations or views that he or she has expressed in this research report, nor is it tied to any specific investment banking transactions performed by Nomura Securities International, Inc., Nomura International plc or any other Nomura Group company.
Important Disclosures Conflict-of-interest disclosures Important disclosures may be accessed through the following website: http://go.nomuranow.com/research/globalresearchportal/pages/disclosures/disclosures.aspx . If you have difficulty with this site or you do not have a password, please contact your Nomura Securities International, Inc. salesperson (1-877-865-5752) or email [email protected] for assistance. Online availability of research and additional conflict-of-interest disclosures Nomura Equity Research is available on nomuranow.com, Bloomberg, Capital IQ, Factset, Reuters and ThomsonOne. Important disclosures may be accessed through the left hand side of the Nomura Disclosure web page http://go.nomuranow.com/research/globalresearchportal or requested from Nomura Securities International, Inc., on 1-877-865-5752. If you have any difficulties with the website, please email [email protected] for technical assistance. The analysts responsible for preparing this report have received compensation based upon various factors including the firm's total revenues, a portion of which is generated by Investment Banking activities. Unless otherwise noted, the non-US analysts listed at the front of this report are not registered/qualified as research analysts under FINRA/NYSE rules, may not be associated persons of NSI, and may not be subject to FINRA Rule 2711 and NYSE Rule 472 restrictions on communications with covered companies, public appearances, and trading securities held by a research analyst account. Industry Specialists identified in some Nomura International plc research reports are employees within the Firm who are responsible for the sales and trading effort in the sector for which they have coverage. Industry Specialists do not contribute in any manner to the content of research reports in which their names appear. Marketing Analysts identified in some Nomura research reports are research analysts employed by Nomura International plc who are primarily responsible for marketing Nomura‟s Equity Research product in the sector for which they have coverage. Marketing Analysts may also contribute to research reports in which their names appear and publish research on their sector. Distribution of ratings (Global) The distribution of all ratings published by Nomura Global Equity Research is as follows: 49% have been assigned a Buy rating which, for purposes of mandatory disclosures, are classified as a Buy rating; 41% of companies with this rating are investment banking clients of the Nomura Group*. 41% have been assigned a Neutral rating which, for purposes of mandatory disclosures, is classified as a Hold rating; 50% of companies with this rating are investment banking clients of the Nomura Group*. 10% have been assigned a Reduce rating which, for purposes of mandatory disclosures, are classified as a Sell rating; 20% of companies with this rating are investment banking clients of the Nomura Group*. As at 30 September 2011. *The Nomura Group as defined in the Disclaimer section at the end of this report. Explanation of Nomura's equity research rating system in Europe, Middle East and Africa, US and Latin America for ratings published from 27 October 2008 The rating system is a relative system indicating expected performance against a specific benchmark identified for each individual stock. Analysts may also indicate absolute upside to target price defined as (fair value - current price)/current price, subject to limited management discretion. In most cases, the fair value will equal the analyst's assessment of the current intrinsic fair value of the stock using an appropriate valuation methodology such as discounted cash flow or multiple analysis, etc. Stocks A rating of 'Buy', indicates that the analyst expects the stock to outperform the Benchmark over the next 12 months. A rating of 'Neutral', indicates that the analyst expects the stock to perform in line with the Benchmark over the next 12 months. A rating of 'Reduce', indicates that the analyst expects the stock to underperform the Benchmark over the next 12 months. A rating of 'Suspended', indicates that the rating, target price and estimates have been suspended temporarily to comply with applicable regulations and/or firm policies in certain circumstances including, but not limited to, when Nomura is acting in an advisory capacity in a merger or strategic transaction involving the company. Benchmarks are as follows: United States/Europe: Please see valuation methodologies for explanations of relevant benchmarks for stocks (accessible through the left hand side of the Nomura Disclosure web page: http://go.nomuranow.com/research/globalresearchportal);Global Emerging Markets (ex-Asia): MSCI Emerging Markets ex-Asia, unless otherwise stated in the valuation methodology. Sectors A 'Bullish' stance, indicates that the analyst expects the sector to outperform the Benchmark during the next 12 months. A 'Neutral' stance, indicates that the analyst expects the sector to perform in line with the Benchmark during the next 12 months. A 'Bearish' stance, indicates that the analyst expects the sector to underperform the Benchmark during the next 12 months. Benchmarks are as follows: United States: S&P 500; Europe: Dow Jones STOXX 600; Global Emerging Markets (ex-Asia): MSCI Emerging Markets ex-Asia. Explanation of Nomura's equity research rating system for Asian companies under coverage ex Japan published from 30 October 2008 and in Japan from 6 January 2009 Stocks Stock recommendations are based on absolute valuation upside (downside), which is defined as (Target Price - Current Price) / Current Price, subject to limited management discretion. In most cases, the Target Price will equal the analyst's 12-month intrinsic valuation of the stock, based on an appropriate valuation methodology such as discounted cash flow, multiple analysis, etc. A 'Buy' recommendation indicates that potential upside is 15% or more. A 'Neutral' recommendation indicates that potential upside is less than 15% or downside is less than 5%. A 'Reduce' recommendation indicates that potential downside is 5% or more. A rating of 'Suspended' indicates that the rating and target price have been suspended temporarily to comply with applicable regulations and/or firm policies in certain circumstances including when Nomura is acting in an advisory capacity in a merger or strategic transaction involving the subject company. Securities and/or companies that are labelled as 'Not rated' or shown as 'No rating' are not in regular research coverage of the Nomura entity identified in the top banner. Investors should not expect continuing or additional information from Nomura relating to such securities and/or companies. Sectors A 'Bullish' rating means most stocks in the sector have (or the weighted average recommendation of the stocks under coverage is) a positive absolute recommendation. A 'Neutral' rating means most stocks in the sector have (or the weighted average recommendation of the stocks

Nomura | Asia Special Report November 2011
103
under coverage is) a neutral absolute recommendation. A 'Bearish' rating means most stocks in the sector have (or the weighted average recommendation of the stocks under coverage is) a negative absolute recommendation. Explanation of Nomura's equity research rating system in Japan published prior to 6 January 2009 (and ratings in Europe, Middle East and Africa, US and Latin America published prior to 27 October 2008) Stocks A rating of '1' or 'Strong buy', indicates that the analyst expects the stock to outperform the Benchmark by 15% or more over the next six months. A rating of '2' or 'Buy', indicates that the analyst expects the stock to outperform the Benchmark by 5% or more but less than 15% over the next six months. A rating of '3' or 'Neutral', indicates that the analyst expects the stock to either outperform or underperform the Benchmark by less than 5% over the next six months. A rating of '4' or 'Reduce', indicates that the analyst expects the stock to underperform the Benchmark by 5% or more but less than 15% over the next six months. A rating of '5' or 'Sell', indicates that the analyst expects the stock to underperform the Benchmark by 15% or more over the next six months. Stocks labeled 'Not rated' or shown as 'No rating' are not in Nomura's regular research coverage. Nomura might not publish additional research reports concerning this company, and it undertakes no obligation to update the analysis, estimates, projections, conclusions or other information contained herein. Sectors A 'Bullish' stance, indicates that the analyst expects the sector to outperform the Benchmark during the next six months. A 'Neutral' stance, indicates that the analyst expects the sector to perform in line with the Benchmark during the next six months. A 'Bearish' stance, indicates that the analyst expects the sector to underperform the Benchmark during the next six months. Benchmarks are as follows: Japan: TOPIX; United States: S&P 500, MSCI World Technology Hardware & Equipment; Europe, by sector - Hardware/Semiconductors: FTSE W Europe IT Hardware; Telecoms: FTSE W Europe Business Services; Business Services: FTSE W Europe; Auto & Components: FTSE W Europe Auto & Parts; Communications equipment: FTSE W Europe IT Hardware; Ecology Focus: Bloomberg World Energy Alternate Sources; Global Emerging Markets: MSCI Emerging Markets ex-Asia. Explanation of Nomura's equity research rating system for Asian companies under coverage ex Japan published prior to 30 October 2008 Stocks Stock recommendations are based on absolute valuation upside (downside), which is defined as (Fair Value - Current Price)/Current Price, subject to limited management discretion. In most cases, the Fair Value will equal the analyst's assessment of the current intrinsic fair value of the stock using an appropriate valuation methodology such as Discounted Cash Flow or Multiple analysis etc. However, if the analyst doesn't think the market will revalue the stock over the specified time horizon due to a lack of events or catalysts, then the fair value may differ from the intrinsic fair value. In most cases, therefore, our recommendation is an assessment of the difference between current market price and our estimate of current intrinsic fair value. Recommendations are set with a 6-12 month horizon unless specified otherwise. Accordingly, within this horizon, price volatility may cause the actual upside or downside based on the prevailing market price to differ from the upside or downside implied by the recommendation. A 'Strong buy' recommendation indicates that upside is more than 20%. A 'Buy' recommendation indicates that upside is between 10% and 20%. A 'Neutral' recommendation indicates that upside or downside is less than 10%. A 'Reduce' recommendation indicates that downside is between 10% and 20%. A 'Sell' recommendation indicates that downside is more than 20%. Sectors A 'Bullish' rating means most stocks in the sector have (or the weighted average recommendation of the stocks under coverage is) a positive absolute recommendation. A 'Neutral' rating means most stocks in the sector have (or the weighted average recommendation of the stocks under coverage is) a neutral absolute recommendation. A 'Bearish' rating means most stocks in the sector have (or the weighted average recommendation of the stocks under coverage is) a negative absolute recommendation. Target Price A Target Price, if discussed, reflect in part the analyst's estimates for the company's earnings. The achievement of any target price may be impeded by general market and macroeconomic trends, and by other risks related to the company or the market, and may not occur if the company's earnings differ from estimates. Disclaimers
This document contains material that has been prepared by the Nomura entity identified at the top or bottom of page 1 herein, if any, and/or, with the sole or joint contributions of one or more Nomura entities whose employees and their respective affiliations are specified on page 1 herein or identified elsewhere in the document. Affiliates and subsidiaries of Nomura Holdings, Inc. (collectively, the 'Nomura Group'), include: Nomura Securities Co., Ltd. ('NSC') Tokyo, Japan; Nomura International plc ('NIplc'), UK; Nomura Securities International, Inc. ('NSI'), New York, US; Nomura International (Hong Kong) Ltd. („NIHK‟), Hong Kong; Nomura Financial Investment (Korea) Co., Ltd. („NFIK‟), Korea (Information on Nomura analysts registered with the Korea Financial Investment Association ('KOFIA') can be found on the KOFIA Intranet at http://dis.kofia.or.kr ); Nomura Singapore Ltd. („NSL‟), Singapore (Registration number 197201440E, regulated by the Monetary Authority of Singapore); Capital Nomura Securities Public Company Limited („CNS‟), Thailand; Nomura Australia Ltd. („NAL‟), Australia (ABN 48 003 032 513), regulated by the Australian Securities and Investment Commission ('ASIC') and holder of an Australian financial services licence number 246412; P.T. Nomura Indonesia („PTNI‟), Indonesia; Nomura Securities Malaysia Sdn. Bhd. („NSM‟), Malaysia; Nomura International (Hong Kong) Ltd., Taipei Branch („NITB‟), Taiwan; Nomura Financial Advisory and Securities (India) Private Limited („NFASL‟), Mumbai, India (Registered Address: Ceejay House, Level 11, Plot F, Shivsagar Estate, Dr. Annie Besant Road, Worli, Mumbai- 400 018, India; Tel: +91 22 4037 4037, Fax: +91 22 4037 4111; SEBI Registration No: BSE INB011299030, NSE INB231299034, INF231299034, INE 231299034, MCX: INE261299034); Banque Nomura France („BNF‟), regulated by the Autorité des marches financiers and the Autorité de Contrôle Prudentiel; NIplc, Dubai Branch („NIplc, Dubai‟); NIplc, Madrid Branch („NIplc, Madrid‟) and NIplc, Italian Branch („NIplc, Italy‟). This material is: (i) for your private information, and we are not soliciting any action based upon it; (ii) not to be construed as an offer to sell or a solicitation of an offer to buy any security in any jurisdiction where such offer or solicitation would be illegal; and (iii) based upon information from sources that we consider reliable, but has not been independently verified by Nomura Group. Nomura Group does not warrant or represent that the document is accurate, complete, reliable, fit for any particular purpose or merchantable and does not accept liability for any act (or decision not to act) resulting from use of this document and related data. To the maximum extent permissible all warranties and other assurances by Nomura group are hereby excluded and Nomura Group shall have no liability for the use, misuse, or distribution of this information. Opinions or estimates expressed are current opinions as of the original publication date appearing on this material and the information, including the opinions and estimates contained herein, are subject to change without notice. Nomura Group is under no duty to update this document. Any comments or statements made herein are those of the author(s) and may differ from views held by other parties within Nomura Group. Clients should consider whether any advice or recommendation in this report is suitable for their particular circumstances and, if appropriate, seek professional advice, including tax advice. Nomura Group does not provide tax advice. Nomura Group, and/or its officers, directors and employees, may, to the extent permitted by applicable law and/or regulation, deal as principal, agent, or otherwise, or have long or short positions in, or buy or sell, the securities, commodities or instruments, or options or other derivative instruments based thereon, of issuers or securities mentioned herein. Nomura Group companies may also act as market maker or liquidity provider (as defined within Financial Services Authority („FSA‟) rules in the UK) in the financial instruments of the issuer. Where the activity of

Nomura | Asia Special Report November 2011
104
market maker is carried out in accordance with the definition given to it by specific laws and regulations of the US or other jurisdictions, this will be separately disclosed within the specific issuer disclosures. This document may contain information obtained from third parties, including ratings from credit ratings agencies such as Standard & Poor‟s. Reproduction and distribution of third party content in any form is prohibited except with the prior written permission of the related third party. Third party content providers do not guarantee the accuracy, completeness, timeliness or availability of any information, including ratings, and are not responsible for any errors or omissions (negligent or otherwise), regardless of the cause, or for the results obtained from the use of such content. Third party content providers give no express or implied warranties, including, but not limited to, any warranties of merchantability or fitness for a particular purpose or use. Third party content providers shall not be liable for any direct, indirect, incidental, exemplary, compensatory, punitive, special or consequential damages, costs, expenses, legal fees, or losses (including lost income or profits and opportunity costs) in connection with any use of their content, including ratings. Credit ratings are statements of opinions and are not statements of fact or recommendations to purchase hold or sell securities. They do not address the suitability of securities or the suitability of securities for investment purposes, and should not be relied on as investment advice. Any MSCI sourced information in this document is the exclusive property of Morgan Stanley Capital International Inc. („MSCI‟). Without prior written permission of MSCI, this information and any other MSCI intellectual property may not be reproduced, re-disseminated or used to create any financial products, including any indices. This information is provided on an "as is" basis. The user assumes the entire risk of any use made of this information. MSCI, its affiliates and any third party involved in, or related to, computing or compiling the information hereby expressly disclaim all warranties of originality, accuracy, completeness, merchantability or fitness for a particular purpose with respect to any of this information. Without limiting any of the foregoing, in no event shall MSCI, any of its affiliates or any third party involved in, or related to, computing or compiling the information have any liability for any damages of any kind. MSCI, Morgan Stanley Capital International and the MSCI indexes are services marks of MSCI and its affiliates. Investors should consider this document as only a single factor in making their investment decision and, as such, the report should not be viewed as identifying or suggesting all risks, direct or indirect, that may be associated with any investment decision. Nomura Group produces a number of different types of research product including, among others, fundamental analysis, quantitative analysis and short term trading ideas; recommendations contained in one type of research product may differ from recommendations contained in other types of research product, whether as a result of differing time horizons, methodologies or otherwise. Nomura Group publishes research product in a number of different ways including the posting of product on Nomura Group portals and/or distribution directly to clients. Different groups of clients may receive different products and services from the research department depending on their individual requirements. Figures presented herein may refer to past performance or simulations based on past performance which are not reliable indicators of future performance. Where the information contains an indication of future performance, such forecasts may not be a reliable indicator of future performance. Moreover, simulations are based on models and simplifying assumptions which may oversimplify and not reflect the future distribution of returns. Certain securities are subject to fluctuations in exchange rates that could have an adverse effect on the value or price of, or income derived from, the investment. The securities described herein may not have been registered under the US Securities Act of 1933 (the „1933 Act‟), and, in such case, may not be offered or sold in the US or to US persons unless they have been registered under the 1933 Act, or except in compliance with an exemption from the registration requirements of the 1933 Act. Unless governing law permits otherwise, any transaction should be executed via a Nomura entity in your home jurisdiction. This document has been approved for distribution in the UK and European Economic Area as investment research by NIplc, which is authorized and regulated by the FSA and is a member of the London Stock Exchange. It does not constitute a personal recommendation, as defined by the FSA, or take into account the particular investment objectives, financial situations, or needs of individual investors. It is intended only for investors who are 'eligible counterparties' or 'professional clients' as defined by the FSA, and may not, therefore, be redistributed to retail clients as defined by the FSA. This document has been approved by NIHK, which is regulated by the Hong Kong Securities and Futures Commission, for distribution in Hong Kong by NIHK. This document has been approved for distribution in Australia by NAL, which is authorized and regulated in Australia by the ASIC. This document has also been approved for distribution in Malaysia by NSM. In Singapore, this document has been distributed by NSL. NSL accepts legal responsibility for the content of this document, where it concerns securities, futures and foreign exchange, issued by their foreign affiliates in respect of recipients who are not accredited, expert or institutional investors as defined by the Securities and Futures Act (Chapter 289). Recipients of this document in Singapore should contact NSL in respect of matters arising from, or in connection with, this document. Unless prohibited by the provisions of Regulation S of the 1933 Act, this material is distributed in the US, by NSI, a US-registered broker-dealer, which accepts responsibility for its contents in accordance with the provisions of Rule 15a-6, under the US Securities Exchange Act of 1934. This document has not been approved for distribution in the Kingdom of Saudi Arabia („Saudi Arabia‟) or to clients other than 'professional clients' in the United Arab Emirates („UAE‟) by Nomura Saudi Arabia, NIplc or any other member of Nomura Group, as the case may be. Neither this document nor any copy thereof may be taken or transmitted or distributed, directly or indirectly, by any person other than those authorised to do so into Saudi Arabia or in the UAE or to any person located in Saudi Arabia or to clients other than 'professional clients' in the UAE. By accepting to receive this document, you represent that you are not located in Saudi Arabia or that you are a 'professional client' in the UAE and agree to comply with these restrictions. Any failure to comply with these restrictions may constitute a violation of the laws of Saudi Arabia or the UAE. No part of this material may be (i) copied, photocopied, or duplicated in any form, by any means; or (ii) redistributed without the prior written consent of a member of Nomura Group. Further information on any of the securities mentioned herein may be obtained upon request. If this document has been distributed by electronic transmission, such as e-mail, then such transmission cannot be guaranteed to be secure or error-free as information could be intercepted, corrupted, lost, destroyed, arrive late or incomplete, or contain viruses. The sender therefore does not accept liability for any errors or omissions in the contents of this document, which may arise as a result of electronic transmission. If verification is required, please request a hard-copy version. Nomura Group manages conflicts with respect to the production of research through its compliance policies and procedures (including, but not limited to, Conflicts of Interest, Chinese Wall and Confidentiality policies) as well as through the maintenance of Chinese walls and employee training.
Additional information is available upon request. Disclosure information is available at the Nomura Disclosure web page: http://go.nomuranow.com/research/globalresearchportal/pages/disclosures/disclosures.aspx