Embed Size (px)
Citation preview

Still an open road
China wind
Joseph Lam, CFA – NIHK+852 2252 [email protected]
Thomas Tang – NIHK+852 2252 [email protected]
Scott Chui – NIHK+852 2252 [email protected]
June 2014
Connecting Markets East & West
See Appendix A-1 for analyst certification, important disclosures and the status of non-US analysts.
Any authors named on this report are research analysts unless otherwise indicated.
Equity Research

Stocks for action – Overall bmanufacturers to operators
Stocks for action
Source: Bloomberg, Nomura research. Pricing as on 17 June 2014
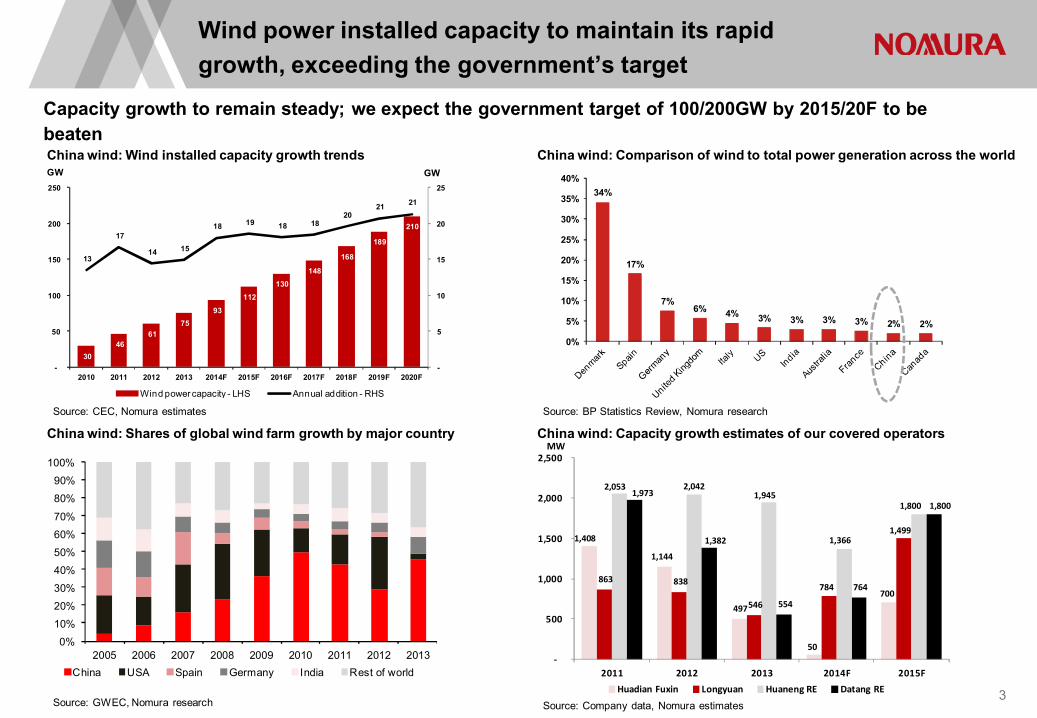
Positive on sector fundamentals, given: Strong wind power capacity growth ahead, with the 12th FYP wind cap
112/210GW). Continuous improvement in the wind curtailment issue, with the accele
release of Renewable Portfolio Standard, as well as other government Prefer wind equipment to wind farm operators
Wind equipment makers as the direct beneficiary with immediate earni Wind farm operators can also benefit from the recovery in wind sector f
contribution, as well as a potential wind power tariff cut. Prefer mixed players given their solid cash inflow and diversified risk
Quality cash inflows generated from traditional fuel sources (coal/hydro Diversify the policy/climate risk on single fuel source.
Stock picks: CHST (658 HK) – Positioned as an industrial conglomerate: 1) the recove
y-y in 2014F); and 2) a turnaround for loss-making new businesses (includ Huadian Fuxin (816 HK) – A diversified and well balanced portfolio across
universe, with strong capacity growth ahead (17.6% 2013-15 CAGR across
Company Ticker RatingWind equipmentCHST 658 HK Buy 7.30 Goldw ind 2208 HK Buy 9.67
Wind operatorsHuadian Fuxin 816 HK Buy 5.30 China Longyuan 916 HK Buy 9.50 Huaneng RE 958 HK Buy 2.90 Datang RE 1798 HK Reduce 1.00
Price target (HKD)
1
bullish, prefer equipment
pacity target of 100/200GW by 2015/20F likely to be beaten (our estimate of
ration of UHV transmission lines’ construction and approval, potential policies regarding clean energy.
ngs impact for wind power capacity growth.fundamentals, but this requires capex investment first before any earnings
k portfolio: o/nuclear) support the rapid growth of renewable business (wind/solar)
ry of the wind gearbox business with strong sales volume growth ahead (at 23.3% ing CNC and LED sapphire substrates) in 2014F.s different fuel mix (wind, hydro, coal, nuclear, etc.), which is unique in the s different fuel types). Relatively low equity financing risk.

China wind: Major sector-specific news flow and regulatory development/
Source: Nomura research
4 Dec 2012MOF announced supplemental renewable tariff payment for Oct 2010 - Apr 2011
12 Dec 2012MOF announced advances for supplemental renewable tariff in 2012
18 Dec 2012Supplemental 2nd batch preliminary approval for wind power projects (8.5GW)
8 Jan 2013NEA targets to add 18GW wind power capacity in 2013
25 Jan 2013SREC established surplus wind power trading mechanism from Northeast China to North China
1 Feb 2013SERC requested higher wind/solar power dispatch to alleviate pollution levels
10 Mar 2013NEA andSERC merged under NEA
19 Mar 2013- 3rd batch preliminary approval for wind power projects (28.7GW)- NEA announced that it will take measures to promote wind power dispatch in 2013
22 Mar 2013NEA announced initiatives to promote heat generation using wind power
4 Apr MoF aadvancsupplerenew(unspe
24N20inof
Continuous governmental su
2
/proposals
14 Apr 2014NEA published notice to urge related parties to secure the absorption of wind power output
2013announced ces for emental
wable tariff ecified period)
4 Jan 2014EA released014 wind power nstallation target f 18GW
28 Feb 20144th batch preliminary approval for wind power projects (27.6GW)
15 May 2013NEA delegated wind power approval authority to local governments
13 Sep 2013State Council published the Action Plan of Air Pollution Control, promoting clean energy
4 Jun 2014NEA signed task paper with State Grid and South Grid to promote the construction of 12 new UHV lines
16 May 2014NDRC published the notice to push the air pollution control in energy industry, with 2015/17 wind capacity target of 100/150GW
upport and favorable policies
30 46
61 75
93
112 130
148
168
189
210
13
17
14 15
18 19 18 18 20
21 21
-
5
10
15
20
25
-
50
100
150
200
250
2010 2011 2012 2013 2014F 2015F 2016F 2017F 2018F 2019F 2020F
GWGW
Wind power capacity - LHS Annual addition - RHS
Wind power installed capacigrowth, exceeding the gover
Capacity growth to remain steady; we expect the govebeatenChina wind: Wind installed capacity growth trends
Source: CEC, Nomura estimates
China wind: Shares of global wind farm growth by major country
Source: GWEC, Nomura research
0%
10%
20%
30%
40%
50%
60%
70%
80%
90%
100%
2005 2006 2007 2008 2009 2010 2011 2012 2013China USA Spain Germany India Rest of world
34%
17%
7%6% 4% 3% 3% 3% 3% 2% 2%
0%
5%
10%
15%
20%
25%
30%
35%
40%
1,408
1,144
497
50
700 863 838
546
784
1,499
2,053 2,042 1,945
1,366
1,800 1,973
1,382
554
764
1,800
‐
500
1,000
1,500
2,000
2,500
2011 2012 2013 2014F 2015F
MW
Huadian Fuxin Longyuan Huaneng RE Datang RE
ty to maintain its rapid rnment’s target
ernment target of 100/200GW by 2015/20F to be
3
China wind: Comparison of wind to total power generation across the world
Source: BP Statistics Review, Nomura research
China wind: Capacity growth estimates of our covered operators
Source: Company data, Nomura estimates

To avoid curtailment, and to enjoy the higher FiT, wind capacitYunnan, Guizhou, Guangdong, Fujian provinces.
China wind: Map of China’s wind resources and each provinces’ share of China’s total 75.5GW end-2013 cumulative wind installed capacity
Source: CEC, GWEC, Nomura research
Hainan0.4
Inner Mongolia23.8
Beijing0.2
Hebei10.4
Tianjin0.3
Jiangs3.4Anhui
0.7Zhejia
0.6
Henan0.4
Hubei0.5
Shaanxi0.8
Ningxia4.0
Qinghai0.1
Xinjiang6.6
TibetSichuan
0.1
Yunnan2.2 Guangxi
0.5
Guizhou1.8
Fujian1.9
Hunan0.4
Jiangxi0.4
Shanxi4.2 Shandong
6.6
Taiw
Liao7.
Guangdong2.2
Chongqing0.1
Gansu9.3
Wind Power Density
200 w/m2 (high)
150-200 w/m2
100-150 w/m2
50-100 w/m2
50 w/m2 (low)
Numbers are in % of 2013 national wind power installed capacity
From North to South - The gcapacity growth tilted
ty addition has gradually migrated to southern regions such as
4
China wind: Total 4 batches of preliminary approved projects breakdown by regions
Source: NEA, CEC, Nomura research
China wind: Capacity growth by regions – 2013 and 1Q14
Source: CEC, Nomura research
Jilin5.0
u
Shanghai0.4
ang6
wan
Heilongjiang5.2
ning5
8,550 5,680 6,163 5,546
8,870
980 491 804
1,760
3,778 3,732 3,955
1,480
4,340 3,693 5,569
2,100
4,420 6,101 4,314
4,070
3,370
7,808 7,409
0
5,000
10,000
15,000
20,000
25,000
30,000
1st batch 2nd batch 3rd batch 4th batch
MW
Northern China Northeatern China Eastern ChinaCentral China Southern China Northwestern China
26,830
22,568
27,986 27,597
Region 2013 Capacity grow th 1Q14 Capacity growthNorthern China 17.8% 4.4%Northeatern China 13.8% 2.6%Eastern China 32.3% 5.6%Central China 125.0% 22.4%Southern China 39.1% 4.0%Northw estern China 32.0% 12.8%
geographical mix of wind

China wind: National installed and grid connected wind power generation capacity (2006-2013)
Source: GWEC, CEC, Nomura research
China wind : Annual wind farm installations by province (2009-13)
Source: CEC, Nomura research
0%
10%
20%
30%
40%
50%
60%
70%
80%
90%
100%
2009 2010 2011 2012 2013Inner Mong Gansu Liaoning Jilin Heilongjiang HebeiShandong Xinjiang Jiangsu Ningxia Shanxi GuangdongFujian Yunnan Zhejiang Others
2 49
16
30
45
61
75
3 612
26
45
62
75
91
23%
32%
25%
38%34%
28%
19%17%
0%
10%
20%
30%
40%
0
20
40
60
80
100
2006 2007 2008 2009 2010 2011 2012 2013
%GW Grid connected capacity (LHS)Installed capacity (LHS)% of capacity unconnected (RHS)
Wind supply and demand an
5
China: Power generation surplus over local power demand by province (2013)
Source: CEC, Nomura research
China wind: Wind farm operators current installed capacity by region
Source: NDRC, Nomura research
-150
-100
-50
0
50
100
150
bn kWh
19%
28%
44%
33%
21%
20%
24%
18%
40%
33%
21%
42%
20%
20%
11%
6%
0% 20% 40% 60% 80% 100%
Longyuan
Huaneng RE
Datang RE
Huadian Fuxin
In. Mongolia Northeastern Central and western Southeastern coastline
nalysis

China wind: Annual wind capacity installation by region
Source: LY, HN RE, DT RE, Nomura research
China wind: Annual wind power generation mix by region
Note: Huadian Fuxin does not disclose its annual power generation by regionsSource: Company data, Nomura research
512233
444 491248 110
338 892 341 297
147
38
214
647
849 744
1,075
913
140
230 419 510476
306
0
500
1,000
1,500
2,000
2,500
2008 2009 2010 2011 2012 2013
MW Longyuan
Inner Mongolia Northeastern
Central and Western Southeastern Coastline
0 0 0 0199 24950 63297
393
80
0
500
1,000
1,500
2,000
2,500
2008 2009 2010 2011 2012 2013
MW Huadian Fuxin
Inner Mongolia Northeastern
Central and Western Southeastern Coastline
19% 23% 29%22% 20% 23%
19%
30%29%
31% 28% 21%
31%
25% 21%18% 21% 33%
30%21% 20%
30% 31%23%
0%
10%
20%
30%
40%
50%
60%
70%
80%
90%
100%
2007 2008 2009 2010 2011 2012
LongyuanInner Mongolia NortheasternCentral and Western Southeastern Coastline
14%
35% 38%23%26%
41%
31% 24%
24%6%
11%
9% 17%
31%
100%
68%
33%24% 21% 23%
0%
10%
20%
30%
40%
50%
60%
70%
80%
90%
100%
2007 2008 2009 2010 2011 2012
Huaneng REInner Mongolia NortheasternCentral and Western Southeastern Coastline
Wind farm operators’ strateg
6
e
593
975
1490101
401
299
299
50 9998
387
678
306
56675
155
312
257
198
99
0
500
1,000
1,500
2,000
2,500
2008 2009 2010 2011 2012 2013
MW Huaneng RE
Inner Mongolia Northeastern
Central and Western Southeastern Coastline
527 494 399 293149 50
179 249 402
200
9899
95 50
379
342
19850
50 59
230
309
53
0
500
1,000
1,500
2,000
2,500
2008 2009 2010 2011 2012 2013
MW Datang RE
Inner Mongolia Northeastern
Central and Western Southeastern Coastline
54%70%
62% 63%52%
43%
34%
21%22% 22%
24%
23%
12% 9%10% 7%
13%20%
6% 8% 10% 13%
0%
10%
20%
30%
40%
50%
60%
70%
80%
90%
100%
2007 2008 2009 2010 2011 2012
Datang REInner Mongolia NortheasternCentral and Western Southeastern Coastline
gy – Heading south

Wind Power Density
200 w/m2 (high)
150-200 w/m2
100-150 w/m2
50-100 w/m2
50 w/m2 (low)
Yunnan
Guizhou
Sichuan
Guangxi
East Inner Mongolia
Wind Power Density
200 w/m2 (high)
150-200 w/m2
100-150 w/m2
50-100 w/m2
50 w/m2 (low)
Jiangsu
Xinjiang
Gansu
Guangdong
China wind: Wind farm operators’ guidance on near-term focus areas
Source: Company data, Nomura research
Huadian Fuxin
Huaneng RE
Wind farm operators’ strateg
Wind Power Density
200 w/m2 (high)
150-200 w/m2
100-150 w/m2
50-100 w/m2
50 w/m2 (low)
Zhejiang
Jiangsu
Shandong
Yunnan Guangxi
Wind Power Density
200 w/m2 (high)150-200 w/m2100-150 w/m250-100 w/m250 w/m2 (low)
Jiangsu
FujianYunnan
7
Longyuan
Datang RE
gy – Heading south

1,750
1,950
2,150
2,350
2,550
2,750Hrs 2010 2011 2012
2013 2014
1,000
1,500
2,000
2,500
3,000Hrs
2010 2011 20122013 2014
Wind utilisation recovered rolows… and likely to be stable
China wind: YTD (annualised) wind farm utilisation
Source: CEC, Nomura research
China wind: Monthly (annualised) wind farm utilisation
Source: CEC, Nomura research
NA
NA
20%
11%
8%
10%
14%
12%
6%
12%
21%
11%
NA
17%
21%
15%
0%
5%
10%
15%
20%
25%
2010 2011 2012 2013
Huadian Fuxin Longyuan Huaneng RE Datang RE
obustly in 2013 from 2012 e in 2014F
Weak wind speed in 4M14; but seeing recovery since May Policy and infrastructure initiatives NEA’s notice to ensure the wind power absorption in 2014 Excess wind power generation trading system
8
PRC wind farm operators’ reported wind power curtailment ratios
Source: Company data, Nomura research
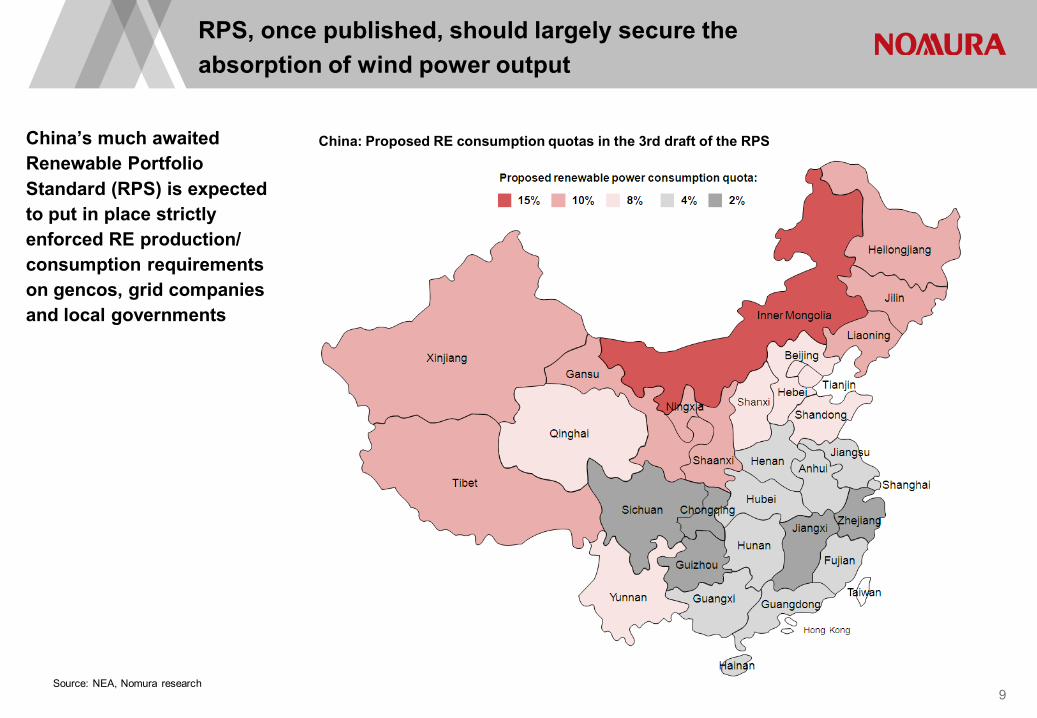
China: Proposed RE consump
Source: NEA, Nomura research
China’s much awaited Renewable Portfolio Standard (RPS) is expected to put in place strictly enforced RE production/ consumption requirements on gencos, grid companies and local governments
RPS, once published, shouldabsorption of wind power ou
9
ption quotas in the 3rd draft of the RPS
d largely secure the utput

China: UHV grid
Source: NDRC, NEA
The build-out of China’s power transmission infrastructu
6
12
345
7
Southeast Shanxi-Nan
Xiangjiaba – Shangha
Jinping – South Jiang
South Hami – Zhengz
Huainan – Shanghai 1
Xiluodu – West Zhejia
North Zhejiang – Fuzh
Huainan – Nanjing - S8
UHV grid lines – Constructio
After years’ of debate on the applied technology, the central government seems to have made its decision and preliminary approved a whole pack of 12 UHV grid lines to be built in the next 3-5 years in early 2014
Transmission lines Type Voltage Transmission forNingxia - Zhejiang DC ±800kv Wind pow erShanghaimiao - Shandong DC ±800kv Wind pow erXimeng - Jiangsu DC ±800kv Wind pow erXimeng - Shandong AC 1000kv Wind pow erWest Inner Mongolia - South Tianjin AC 1000kv Wind pow erSuizhong - Nothern China Grid DC ±500kv Coal-f iredShanxi - Hebei DC ±500kv Coal-f iredShenmu - Hebei DC ±500kv Coal-f iredShanxi - Zhejiang DC ±800kv Coal-f iredHuainan - Nanjing - Shanghai* AC 1000kv Coal-f iredYuheng - Weifang AC 1000kv Coal-f iredLijiang - Shenzhen DC ±800kv Coal-fired, Hydropow er
China: Details of the 12 UHV lines preliminary approved
Source: NEA, State Grid, Nomura research
10
d expansion plans before 2020
A, State Grid, Nomura research
ure is of crucial importance to the wind power industry...
Hainan
Inner Mongolia
Jilin
Beijing
HebeiTianjin
Jiangsu
Anhui Shanghai
Zhejiang
Henan
Hubei
Shaanxi
Ningxia
Qinghai
Xinjiang
TibetSichuan
Yunnan Guangxi
Guizhou Fujian
Hunan Jiangxi
ShanxiShandong
Taiwan
Heilongjiang
Liaoning
Guangdong
Chongqing
Gansu
1000kV UHVAC planned
± 800/±1000 kV UHVDC planned
± 800kV UHVDC completed
1000kV UHVAC completed
± 800kV UHVDC under construction
1000kV UHVAC under construction
10GW scale wind power bases
23
1
5
4
7
nyang – Jingmen 1000kv UHVAC
ai ±800kv UHVDC
gsu ±800kv UHVDC
zhou ±800kv UHVDC
1000kv UHVAC
6
ang ±800kv UHVDC
hou ±800kv UHVDC
Xinjiang Hami
Gansu Jiuquan
West Inner Mongolia
East Inner MongoliaJilin
Hebei
Shandong coastline
Jiangsu coastline
Shanghai 1000kv UHVAC
8
on accelerating

CNY 0.51/kWh Category I resource area
CNY 0.54/kWh Category II resource area
CNY 0.58/kWh Category III resource area
CNY 0.61/kWh Category IV resource area
China: The current four-tier wind FiT by region (incl. VAT)
Source: China wind power outlook (2010), Nomura research
Wind tariff – Generally stablenewly installed projects
We expect FiT for wind power will see a gradual decline – to be- The central government targets to reach grid-parity by 2020F;- The decline in equipment cost;- The further improvement of curtailment issue.
11
China wind: Wind operators’ blended wind tariffs (ex VAT)
Source: Company data, Nomura research
0.44
0.45
0.46
0.47
0.48
0.49
0.50
0.51
0.52
2013 2014F 2015F 2016F 2017F 2018F 2019F 2020F
CNY/kWhHuadian Fuxin Longyuan Huaneng RE Datang RE
e but may see tariff cut for
e cut by 5% every two years starting from 2015F to 2020F, given:
5,689 5,327 5,333
4,222 3,765 3,589 3,509
2,000
3,000
4,000
5,000
6,000
2007 2008 2009 2010 2011 2012 2013
CNY/kW
427
471
537 541
485 502 494
400
440
480
520
560
600
2007 2008 2009 2010 2011 2012 2013
CNY/kW
Goldwind: Trend of 1.5MW WTG ASP CHST: Trend of 1.5MW gearbox ASP
Source: Company data, Nomura research

385% 395%
342%366%
173% 182% 178% 177%187%
232%209%
242%
341%
409% 411%437%
150%
200%
250%
300%
350%
400%
450%
500%
2010 2011 2012 2013Huadian Fuxin Longyuan Huaneng RE
‐ Longyuan's placement & perp bond issuance‐Huadian Fuxin IPO
Datang RE IPOHuaneng RE IPO
Huaneng REplacement
1,408
1,144
497
50
700 863 838
546
784
1,499
2,053 2,042 1,945
1,366
1,800 1,973
1,382
554
764
1,800
‐
500
1,000
1,500
2,000
2,500
2011 2012 2013 2014F 2015F
MW
Huadian Fuxin Longyuan Huaneng RE Datang RE
A trade-off between capacityrisk
China wind: Wind farm operators’ capacity addition – 2011-15F
Source: Company data, Nomura estimates
PRC wind farm operators: Net D/E profiles
Source: Company data, Nomura research
350%381%
183% 177%
289%
323%
453% 457%
2014F 2015FDatang RE
Huadian Fuxin placement
y growth and gearing / dilution
12
Source: Company data, Nomura research
4,397 6,000 2,727 2,458 2,305 2,753 1,813 2,111
52.4%45.9%
66.5%
85.9%
0%
10%
20%
30%
40%
50%
60%
70%
80%
90%
100%
-
1,000
2,000
3,000
4,000
5,000
6,000
Huadian Fuxin Longyuan Huaneng RE Datang RE
CNY mn
EBIT Net financial expenses % of net financial expenses to EBIT
China wind: Wind farm operators’ financial expenses to EBIT - 2013

R&M cost will surge due to tWTGs, while remains a relati
China wind: Wind farm operators’ cost breakdown – 2012-15F
Source: Company data, Nomura research
2012 y-y 2013 y-y 2014F y-y 2015FHuadian Fuxin - Depreciation (1,798) 44.5% (2,175) 21.0% (2,592) 19.2% (3,166) - Fuel cost (4,107) 104.4% (4,362) 6.2% (4,381) 0.4% (4,883) - Labor (801) 21.1% (955) 19.3% (1,139) 19.2% (1,322) - R&M (335) 99.3% (440) 31.3% (524) 19.2% (609)
- Administration (430) 89.8% (415) -3.5% (494) 19.2% (574) - Financial expenses (1,905) 58.6% (2,305) 21.0% (2,538) 10.1% (3,016) - Others (451) 219.2% (217) -51.9% 167 na 736 Total (9,826) 73.9% (10,869) 10.6% (11,501) 5.8% (12,833) Total expenses / revenue 86.6% 8.9ppt 82.1% -4.5ppt 77.3% -4.8ppt 73.7%
Longyuan - Depreciation (3,697) 29.9% (4,391) 18.8% (5,030) 14.5% (5,680) - Fuel cost (5,824) -14.0% (5,086) -12.7% (4,792) -5.8% (4,726) - Labor (925) 20.3% (1,115) 20.5% (1,193) 7.0% (1,244) - R&M (305) 20.2% (521) 71.0% (538) 3.2% (667)
- Administration (402) 36.6% (396) -1.3% (448) 13.2% (444) - Financial expenses (2,485) 61.8% (2,753) 10.8% (2,755) 0.1% (3,257) - Others (390) 15.4% (980) 151.5% (677) -30.9% (676) Total (14,027) 9.5% (15,242) 8.7% (15,432) 1.2% (16,694) Total expenses / revenue 81.1% 1.9ppt 79.7% -1.4ppt 74.7% -5.0ppt 74.1%
Huaneng RE - Depreciation (1,612) 37.9% (1,931) 19.8% (2,223) 15.1% (2,799) - Labor (151) 28.0% (205) 36.0% (268) 30.5% (331) - R&M (50) 68.3% (91) 80.7% (96) 5.0% (168)
- Administration (127) 7.7% (146) 15.4% (191) 30.5% (236) - Financial expenses (1,530) 50.2% (1,813) 18.5% (2,206) 21.7% (2,931) - Others (104) 12.8% (420) 303.8% (202) -51.8% (265) Total (3,574) 40.4% (4,607) 28.9% (5,185) 12.6% (6,730) Total expenses / revenue 88.8% 9.1ppt 79.5% -9.3ppt 77.0% -2.5ppt 76.1%
Datang RE - Depreciation (1,857) 36.4% (2,201) 18.5% (2,445) 11.1% (2,716) - Labor (265) 41.1% (353) 33.2% (295) -16.3% (328) - R&M (83) 19.6% (121) 45.6% (175) 45.0% (223)
- Material costs (24) -21.0% (65) 171.7% (46) -29.2% (51) - Financial expenses (1,934) 46.8% (2,111) 9.2% (2,171) 2.8% (2,387) - Others (294) 19.8% (374) 27.1% (390) 4.3% (440) Total (4,457) 38.8% (5,224) 17.2% (5,522) 5.7% (6,144) Total expenses / revenue 102.0% 18.2ppt 92.8% -9.2ppt 91.9% -0.8ppt 90.7%
he increasing out-of-warranty ively small portion
13
China wind farm operators: Proportion of out-of-warranty WTG
y-y 2012-15F CAGR
22.1% 20.8%11.5% 5.9%16.1% 18.2%16.1% 22.0%
16.1% 10.1%18.8% 16.6%
na na11.6% 9.3%
-3.6ppt
12.9% 15.4%-1.4% -6.7%4.3% 10.4%
24.0% 29.8%
-0.9% 3.4%18.2% 9.4%-0.2% 20.1%8.2% 6.0%
-0.6ppt
25.9% 20.2%23.4% 29.9%76.3% 49.6%
23.4% 22.9%32.9% 24.2%31.4% 36.7%29.8% 23.5%
-0.9ppt
11.1% 13.5%11.0% 7.3%27.0% 38.9%
11.0% 28.7%10.0% 7.3%12.8% 14.4%11.3% 11.3%
-1.2ppt
Source: Company data, Nomura research
7%
53%
4%
15%21%
57%
18%
39%35%
61%
35%
44%
0%
10%
20%
30%
40%
50%
60%
70%
Huadian Fuxin Longyuan Huaneng RE Datang RE
2013 2014F 2015F
Why R&M cost will surge? A typical warranty period for WTG is 3-5 years; Generally, it will cost 3-4 times for R&M
expenses when a WTG’s warranty is expired.

Wind farm operators: CDM income profiles and contribution to PBT
CER and EUA price trends
Source: Bloomberg, Nomura research
0
5
10
15
20
25
17-J
un-0
9
17-O
ct-0
9
17-F
eb-1
0
17-J
un-1
0
17-O
ct-1
0
17-F
eb-1
1
17-J
un-1
1
17-O
ct-1
1
17-F
eb-1
2
17-J
un-1
2
17-O
ct-1
2
17-F
eb-1
3
17-J
un-1
3
17-O
ct-1
3
EUR/ ton EUA Future CER Futur
CDM income – An old-time fa
118 210 392 727 742 54
19%
11%
12%
20% 20%
2%
0%
5%
10%
15%
20%
25%
0
100
200
300
400
500
600
700
800
2008 2009 2010 2011 2012 2013
CNY mn
LongyuanCDM income - LHS % of PBT - RHS
31 75 155 134 -
5%
8%
21%
8%
0%0%
5%
10%
15%
20%
25%
0
20
40
60
80
100
120
140
160
180
2008 2009 2010 2011 2012 2013
CNY mn
Huadian FuxinCDM income - LHS % of PBT - RHS
Source: Company data, Nomura research
14
17-F
eb-1
4
17-J
un-1
4
e
airy tale
%
%
%
%
16 29 165 484 105 -
17%
9%
26%
42%
17%
0%0%
5%
10%
15%
20%
25%
30%
35%
40%
45%
0
100
200
300
400
500
600
2008 2009 2010 2011 2012 2013
CNY mn
Huaneng RECDM income - LHS % of PBT - RHS
72 137 229 371 61 58
30%
36%
31%
37%34%
16%
0%
5%
10%
15%
20%
25%
30%
35%
40%
0
50
100
150
200
250
300
350
400
2008 2009 2010 2011 2012 2013
CNY mn
Datang RECDM income - LHS % of PBT - RHS
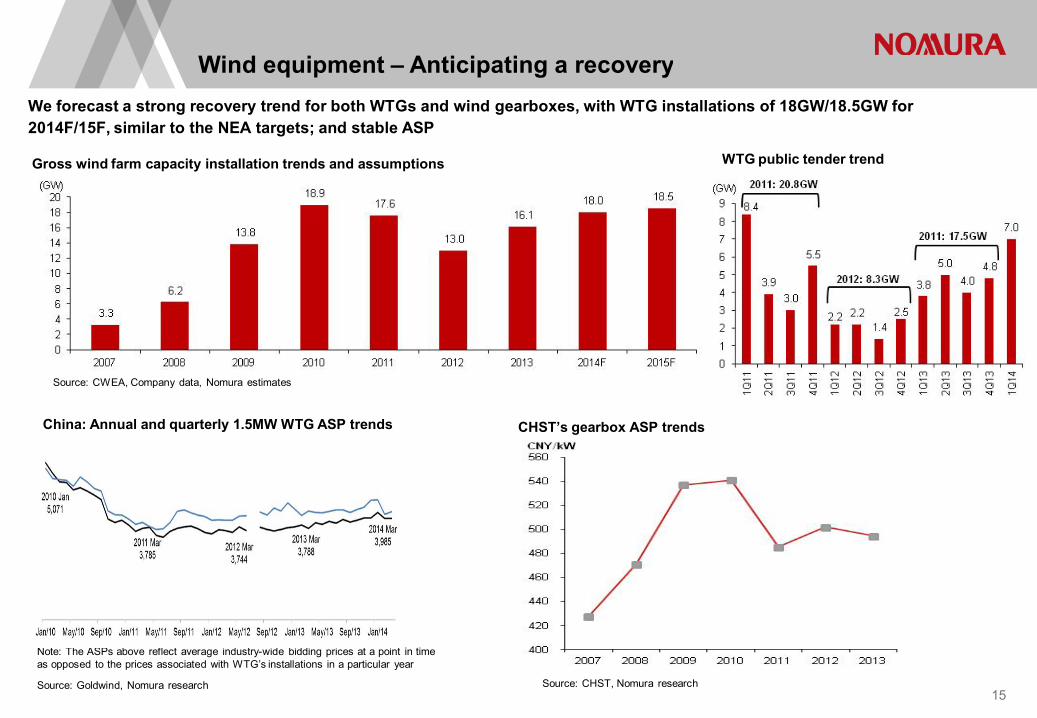
Gross wind farm capacity installation trends and assumptions
We forecast a strong recovery trend for both WTGs and wind gea2014F/15F, similar to the NEA targets; and stable ASP
Wind equipment – Anticipati
Source: Goldwind, Nomura research
Note: The ASPs above reflect average industry-wide bidding prices at a point in time as opposed to the prices associated with WTG’s installations in a particular year
China: Annual and quarterly 1.5MW WTG ASP trends
Source: CWEA, Company data, Nomura estimates
15
arboxes, with WTG installations of 18GW/18.5GW for
ng a recovery
Source: CHST, Nomura research
WTG public tender trend
CHST’s gearbox ASP trends

Positioned as an industrial conglomerate Diversified business with six segments, namely: 1) gearbox (including wind, tr
computer numerical controlled (CNC) system; 4) coal mining machinery; 5) lig
Wind gearbox: On a strong recovery trend with sales volume to grow Domestic market: 15%-plus sales volume growth given the improving wind p Overseas market: 50% sales volume growth due to the strong demand from
New businesses (CNC, coal mining machines and LED): we expect t CNC: marginally breakeven in 2013FY, and expecting a slight profit in 2014F. Coal mining machines: remain cautious given the challenging environment. LED: At early stage of the business with loss making situation in 2013FY, but
profit in 2014F when it achieves economies of scale (current production at ~0
Valuation: Attractive valuation vs peers At HKD5.42, the stock is trading at attractive 2014F P/E and P/B of 15.6x and
P/B.
China High Speed Transmis
CHST: Wind gearboxes sales volume (2008CHST: Wind gearboxes sales volume (2008--15F)15F)
2,506
5,474
8,156 7,266 4,777 5,719 6,624 7,115
704
954
1,083 1,362
1,901 1,613
2,419 3,024
-30%
0%
30%
60%
90%
120%
150%
0
2,000
4,000
6,000
8,000
10,000
12,000
2008
2009
2010
2011
2012
2013
2014
F
2015
F
(MW) Domestic (LHS)Export (LHS)y-y growth (RHS)
Source: CWEA, NEA, Company data, Nomura estimates
raditional, high-speed locomotives, etc); 2) marine gearbox; 3) ght-emitting diode (LED) sapphire substrates; and 6) mechatronics.
w 23.3% y-y in 2014Fpower generating environment in China since 2H13GE in the US.
to see a turnaround.
CHST is expecting the business to break even or achieve a slight .3mn units / month vs. end-2014F target of 0.8mn units / month).
0.8x, respectively, vs Goldwind (2208 HK, Buy) at 26.0x P/E and 1.4x
16
ssion (658 HK, Buy)
CHST’s gearbox ASP trendsCHST’s gearbox ASP trends
Note: The ASPs disclosed are blended across both domestic and export sales and exclude PRC VAT at 17%

WTG sales: a direct beneficiary of expected wind power market reb Solid WTG sales volume growth due to: 1) most of the wind farm projects a
Goldwind has a homefield advantage in the Hami Wind Farm Project Phase and 4) the NEA also targets 18GW of new wind installed capacity in 2014, up
Limited upside potential in margin expansion: the ASP for wind turbines t
Wind power services: only a small earnings contributor 20% revenue growth and a slight pick up in GPM given revenue mix will shift Limited opportunity from ex-warranty installed base, given: 1) usually on
maintenance services; and 2) many mid-to-large wind farm operators have a
Wind farm development: gaining importance as a wind farm operat 700MW new capacity each year for 2014-15F, thanks to 3.1GW project pipel The company will pursue more on a “build-and-operate” strategy instead of a
Valuation: High valuation justified, but CHST is our preferred play Trading at 2014F P/E of 26.0x and P/B of 1.4x, Goldwind shares are at a pre
which trades at 15.6x P/E and 0.8x P/B. We believe the high valuation is just
Xinjiang Goldwind (2208 HK
Goldwind: WTG sales volume Goldwind: WTG sales volume (2007(2007--16F)16F)
China: 1.5MW WTGChina: 1.5MW WTGpublic bidding pricpublic bidding pric
Source: Company data, Nomura estimates
boundapproved by the NEA under the four batches are still pending construction; 2) II; 3) we see mid- to long-term potential for offshore wind farm development; p 11.8% y-y from 16.1GW in 2013.to remain flattish to slightly, with limited cost reduction esp. for 1.5MW WTGs
t to higher-margin maintenance service instead of lower-margin EPC.nly wind farms installed with Goldwind’s wind turbines will use Goldwind’s already set up their own internal teams for maintenance.
torline under the four batch of NEA approvals
a “build-and-sell” strategy
emium valuation to peers and more specifically to wind equipment peer CHST, tified by a three-year EPS CAGR of 37.3%. Buy.
17
K, Buy)
G monthly average G monthly average ce (CNY/kW)ce (CNY/kW)
GoldwindGoldwind: Market share of the : Market share of the WTG sales in ChinaWTG sales in China

Wind farm operators – Rapidprefer players with diversifie
Huadian Fuxin (816 HK, Buy, TP HKD5.30) – A diversified clean ene A diversified and well balanced portfolio of generation assets across differen Strong capacity growth ahead: At 17.6% 2013-15 CAGR across different fue Low equity financing risk Valuation: Trading at 13.1x 2014F P/E (at the lower end of its peers’ range o Initiated coverage at Buy with TP of HKD5.3 on 15 May 2014.
Longyuan (916 HK, Buy, TP HKD9.50) – Premium for its balance sh The strongest balance sheet across peers: Low dilution risk A mix of coal-fired and wind power generation portfolio: Risk diversification a Steady and quality wind capacity growth: Mediocre capacity growth across p
exposure in overseas market and first-mover advantage in low-wind-speed r Valuation: Trading at 16.3x 2014F P/E (at the higher end of its peers’ range o
strong balance sheet.
Huaneng RE (958 HK, Buy, TP HKD2.90) – Wind blowing with sunsh Strong capacity growth: Fastest wind capacity growth among peers at 1.8GW More emphasis on solar power business: ~200MW in new solar capacity pa Dilution risk remains given high gearing: Strong capacity growth comes with Valuation: Trading at 12.8x 2014F P/E (at the low end of its peers’ range of 1
of 38.9%.
Datang RE (1798 HK, Reduce, TPHKD1.00) – Choked by high gearin Slowest wind capacity growth: With 0.6-0.8GW annual capacity additions for Curtailment eases but remains high vs peers Heavy financial burden given high gearing: With net gearing ranges between
largely eroded by interest expenses, and a potential equity financing exercis Valuation: Trading at 16.9x 2014F P/E (at the high end of its peers’ range of
18
d capacity growth ahead; ed exposure
ergy exposurent fuel mix (wind, hydro, coal, nuclear, etc.): Unique in the universeel types
of 12.8x-16.9x) and 1.9x P/B. Attractive
heet strength
across different fuels.peers, but with potential margin and curtailment improvement, thanks to its regions.of 12.8x-16.9x) and 1.6x P/B; at a premium to peers but justifiable given its
hineW pa, implying a 25.6% 2013-15F CAGR.at a decent IRR of 12-15%.high capex needs; seeing potential equity financing in the mid- to long-term.
12.8x-16.9x) and 1.3x P/B; undemanding, given its strong 2013-16F EPS CAGR
ngr 2014/15F, implying a 11.6% 2013-15F CAGR, the lowest among peers.
n 430-460% in 2014-16F per our estimates, we see the company’s profit being e in the near-term is more likely than peers.12.8x-16.9x) and 0.6x P/B; demanding.

Wind Power Density
200 w/m2 (high)
150-200 w/m2
100-150 w/m2
50-100 w/m2
50 w/m2 (low)
Southeastern Coastline1,224MW windInstalled capacity(20% of portfolio)
Inner Mongolia1,716MW windInstalled capacity(28% of portfolio)
Central and Western 2,034MW windInstalled capacity(33% of portfolio)
Northeastern China1,247MW windInstalled capacity(20% of portfolio)
Wind Power Installed
Power plant type
Wind Power Density
200 w/m2 (high)
150-200 w/m2
100-150 w/m2
50-100 w/m2
50 w/m2 (low)
Southeastern Coastline222MW windInstalled capacity(6% of portfolio)
Inner Mongolia1,170MW windInstalled capacity(33% of portfolio)
Central and Western 1,469MW windInstalled capacity(42% of portfolio)
Northeastern China640MW windInstalled capacity(18% of portfolio)
Wind Power Installed
Power plant type
China wind: Wind farm operators’ 2013 capacity distribution
Source: Company data, Nomura research
Huadian Fuxin
Huaneng RE
Wind farm operators’ currenLongyuan poised at a better
Wind Power Density
200 w/m2 (high)
150-200 w/m2
100-150 w/m2
50-100 w/m2
50 w/m2 (low)
Southeastern Coastline650MW windInstalled capacity(11% of portfolio)
Inner Mongolia2,507MW windInstalled capacity(44% of portfolio)
Central and Western 1,187MW windInstalled capacity(21% of portfolio)
Northeastern China1,375MW windInstalled capacity(24% of portfolio)
Wind Power Installed
Power plant type
Wind Power Density
200 w/m2 (high)150-200 w/m2100-150 w/m250-100 w/m250 w/m2 (low)
Power plant type
Wind Power InstalledCoal Power
Southeastern Coastline2,427MW wind installed capacity(20% of portfolio)
Inner Mongolia2,285MW wind installed capacity(19% of portfolio)
Central and Western4,709MW wind installed capacity(40% of portfolio)
Northeastern2,489MW wind installed capacity(21% of portfolio)
19
Longyuan
Datang RE
t capacity distribution –position

Note: Pricing as of 17 June 2014; ratings and price targets are as of the date of the most recently publishSource: Company data, Bloomberg, Nomura estimates
Valuation comparison I
ReportingCompany Ticker currency FY end RatingWind equipmentCHST 658 HK CNY Dec 1,635 BuyGoldw ind 2208 HK CNY Dec 2,695 BuyWind equipment average
Wind operatorsHuadian Fuxin 816 HK CNY Dec 7,980 BuyChina Longyuan 916 HK CNY Dec 8,036 BuyHuaneng RE 958 HK CNY Dec 9,029 BuyDatang RE 1798 HK CNY Dec 7,274 Reduce
Wind operators average
Company 2013 2014F 2015F 2013 2014FWind equipmentCHST 0.00 0.00 0.07 na naGoldw ind 0.08 0.08 0.12 1.1% 1.2%
Wind equipment average 0.04 0.04 0.09 1.1% 1.2%
Wind operatorsHuadian Fuxin 0.04 0.05 0.06 1.2% 1.5%China Longyuan 0.05 0.08 0.09 0.7% 1.2%Huaneng RE 0.02 0.03 0.04 0.9% 1.5%Datang RE 0.00 0.01 0.01 0.3% 0.9%
Wind operators average 0.03 0.04 0.05 0.8% 1.3%
No. of shares (mn)
DPS (Reporting $) Yield (%)
20
hed report (http://www.Nomura.com) rather than the date of this document.
Price Market cap(HKD) % upside (USD mn) 2013 2014F 2015F
7.30 5.42 34.7% 1,144 0.05 0.27 0.359.67 9.20 5.1% 3,199 0.16 0.27 0.38
2,171 0.10 0.27 0.37
5.30 4.18 26.8% 4,304 0.19 0.25 0.329.50 8.55 11.1% 8,866 0.26 0.41 0.472.90 2.73 6.2% 3,181 0.10 0.17 0.221.00 1.09 -8.3% 1,023 0.03 0.05 0.06
4,343 0.15 0.22 0.27
2015F 2013 2014F 2015F 2013 2014F 2015F
1.7% 0.0% 0.0% 20.0% 5.21 5.48 5.821.6% 50.4% 30.0% 30.0% 4.96 5.15 5.46
1.6% 25.2% 15.0% 25.0% 5.08 5.32 5.64
2.0% 20.8% 20.0% 20.0% 1.47 1.72 1.991.4% 18.6% 20.0% 20.0% 3.85 4.21 4.602.0% 20.3% 20.3% 20.3% 1.54 1.67 1.851.1% 9.2% 15.0% 15.0% 1.28 1.32 1.38
1.6% 17.2% 18.8% 18.8% 2.03 2.23 2.45
Price target (HKD)
EPS (Reporting $)
Dividend payout (%) BVPS (Reporting $)

Valuation comparison II
Note: Pricing as of 17 Jun 2014; Ratings and price targets are as of the date of the most recently publishSource: Company data, Bloomberg, Nomura estimates
Company 2013 2014F 2015F 2013Wind equipmentCHST 91.2 15.6 12.0 0.8Goldw ind 45.9 26.0 18.4 1.4Wind equipment average 68.6 20.8 15.2 1.1
Wind operatorsHuadian Fuxin 17.2 13.1 10.2 2.2China Longyuan 26.6 16.3 13.9 1.7Huaneng RE 20.9 12.8 9.4 1.4Datang RE 26.6 16.9 13.5 0.7Wind operators average 22.8 14.8 11.8 1.5
Company 2013 2014F 2015F 2013Wind equipmentCHST 84.7% 84.8% 79.8% 0.8%Goldw ind 27.6% 49.0% 65.4% 3.3%Wind equipment average 56.1% 66.9% 72.6% 2.0%
Wind operatorsHuadian Fuxin 365.7% 350.4% 380.9% 13.5%China Longyuan 177.7% 177.4% 183.2% 6.8%Huaneng RE 209.2% 241.8% 289.5% 6.9%Datang RE 410.9% 437.3% 453.0% 2.6%Wind operators average 290.9% 301.7% 326.6% 7.4%
P/E (x) P/B (
Net Gearing (%) RoE (
21
hed report (http://www.Nomura.com) rather than the date of this document.
2014F 2015F 2013 2014F 2015F
0.8 0.7 12.3 9.1 8.11.4 1.3 12.3 6.4 5.91.1 1.0 12.3 7.7 7.0
1.9 1.6 10.7 9.7 9.01.6 1.4 10.7 9.2 8.41.3 1.1 10.2 9.4 8.60.6 0.6 10.2 9.9 9.31.3 1.2 10.4 9.5 8.8
2014F 2015F 2013 2014F 2015F
5.0% 6.1% 2.8% 4.4% 5.1%5.4% 7.2% 1.4% 3.9% 4.6%5.2% 6.7% 2.1% 4.1% 4.8%
15.6% 17.0% 7.1% 7.6% 7.9%10.1% 10.7% 6.3% 7.2% 7.7%9.8% 12.0% 5.8% 6.3% 6.8%3.8% 4.6% 4.5% 4.7% 5.0%9.8% 11.1% 5.9% 6.4% 6.8%
(x) EV/EBITDA (x)
(%) RoA (%)

Source: Company data, Bloomberg, Nomura estimates
CHSTCHST GoldwindGoldwind
LongyuanLongyuan Huaneng REHuaneng RE
P/E comparison
22
Huadian FuxinHuadian Fuxin
Datang REDatang RE

Source: Company data, Bloomberg, Nomura estimates
P/B comparison
CHSTCHST GoldwindGoldwind
LongyuanLongyuan Huaneng REHuaneng RE
23
Huadian FuxinHuadian Fuxin
Datang REDatang RE

Appendix A-1Any Authors named on this report are Research Analysts unless otheAnalyst Certification We, Joseph Lam, Yuwen Tang and Scott Chui, hereby certify (1) that the views expressed in this Researeferred to in this Research report, (2) no part of our compensation was, is or will be directly or indirectlyour compensation is tied to any specific investment banking transactions performed by Nomura Securiti
Issuer Specific Regulatory Disclosures The term "Nomura Group" used herein refers to Nomura Holdings, Inc. or any of its affiliates or subsidia
Materially mentioned issuers Issuer Ticker Price Price date China Datang Renewable Power 1798 HK 1.08 HKD 18-Jun-2014China High Speed Transmission 658 HK 5.43 HKD 18-Jun-2014China Longyuan Power 916 HK 8.41 HKD 18-Jun-2014Huadian Fuxin 816 HK 4.28 HKD 18-Jun-2014Huaneng Renewables Corporation 958 HK 2.7 HKD 18-Jun-2014Xinjiang Goldwind 2208 HK 9.2 HKD 18-Jun-2014
Important Disclosures
Online availability of research and conflict-of-interest disclosures Nomura research is available on www.nomuranow.com/research, Bloomberg, Capital IQ, Factset, MarkImportant disclosures may be read at http://go.nomuranow.com/research/globalresearchportal/pages/di5752. If you have any difficulties with the website, please email [email protected] for help. The analysts responsible for preparing this report have received compensation based upon various factUnless otherwise noted, the non-US analysts listed at the front of this report are not registered/qualifiedbe subject to FINRA Rule 2711 and NYSE Rule 472 restrictions on communications with covered comp Nomura Global Financial Products Inc. (“NGFP”) Nomura Derivative Products Inc. (“NDPI”) and NomuraNational Futures Association (NFA) as swap dealers. NGFP, NDPI, and NIplc are generally engaged in Any authors named in this report are research analysts unless otherwise indicated. Industry Specialistsresponsible for the sales and trading effort in the sector for which they have coverage. Industry Speciali Distribution of ratings (Global) The distribution of all ratings published by Nomura Global Equity Research is as follows: 45% have been assigned a Buy rating which, for purposes of mandatory disclosures, are classified as a44% have been assigned a Neutral rating which, for purposes of mandatory disclosures, is classified as11% have been assigned a Reduce rating which, for purposes of mandatory disclosures, are classified Group*. As at 31 March 2014. *The Nomura Group as defined in the Disclaimer section at the end of this report.
24
rwise indicated
arch report accurately reflect our personal views about any or all of the subject securities or issuers y related to the specific recommendations or views expressed in this Research report and (3) no part of ies International, Inc., Nomura International plc or any other Nomura Group company.
aries, and may refer to one or more Nomura Group companies.
Stock rating Previous rating Date of change Sector rating 4 Reduce Neutral 23-Jul-2013 N/A 4 Buy Suspended 15-May-2014 N/A 4 Buy Neutral 12-Dec-2011 N/A 4 Buy Not Rated 15-May-2014 N/A 4 Buy Neutral 15-May-2014 N/A 4 Buy Suspended 15-May-2014 N/A
kitHub, Reuters and ThomsonOne. sclosures/disclosures.aspx or requested from Nomura Securities International, Inc., on 1-877-865-
tors including the firm's total revenues, a portion of which is generated by Investment Banking activities. as research analysts under FINRA/NYSE rules, may not be associated persons of NSI, and may not
panies, public appearances, and trading securities held by a research analyst account.
a International plc. (“NIplc”) are registered with the Commodities Futures Trading Commission and the the trading of swaps and other derivative products, any of which may be the subject of this report.
identified in some Nomura International plc research reports are employees within the Firm who are sts do not contribute in any manner to the content of research reports in which their names appear.
a Buy rating; 42% of companies with this rating are investment banking clients of the Nomura Group*. s a Hold rating; 54% of companies with this rating are investment banking clients of the Nomura Group*. as a Sell rating; 26% of companies with this rating are investment banking clients of the Nomura

Explanation of Nomura's equity research rating system in Europe, Middle East and AfThe rating system is a relative system, indicating expected performance against a specific benchmark idan assessment of the current intrinsic fair value of the stock based on an appropriate valuation methodocash flow analysis, expected return on equity and multiple analysis. Analysts may also indicate expecteprice)/current price. STOCKS A rating of 'Buy', indicates that the analyst expects the stock to outperform the Benchmark over the nexthe Benchmark over the next 12 months. A rating of 'Reduce', indicates that the analyst expects the stothe rating, target price and estimates have been suspended temporarily to comply with applicable regula'No rating' are not in regular research coverage. Investors should not expect continuing or additional inUnited States/Europe/Asia ex-Japan: please see valuation methodologies for explanations of relevanhttp://go.nomuranow.com/research/globalresearchportal/pages/disclosures/disclosures.aspx; Global Emmethodology; Japan: Russell/Nomura Large Cap. SECTORS A 'Bullish' stance, indicates that the analyst expects the sector to outperform the Benchmark during thewith the Benchmark during the next 12 months. A 'Bearish' stance, indicates that the analyst expects thrated' or shown as 'N/A' are not assigned ratings. Benchmarks are as follows: United States: S&P 500ex-Asia. Japan/Asia ex-Japan: Sector ratings are not assigned. Explanation of Nomura's equity research rating system in Japan and Asia ex-Japan pSTOCKS Stock recommendations are based on absolute valuation upside (downside), which is defined as (TargeTarget Price will equal the analyst's 12-month intrinsic valuation of the stock, based on an appropriate vindicates that potential upside is 15% or more. A 'Neutral' recommendation indicates that potential upsidownside is 5% or more. A rating of 'Suspended' indicates that the rating and target price have been scircumstances including when Nomura is acting in an advisory capacity in a merger or strategic transacshown as 'No rating' are not in regular research coverage of the Nomura entity identified in the top bansecurities and/or companies. SECTORS A 'Bullish' rating means most stocks in the sector have (or the weighted average recommendation of thstocks in the sector have (or the weighted average recommendation of the stocks under coverage is) a weighted average recommendation of the stocks under coverage is) a negative absolute recommendati Target Price A Target Price, if discussed, reflects in part the analyst's estimates for the company's earnings. The achother risks related to the company or the market, and may not occur if the company's earnings differ fro
25
frica, US and Latin America, and Japan and Asia ex-Japan from 21 October 2013dentified for each individual stock, subject to limited management discretion. An analyst’s target price is ology determined by the analyst. Valuation methodologies include, but are not limited to, discounted d absolute upside/downside relative to the stated target price, defined as (target price - current
xt 12 months. A rating of 'Neutral', indicates that the analyst expects the stock to perform in line with ock to underperform the Benchmark over the next 12 months. A rating of 'Suspended', indicates that ations and/or firm policies. Securities and/or companies that are labelled as 'Not rated' or shown as formation from Nomura relating to such securities and/or companies. Benchmarks are as follows: t benchmarks for stocks, which can be accessed at: merging Markets (ex-Asia): MSCI Emerging Markets ex-Asia, unless otherwise stated in the valuation
e next 12 months. A 'Neutral' stance, indicates that the analyst expects the sector to perform in line he sector to underperform the Benchmark during the next 12 months. Sectors that are labelled as 'Not 0; Europe: Dow Jones STOXX 600; Global Emerging Markets (ex-Asia): MSCI Emerging Markets
rior to 21 October 2013
et Price - Current Price) / Current Price, subject to limited management discretion. In most cases, the valuation methodology such as discounted cash flow, multiple analysis, etc. A 'Buy' recommendation ide is less than 15% or downside is less than 5%. A 'Reduce' recommendation indicates that potential uspended temporarily to comply with applicable regulations and/or firm policies in certain
ction involving the subject company. Securities and/or companies that are labelled as 'Not rated' or nner. Investors should not expect continuing or additional information from Nomura relating to such
he stocks under coverage is) a positive absolute recommendation. A 'Neutral' rating means most neutral absolute recommendation. A 'Bearish' rating means most stocks in the sector have (or the ion.
hievement of any target price may be impeded by general market and macroeconomic trends, and by m estimates.

Disclaimers This document contains material that has been prepared by the Nomura entity identified at the top or bowhose employees and their respective affiliations are specified on page 1 herein or identified elsewhereaffiliates or subsidiaries and may refer to one or more Nomura Group companies including: Nomura SecInternational, Inc. ('NSI'), New York, US; Nomura International (Hong Kong) Ltd. (‘NIHK’), Hong Kong; Nregistered with the Korea Financial Investment Association ('KOFIA') can be found on the KOFIA Intrane197201440E, regulated by the Monetary Authority of Singapore); Nomura Australia Ltd. (‘NAL’), Australand holder of an Australian financial services licence number 246412; P.T. Nomura Indonesia (‘PTNI’), Taiwan; Nomura Financial Advisory and Securities (India) Private Limited (‘NFASL’), Mumbai, India (ReMumbai- 400 018, India; Tel: +91 22 4037 4037, Fax: +91 22 4037 4111; CIN No : U74140MH2007PTC231299034, MCX: INE261299034) and NIplc, Madrid Branch (‘NIplc, Madrid’). ‘CNS Thailand’ next to aCapital Nomura Securities Public Company Limited (‘CNS’) to provide research assistance services to NTHIS MATERIAL IS: (I) FOR YOUR PRIVATE INFORMATION, AND WE ARE NOT SOLICITING ANY ASOLICITATION OF AN OFFER TO BUY ANY SECURITY IN ANY JURISDICTION WHERE SUCH OFFSOURCES THAT WE CONSIDER RELIABLE, BUT HAS NOT BEEN INDEPENDENTLY VERIFIED BYNomura Group does not warrant or represent that the document is accurate, complete, reliable, fit for anresulting from use of this document and related data. To the maximum extent permissible all warrantiesfor the use, misuse, or distribution of this information. Opinions or estimates expressed are current opinions as of the original publication date appearing on thchange without notice. Nomura Group is under no duty to update this document. Any comments or stateNomura Group. Clients should consider whether any advice or recommendation in this report is suitableNomura Group does not provide tax advice. Nomura Group, and/or its officers, directors and employees, may, to the extent permitted by applicable or sell, the securities, commodities or instruments, or options or other derivative instruments based thermaker or liquidity provider (within the meaning of applicable regulations in the UK) in the financial instrugiven to it by specific laws and regulations of the US or other jurisdictions, this will be separately disclosThis document may contain information obtained from third parties, including ratings from credit ratings prohibited except with the prior written permission of the related third party. Third party content providerratings, and are not responsible for any errors or omissions (negligent or otherwise), regardless of the cexpress or implied warranties, including, but not limited to, any warranties of merchantability or fitness foincidental, exemplary, compensatory, punitive, special or consequential damages, costs, expenses, legtheir content, including ratings. Credit ratings are statements of opinions and are not statements of fact securities or the suitability of securities for investment purposes, and should not be relied on as investmAny MSCI sourced information in this document is the exclusive property of MSCI Inc. (‘MSCI’). Withoutreproduced, re-disseminated or used to create any financial products, including any indices. This informinformation. MSCI, its affiliates and any third party involved in, or related to, computing or compiling the merchantability or fitness for a particular purpose with respect to any of this information. Without limitingrelated to, computing or compiling the information have any liability for any damages of any kind. MSCI Russell/Nomura Japan Equity Indexes are protected by certain intellectual property rights of Nomura Senot guarantee the accuracy, completeness, reliability, or usefulness thereof and do not account for busiInvestors should consider this document as only a single factor in making their investment decision andmay be associated with any investment decision. Nomura Group produces a number of different types otrading ideas; recommendations contained in one type of research product may differ from recommendamethodologies or otherwise. Nomura Group publishes research product in a number of different ways ingroups of clients may receive different products and services from the research department depending Ideas platform (Retina) at http://go.nomuranow.com/equities/tradingideas/retina/ Figures presented herein may refer to past performance or simulations based on past performance whicfuture performance, such forecasts may not be a reliable indicator of future performance. Moreover, simfuture distribution of returns.
26
ottom of page 1 herein, if any, and/or, with the sole or joint contributions of one or more Nomura entities e in the document. The term "Nomura Group" used herein refers to Nomura Holdings, Inc. or any of its curities Co., Ltd. ('NSC') Tokyo, Japan; Nomura International plc ('NIplc'), UK; Nomura Securities
Nomura Financial Investment (Korea) Co., Ltd. (‘NFIK’), Korea (Information on Nomura analysts et at http://dis.kofia.or.kr); Nomura Singapore Ltd. (‘NSL’), Singapore (Registration number ia (ABN 48 003 032 513), regulated by the Australian Securities and Investment Commission ('ASIC') Indonesia; Nomura Securities Malaysia Sdn. Bhd. (‘NSM’), Malaysia; NIHK, Taipei Branch (‘NITB’),
egistered Address: Ceejay House, Level 11, Plot F, Shivsagar Estate, Dr. Annie Besant Road, Worli, C169116, SEBI Registration No: BSE INB011299030, NSE INB231299034, INF231299034, INE n analyst’s name on the front page of a research report indicates that the analyst is employed by NSL under a Research Assistance Agreement. CNS is not a Nomura entity. ACTION BASED UPON IT; (II) NOT TO BE CONSTRUED AS AN OFFER TO SELL OR A FER OR SOLICITATION WOULD BE ILLEGAL; AND (III) BASED UPON INFORMATION FROM Y NOMURA GROUP. ny particular purpose or merchantable and does not accept liability for any act (or decision not to act) and other assurances by Nomura group are hereby excluded and Nomura Group shall have no liability
his material and the information, including the opinions and estimates contained herein, are subject to ements made herein are those of the author(s) and may differ from views held by other parties within e for their particular circumstances and, if appropriate, seek professional advice, including tax advice.
law and/or regulation, deal as principal, agent, or otherwise, or have long or short positions in, or buy reon, of issuers or securities mentioned herein. Nomura Group companies may also act as market ments of the issuer. Where the activity of market maker is carried out in accordance with the definition
sed within the specific issuer disclosures. agencies such as Standard & Poor’s. Reproduction and distribution of third party content in any form is
rs do not guarantee the accuracy, completeness, timeliness or availability of any information, including cause, or for the results obtained from the use of such content. Third party content providers give no or a particular purpose or use. Third party content providers shall not be liable for any direct, indirect, al fees, or losses (including lost income or profits and opportunity costs) in connection with any use of or recommendations to purchase hold or sell securities. They do not address the suitability of
ment advice. t prior written permission of MSCI, this information and any other MSCI intellectual property may not be
mation is provided on an "as is" basis. The user assumes the entire risk of any use made of this information hereby expressly disclaim all warranties of originality, accuracy, completeness,
g any of the foregoing, in no event shall MSCI, any of its affiliates or any third party involved in, or and the MSCI indexes are services marks of MSCI and its affiliates.
ecurities Co., Ltd. and Russell Investments. Nomura Securities Co., Ltd. and Russell Investments do ness activities and services that any index user and its affiliates undertake with the use of the Indexes. , as such, the report should not be viewed as identifying or suggesting all risks, direct or indirect, that of research product including, among others, fundamental analysis, quantitative analysis and short term ations contained in other types of research product, whether as a result of differing time horizons, ncluding the posting of product on Nomura Group portals and/or distribution directly to clients. Different on their individual requirements. Clients outside of the US may access the Nomura Research Trading
ch are not reliable indicators of future performance. Where the information contains an indication of mulations are based on models and simplifying assumptions which may oversimplify and not reflect the

Certain securities are subject to fluctuations in exchange rates that could have an adverse effect on theThe securities described herein may not have been registered under the US Securities Act of 1933 (thebeen registered under the 1933 Act, or except in compliance with an exemption from the registration reqexecuted via a Nomura entity in your home jurisdiction. This document has been approved for distribution in the UK and European Economic Area as investmeFinancial Conduct Authority and the Prudential Regulation Authority. NIplc is a member of the London Sapplicable regulations in the UK, or take into account the particular investment objectives, financial situacounterparties' or 'professional clients' for the purposes of applicable regulations in the UK, and may nobeen approved by NIHK, which is regulated by the Hong Kong Securities and Futures Commission, for NAL, which is authorized and regulated in Australia by the ASIC. This document has also been approveaccepts legal responsibility for the content of this document, where it concerns securities, futures and foor institutional investors as defined by the Securities and Futures Act (Chapter 289). Recipients of this ddocument. Unless prohibited by the provisions of Regulation S of the 1933 Act, this material is distributeaccordance with the provisions of Rule 15a-6, under the US Securities Exchange Act of 1934. The entitmake copies of such documents available to their clients. This document has not been approved for distribution to persons other than ‘Authorised Persons’, ‘ExemArabia (‘Saudi Arabia’) or 'professional clients' (as defined by the Dubai Financial Services Authority) in the Qatar Financial Centre Regulatory Authority) in the State of Qatar (‘Qatar’) by Nomura Saudi Arabiacopy thereof may be taken or transmitted or distributed, directly or indirectly, by any person other than t‘Authorised Persons’, ‘Exempt Persons’ or ‘Institutions’ located in Saudi Arabia or 'professional clients' idocument, you represent that you are not located in Saudi Arabia or that you are an ‘Authorised Personor a ‘Market Counterparty’ or ‘Business Customers’ in Qatar and agree to comply with these restrictionsArabia or Qatar. NO PART OF THIS MATERIAL MAY BE (I) COPIED, PHOTOCOPIED, OR DUPLICATED IN ANY FORMEMBER OF NOMURA GROUP. If this document has been distributed by electronic transmission, succould be intercepted, corrupted, lost, destroyed, arrive late or incomplete, or contain viruses. The sendemay arise as a result of electronic transmission. If verification is required, please request a hard-copy ve Nomura Group manages conflicts with respect to the production of research through its compliance poliConfidentiality policies) as well as through the maintenance of Chinese walls and employee training. Additional information is available upon request and disclosure information is available at the Nhttp://go.nomuranow.com/research/globalresearchportal/pages/disclosures/disclosures.aspx Copyright © 2014 Nomura International (Hong Kong) Ltd. All rights reserved.
27
value or price of, or income derived from, the investment. ‘1933 Act’), and, in such case, may not be offered or sold in the US or to US persons unless they have quirements of the 1933 Act. Unless governing law permits otherwise, any transaction should be
nt research by NIplc. NIplc is authorised by the Prudential Regulation Authority and regulated by the Stock Exchange. This document does not constitute a personal recommendation within the meaning of ations, or needs of individual investors. This document is intended only for investors who are 'eligible ot, therefore, be redistributed to persons who are 'retail clients' for such purposes. This document has distribution in Hong Kong by NIHK. This document has been approved for distribution in Australia by
ed for distribution in Malaysia by NSM. In Singapore, this document has been distributed by NSL. NSL oreign exchange, issued by their foreign affiliates in respect of recipients who are not accredited, expert document in Singapore should contact NSL in respect of matters arising from, or in connection with, this ed in the US, by NSI, a US-registered broker-dealer, which accepts responsibility for its contents in ty that prepared this document permits its separately operated affiliates within the Nomura Group to
mpt Persons’ or ‘Institutions’ (as defined by the Capital Markets Authority) in the Kingdom of Saudi the United Arab Emirates (‘UAE’) or a ‘Market Counterparty’ or ‘Business Customers’ (as defined by
a, NIplc or any other member of Nomura Group, as the case may be. Neither this document nor any hose authorised to do so into Saudi Arabia or in the UAE or in Qatar or to any person other than n the UAE or a ‘Market Counterparty’ or ‘Business Customers’ in Qatar . By accepting to receive this
n’, an ‘Exempt Person’ or an ‘Institution’ in Saudi Arabia or that you are a 'professional client' in the UAE s. Any failure to comply with these restrictions may constitute a violation of the laws of the UAE or Saudi
RM, BY ANY MEANS; OR (II) REDISTRIBUTED WITHOUT THE PRIOR WRITTEN CONSENT OF A h as e-mail, then such transmission cannot be guaranteed to be secure or error-free as information
er therefore does not accept liability for any errors or omissions in the contents of this document, which ersion.
icies and procedures (including, but not limited to, Conflicts of Interest, Chinese Wall and
omura Disclosure web page: