Embed Size (px)
Citation preview

Applied Psycholinguistics 21 (2000), 183–204Printed in the United States of America
Children’s written and oral spelling
REBECCA TREIMANWayne State University
DERRICK BOURASSAAcadia University
ADDRESS FOR CORRESPONDENCERebecca Treiman, Department of Psychology, Wayne State University, 71 West Warren Avenue,Detroit, MI 48202. Email: [email protected]
ABSTRACTFor adults, written spelling is generally superior to oral spelling. To determine whether the sameholds true for children in kindergarten through second grade, we compared children’s ability to spellreal words (Experiment 1) and nonsense words (Experiment 2) orally and in writing. Building onthe work of Tangel and Blachman (1992, 1995) and others, we developed a reliable system to assessthe overall quality of the children’s spellings. We also examined the phonological and orthographiclegality of the spellings. By first and second grade, written spellings were superior to oral spellingsin both overall quality and representation of phonological form. This held true for both words andnonwords. The results suggest that children, like adults, more accurately analyze the linguistic struc-ture of a spoken item when they can represent the results in a lasting, visible form than when theycannot.
Historically, research on spelling has lagged behind research on reading. Thegap has narrowed somewhat in recent years with studies that have described thecourse of spelling development in English and other languages (e.g., Perfetti,Rieben, & Fayol, 1997) and studies that have examined the effects of phonemicanalysis instruction on spelling achievement (e.g., Tangel & Blachman, 1992,1995). However, we still know less about how children learn to spell than abouthow they learn to read. The present study was designed to fill some of the gapsin our knowledge about spelling. We sought to provide information that wouldadd to our theoretical understanding of the spelling process and, more practi-cally, that could be used in the design and scoring of spelling tests for children.
In most classroom spelling tests and in all standardized spelling tests of whichwe are aware, children’s spellings are scored simply as correct or incorrect.However, research on emergent spelling (e.g., Henderson & Beers, 1980; Read,1986; Treiman, 1993) has revealed large differences within young children’sincorrect spellings. Stage theories of spelling development (e.g., Ehri, 1986;Gentry, 1982; Henderson & Beers, 1980) explain these differences by postulat-ing that children go through a series of qualitatively different stages during thecourse of learning to spell. The earliest spellings bear no relationship to the
2000 Cambridge University Press 0142-7164/00 $9.50
Applied Psycholinguistics 21:2 184Treiman & Bourassa: Written and oral spelling
sounds in the intended word; these have been called precommunicative (Gentry,1982). Semiphonetic spellings represent some of the phonemes in the word (e.g.,“l” for elephant). Phonetic spellings (e.g., “elefut” for elephant or “chran” fortrain) provide a more complete representation and may capture certain featuresof the pronunciation that are ignored in conventional English spelling (Ehri,1986; Gentry, 1982). During the transitional (Gentry, 1982) or morphemic (Ehri,1986) stage, children increasingly rely on visual and morphological information(e.g., spelling eighty as “eightee” instead of the phonetic “ate”). Other research-ers have questioned the concept of developmental stages, while acknowledgingthat existing stage theories may provide a rough overall picture of spelling de-velopment (e.g., Rittle-Johnson & Siegler, 1999; Treiman & Cassar, 1997b;Varnhagen, McCallum, & Burstow, 1997). Although the debate is still ongoing,it is clear that children’s misspellings reveal varying levels and types of knowl-edge. These differences are masked if spellings are scored simply as correct orincorrect.
Several previous studies have attempted to develop real word spelling teststhat can be scored so as to capture the sophistication of young children’s errors(e.g., Burns & Richgels, 1989; Liberman, Rubin, Duques, & Carlisle, 1985;Mann, Tobin, & Wilson, 1987; Morris & Perney, 1984; Richgels, 1986;Tangel & Blachman, 1992, 1995; Zutell, 1980). In these scoring systems, spell-ings that represent more of a word’s phonological and orthographic featuresreceive higher ratings than spellings that bear little resemblance to the intendedword, even when both spellings are unconventional. In the present study, wetried to refine these tests and scoring systems. In addition, we sought to developsimilar tests of nonword spelling. Our word and nonword spelling tests, whichtogether we call the Treiman–Bourassa Early Spelling Test (T-BEST), weredesigned for young children who are beginning to master the English writingsystem.
Another goal of our study was to examine the cognitive requirements of dif-ferent spelling tasks and how these influence children’s performance. In all stan-dardized spelling tests of which we are aware and in most classroom spellingassessments, children write their spellings on paper. Spelling can also be testedin other ways, such as asking children to spell words aloud. In the presentexperiments, we asked whether the output modality makes a difference. If chil-dren can reveal their knowledge more easily or more completely in one modalitythan another, this would have obvious implications for assessment. Modality-related differences, if found, might also shed light on the nature of the spellingprocess.
There is evidence that adults spell more accurately when they are permittedto write words down than when they are asked to spell the words aloud. Anec-dotal support for this claim comes from the observation that people sometimestrace a word in the air or on a table if a pencil is not available. More conclu-sively, Tenney (1980, Experiment 2) asked college students to choose betweentwo alternative spellings for words such as nickel (“nickel” vs. “nickle”) andinsistence (“insistence” vs. “insistance”). Students performed significantly betterwhen they were told to write the word both ways on a sheet of paper beforedeciding than when they were told to think as long as they liked. In two experi-

Applied Psycholinguistics 21:2 185Treiman & Bourassa: Written and oral spelling
ments, Stadtlander (1996) found that college students were more accurate whenspelling words on paper than when spelling them aloud.
Only a few studies have compared children’s ability to spell words orallyand in writing. Using a within-subjects design, Jorm and Schoknecht (1981,Experiment 2) found a superiority for written spelling over oral spelling in agroup of fourth, fifth, and sixth graders. Children below the fourth grade werenot included in the Jorm and Schoknecht study, begging the question of whenthe superiority of written spelling emerges. Turner and Quinn (1986) comparedvarious methods of teaching children to spell made-up words such as proat.Children heard the spelling orally and then reproduced it either orally or onpaper. Recall was assessed by either an oral or a written test. Three groups ofchildren participated: 7- and 8-year-olds, 8- to 10-year-olds, and 10- and 11-year-olds. The children generally did better when the form of the final test (oral)matched the form of the initial presentation (oral). The 10- and 11-year-olds didparticularly well when they wrote the spellings on paper before they were tested.No such advantage was found for the younger groups. At least in this wordlearning task, it apparently takes some time for the advantage of written spellingto develop.
In the research reported here, we studied children in early elementary school(kindergartners, first graders, and second graders in Experiment 1 and kinder-gartners and first graders in Experiment 2) and asked when the superiority forwritten spelling begins to emerge. In Experiment 1, each child spelled two listsof real words. One list was spelled in writing and the other list was spelledaloud, with the assignment of lists to conditions balanced across children. Exper-iment 2 used a similar design, except that the children spelled nonsense wordsrather than real words. In Jorm and Schoknecht’s (1981) comparison of writtenand oral spelling, as in many other spelling tests, children’s spellings werescored simply as correct or incorrect. We scored the real word spellings in thisway, but we also looked at the spellings in more detail. Specifically, we devel-oped scoring systems that were designed to capture (a) the overall sophisticationof the spellings, (b) their phonological accuracy, and (c) their conformity to theorthographic structure of English. Each of these scales assesses a different as-pect of spelling. When combined, they allow for a comprehensive examinationof the sources of information that children use when they spell in writing andwhen they spell aloud.
EXPERIMENT 1
Method
Participants. Table 1 provides background information about the participants.Kindergartners and first graders were tested during the early part of the schoolyear (October and November). Second graders were tested around the middle ofthe school year (December and January). The children, who were predominantlyCaucasian, attended schools in a middle-class suburban area. All were nativespeakers of English. Reading instruction included a mix of phonics and litera-

Applied Psycholinguistics 21:2 186Treiman & Bourassa: Written and oral spelling
Table 1. Background information about children in Experiment 1
Kindergarten First grade Second grade
Number of children 30 (15 M, 15 F) 28 (12 M, 16 F) 33 (17 M, 16 F)Mean age (range) 5;8 (5;1–6;3) 6;7 (6;2–7;3) 7;9 (7;2–8;10)Mean no. correct on letter-
name task, strict scoring(SD) 18.4 (8.3) 25.9 (0.4) 26.0 (0.0)
Mean no. correct on letter-name task, lenient scoring(SD) 23.8 (3.9) 26.0 (0.0) 26.0 (0.0)
Mean no. correct on letter-sound task, strict scoring(SD) 9.4 (7.1) 21.9 (3.9) 23.9 (1.6)
Mean no. correct on letter-sound task, lenient scoring(SD) 20.1 (4.7) 25.6 (0.9) 25.9 (0.3)
Note: Maximum score on letter-name and letter-sound tasks = 26.
ture-based approaches, and explicit spelling instruction was given in the firstand second grades. Although achievement test scores for the children in thepresent Experiments 1 and 2 were not available, our experience with other chil-dren from some of the same schools suggested that the participants performedclose to national norms, on average, on standardized spelling tests such as thespelling subtest of the Wide Range Achievement Test (Wilkinson, 1993).
Stimuli. The real word portion of our spelling test, the T-BEST, had two ver-sions – List A and List B. Each list contained 10 words. The words on the twolists were similar in phonological structure, spelling patterns, and frequency inchildren’s reading materials (Carroll, Davies, & Richman, 1971; Harris & Jacob-son, 1972; Zeno, Ivenz, Millard, & Duvvuri, 1995). The words were chosen tosample a variety of phonological and orthographic patterns. For example, ListA contained nap and packed, and List B contained lap and locked (see theAppendix for the complete lists). The words on each list were presented in thesame order to all children. The sequence began with two consonant–vowel–con-sonant words, with longer and more complex words occurring later in the lists.A sentence was prepared using each word. Across the two lists, the sentenceswere similar in length, structure, and position of the key word within the sen-tence. For example, the sentence for nap was “The baby took a long nap,” andthe sentence for lap was “The baby sat on her mother’s lap.”
Procedure. For the written spelling condition, the child was told that he or shewould be asked to spell some words. The child’s attention was drawn to a posteron a nearby wall that showed the upper- and lower-case forms of each letter.The child was told that “we use these letters to spell words.” The experimenterasked the child to spell his or her first name. The child did this on wide-lined

Applied Psycholinguistics 21:2 187Treiman & Bourassa: Written and oral spelling
paper, the experimenter helping if necessary. One of the test lists (A or B) wasthen presented. The experimenter said each word, used it in the sentence, andthen said the word again. The child wrote the word on the paper, which hadnumbered lines for each word; if necessary, the experimenter helped the childto locate the spot for each word. The experimenter provided general encourage-ment but did not indicate whether the child’s spellings were correct or incorrect.If the child was not sure how to form a letter, the experimenter told him or herto look at the wall chart. If the experimenter could not make out a letter thechild had written, she inquired what letter the child had intended after he or shehad finished spelling the word.
The procedure for the oral spelling condition was similar to that for the writ-ten condition except that the experimenter asked the child to spell each wordout loud. Responses in this condition were tape-recorded for later verification.
During the first session, each child completed one list (A or B) in either thewritten or the oral condition. During the second session, which took place anaverage of 8 days after the first, the child completed the other list in the othercondition. The order of the written and oral conditions was balanced acrosschildren, as was the assignment of word lists to conditions.
Tests of letter-name and letter-sound knowledge were given in a third session(an average of 7 days after the second session) for the kindergartners and mostof the first graders. For the second graders and a few first graders, the letter-name and letter-sound tests were given at the end of the second session. Themain purpose of these tests was to determine whether the children knew thenames of the letters (important for the oral spelling task) and to allow for com-parisons between the children in this and the subsequent experiment. For theletter-name test, each child was shown a series of cards on which upper-caseletters were printed. There was one card for each letter of the alphabet, and theorder of the cards was randomized for each child. For each card, the child wasasked to give the name of the letter. If he or she did not respond correctly inthis free-choice situation, a follow-up question provided the child with twochoices. The letter-sound test followed the letter-name test and used the samecards. The child was asked to provide the sound of the letter on each card. Ifhe or she did not respond correctly, two alternatives were offered. The data forthe letter-name and letter-sound tasks were scored in two ways. By the strictsystem, responses were counted as correct only if the child provided the rightanswer in the free-choice situation. By the lenient system, responses were scoredas correct if the child responded correctly on either the free-choice or two-choice task.
Scoring of spellings. The children’s spellings were scored in several ways.
CORRECTNESS. Each spelling was scored as conventionally correct or incor-rect. Spellings that contained only some of the correct letters did not get anycredit in this system. Reliability for this scoring system can be assumed to be100%, since children were asked to identify any unclear letters in their writtenproductions and there is no ambiguity about the words’ correct spellings.

Applied Psycholinguistics 21:2 188Treiman & Bourassa: Written and oral spelling
COMPOSITE SPELLING SCORE. This system was designed to measure thesophistication of children’s invented spelling attempts, giving more points tospellings that captured more of the phonological and orthographic features ofthe word than to those that captured fewer. It is called a composite scoringsystem because it was designed to reflect both the phonological and ortho-graphic features of the children’s spellings. For each word, 0 points were givenfor a primitive attempt that did not include any letters (e.g., “789131416” forpacked), and full points (between 8 and 11) were given for a fully correctspelling (see Appendix for the maximum point value for each word). Spellingsthat represented more of the phonemes in the spoken form of the word (e.g.,“pat” for packed) earned more points than those that represented fewer (e.g.,“p” for packed). In addition, spellings that contained more of the conventionalorthographic features scored higher than spellings that were less conventional.For example, both “pact” and “paked” include a letter or letter group that couldrepresent each of the phonemes in packed. However, “paked” received morepoints because it included the conventional ed spelling of the past tense marker.Spellings were scored in terms of how they represented the phonemes in thespoken word rather than how they would be pronounced. For example, “paked”contains a letter or letter group that can represent each phoneme in the spokenform /pækt/, even though it would be read as /pekt/ if pronounced according toconventional English spelling-to-sound rules.
Our scoring system stemmed most directly from the work of Tangel andBlachman (1992, 1995), which in turn was based on previous studies (e.g.,Burns & Richgels, 1989; Liberman et al., 1985; Mann et al., 1987; Morris &Perney, 1984; Richgels, 1986; Zutell, 1980). Our system differed from that ofTangel and Blachman in several ways. First, because our goal was to develop asensitive test for young children, our scale was more discriminating at the lowerend. This is important because, when Tangel and Blachman (1992) gave theirspelling test near the end of the school year to kindergartners who had notreceived special instruction in phonemic awareness, 46% of the children’s spell-ings received 0 points. Any random string of symbols earned 0 points in theTangel and Blachman scheme, whether the symbols were conventional lettersor not. Our invented spelling scale gave more points to spellings that consistedof only conventional letters than to spellings that included other types of sym-bols. Thus, for packed, a string of numbers such as “789131416” received 0points, a combination of letters and numbers such as “9g” received 1 point, anda string of letters that bore no phonological relationship to the target received 2points. A second difference between our scoring system and that of Tangel andBlachman is that the maximum number of points allotted to a word varied ac-cording to its phonological and orthographic complexity. For example, a correctspelling of packed received 10 points, and a correct spelling of lap received 8points. This difference reflects the fact that packed is longer and more complexthan lap. By allotting more points to more complex words, we could be morediscriminating in the middle range of the scale.
Tangel and Blachman (1992, 1995) used the research on emergent spelling indeveloping their scale and thus gave partial credit for phonologically relatedletters such as ch for /t/ before /r/. In this example, children sometimes use ch

Applied Psycholinguistics 21:2 189Treiman & Bourassa: Written and oral spelling
Table 2. Sample spellings of lap and number of points given to each on compositespelling scale
Spelling Description Points
“2” Does not include any letters. 0“4he” Includes some letters that are not related to the sounds in
the word and some other symbols. 1“x,” “yhiji” Includes only letters, but the letters are not related to the
sounds in the word. 2“rv,” “pb” Begins with a letter that is related in sound to the initial
phoneme of the word (e.g., “r” for /l/) or begins with aletter that conventionally represents a phoneme of theword other than the first phoneme. 3
“l” Begins with conventional initial letter (which may be fol-lowed by other letters or symbols). 4
“lo,” “lvfaef” Two of the three phonemes are represented with conven-tional letters, letters that represent related sounds, or let-ters that are highly visually confusable with the conven-tional letters. Intrusions are allowed. 5
“lanp” All three phonemes are represented with conventional let-ters, letters that represent related sounds, or letters thatare highly visually confusable with the conventional let-ters. Intrusions are allowed. 6
“lop,” “lape” All three phonemes are represented and both consonants arespelled conventionally. No intrusions. 7
“lap” Conventional spelling is produced. 8
to signal the changes that occur on the /t/ of train and that make it similar tothe first part of chain (e.g., Read, 1986; Treiman, 1993). Although an error like“chran” for train is unusual from the perspective of conventional English, itaccurately captures the word’s sound. We followed Tangel and Blachman ingiving credit for phonologically related letters. We also allowed for visuallyrelated letters such as d for b on the grounds that children sometimes confusesimilar-looking letters such as these (e.g., Treiman, 1993).
Tables 2 and 3 provide sample spellings of lap and packed, respectively, andshow the number of points allotted to each spelling by our composite scoringsystem. More detailed information about the scoring criteria for each word isavailable from the authors.
To establish reliability, a second rater was extensively trained in using thecomposite scoring system. To permit comparison with the results of Tangel andBlachman (1992, 1995), we used the same two methods of measuring reliability.First, we calculated the percentage of agreement between the original rater andthe second rater for the 1,735 responses that were not used to train the raters onthe scoring criteria. (These 1,735 responses represent 95% of the total set.)Using this method, the percentage of agreement was 94%. Percentage of agree-ment for individual words ranged from 84% to 99%, generally being lower forlonger words and higher for shorter words. The second method used to establish

Applied Psycholinguistics 21:2 190Treiman & Bourassa: Written and oral spelling
Table 3. Sample spellings of packed and number of points given to each on compositespelling scale
Spelling Description Points
“789131416” Does not include any letters. 0“9g” Includes some letters that are not related to the sounds in
the word and some other symbols. 1“onf” Includes only letters, but the letters are not related to the
sounds in the word. 2“bwxz” Begins with a letter that is related in sound to the initial
phoneme of the word (e.g., “b” for /p/) or begins with aletter that conventionally represents a phoneme of theword other than the first phoneme. 3
“p,” “p10” Begins with conventional initial letter (which may be fol-lowed by other letters or symbols). 4
“pao,” “qrt” Two of the four phonemes are represented with conven-tional letters, letters that represent related sounds, or let-ters that are highly visually confusable with the conven-tional letters. Intrusions are allowed. 5
“pat,” “pata” Three of the four phonemes are represented with conven-tional letters, letters that represent related sounds, or let-ters that are highly visually confusable with the conven-tional letters. Intrusions are allowed. 6
“pact,” “pacd” All four phonemes are represented with a mix of conven-tional letters, letters that represent related sounds, andletters that are highly visually confusable with the con-ventional letters. Intrusions are allowed. 7
“pacid” All four phonemes are represented, consonant phonemesare spelled with conventional letters, and the ending isspelled with a vowel plus d. 8
“paked” All four phonemes are represented, consonant phonemesare spelled with conventional letters, and the ending isspelled as ed. 9
“packed” Conventional spelling is produced. 10
reliability of the scoring system was to compute the Pearson correlation betweenthe scores of the two raters. This correlation was 1.00 (p < .001).
PHONOLOGICAL SKELETON. To assess the phonological knowledge behindthe children’s spellings, we coded each spelling according to whether it capturedthe consonant–vowel structure of the target word. A spelling was considered toretain the phonological skeleton of the target if it consisted of an appropriatesequence of consonant and vowel graphemes. This measure was previously usedby Bruck, Treiman, Caravolas, Genesee, and Cassar (1998) to assess the attain-ment of a basic level of phonological analysis. Consider “lup” as a spelling forlap. Although this spelling is incorrect, it contains a consonant grapheme fol-lowed by a vowel grapheme followed by another consonant grapheme, thusrepresenting the consonant–vowel skeleton of lap. A child who produces this

Applied Psycholinguistics 21:2 191Treiman & Bourassa: Written and oral spelling
spelling has presumably succeeded in analyzing the basic phonological structureof the word to be spelled. In contrast, “lamp” for lap does not accurately reflectthe phonological skeleton of the target word and so was scored as incorrect bythis system.
Reliability was calculated in the same manner as for the composite score. Thepercentage of responses on which the calculations were based was 99%. By thefirst method, the percentage of agreement between the raters was 97%. Bythe second method, the correlation between the scores of the raters was .98(p < .001).
ORTHOGRAPHIC ACCEPTABILITY. A spelling was coded as orthographicallyacceptable if it contained a sequence of graphemes that may occur in Englishand as orthographically unacceptable if it contained an illegal sequence. Thissystem was previously used by Bruck et al. (1998) to assess children’s knowl-edge of, and adherence to, the orthographic patterns of English. It does notconsider a spelling’s phonological acceptability, which is reflected in some ofthe other scales. For instance, spellings of “lup” for lap and “part” for packedare orthographically acceptable because they could be (and in the second caseare) real English words. “Lvfaef” and “ptk” are not acceptable because theycontain sequences of letters that never occur in English.
Reliability was assessed as previously described, using 98% of the data. Bythe first method, the percentage of agreement between the raters was 95%. Bythe second method, there was a correlation of .99 between the scores of theraters (p < .001).
Results
Table 4 shows the scores for children’s written and oral spellings on the realword T-BEST according to each of the scoring systems. First, consider the re-sults for fully correct spellings. Correct spellings became more common acrossthe three grade levels. Kindergartners never spelled any of the words correctly,and first and second graders tended to produce more correct spellings in thewritten condition than in the oral condition. To confirm these impressions, ananalysis of variance (ANOVA) was performed with the between-subjects factorof grade (kindergarten, first, or second) and the within-subject factor of condi-tion (oral or written). There was a main effect of grade, F(2, 88) = 110.83, p <.001, a main effect of condition, F(1, 88) = 15.24, p < .001, and a significantinteraction between these two factors, F(2, 88) = 5.08, p = .008. To compare per-formance on the oral and written conditions at each grade level, t tests werecarried out using only data from the relevant comparison to construct the errorterm. In addition, given concerns about floor and ceiling effects in the data,nonparametric Wilcoxon signed ranks tests were carried out. For these follow-up tests, two-tailed p values are reported. First graders showed a tendency to-ward better performance in the written condition than in the oral condition,t(27) = 1.97, p = .059; T = 4.00, N = 14, p = .058. For second graders, writtenspelling was clearly superior to oral spelling, t(32) = 3.60, p = .001; T = 55.00,

Applied Psycholinguistics 21:2 192Treiman & Bourassa: Written and oral spelling
Table 4. Mean values on various measures for spellings produced by children inExperiment 1 (standard deviations in parentheses)
SecondKindergarten First grade grade
No. correct (max. = 10)Written 0.00 (0.00) 1.14 (0.76) 6.39 (2.85)Oral 0.00 (0.00) 0.82 (0.67) 5.79 (2.93)
Composite score (max. = 9.3)Written 3.12 (1.13) 6.51 (0.72) 8.62 (0.66)Oral 3.36 (0.96) 6.26 (0.88) 8.39 (0.78)
No. spellings with correct phonologicalskeleton (max. = 10)
Written 0.10 (0.31) 2.68 (1.72) 8.82 (1.76)Oral 0.10 (0.31) 2.14 (1.65) 8.12 (2.13)
No. orthographically acceptable spellings(max. = 10)
Written 1.90 (2.28) 5.47 (2.46) 9.09 (1.18)Oral 1.64 (1.86) 5.63 (2.32) 9.39 (0.97)
N = 25, p = .002. Kindergartners, of course, showed no difference between thetwo conditions as they produced no correct spellings in either case.
Turning to the results of the composite scoring, there was a reliable effect ofgrade, F(2, 88) = 326.89, p < .001, and an interaction of grade and condition,F(2, 88) = 7.81, p = .001. First graders received significantly higher compositescores in the written condition than in the oral condition, t(27) = 2.86, p = .008;T = 63.50, N = 25, p = .008. Second graders showed the same pattern, t(32) =4.76, p < .001; T = 71.00, N = 32, p < .001. For kindergartners, the tendency to-ward better performance in the oral condition was not statistically reliable,t(29) = 1.68, p = .10; T = 144.50, N = 28, p = .18.
We now examine children’s ability to represent the phonological skeleton ofthe words. As Table 4 shows, kindergartners were rarely able to represent theentire phonological skeleton of the word. First graders did so approximately aquarter of the time, and second graders did so substantially more often. Firstand second graders were better at representing a word’s phonological skeletonwhen they spelled the word on paper than when they spelled it aloud. Confirm-ing these impressions, the ANOVA showed a main effect of grade, F(2, 88) =291.57, p < .001, a main effect of condition, F(1, 88) = 14.64, p < .001, and aninteraction between grade and condition, F(2, 88) = 3.92, p = .023. Plannedcomparisons revealed that written spelling tended to be superior to oral spellingat the first grade level, t(27) = 2.11, p = .045; T = 63.00, N = 21, p = .058. Forsecond graders, the superiority for written over oral spelling was clearly reliable,t(32) = 3.73, p = .001; T = 29.50, N = 21, p = .002.
Finally, we turn to the results of the orthographic scoring. Across the threegrade levels there was an increase in the number of spellings that were ortho-
Applied Psycholinguistics 21:2 193Treiman & Bourassa: Written and oral spelling
graphically legal. However, there were no significant differences between thewritten and oral spelling conditions in orthographic legality. The only reliableeffect in an ANOVA using the factors of grade and condition was the maineffect of grade, F(2, 88) = 150.97, p < .001.
Discussion
The results of Experiment 1 show that the superiority for written over oralspelling that was previously found in adults and older elementary school chil-dren (Jorm & Schoknecht, 1981; Stadtlander, 1996; Tenney, 1980; Turner &Quinn, 1986) begins to emerge in first grade and is clearly present by secondgrade. Our composite scoring system, which was based on that of Tangel andBlachman (1992, 1995), was designed to go beyond the simple correct/incorrectclassification scheme of many previous studies. Higher quality invented spell-ings (e.g., “pat” for packed) received more points on the composite measurethan more primitive invented spellings (e.g., “p” for packed). By this measure,there was a statistically significant superiority for written spelling over oralspelling at both the first grade and second grade levels. When spellings werescored as correct or incorrect, the superiority for the written condition over theoral condition did not reach statistical significance for the first graders. Thismay have reflected the fact that the first graders, who were tested near thebeginning of the school year, produced few fully correct spellings (only about10%). As a result, the correctness measure may have been less sensitive thanthe composite measure for this group. By the middle of second grade, whenfully correct spellings were more prevalent (about 60%), correct spellings weresignificantly more common in written spelling than in oral spelling.
Our composite scoring system was designed to capture both phonological andorthographic aspects of spelling. In looking separately at these two aspects, wefound some evidence that the superiority for written spelling reflected primarilyphonological factors. Thus, the proportion of spellings that correctly representedthe consonant–vowel skeleton of the target word (e.g., “pakt” for packed) wassignificantly higher in the written condition than the oral condition for secondgraders. There was a trend in this direction for first graders as well, although thedifference missed significance by a nonparametric test. In terms of orthographicacceptability, there was no significant difference between oral and written spell-ing at any of the three grade levels.
The kindergartners in Experiment 1, who were tested after only a few monthsof instruction, were not able to spell any of the words correctly and hardly everrepresented the full phonological skeleton. Their average performance on thecomposite spelling scale corresponded, at best, to an ability to represent a singlesound of the target word. The kindergartners did not show the superiority forwritten over oral spelling that was seen among the older children.
Why did the first and especially the second graders do better on written spell-ing than on oral spelling? One possible explanation is based on theories ofspelling that grant a central role to a “graphemic buffer” (Caramazza, Miceli,

Applied Psycholinguistics 21:2 194Treiman & Bourassa: Written and oral spelling
Villa, & Romani, 1987; Margolin, 1984). According to such theories, spellingcomprises two major stages. In the first and more central stage, a graphemicrepresentation is generated. This representation is either constructed on the basisof a word’s linguistic form or, in the case of familiar words, retrieved frommemory. In the second and more peripheral stage of the spelling process, anoutput is generated based on the graphemic representation. The output can be ahandwritten spelling or an oral string of letter names, among other possibilities.The graphemic buffer mediates between the two stages, temporarily holding anabstract representation of a word’s spelling prior to its conversion into lettershapes or letter names. With written spelling, the load on the graphemic bufferis relatively small because there is an external record of which letters have beenproduced. With oral spelling, there is no such external memory to help withplace-keeping. Letters in the graphemic buffer may thus be omitted, duplicated,or reversed.
To test the graphemic buffer view, we examined each incorrect oral and writ-ten spelling for any instance of a letter omission, letter duplication, or lettersequence reversal (or any combination thereof). We then calculated the propor-tion of incorrect spellings containing any of these errors for the oral and writtenconditions of each child. This dependent measure was subjected to an ANOVAusing the factors of grade and condition. There was a main effect of grade, F(2,82) = 12.94, p < .001, indicating that the proportion of errors containing letteromissions, duplications, and/or reversals increased with grade level (M = .15,.33, and .46 for kindergarten, first grade, and second grade, respectively). Impor-tantly, neither the main effect of condition, F(1, 82) = 1.35, p > .20, nor thegrade by condition interaction (F < 1) was reliable. These results are clearlyinconsistent with the graphemic buffer view, which predicts a larger proportionof letter omissions, duplications, and reversals in the oral condition as comparedto the written condition.
Before considering other possible explanations for the superiority of writtenspelling over oral spelling in early elementary school children, we wished todetermine whether a similar superiority for written spelling would be found fornonwords. We therefore carried out a second experiment in which children wereasked to spell unfamiliar nonsense words rather than familiar real words. Theparticipants in Experiment 2 were kindergartners and first graders.
Another goal of Experiment 2 was to develop a nonword spelling test forwhich overall quality of spellings, maintenance of the phonological skeleton,and orthographic legality could be reliably scored. As mentioned earlier, previ-ous studies that developed measures of overall spelling quality used real wordsas stimuli (Burns & Richgels, 1989; Liberman et al., 1985; Mann et al., 1987;Morris & Perney, 1984; Richgels, 1986; Tangel & Blachman, 1992, 1995; Zu-tell, 1980). It has been suggested that nonword spelling tests provide a moresensitive measure of children’s ability to construct spellings than do many realword spelling tests (e.g., Stuart & Masterson, 1992). Children must use sublexi-cal procedures to construct the spellings of nonwords; they cannot retrieve theentire spelling of a nonword from memory in the same way that they can re-trieve the spelling of a familiar word like no or mom. It is thus important todevelop sensitive and reliable tests of nonword spelling.

Applied Psycholinguistics 21:2 195Treiman & Bourassa: Written and oral spelling
Table 5. Background information about children in Experiment 2
Kindergarten First grade
Number of children 28 (15 M, 13 F) 30 (15 M, 15 F)Mean age (range) 6;2 (5;5–6;10) 7;3 (6;8–7;9)Mean no. correct on letter-name task, strict
scoring (SD) 24.9 (2.1) 26.0 (0.0)Mean no. correct on letter-name task, lenient
scoring (SD) 26.0 (0.0) 26.0 (0.0)Mean no. correct on letter-sound task, strict
scoring (SD) 22.5 (4.0) 24.5 (1.9)Mean no. correct on letter-sound task, lenient
scoring (SD) 25.6 (0.9) 26.0 (0.0)
Note: Maximum score on letter-name and letter-sound tasks = 26.
EXPERIMENT 2
Method
Participants. Table 5 provides background information about the children whocompleted Experiment 2. The children were tested in the latter part of the schoolyear (late March to early June for the kindergartners, and May for the firstgraders). As in Experiment 1, all of the children attended schools in middle-class suburban areas, and all were native speakers of English. Again, the chil-dren were predominantly Caucasian. The instructional methods were similar tothose used in Experiment 1. The children’s knowledge of letter names and lettersounds was found to be better than in Experiment 1, most likely because thetesting took place later in the school year.
Stimuli. The nonword version of the T-BEST contained two lists of 10 stimuli,List A and List B. The stimuli, which were unfamiliar nonwords for children,were similar in phonological structure to the real words used in Experiment 1.The stimuli are listed in the Appendix in their order of presentation.
Procedure. For the written spelling condition, the child was told that he or shewould be asked to spell some “words.” The child’s attention was drawn to anearby poster that showed the upper- and lower-case forms of each letter, andhe or she was told that “we use these letters to spell words.” The experimenterfirst asked the child to spell his or her first name. The experimenter then saidthat the child would be asked to spell some “made-up words.” The experimentersaid each nonword three times and asked the child to repeat it. He or she wasgiven three chances to do so. In those rare cases in which a child did not cor-rectly repeat a nonword after three tries, his or her spelling of that stimulus wasnot scored. After saying each nonword, the child spelled it on the answer sheet.The answer sheet had spaces for each item, but the spaces were not numberedas they were in Experiment 1. This change was made because we felt that the

Applied Psycholinguistics 21:2 196Treiman & Bourassa: Written and oral spelling
use of numbered spaces may have led some of the kindergartners in Experiment1 to include numbers in their spellings. The experimenter encouraged the childto write something for each nonword. If the child was unsure how to form aletter, the experimenter told him or her to look at the wall chart. If the experi-menter could not make out a letter the child had written, he or she inquiredwhat letter the child had intended after the child had finished spelling the item.The procedure for the oral spelling condition was similar except that the experi-menter asked the child to spell each stimulus aloud.
During the first session, each child completed one list (A or B) in either thewritten or the oral condition. During the second session, which took place anaverage of 6 days after the first, the child completed the other list in the othercondition. The order of the written and oral spelling conditions and the assign-ment of word lists to conditions were balanced across children.
Each child was also given a test of letter-name knowledge and a test of letter-sound knowledge. These tests took place in a third session (an average of 4 daysafter the second session) for most of the kindergartners. For the first graders andsome of the kindergartners, the letter-name and letter-sound tests were given atthe end of the second session. The procedure and scoring for these tests werethe same as in Experiment 1, the only difference being that the order of theletter-name and letter-sound tests was randomly chosen for each child.
Scoring of spellings. The children’s spellings on the nonword version of theT-BEST were scored in several ways.
COMPOSITE SPELLING SCORE. The composite scoring system that was de-veloped for the real words of Experiment 1 was modified for use with thenonwords of Experiment 2. Because the nonwords were similar in phonologicalstructure to the real words, the scales were similar. The maximum point valuefor each word is shown in the Appendix. Note that the maximum values for/bIkt/ and /mækt/ were less than those for the phonologically similar real wordspacked and locked of Experiment 1 because spellings such as “bict” and “makt”received as many points as those such as “bicked” and “macked.” In the caseof packed and locked, the highest scores were reserved for spellings with finaled. Detailed information about the scoring criteria for each item is availablefrom the authors.
To establish reliability, a second rater was trained to use the composite scor-ing system. Percentage of agreement between the original rater and the secondrater for the responses that were not used to train the raters on the scoringcriteria was 93%. (These responses represent 97% of the total set of responses.)The Pearson correlation between the scores of the two raters was 1.00 (p <.001).
PHONOLOGICAL SKELETON. We coded each spelling according to whetherit captured the consonant–vowel structure of the target word, following the sameguidelines as in Experiment 1. Reliability was calculated in the same manner asfor the composite score. By the first method, the percentage of agreement be-
Applied Psycholinguistics 21:2 197Treiman & Bourassa: Written and oral spelling
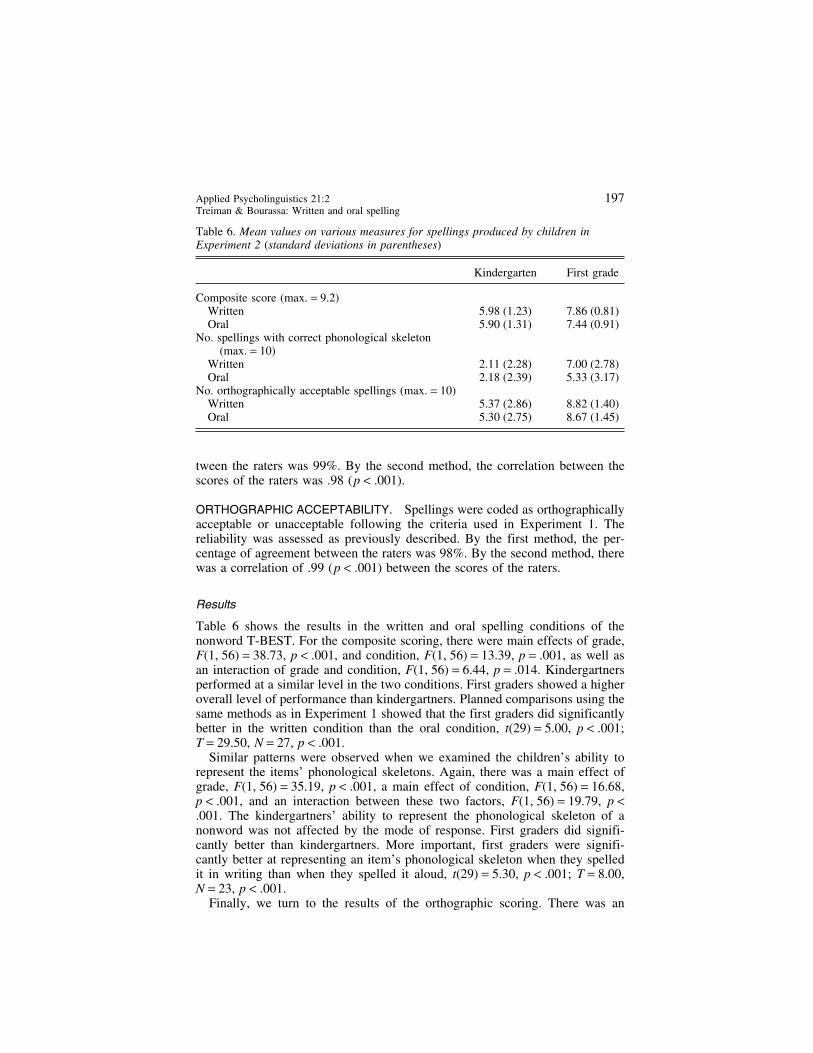
Table 6. Mean values on various measures for spellings produced by children inExperiment 2 (standard deviations in parentheses)
Kindergarten First grade
Composite score (max. = 9.2)Written 5.98 (1.23) 7.86 (0.81)Oral 5.90 (1.31) 7.44 (0.91)
No. spellings with correct phonological skeleton(max. = 10)
Written 2.11 (2.28) 7.00 (2.78)Oral 2.18 (2.39) 5.33 (3.17)
No. orthographically acceptable spellings (max. = 10)Written 5.37 (2.86) 8.82 (1.40)Oral 5.30 (2.75) 8.67 (1.45)
tween the raters was 99%. By the second method, the correlation between thescores of the raters was .98 (p < .001).
ORTHOGRAPHIC ACCEPTABILITY. Spellings were coded as orthographicallyacceptable or unacceptable following the criteria used in Experiment 1. Thereliability was assessed as previously described. By the first method, the per-centage of agreement between the raters was 98%. By the second method, therewas a correlation of .99 (p < .001) between the scores of the raters.
Results
Table 6 shows the results in the written and oral spelling conditions of thenonword T-BEST. For the composite scoring, there were main effects of grade,F(1, 56) = 38.73, p < .001, and condition, F(1, 56) = 13.39, p = .001, as well asan interaction of grade and condition, F(1, 56) = 6.44, p = .014. Kindergartnersperformed at a similar level in the two conditions. First graders showed a higheroverall level of performance than kindergartners. Planned comparisons using thesame methods as in Experiment 1 showed that the first graders did significantlybetter in the written condition than the oral condition, t(29) = 5.00, p < .001;T = 29.50, N = 27, p < .001.
Similar patterns were observed when we examined the children’s ability torepresent the items’ phonological skeletons. Again, there was a main effect ofgrade, F(1, 56) = 35.19, p < .001, a main effect of condition, F(1, 56) = 16.68,p < .001, and an interaction between these two factors, F(1, 56) = 19.79, p <.001. The kindergartners’ ability to represent the phonological skeleton of anonword was not affected by the mode of response. First graders did signifi-cantly better than kindergartners. More important, first graders were signifi-cantly better at representing an item’s phonological skeleton when they spelledit in writing than when they spelled it aloud, t(29) = 5.30, p < .001; T = 8.00,N = 23, p < .001.
Finally, we turn to the results of the orthographic scoring. There was an

Applied Psycholinguistics 21:2 198Treiman & Bourassa: Written and oral spelling
increase from kindergarten to first grade in the number of spellings that wereorthographically legal. However, there were no significant differences betweenthe written and oral spelling conditions. The only reliable effect in an ANOVAusing the factors of grade and condition was the main effect of grade, F(1, 56)= 37.87, p < .001.
Discussion
The results of Experiment 2 are similar to those of Experiment 1 but are evenmore robust. In both experiments, kindergartners showed no significant differ-ences between written and oral spelling. The nonsignificant trend in Experiment1 for kindergartners to receive higher composite scores in the oral condition thanin the written condition was not replicated here. We also found in Experiment 2that first graders produced significantly higher quality spellings in the writtencondition than in the oral condition. This was true according to both the compos-ite measure (where the difference was also significant in Experiment 1) and thephonological measure (where the difference did not reach significance by anonparametric test in Experiment 1). In terms of orthographic legality, chil-dren’s spellings did not differ reliably across the two conditions. This was thesame pattern that was found in Experiment 1.
GENERAL DISCUSSION
In two experiments, we discovered that the superiority for written spelling overoral spelling, previously found among adults and older elementary school chil-dren (Jorm & Schoknecht, 1981; Stadtlander, 1996; Tenney, 1980; Turner &Quinn, 1986), is also present as early as first and second grade. First gradersshowed a significant superiority for written spelling in terms of our compositescore, both with real words (Experiment 1) and with nonwords (Experiment 2).With nonwords, first graders were also better at capturing an item’s phonologi-cal skeleton when they spelled it on paper than when they spelled it aloud(Experiment 2). First graders showed a trend in the same direction for realwords, and that trend was significant by the middle of second grade (Experiment1). When spellings of real words were scored in terms of correctness, the superi-ority for written spelling over oral spelling missed significance for first gradersbut was significant for second graders (Experiment 1). Thus, rather than beingrestricted to highly skilled spellers, the advantage for written spelling is evidentfrom an early age.
What makes written spelling superior to oral spelling for children in earlyelementary school and above? As we have discussed, one hypothesis places thesuperiority of written spelling over oral spelling at the level of the graphemicbuffer, the temporary store in which spellings are thought to be maintained priorto output (Caramazza et al., 1987; Margolin, 1984). In this view, read-out fromthe graphemic buffer is facilitated when the speller can easily track which lettershave been produced and which have not yet been produced. The graphemicbuffer hypothesis predicts that omissions, repetitions, and reversals of lettersshould be more frequent in the oral condition than in the written condition.

Applied Psycholinguistics 21:2 199Treiman & Bourassa: Written and oral spelling
However, we did not find this to be the case in an analysis of children’s realword spellings in Experiment 1. The finding that orthographically illegal errorsdid not differ between the oral and written conditions in either Experiment 1 orExperiment 2 also provides evidence against the graphemic buffer view. On thisview, errors in the oral condition should often be orthographically illegal, as in“np” for nap (omission) or “naap” for nap (doubling).
Another possible explanation for the superiority of written over oral spellingis based on the idea that spelling involves a generate-and-test process (Simon &Simon, 1973). On this view, people generate a trial spelling and then use theirknowledge of reading to test the spelling. If there is a mismatch, a new spellingis produced. The generate-and-test process works best when the trial spellingcan be viewed in a form that has often been encountered in reading (e.g., ahandwritten or typed form). When the spelling is produced orally, a generate-and-test process is difficult to use. The generate-and-test view predicts that asuperiority for written spelling over oral spelling should be found primarily forreal words. Nonwords, the spellings of which look unfamiliar, should not showa difference. However, the results of Experiment 2 showed that first graderswere better at written spelling than oral spelling even for nonwords. The gener-ate-and-test view further predicts that written spelling should surpass oral spell-ing in the use of legal letter sequences. This is because candidate spellings withillegal sequences look unfamiliar and are subject to change. However, we foundno difference in orthographic legality between written and oral spelling in eitherexperiment.
Given the lack of support for either the graphemic buffer hypothesis or thegenerate-and-test hypothesis, we put forward an alternative hypothesis – the lin-guistic hypothesis. On this view, the superiority for written spelling over oralspelling arises as people analyze a word’s linguistic structure and construct aspelling – not as they hold a complete spelling in memory prior to output. Whenthe complete spelling of an item is not stored in memory (as was the case for thenonwords and probably many of the real words in these experiments), childrenmust analyze the item into smaller units and decide how to symbolize each unitin print. Spellers can do this most easily when the interim and final results oftheir analyses can be represented in a visible and lasting form. Writing, whichprovides a material representation of a word’s phonological structure, is idealfor this purpose. Our finding that children were better able to represent theconsonant–vowel structure of words in the written condition than in the oralcondition is consistent with the linguistic hypothesis. Also consistent with thehypothesis is that the differences between the written and the oral conditionsappeared primarily in the ability to represent the phonological structure of thestimuli.
Further support for the idea that the phonological analysis of spoken wordsis facilitated when the results can be represented in a visible form comes fromfindings reviewed by Elkonin (1971). In these studies, preschoolers were trainedto segment spoken words into phonemes and to pronounce the phonemes sepa-rately. When children were taught the segmentation task with no external aids,their performance was poor. When children were provided with visual aids (col-ored poker chips to represent the phonemes and a series of boxes in which to
Applied Psycholinguistics 21:2 200Treiman & Bourassa: Written and oral spelling
place the chips), they did much better. Many of the children who learned thesegmentation task using the external supports were later able to perform the taskwhen the props were removed. Elkonin attributed children’s poor performancein the standard condition to the continuity of speech – the fact that phonemesblend into one another during the pronunciation of spoken words. In his view,the external aids help children to conceptualize a word as a sequence of separateunits. Lewkowicz and Low (1979) also reported positive effects for visual aidsamong U.S. kindergartners, at least when children are first learning the segmen-tation task.
For older children and adults, as for younger children, concrete symbols seemto facilitate thinking about the separate phonemes in words. For them, lettersare the ideal symbols. The use of orthographic images often helps people ana-lyze the phonological structure of words. However, it can sometimes lead themastray. For example, adults may judge that ox contains two sounds rather thanthree because the word is spelled with two letters (Moats, 1994). Effects oforthographic knowledge appear to emerge at an early age. For example, Treimanand Cassar (1997a) asked first graders and college students to indicate whetherspoken syllables contained one or two “sounds.” With syllables that could belabeled by a single letter, such as /εl/ (l), /ar/ (r), or /ai/ (i), people often gave“one-sound” responses. With otherwise similar two-phoneme syllables thatcould not be labeled by a single letter, such as /æl/, “two-sound” responseswere more common. These effects were as strong for first graders as for adults,indicating that even young children use the visual representation provided byorthography when analyzing the phonological composition of spoken words.
Additional evidence suggests that orthographic representations are useful inremembering novel phonological forms. Ehri and Wilce (1979) found that youngchildren have difficulty remembering meaningless syllables, but that perfor-mance improves when they are shown spellings for the syllables. Seeing a sylla-ble’s spelling was more effective than hearing the syllable spelled aloud or sayingthe syllable an extra time (Ehri & Wilce, 1979, Experiment 3). Given the supportthat visual cues provide for phonological memory and phonological analysis, writ-ten spelling may encourage the use of a phonological spelling strategy.
Our linguistic hypothesis assumes that written spelling is beneficial becauseit provides a concrete, visible representation of a word’s phonological form.One plausible alternative hypothesis is that there is something about the motoract of writing that is particularly helpful. Research by Hulme and Bradley (1984)is consistent with this alternative view. Their results suggest that writing a wordon paper is a more effective way of learning its spelling than forming the wordwith letter tiles. Similarly, Cunningham and Stanovich (1990) found that hand-writing was superior to arranging letter tiles or typing the word on a computerkeyboard. However, Vaughn, Schumm, and Gordon (1992) were unable to repli-cate this result. They found no significant differences among writing, sortingletter tiles, and typing on a computer as a means of learning a word’s spelling.Nor did Berninger and colleagues (1998) find an overall superiority for writingas a response mode in learning to spell words. Writing a word with a pencil,arranging letter tiles to spell a word, or typing a word on a computer keyboardwith the result displayed on the screen all yield a visible record of the word’s

Applied Psycholinguistics 21:2 201Treiman & Bourassa: Written and oral spelling
structure. The provision of such a record may be the primary factor that accountsfor the superiority of written spelling over oral spelling for children in earlyelementary school and above.
In our experiments, kindergarten children did not show the superiority forwritten spelling that older children did. Why not? The data of Lewkowicz andLow (1979) suggest that simple and understandable visual supports can be help-ful for kindergartners. However, kindergartners write so slowly and laboriouslythat self-generated print may not serve as a useful aid for them. This explanationis consistent with the finding of Berninger et al. (1998) that, among secondgraders with spelling problems, difficulties in handwriting can exacerbate spell-ing difficulties.
To summarize, our results suggest that the linguistic analysis of spoken words– a major component of spelling – is facilitated when the results of the analysiscan be represented in a visible and lasting form. Written spelling provides thisbenefit. Spellings produced in this manner are thus more accurate representationsof words’ phonological forms than spellings that are produced orally.
An additional goal of our research was to refine existing methods of assessingchildren’s spelling errors on real words and to extend these systems to non-words. The real word version of the T-BEST developed for Experiment 1 builton tests and methods developed in previous studies (e.g., Burns & Richgels,1989; Liberman et al., 1985; Mann et al., 1987; Morris & Perney, 1984; Rich-gels, 1986; Tangel & Blachman, 1992, 1995; Zutell, 1980). It incorporated someimprovements over the earlier systems that make it especially useful for begin-ning spellers, such as improved discrimination at the lower end of the scale. ForExperiment 2, we developed a nonword version of the T-BEST that could bescored in a similar manner. Given that nonword spelling is a good measure ofability to use sublexical procedures, this is a useful contribution.
Additional work is needed to improve our spelling tests and scoring measuresand to verify that our composite measure is a more sensitive measure of perfor-mance than traditional correct/incorrect measures. In developing the compositemeasure, we were fairly lenient in what we counted as related letters becausewe wanted to credit children’s primitive attempts to represent a word’s structure.For example, producing “b” for packed would receive 3 of a possible 10 pointsbecause we considered b, which differs from /p/ only in voicing, an attempt torepresent the word’s first phoneme. Tangel and Blachman (1992, 1995) alsoallowed for such voicing errors, a decision that is supported by studies demon-strating children’s tendency to confuse phonemes that differ only in voicing(e.g., Treiman, Broderick, Tincoff, & Rodriguez, 1998). Our policy, howeverwell motivated, meant that in a few cases responses received higher scores thanthey probably deserved. As perhaps the most extreme example, a kindergartner’s“aabbccdde” for lap received 5 of a possible 8 points because a counted as aspelling of the word’s vowel and b counted as an attempt to represent the /p/,with the other letters counting as intrusions and not detracting from the score.It is not always clear how to distinguish between spellings that are real attemptsto represent the sounds in the spoken word and those that are not, and our scaleneeds further refinement in this area. An additional goal is to develop computer-based scoring systems that are easy for teachers and test administrators to use.
Applied Psycholinguistics 21:2 202Treiman & Bourassa: Written and oral spelling
Despite the limitations of the T-BEST, we believe that it is an importantstep toward being able to evaluate the quality of young children’s spellings. Byexamining the nature of children’s spelling errors, we can gain more informationthan by simply categorizing the spellings as correct or incorrect. This knowledgeshould be useful for teachers, helping them determine where children are intheir development and what they need to learn next. The knowledge should alsobe useful to the children themselves. It can help them understand that, even iftheir knowledge of the complex English writing system is not yet perfect, theyare progressing in mastering the system.
APPENDIX
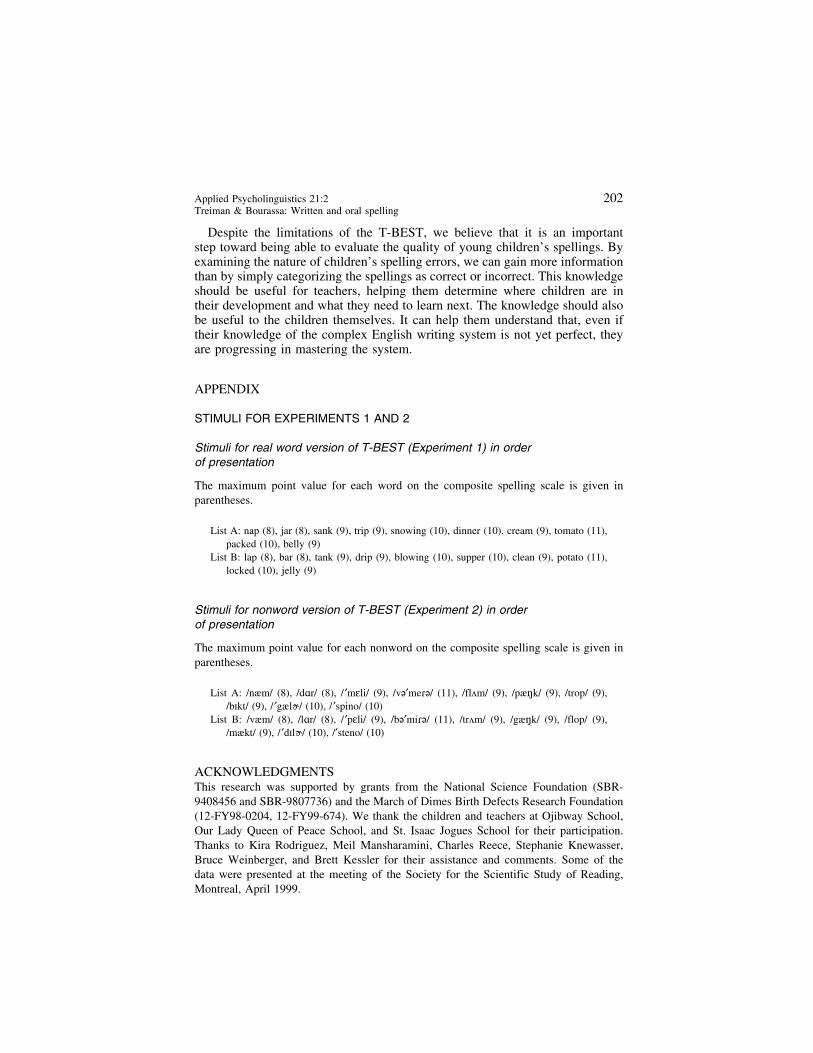
STIMULI FOR EXPERIMENTS 1 AND 2
Stimuli for real word version of T-BEST (Experiment 1) in orderof presentation
The maximum point value for each word on the composite spelling scale is given inparentheses.
List A: nap (8), jar (8), sank (9), trip (9), snowing (10), dinner (10), cream (9), tomato (11),packed (10), belly (9)
List B: lap (8), bar (8), tank (9), drip (9), blowing (10), supper (10), clean (9), potato (11),locked (10), jelly (9)
Stimuli for nonword version of T-BEST (Experiment 2) in orderof presentation
The maximum point value for each nonword on the composite spelling scale is given inparentheses.
List A: /næm/ (8), /dar/ (8), / ′mεli/ (9), /vE′me2E/ (11), /fl8m/ (9), /pænk/ (9), /trop/ (9),/bIkt/ (9), / ′gæl7/ (10), / ′spino/ (10)
List B: /væm/ (8), /lar/ (8), / ′pεli/ (9), /bE′mi2E/ (11), /tr8m/ (9), /gænk/ (9), /flop/ (9),/mækt/ (9), / ′dIl7/ (10), /′steno/ (10)
ACKNOWLEDGMENTSThis research was supported by grants from the National Science Foundation (SBR-9408456 and SBR-9807736) and the March of Dimes Birth Defects Research Foundation(12-FY98-0204, 12-FY99-674). We thank the children and teachers at Ojibway School,Our Lady Queen of Peace School, and St. Isaac Jogues School for their participation.Thanks to Kira Rodriguez, Meil Mansharamini, Charles Reece, Stephanie Knewasser,Bruce Weinberger, and Brett Kessler for their assistance and comments. Some of thedata were presented at the meeting of the Society for the Scientific Study of Reading,Montreal, April 1999.

Applied Psycholinguistics 21:2 203Treiman & Bourassa: Written and oral spelling
REFERENCESBerninger, V., Abbott, R., Rogan, L., Reed, E., Abbott, S., Brooks, A., Vaughan, K., & Graham, S.
(1998). Teaching spelling to children with specific learning disabilities: The mind’s ear andeye beat the computer or pencil. Learning Disability Quarterly, 21, 106–122.
Bruck, M., Treiman, R., Caravolas, M., Genesee, F., & Cassar, M. (1998). Spelling skills of childrenin whole language and phonics classrooms. Applied Psycholinguistics, 19, 669–684.
Burns, J. M., & Richgels, D. J. (1989). An investigation of task requirements associated with theinvented spellings of 4-year-olds with above average intelligence. Journal of Reading Behav-ior, 21, 1–14.
Caramazza, A., Miceli, G., Villa, G., & Romani, C. (1987). The role of the Graphemic Buffer inspelling: Evidence from a case of acquired dysgraphia. Cognition, 26, 59–85.
Carroll, J. B., Davies, P., & Richman, B. (1971). Word frequency book. Boston: Houghton Mifflin.Cunningham, A. E., & Stanovich, K. E. (1990). Early spelling acquisition: Writing beats the com-
puter. Journal of Educational Psychology, 82, 159–162.Ehri, L. C. (1986). Sources of difficulty in learning to spell and read. In M. L. Wolraich &
D. Routh (Eds.), Advances in developmental and behavioral pediatrics (Vol. 7, pp. 121–195). Greenwich, CT: JAI Press.
Ehri, L. C., & Wilce, L. S. (1979). The mnemonic value of orthography among beginning readers.Journal of Educational Psychology, 71, 26–40.
Elkonin, D. B. (1971). The development of speech. In A. V. Zaporozhets & D. B. Elkonin (Eds.),The psychology of preschool children (pp. 111–185). Cambridge, MA: MIT Press.
Gentry, J. R. (1982). An analysis of developmental spelling in GNYS AT WRK. The ReadingTeacher, 36, 192–200.
Harris, A. J., & Jacobson, M. D. (1972). Basic elementary reading vocabulary. London: Macmillan.Henderson, E. H., & Beers, J. W. (Eds.). (1980). Developmental and cognitive aspects of learning
to spell: A reflection of word knowledge. Newark, DE: International Reading Association.Hulme, C., & Bradley, L. (1984). An experimental study of multi-sensory teaching with normal and
retarded readers. In R. Malatesha & H. Whitaker (Eds.), Dyslexia: A global issue (pp. 431–443). The Hague: Nijhoff.
Jorm, A. F., & Schoknecht, C. (1981). Role of visual word-recognition checks in children’s spelling.Australian Journal of Psychology, 33, 393–403.
Lewkowicz, N. K., & Low, L. Y. (1979). Effects of visual aids and word structure on phonemicsegmentation. Contemporary Educational Psychology, 4, 238–252.
Liberman, I. Y., Rubin, H., Duques, S., & Carlisle, J. (1985). Linguistic abilities and spelling profi-ciency in kindergarteners and adult poor spellers. In D. B. Gray & J. F. Kavanagh (Eds.),Biobehavioral measures of dyslexia (pp. 163–176). Parkton, MD: New York Press.
Mann, V. A., Tobin, P., & Wilson, R. (1987). Measuring phonological awareness through the in-vented spellings of kindergarten children. Merrill–Palmer Quarterly, 33, 354–391.
Margolin, D. I. (1984). The neuropsychology of writing and spelling: Semantic, phonological, mo-tor, and perceptual processes. Quarterly Journal of Experimental Psychology, 36A, 459–489.
Moats, L. C. (1994). The missing foundation in teacher education: Knowledge of the structure ofspoken and written language. Annals of Dyslexia, 44, 81–102.
Morris, D., & Perney, J. (1984). Developmental spelling as a predictor of first-grade readingachievement. Elementary School Journal, 84, 441–457.
Perfetti, C. A., Rieben, L., & Fayol, M. (Eds.). (1997). Learning to spell: Research, theory, andpractice across languages. Mahwah: NJ: Erlbaum.
Read, C. (1986). Children’s creative spelling. London: Routledge & Kegan Paul.Richgels, D. J. (1986). An investigation of preschool and kindergarten children’s spelling and read-
ing abilities. Journal of Research and Development in Education, 19, 41–47.Rittle-Johnson, B., & Siegler, R. S. (1999). Learning to spell: Variability, choice, and change in
children’s strategy use. Child Development, 70, 332–348.Simon, D. P., & Simon, H. A. (1973). Alternative uses of phonemic information in spelling. Review
of Educational Research, 43, 115–137.Stadtlander, L. (1996, November). Why is it so difficult to spell a word aloud? Paper presented at
the Psychonomic Society, Chicago, IL.Stuart, M., & Masterson, J. (1992). Patterns of reading and spelling in 10-year-old children related to

Applied Psycholinguistics 21:2 204Treiman & Bourassa: Written and oral spelling
prereading phonological abilities. Journal of Experimental Child Psychology, 54, 168–187.Tangel, D. M., & Blachman, B. A. (1992). Effect of phoneme awareness instruction on kindergarten
children’s invented spelling. Journal of Reading Behavior, 24, 233–261.(1995). Effect of phoneme awareness instruction on the invented spelling of first-grade children:
A one-year follow-up. Journal of Reading Behavior, 27, 153–185.Tenney, Y. J. (1980). Visual factors in spelling. In U. Frith (Ed.), Cognitive processes in spelling
(pp. 215–229). London: Academic.Treiman, R. (1993). Beginning to spell: A study of first-grade children. New York: Oxford Univer-
sity Press.Treiman, R., Broderick, V., Tincoff, R., & Rodriguez, K. (1998). Children’s phonological aware-
ness: Confusions between phonemes that differ only in voicing. Journal of ExperimentalChild Psychology, 68, 3–21.
Treiman, R., & Cassar, M. (1997a). Can children and adults focus on sound as opposed to spellingin a phoneme counting task? Developmental Psychology, 33, 771–780.
(1997b). Spelling acquisition in English. In C. A. Perfetti, L. Rieben, & M. Fayol (Eds.), Learningto spell: Research, theory, and practice across languages (pp. 61–80). Hillsdale, NJ: Erl-baum.
Turner, I. F., & Quinn, E. (1986). Learning English spellings: Strategies employed by primaryschool boys. Educational Psychology, 6, 231–241.
Varnhagen, C. K., McCallum, M., & Burstow, M. (1997). Is children’s spelling naturally stage-like? Reading and Writing: An Interdisciplinary Journal, 9, 451–481.
Vaughn, S., Schumm, J. S., & Gordon, J. (1992). Early spelling acquisition: Does writing reallybeat the computer? Learning Disability Quarterly, 15, 223–228.
Wilkinson, G. (1993). The Wide Range Achievement Test (3rd ed.). Wilmington, DE: Wide Range.Zeno, S. M., Ivenz, S. H., Millard, R. T., & Duvvuri, R. (1995). Educator’s word frequency guide.
Brewster, NY: Touchstone Applied Science Associates.Zutell, J. (1980). Children’s spelling strategies and their cognitive development. In E. H. Hender-
son & J. W. Beers (Eds.), Developmental and cognitive aspects of learning to spell: Areflection of word knowledge (pp. 52–73). Newark, DE: International Reading Association.