Embed Size (px)
Citation preview

CHILD POVERTY AND DEPRIVATION IN BELGIUM
Anne-Catherine Guio, LISER See for details Guio, Vandenbroucke, Vinck (2014)

Why child poverty should be a priority? • Large scale problem: in BE around 420.000 children (<18 years).
• Not a residual problem which can be solved by economic growth on its own.
• Some societal changes increase the risk of child poverty persisting in the future.
• Poverty threats all fundamental children’s rights.
• Intergenerational impact: consequences on nutrition, health, educational attainments, self-esteem and social relations, with long-term impact: poor children are less likely to reach their full potential when they grow up and have a higher risk of living in poverty as adults.
• Investing in children living in poverty leads to economic benefits and savings in social costs in long term. It is more costly and less successful to redress the causes of poverty at a later stage.
2

Ecarts de performances selon le statut socioéconomique
(PI SA 2012, mat h.) Sour ce: Ar yane Baye (ULG)
3
117
112
90
0 20 40 60 80 100 120 140
France
Hongrie
Communauté flamande
Fédération Wallonie-Bruxelles
Luxembourg
Portugal
République tchèque
Allemagne
Pologne
Autriche
Etats-Unis
Espagne
Moyenne Ocdé
Grèce
Suisse
Australie
Royaume-Uni
Danemark
Irlande
Pays-Bas
Corée
Japon
Italie
Suède
Canada
Finlande
Norvège
Islande
Estonie
Communauté germanophone
L’équivalent de 3 années d’études

4
Source: Bellani & Bia (2014)
Probabilité de vivre en pauvreté une fois adulte, quand on l’a été durant l’enfance

Multiple indicators
Income poverty
• Living in household (hhd) whose net equivalised income is below 60% of the national median (equivalised) income
Relative approach, national income threshold. Poverty threshold for a couple with two children (€2100) vs. poverty threshold for a single (€1000).
• Assumption: intra-hhd equal sharing of resources.
• At regional level, national threshold used for conceptual reason (cost not lower in WA and BR than in FL, social transfers/wages do not differ important to compare each region with the federal threshold).
Material Deprivation (MD)
• Equal income >< equal outcomes, because:
Wealth and debt may differ
Needs and costs may differ
Measurement problems on both sides
• MD: suffer from at least 3 enforced lacks (out of nine items).
More absolute approach, common list of items across the EU & common threshold.
• Guio, Gordon and Marlier (2012) propose a child specific deprivation indicator (18 items).
5

Child income poverty risk
0
5
10
15
20
25
30
35
40
45
AROP60 Child [0-17] AROP60 TotalChild 0-17 Total population
Source: EU-SILC 2011
! If compared to EU Regions, around 20 regions performs better/same as FL (around 10 regions /same as BR).

Child income poverty vs. child-specific material deprivation
0
10
20
30
40
50
60
70
80
90
AROP60 [1-15] CHMD3 [1-15]Income poverty Deprivation
7
Source: EU-SILC 2009

Regional disparities are not an exception… But require specific in depth analysis and adequate policy respons

Child deprivation: children’s daily living conditions
0 5 10 15 20 25 30 35 40
Cumulate 3 or more problems
Indoor games
Fruits & vegetables daily
Outdoor leisure equiment
Meat, chicken or fish daily
Suitable books
School trips
Two pairs of shoes
Celebrations
Invite friends
Computer & Internet
Car
Some new clothes
Place to do homework
Home adequately warm
Leisure activities
Arrears
Replace worn-out furniture
Holiday (1 week/year)
Wallonia Flanders Brussels
High diversity among Belgian regions large disparities in daily living conditions of children within the country.
9
Source: EU-SILC 2009

Risk factors – child deprivation – odds ratios – longitudinal survey
0
1
2
3
4
5
6
owner ln(equivalised
income)
VL Number ofyears inpoverty
primaryeducation
VLWI lowersecondaryeducation
Single parent
Significantly increase deprivation
Significantly decrease deprivation
VLWI=very low work intensity in the household

0
10
20
30
40
50
60
70
80
90
AROP60 in verylow WI HHs
AROP60 in lowWI HHs
AROP60 inmedium WI HHs
AROP60 in highWI HHs
AROP60 in veryhigh WI HHs
FL & WA - child poverty risk by work intensity (WI) group
FL ARP WA ARP
Child income poverty risk and work intensity of the household
• Low poverty risk for hhds in employment.
• BUT very high risk of poverty for those living in VLWI (both in FL and WA).
11
Source: EU-SILC 2009

Lone parents (LP)
• Children living in LP hhds are at high risk of poverty: BE (43,3%), FL (24,9%) and WA (60,5%) whereas the EU27 average is 37,3% (2011).
• Share of children living in LP in WA is among the highest in the EU (19,5%) (2011).
• Children in LP have higher probability to live in very low work intensity households (VLWI)
• But poverty/deprivation risk remains high for lone parents working
12

Lone parents: impact of work intensity on child deprivation
Child deprivation risk declines with work intensity for both household types, but gradient less steep for lone parents deprivation risk remains high for lone parents working.
13
Source: EU-SILC 2009
0
10
20
30
40
50
60
70
80
Ch
ild-s
pe
cifi
c M
D3
+ r
isk
(%)
Hhd work intensity (3 groups)
Single parents
Other householdswith children
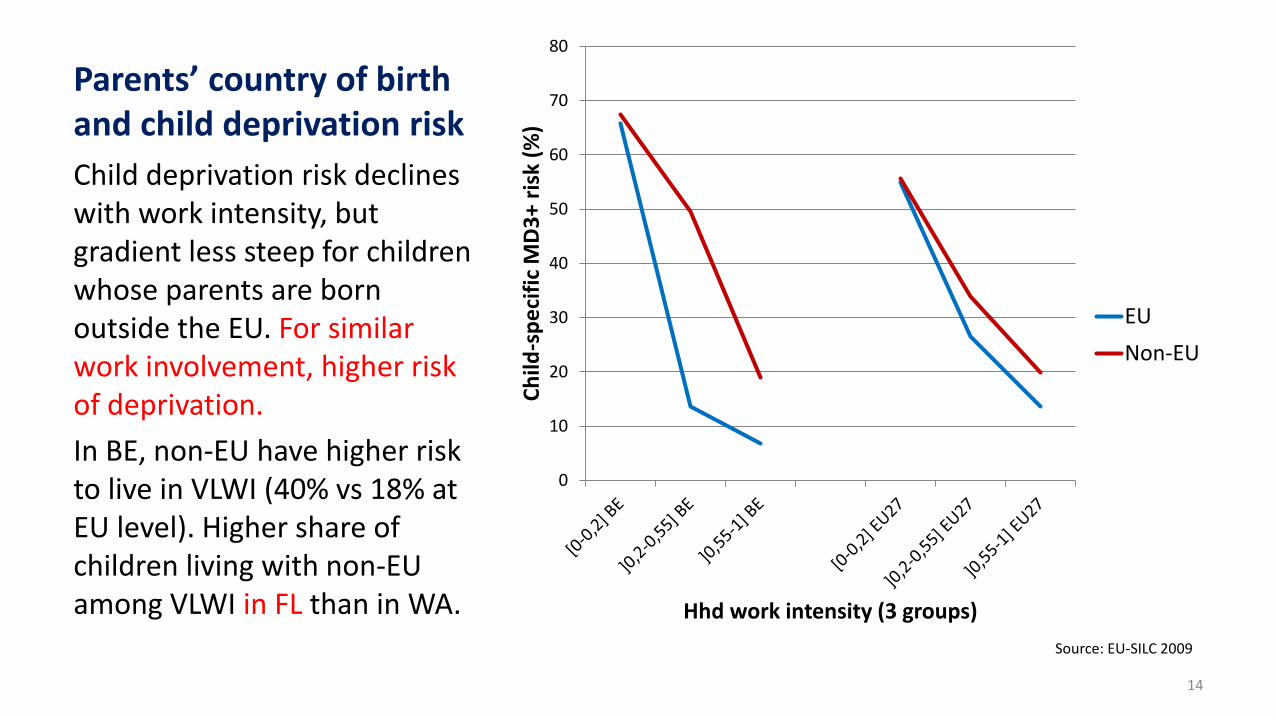
Parents’ country of birth and child deprivation risk
Child deprivation risk declines with work intensity, but gradient less steep for children whose parents are born outside the EU. For similar work involvement, higher risk of deprivation.
In BE, non-EU have higher risk to live in VLWI (40% vs 18% at EU level). Higher share of children living with non-EU among VLWI in FL than in WA.
14
Source: EU-SILC 2009
0
10
20
30
40
50
60
70
80
Ch
ild-s
pe
cifi
c M
D3
+ r
isk
(%)
Hhd work intensity (3 groups)
EU
Non-EU

Why high risk of poverty/deprivation among children living in low work intensity household? – Lone parent with 2 children (2y & 4y)
15
Source: Storms & Bogaerts (2012)
0%
20%
40%
60%
80%
100%
120%
140%
Minimum income(OCMW/CPAS)
Minimumunemployment
benefits
Minimumdisability benefits
Minimum wage
At-risk-of-poverty threshold
Reference budget - not working -tenant private sector
Reference budget - not working -tenant social sector
Reference budget - working -tenant private sector
Reference budget - working -tenant social sector

16
Taking up a job helps to exit poverty in (only) half of the cases
Source: Thévenot (2014)

Conclusions (1) • One child out of five is deprived in Belgium. • Not a residual problem which can be solved by economic growth on its own. Need investing
in children for future. • Large regional diversity, as in other countries, which deserves specific analysis and adequate
policy responses. • Household work intensity matters to explain child poverty in BE:
– In FL, low share of children living in VLWI households but high risk for those children – In WA, both high share of children living in VLWI households and high risk for those children
• But having a job not always enough to escape poverty. • Lone parents and non-EU citizens: higher risks of being VLWI and being deprived if working. • For some households with children, social transfers or minimum wage do not lift them above
poverty threshold; depends on the composition of the household • Problematic not gender neutral (LP, part-time work…) • Gap between actual resources and resources needed to reach a « decent » standard of
living for those in VLWI, or those living in hhds in which income from work is not sufficient to cover family needs (lone parents, low paid workers, large families).
17
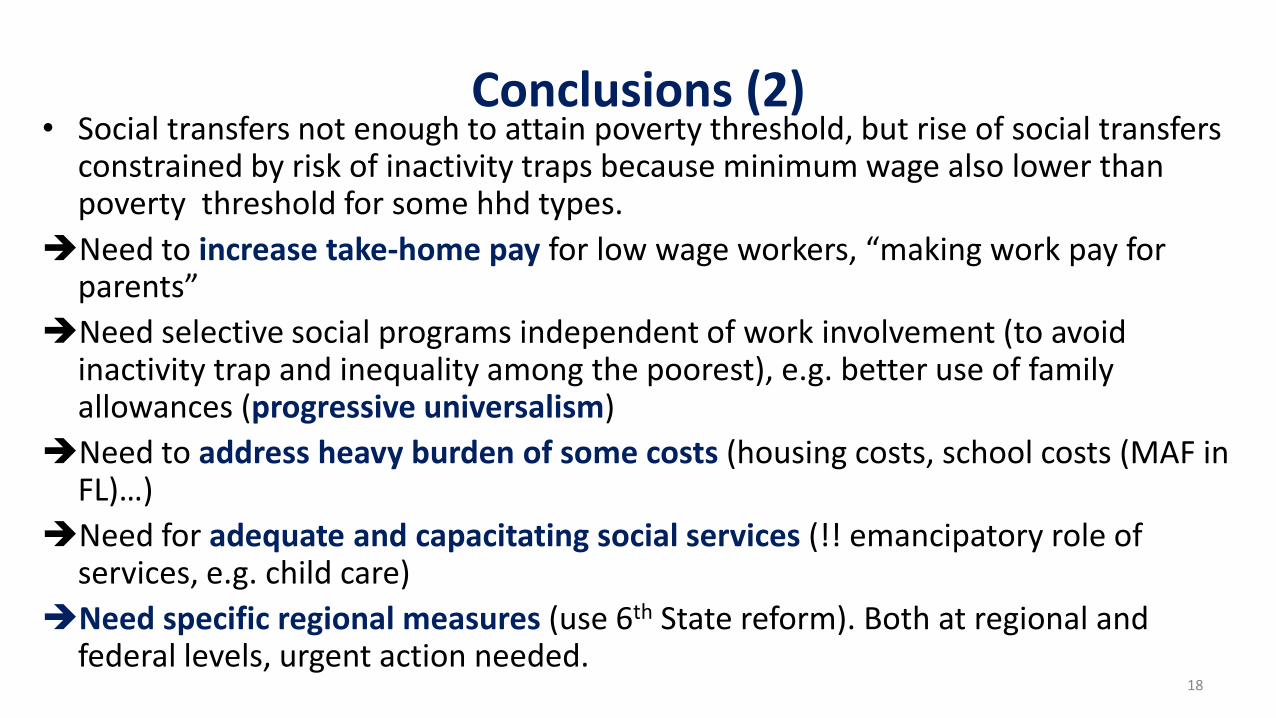
Conclusions (2) • Social transfers not enough to attain poverty threshold, but rise of social transfers
constrained by risk of inactivity traps because minimum wage also lower than poverty threshold for some hhd types.
Need to increase take-home pay for low wage workers, “making work pay for parents”
Need selective social programs independent of work involvement (to avoid inactivity trap and inequality among the poorest), e.g. better use of family allowances (progressive universalism)
Need to address heavy burden of some costs (housing costs, school costs (MAF in FL)…)
Need for adequate and capacitating social services (!! emancipatory role of services, e.g. child care)
Need specific regional measures (use 6th State reform). Both at regional and federal levels, urgent action needed.
18