Embed Size (px)
Citation preview
Research report
Review of the child material deprivation items in the Family Resources Survey by Stephen McKay

Department for Work and Pensions
Research Report No 746
Review of the child material deprivation items in the family resources surveyStephen McKay
A report of research carried out by Birmingham University on behalf of the Department for Work and Pensions

© Crown copyright 2011.
You may re-use this information (not including logos) free of charge in any format or medium, under the terms of the Open Government Licence. To view this licence, visit http://www.nationalarchives.gov.uk/doc/open-government-licence/or write to the Information Policy Team, The National Archives, Kew, London TW9 4DU, or email: [email protected].
This document/publication is also available on our website at: http://research.dwp.gov.uk/asd/asd5/rrs-index.asp
Any enquiries regarding this document/publication should be sent to us at: Department for Work and Pensions, Commercial Support and Knowledge Management Team, Upper Ground Floor, Steel City House, West Street, Sheffield S1 2GQ
First published 2011.
ISBN 978 1 84712 980 2
Views expressed in this report are not necessarily those of the Department for Work and Pensions or any other Government Department.
iii
ContentsAcknowledgements ................................................................................................................................... v
The Author .................................................................................................................................................. vi
1 Introduction .........................................................................................................................................1
1.1 Introduction ..............................................................................................................................1
1.2 Background ...............................................................................................................................1
1.3 Research questions .................................................................................................................2
1.4 Research methods ...................................................................................................................2
2 Qualitative research ............................................................................................................................4
2.1 Introduction ..............................................................................................................................4
2.2 Background ...............................................................................................................................4
2.3 Research findings .....................................................................................................................4
3 Analysis of omnibus data ..................................................................................................................6
3.1 Introduction ..............................................................................................................................6
3.2 Data collection .........................................................................................................................6
3.3 Items regarded as necessities ..............................................................................................6
3.3.1 Children........................................................................................................................7
3.3.2 Showcardordereffects......................................................................................... 10
3.4 Items lacking ......................................................................................................................... 12
3.4.1 Factoranalysis........................................................................................................ 15
3.4.2 Reliabilityanalysis.................................................................................................. 19
4 Discussion and recommendations ............................................................................................... 21
4.1 Introduction ........................................................................................................................... 21
4.2 Evidence on changing the existing questions ................................................................ 21
4.3 Evidence on proposed new questions .............................................................................. 23
4.4 Recommendations ............................................................................................................... 24
Appendix A Additional tables ............................................................................................................. 26
Appendix B Existing FRS questions ................................................................................................... 29
Appendix C ONS Omnibus Survey questions .................................................................................. 31
References ................................................................................................................................................ 39
Contents
iv
List of tables
Table 3.1 Items regarded as essential – starred items are existing FRS questions ..............7
Table 3.2 Items regarded as essential – by location within each showcard ....................... 11
Table 3.3 Items not owned by families with children .............................................................. 12
Table 3.4 Correlations with gross income, of not having the items ..................................... 14
Table 3.5 Factor loadings following (unrotated) factor analysis, for factors 1-3 ............... 17
Table 3.6 Factor loadings following (unrotated) factor analysis, for factors 1-3 ............... 18
Table 3.7 Reliability analysis (items in italics did not contribute to the reliability of the overall scale) ........................................................................................................ 19
Table 4.1 Summary of evidence on existing FRS questions ..........................................................22
Table 4.2 Summary of evidence on proposed new material deprivation questions ......... 23
Table A.1 Items regarded as essential by age group ................................................................ 26
Table A.2 Items regarded as essential, by gender and disability .......................................... 27
List of figures
Figure 1.1 Overview of the research methodology .......................................................................3
Figure 3.1 Scree plot for factor analysis of most adult-related items [KMO = 0.80] ........... 16
Figure 3.2 Scree plot for factor analysis of most child-related items [KMO = 0.64] ............ 18
Contents

v
AcknowledgementsThis work partly presents analysis of new data from the Office for National Statistics (ONS) Omnibus Survey, but also draws on the work of researchers at the Centre for Research in Social Policy, and within the Child Poverty Unit. It also draws on discussions held within these teams. I acknowledge the help and insight in particular of Michael Kelly, Stephen Munn and Laura Adelman at the Child Poverty Unit, Donald Hirsch and Noel Smith at Loughborough. At ONS, Helen Harris and Matthew Steel provided support and excellent documentation to facilitate accessing and analysing the new omnibus data. However, any errors or misunderstandings are the author’s responsibility.
Acknowledgements
vi
The AuthorStephen McKay is the chair in social research at the University of Birmingham.
The Author

1
1 Introduction1.1 IntroductionMaterial deprivation indicators have often been recommended as a rigorous scientific approach to the measurement of poverty (Pantazis etal., 2006). The concept of deprivation indicators has been influential in the development of measures to track progress towards reducing child poverty, with targets based, in part, on a measure of material deprivation alongside low income. In 2004/05 the Family Resources Survey (FRS) was amended to include questions relating to material deprivation (McKay and Collard, 2004), and these have formed part of the annual reports monitoring progress to reduce and, in time, eradicate child poverty.
The inclusion of new material deprivation questions from 2004/05 was based on quantitative research to determine the most reliable and valid indicators of deprivation among families with children. It was envisaged that this set of questions would need to be updated over time, to reflect changes in what people believe to be the necessities of life. This report provides evidence on which items (material goods, activities, access to services) are now regarded as essential in the UK. It draws on this evidence to propose changes to the overall set of indicators used to measure child poverty.
1.2 BackgroundConsultations in 2002 provided support for using a measure of material deprivation to calculate poverty. Academic research (McKay and Collard, 2004) identified a set of 21 questions that have been included on the FRS since 2004/05. This analysis and question selection was based on the most up to date data available at the time, including:
• the PovertyandSocialExclusion (PSE) Survey 1999, including an ONS Omnibus Survey (1999) with questions on perceptions of necessities;
• the FamiliesandChildrenStudy (FACS), 1999-2002;
• the BritishHouseholdPanelSurvey (BHPS), especially 2001 data (wave 10);
• literature from other countries, especially Ireland, where similar analysis had been conducted.
However, it is possible that attitudes towards the existing FRS questions may have changed, or that new questions may now better represent children’s material deprivation. It is clear that such perceptions of essential items have changed over time, partly in response to changes in technology. Few would now believe that a VHS machine was a necessity; access to the internet would have only rarely been contemplated as a necessity in the 1990s. Attitudes towards leisure activities and food intake may also change over time. It is the purpose of this research to track such trends, and consider what are regarded as essential in 2009 and onwards.
Analysis of the most recent waves of FRS data, conducted by analysts within the Child Poverty Unit, continues to inspire confidence in the initial selection of deprivation questions. They maintain a robust correlation with income and with each other. As such they continue to serve as a good means of measuring deprivation separately from levels of household income.
The Child Poverty Unit commissioned the analysis in this report to update, if and where necessary, the current FRS questions used to measure children’s material deprivation. Recommendations for such changes would reflect movements in what are perceived to be necessities since the current questions were introduced, and any changes in the ability of such questions (taken as a whole) to track material deprivation among families with children.
Introduction

2
This programme of work also fulfils the commitment to periodically review the items selected, established as part of the 2003 conclusions of the MeasuringChildPoverty consultation.
1.3 Research questionsIt is worth noting that in previous research respondents have generally been asked to identify those items that they regard as necessities for all family types, rather than for families with children or parents in particular. Of course those questions specifically about children presume their presence, but the questions about adults and households have not related specifically to parents. Part of the research will be to compare the answers given in relation to parents, with previous survey responses relating to adults of all kinds. There is recent evidence that changing the frame of reference to older people generated higher proportions identifying different items as necessary, and found ‘greaterunanimityaboutwhatmightberegarded [as]anecessityfortheoldergroup’ (McKay, 2008: p25). Even so, a holiday was not regarded as essential for those aged 65+, in 2008, but was seen as a necessity for all people in 1999. It is plausible that asking about families with children will have similar effects, sometimes increasing but perhaps sometimes reducing the likelihood that items are regarded as essential.
We already know that that some items were more likely to be regarded as essential by families with children, but other items were less often regarded as necessities (McKay and Collard, 2004: p36). For instance the concept of ‘Money to spend on self weekly’ was not regarded as a necessity by parents (42 per cent said it was essential), but was a necessity among the general population (59 per cent regarding this as essential). The same was also true of ‘an outfit for social occasions’, which parents did not rate as necessary and going against the views of a narrow majority of the general population.
There are two key overall research questions that this research project is designed to answer. First what kinds of items (goods or activities) are regarded as necessities for families with children. Second, linked to this, for which items does an enforced absence (through lack of money) constitute deprivation?
The existing deprivation questions appear to be working well, but it was always envisaged that such a set of questions must be subject to periodic testing to ensure they continue to capture deprivation in an optimal way. There is, of course, a strong argument for continuity, however, the research may need to update the set of questions in line with any changes in perceptions of what is a necessity for families with children. It is worthless having a consistent time-series measure if what is being measured is no longer relevant, or has a new and different meaning.
The second key research aim is to ensure that any set of questions continues to be a good discriminator between deprived, and non-deprived, families with children. This analysis will draw on analysis of links between lacking an item and measures of living standards, such as incomes. We already have good data on the existing questions through FRS, of course, but omnibus data will provide some information on any new questions proposed for future inclusion in the deprivation measure.
1.4 Research methodsThe overall research programme proceeded using three inter-connected elements. First, qualitative research (focus groups) with parents was used to examine contemporary views of necessities for families with children. This element was conducted by the Centre for Research in Social Policy (CRSP) at Loughborough University. Second, new questions were devised for an omnibus survey to test whether suggestions for items generated by stage one, and the existing child material deprivation
Introduction

3
items, were viewed as necessities by the general population. The fieldwork was conducted by ONS (ONS 2009), with input from DWP, CRSP and the University of Birmingham to help develop those questions.
In the Omnibus survey, respondents were asked what items they regard as essential among families with children. And among families with children, respondents were also asked if they had each item, and if they did not, whether this was because they do not want it or could not afford it.
The final stage of the research, having analysed the results of the omnibus data, was to make recommendations for a final suite of questions to include on the FRS from 2010/11 onwards.
An overview of the research methodology is presented in diagrammatic form in Figure 1.1. It is worth a reminder that the original questions were only selected after extensive research, which itself built on many years of experience with indicators of this kind. The new set of questions should also be reviewed after an appropriate period, of around five years.
Figure 1.1 Overview of the research methodology
Existing FRS questions
Introduction
(based on detailed research)
Qualitative research on items thought essential
New Omnibus Survey questions
Statistical analysis of omnibus
Independent recommendations for new set of questions
Discussions regarding optimal selection of questions
New FRS questions

4
2 Qualitative research2.1 IntroductionIn this section we summarise the qualitative stage of this project. Qualitative research was designed and conducted by CRSP, at the University of Loughborough, in discussion with the Child Poverty Unit. Full results are presented in Hirsch and Smith (2010).
2.2 BackgroundIt is common for qualitative preparatory work to precede quantitative data collection. This kind of research may have different purposes. It might be used to clarify what kinds of words and terms people are most familiar with. Or it might be used to construct a set of items to be tested, based on the public’s understanding of how people live their lives.
Research by Middleton (1998) showed how a qualitative study might be used to select goods and services that people regard as necessary. In her research, focus group participants identified lists of items that every adult in the UK should be able to afford. They went on to discuss if some of these were more important than others. In a second phase of qualitative research respondents considered how long people might be able to do without these items before falling into poverty. The PSE study, of which this was a part, went on to test a very large number of questions in omnibus research, before selecting those regarded as necessary for the main interview.
A distinctive feature of this research project, unlike the PSE research, was that it was possible to include only parents in the research to look at what should be essential for parents (Hirsch and Smith, 2010). Past research has generally tended to consider the whole population, and not look at specific subgroups, although sometimes partitioning groups into similar people for some of the constituent focus groups (Middleton 1998).
2.3 Research findingsIt was not necessary to start from a blank sheet. For this study there were the existing questions from the Family Resources Survey (FRS) which were clearly important to include. Indeed they owe their origins partly to qualitative research conducted in the late 1990s. This set of questions is enumerated in Appendix B to this report. The new qualitative research offered an opportunity both to affirm the existing set of questions, and also to look at new areas and suggestions that could be included if they were thought to be important by families.
The core of the qualitative work was a set of eight focus groups with parents conducted across three cities in England – including 45 parents in all. Five of these groups included parents who had a school-aged child, and perhaps other children as well. In three of the groups all parents had at least one child who was younger than school age. Both mothers and fathers were included in the groups, and the socio-economic and demographic characteristics were varied.
In line with work on Minimum Income Standards, there was an emphasis on recognising consensus within the groups, or at least coming to an overall common view. Participants were also reminded that the task was one of defining what is a necessity for everyone (or, at least, every family with children) in the UK This was achieved through looking at particular hypothetical case studies, and not focussing in on individual experience.
Qualitative research
5
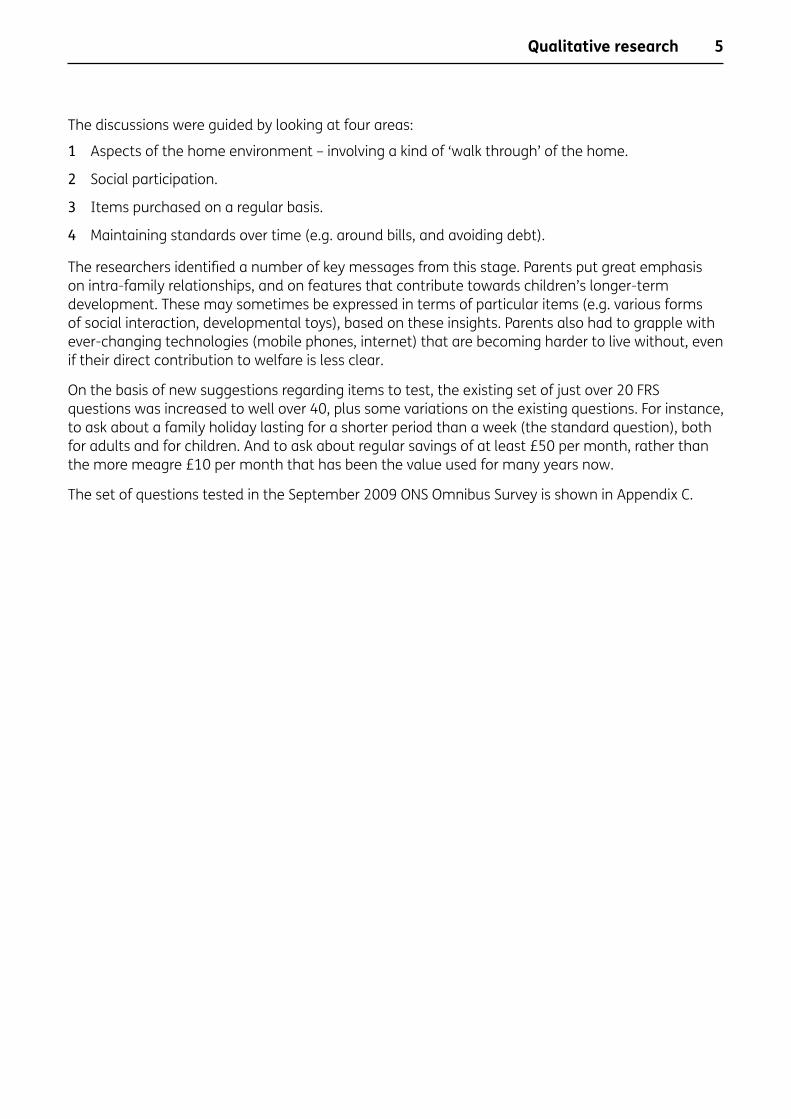
The discussions were guided by looking at four areas:
1 Aspects of the home environment – involving a kind of ‘walk through’ of the home.
2 Social participation.
3 Items purchased on a regular basis.
4 Maintaining standards over time (e.g. around bills, and avoiding debt).
The researchers identified a number of key messages from this stage. Parents put great emphasis on intra-family relationships, and on features that contribute towards children’s longer-term development. These may sometimes be expressed in terms of particular items (e.g. various forms of social interaction, developmental toys), based on these insights. Parents also had to grapple with ever-changing technologies (mobile phones, internet) that are becoming harder to live without, even if their direct contribution to welfare is less clear.
On the basis of new suggestions regarding items to test, the existing set of just over 20 FRS questions was increased to well over 40, plus some variations on the existing questions. For instance, to ask about a family holiday lasting for a shorter period than a week (the standard question), both for adults and for children. And to ask about regular savings of at least £50 per month, rather than the more meagre £10 per month that has been the value used for many years now.
The set of questions tested in the September 2009 ONS Omnibus Survey is shown in Appendix C.
Qualitative research
6
3 Analysis of omnibus data3.1 IntroductionFollowing on from the qualitative research the September 2009 ONS Omnibus asked first about whether people regarded a set of 47 items as being essential for families with children. It then asked families with children if they had the items, and the reasons why not when not owned.
3.2 Data collectionQuestions on necessities were asked in the September 2009 ONS Omnibus Survey (ONS, 2009). The set of 47 questions about necessities was asked in one of four different approaches, each showing the lists of items in different orders on the relevant showcards. This was partly to replicate the fuller randomisation found in some previous studies, such as Gordon etal. (2000), and partly to enable investigation of whether those orderings affected the propensity of people to describe an item as necessary.
The ONS study comprised a random sample of 957 people interviewed in 67 postal sectors. The response rate in this particular month was 53 per cent. The data was weighted to ensure it matched the expected numbers of people in each age group, by gender and region, after having allowed for the sample design which selected one person per household (ONS, 2009).
All the results reported below are appropriately weighted, with the unweighted sample sizes also shown to provide an indication of the reliability of results.
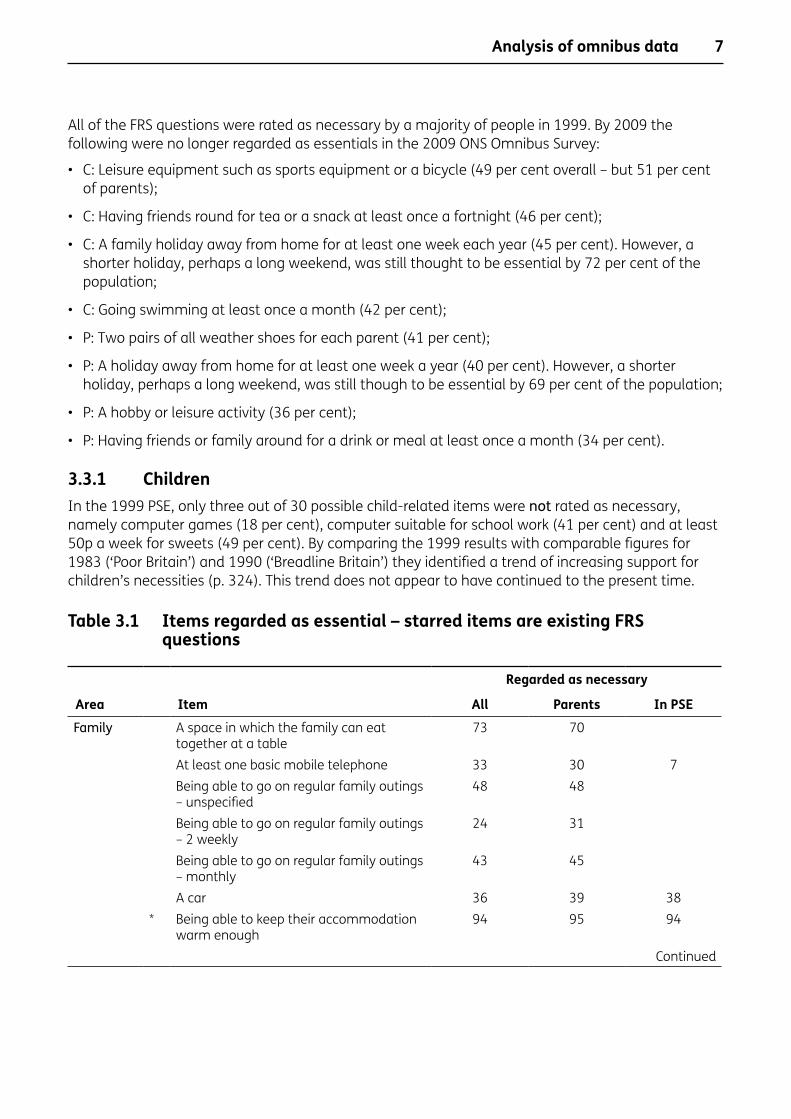
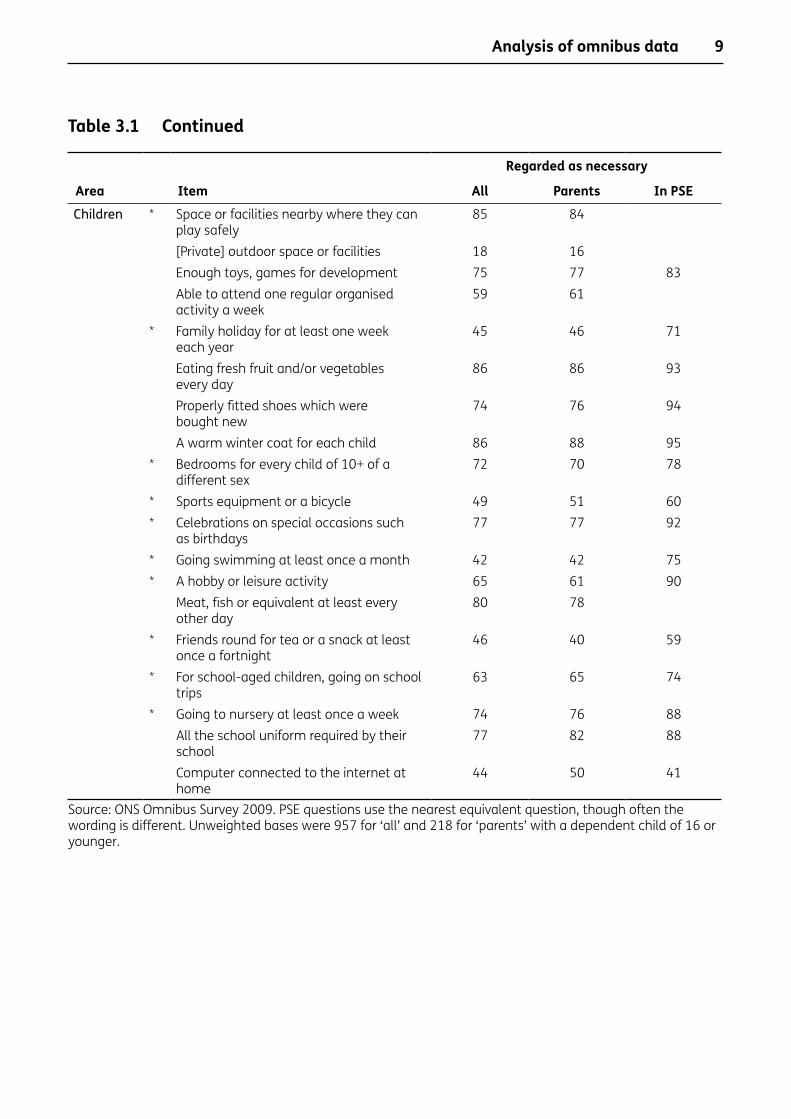
3.3 Items regarded as necessitiesIn Table 3.1 we show the proportions of respondents, and of parents, who regarded each of the items as being essential. We also show the results for similar items asked in the 1999 Poverty and Social Exclusion Survey (PSE) (Gordon etal., 2000), though some of the equivalents are closer than others owing to some differences in the wording used.
Previous work on material deprivation has classed an item as essential if at least half of the population thought this was the case. It is fairly clear that, in general, fewer people than 10 years ago say that many of the particular items suggested are necessary. For example, a warm winter coat was regarded as essential by 85 per cent in 1999, but only by 66 per cent in 2009 – albeit a clear majority in both years. Among other changes:
• those rating a hobby (for the adults) as essential plummeted from 78 per cent in 1999 to only 36 per cent in the 2009 data;
• having friends or family around for a drink or meal at least once a month was regarded as necessary by close to two-thirds in 1999, but only one-third in 2009;
• taking children to swimming classes also saw a sizeable decrease, from 75 per cent down to 42 per cent;
• many more selected a mobile phone as a necessity, but this surely represents technological change rather than a specific increase in generosity.
Analysis of omnibus data
7
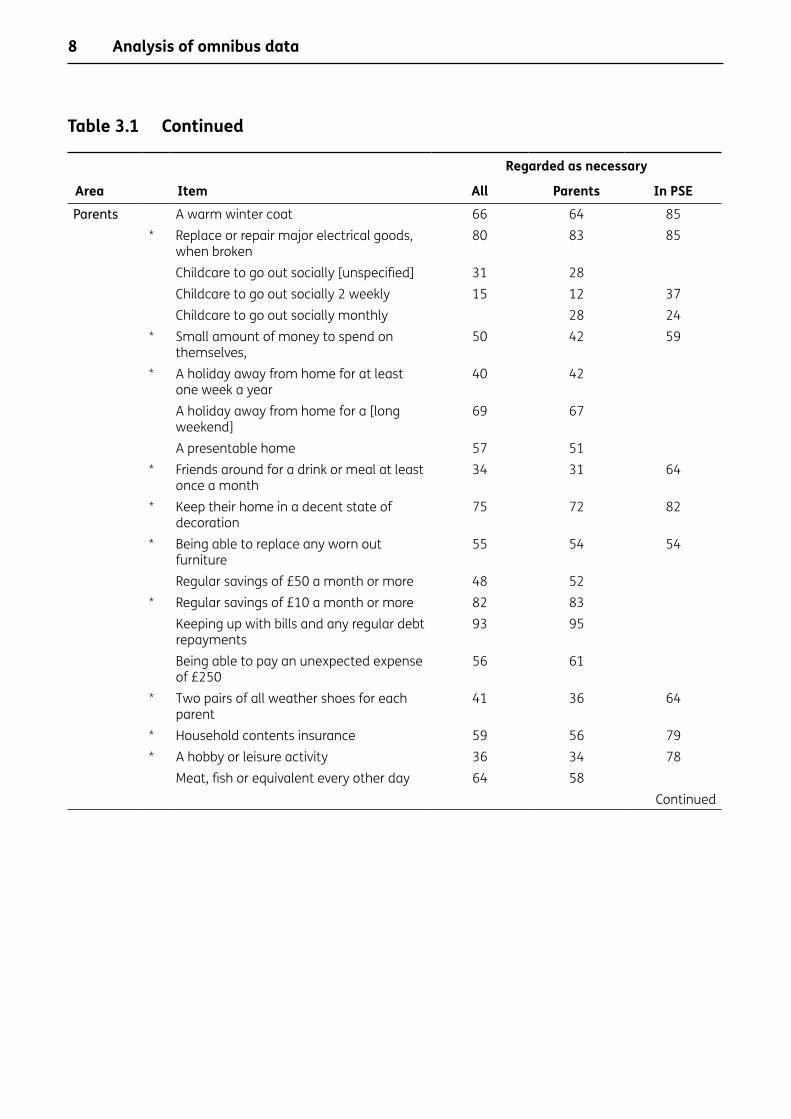
All of the FRS questions were rated as necessary by a majority of people in 1999. By 2009 the following were no longer regarded as essentials in the 2009 ONS Omnibus Survey:
• C: Leisure equipment such as sports equipment or a bicycle (49 per cent overall – but 51 per cent of parents);
• C: Having friends round for tea or a snack at least once a fortnight (46 per cent);
• C: A family holiday away from home for at least one week each year (45 per cent). However, a shorter holiday, perhaps a long weekend, was still thought to be essential by 72 per cent of the population;
• C: Going swimming at least once a month (42 per cent);
• P: Two pairs of all weather shoes for each parent (41 per cent);
• P: A holiday away from home for at least one week a year (40 per cent). However, a shorter holiday, perhaps a long weekend, was still though to be essential by 69 per cent of the population;
• P: A hobby or leisure activity (36 per cent);
• P: Having friends or family around for a drink or meal at least once a month (34 per cent).
3.3.1 ChildrenIn the 1999 PSE, only three out of 30 possible child-related items were not rated as necessary, namely computer games (18 per cent), computer suitable for school work (41 per cent) and at least 50p a week for sweets (49 per cent). By comparing the 1999 results with comparable figures for 1983 (‘Poor Britain’) and 1990 (‘Breadline Britain’) they identified a trend of increasing support for children’s necessities (p. 324). This trend does not appear to have continued to the present time.
Table 3.1 Items regarded as essential – starred items are existing FRS questions
Regarded as necessary
Area Item All Parents In PSEFamily A space in which the family can eat
together at a table73 70
At least one basic mobile telephone 33 30 7Being able to go on regular family outings – unspecified
48 48
Being able to go on regular family outings – 2 weekly
24 31
Being able to go on regular family outings – monthly
43 45
A car 36 39 38* Being able to keep their accommodation
warm enough94 95 94
Continued
Analysis of omnibus data
8
Table 3.1 Continued
Regarded as necessary
Area Item All Parents In PSEParents A warm winter coat 66 64 85
* Replace or repair major electrical goods, when broken
80 83 85
Childcare to go out socially [unspecified] 31 28Childcare to go out socially 2 weekly 15 12 37Childcare to go out socially monthly 28 24
* Small amount of money to spend on themselves,
50 42 59
* A holiday away from home for at least one week a year
40 42
A holiday away from home for a [long weekend]
69 67
A presentable home 57 51* Friends around for a drink or meal at least
once a month34 31 64
* Keep their home in a decent state of decoration
75 72 82
* Being able to replace any worn out furniture
55 54 54
Regular savings of £50 a month or more 48 52* Regular savings of £10 a month or more 82 83
Keeping up with bills and any regular debt repayments
93 95
Being able to pay an unexpected expense of £250
56 61
* Two pairs of all weather shoes for each parent
41 36 64
* Household contents insurance 59 56 79* A hobby or leisure activity 36 34 78
Meat, fish or equivalent every other day 64 58Continued
Analysis of omnibus data
9
Table 3.1 Continued
Regarded as necessary
Area Item All Parents In PSEChildren * Space or facilities nearby where they can
play safely85 84
[Private] outdoor space or facilities 18 16Enough toys, games for development 75 77 83Able to attend one regular organised activity a week
59 61
* Family holiday for at least one week each year
45 46 71
Eating fresh fruit and/or vegetables every day
86 86 93
Properly fitted shoes which were bought new
74 76 94
A warm winter coat for each child 86 88 95* Bedrooms for every child of 10+ of a
different sex72 70 78
* Sports equipment or a bicycle 49 51 60* Celebrations on special occasions such
as birthdays77 77 92
* Going swimming at least once a month 42 42 75* A hobby or leisure activity 65 61 90
Meat, fish or equivalent at least every other day
80 78
* Friends round for tea or a snack at least once a fortnight
46 40 59
* For school-aged children, going on school trips
63 65 74
* Going to nursery at least once a week 74 76 88All the school uniform required by their school
77 82 88
Computer connected to the internet at home
44 50 41
Source: ONS Omnibus Survey 2009. PSE questions use the nearest equivalent question, though often the wording is different. Unweighted bases were 957 for ‘all’ and 218 for ‘parents’ with a dependent child of 16 or younger.
Analysis of omnibus data

10
3.3.2 Showcard order effects[This section is somewhat more technical and methodological than the remainder of this report, and may be safely skipped by those concerned with the substantive results and recommendations. It concerns the effects of having the set of items located at different points on the showcards.]
One feature of the data collection was that sets of items were grouped together in a number of showcards, but with some randomisation of the order. Any particular item could appear in up to four different locations within that showcard – sometimes at the top, or somewhat in the middle, or at the end. The showcards typically had either five or six listed items. There were four different pre-set random orderings of the showcards, so not all permutations were possible. We might expect that items appearing at the top of the showcard, or perhaps at the lower end, might elicit a different response from those appearing in the middle (see Krosnick and Alwin, 1987).
In Table 3.2 we show the proportion who rated particular items as necessary, according to their positioning on the showcard. So, for example, when asked about ‘A space in which the family can eat together at a table’, overall, 73 per cent thought that this was a necessity (refer back to Table 3.1). However, among those respondents who were presented with this item as the first on the showcard list, some 80 per cent said it was essential, compared to just 66 per cent who thought this when it appeared in third place (there were five separate items listed). Some 73 per cent agreed it was essential when it appeared second on the list. We may be confident that these differences in responses, according to showcard order are statistically significant with a 99 per cent level of confidence. Overall, for 12 of the 39 items that were asked about in this way, there appeared to be different proportions who rated them as necessities according to their location on the showcards. Mostly the proportions were lower, the lower down the showcard, but with some evidence of a positive effect from appearing right at the foot of the card.
Many of the statistically significant differences appear to have occurred on the first two sets of showcards. It is possible that respondents took a while to get used to the task they were being asked to do, and perhaps assigned lesser importance to the item ordering as the interview proceeded. Even so, among the child items appearing rather later in the interview some occasional differences according to showcard order were also found – this affected those reflecting on whether ‘fresh fruit and vegetables each day’ and having all the school uniform required should be counted as essential or not.
There may be explanations for these apparent differences which do not relate to the showcard order. It may be reflecting differences in the groups and interviewers who happened to be encountering alternative ordering. At this stage, it is perhaps safest to conclude that showcard order might be having an effect on some questions, but it remains unclear why some questions appear to be affected whilst others were not.
Analysis of omnibus data

11
Table 3.2 Items regarded as essential – by location within each showcard
Percentage agreeing was necessaryItem 1st 2nd 3rd 4th 5th 6th SigSpace the family can eat together at a table 80 73 66 **At least one basic mobile telephone 40 28 34 29 *Being able to go on regular family outings 48 49 43 nsA car 47 32 ***Able to keep their accommodation warm enough 91 98 94 **A warm winter coat 65 65 67 nsAble to replace electrical goods 75 85 86 77 **Being able to arrange childcare to go out socially 30 30 31 35 nsSmall amount of personal spending money 46 51 51 49 nsA holiday for at least one week a year 42 40 40 nsA presentable home 63 57 51 *Family around for a drink or meal 40 31 34 *Home in a decent state of decoration 70 75 81 **Able to replace any worn out furniture 52 54 62 nsRegular savings of £50 a month or more 53 46 45 nsKeeping up with bills 96 94 93 90 nsAn unexpected expense of £250 55 50 57 61 nsTwo pairs of all weather shoes for each parent 43 44 41 37 nsHousehold contents insurance 63 61 61 53 nsA hobby or leisure activity 37 39 29 38 nsEating meat, fish every two days 63 63 67 63 nsOutdoor space or facilities for play 88 86 82 84 nsToys, games for child’s development 78 75 75 72 nsAt least one regular organised activity 64 61 57 nsA family holiday for at least one week 44 48 40 46 nsEating fresh fruit and/or vegetables every day 90 79 87 89 ***Properly fitted shoes which were bought new 74 72 75 74 nsA warm winter coat for each child 86 91 85 81 *Bedrooms for every child of 10+ of each sex 77 70 72 nsSports equipment or a bicycle 51 48 47 50 nsCelebrations on special occasions 76 77 80 nsGoing swimming at least once a month 41 44 40 nsA hobby or leisure activity 66 61 67 67 nsMeat, fish every two days 85 80 81 74 *Friend round for tea or a snack 47 38 50 48 nsFor school-aged children, going on school trips 67 64 60 61 nsGoing to toddler group, or nursery 73 72 80 72 nsAll the school uniform required 84 73 70 81 ***Having a computer connected to the internet 45 42 46 43 ns
Significance is based on ANOVA test – which identifies differences between categories. * – 5 per cent level, ** – 1 per cent level, *** -0.1 per cent level.
Analysis of omnibus data

12
3.4 Items lackingIn Table 3.3 we show the proportions of items that families do not have. How many lack them, for any reason, and how many said they were unable to afford them. So, for instance, six per cent of families did not have a space for a table for the family to eat at, whilst three per cent said they lacked this because they were unable to afford it. For the others (lacking this space, but not saying it was an affordability issue) this must be reflecting some element of choice rather than financial constraint.
Table 3.3 Items not owned by families with children
Cellpercentages
Area ItemMissing – any
reasonUnable to
affordFamily A space in which the family can eat together at a table 6 3
At least one basic mobile telephone * -Being able to go on regular family outings – two weekly 39 19Being able to go on regular family outings – monthly 20 13A car 13 7Being able to keep their accommodation warm enough 7 7
Parents A warm winter coat 5 4Replace or repair major electrical goods, when broken 17 12Childcare to go out socially two weekly 57 19Childcare to go out socially monthly 45 14Small amount of money to spend on themselves 30 28A holiday away from home for at least one week a year 33 27A holiday away from home for a [long weekend] 18 15A presentable home 7 6Friends around for a drink or meal at least once a month 30 11Keep their home in a decent state of decoration 15 14Being able to replace any worn out furniture 24 17Regular savings of £50 a month or more 48 42Regular savings of £10 a month or more 38 32Keeping up with bills and any regular debt repayments 8 8Being able to pay an unexpected expense of £250 27 26Two pairs of all weather shoes for each parent 7 5Household contents insurance 25 15A hobby or leisure activity 28 8Meat, fish or equivalent every other day 3 2
Children Space or facilities nearby where they can play safely 7 7[Private] outdoor space or facilities 30 30Enough toys, games for development 4 2Able to attend one regular organised activity a week 31 6Family holiday for at least one week each year 27 19A family holiday away from home for a [long weekend] 18 13
Continued
Analysis of omnibus data

13
Table 3.3 Continued
Cellpercentages
Area ItemMissing – any
reasonUnable to
affordChildren Eating fresh fruit and/or vegetables every day 8 2
Properly fitted shoes which were bought new 4 *A warm winter coat for each child 4 2Bedrooms for every child of 10+ of a different sex 19 5Sports equipment or a bicycle 13 1Celebrations on special occasions such as birthdays, 2 *Going swimming at least once a month 44 8A hobby or leisure activity 25 3Meat, fish or equivalent at least every other day 6 2Friends round for tea or a snack at least once a fortnight 35 3For school-aged children, going on school trips 7 3Going to nursery at least once a week 36 4All the school uniform required by their school 3 1Computer connected to the internet at home 10 4
Source: ONS Omnibus Survey 2009.
In selecting items for the FRS, there is only limited utility from having an item that is very rarely lacked. Where items have ownership that is close to universal, they cannot tell us much about which families are more deprived than others, or how levels of deprivation are changing over time. Conversely, where a high proportion of people are unable to afford something, it is probably unlikely to be regarded as a necessity.
We would expect that the questions selected for measuring material deprivation would be correlated with income. A higher income is associated with lower deprivation, and the reverse. However, we might expect that links would often be weak, because material deprivation may often be measuring something distinct from level of income. The correlations of each question with gross income are shown in Table 3.4. Those with statistically significant correlations are in bold type. As may be seen, in many instances there is a strong negative correlation between income and being unable to afford particular items. This does not extend to all the items shown – some (such as having space to eat at a table) did not appear to be associated within income. They may instead be reflecting either different preferences, or a longer term measure of living standards rather than current income.
Analysis of omnibus data

14
Table 3.4 Correlations with gross income, of not having the items
Pearson correlation coefficientsArea Item Lacking Sig. Can’t
affordSig.
Family A space in which the family can eat together at a table
-0.08 0.24 -0.03 0.70
At least one basic mobile telephone -0.01 0.87 - -Being able to go on regular family outings – two weekly
-0.05 0.41 -0.18 0.01
Being able to go on regular family outings – monthly
-0.16 0.01 -0.23 0.00
A car -0.31 0.00 -0.26 0.00Being able to keep their accommodation warm enough
-0.14 0.03 -0.14 0.03
Parents A warm winter coat -0.14 0.04 -0.12 0.07replace or repair major electrical goods, when broken
-0.25 0.00 -0.24 0.00
Childcare to go out socially 2 weekly -0.02 0.82 -0.04 0.57Childcare to go out socially monthly -0.08 0.19 -0.13 0.04Small amount of money to spend on themselves,
-0.30 0.00 -0.28 0.00
A holiday away from home for at least one week a year
-0.16 0.01 -0.21 0.00
A holiday away from home for a [long weekend]
-0.23 0.00 -0.23 0.00
A presentable home -0.09 0.16 -0.07 0.28Friends around for a drink or meal at least once a month
-0.17 0.01 -0.23 0.00
Keep their home in a decent state of decoration
-0.11 0.08 -0.11 0.10
Being able to replace any worn out furniture
-0.18 0.00 -0.19 0.00
Regular savings of £50 a month or more -0.17 0.01 -0.24 0.00Regular savings of £10 a month or more -0.14 0.04 -0.22 0.00Keeping up with bills and any regular debt repayments
-0.10 0.12 -0.10 0.12
Being able to pay an unexpected expense of £250
-0.37 0.00 -0.35 0.00
Two pairs of all weather shoes for each parent
-0.14 0.03 -0.21 0.00
Household contents insurance -0.14 0.03 -0.25 0.00A hobby or leisure activity -0.25 0.00 -0.20 0.00Meat, fish or equivalent every other day -0.09 0.18 -0.13 0.05
Continued
Analysis of omnibus data

15
Table 3.4 Continued
Pearson correlation coefficientsArea Item Lacking Sig. Can’t
affordSig.
Children Space or facilities nearby where they can play safely
-0.11 0.09 -0.11 0.09
[Private] outdoor space or facilities -0.17 0.01 -0.17 0.01Enough toys, games for development 0.00 0.97 -0.10 0.12Able to attend one regular organised activity a week
-0.02 0.81 -0.17 0.01
Family holiday for at least one week each year
-0.12 0.05 -0.18 0.01
Family holiday away from home for a [long weekend]
-0.16 0.01 -0.21 0.00
Eating fresh fruit and/or vegetables every day
0.00 0.96 -0.11 0.10
Properly fitted shoes which were bought new
0.05 0.49 -0.04 0.59
A warm winter coat for each child 0.01 0.83 -0.06 0.35Bedrooms for every child of 10+ of a different sex
-0.06 0.35 -0.14 0.03
Sports equipment or a bicycle 0.05 0.46 -0.13 0.05Celebrations on special occasions such as birthdays,
-0.03 0.60 -0.06 0.34
Going swimming at least once a month -0.10 0.13 -0.19 0.00A hobby or leisure activity -0.03 0.59 -0.11 0.09Meat, fish or equivalent at least every other day
-0.07 0.27 -0.10 0.11
Friends round for tea or a snack at least once a fortnight
0.00 0.95 -0.15 0.02
For school-aged children, going on school trips
-0.09 0.23 -0.17 0.03
Going to nursery at least once a week -0.07 0.47 -0.08 0.38All the school uniform required by their school
-0.03 0.70 -0.06 0.46
Computer connected to the internet at home
-0.05 0.55 -0.14 0.05
Source: ONS Omnibus Survey 2009.
3.4.1 Factor analysisFactor analysis provides an important statistical method for looking at how far a set of questions is measuring the same underlying concept (see Calandrino (2003) for past analysis of deprivation questions). We, therefore, ran separate factor analysis covering the adult/family variables, and the child-related variables, and discuss each in turn.
Analysis of omnibus data

16
One interpretative diagram is the so-called ‘scree plot; this illustrates the different proportions of the overall explained variance that may be attributed to one or more underlying factors. In Figure 3.1 we show the plot for the family and adult-related questions. This shows that there is one strong underlying dimension that explains most of the systematic variation in responses – in other words, something like a factor representing material deprivation. This is a positive result for this analysis, indicating that the questions are probably capturing a single underlying dimension rather than several.
Figure 3.1 Scree plot for factor analysis of most adult-related items [KMO = 0.80]
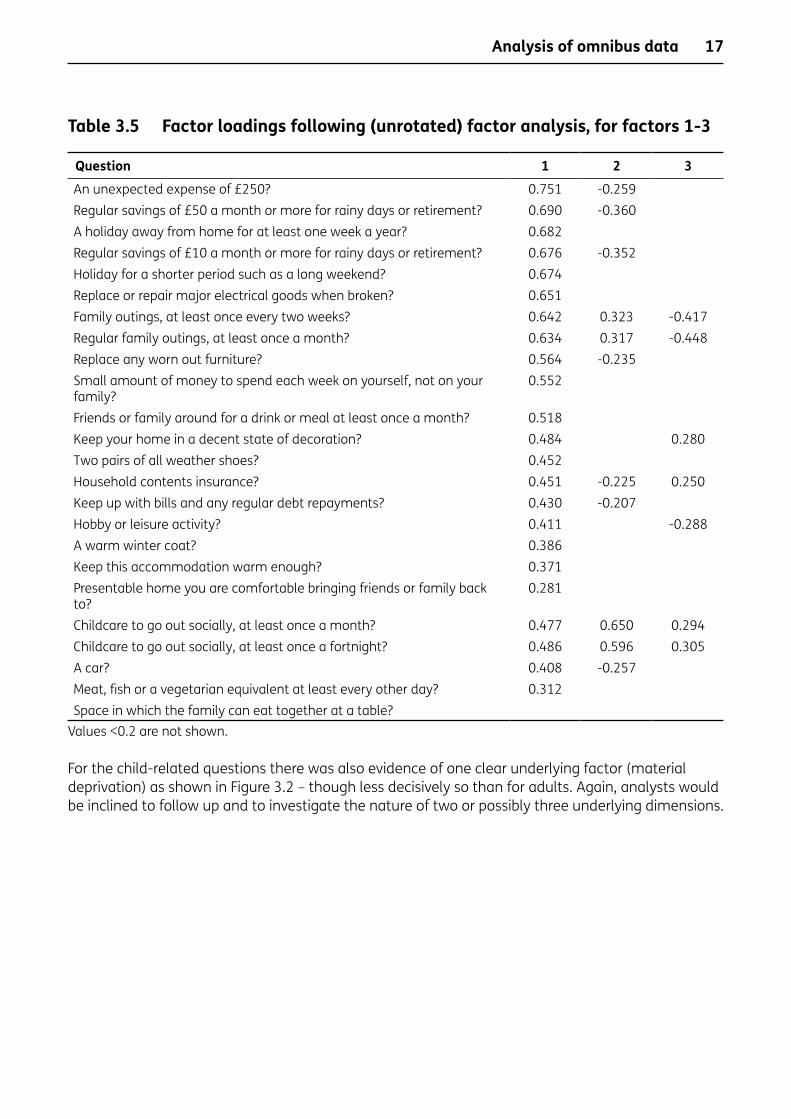
Analysts looking at this plot would be inclined to investigate the kinds of meanings that might be possible for one or two (possibly three) underlying dimensions (Bartholomew etal., 2008). Results for the factor loadings are shown in Table 3.5. These are the correlations between each question (those items people were unable to afford) and the latent variables constructed. There is no evidence here to suggest that there are strong secondary dimensions, constituting a distinctive variant on material deprivation. We may also note that those with lower values in the first column are less well correlated with the underlying concept of material deprivation, as derived through factor analysis.
8
6
4
2
0
Eige
nval
ue
1 2 3 4 5 6 7 8 9 10 11 12 13 14 15 16 17 18 19 20 21 22 23 24
Factor number
Analysis of omnibus data
17
Table 3.5 Factor loadings following (unrotated) factor analysis, for factors 1-3
Question 1 2 3An unexpected expense of £250? 0.751 -0.259Regular savings of £50 a month or more for rainy days or retirement? 0.690 -0.360A holiday away from home for at least one week a year? 0.682Regular savings of £10 a month or more for rainy days or retirement? 0.676 -0.352Holiday for a shorter period such as a long weekend? 0.674Replace or repair major electrical goods when broken? 0.651Family outings, at least once every two weeks? 0.642 0.323 -0.417Regular family outings, at least once a month? 0.634 0.317 -0.448Replace any worn out furniture? 0.564 -0.235Small amount of money to spend each week on yourself, not on your family?
0.552
Friends or family around for a drink or meal at least once a month? 0.518Keep your home in a decent state of decoration? 0.484 0.280Two pairs of all weather shoes? 0.452Household contents insurance? 0.451 -0.225 0.250Keep up with bills and any regular debt repayments? 0.430 -0.207Hobby or leisure activity? 0.411 -0.288A warm winter coat? 0.386Keep this accommodation warm enough? 0.371Presentable home you are comfortable bringing friends or family back to?
0.281
Childcare to go out socially, at least once a month? 0.477 0.650 0.294Childcare to go out socially, at least once a fortnight? 0.486 0.596 0.305A car? 0.408 -0.257Meat, fish or a vegetarian equivalent at least every other day? 0.312Space in which the family can eat together at a table?
Values <0.2 are not shown.
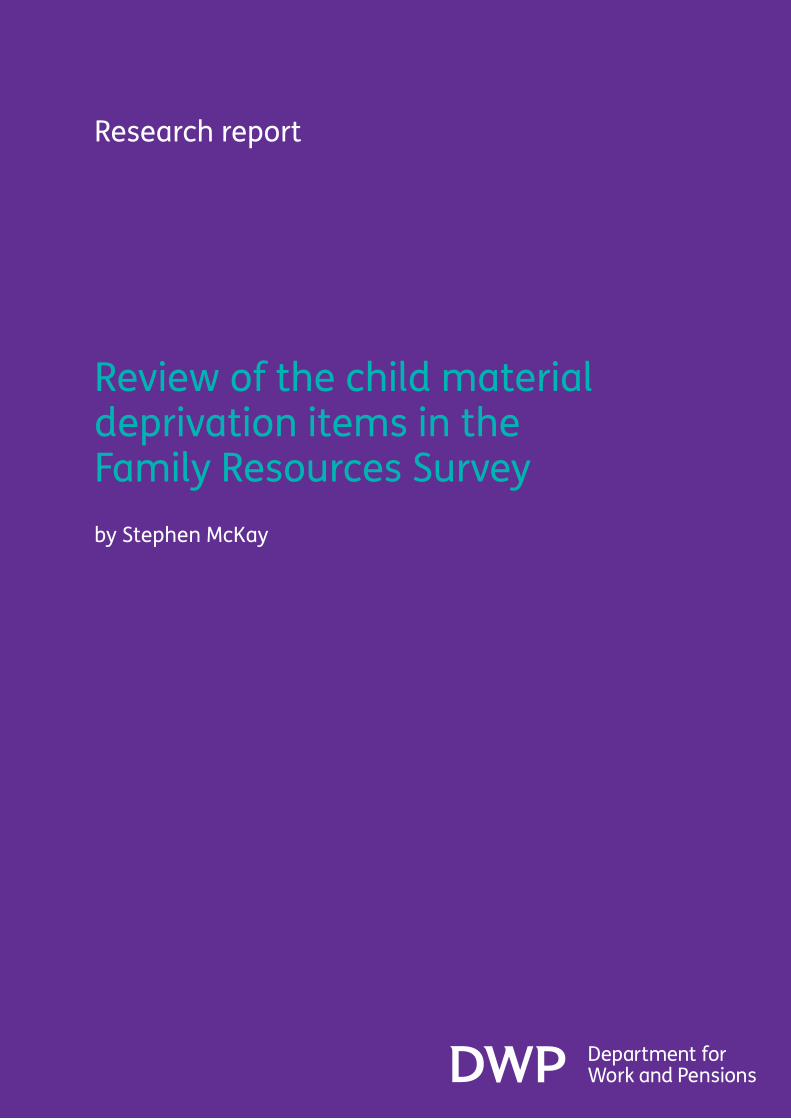
For the child-related questions there was also evidence of one clear underlying factor (material deprivation) as shown in Figure 3.2 – though less decisively so than for adults. Again, analysts would be inclined to follow up and to investigate the nature of two or possibly three underlying dimensions.
Analysis of omnibus data

18
Figure 3.2 Scree plot for factor analysis of most child-related items [KMO = 0.64]
Again, we may be fairly confident that the selected questions constitute a strong main measure of child deprivation. One exception was that lacking enough bedrooms of each child aged 10+ of different genders was not well correlated with the main deprivation scale. It may be measuring something rather different from the other questions – perhaps a longer-term dimension, or perhaps related to a larger family size.
Table 3.6 Factor loadings following (unrotated) factor analysis, for factors 1-3
Question 1 2 3A family holiday away from home every year for a shorter period? 0.795A family holiday away from home for at least one week a year? 0.783Do they have friends round for tea or a snack? 0.560 -0.389 0.534Do they have a hobby or leisure activity? 0.414 0.269Do they go swimming at least once a month? 0.400Attend at least one regular organised activity a week outside school? 0.359 0.311Leisure equipment such as sports equipment or a bicycle? 0.348[Play] space or facility private to your family? 0.317 -0.296 -0.216Outdoor space or facilities nearby where they can play safely? 0.519 -0.689 -0.211Meat, fish or a vegetarian equivalent at least every other day? 0.217 0.535A warm winter coat each? 0.215Eat fresh fruit and/or vegetables every day? 0.324Enough bedrooms for every child of 10 or over of a different sex?
Values<0.2 are not shown.
4
3
2
1
0
Eige
nval
ue
1 2 3 4 5 6 7 8 9 10 11 12 13
Factor number
Analysis of omnibus data

19
3.4.2 Reliability analysisNext we consider the consistency of the variables, again looking at those unable to afford the different items. This is conducted using a statistical technique known as reliability analysis, which generates a key outcome known as Cronbach’s alpha. The alpha value for the set of variables (41 questions) shown here was 0.908. This represents a very high level of reliability for adding up a set of questions to make an overall score (values above 0.7 are generally considered good for comparing groups; Bland and Altman, 1997, with values of 0.9 or higher indicating a level that may even be suitable for diagnostic use at an individual level).
There were only a few questions which did not really contribute to the overall reliability of the scale – and, even for these, the extra reliability gained from their removal would have been fairly small (see Table 3.7). Those small gains reflect that the overall level of reliability is already very high. It is also instructive to consider the correlation between the item, and the overall scale (the first numeric column). Lower values indicate lower levels of reliability, meaning that the particular question (being unable to afford the good/service) has a low correlation with the sum of being unable to afford the others listed.
Table 3.7 Reliability analysis (items in italics did not contribute to the reliability of the overall scale)
Corrected item-total correlation
Cronbach’s alpha if item deleted
Spaceinwhichthefamilycaneattogetheratatable? 0.107 0.909Atleastonebasicmobiletelephone? 0.000 0.909Regular family outings, at least once every two weeks? 0.567 0.904Do you go on regular family outings, monthly? 0.586 0.904Does your family have a car? 0.348 0.907Able to keep this accommodation warm enough? 0.360 0.907Do you (and your partner) have a warm winter coat? 0.378 0.907Replace or repair major electrical goods when broken? 0.612 0.904Childcare to go out socially, at least once a fortnight? 0.422 0.907Childcare to go out socially, at least once a month? 0.424 0.906A small amount of money to spend on yourself? 0.521 0.905Holiday away from home for at least one week a year? 0.686 0.902Holiday for a shorter period, such as a long weekend? 0.684 0.902A presentable home? 0.280 0.908Friends or family around for a drink or meal monthly? 0.493 0.905Keep your home in a decent state of decoration? 0.466 0.906Replace any worn out furniture? 0.535 0.905Make regular savings of £50 a month or more? 0.609 0.904Make regular savings of £10 a month or more? 0.597 0.904Keep up with bills and any regular debt repayments? 0.379 0.907An unexpected expense of £250? 0.682 0.902Two pairs of all weather shoes? 0.430 0.907Household contents insurance? 0.442 0.906Do you have a hobby or leisure activity? 0.402 0.907
Continued
Analysis of omnibus data

20
Table 3.7 Continued
Corrected item-total correlation
Cronbach’s alpha if item deleted
Meat, fish or a vegetarian equivalent at least 2 days? 0.260 0.908Outdoor space or facilities nearby where they can play? 0.340 0.907Spaceorfacilityprivatetoyourfamily? 0.304 0.909Toys, games and books to support their development? 0.237 0.908At least one regular organised activity a week? 0.375 0.907A family holiday away from home for one week? 0.695 0.902A family holiday for a shorter period? 0.657 0.903Fresh fruit and/or vegetables every day? 0.298 0.908Properlyfittedshoeswhichwereboughtnew? 0.224 0.909Do they have a warm winter coat each? 0.243 0.908Bedroomsforeverychildof10+ofdifferentsex? 0.199 0.909Leisure equipment such as a bicycle? 0.249 0.908Celebrationsonspecialoccasions? 0.224 0.909Do they go swimming at least once a month? 0.402 0.907Do they have a hobby or leisure activity? 0.324 0.908Do they have meat, fish at least every other day? 0.188 0.908Friends round for tea or a snack at least once a fortnight? 0.373 0.907
Analysis of omnibus data

21
4 Discussion and recommendations4.1 IntroductionIn this section we bring together the evidence already presented, and make suggestions for how the FRS material deprivation may be adapted for future use. Overall, we may identify three different strategies to changing the set of questions. These are: No change; Minor change; and Major change.
The No change option would emphasise the time-consistency of the measure, and propose no new questions and no questions to be removed. This default path would maximise consistency with the existing series. However, we must challenge the benefits of consistency if the meaning and usefulness of those questions has changed. There are now questions included in the FRS which less than 40 per cent of the population now regard as necessary for families with children, and which are not supported by qualitative research. It was always envisaged that changes would be needed at regular, if lengthy, intervals. There is sufficient evidence to propose changes at this stage.
An approach of Minor change would imply changing perhaps two to six questions. This would ensure a high degree of consistency with past data – indeed it would always be possible to calculate measures based on the large number of questions that were retained – but would also ensure that the questions reflected standard thinking on deprivation indicators which requires them to have widespread support.
The final approach is that of Major change. This would imply changing rather more questions, perhaps seven to eight1 or still more, on the grounds that these are no longer regarded as necessities and, therefore, should be dropped. I think, however, that this would reduce confidence in the consistency of the time-series of data. There are also fewer than this number that really justify themselves as appropriate replacements (see Section 4.3) and, therefore, the measure might run the risk of having fewer items if this route was adopted.
Therefore, overall I think the ‘minor change’ option is backed by the strongest evidence and is what is proposed by this report.
4.2 Evidence on changing the existing questionsIt makes sense to start from the existing questions used to measure material deprivation in the FRS. In Table 4.1 we show the existing set, the verdict from qualitative research, the proportion rating as necessary in the September 2009 ONS omnibus, and the proportion of families with children who were unable to afford the item concerned.
There are now eight of these questions that are no longer supported as essential by at least half the population. This has long been a key criterion of whether an item should be included in a measure of poverty that takes account of material deprivation.
1 The eighth question ‘at risk’ of being dropped (children’s leisure equipment) was supported by 49 per cent of the population. This is not statistically discernible from a value of 50 per cent in the population as a whole.
Discussion and recommendations

22
One unknown factor is whether the large drop in proportions rating items as necessary is mainly a recession ‘blip’, or instead part of a longer-term trend against certain ‘social’ measures of deprivation that will persist during a recovery. There did seem to be rather smaller decreases in support for some of the material goods and those related to children’s development. Proportions very close to half – such as the 49 per cent agreeing that sports equipment was essential – are not statistically discernible from 50 per cent in any case. This set of eight questions represents those that should be subject to detailed scrutiny. However, some had a degree of support from the qualitative research, and some appear to correlate well both with incomes and the other questions.
Another consideration is how many people are unable to afford the items. Where coverage is almost universal, it is hard for a question to track change over time. This might apply, for instance, to ‘Celebrations on special occasions such as birthdays, Christmas or other religious festivals’, which fewer than one in every 200 families could not afford. Also, taking out an item with a high proportion unable to afford it puts greater pressure on the consistency of the overall time series (a week’s holiday each year being the key example of this).
Table 4.1 Summary of evidence on existing FRS questions
Area ItemQualitative
view NecessaryUnable to
affordFamily In winter, being able to keep their
accommodation warm enough+ 94 6.9
Parents Being able to make regular savings of £10 a month or more for rainy days or retirement
= 82 31.8
Being able to replace or repair major electrical goods, when broken
+/= 80 12.2
Having enough money to keep their home in a decent state of decoration
-/= 75 14.4
Household contents insurance + 59 14.7
Being able to replace any worn out furniture
- 55 16.9
Having a small amount of money to spend each week on themselves, not on their family
+ 50 27.5
Two pairs of all weather shoes for each parent
41 4.9
A holiday away from home for at least one week a year
= 40 26.7
A hobby or leisure activity - 36 8.4
Having friends or family around for a drink or meal at least once a month
- 34 11.0
Children Having an outdoor space or facilities nearby where they can play safely
85 7.4
Celebrations on special occasions such as birthdays, Christmas or other religious festivals
+ 77 0.4
Continued
Discussion and recommendations

23
Table 4.1 Continued
Area ItemQualitative
view NecessaryUnable to
affordChildren For children below school age, going to
toddler group, or nursery, or playgroup at least once a week
+ 74 3.8
Having enough bedrooms for every child of 10 or over of a different sex
72 4.6
A hobby or leisure activity - 65 3.3
For school-aged children, going on school trips
+ 63 2.6
Leisure equipment such as sports equipment or a bicycle
+/= 49 1.4
Having friends round for tea or a snack at least once a fortnight
- 46 3.4
A family holiday away from home for at least one week each year
= 45 18.7
Going swimming at least once a month 42 7.9
4.3 Evidence on proposed new questionsWe have seen that some existing FRS questions are no longer regarded as concerning essential items. Have new items instead become essential? In this section we consider the contemporary evidence on non-FRS items and how far they have widespread support as being necessities. We show overall results in Table 4.2. One question – keeping up with regular commitments – was regarded as essential by over nine people in every ten. A further three questions, each relating to children, were regarded as necessities by some 80 per cent, or more. Three of these questions also attained a high degree of support within the focus groups.
Table 4.2 Summary of evidence on proposed new material deprivation questions
Area ItemQualitative
view NecessaryUnable to
affordFamily A space in which the family can eat
together at a table+ 73 3.4
Being able to go on regular family outings – monthly
+ 43 12.6
A car = 36 7.3At least one basic mobile telephone + 33 0.0Being able to go on regular family outings – 2 weekly
+ 24 18.7
F: Being able to go on regular family outings – unspecified
48
Continued
Discussion and recommendations

24
Table 4.2 Continued
Area ItemQualitative
view NecessaryUnable to
affordParents Keeping up with bills and any regular debt
repayments+ 93 7.7
A holiday away from home for a [long weekend]
+ 69 15.1
A warm winter coat + 66 4.3Eating meat, fish or a vegetarian equivalent at least every other day
- 64 2.4
A presentable home you are comfortable bringing friends or family back to
+ 57 6.3
Being able to pay an unexpected expense of £250
56 25.8
Being able to make regular savings of £50 a month or more for rainy days or retirement
+ 48 42.1
Being able to arrange childcare to go out socially unspecified frequency
+ 31
Being able to arrange childcare to go out socially – monthly
+ 28 13.9
Being able to arrange childcare to go out socially – 2 weekly
+ 15 18.6
Children Eating fresh fruit and/or vegetables every day
+ 86 1.7
A warm winter coat for each child + 86 1.6Eating meat, fish or a vegetarian equivalent at least every other day
- 80 2.1
For school-aged children, all the school uniform required by their school
77 1.4
Enough toys, games and books to support a child s development
+ 75 1.6
Properly fitted shoes which were bought new, not second-hand
74 0.2
A family holiday away from home for a [long weekend]
+ 72 13.1
Being able to attend at least one regular organised activity a week outside school
+ 59 5.8
For school-aged children, having a computer connected to the internet at home
+ 44 4.0
[private] outdoor space or facilities nearby where they can play safely
+ 18 29.6
Discussion and recommendations

25
4.4 RecommendationsAdopting a strategy of minor change then raises the question of which items to drop, and which new ones to include.
On the basis of the information presented here, we may strongly recommend that we remove the last two questions on parents. That is, having a hobby or leisure activity, and having friends or family around for a drink or meal at least once a month. These have the weakest support, and only a minority believe them to be essential. The qualitative research was also sceptical about their value. The one week’s holiday question continues to be very important within the measure – over a quarter of families were unable to afford this. It would interrupt the measure somewhat to remove it. The next two questions with proportions in the low-40s (children going swimming, shoes for parents) should also be considered as vulnerable to being removed with little to recommend their retention.
By contrast many of the new candidate questions attracted high levels of support as representing necessities. In particular there was very strong support for being able to keep up with bills2, which over 90 per cent believed was essential. Enjoying almost as much support was for children to be eating fresh fruit and vegetables every day, and children having a warm winter coat. The question of fruit and vegetables also has strong face validity, and fills something of a gap towards diet-based questions. These three questions are straightforward to recommend, assuming that at least three questions are being dropped.
More of a judgement call is to have a replacement question if we remove the question concerning children attending regular swimming, which has fallen back rather far in parental and popular support. A suitable replacement might be for children to be attending at least one activity organised outside school. This enjoyed the support of 59 per cent of people, and proved resilient within the focus group element of the research.
Overall, the evidence supports making some minor changes to the questions asked in the FRS to measure material deprivation among families. It is something of a judgement call whether this should involve changing as few as two questions, or as many as four or five. Replacement questions should ideally tap into the same kinds of domains as those lost.
2 The FRS does ask about arrears, but this has never been part of the overall deprivation indicator used within the Households Below Average Income series.
Discussion and recommendations

26
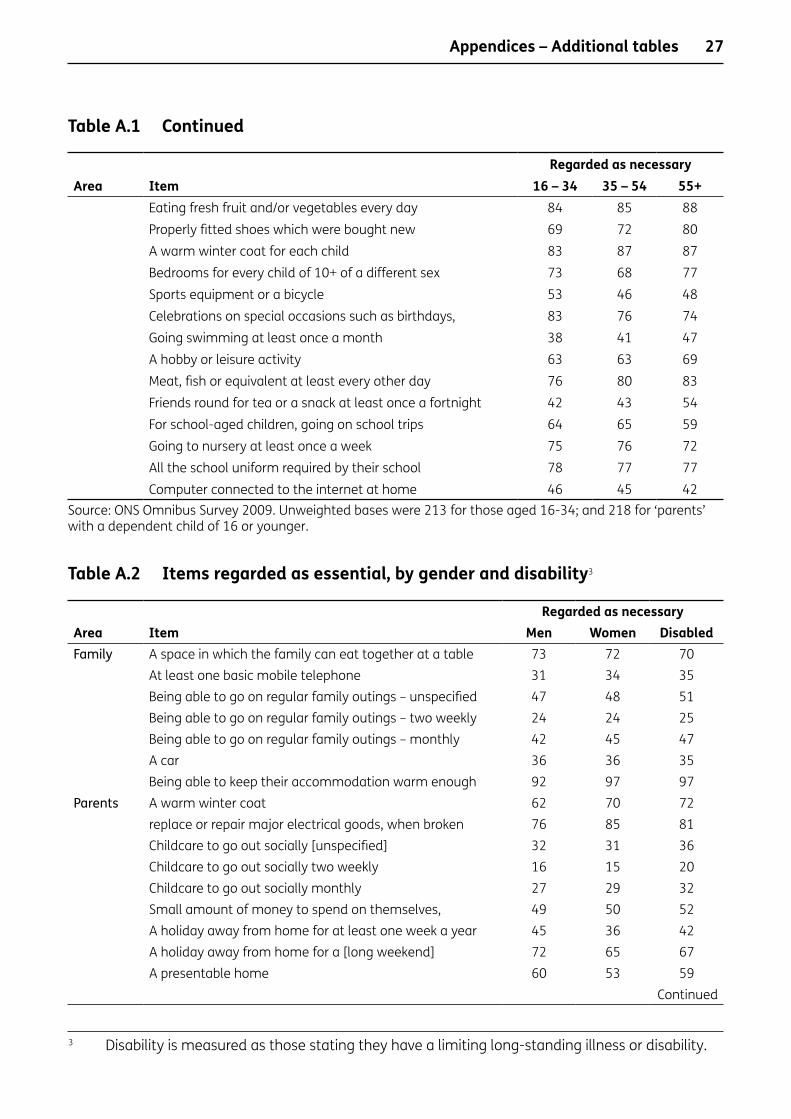
Appendix A Additional tablesTable A.1 Items regarded as essential by age group
Regarded as necessaryArea Item 16 – 34 35 – 54 55+Family A space in which the family can eat together at a table 67 71 80
At least one basic mobile telephone 36 25 37Being able to go on regular family outings – unspecified 40 49 53Being able to go on regular family outings – two weekly 22 27 23Being able to go on regular family outings – monthly 35 46 48A car 40 36 32Being able to keep their accommodation warm enough 93 95 94
Parents A warm winter coat 59 65 73Replace or repair major electrical goods, when broken 80 83 78Childcare to go out socially [unspecified] 31 24 40Childcare to go out socially two weekly 17 10 19Childcare to go out socially monthly 27 22 36Small amount of money to spend on themselves, 50 42 57A holiday away from home for at least one week a year 33 43 44A holiday away from home for a [long weekend] 71 66 70A presentable home 52 55 62Friends around for a drink or meal at least once a month 29 31 41Keep their home in a decent state of decoration 71 75 77Being able to replace any worn out furniture 55 54 57Regular savings of £50 a month or more 57 46 40Regular savings of £10 a month or more 90 78 78Keeping up with bills and any regular debt repayments 94 95 90Being able to pay an unexpected expense of £250 55 59 54Two pairs of all weather shoes for each parent 34 36 52Household contents insurance 51 58 67A hobby or leisure activity 36 30 41Meat, fish or equivalent every other day 61 62 69
Children Space or facilities nearby where they can play safely 83 85 86[Private] outdoor space or facilities 17 16 23Enough toys, games for development 79 75 71Able to attend one regular organised activity a week 61 58 60Family holiday for at least one week each year 41 46 47A family holiday away from home for a [long weekend] 73 71 72
Continued
Appendices – Additional tables
27
Table A.1 Continued
Regarded as necessaryArea Item 16 – 34 35 – 54 55+
Eating fresh fruit and/or vegetables every day 84 85 88Properly fitted shoes which were bought new 69 72 80A warm winter coat for each child 83 87 87Bedrooms for every child of 10+ of a different sex 73 68 77Sports equipment or a bicycle 53 46 48Celebrations on special occasions such as birthdays, 83 76 74Going swimming at least once a month 38 41 47A hobby or leisure activity 63 63 69Meat, fish or equivalent at least every other day 76 80 83Friends round for tea or a snack at least once a fortnight 42 43 54For school-aged children, going on school trips 64 65 59Going to nursery at least once a week 75 76 72All the school uniform required by their school 78 77 77Computer connected to the internet at home 46 45 42
Source: ONS Omnibus Survey 2009. Unweighted bases were 213 for those aged 16-34; and 218 for ‘parents’ with a dependent child of 16 or younger.
Table A.2 Items regarded as essential, by gender and disability3
Regarded as necessaryArea Item Men Women DisabledFamily A space in which the family can eat together at a table 73 72 70
At least one basic mobile telephone 31 34 35Being able to go on regular family outings – unspecified 47 48 51Being able to go on regular family outings – two weekly 24 24 25Being able to go on regular family outings – monthly 42 45 47A car 36 36 35Being able to keep their accommodation warm enough 92 97 97
Parents A warm winter coat 62 70 72replace or repair major electrical goods, when broken 76 85 81Childcare to go out socially [unspecified] 32 31 36Childcare to go out socially two weekly 16 15 20Childcare to go out socially monthly 27 29 32Small amount of money to spend on themselves, 49 50 52A holiday away from home for at least one week a year 45 36 42A holiday away from home for a [long weekend] 72 65 67A presentable home 60 53 59
Continued
3 Disability is measured as those stating they have a limiting long-standing illness or disability.
Appendices – Additional tables

28
Table A.2 Continued
Regarded as necessaryArea Item Men Women DisabledParents Friends around for a drink or meal at least once a month 34 34 37
Keep their home in a decent state of decoration 74 75 73Being able to replace any worn out furniture 52 58 59Regular savings of £50 a month or more 51 45 44Regular savings of £10 a month or more 82 81 78Keeping up with bills and any regular debt repayments 93 93 94Being able to pay an unexpected expense of £250 54 58 53Two pairs of all weather shoes for each parent 40 42 46Household contents insurance 56 63 61A hobby or leisure activity 39 32 37Meat, fish or equivalent every other day 65 64 66
Children Space or facilities nearby where they can play safely 83 86 85[Private] outdoor space or facilities 19 18 17Enough toys, games for development 76 74 77Able to attend one regular organised activity a week 59 60 64Family holiday for at least one week each year 47 42 48A family holiday away from home for a [long weekend] 75 69 73Eating fresh fruit and/or vegetables every day 82 90 87Properly fitted shoes which were bought new 69 78 80A warm winter coat for each child 83 88 88Bedrooms for every child of 10+ of a different sex 72 73 76Sports equipment or a bicycle 51 47 49Celebrations on special occasions such as birthdays, 77 78 74Going swimming at least once a month 41 43 49A hobby or leisure activity 67 64 67Meat, fish or equivalent at least every other day 76 83 84Friends round for tea or a snack at least once a fortnight 42 50 46For school-aged children, going on school trips 61 65 64Going to nursery at least once a week 68 81 76All the school uniform required by their school 73 81 77Computer connected to the internet at home 46 42 38
Source: ONS Omnibus Survey 2009. Unweighted bases were 448 for men, 509 for women and 334 for those with a long-standing illness or disability.
Appendices – Additional tables
29
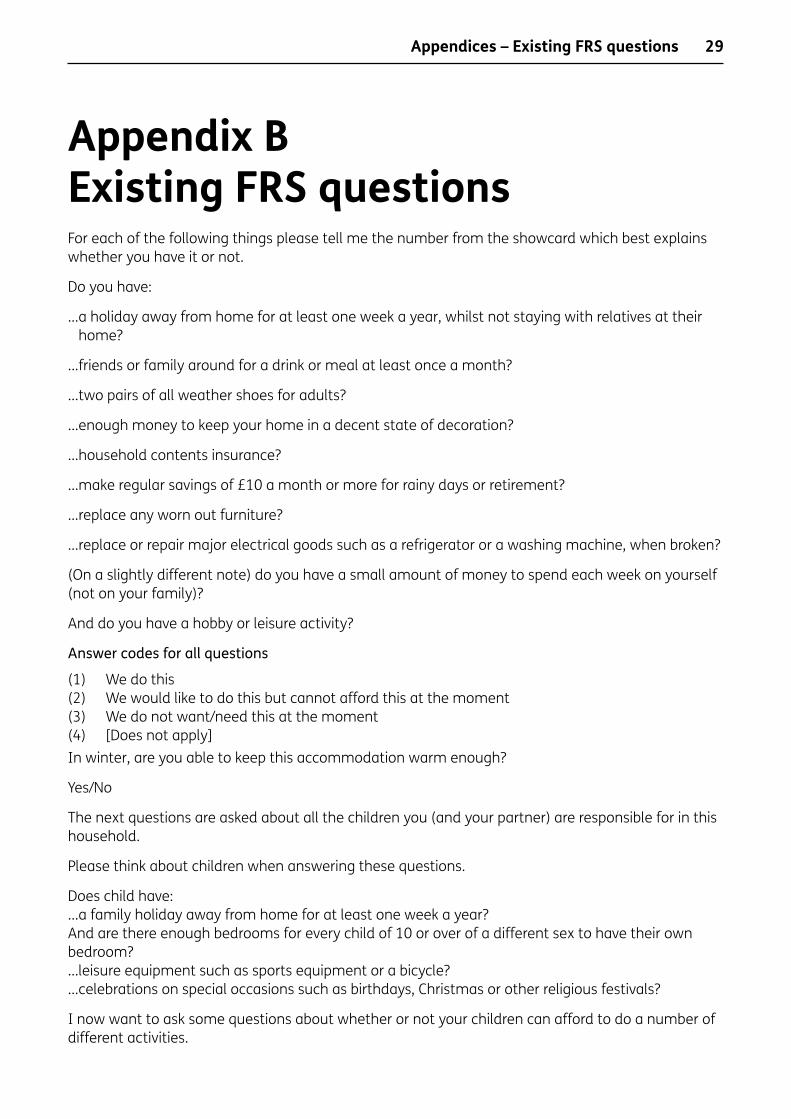
Appendix B Existing FRS questionsFor each of the following things please tell me the number from the showcard which best explains whether you have it or not.
Do you have:
… a holiday away from home for at least one week a year, whilst not staying with relatives at their home?
…friends or family around for a drink or meal at least once a month?
…two pairs of all weather shoes for adults?
…enough money to keep your home in a decent state of decoration?
…household contents insurance?
…make regular savings of £10 a month or more for rainy days or retirement?
…replace any worn out furniture?
…replace or repair major electrical goods such as a refrigerator or a washing machine, when broken?
(On a slightly different note) do you have a small amount of money to spend each week on yourself (not on your family)?
And do you have a hobby or leisure activity?
Answer codes for all questions
(1) We do this(2) We would like to do this but cannot afford this at the moment(3) We do not want/need this at the moment(4) [Does not apply]In winter, are you able to keep this accommodation warm enough?
Yes/No
The next questions are asked about all the children you (and your partner) are responsible for in this household.
Please think about children when answering these questions.
Does child have: …a family holiday away from home for at least one week a year? And are there enough bedrooms for every child of 10 or over of a different sex to have their own bedroom? …leisure equipment such as sports equipment or a bicycle? …celebrations on special occasions such as birthdays, Christmas or other religious festivals?
I now want to ask some questions about whether or not your children can afford to do a number of different activities.
Appendices – Existing FRS questions
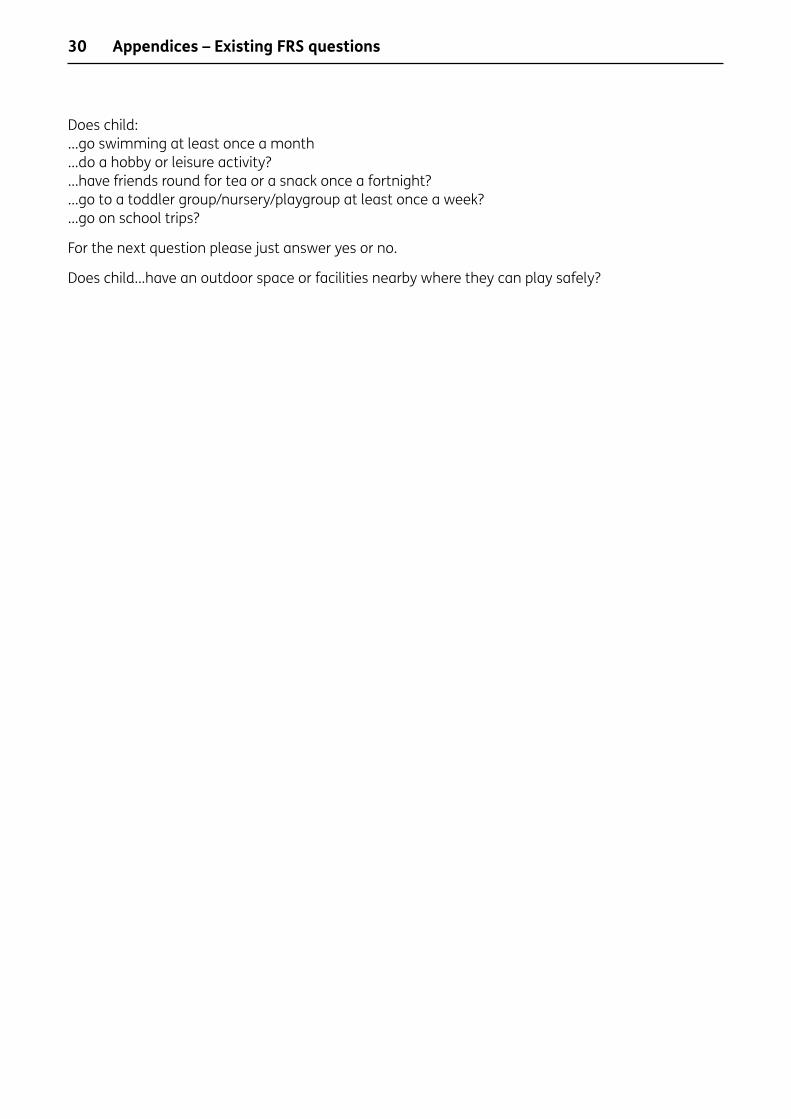
30
Does child: …go swimming at least once a month …do a hobby or leisure activity? …have friends round for tea or a snack once a fortnight? …go to a toddler group/nursery/playgroup at least once a week?…go on school trips?
For the next question please just answer yes or no.
Does child…have an outdoor space or facilities nearby where they can play safely?
Appendices – Existing FRS questions

31
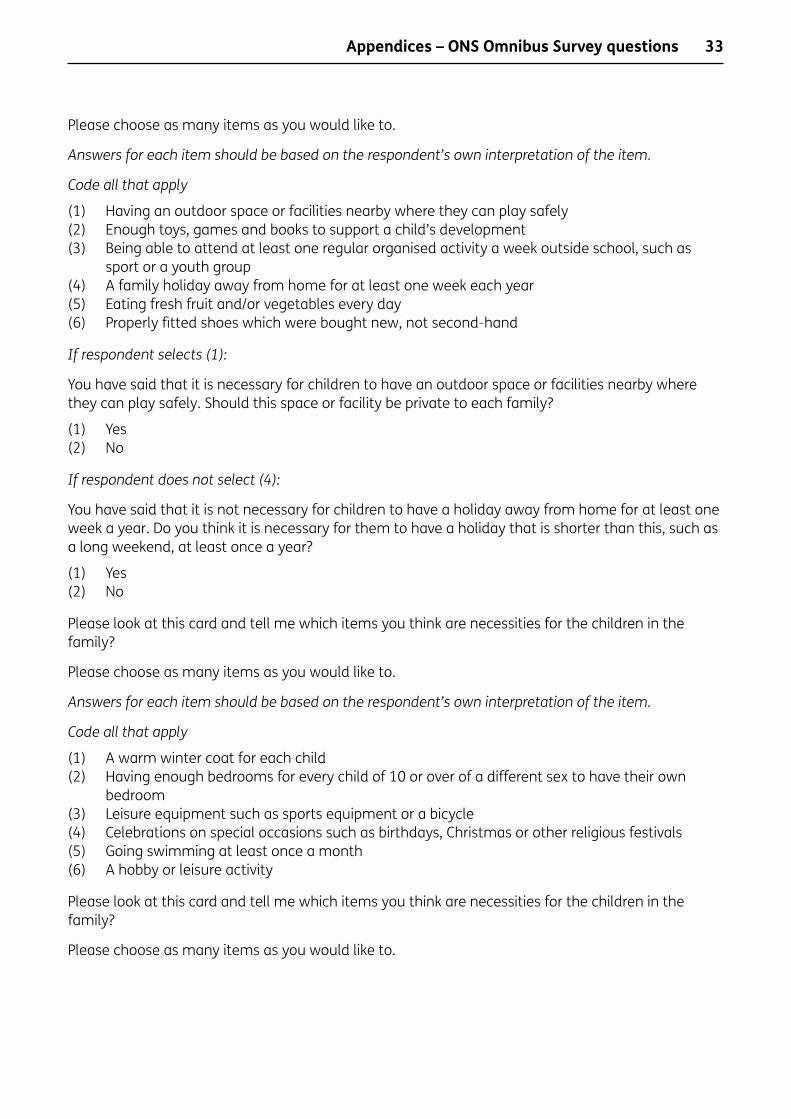
Appendix C ONS Omnibus Survey questionsa NeccessitiesWe list the questions on the ONS Omnibus Survey for September 2009. Four different orderings of these items were used on the different showcards – see Section 3.3.2 for analysis of the effects of different orderings.
Which of the items on this card do you think are necessities for the family as a whole? Please choose as many items as you would like to.
(1) A space in which the family can eat together at a table (2) At least one basic mobile telephone (3) Being able to go on regular family outings (4) A car (5) In winter, being able to keep their accommodation warm enough
Ifrespondentselects(3):
How often do you think regular family outings should be?
(1) At least once every two weeks (2) At least once a month(3) Less often than once a month (Spontaneous only)
The next set of showcards show items which may or may not be necessary for parents in the family. By a necessity I mean something that every family should be able to afford if they want it, and not have to do without.
Please look at this card and tell me which items you think are necessities for the parents in the family?
Answersforeachitemshouldbebasedontherespondent’sowninterpretationoftheitem.Codeallthatapply
(1) A warm winter coat (2) Being able to replace or repair major electrical goods such as a refrigerator or a
washing machine, when broken (3) Being able to arrange childcare to go out socially (4) Having a small amount of money to spend each week on themselves (not on their family) (5) A holiday away from home for at least one week a year, whilst not staying with relatives at
their home
Appendices – ONS Omnibus Survey questions

32
Ifrespondentselects(3):
How often do you think parents should be able to arrange the childcare they need to go out socially?
(1) At least once every two weeks (2) At least once a month(3) Less often than once a month (Spontaneous only)
Ifrespondentselects(5):
You have said that it is not necessary for parents to have a holiday away from home for at least one week a year. Do you think it is necessary for them to have a holiday away from home for a shorter period each year, such as a long weekend?
(1) Yes(2) No
And which of the items on this card do you think are necessities for the parents in the family?
Please choose as many items as you would like to.
Answersforeachitemshouldbebasedontherespondent’sowninterpretationoftheitem.
Codeallthatapply
(1) A presentable home you are comfortable bringing friends or family back to (2) Having friends or family around for a drink or meal at least once a month (3) Having enough money to keep their home in a decent state of decoration (4) Being able to replace any worn out furniture (5) Being able to make regular savings of £50 a month or more for rainy days or retirement
Ifrespondentdoesnotselect(5):
Do you think it is necessary for parents to be able to make regular savings of £10 a month or more for rainy days or retirement?
(1) Yes (2) No
And which of the items on this card do you think are necessities for the parents in the family?
Please choose as many items as you would like to.
Answersforeachitemshouldbebasedontherespondent’sowninterpretationoftheitem.
Codeallthatapply
(1) Keeping up with bills and any regular debt repayments (2) Being able to pay an unexpected expense of £250 (3) Two pairs of all weather shoes for each parent (4) Household contents insurance (5) A hobby or leisure activity (6) Eating meat, fish or a vegetarian equivalent at least every other day
The next set of showcards show items which may or may not be necessary for children in the family. By a necessity I mean something that every family should be able to afford if they want it, and not have to do without.
Please look at this card and tell me which items you think are necessities for the children in the family?
Appendices – ONS Omnibus Survey questions
33
Please choose as many items as you would like to.
Answersforeachitemshouldbebasedontherespondent’sowninterpretationoftheitem.
Codeallthatapply
(1) Having an outdoor space or facilities nearby where they can play safely (2) Enough toys, games and books to support a child’s development (3) Being able to attend at least one regular organised activity a week outside school, such as
sport or a youth group (4) A family holiday away from home for at least one week each year (5) Eating fresh fruit and/or vegetables every day (6) Properly fitted shoes which were bought new, not second-hand
Ifrespondentselects(1):
You have said that it is necessary for children to have an outdoor space or facilities nearby where they can play safely. Should this space or facility be private to each family?
(1) Yes (2) No
Ifrespondentdoesnotselect(4):
You have said that it is not necessary for children to have a holiday away from home for at least one week a year. Do you think it is necessary for them to have a holiday that is shorter than this, such as a long weekend, at least once a year?
(1) Yes (2) No
Please look at this card and tell me which items you think are necessities for the children in the family?
Please choose as many items as you would like to.
Answersforeachitemshouldbebasedontherespondent’sowninterpretationoftheitem.
Codeallthatapply
(1) A warm winter coat for each child (2) Having enough bedrooms for every child of 10 or over of a different sex to have their own
bedroom (3) Leisure equipment such as sports equipment or a bicycle (4) Celebrations on special occasions such as birthdays, Christmas or other religious festivals (5) Going swimming at least once a month (6) A hobby or leisure activity
Please look at this card and tell me which items you think are necessities for the children in the family?
Please choose as many items as you would like to.
Appendices – ONS Omnibus Survey questions

34
Answersforeachitemshouldbebasedontherespondent’sowninterpretationoftheitem.
Codeallthatapply
(1) Eating meat, fish or a vegetarian equivalent at least every other day (2) Having friends round for tea or a snack at least once a fortnight (3) For school-aged children, going on school trips (4) For children below school age, going to toddler group, or nursery, or playgroup at least once a
week (5) For school-aged children, all the school uniform required by their school (6) For school-aged children, having a computer connected to the internet at home
b Having and affording these itemsThe next section is about things that some families with children have, but which many people have difficulty finding the money for. For each of the following things, please tell me the number from the showcard which best explains whether you have the item or not.
Answersforeachitemshouldbebasedontherespondent’sowninterpretationoftheitem
The following questions are about items for your family as a whole.
Does your family have a car?(1) We have/do this(2) We would like to have/do this, but cannot afford this at the moment(3) We do not want/need this at the moment
Do you have a space in which the family can eat together at a table?(1) We have/do this(2) We would like to have/do this, but cannot afford this at the moment(3) We do not want/need this at the moment
Do you go on regular family outings, at least once every two weeks?(1) We have/do this(2) We would like to have/do this, but cannot afford this at the moment(3) We do not want/need this at the moment
Do you go on regular family outings, at least once a month?(1) We have/do this(2) We would like to have/do this, but cannot afford this at the moment(3) We do not want/need this at the moment
Does your family as a whole have at least one basic mobile telephone?(1) We have/do this(2) We would like to have/do this, but cannot afford this at the moment(3) We do not want/need this at the moment
For the next question, please answer yes or no
In winter, are you able to keep this accommodation warm enough?(1) Yes(2) No
Appendices – ONS Omnibus Survey questions

35
Do you (and your partner) eat meat, fish or a vegetarian equivalent at least every other day?(1) We have/do this(2) We would like to have/do this, but cannot afford this at the moment(3) We do not want/need this at the moment
Do you (and your partner) have childcare to go out socially, at least once a fortnight?(1) We have/do this(2) We would like to have/do this, but cannot afford this at the moment(3) We do not want/need this at the moment
Do you (and your partner) have childcare to go out socially, at least once a month?(1) We have/do this(2) We would like to have/do this, but cannot afford this at the moment(3) We do not want/need this at the moment
Do you (and your partner) have enough money to keep your home in a decent state of decoration?(1) We have/do this(2) We would like to have/do this, but cannot afford this at the moment(3) We do not want/need this at the moment
Do you have a hobby or leisure activity?(1) We have/do this(2) We would like to have/do this, but cannot afford this at the moment(3) We do not want/need this at the moment
Could you (and your partner) pay an unexpected expense of £250?(1) We have/do this(2) We would like to have/do this, but cannot afford this at the moment(3) We do not want/need this at the moment
Do you (and your partner) have a holiday away from home for at least one week a year, whilst not staying with relatives at their home?(1) We have/do this(2) We would like to have/do this, but cannot afford this at the moment(3) We do not want/need this at the moment
[IF NO] Do you (and your partner) have this for a shorter period each year, such as a long weekend?(1) We have/do this(2) We would like to have/do this, but cannot afford this at the moment(3) We do not want/need this at the moment
Do you (and your partner) replace any worn out furniture?(1) We have/do this(2) We would like to have/do this, but cannot afford this at the moment(3) We do not want/need this at the moment
Do you (and your partner) have friends or family around for a drink or meal at least once a month?(1) We have/do this(2) We would like to have/do this, but cannot afford this at the moment(3) We do not want/need this at the moment
Appendices – ONS Omnibus Survey questions

36
Do you (and your partner) make regular savings of £50 a month or more for rainy days or retirement?(1) We have/do this(2) We would like to have/do this, but cannot afford this at the moment(3) We do not want/need this at the moment
[IF NO] Do you (and your partner) make regular savings of £10 a month or more for rainy days or retirement?(1) We have/do this(2) We would like to have/do this, but cannot afford this at the moment(3) We do not want/need this at the moment
Do you (and your partner) have a presentable home you are comfortable bringing friends or family back to?(1) We have/do this(2) We would like to have/do this, but cannot afford this at the moment(3) We do not want/need this at the moment
Do you (and your partner) have two pairs of all weather shoes?(1) We have/do this(2) We would like to have/do this, but cannot afford this at the moment(3) We do not want/need this at the moment
Do you (and your partner) have a warm winter coat?(1) We have/do this(2) We would like to have/do this, but cannot afford this at the moment(3) We do not want/need this at the moment
Do you (and your partner) have household contents insurance?(1) We have/do this(2) We would like to have/do this, but cannot afford this at the moment(3) We do not want/need this at the moment
Do you have a small amount of money to spend each week on yourself, not on your family?(1) We have/do this(2) We would like to have/do this, but cannot afford this at the moment(3) We do not want/need this at the moment
Do you (and your partner) replace or repair major electrical goods such as a refrigerator or a washing machine, when broken?(1) We have/do this(2) We would like to have/do this, but cannot afford this at the moment(3) We do not want/need this at the moment
For the next question, please answer yes or no
Do you (and your partner) keep up with bills and any regular debt repayments?(1) Yes(2) No
The next questions are about all the children you (and your partner) are responsible for in this household.
Answersforeachitemshouldbebasedontherespondent’sowninterpretationoftheitem.
Appendices – ONS Omnibus Survey questions

37
Are any of your children of school-age? This includes children aged 4 who are attending primary school, and children aged 16–19 who are still in full-time education, unless they are at university(1) Yes(2) No
Do they eat fresh fruit and/or vegetables every day?(1) Child(ren) do this(2) Child(ren) would like to do this but we cannot afford this at the moment(3) Child(ren) do not want/need this at the moment
For the next question, please answer yes or noDo they have an outdoor space or facilities nearby where they can play safely?‘Nearby’ and ‘safely’ are respondent’s own interpretation(1) Yes(2) No[IF YES] And is this space or facility private to your family?(1) Yes(2) No
Do they have a computer connected to the internet at home?(1) Child(ren) do this(2) Child(ren) would like to do this but we cannot afford this at the moment(3) Child(ren) do not want/need this at the moment
Do they go on school trips?(1) Child(ren) do this(2) Child(ren) would like to do this but we cannot afford this at the moment(3) Child(ren) do not want/need this at the moment
Do they have all the school uniform required for their school?(1) Child(ren) do this(2) Child(ren) would like to do this but we cannot afford this at the moment(3) Child(ren) do not want/need this at the moment
Do they have a hobby or leisure activity?(1) Child(ren) do this(2) Child(ren) would like to do this but we cannot afford this at the moment(3) Child(ren) do not want/need this at the moment
Do they have a warm winter coat each?(1) Child(ren) do this(2) Child(ren) would like to do this but we cannot afford this at the moment(3) Child(ren) do not want/need this at the moment
Do they have celebrations on special occasions such as birthdays, Christmas or other religious festivals?(1) Child(ren) do this(2) Child(ren) would like to do this but we cannot afford this at the moment(3) Child(ren) do not want/need this at the moment
Do they have a family holiday away from home for at least one week a year?(1) Child(ren) do this(2) Child(ren) would like to do this but we cannot afford this at the moment(3) Child(ren) do not want/need this at the moment
Appendices – ONS Omnibus Survey questions
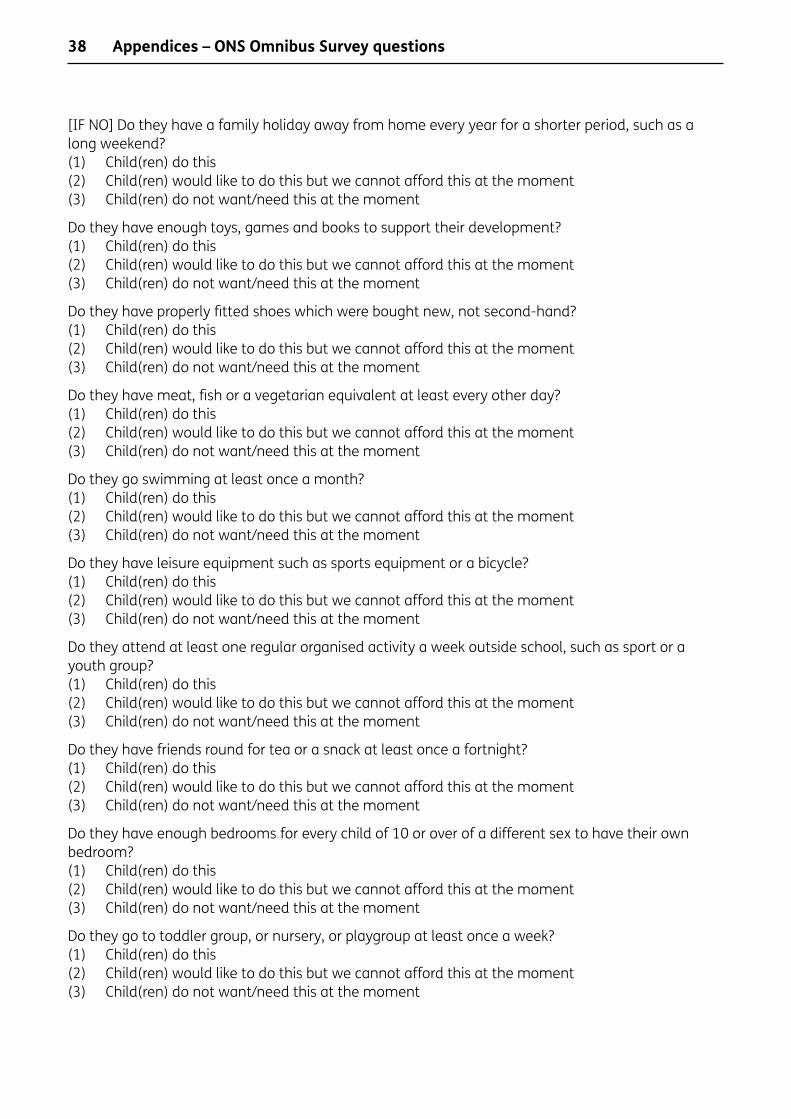
38
[IF NO] Do they have a family holiday away from home every year for a shorter period, such as a long weekend?(1) Child(ren) do this(2) Child(ren) would like to do this but we cannot afford this at the moment(3) Child(ren) do not want/need this at the moment
Do they have enough toys, games and books to support their development?(1) Child(ren) do this(2) Child(ren) would like to do this but we cannot afford this at the moment(3) Child(ren) do not want/need this at the moment
Do they have properly fitted shoes which were bought new, not second-hand?(1) Child(ren) do this(2) Child(ren) would like to do this but we cannot afford this at the moment(3) Child(ren) do not want/need this at the moment
Do they have meat, fish or a vegetarian equivalent at least every other day?(1) Child(ren) do this(2) Child(ren) would like to do this but we cannot afford this at the moment(3) Child(ren) do not want/need this at the moment
Do they go swimming at least once a month?(1) Child(ren) do this(2) Child(ren) would like to do this but we cannot afford this at the moment(3) Child(ren) do not want/need this at the moment
Do they have leisure equipment such as sports equipment or a bicycle?(1) Child(ren) do this(2) Child(ren) would like to do this but we cannot afford this at the moment(3) Child(ren) do not want/need this at the moment
Do they attend at least one regular organised activity a week outside school, such as sport or a youth group?(1) Child(ren) do this(2) Child(ren) would like to do this but we cannot afford this at the moment(3) Child(ren) do not want/need this at the moment
Do they have friends round for tea or a snack at least once a fortnight?(1) Child(ren) do this(2) Child(ren) would like to do this but we cannot afford this at the moment(3) Child(ren) do not want/need this at the moment
Do they have enough bedrooms for every child of 10 or over of a different sex to have their own bedroom?(1) Child(ren) do this(2) Child(ren) would like to do this but we cannot afford this at the moment(3) Child(ren) do not want/need this at the moment
Do they go to toddler group, or nursery, or playgroup at least once a week?(1) Child(ren) do this(2) Child(ren) would like to do this but we cannot afford this at the moment(3) Child(ren) do not want/need this at the moment
Appendices – ONS Omnibus Survey questions
39
ReferencesBartholomew, D., Steele, F., Moustaki, I. and Galbraith, J. (2008). AnalysisofMultivariateSocialScienceData. Second Edition, Chapman & Hall.
Bland J. and Altman, D. (1997). ‘Statistics notes: Cronbach’s alpha’. BMJ 314:572.
Calandrino, M. (2003). LowincomeanddeprivationinBritishfamilies. London: DWP Working Paper No. 10.
Gordon, D., Adelman, L., Ashworth, K., Bradshaw, J., Levitas, R., Middleton, S., Pantazis, C., Patsios, D., Payne, S., Townsend, P. and Williams, J. (2000). PovertyandSocialExclusioninBritain. York: Joseph Rowntree Foundation.
Hirsch, D. and Smith, N. (2010). Familyvalues–parents’viewsonnecessitiesforfamilieswithchildren DWP report, forthcoming.
Krosnick, J. and Alwin, D. (1987). ‘An evaluation of a cognitive theory of response-order effects in survey measurement’ in PublicOpinionQuarterly, vol 51: 201-219.
McKay, S. and Collard, S. (2004). DevelopingdeprivationquestionsfortheFamilyResourcesSurvey. London: DWP Working Paper No. 13.
McKay, S. (2008). Measuringmaterialdeprivationamongolderpeople:MethodologicalstudytorevisetheFamilyResourcesSurvey questions. London: DWP Working Paper No. 54. http://www.dwp.gov.uk/asd/asd5/WP54.pdf [ISBN 978 1 84712 443 2] (64pp).
Middleton, S. (1998). ‘Revising the Breadline Britain Questions: Relevant Findings from the Group Discussions’ (Chapter 8) pp 43-64 in Bradshaw, J., Gordon, D., Levitas, R., Middleton, S., Pantazis, C., Payne, S., Townsend, P. (editors). PerceptionsofPoverty&SocialExclusion,1998:ReportonPreparatoryResearch. University of Bristol: Townsend Centre for International Poverty Research.
Office for National Statistics (2009). NationalStatisticsOpinionsSurvey–TechnicalReport–September2009. London: ONS.
Pantazis, C., Gordon, D. and Levitas, R. (editors) (2006). PovertyandSocialExclusioninBritain:themillenniumsurvey. Bristol: The Policy Press.
References

The inclusion of new material deprivation questions from 2004/05 was based on quantitative research to determine the most reliable and valid indicators of deprivation among families with children. It was envisaged that this set of questions would need to be updated over time, to reflect changes in what people believe to be the necessities of life.
The Child Poverty Unit commissioned the analysis in this report to update, if and where necessary, the current Family Resources Survey questions used to measure children’s material deprivation. Recommendations for such changes would reflect movements in what are perceived to be necessities since the current questions were introduced, and any changes in the ability of such questions, taken as a whole, to track material deprivation among families with children.
This report provides evidence on which items (material goods, activities and access to services) are now regarded as essential in the UK. It draws on this evidence to propose changes to the overall set of indicators used to measure child poverty.
If you would like to know more about DWP research, please contact: Kate Callow, Commercial Support and Knowledge Management Team, Upper Ground Floor, Steel City House, West Street, Sheffield, S1 2GQ.http://research.dwp.gov.uk/asd/asd5/rrs-index.asp
Published by the Department for Work and PensionsMay 2011www.dwp.gov.ukResearch report no. 746 ISBN 978-1-84712-980-2