Embed Size (px)
Citation preview

CHILD CAREin
NEW BRUNSWICK:The
SOCIAL & ECONOMIC IMPACTS
Kerry McCuaig, Fellow Early Childhood Policy, Ontario Institute for Studies in Education/University of Toronto
Elizabeth Dhuey, Ph.D. Centre for Industrial Relations and Human Resources/University of Toronto
November 2015

2
ACKNOWLEDGEMENTSThe researchers would like to thank the community leaders and New Brunswick officials who gave so generously of their time and resources to assist in the development of this study. We would like to acknowledge the Margaret and Wallace McCain Family Founda-tion whose generous financial support made this work possible. Our gratitude goes to graphic designer Erin Holmes of Soplari Design for her professional and patient guidance and to Stacey Mudie of the Atkinson Centre for handling all the details we forgot. While appreci-ating the input of many, the authors accept full responsibility for the content of this report.
Kerry McCuaig, Elizabeth Dhuey. November 2015
Please cite this publication as: McCuaig, K., Dhuey, E. (November 2015). Child Care in New Brunswick: The social and economic im-pacts. Toronto, ON: Atkinson Centre for Society and Child Develop-ment. OISE/University of Toronto.
The Atkinson Centre for Society and Child Development is one of 20 research centres at the University of Toronto. It is committed to using the best available evidence on early child development to inform public discourse, public policy and the professional learning of those working with young children. — See more at: http://www.oise.utoronto.ca/atkinson/

3
This study takes a broad view of “child care” and uses the term interchangeably with “early childhood education” and “early education” and “early childhood education and child care” (ECEC), which is more commonly found in the liter-ature and is increasingly used by the sector. ECEC includes all arrangements providing care and education for children outside of compulsory schooling. In the context of New Brunswick, this would include child care centres and community (family) daycare homes.

4
Table of Contents
Acknowledgements . . . . . . . . . . . . . . . . . . . . . . . . . . . . . . . . . . . . . . . . . . . . . . . . . . . . . . . . . . . . . . .2
Scope, Methodology and Limitations . . . . . . . . . . . . . . . . . . . . . . . . . . . . . . . . . . . . . . . . . . . . . . . . .6
A: A Strong Start For School and For Life . . . . . . . . . . . . . . . . . . . . . . . . . . . . . . . . . . . . . . . . . . . .6
Socioeconomic Benefits of Early Education and Child Care . . . . . . . . . . . . . . . . . . . . . . . . . . . . . . 6
ECEC and Human Development . . . . . . . . . . . . . . . . . . . . . . . . . . . . . . . . . . . . . . . . . . . . . . . . . . . . . 6
Public Policy Influences on ECEC . . . . . . . . . . . . . . . . . . . . . . . . . . . . . . . . . . . . . . . . . . . . . . . . . . . 9
ECEC and Fertility . . . . . . . . . . . . . . . . . . . . . . . . . . . . . . . . . . . . . . . . . . . . . . . . . . . . . . . . . . . . . . . . 9
Program Funding . . . . . . . . . . . . . . . . . . . . . . . . . . . . . . . . . . . . . . . . . . . . . . . . . . . . . . . . . . . . . . . . 10
Governance and Service Delivery Options . . . . . . . . . . . . . . . . . . . . . . . . . . . . . . . . . . . . . . . . . . . . 10
Programs for Children 0–4 years old and Their Families . . . . . . . . . . . . . . . . . . . . . . . . . . . . . . . 12
B: Predicting the Costs and Benefits of Investing in Child Care . . . . . . . . . . . . . . . . . . . . . . . . .13
The Child Care Sector as a Source of Local Economic Development . . . . . . . . . . . . . . . . . . . . . . 13
Changes in Workforce Participation Due to Child Care . . . . . . . . . . . . . . . . . . . . . . . . . . . . . . . . . . 15
Impact of Subsidized Child Care on Mothers’ Employment Rates . . . . . . . . . . . . . . . . . . . . . . . . . . 16
Impact of Increased Maternal Employment on Tax Revenue . . . . . . . . . . . . . . . . . . . . . . . . . . . . . 18
The Effect of Increased Maternal Employment on GDP . . . . . . . . . . . . . . . . . . . . . . . . . . . . . . . . . . 19
The Child Care Sector’s Other Effects . . . . . . . . . . . . . . . . . . . . . . . . . . . . . . . . . . . . . . . . . . . . . . . 19
Costs of Child Care — Program Costs . . . . . . . . . . . . . . . . . . . . . . . . . . . . . . . . . . . . . . . . . . . . . . . . 20
Costs of Child Care – Capital Costs . . . . . . . . . . . . . . . . . . . . . . . . . . . . . . . . . . . . . . . . . . . . . . . . . . 23
Summary of Economic Costs and Benefits . . . . . . . . . . . . . . . . . . . . . . . . . . . . . . . . . . . . . . . . . . . . 25
References . . . . . . . . . . . . . . . . . . . . . . . . . . . . . . . . . . . . . . . . . . . . . . . . . . . . . . . . . . . . . . . . . . . . . .26
Appendices . . . . . . . . . . . . . . . . . . . . . . . . . . . . . . . . . . . . . . . . . . . . . . . . . . . . . . . . . . . . . . . . . . . . . .28

5
List of Figures and TablesFigure A1: Early Childhood Education and Care Provides Multiple Benefits to The Individual, Families and Society . . . . . . . . . . . . . . . . . . . . . .7
Figure A2: Adverse Influences on Early Brain Developments and Potential Outcomes . . . . . . . . . . . . . . . . . . . . . . . . . . . . . . . . . . . . . . . . . . . . .8
Figure A3: Effects of Oral Language Weakness on Reading Growth . . . . . . . . . . . . . . . . . . . . . . . . . . . . . . . . . . . . . . . . . . . . . . . . . . . . . . . . . . . . .8
Figure A4: Home and Outside Factors Affecting School Achievement at Age 11 . . . . . . . . . . . . . . . . . . . . . . . . . . . . . . . . . . . . . . . . . . . . . . . . . . . .9
Figure A5: Score Point Difference on PISA Reading Results at Age 15 Generated by ECEC Policies . . . . . . . . . . . . . . . . . . . . . . . . . . . . . . . . .9
Figure B1: NB Employment Rates for Females With at Least One Child 0–9 years by Education Level . . . . . . . . . . . . . . . . . . . . . . . . . . . . . . . . .15
Figure B2: Current and Proposed Spending Per Child in Child Care and School . . . . . . . . . . . . . . . . . . . . . . . . . . . . . . . . . . . . . . . . . . . . . . . . .23
Appendix Figure A: New Brunswick Communities . . . . . . . . . . . . . . . . . . . . . . . . . . . . . . . . . . . . . . . . . . . . . . . . . . . . . . . . . . . . . . . . . . . . . . . . . . . .30
Table A1: Funding Rate for Child Care Staff Receiving Wage Enhancement (QIFS) . . . . . . . . . . . . . . . . . . . . . . . . . . . . . . . . . . . . . . . . . . . . . . . . .10
Table A2: Provincial Educational Requirements and Professional Standards for Staff in Regulated Child Care Centres/Family Child Care . . .11
Table B1: Provincial Input-Output Multipliers for Social Assistance (Includes Child Care), 2010 . . . . . . . . . . . . . . . . . . . . . . . . . . . . . . . . . . . . . .14
Table B2: Rank of Input-Output Multipliers for Social Assistance (Out of 152 industries) in New Brunswick, 2010 . . . . . . . . . . . . . . . . . . . . . . .14
Table B3: Number of Children in New Brunswick . . . . . . . . . . . . . . . . . . . . . . . . . . . . . . . . . . . . . . . . . . . . . . . . . . . . . . . . . . . . . . . . . . . . . . . . . . . .15
Table B4: Percentage Breakdown of Families by Children and Heads of Household . . . . . . . . . . . . . . . . . . . . . . . . . . . . . . . . . . . . . . . . . . . . . . . .15
Table B5: Labour Force Participation in New Brunswick . . . . . . . . . . . . . . . . . . . . . . . . . . . . . . . . . . . . . . . . . . . . . . . . . . . . . . . . . . . . . . . . . . . . . .15
Table B6: Percentage of Households by Lone Heads of Households by Sex . . . . . . . . . . . . . . . . . . . . . . . . . . . . . . . . . . . . . . . . . . . . . . . . . . . . . . .16
Table B7: Labour Force Statistics for Women by Region . . . . . . . . . . . . . . . . . . . . . . . . . . . . . . . . . . . . . . . . . . . . . . . . . . . . . . . . . . . . . . . . . . . . . . .16
Table B8: Summary Table of Studies Estimating the Impact of Subsidized Child Care on Mothers’ Employment Rate . . . . . . . . . . . . . . . . . . . . .17
Table B9: Top 25 Occupations with the Most Anticipated Job Openings between 2016 and 2025 . . . . . . . . . . . . . . . . . . . . . . . . . . . . . . . . . . . . .18
Table B10: Effect of Maternal Employment Rate Increase on Income Tax Revenue . . . . . . . . . . . . . . . . . . . . . . . . . . . . . . . . . . . . . . . . . . . . . . . . .19
Table B11: The Effect of Increased Maternal Employment on GDP . . . . . . . . . . . . . . . . . . . . . . . . . . . . . . . . . . . . . . . . . . . . . . . . . . . . . . . . . . . . . . .19
Table B12: Predicted Effect of Child Care (CC) on Income Assistance (IS) Costs . . . . . . . . . . . . . . . . . . . . . . . . . . . . . . . . . . . . . . . . . . . . . . . . . . .20
Table B13: Current Child Care Availability and Predicted Use of Child Care . . . . . . . . . . . . . . . . . . . . . . . . . . . . . . . . . . . . . . . . . . . . . . . . . . . . . . .21
Table B14: Predicted Number of New Spaces Needed by Community/Region . . . . . . . . . . . . . . . . . . . . . . . . . . . . . . . . . . . . . . . . . . . . . . . . . . . . .22
Table B15: Predicted Number of New Staff Positions Required by Community/Region . . . . . . . . . . . . . . . . . . . . . . . . . . . . . . . . . . . . . . . . . . . . . .22
Table B16: Child Care Program Expenditures . . . . . . . . . . . . . . . . . . . . . . . . . . . . . . . . . . . . . . . . . . . . . . . . . . . . . . . . . . . . . . . . . . . . . . . . . . . . . . .23
Table B17: Average Parent Fees by Age and Region . . . . . . . . . . . . . . . . . . . . . . . . . . . . . . . . . . . . . . . . . . . . . . . . . . . . . . . . . . . . . . . . . . . . . . . . . .23
Table B18: Additional Yearly Expenditures for Increased Levels of Child Care . . . . . . . . . . . . . . . . . . . . . . . . . . . . . . . . . . . . . . . . . . . . . . . . . . . . .24
Table B19: Cost to Build or Renovate Child Care Centres per Legislated Space Requirement . . . . . . . . . . . . . . . . . . . . . . . . . . . . . . . . . . . . . . . .24

6
Scope, methodology and limitations
This study was commissioned by the New Brunswick Department of Education and Early Childhood Development to support the work of its Child Care Taskforce. The authors were asked to develop a cost benefit analysis of the potential social and economic impacts of public spending on child care in the province. They were also asked to pro-vide recommendations on child care service delivery based on best practices in other Canadian jurisdictions.
This study uses a mixed methodology, including a selected review of the relevant research literature examining the impact of early edu-cation and child care on child, family and socioeconomic outcomes; analyses of relevant NB government documents; key informant in-terviews and feedback received during a roundtable attended by the taskforce commissioners and government officials.
The quantitative data used in the economic analysis were primarily obtained from the Industry Accounts Division at Statistics Canada, the 2011 Canadian Census, the 2011 National Household Survey, the Ed-ucation and Early Childhood Development Department and the New Brunswick Health Council.
The multipliers used in the input-output analysis were only available at the provincial level and were from 2010. No newer data or data from smaller geographical areas were available. The precise measure of the child care industry was not available and a proxy was used instead.
The data from the 2011 National Household Survey may be problematic as it was non-mandatory and has been shown to have uneven response rates based on demographic characteristics. Unfortunately, this is the best data currently available.
The effect of the child care sector on income tax revenue and GDP was based on a number of assumptions listed in the text regarding the productivity of women who become employed due to the increase in child care availability.
The predicted use of child care was estimated using current birth rates by community which may change over time which would affect demand. In addition, it was assumed that individuals’ only access child care in the community in which they live. The rate of child care use was established at 65 percent of children 0–8 years old to coincide with New Brunswick’s anti-poverty strategy. The level of funding per space was established to mirror those offered in Quebec. Two levels of parent fees are modeled to estimate overall costs.
The estimates regarding capital expansions assumes that every additional space for children 0–4 years old will either be built or renovated. The estimates also assume that centres will be built only to the minimum legislated space requirements and do not take into account any returns to scale.
A: A Strong Start For School and For LifeA wide body of research from across disciplines documents the ben-efits of early childhood education and care (ECEC) for children, fam-ilies and society. The evidence suggests that accessible, quality ECEC would deliver similar benefits to New Brunswick.
SOCIOECONOMIC BENEFITS OF EARLY EDUCATION AND CHILD CAREAs illustrated in Figure A1, early education and care is associated with a wide range of benefits. Early education is a job creator in its own right, while supporting parents as they work or upgrade their skills (Fortin, 2012; Fairholm, 2010; Barnett, 2007). It provides a means of welcoming new immigrant and minority families as it offers opportunities for inclusion (Bennett, 2011; Winsler, 2008). By identifying problems and intervening early, ECEC decreases special education costs (Peters, 2010).1 Improved education ultimately
1 Longitudinal research found a $5000/student saving in special education associated with attendance in early childhood education programs.
helps to reduce skills shortages and expenditures in health, justice and social services (Heckman, 2000, 2008; Fortin, 2012). These, in turn, have a positive effect on income inequality leading to a stronger society and economy. These goals are found in the strategic directions of several Government of New Brunswick documents, including but not limited to the Discussion Paper on the 10-Year Education Plan, Putting Children First, the Linguistic and Cultural Development Policy: A Societal Project for the French Education System and Overcoming Poverty Together: The New Brunswick Economic and Social Inclusion Plan, 2014–2019.
ECEC AND HUMAN DEVELOPMENTChild development is a multi-faceted, inter-related and continuous process of change in which children master ever more complex lev-els of moving, thinking, feeling and relating to others. Physical, cogni-tive, social and emotional development occurs as the child interacts

7
with the surrounding environments of family, the community and the broader society. Public policy is not equally effective at influencing outcomes in all three spheres.
Yoshikawa’s 2013 meta-analysis of 40 years of international research identifies advantages from regular attendance in early education that persist into adulthood. Waiting for the school years to improve academic and social outcomes is often too late. It is during the years before school that brain development is most rapid and when children are particularly sensitive to their environments. Nurturing, stimulation and nutrition interact with genetic predispositions to sculpt the architecture of the brain and its neural pathways, influencing learning, behaviour and physical and mental health over the life course.
As illustrated in Figure A2, adversity in early childhood in the form of harsh, neglectful or inconsistent parenting, combined with poor social demographic factors, has an impact on brain development. This creates a cascading effect that manifests throughout the life cycle:
• In preschoolers: Aggression or withdrawal; developmental delays.• In adolescents and young adults: Poor academic performance;
greater school dropout rates; early pregnancy; risky behaviour, including substance abuse; and mental health problems.
• In adults: Obesity; type 2 diabetes; cancers and heart disease.
These in turn create intergenerational cycles of poor outcomes. Qual-ity ECEC programs have been found to help mitigate the detrimental effects of adverse home and other environmental factors on early de-velopment (Walker et al., 2011; Allen, 2011).
The home environment has the strongest influence on children’s competencies prior to school entry (Sammons, et al., 2007, 2011; Sylvia et al., 2008). These competencies include language skills, cognitive abilities and the ability to interact with other people. Assessments of kindergarten-aged children using the Early Development Instrument (EDI) show high levels of vulnerability.2 For example, research from the University of British Columbia links vulnerability as measured by the Early Development Instrument to poorer performance on provincial testing in Grades 4 and 7 (Mustard, 2007). Manitoba research links vulnerability in Kindergarten with poor academic results, including increased grade repetition, and incomplete school leaving, at Grades 10 and 12 (Mustard, 2007).
Language skills are a strong and early predictor of cognitive achieve-ment, social competency and emotional regulation. Children’s early oral vocabulary knowledge continues to grow rapidly throughout early childhood and to overlap with reading acquisition in primary school. Children with low language skills at school entry are unlikely
2 The Early Development Instrument is used in 11 out of 13 Canadian jurisdictions (except NB and PEI). Teachers administer the tool during the latter half of kindergarten to provide a population level assessment of children’s development in five categories: physical, social, emotional, cognitive and general knowledge. Results vary widely by community, however on average about one in four children show early vulnerabilities which could impact future outcomes.
EarlyChildhoodEducationand Care
Atkinson Centre, OISE/UT
Developmental health, learning
and behaviour
School readiness
Equity for all children (e.g. special needs)
Appreciation and respect for diversity
Population health
Women’s equality
Labour market support
Poverty reduction
Pluralism
Crime prevention
Economic development
Job creation & training
Social inclusion
Work/Life balance
Effective parenting
Link to community supports
Economic independence
Maternal health benefits
CommunitySociety
FamilyChild
Early Childhood Education and Care Provides Multiple Benefits to the Individual, Families and Society

8
to have the process reversed by the school system. A large U.S. study illustrated in Figure A3 shows how small problems at school entry magnify greatly so that a 9-month developmental gap at age
Figure A2Adverse In�uences on Early Brain Development and Potential Outcomes
GENES
G x Eepigenetics
EXPERIENCE
physicalenvironment
nutrition
care & a�ention
Other environmental factors (SES, neighbourhood, school, etc.)
Parents(neglect/abuse)
STRESSPeers
(victimization/rejection/marginalization)
PregnancyEarly
Childhood(0–6 years)
Middle Childhood
(6–12 years)Adolescence(12–18 years) Adulthood
Individual trajectories
EmotionsA�ention
StressSelf-control
Learning
Dropping outDepressionAnxietyIna�ention/ImpulsivitySubstance abuseObesityHealth problemsViolence, etc.Parental neglect/abuse
Sensi�ve Period
ComorbiditiesCascade e�ects
Adapted �om: Garner, A., Shonko�, P. (2012); Kandel, E., Schwartz, J. & Jessel, T. (2000); Mustard, F., McCain, M., Shanker, S. (2007)
6 becomes 5.2-year gap at age 13.3 Reducing academics inequities and their resulting long-term consequences are therefore depen-dent on improving the competencies of children before they start school.
Quality ECEC programs have been found to amplify benefits for all children and help to mitigate the detrimental effects of adverse home and neighbourhood environments on school readiness (Schweinhart, 2012; Pianta & Howes, 2009). Children who benefit most from participation in quality ECEC programs, but who are the least likely to attend, are those living in families disadvantaged by poverty (McCain et al., 2011).
A large study from the United Kingdom shows the effect size of home versus outside factors, by age 11 (Sylva et al., 2008, Sammons et al., 2011). As shown in Figure A4, the home environment, including the health of family members and family income and socioeconomic fac-tors, exert the most influence on child outcomes. However, the stron-gest outside-the-home influencers are participation in ECEC and the quality of early schooling. The effect size of ECEC was found to be stronger than home visiting, neighbourhood factors or parenting programs alone. Work from North Carolina even indicates that good
3 (Hart & Risley, 1995, Sparks et al., 2014)
Figure A3E�ects of Oral Language Weakness on Reading Growth
Read
ing
Age
3456789
10111213141516
High oral language at kindergarten
Low oral language at kindergarten
Chronological Age4 5 6 7 8 9 10 11 12 13 14
5.2 year gap

9
quality early education can compensate children for lower quality primary schooling (Campbell, 2001). These studies provide important information for policy-makers. While it is difficult for public policy to alter family dynamics, it does exert considerable influence over the availability and quality of ECEC and primary schooling.
PUBLIC POLICY INFLUENCES ON ECECECEC programs are most effective when they are universally available; are part of a children’s service network; include health and parenting supports; and are accompanied by adequate paid parental leave and income transfers (Commission on Social Determinants of Health, 2008). The OECD Quality Network (Organisation for Economic Cooperation and Development, 2011) lists four factors required for effective ECEC programs:
1. The children attend regularly. The effect size is greater when programs are available to all children rather than targeted to children in low-income families.
2. ECEC programs are adequately staffed.
3. Sufficient numbers of educators have a degree in early child-hood education.
4. The teaching approach is child-centred, with a high portion of child initiated activities.
The Network does not set targets for staffing levels or educator qualifications, nor does it specifically define the curricula. Rather, it finds a correlation between these factors and outcomes for children. These are considerations for policy-makers as they grow access to ECEC services.
Results from the International Programme for International Student Assessment (PISA)4 support these findings. The 2009 reading as-sessment of students at age 15 shows that, in most countries, pupils who attended preschool programs perform better than those who did not attend. Here public policy makes a difference.
Longer attendance in ECEC programs, smaller child-to-staff ratios and higher public expenditures per child during the preschool years all enhanced the reading scores of pupils at age 15, as shown in Figure A5. The largest differences are associated with a higher portion of preschoolers attending ECEC and the number of years children attend. Increasing the duration of preschool programming is associated with an average 10 point score increase for each year of ECEC attendance by children ages 3–6 years.
ECEC’s positive influence on educational outcomes makes it a compelling area for investment. Education is the ultimate tool to address many economic and social challenges. It creates wider options for careers, raises employment and lowers chronic unemployment, leading to higher standards of living and a reduction in the social ills associated with poverty. A more educated workforce creates a more innovative and productive economy.
ECEC AND FERTILITY Jurisdictions have reason to be concerned about declining birth rates. Aging populations and low birth rates are associated with stagnant economic growth and real concerns about the viability of
4 PISA is a triennial survey of the knowledge and skills of 15-year-olds near the end of their compulsory schooling. PISA provides comparative international data in three core-learning areas: mathematics, reading and science. Sixty-five jurisdictions participate in PISA. In Canada, only the 10 provinces participate in PISA.
0
2
4
6
8
10
Spen
d an e
xtra $
on pr
esch
ool
Redu
ce ch
ild-e
duca
tor r
atios
by 1
child
Incre
ase d
urati
on of
pres
choo
l by 1
year
Incre
ase p
ortio
n of c
hildr
en a�
endin
g pre
scho
ol by
1%
4.8
9.9
1.3 1.5
Figure A5Score Point Di�erence on PISA Reading Assessment
at Age 15 Generated by ECEC Policies
0
1
2
3
4
5
6
Prim
ary s
choo
l
ECEC
Fami
ly He
alth
Fami
ly inc
ome
Fath
er ed
.
Moth
er ed
.
SES
4.6
4.0
Home factors Outside of home factors
Figure A4Home and Outside Factors A�ecting
School Achievement at Age 11
2.0
5.0 5.2
3.1
2.6
E�ec
t Siz
e

10
social programs. On average, childless and retiree households do not spend as much of their income as families with children, and a larger portion of the disposal income of retirees is spent outside their communities. Yet the childless and retirees rely on the labour of the next generation to fund their old age security. Even those with private wealth rely on the goods and services produced by the next working generation. By raising tomorrow’s workers, parents help to make everyone’s retirement more viable.
Among developed countries, only in the U.S. (2.01) and France (1.99) are mothers having sufficient children to maintain population levels. New Brunswick’s birth rate is 1.54, below the Canadian average of 1.61.5
Low birth rates arise from the conflict between working and raising children, which discourages women from childbearing. Governments respond with paid parental leaves and cash benefits to help families manage work-life balance but what seems to boost fertility most is available, affordable child care. By cutting the cost of combining work and motherhood, child care supports both. Studies show expanding child care to cover 60 percent of children younger than 5 years old led to an increase of 0.5 and 0.7 more children per woman. For jurisdictions struggling with the ramifications of very low fertility, increases of this magnitude would be sufficient to approximate replacement level fertility (OECD, 2011).
Child care not only influences a woman’s decision to work, but also effects her ongoing attachment to the workforce and her decision to have children. Higher child care costs result in a lower birth rate for unemployed women, more women leaving employment and fewer women returning to paid work following childbirth. Low fee child care helped boost Quebec’s maternal employment rate and its birth rate from the lowest among all Canadian provinces to one of the highest. Good, affordable child care signals to women that work and having children are compatible. That is good for women, good for productivity and good for New Brunswick revenues.
Funding, governance and service deliveryPROGRAM FUNDING New Brunswick’s $44-million child care budget is distributed through five funding streams (See Table B16). Funds support staff wages and training, provide additional support for children with special needs, subsidize fees for low-income families and provide a small capital fund for repairs and renovations. The only fund that offsets child care operating costs is the Quality Improvement Funding Supports (QIFS) which supplements staff wages to a maximum of $5/hour. QIFS is directed at improving staff wages to support recruitment and retention and in doing so, offset pressures on parent fees.
5 Statistics Canada, CANSIM, table 102–4505.
The QIFS is administratively heavy, involving an annual application and quarterly reporting of staff hours by operators, and the processing of monthly payments to 756 operators by the department. Operators also receive a 14 percent administrative fee. The QIFS is also a difficult process to oversee. Despite increases to the fund, child care staff reported little movement to their wages between 2010–2014, according to the Early Childhood Education Report, while child care fees rose. If the province were to consider any major expansion of child care, the current QIFS process would be not be sustainable.
Public contributions for child care are low in New Brunswick. The QIFS subsidizes operating costs by about $1,700/space on average, or about 25 percent of overall costs, leaving parent fees to cover the remaining 75 percent. This is high in comparison to PEI where parents contribute 50 percent of operating costs or Quebec where parent fees account for only 15 percent.
High fees are a barrier to parents using regulated child care, but they are also a drag on quality. Child care providers struggle between setting fees low enough to attract parents and fill spaces and high enough to recruit and retain staff. Despite low wages parents still can’t afford the fees, leading to vacancies that undermine program viability. Corners get cut and quality suffers. It is a squeeze play with no winners.
GOVERNANCE AND SERVICE DELIVERY OPTIONSNew Brunswick child care services are unplanned, under resourced and fragmented. While Kindergarten, child care and family resource programs are under a single department, there remains a schism in the delivery of services. Child care is designed to support parent employment, while Kindergarten focuses on children’s cognitive development. Separate funding, mandates and oversight for family support and intervention programs create further divisions and challenges for families. Families, particularly those with multiple children and/or children with special needs, get their children’s care in one place, education in another, parenting supports in still another and travel further afield for special needs supports.
Table A1: Funding Rate for Child Care Staff Receiving Wage Enhancement (QIFS)
$5.00/hour Eligible employees who have recognized Early Childhood Education training or university degree in any discipline from an approved Canadian institution.
$3.07/hourPrimary staff members and Administrator/primary staff members who do not have recognized Early Childhood Education.
$2.75/hour Administrator and Relief Staff who do not have recognized Early Childhood Education training or a university degree.
Source: Quality Improvement Funding Support Program (2015–2016) Handbook

11
Reviews of delivery models in Ontario (Corter et al., 2012; Janmohamed et al., 2014) and Atlantic Canada (HERG, 2012) found that when programs were consolidated at a single site (usually the school), absenteeism decreased, there was greater compliance addressing special needs and parental stress was reduced. Staff members benefited from working in inter-disciplinary teams. Strategies for children with special needs were shared and applied by all staff working with the children, often reducing the amount of time special interventions were required. Moreover, integrated programming was found to serve more families for the same costs.
As shown in Table A2, In comparison to other provinces New Brunswick’s qualifications for early childhood educators are not high. Its maximum academic requirement is a 1 year certificate and the density of trained educators per children is the lowest in Canada. A process is underway to have all directors and primary staff members working with infants and preschoolers in centre-based facilities take 30 hours of training in the designated early learning curriculum. The University of New Brunswick is also developing an online degree program in ECE. These may provide a model to improve workforce qualifications and develop professional leadership.
Following the example of other jurisdictions New Brunswick may be advised to adjust its age span for child care. For example Quebec regulates programs for children 0–4 years under its day nurseries legislation. After school care for children 5–12 is guided by program standards overseen by schools. Ontario allows recreation programs to provide out of school care for children 9–12 years.
A concentration on children 0–8 years allows for more intentional pre- and in-service training and more focused programming. It also mirrors the 0–8 early learning continuum the Department of Education and Early Childhood Development has instituted.
Given the underdeveloped infrastructure for child care in New Brunswick it would be both difficult and expensive to expand services from the current base. However, there is strength in NB’s school system. Schools exist in every community. They are designed for children and many, at least in rural areas, have surplus space. There is capacity within the school infrastructure to directly operate child care and to align child care/early childhood services for younger children, creating a continuum of care from infancy through Kindergarten and into school.
Schools are also well also placed to address access inequities. As child care licence holders they are able to provide options, particularly in small communities where no child care providers exist. The school’s classrooms, libraries, gyms, playgrounds and kitchens and lunchrooms are able to serve children and families during and outside regular school hours.
Concerns about schools institutionalizing the care and playtime of children are acknowledged. However, considerable national and international evidence documents that when schools expand their mandates to include programming for younger children, after-hours care and family activities, they become more responsive to the com-munities they serve. In turn, community trust in schools is enhanced (Corter et al., 2012; Janmohamed et al., 2014; HERG, 2012).
Table A2: Provincial Educational Requirements and Professional Standards for Staff in Regulated Child Care Centres/Family Child Care
PROVINCE
ACADEMIC CREDENTIAL FOR PRIMARY STAFF
ENTRY LEVEL REQUIREMENT
PROFESSIONAL CERTIFICATION
PROFESSIONAL DEVELOPMENT
ECES/PRESCHOOL GROUP
FAMILY CHILD CARE ORIENTATION
NL 1 year certificate Yes Certification 30 hours / 3 years 1 Yes
PE 1 year certificate Yes Certification 30 hours/ 3 years 1 Yes
NS 2 year diploma Yes Classification 30 hours/ 3 years 2 Yes
NB 1 year certificate One time/30 hours 0.5
QC 3 year diploma 2 Yes
ON 2 year diploma Registration 1
MB 2 year diploma Yes Classification 1.3 Yes
SK 1 year certificate Yes Certification 1 Yes
AB 1 year certificate Yes Certification 1
BC 2 year diploma Yes License 40 hours/5 years 1 Yes
Source: Early Childhood Education Report 2014

12
The following recommendations would operationalize this direction.
Recommendations for programs for children 5–12 years old:1. Operators: Schools are responsible for sufficient before- and
after-school and holiday programming to meet demand for children ages 5 to 12 years. Schools may directly operate the program or contract with child care, recreation or other program providers as appropriate. Schools, in consultation with parents, would establish the hours of operation.
2. Staffing: Staffing for school-aged programs includes persons with a range of qualifications responsive to the ages and inter-ests of the children, including cultural and language workers, recreationists, early childhood educators, child and youth work-ers, educational assistants, teachers and high school students; supervised by staff knowledgeable of child development.
3. Curriculum: Validated program approaches will guide programs for older children. High Five is an example of a developmental program for middle childhood.6
4. Funding and fees: Schools assume the facilities costs for out of school programs. Staff wages and benefits, program supplies, and food are covered with parent fees. Schools may recoup reasonable administrative costs but will not generate excess revenue from the provision of after-school programs. School districts may establish centralized billing and fee collection systems to reduce administration. The Region of Waterloo provides an effective example.7
5. Schools that directly operate programming receive the same operational funding as available to child care centres.
PROGRAMS FOR CHILDREN 0–4 YEARS OLD AND THEIR FAMILIES Existing early childhood programs serving younger children have the option of becoming Early Childhood Centres. Early Childhood Centres consolidate existing early childhood services within a community or catchment, including child care centres, community child care, child/parent drop-in, and family resource and information programs. Early Childhood Centres also provide a base for the delivery of pre- and post-natal and special needs programs and interventions. Early Childhood Centres follow the provincial early years curriculum, employ appropriately qualified staff, adhere to an established wage and fee schedule and have a parent advisory board.
6 http://highfive.org/what-high-five/mission-vision-and-principles7 www.wcdsb.ca/schools/Register for School/Elementary Registration/kinder/pdf/FAQ_-_OneList_Billing_Invoices.pdf
To support the development of children who would not otherwise participate in an early years program, Early Childhood Centres are funded to provide up to 20 hours a week of programming for children 3–4 years old in their catchment.
Community child care providers are attached to an Early Childhood Centres to participate in professional development and access programming support and resources. Early Childhood Centres also provide a convenient location for families accessing intervention and special needs supports. In this way, intervention programs come to families, rather than requiring parents to bring children to multiple locations.
Recommendations for programming for children ages 0–4 years: 1. Consolidate current early childhood service and funding streams,
including licensed child care centres, community day care homes, child/parent drop-in, resource and information programs into Early Childhood Centres. Early Childhood Centres provide full-, part-time and occasional child care for children ages 0–4 years; drop-in play programs for children with their parents/guardians and/or caregivers; parenting information and resources; and are a platform to deliver public health and intervention services.
2. Early Childhood Centres are funded to provide 20 hours a week of programming to all children 3–4 years old.
3. Operators: Early Childhood Centres may evolve from new agencies or by expanding the mandates of existing early childhood programs.
4. Staffing: Staffing complement includes early childhood educators, family support workers and special needs and intervention staff. The mix of qualifications responds to the varied needs of families, allows for staffing efficiencies and provides staff with opportunities to broaden their skill sets to encompass both child care and family supports.
5. Curriculum framework: Early Childhood Centres use the New Brunswick Curriculum Framework for Early Learning and Child Care: English and the Curriculum éducatif pour la petite enfance francophone du Nouveau-Brunswick: Français, along with the accompanying support tools.
6. Location: The preferred location for Early Childhood Centres is in schools. Newly built and renovated schools would include sufficient designated space for viable Early Childhood Centres. Early Childhood Centres would have priority for surplus space in schools and enjoy security of tenure.

13
7. Funding and fees: Consolidate current operational funding streams for child care and family resource centres, information and referral programs into a single grant to Early Childhood Centres based on staffing needs. This promotes program stability while encouraging the Early Childhood Centres to maximize outreach to families. It reflects the type of funding formula used for after school care — another step in aligning the two systems.
8. Programs that choose not to convert to, or merge into, Early Childhood Centres may continue operating under current funding and regulatory rules. All service expansion will use the model of school-offered programming for 5–12 year olds and integrated Early Childhood Centres for children 0–4 years.
Recommendations for infrastructure supports: 9. Infrastructure support: Include child care in the planning
mandates of school districts and municipalities. Restrict new licenses to programs that fall within the children’s service plan.
10. Accountability: Establish a province wide fee and salary scale. Manitoba, PEI and Quebec provide examples of efficient, transparent fee and wage schedules. These systems are administratively effective allowing department resources to be refocused on supporting program quality.
11. Transition team: Establish a transition team with representatives in and outside government to provide expert support to schools and child care providers transitioning to the new service deliv-ery model.
B: Predicting the Costs and Benefits of Investing in Child Care
The child care sector is unique as it affects those providing care and those employed in the service, it creates opportunities for parents who are freed from child care duties, and it impacts the child whose human capital is enhanced. Predicting the costs and benefits of the sector is challenging because of all the layers involved.
This report uses a variety of techniques to determine the economic benefits of public spending on child care. We first focus on the how the child care sector is connected to other industries and how investing in child care affects these other industries. This analysis uses input-output models to estimate how investing in child care leads to increased spending in other industries.
We use estimates from previous studies to predict how investing in child care in New Brunswick will affect the labour market partic-ipation of mothers. We then estimate how these new workers will stimulate economic activity and ultimately affect the GDP. We also estimates the new tax revenue and income assistance savings that will be generated as more mothers enter the labour market.
Calculating the costs of child care is a bit more straightforward. We first estimate the increased demand for spaces based on providing child care in New Brunswick at the provincial target of 65 percent. Once we have an estimate of the new spots needed, we can calcu-late the programming and capital costs to provide these spots.
All the different analysis outlined above help paint a picture of how investing in child care impacts the economy of New Brunswick. They provide guidance on the possible benefits and costs of increased public spending in the sector.
THE CHILD CARE SECTOR AS A SOURCE OF LOCAL ECONOMIC DEVELOPMENTPublic money for child care creates a ripple effect of spending; in other words, a dollar invested in child care leads to increased spending in other industries. For instance, child care programs spend money on salaries, supplies, food and rent, which in turn impacts other businesses in the supply chain. Therefore, to calculate the effect of the child care sector, it is important to quantify all the effects of spending in an industry on the entire economy.
An input-output analysis can be used to estimate the effct of child care spending on local economic development. This analysis is a quantitative economic technique that estimates the interdependencies between different industries in an economy. Government and private industry commonly use these input-output multipliers to show the direct and indirect effects. The direct effects can be considered the first round of impacts. This first round includes the potential impact on the GDP (gross domestic product1) of those industries that expand production to satisfy the increased demand for their product. The indirect effects result from backwards linkages in the economy, when the firms producing the commodity purchase additional goods and services from other firms. In the case of child care, the direct effects are the effects from the child care industry itself (i.e. salaries to workers, rent/mortgage on building, etc.). The indirect effects are the effects of the child care industry on other industries through the purchase of food, janitorial services, supplies, etc.
Input-output models are not a measurement of the full impact of the child care sector. They only calculate the links between one industry
1 The GDP is the monetary value of all the finished goods and services produced within a particular region during a specific time period.

14
and its suppliers. For instance, in the child care sector this would generally be supplies, labour and food. They do not capture the investment effects of caring for and educating young children. It also does not measure the role child care plays in supporting parents to work which we will separately estimate in the next section. Nor does it include money spent in households on other goods due to increased public spending on child care (induced effects). For example, they do not include the effect of a family spending more as a result of increased earnings from maternal employment.
To examine New Brunswick, this report will use multipliers compiled by the Industry Accounts Division from Statistics Canada. We have listed the GDP, Labour income and Jobs multipliers. The GDP mul-tiplier calculates the total value added to the provincial economy by each dollar of increased direct spending. The labour income multipli-er measures the overall increase in wages due to job growth (what workers have to spend). Finally, the employment multiplier is used to calculate the number of new jobs created. Finally, these multipliers are calculated within province and throughout all provinces. Within province does not include imports and exports from other provinc-es generated by increased spending on child care, whereas, the all provinces multipliers allows for inter-provincial trade. Both sets of multipliers are based on models from 2010 and include the most up-to-date information available.
Table B1 lists the multipliers calculated by Statistics Canada for the Social Assistance industry for each province.2 Statistics Canada does not calculate multipliers for child care services specifically, so this report will use social assistance as a proxy for child care
2 Data for Newfoundland and PEI not available.
services. The Social Assistance industry is a broader category of industries that includes individual and family services, community food and housing, vocational rehabilitation services, and child day care services. Therefore, child care is a subset of the broader social assistance industry. By using a proxy we are making the assumption that the social assistance industry has similar levels of interconnectedness between industries as child care alone. This is a reasonable assumption.
The data in Table B1 can be interpreted as follows. Examining the first three columns, we can predict that every $1 spent on child care in New Brunswick will return $1.15 to the economy in increased spending and $1.10 in increased labour income. Finally, every addi-tional job in child care creates 1.05 jobs. Another way to look at the employment multiplier is to estimate the number of jobs per million dollars spent on the industry. In this case, approximately 34 jobs will be created per million dollars of investment in child care. The next three columns look at the impact on inter-provincial trade generated by the expansion of child care. The estimates in Table B1 can be considered conservative estimates of the real effect.
It is important to note that these effects are at the provincial level and do not indicate that the benefits would be uniformly distributed across the province. Some regions may benefit more than others, but we are not able to estimate this with the data available. For com-parison Table A in the Appendix summarize multipliers for child care from different geographic areas and from a wide variety of authors.
When using multipliers, it is often preferable to make relative versus absolute comparisons. Table B2 lists the rank of the social assistance multiplier compared to the other 152 industries in New Brunswick. Social assistance, which includes child care, is ranked 107 out of 152 industries in terms of creating economic growth, 115 in terms of creating labour income growth and 122 in employment impact. In other words investing in child care is a better economic prospect than investing in a third of the other industries in New Brunswick. These findings are in line with other studies from
Table B1: Provincial Input-Output Multipliers for Social Assistance (Includes Child Care), 2010WITHIN NEW BRUNSWICK ALL PROVINCES
TYPE I MULTIPLIERS TYPE I MULTIPLIERS
PROVINCE
GDP BASIC PRICE
LABOUR INCOME JOBS
GDP BASIC PRICE
LABOUR INCOME JOBS
AB 1.58 1.42 1.22 1.75 1.55 1.29
BC 1.23 1.20 1.09 1.30 1.25 1.11
MB 1.75 1.84 1.26 2.18 2.32 1.37
NB 1.15 1.10 1.05 1.29 1.18 1.08
NL x x x x x x
NS 1.33 1.22 1.14 1.51 1.34 1.19
ON 1.11 1.08 1.04 1.12 1.09 1.05
PE x x x x x x
QC 1.27 1.20 1.12 1.35 1.26 1.15
SK 1.70 1.59 1.16 2.15 2.00 1.26Source: Retrieved from Provincial Input-Output Multipliers, 2010, Catalogue no.
15F0046XDB. Compiled by the Industry Accounts Division / Statistics Canada
Table B2: Rank of Input-Output Multipliers for Social Assistance (Out of 152 industries) in New Brunswick, 2010WITHIN NEW BRUNSWICK ALL PROVINCES
TYPE I MULTIPLIERS TYPE I MULTIPLIERS
GDP BASIC PRICE
LABOUR INCOME JOBS
GDP BASIC PRICE
LABOUR INCOME JOBS
RANK 107 115 122 91 121 123
Source: Retrieved from Provincial Input-Output Multipliers, 2010, Catalogue no. 15F0046XDB. Compiled by the Industry Accounts Division / Statistics Canada

15
different regions comparing industry multiplier effects.3 Table B in the Appendix lists input-output multiplier effects for other industries and services in New Brunswick.
CHANGES IN WORKFORCE PARTICIPATION DUE TO CHILD CAREFamily favorable policies such as child care, allow parents to enter the work force. As seen in Table B3, New Brunswick’s population of around 750,000, includes 88,865 children between the ages of 0 and 11. These children all potentially need child care services. Table B4 shows that 62 percent of New Brunswick families include young children. Of these, lone parents head 16 percent of all fami-lies. The ability of lone parents to work is even more affected by child care availability.
It is also helpful to understand the labour force characteristics of the individuals that may be affected by child care availability. The first labour force characteristic to examine is the labour force participation rate. The traditional way to report the labour force participation rate is to add up all employed adults plus all those who are unemployed but actively looking for work. These figures do not include individuals who are not looking for work but want a job (discouraged workers). These people are not seen in the traditional measure of labour force participation and often include parents of young children. Table B5 shows that in New Brunswick, about 64 percent of the adult population is working or looking for work and of that 64 percent, about 10 percent are not employed. The female population has a lower labour force participation rate but also a lower unemployment rate.
3 See Centre for Spatial Economics (2009) and Liu, Ribeiro, and Warner (2004) for examples.
New Brunswick has a high percentage of working mothers. Figure B1 shows the employment rate for women (age 15–54) with at least one child by education levels. It highlights the strong correlation between educational attainment and participation in paid work. The employment rate is the percentage of women in the labour force working for pay.
It is important to determine child care needs across communities, rather than an overall provincial estimate. Table B6 shows the percentage of families with a lone female head of household ranges from around 9 percent to more than double at around 20 percent depending on community. The percentage with lone male heads of households also vary significantly by community. Table B7 further highlights the differences across communities by showing the labour force participation rate and unemployment rate for females across communities. As can be seen in Table B7, column 2, the labour force participation rate ranges from 44 percent (Dalhousie area) to 71 percent (Dieppe area) and the unemployment rate ranges from a low of four percent (Sussex area) to almost 30 percent (Neguac area). This report breaks New Brunswick into 33 communities (with the three biggest urban cores subdivided) following the New Brunswick Health Council community boundaries. Table C in the Appendix gives information on which areas belong to which communities and Figure A in the Appendix illustrates the community boundaries.
0%
20%
40%
60%
80%
100%Employment rate
Bach
elor's
Deg
ree
Colle
ge D
egre
e
HS D
iplom
a
HS D
ropo
ut
All
Figure B1NB Employment Rates for Females With at
Least One Child 0–9 years by Education Level
52.4
40.1
68.5
83.2 84.1
Table B5: Labour Force Participation in New BrunswickPERCENT OF POPULATION IN LABOUR FORCE 64.1
PERCENT OF POPULATION UNEMPLOYED 10.4
PERCENT OF FEMALES IN LABOUR FORCE 59.9
PERCENT OF FEMALES UNEMPLOYED 8.3
Source: 2011 National Household Survey
Table B3: Number of Children in New BrunswickTOTAL POPULATION 750,352
AGES 0–4 36,480
AGES 5–9 36,625
AGES 10–11 15,760
0–11 YEARS 88,865
Source: 2011 Canadian Census
Table B4: Percentage Breakdown of Families by Children and Heads of Household
FAMILIES WITHOUT CHILDREN 38
COUPLE FAMILIES WITH CHILDREN 46
FAMILIES WITH LONE FEMALE HEAD OF HOUSEHOLDS 13
FAMILIES WITH LONE MALE HEADS OF HOUSEHOLDS 3
TOTAL FAMILIES WITH CHILDREN 62
Source: 2011 Canadian Census

16
Table B6: Percentage of Households by Lone Heads of Households by Sex
PERCENTAGE OF HOUSEHOLDS WITH
COMMUNITY NAME LONE FEMALE HEAD LONE MALE HEAD
Kedgwick Area 13.7 4.8
Campbellton Area 16.1 3.8
Dalhousie Area 13.4 3.8
Bathurst Area 11.1 3.2
Caraquet Area 15.9 4.3
Shippagan Area 18.5 5.7
Tracadie-Sheila Area 16.5 4.9
Neguac Area 17.8 5.2
Miramichi Area 13.8 3.4
Bouctouche Area 14.2 3.8
Salisbury Area 11.4 3.3
Shediac Area 9.2 2.9
Sackville Area 10.6 2.7
Riverview Area 11.2 3.0
Moncton 13.8 3.1
Dieppe Area 9.4 2.4
Hillsborough Area 10.2 3.3
Sussex Area 10.0 2.7
Minto Area 12.3 3.1
Saint John Area 19.5 4.0
Grand Bay-Westfield Area 9.5 3.8
Quispamsis Area 9.5 2.5
St. George Area 12.4 4.0
St. Stephen Area 14.5 2.8
Oromocto Area 9.9 3.0
Fredericton 13.8 2.9
New Maryland Area 9.9 3.0
Nackawic Area 9.6 3.1
Douglas Area 8.9 3.6
Florenceville-Bristol Area 11.9 3.0
Perth-Andover Area 12.9 4.0
Grand Falls Area 10.5 3.4
Edmundston Area 10.1 3.1Source: 2011 National Household Survey
IMPACT OF SUBSIDIZED CHILD CARE ON MOTHERS’ EMPLOYMENT RATESMany studies have estimated the impact of subsidized child care on mothers’ employment rates, as shown in Table B8. These studies have spanned a number of different countries and timeframes. Although none are perfectly comparable to New Brunswick, there is still much to learn about potential impacts. Overall, evidence of the impact of subsidized child care on the labour supply of mothers is mixed. Germany and the Netherlands reported moderate increases, while subsidized child care in Norway and Sweden has had very little
Table B7: Labour Force Statistics for Women by Region
COMMUNITY NAME IN LABOUR FORCE (%) UNEMPLOYED (%)
Kedgwick Area - -
Campbellton Area 48.9 8.4
Dalhousie Area 44.1 10.5
Bathurst Area 54.7 9.3
Caraquet Area 52.2 7.4
Shippagan Area 51.6 14.0
Tracadie-Sheila Area 55.9 8.8
Neguac Area 52.7 29.1
Miramichi Area 55.6 11.0
Bouctouche Area 55.4 10.3
Salisbury Area 58.8 7.9
Shediac Area 59.3 9.6
Sackville Area 63.2 13.0
Riverview Area 66.2 6.8
Moncton 65.2 6.8
Dieppe Area 70.7 5.7
Hillsborough Area 59.9 12.0
Sussex Area 57.1 4.1
Minto Area 49.6 17.3
Saint John Area 59.0 8.7
Grand Bay-Westfield Area 66.1 5.2
Quispamsis Area 63.3 6.6
St. George Area 58.4 15.5
St. Stephen Area 50.2 6.5
Oromocto Area 63.3 6.8
Fredericton 62.7 7.9
New Maryland Area 68.1 5.7
Nackawic Area 58.0 7.5
Douglas Area 66.1 8.9
Florenceville-Bristol Area 57.8 9.8
Perth-Andover Area 52.1 9.7
Grand Falls Area 57.2 8.4
Edmundston Area 56.8 6.6Source: 2011 National Household Survey
impact. The lowest effect size was found in Sweden. This is because at the time of Sweden’s child care reform, over 80 percent of children ages 3–6 years were already in child care so there was little room for growth. By contrast in Kentucky, California and Québec, where maternal labour force participation was low, the enhanced availability of child care produced a much larger effect size. Subsidized child care had the biggest effect on single parents and those with low levels of education. In New Brunswick mothers with low education levels are least likely to be in the workforce, leaving considerable room for employment growth among this group in particular.

17
each occupation, the percent of women now in the job category and the average annual income for that occupation.
A large number of the most in-demand occupations in the next decade do not require high levels of education and already employ a large percentage of women. This would indicate that jobs are available for mothers entering the labour market however the majority of these jobs are not 9 to 5. Child care operating during traditional hours may not be a sufficient inducement for these women to work. It is also important to note that these are provincial projections. Job openings are not evenly distrusted throughout the province. While child care may enable more woman to work; jobs may not be available in their communities.
The occupations highlighted in the table do not take into account the potential of an expanded child care sector as a job creator itself. Most jobs created by the child care sector stay in the community as educators, support staff, cooks, maintenance and so on. Many of the jobs created by the child care sector would also be suited for women entering the job market.
Due to differences in policies and geography, it is impossible to exactly predict what would occur in New Brunswick if child care services were expanded. However, it is possible to make educated guesses on the bounds of changes that may occur based on what has happened in other jurisdictions. For instance, using the most conservative estimates from other jurisdictions, if the employment rate of mothers4 increased between 1 and 7 percentage points, then between 994 and 7,146 more New Brunswick mothers would be employed. However, we must still ask: Can the women who are freed up from child care duties find work? And if there are jobs, will they chose to work?
A large majority of mothers in New Brunswick who are unemployed also do not hold high educational qualifications. The occupations that will see the highest growth in demand over the next decade are listed in Table B9. It includes the top 25 occupations with the most anticipated job openings required to maintain current levels of economic activity due to attrition and new job growth between 2016 and 2025. It also lists the minimum level of education required for
4 We will count mothers as being women who are living with at least one child in the household and who are between 15–54 years old.
Table B8: Summary Table of Studies Estimating the Impact of Subsidized Child Care on Mothers’ Employment Rate
LOCATION STUDY DATA SOURCE EMPLOYMENT RATE PERCENTAGE POINT INCREASE OF MOTHERS
Canada (Québec) Haeck et al. (2013) National Longitudinal Survey of Children and Youth (1998–2008)
Overall: 6–13 %
Two Parent: 5–14%
Single H.S. Education: 27%
Canada (Québec) Lefevbre (2009) Survey of Labour and Income Dynamics (2002–2004)Overall: 4.7–7.0%
Low Education: 10.1–19.2%
Canada (Québec) Baker et al (2008) National Longitudinal Survey of Children and Youth (1994–2003) Married: 7.7 %
Canada (Québec) Lefevbre & Merrigan (2008) Survey of Labour and Income Dynamics (1993–2002)Overall period: 7.3%
1999–2002: 7.6–8.1%
Germany Bauernschuster & Schlotter (2015) German Socio Economic Panel (1996–2001) 5–8.2%
Netherlands Bettendorf et al. (2012) Labour Force Survey of Statistics Netherlands (1995–2009)
Overall: 1.5–3.4%
Short-run effect: 1.5–2.3%
Medium-run effect: 2.3–3.4%
Norway Havnes & Mogstad (2011) Administrative Registrars from Statistics Norway (1976–1979) Overall: 1.1%
Sweden Lundin et al. (2008) Statistics SE (2001, 2003) 0.0068
United States (Kentucky) Berger & Black (1992) Survey of single mothers in Kentucky; Current population survey May 1988 8.4–25.3%
United States Blau & Teken (2007) National Survey of America’s Families (1999) 0.33

18
average New Brunswick worker and earn the average wage for a woman with dependent children, this would increase tax revenue by $2,453 per worker. At the low end (994 new workers) this would increase tax revenues by $2,438,282. If the employed labour force increased by 7,146 average workers tax revenues would increase by $17,529,138. In addition, the government revenue would see increases due to lower use of social welfare, social transfers and other credits for low-income families.
IMPACT OF INCREASED MATERNAL EMPLOYMENT ON TAX REVENUEAssuming that all the new entrants into the job market are high school dropouts, this would increase provincial tax revenue by $790 per worker, which would translate into $785,260 in tax revenue if the labour market expanded by 1 percent (994 new workers) to a $5,645,340 tax increase based on a labour force expansion of 7 percent (7,146 low-educated mothers entering the workforce). If all the new entrants into the job market are comparable to the
Table B9: Top 25 Occupations with the Most Anticipated Job Openings between 2016 and 2025EDUCATION REQUIRED
OCCUPATIONON THE JOB
TRAINING
HIGH SCHOOL DIPLOMA
COLLEGE/ APPREN-TICESHIP
UNIVERSITY DEGREE
GRADUATE DEGREE
% OF CURRENT WORKFORCE IS
FEMALE
AVERAGE ANNUAL EMPLOYMENT
INCOME
Registered nurses and registered psychiatric nurses Yes 94.1% $58,018
Retail and wholesale trade managers Yes Maybe 42.7% $42,917
Nurse aides, orderlies and patient service associates Yes 86.9% $24,308
Retail salespersons Yes 54.8% $21,101
Administrative assistants Yes 96.9% $30,338
Other customer and information services representatives Yes 65.7% $26,682
Light duty cleaners Yes 74.1% $19,054
Home support workers, housekeepers and related occupations Yes 94.9% $15,075
Administrative officers Yes 83.4% $41,343
Janitors, caretakers and building superintendents Yes 21.7% $28,285
Transport truck drivers Yes 1.4% $38,731
General office support workers Yes 88.4% $32,342
Cashiers Yes 82.6% $11,518
Elementary school and kindergarten teachers Yes 88.2% $50,953
Cooks Yes 58.7% $17,065
Carpenters Yes 1.9% $29,415
Heavy equipment operators (except crane) Yes 1.0% $42,787
Licensed practical nurses Yes 90.1% $35,236
Construction trades helpers and labourers Yes 4.2% $27,201
Receptionists Yes 92.2% $23,155
Automotive service technicians, truck and bus mechanics and mechanical repairers Yes 0.0% $37,482
Food counter attendants, kitchen helpers and related support occupations Yes 72.0% $13,356
Security guards and related security service occupations Yes 16.0% $24,621
Financial auditors and accountants Yes 56.0% $60,124
Accounting and related clerks Yes 84.1% $31,865 Source: Top 25 occupations and education requirements provided by the Post-Secondary Education, Training and Labour Department, New Brunswick.
% of current workforce and income downloaded from http://www1.gnb.ca/0105/op-pp/Default.aspx?l=e.

19
THE EFFECT OF INCREASED MATERNAL EMPLOYMENT ON GDPThe GDP of New Brunswick was $31.9-Billion in 2013. The GDP is the monetary value of all the finished goods and services produced within a particular region during a specific time period. The GDP is used to gauge the health of the economy by examining its increase or decrease over time. If the GDP grows by 5 percent, it means that the economy has grown by 5 percent.
An important economic fact (Solow, 1956) is that the GDP basically reacts in proportion to the increase in the number of persons employed, provided that the new individuals hired are just as productive as existing workers. Numerous studies5 of the impact of Québec’s child care programs have estimated that women who are induced to enter the labour market are as productive as the average worker already in the labour force, based on the number of weeks and the number of annual hours worked. In addition, Lefebvre, Merrigan and Roy-Desrosiers (2011) found that available, affordable child care had the same impact on the employment rate of mothers of children ages 0–5 years as for women with and without a university degree. Therefore, for women with children 5 years old and younger, it can be assumed that their average productivity is similar to currently-employed workers.
We can create conservative estimates of GDP growth using a range of productivity estimates to estimate the overall effect on GDP of more mothers entering the workforce because of increased access to child care. To estimate the low end, we assume that the impact on employment is concentrated on those who did not complete high school and therefore assume that their level of productivity is also lower. Women, age 15–54 who did not complete high school and who has at least one child, earned $17,789 in 2011 according to the 2011 National Household Survey. The average woman with at least one child earned $34,971. The median income for the province was $55,090.
On the low end, if we assume only high school dropouts are induced to enter the labour market due to the availability of child care, they would be 32 percent as productive as a New Brunswick worker earning the median income. To estimate a conservative high end,
5 Lefebvre & Merrigan (2008); Baker, Gruber & Milligan (2008); and Lefebvre, Merrigan & Verstraete (2009)
Table B10: Effect of Maternal Employment Rate Increase on Income Tax Revenue
DOLLAR INCREASE IN REVENUE
EDUCATION LEVEL OF NEW ENTRANTS
1% INCREASE TO EMPLOYMENT RATE
7% INCREASE TO EMPLOYMENT RATE
Low $785,260 $5,645,340
Average $2,438,282 $17,529,138Source: http://www2.gnb.ca/content/gnb/en/departments/finance/taxes/personal.html
we assume that the new entrants are similar to currently employed mothers, and are therefore 63 percent as productive as the average New Brunswick worker.
This information can be used to calculate the high- and low-end effect of increased maternal employment on GDP, which can be seen in Table B11. An estimated 994 to 7,146 more mothers will work, which represents an increase of 1–7 percentage points.6 If all the new job entrants have low educational levels, this will increase GDP by between 0.16 percent and 1.12 percent. If the new entrants are similar to mothers already in the workforce, the GDP will increase between 0.32 percent and 2.24 percent. Therefore, GDP is calculated to increase by between $51-million and $357.2-million at the low end and between $102-million and $714-million using conservative upper bound estimates. These returns are lower than commonly reported because of the constraints on employment growth in New Brunswick. Mothers with post-secondary credentials are already largely in the labour force, meaning most job growth will involve women with high school education or less.
THE CHILD CARE SECTOR’S OTHER EFFECTS Child care not only affects GDP and employment, it has also been shown to affect the use of social assistance. In particular, Andren (2005) and Connelly and Kimmel (2003) both found that child care availability has a large effect on the attachment of sole parents to social assistance. This has implications for New Brunswick as there were 2,849 parents with children ages 4 years and younger on income assistance in 2013–2014 and 3,111 parents with children 5–11 years of age on income assistance in 2013–2014.7 While families rely on social assistance for a number of factors, accessible, affordable child care would allow many parents to transfer from welfare to work. As Table B12 illustrates, if child care were available, an estimated 25 percent of parents would be able to leave social assistance for paid work, for an annual provincial savings of $17.1-million.8
6 This is estimated at the provincial level. The data do not exist to estimate the increase at any level of geography lower than the province.7 Data provided by the EECD/EDPE.8 Calculation based on Schedule A of the Family Income Security Act for a 1 parent/1 child household receiving payments under the Transition Benefit Program
Table B11: The Effect of Increased Maternal Employment on GDP
PERCENT INCREASE IN GDP DOLLAR INCREASE IN GDP
EDUCATION LEVEL OF NEW ENTRANTS
WITH 1% INCREASE IN
EMPLOYMENT RATE
WITH 7% INCREASE IN
EMPLOYMENT RATE
WITH 1% INCREASE IN
EMPLOYMENT RATE
WITH 7% INCREASE IN
EMPLOYMENT RATE
Low 0.16% 1.12% $51,040,000 $357,280,000
Average 0.32% 2.24% $102,080,000 $714,560,000
Source: http://www2.gnb.ca/content/gnb/en/departments/finance/taxes/personal.html

20
The lack of child care can significantly hinder the acquisition of education for parents. This is especially true for younger parents who have children before they finish schooling. New Brunswick has a large number of teen births (mothers 14-19 years of age) and this number is on the rise. For example, in 2010 there were 34.8 births per 1000 to a teen mother in the province. This rate has increased by 17.6 percent since 2001.9 When teenage parents do not receive the support and resources they need, a variety of detrimental consequences may occur. In particular, many young mothers do not graduate from high school, affecting future employment and earnings. More assessable child care services would help to ameliorate the effects of early parenthood by providing support to continue schooling or enter the labour market.
Child care availability can also help parents attain higher levels of education. Herbst and Tekin (2011) found that child care subsidies increase the chance a single mother will enroll in post-secondary education by 13 percentage points. In addition, they showed that child care subsidies increase the chance a single mother will participate in a job training program by 8 percentage points. Since mothers’ educa-tional levels are directly linked to child outcomes, educating mothers is an important way of breaking intergenerational cycles of poverty.
Child care also supports community stability particularly in more re-mote areas where it is an asset in recruiting and retaining essential workers such as teachers, health care and police.
COSTS OF CHILD CARE — PROGRAM COSTSAs part of its anti-poverty strategy New Brunswick established a target to provide child care to 65 percent of its children. This report calculates child care costs using the 65 percent target for children ages 0-8 years. We choose this age group because it mirrors directions the province is adopting around the organization of other children’s services and programming, including curriculum approaches to early learning. As discussed earlier, focusing on younger children would enable more intentional programming. It also reflects a preference among children 9–12 years old who feel they have outgrown child care and wish to participate in alternative out-of-school activities.
9 Source: McKay, 2013
Table B12: Predicted Effect of Child Care (CC) on Income Assistance (IS) Costs
NO CC WITH CCREDUCED SI
CASES SI SAVINGS
# FAMILIES ON IS WITH CHILDREN 0–4 YEARS
2,849 2137 712 $8,190,875
# FAMILIES ON IS WITH CHILDREN 0–11 YEARS
3,110 2333 778 $8,941,250
TOTAL 5,959 4469 1490 $17,132,125
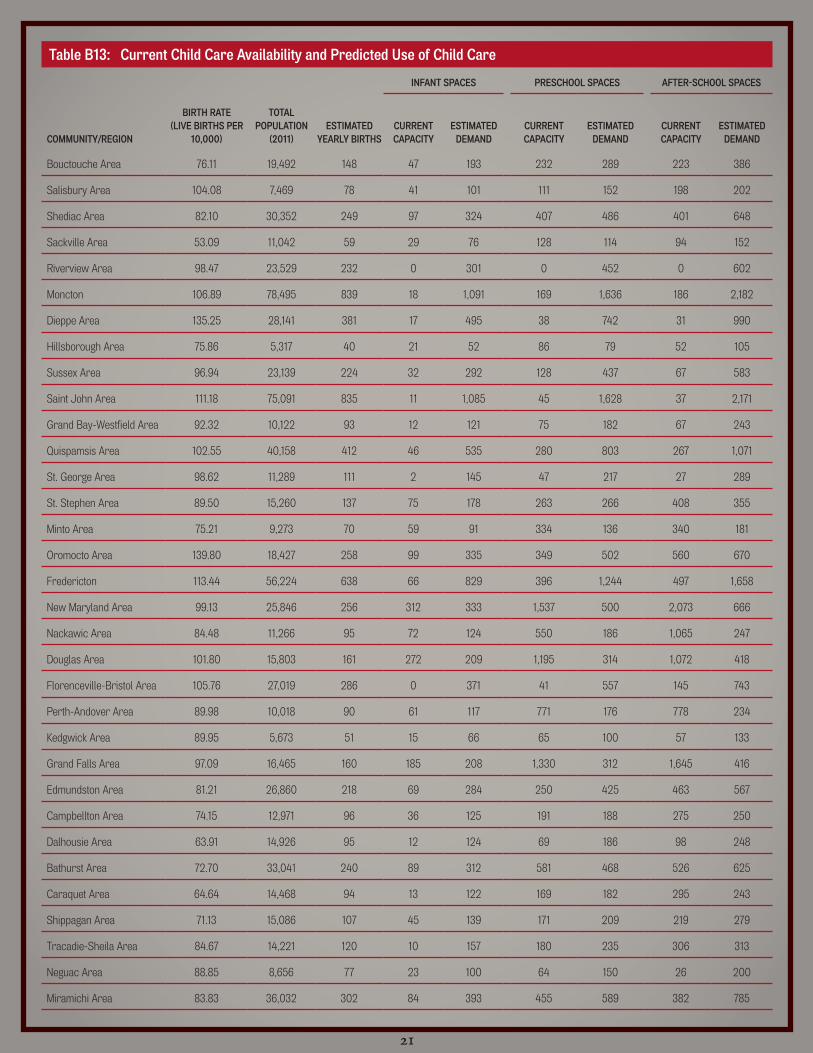
Roughly 7,000 babies are born in New Brunswick each year.10 To examine the demand across New Brunswick in different communities, the current capacity along with the estimated demand for infant, preschool, and after school child care spaces are presented in Table B13. The estimated demand was calculated by community specific birth rates, populations and the 65 percent capacity rate. The assumption made is that the child care spot is in the same community as the child lives. There are some circumstances that this would not hold for instance if a parent used a child care centre near their work instead of home.
Table B14 highlights the predicted number of new spaces needed based on the data provided in Table B13. In particular, it is estimat-ed that an additional 7,521 infant spaces, 7,667 preschool spaces, and 10,915 school ages spaces will be needed across the province. Some communities have met or exceeded the capacity goals for some child care levels. For instance, it is estimated that the Minto area has enough preschool and after school spaces. The same is true for six other communities. However, overall, most communities will need to increase their child care spaces to hit the 65 percent capacity target. Table B14 also indicates that child care is a regional/community is-sue with strong differences across the province.
Table B15 lists the number of new staff positions required for the increase in child care spaces predicted in Table B14. Based on New Brunswick legislated staff:child ratios in child care centres, approximately 4,412 new staff would need to be trained and hired to accommodate the increased enrolment. This number varies significantly across communities. The public cost to educate these additional staff can be estimated at approximately $3,000/staff, which would cost around $13.2-million.
Public contributions as a percentage of the cost of operating child care are comparatively low in New Brunswick. Table B16 shows the provincial budget for child care totaling $44-million. This supports staff wages and training, provides additional in class support for children with special needs, subsidizes fees for low-income families and has a small capital fund for repairs and renovations. The only fund that offsets child care operating costs is the Quality Improvement Funding Supports (QIFS) which supplements staff wages to a maximum of $5/hour. This subsidizes operating costs by about $1,700/space on average or about 25 percent overall cost of a space, leaving parent fees to cover the remaining 75 percent of costs. Table B17 lists average child care fees by region. High fees are a barrier to parents using regulated child care, but they are also a drag on quality. Child care providers struggle between setting fees low enough to attract parents and fill spaces and high enough to recruit and retain staff.
10 New Brunswick has a roughly 9.18/1000 person birth rate each year, and a current population is estimated at 751,170. 2013 data found here: http://www.snb.ca/e/1000/1000-01/pdf/2013/T1.pdf
21
Table B13: Current Child Care Availability and Predicted Use of Child Care
INFANT SPACES PRESCHOOL SPACES AFTER-SCHOOL SPACES
COMMUNITY/REGION
BIRTH RATE (LIVE BIRTHS PER
10,000)
TOTAL POPULATION
(2011)ESTIMATED
YEARLY BIRTHSCURRENT CAPACITY
ESTIMATED DEMAND
CURRENT CAPACITY
ESTIMATED DEMAND
CURRENT CAPACITY
ESTIMATED DEMAND
Bouctouche Area 76.11 19,492 148 47 193 232 289 223 386
Salisbury Area 104.08 7,469 78 41 101 111 152 198 202
Shediac Area 82.10 30,352 249 97 324 407 486 401 648
Sackville Area 53.09 11,042 59 29 76 128 114 94 152
Riverview Area 98.47 23,529 232 0 301 0 452 0 602
Moncton 106.89 78,495 839 18 1,091 169 1,636 186 2,182
Dieppe Area 135.25 28,141 381 17 495 38 742 31 990
Hillsborough Area 75.86 5,317 40 21 52 86 79 52 105
Sussex Area 96.94 23,139 224 32 292 128 437 67 583
Saint John Area 111.18 75,091 835 11 1,085 45 1,628 37 2,171
Grand Bay-Westfield Area 92.32 10,122 93 12 121 75 182 67 243
Quispamsis Area 102.55 40,158 412 46 535 280 803 267 1,071
St. George Area 98.62 11,289 111 2 145 47 217 27 289
St. Stephen Area 89.50 15,260 137 75 178 263 266 408 355
Minto Area 75.21 9,273 70 59 91 334 136 340 181
Oromocto Area 139.80 18,427 258 99 335 349 502 560 670
Fredericton 113.44 56,224 638 66 829 396 1,244 497 1,658
New Maryland Area 99.13 25,846 256 312 333 1,537 500 2,073 666
Nackawic Area 84.48 11,266 95 72 124 550 186 1,065 247
Douglas Area 101.80 15,803 161 272 209 1,195 314 1,072 418
Florenceville-Bristol Area 105.76 27,019 286 0 371 41 557 145 743
Perth-Andover Area 89.98 10,018 90 61 117 771 176 778 234
Kedgwick Area 89.95 5,673 51 15 66 65 100 57 133
Grand Falls Area 97.09 16,465 160 185 208 1,330 312 1,645 416
Edmundston Area 81.21 26,860 218 69 284 250 425 463 567
Campbellton Area 74.15 12,971 96 36 125 191 188 275 250
Dalhousie Area 63.91 14,926 95 12 124 69 186 98 248
Bathurst Area 72.70 33,041 240 89 312 581 468 526 625
Caraquet Area 64.64 14,468 94 13 122 169 182 295 243
Shippagan Area 71.13 15,086 107 45 139 171 209 219 279
Tracadie-Sheila Area 84.67 14,221 120 10 157 180 235 306 313
Neguac Area 88.85 8,656 77 23 100 64 150 26 200
Miramichi Area 83.83 36,032 302 84 393 455 589 382 785

22
Table B14: Predicted Number of New Spaces Needed by Community/Region
COMMUNITY/REGIONINFANT SPACES
PRESCHOOL SPACES
AFTER SCHOOL SPACES
Bouctouche Area 146 57 163
Salisbury Area 60 41 4
Shediac Area 227 79 247
Sackville Area 47 0 58
Riverview Area 301 452 602
Moncton 1,073 1,467 1,996
Dieppe Area 478 704 959
Hillsborough Area 31 0 53
Sussex Area 260 309 516
Saint John Area 1,074 1,583 2,134
Grand Bay-Westfield Area 109 107 176
Quispamsis Area 489 523 804
St. George Area 143 170 262
St. Stephen Area 103 3 0
Minto Area 32 0 0
Oromocto Area 236 153 110
Fredericton 763 848 1,161
New Maryland Area 21 0 0
Nackawic Area 52 0 0
Douglas Area 0 0 0
Florenceville-Bristol Area 371 516 598
Perth-Andover Area 56 0 0
Kedgwick Area 51 35 76
Grand Falls Area 23 0 0
Edmundston Area 215 175 104
Campbellton Area 89 0 0
Dalhousie Area 112 117 150
Bathurst Area 223 0 99
Caraquet Area 109 13 0
Shippagan Area 94 38 60
Tracadie-Sheila Area 147 55 7
Neguac Area 77 86 174
Miramichi Area 309 134 403
Provincial Totals 7,521 7,667 10,915
Source: Current child care capacity provided by Education and Early Childhood Devel-opment Department, New Brunswick. Birth rate and population by community used to
calculate estimated demand provided by the New Brunswick Health Council.
Table B15: Predicted Number of New Staff Positions Required by Community/Region*
COMMUNITY/REGIONINFANT SPACES
PRESCHOOL SPACES
AFTER SCHOOL TOTAL
Bouctouche Area 49 8 12 69
Salisbury Area 20 6 0 26
Shediac Area 76 12 17 105
Sackville Area 16 0 4 20
Riverview Area 100 67 43 210
Moncton 358 217 141 716
Dieppe Area 159 104 68 331
Hillsborough Area 10 0 4 14
Sussex Area 87 46 37 169
Saint John Area 358 234 151 743
Grand Bay-Westfield Area 36 16 12 65
Quispamsis Area 163 77 57 297
St. George Area 48 25 19 91
St. Stephen Area 34 0 0 35
Minto Area 11 0 0 11
Oromocto Area 79 23 8 109
Fredericton 254 125 82 462
New Maryland Area 7 0 0 7
Nackawic Area 17 0 0 17
Douglas Area 0 0 0 0
Florenceville-Bristol Area 124 76 42 242
Perth-Andover Area 19 0 0 19
Kedgwick Area 17 5 5 28
Grand Falls Area 8 0 0 8
Edmundston Area 72 26 7 105
Campbellton Area 30 0 0 30
Dalhousie Area 37 17 11 65
Bathurst Area 74 0 7 81
Caraquet Area 36 2 0 38
Shippagan Area 31 6 4 41
Tracadie-Sheila Area 49 8 0 57
Neguac Area 26 13 12 51
Miramichi Area 103 20 29 151
Provincial Totals 2,507 1,132 773 4,412
*Estimated demand for new staff based on legislated child:staff ratios.Does not distinguish between qualified and non-qualified staffng.

23
To address this challenge we set two benchmarks to model the costs of expanded access to child care. First we use Quebec’s example to establish the public cost per space. In Quebec child care is public-ly funded at $13,000 for an infant spot, $10,500 for preschool, and $2,890 for school age spaces. This model would bring public funding for preschool aged children closer to the per pupil funding that is available to children enrolled in K–12 education in New Brunswick. To establish the portion parents should pay, we provide two options, one from Quebec and the other from PEI. In Quebec parents’ fees contribute 15 percent of program costs for infant and preschool chil-dren and 50 percent of the costs for school aged children. In Prince Edward Island, parents pay approximately 50 percent of the overall operating costs. Figure B2 shows current public spending per child in child care and in school,11 and proposed spending.
Table B18 represents the total additional public costs of increasing child care access in New Brunswick to cover 65 percent of children 0–8 years old, at the same per space funding levels as Quebec and showing the two different parent fee options. If parents were to pay fees similar to Quebec (15% infant/preschool fees and 50% of school aged fees paid by parents) the additional public cost would be $167-million per year. If parents were to pay the same portion as PEI
11 McCuaig & Akbari, 2014.
Table B16: Child Care Program Expenditures2015 –2016
Quality Improvement Funding Supports (QIFS)/ Wage grants $23,591,900
Early Learning and Child Care Services (ELCC) On line course curricula $1,825,000
E.C.I. Support Workers $2,376,700
Day Care Assistance (DAP)/ Fee subsidies $15,544,000
ELCC Trust Fund/ Capital fund $800,000
Total public funding to child care $44,137,600
Source: Department of Education and Early Childhood Development
Table B17: Average Parent Fees by Age and Region
REGION NAME INFANT PRESCHOOL AFTERSCHOOLChaleur $32.16 $22.80 $12.54
Edmundston $30.40 $26.25 $13.96
Fredericton $33.13 $28.17 $15.38
Miramichi $31.70 $26.74 $13.96
Moncton $34.73 $29.88 $18.45
Peninsula $32.59 $27.03 $12.99
Restigouche $29.57 $25.32 $13.88
Saint John $35.46 $28.82 $15.51
Province Average $33 .35 $28 .11 $15 .72
Source: Department of Education and Early Childhood Development
(50% overall costs) it would cost approximately $104.9-million per year. Table B18 does not include current child care expenditures. Table D in the Appendix lists additional costs by community.
COSTS OF CHILD CARE – CAPITAL COSTSCapital costs could be contained if underutilized school and community spaces are used. A large number of child care programs across the country are housed in elementary schools and the same is probably true in New Brunswick. New Brunswick has not conducted a review of school space that would be suitable for child care programming. However, it is generally the case that there is little surplus space in urban schools but child care expansion could be accommodated within rural schools. Therefore, in this report, we will assume that there is no available space to expand child care in schools in the urban centres of Moncton, Saint John, and Fredericton, the three largest population centres in the province. Other communities are able to adsorb new child care spots without needing to build additional facilities but will need to renovate surplus space in schools. In addition, we assume that existing school space can be made available to accommodate school age child care, therefore capital costs for this age group are not included.
The New Brunswick Regulation 83-85 under the Family Services Act (O.C. 83-457) requires a minimum of 3.25 square metres of usable indoor floor space per child. This is exclusive of offices, hallways, washrooms, lockers, kitchen facilities, shower rooms and isolation rooms.
0
$3,000
$6,000
$9,000
$12,000
$15,000
Pres
choo
l
Infan
t
Aver
age/
child
0-4
Scho
ol/ K
-12
Child
Car
e
Figure B2Current and Proposed Spending
per Child in Child Care and School
$1,700
$11,350 $11,750
$13,000
$10,500
Current annual operating costs/child
Proposed annual operating costs/child

24
The median cost to build a new child care centre is $2,690 per square metre.12 Table B19 highlights the urban areas (Moncton, Saint John, and Fredericton) where new childcare facilities would need to be built to accommodate excess demand for childcare spaces. It indicates the legislated minimum required space needed to serve those children and the estimate cost to build new facilities. Providing new facilities for the estimated 4,309 infant and 5,684 preschool children would cost approximately $87.4-million. Table E in the appendix provides a breakdown of capital costs by community.
12 This figure was provided by the EECD/EDPE. This does not include the cost of buying new land to put the new child care centre.
Renovations to accommodate the additional child care spaces in the non-urban communities are estimated at $2,018 per square metre.13 Accommodating an addition 3,212 infant spots and 1,982 preschool spots would cost approximately $34-million. Therefore, the total capital costs, for new centres would be $121.4-million. It is important to note that capital expenses will also have a mul-tiplier effect. Considering the multiplier effect of non-residential construction on GDP and jobs for New Brunswick and when in-terprovincial trade is considered, the onetime initial investment would impact GDP by between $158.8-$206.3-million and create between 1,154 and 1,391 new jobs.
13 This figure was provided by the EECD/EDPE.
Table B18: Additional Yearly Expenditures for Increased Levels of Child CareADDITIONAL GOVERNMENT CONTRIBUTION
PARENT CONTRIBUTION % OF OVERALL COSTS INFANT SPACES PRESCHOOL SPACES AFTER SCHOOL SPACES ALL SPACES
15% infant/preschool; 50% school aged $83,107,050 $68,427,975 $15,772,175 $167,307,200
50% $48,886,500 $40,251,750 $15,772,175 $104,910,425
Based on 65 percent coverage for children 0– 8 years, funded at $13,000/infant space; $10,500/preschool space; $2,890/school age space
Table B19: Cost to Build or Renovate Child Care Centres per Legislated Space RequirementINFANT SPACES PRESCHOOL SPACES
URBAN/RURALNUMBER OF SPACES
NEEDEDLEGISLATED REQUIRED
SPACE (M²) ESTIMATED COSTNUMBER OF SPACES
NEEDEDLEGISLATED REQUIRED
SPACE (M²) ESTIMATED COST
Urban Total 4,309 14,005 $37,627,707 5,684 18,473 $49,693,354
Non-Urban Total 3,212 10,483 $21,063,763 1,982 6,443 $13,001,959
Provincial Totals 7,521 24,488 $58,691,470 7,666 24,916 $62,695,313
Note: The estimated cost is based on the median cost per square metre of $2,690 for building new child care centres in the urban centres (highlighted) and $2,018 per square metre for renovating existing space for non-urban areas (non-highlighted). Please note that the costs do not include the land cost for the new builds.

25
SUMMARY OF ECONOMIC COSTS AND BENEFITSChild care is a unique industry and has a unique economic effect. Investing in child care has a multiplier effect on GDP and jobs, meaning that there is a ripple effect of spending money on child care on different industries and that it creates jobs. In addition, to the multiplier effect, it also increases the labour force participation and employment rate of parents. This increased employment increases GDP and tax revenue and decreases social assistance and government social transfers. Child care also affects parents in many ways such as allowing for increased levels of education which in turn will increase productivity. And finally, it affects children in terms of their human capital acquisition.
Using the following assumptions it can be reasonably estimated that if New Brunswick were to invest in its child care services with a target of providing coverage to 65 percent of all children from 0–8 years of age; and if the new spaces were funded at a level sufficient to support quality ($13,000 for an infant space, 10,500 for a pre-school space and $2,890 for a school age space), the benefits and costs would be as follows:
Benefits• Every $1 spent on child care operations in New Brunswick is
predicted to have a $1.15–1.29 impact on GDP and a $1.10–1.18 impact on labour income.
• Every $1 million of investment in child care creates about 34 jobs. • One time capital spending of $121.4-million to accommodate
new demand for child care would impact the GDP by between $158.8-$206.3-million and create between 1,154 and 1,391 new jobs.
• The employment rate of mothers is predicted to increase between 1 and 7 percentage points, which translates to between 994 and 7,146 more mothers in the workforce.
• The impact of increased maternal employment is calculated to increase GDP between 0.16 percent and 2.24 percent, If all the new job entrants have low educational levels, and between 0.32 percent and 2.24 percent points if the new entrants are similar to mothers already in the workforce. This translates into a $51-million to $357.2-million increase in GDP at the low end and between $102-million and $714-million using conservative upper bound estimates.
• If all new workers did not complete high school, tax revenue would increase by $785,260 with a 1 percent increase in labour force participation and by $5,645,340 with a 7 percent increase in participation. If all new workers are similar to the average mother now employed, tax revenue would increase by $2,438,282 with a 1 percent increase in employment and by $17,529,138 with a 7 percent increase in employment.
• Income assistance expenditures would decrease by $17.2-million.
Costs• Approximately 4,412 additional early childhood educators would
need to be trained and hired to accommodate the increase in children enrolled in child care programs. The cost to the province would be approximately $13.2 million if all new staff were ECE trained.
• Predicted new total yearly public expenditures due to an increase in child care capacity would be between $142.7–$174.4 million depending on the fee schedule chosen. This would be in addition to the current $44-million in expenditures.
• Predicted capital expenses of $121.4-million would be required if new child care centres are built and renovated to accommodate increased capacity for 0–4 year olds. Activities for school-age children should be accommodated within existing space in ele-mentary schools.

26
References
Andrén, T. (2005). The choice of paid childcare, welfare, and labor supply of single mothers. Labour Economics, 10(2), 133-147.
Baker, M., Gruber, J., & Milligan, K. (2008). Universal Child Care, Maternal Labor Supply, and Family Well Being. Journal of Political Economy, 116(4), 709–745.
Barnett, W. S. (2010). Universal and targeted approaches to preschool education in the United States. International Journal of Child Care and Education Policy, 4(1), 112.
Barnett, W. S. (2008). Preschool education and its lasting effects: Research and policy implications. New Brunswick, NJ: Rutgers University, National Institute for Early Education Research.
Barnett, W. S. (2007). Benefits and costs of quality early childhood education. The Children’s Legal Rights Journal (CLRJ), 27, 723.
Barnett, W. S., & Frede, E. C. (2010). The promise of preschool: Why we need early education for all. American Educator, 34(1), 2140.
Barnett, W. S., & Masse, L. N. (2007a). Early childhood program design and economic returns: Comparative benefit-cost analysis of the Abecedarian program and policy implications. Economics of Education Review, 26, 113-125.
Barnett, W. S., & Masse, L. N. (2007b). Comparative benefit–cost analysis of the Abecedarian program and its policy implications. Economics of Education Review, 26(1), 113-125.
Bauernschuster, S., & Schlotter, M. (2015). Public child care and mothers’ labor supply—Evidence from two quasi-experiments. Journal of Public Economics, 123, 1–16.
Berger, Marc, C., & Black, Dan, A. (1992). Child care subsidies, quality of care and the labour supply of low income mothers. Review of Economics & Statistics, 74(4), 635–642.
Bettendorf, L., Jongen, E., & Muller, P. (2012). Childcare subsidies and labour supply : evidence from a large Dutch reform, Tinbergen Institute Discussion Paper, No. 12-093/I, http://nbn-resolving.de/urn:NBN:nl:ui:31-1871/38506
Blau, D., & Tekin, E. (2007). The determinants and consequences of child care subsidies for single mothers in the USA. Journal of Population Economics, 20, 719–741.
Campbell, Frances A., Elizabeth Pungello, Shari Miller-Johnson, Margaret Burchinal, and Craig T. Ramey. “The Development of Cognitive and Academic Abilities: Growth Curves From an Early Childhood Educational Experiment,” Developmental Psychology, 2001, vol. 37, no. 2, pp. 231-242.
Caspi, A., Moffitt, T. E., Newman, D. L., & Silva, P. A. (1996). Behavioral observations at age 3 years predict adult psychiatric disorders: Longitudinal evidence from a birth cohort. Archives of General Psychiatry, 53(11), 1033-1039.
Centre for Spatial Economics. (2009). Literature Review of the Socioeconomic Effects and Benefits. Understanding and Addressing Workforce Shortages in Early Childhood Education and Care (ECEC) Project: Ottawa: Child Care Human Resources Sector Council
Connelly, R., & Kimmel, J. (2003). The Effect of Child Care Costs on the Labor Force Participation and Welfare Recipiency of Single Mothers: Implications for Welfare Reform, Southern Economic Journal 69(3), 498-519.
Corter, C., Janmohamed, Z., & Pelletier, J. (Eds.). (2012). Toronto first duty: Phase 3 report. Toronto, ON: Atkinson Centre for Society and Child Development, OISE/University of Toronto.
Commission on Social Determinants of Health. (2008). Closing the gap in a generation: Health equity through action on the social determinants of health: Final report of the Commission on Social Determinants of Health. Geneva, CH: World Health Organization.
Doherty, G., Lero, D., Goelman, H., LaGrange, A., & Tougas, J. (2000). You bet I care! Guelph, ON: Centre for Families, Work and Well-Being, University of Guelph, Ontario.
Doherty, G., Lero, D., Goelman, H., Tougas, J., & LaGrange, A. (2000). Caring and learning environments: Quality in regulated family child care across Canada. Guelph, ON: Centre for Families, Work and Well-Being, University of Guelph, Ontario.
Duncan, G. J., Dowsett C. J., Claessens, A., Magnuson, K., Huston, A. C., Klebanov, P.& Japel, C. (2007). School readiness and later achievement. Developmental Psychology, 43(6), 1428-1446.
Garner, A., & Shonkoff, P. (2012). Early childhood adversity, toxic stress, and the role of the pediatrician: Translating developmental science into lifelong health. Pediatrics, 129, e224.
Haeck, C. (2013). Canadian Evidence on Ten Years of Universal Preschool Policies : the Good and the Bad (No. Cahiere de recherche working paper 13-34).
Hart, B. & Risley, T. (1995). Meaningful differences in the everyday experience of young American children. Baltimore: Paul H. Brookes Publishing.
Havnes, T., & Mogstad, M. (2011). Money for nothing? Universal child care and maternal employment. Journal of Public Economics, 95(11-12), 1455–1465.
Health and Education Research Group. (2012, Jan.) Year two report: New Brunswick Early Childhood Centres. Fredericton, NB: HERG.
Heckman, J. (2000). Policies to foster human capital. Research in Economics, 54(1), 3-56.
Heckman, J. (2008). Return on Investment: Cost vs. Benefits. Retrieved from www.heckmanequation.org
Herbst, C. M., & Tekin, E. (2011). Do child care subsidies influence single mothers’ decision to invest in human capital? Economics of Education Review, 30(5), 901-912.
Janmohamed, J., McCuaig, K., Akbari, E., Gananathan, R., & Jenkins, J. (2014). Schools at the Centre: Findings from Case Studies Exploring Seamless Early Learning in Ontario. Toronto, ON: Atkinson Centre for Society and Child Development, OISE/University of Toronto.

27
Japel, C., Tremblay, R., & Côté, S. (2005). Quality counts! Assessing the quality of daycare services based on the Québec longitudinal study of child development. RPP Choices, 11(5). Montreal, QC: Institute for Research on Public Policy.
Lefebvre, P., & Merrigan, P. (2008). Child-Care Policy and the Labor Supply of Mothers with Young Children : A Natural Experiment from Canada. Journal of Labour Economics, 26(3), 519–548.
Lefebvre, P., Merrigan, P., & Verstraete, M. (2009). Dynamic labour supply effects of childcare subsidies: Evidence from a Canadian natural experiment on low-fee universal child care. Labour Economics, 16(5).
Liu, Z., Ribeiro, R., & Warner, M. E. (2004). Comparing child care multipliers in the regional economy: Analysis from 50 states. Ithaca, NY: Cornell University, Department of City and Regional Planning.
Lundin, D., Mörk, E., & Öckert, B. (2008). How far can reduced childcare prices push female labour supply? Labour Economics, 15, 647–659.
McCuaig, K., & Akbari, E. (2014a). Early childhood education report 2014. Toronto, ON: Ontario Institute for Studies in Education/University of Toronto. Retrieved from http://timeforpreschool.ca/en/fullreport/
McCuaig, K., & Akbari, E. (2014b). Québec 2014. Toronto, ON: Ontario Institute for Studies in Education/University of Toronto. Retrieved from http://timeforpreschool.ca/media/uploads/profileseng/qcprofileeng.pdf
McCuaig, K., & Akbari, E. (2014c). New Brunswick 2014. Toronto, ON: Ontario Institute for Studies in Education/University of Toronto. Retrieved from http://timeforpreschool.ca/media/uploads/profiles-eng/nb_profile-eng.pdf
McCuaig, K., & Akbari, E. (2014d). Prince Edward Island 2014. Toronto, ON: Ontario Institute for Studies in Education/University of Toronto. Retrieved from http://timeforpreschool.ca/media/uploads/profiles-eng/pe_profile-eng.pdf
McCuaig, K., Bertrand, J., & Shanker, S. (2012). Trends in early education and child care. Toronto, ON: Atkinson Centre of Society and Child Development, OISE/University of Toronto.
McCuaig K., & Hughes, C. (2000). When mom must work: Home daycare as welfare to work option. Toronto, ON: Ontario Coalition for Better Child Care.
McCain, M., Mustard, F., & McCuaig, K. (2011). Early Years Study 3. Toronto: ON: Margaret and Wallace McCain Family Foundation.
Mustard, F., McCain, M., & Shanker, S. (2007). Early Years Study 2. Toronto, ON: Council for Early Childhood Development.
OECD. (2010a). Excellence through equity: Giving every student the chance to succeed (Volume II). PISA, OECD Publishing. Retrieved from www.oecd.org/pisa/keyfindings/pisa2012 resultsvolumeii.htm. Also see OECD (2013). PISA 2012 Results.
OECD. (2010b). PF4.2: Quality of childcare and early education services. OECD Family database. OECD Social Policy Division Directorate of Employment, Labour and Social Affairs. Retrieved from http://www.oecd.org/social/family/database
OECD (2011), Doing Better for Families. Retrieved from: www.oecd.org/social/family/doingbetter
Pascal, C. E. (2009). With our best future in mind: Implementing early learning in Ontario. Toronto, ON: Queen’s Printer. Retrieved from http://www.ontario.ca/en/initiatives/earlylearning/ONT06018865.html
Peters. R. D., Nelson, G., et al. (2010). Investing in our future: Highlights of Better Beginnings, Better Futures research findings at Grade 12. Kingston, ON: Better Beginnings, Better Futures Research Coordination Unit, Queen’s University.
Pianta, R. C., & Howes, C. (Eds.). (2009). The promise of pre-K. Baltimore, MD: Brookes Publishing.
Pratt, J. and D. Kay (2006). “Beyond Looking Backward - Is Child Care a Key Economic Sector?” Community Development, 37(2), pp. 23-37.
Prentice, S. (2007a). Rural childcare: Childcare as economic and social development in Parkland. Winnipeg, MB: Child Care Coalition of Manitoba.
Prentice, S. (2007b). Franco-Manitoban childcare: Childcare as economic, social, and language development in St.Pierre-Jolys. Winnipeg, MB: Child Care Coalition of Manitoba.
Prentice, S. (2007c). Northern childcare: Childcare as economic and social development in Thomson. Winnipeg, MB: Child Care Coalition of Manitoba.
Prentice, S., McCracken, M. (2004). Time for Action: An Economic and Social Analysis of Childcare in Winnipeg. Winnipeg: Child Care Coalition of Manitoba.
Sammons, P., Sylva, K., Melhuish, E., Siraj-Blatchford, I., Taggart, B., Grabbe, Y., & Barreau, S. (2007). Effective preschool and primary education 311 project (EPPE 311) Influences on children’s attainment and progress in key stage 2: Cognitive outcomes in Year 5. London, UK: Institute of Education, University of London/Department for Education.
Sammons, P. K., Sylva, E., Melhuish, E., Siraj-Blatchford, B., Taggart, K., Toth, D., & Draghici, R. (2011). Effective Pre-School, Primary and Secondary Education Project (EPPSE 3–14): Influences on students’ attainment and progress in Key Stage 3: Academic outcomes in English, maths and science in Year 9. London, UK: Institute of Education, University of London/Department for Education.
Schweinhart, L. J. (2012). Preschool programs for children in disadvantaged families. Encyclopedia on Early Childhood Development. Retrieved from http://www.child-encyclopedia.com/documents/SchweinhartANGxp2.pdf
Solow, R. M. (1956). A contribution to the theory of economic growth. The quarterly journal of economics, 65-94.
Sylva, K., Melhuish, E., Sammons, P. Siraj, I., & Taggart, B. (2008). Final report from the primary phase: Preschool, school and family influences on children’s development during key stage 2. DCSF Research Report 61. Nottingham, UK: Institute of Education, University of London.
Sparks, R. L., Patton, J., & Murdoch, A. (2014). Early reading success and its relationship to reading achievement and reading volume: Replication of ‘10 years later’. Reading and Writing, 27(1), 189-21.
Warner, M., (2009). Child Care Multipliers: Stimulus for the States. Linking Economic Development and Child Care Research Project. Cornell University.

28
AppendixAPPENDIX ATo get some context, it is important to examine multipliers from different geographic areas and from a wide variety of authors. In particular, Table A lists the multipliers calculated for child care from a wide variety of sources and for a range of regions. These multipliers do not include estimates of the money spent in households on other goods due to increased public spending on child care (induced effects). For example, they do not include the effect of a family spending more as a result of increased earnings from maternal employment.
Table A lists both a GDP multiplier and an employment multiplier. A GDP multiplier for the child care industry estimates the total value added to the entire economy by each dollar of increased direct spending on child care services. The employment multiplier is an estimate of the number of jobs that would be created by the addition of one new job in the child care industry.
For example, Prentice and McCracken (2004) calculated a 1.16 GDP multiplier and 2.15 job multiplier for Winnipeg, Manitoba. This means that for every dollar spent on child care in Winnipeg, $1.16 is returned to the economy in increased spending. Every additional job in child care creates or sustains 2.15 jobs.
Appendix Table A: Input-Output Multipliers Calculated from Various Regions in Canada and the U .S .
REFERENCE REGIONGDP
MULTIPLIEREMPLOYMENT MULTIPLIER
Prentice and McCracken (2004)1
Winnipeg, Manitoba 1.16 2.15
Prentice (2007a)1 Parkland, Manitoba 1.58 1.49
Prentice (2007b)1 St. Pierre Jolys, Manitoba 1.58 1.49
Prentice (2007c)1 Thompson, Manitoba 1.58 1.49
Pratt and Kay (2006) New York State 1.35
Warner (2009) United States 1.49
Liu, Ribeiro, and United States 1.94 1.41Warner (2004) Alabama 1.44 1.24
Alaska 1.47 1.27
Arizona 1.52 1.27
Arkansas 1.51 1.3
California 1.52 1.25
Colorado 1.54 1.27
Connecticut 1.51 1.25
Washington D.C. 1.42 1.19
Delaware 1.44 1.25
Florida 1.48 1.25
Georgia 1.45 1.2
Hawaii 1.48 1.29
Appendix Table A: Input-Output Multipliers Calculated from Various Regions in Canada and the U .S .
REFERENCE REGIONGDP
MULTIPLIEREMPLOYMENT MULTIPLIER
Liu, Ribeiro, and Idaho 1.53 1.33Warner (2004) Illinois 1.59 1.28
Indiana 1.43 1.23
Iowa 1.52 1.29
Kansas 1.56 1.32
Kentucky 1.46 1.25
Louisiana 1.47 1.26
Maine 1.46 1.29
Maryland 1.5 1.26
Massachusetts 1.49 1.26
Michigan 1.5 1.25
Minnesota 1.6 1.32
Mississippi 1.32 1.18
Missouri 1.6 1.31
Montana 1.53 1.32
Nebraska 1.51 1.28
Nevada 1.37 1.17
New Hampshire 1.49 1.28
New Jersey 1.46 1.21
New Mexico 1.56 1.34
New York 1.52 1.26
North Carolina 1.43 1.22
North Dakota 1.53 1.31
Ohio 1.5 1.28
Oklahoma 1.55 1.31
Oregon 1.52 1.31
Pennsylvania 1.6 1.29
Rhode Island 1.43 1.24
South Carolina 1.38 1.2
South Dakota 1.45 1.27
Tennessee 1.5 1.24
Texas 1.5 1.22
Utah 1.59 1.3
Vermont 1.51 1.3
Virginia 1.46 1.22
Washington 1.55 1.28
West Virginia 1.45 1.28
Wisconsin 1.54 1.31
Wyoming 1.45 1.3
1Used primary education as industry in input-out analysis.
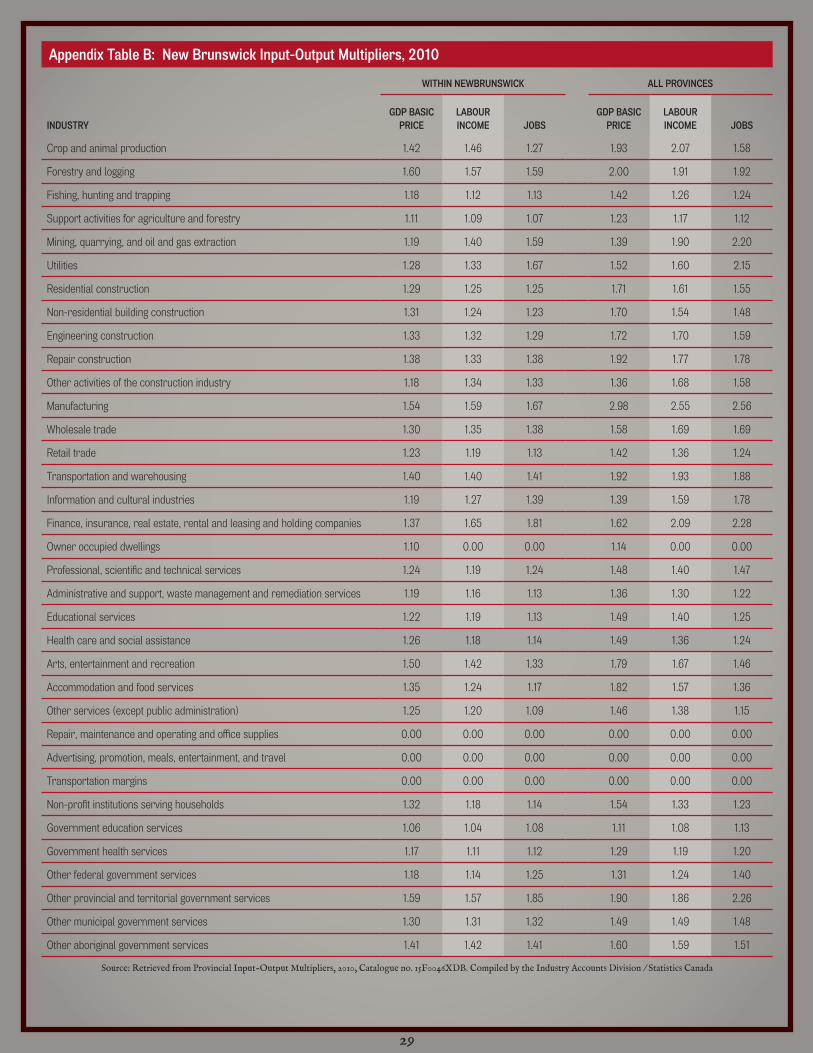
29
Appendix Table B: New Brunswick Input-Output Multipliers, 2010
WITHIN NEWBRUNSWICK ALL PROVINCES
INDUSTRYGDP BASIC
PRICELABOUR INCOME JOBS
GDP BASIC PRICE
LABOUR INCOME JOBS
Crop and animal production 1.42 1.46 1.27 1.93 2.07 1.58
Forestry and logging 1.60 1.57 1.59 2.00 1.91 1.92
Fishing, hunting and trapping 1.18 1.12 1.13 1.42 1.26 1.24
Support activities for agriculture and forestry 1.11 1.09 1.07 1.23 1.17 1.12
Mining, quarrying, and oil and gas extraction 1.19 1.40 1.59 1.39 1.90 2.20
Utilities 1.28 1.33 1.67 1.52 1.60 2.15
Residential construction 1.29 1.25 1.25 1.71 1.61 1.55
Non-residential building construction 1.31 1.24 1.23 1.70 1.54 1.48
Engineering construction 1.33 1.32 1.29 1.72 1.70 1.59
Repair construction 1.38 1.33 1.38 1.92 1.77 1.78
Other activities of the construction industry 1.18 1.34 1.33 1.36 1.68 1.58
Manufacturing 1.54 1.59 1.67 2.98 2.55 2.56
Wholesale trade 1.30 1.35 1.38 1.58 1.69 1.69
Retail trade 1.23 1.19 1.13 1.42 1.36 1.24
Transportation and warehousing 1.40 1.40 1.41 1.92 1.93 1.88
Information and cultural industries 1.19 1.27 1.39 1.39 1.59 1.78
Finance, insurance, real estate, rental and leasing and holding companies 1.37 1.65 1.81 1.62 2.09 2.28
Owner occupied dwellings 1.10 0.00 0.00 1.14 0.00 0.00
Professional, scientific and technical services 1.24 1.19 1.24 1.48 1.40 1.47
Administrative and support, waste management and remediation services 1.19 1.16 1.13 1.36 1.30 1.22
Educational services 1.22 1.19 1.13 1.49 1.40 1.25
Health care and social assistance 1.26 1.18 1.14 1.49 1.36 1.24
Arts, entertainment and recreation 1.50 1.42 1.33 1.79 1.67 1.46
Accommodation and food services 1.35 1.24 1.17 1.82 1.57 1.36
Other services (except public administration) 1.25 1.20 1.09 1.46 1.38 1.15
Repair, maintenance and operating and office supplies 0.00 0.00 0.00 0.00 0.00 0.00
Advertising, promotion, meals, entertainment, and travel 0.00 0.00 0.00 0.00 0.00 0.00
Transportation margins 0.00 0.00 0.00 0.00 0.00 0.00
Non-profit institutions serving households 1.32 1.18 1.14 1.54 1.33 1.23
Government education services 1.06 1.04 1.08 1.11 1.08 1.13
Government health services 1.17 1.11 1.12 1.29 1.19 1.20
Other federal government services 1.18 1.14 1.25 1.31 1.24 1.40
Other provincial and territorial government services 1.59 1.57 1.85 1.90 1.86 2.26
Other municipal government services 1.30 1.31 1.32 1.49 1.49 1.48
Other aboriginal government services 1.41 1.42 1.41 1.60 1.59 1.51
Source: Retrieved from Provincial Input-Output Multipliers, 2010, Catalogue no. 15F0046XDB. Compiled by the Industry Accounts Division / Statistics Canada

30
APPENDIX TABLE C & APPENDIX FIGURE AIt is important to look at the characteristics of different regions because there are many local labour market and social conditions that affect individuals. In this report, we break up New Brunswick
in 28 communities (with the three biggest urban cores subdivided) following the New Brunswick Health Council community boundaries. Table C gives information on which areas belong to which communities and Figure A illustrates the community boundaries.
Appendix Figure A: New Brunswick Communities
26
19
2116
17
24
22.2
20
23
25
28
27
22.1
6
14.3
13
1214.2
14.1
15
18.3
18.1
18.2
11
10
8
7
5
4
32
1
9
6
Source: Appendix D from My Community at a Glance 2014, Technical Document (NBHC, 2014)

31
Appendix Table C: Community and Zone Information
ZONE COMMUNITY COMMUNITY NUMBER NAME
1 Moncton / South-East Area 10 Bouctouche, Richibucto, Saint-Louis de Kent Area
1 Moncton / South-East Area 11 Salisbury, Petitcodiac, Harcourt Area
1 Moncton / South-East Area 12 Shediac, Saint-Antoine, Beaubassin East Area
1 Moncton / South-East Area 13 Sackville, Dorchester, Port Elgin Area
1 Moncton / South-East Area 14.1 Riverview and Coverdale
1 Moncton / South-East Area 14.2 Moncton
1 Moncton / South-East Area 14.3 Dieppe and Memramcook
1 Moncton / South-East Area 15 Hillsborough, Riverside-Albert, Alma Area
2 Fundy Shore / Saint John Area 16 Sussex, Norton, Sussex Corner Area
2 Fundy Shore / Saint John Area 18.1 Saint John, Simonds and Musquash
2 Fundy Shore / Saint John Area 18.2 Grand Bay-Westfield, Westfield, Greenwich Area
2 Fundy Shore / Saint John Area 18.3 Quispamsis, Rothesay, Hampton Area
2 Fundy Shore / Saint John Area 19 St. George, Grand Manan, Blacks Harbour Area
2 Fundy Shore / Saint John Area 20 St. Stephen, Saint Andrews, Campobello Island
3 Fredericton / River Valley Area 17 Minto, Chipman, Cambridge-Narrows Area
3 Fredericton / River Valley Area 21 Oromocto, Gagetown, Fredericton Junction Area
3 Fredericton / River Valley Area 22.1 Fredericton
3 Fredericton / River Valley Area 22.2 New Maryland, Kingsclear, Lincoln Area
3 Fredericton / River Valley Area 23 Nackawic, McAdam, Canterbury Area
3 Fredericton / River Valley Area 24 Douglas, Saint Marys, Doaktown Area
3 Fredericton / River Valley Area 25 Florenceville-Bristol, Woodstock, Wakefield Area
3 Fredericton / River Valley Area 26 Perth-Andover, Plaster Rock, Tobique Area
4 Madawaska / North West Area 27 Grand Falls, Saint-Léonard, Drummond Area
4 Madawaska / North West Area 28 Edmundston, Rivière-Verte, Lac Baker Area
4 Madawaska / North West Area 1 Kedgwick, Saint-Quentin and Grimmer
5 Restigouche Area 2 Campbellton, Atholville, Tide Head Area
5 Restigouche Area 3 Dalhousie, Balmoral, Belledune Area
6 Bathurst / Acadian Peninsula Area 4 Bathurst, Beresford, Petit-Rocher Area
6 Bathurst / Acadian Peninsula Area 5 Caraquet, Paquetville, Bertrand Area
6 Bathurst / Acadian Peninsula Area 6 Shippagan, Lamèque, Inkerman Area
6 Bathurst / Acadian Peninsula Area 7 Tracadie-Sheila, Saumarez and Saint-Isidore
7 Miramichi Area 8 Neguac, Alnwick, Burnt Church Area
7 Miramichi Area 9 Miramichi, Rogersville, Blackville Area
Source: Appendix D from My Community at a Glance 2014, Technical Document (NBHC, 2014)
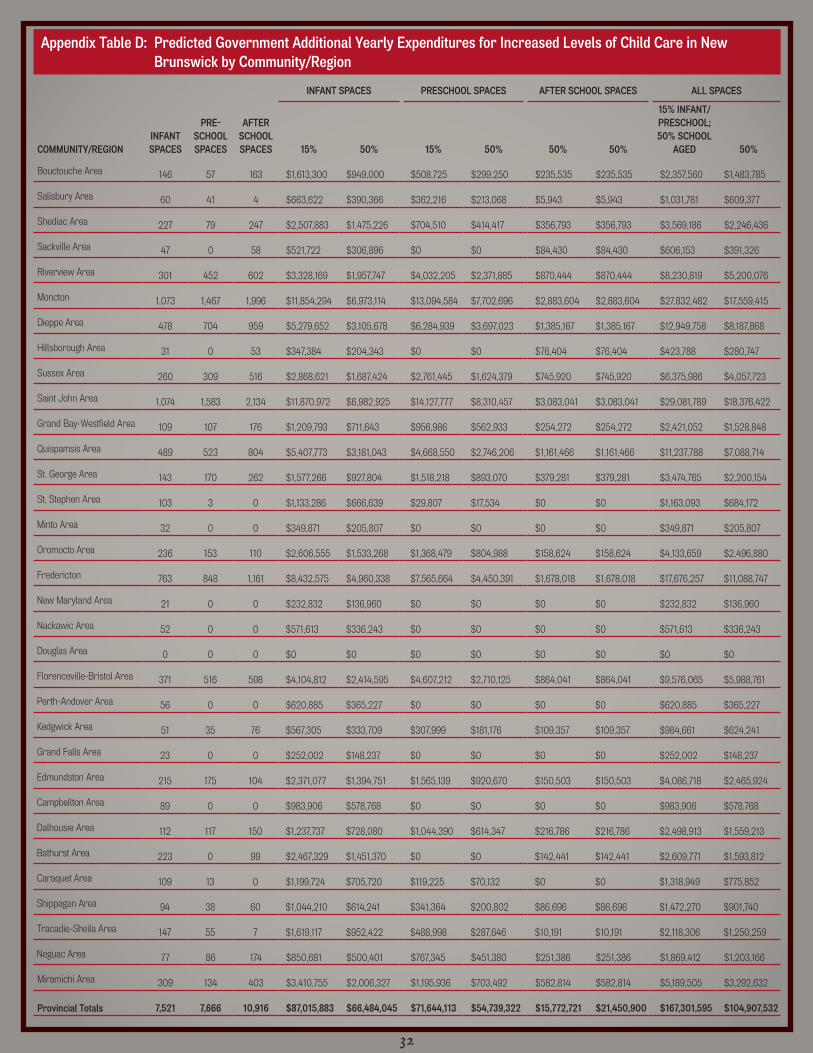
32
Appendix Table D: Predicted Government Additional Yearly Expenditures for Increased Levels of Child Care in New Brunswick by Community/Region
INFANT SPACES PRESCHOOL SPACES AFTER SCHOOL SPACES ALL SPACES
COMMUNITY/REGIONINFANT SPACES
PRE-SCHOOL SPACES
AFTER SCHOOL SPACES 15% 50% 15% 50% 50% 50%
15% INFANT/PRESCHOOL; 50% SCHOOL
AGED 50%
Bouctouche Area 146 57 163 $1,613,300 $949,000 $508,725 $299,250 $235,535 $235,535 $2,357,560 $1,483,785
Salisbury Area 60 41 4 $663,622 $390,366 $362,216 $213,068 $5,943 $5,943 $1,031,781 $609,377
Shediac Area 227 79 247 $2,507,883 $1,475,226 $704,510 $414,417 $356,793 $356,793 $3,569,186 $2,246,436
Sackville Area 47 0 58 $521,722 $306,896 $0 $0 $84,430 $84,430 $606,153 $391,326
Riverview Area 301 452 602 $3,328,169 $1,957,747 $4,032,205 $2,371,885 $870,444 $870,444 $8,230,819 $5,200,076
Moncton 1,073 1,467 1,996 $11,854,294 $6,973,114 $13,094,584 $7,702,696 $2,883,604 $2,883,604 $27,832,482 $17,559,415
Dieppe Area 478 704 959 $5,279,652 $3,105,678 $6,284,939 $3,697,023 $1,385,167 $1,385,167 $12,949,758 $8,187,868
Hillsborough Area 31 0 53 $347,384 $204,343 $0 $0 $76,404 $76,404 $423,788 $280,747
Sussex Area 260 309 516 $2,868,621 $1,687,424 $2,761,445 $1,624,379 $745,920 $745,920 $6,375,986 $4,057,723
Saint John Area 1,074 1,583 2,134 $11,870,972 $6,982,925 $14,127,777 $8,310,457 $3,083,041 $3,083,041 $29,081,789 $18,376,422
Grand Bay-Westfield Area 109 107 176 $1,209,793 $711,643 $956,986 $562,933 $254,272 $254,272 $2,421,052 $1,528,848
Quispamsis Area 489 523 804 $5,407,773 $3,181,043 $4,668,550 $2,746,206 $1,161,466 $1,161,466 $11,237,788 $7,088,714
St. George Area 143 170 262 $1,577,266 $927,804 $1,518,218 $893,070 $379,281 $379,281 $3,474,765 $2,200,154
St. Stephen Area 103 3 0 $1,133,286 $666,639 $29,807 $17,534 $0 $0 $1,163,093 $684,172
Minto Area 32 0 0 $349,871 $205,807 $0 $0 $0 $0 $349,871 $205,807
Oromocto Area 236 153 110 $2,606,555 $1,533,268 $1,368,479 $804,988 $158,624 $158,624 $4,133,659 $2,496,880
Fredericton 763 848 1,161 $8,432,575 $4,960,338 $7,565,664 $4,450,391 $1,678,018 $1,678,018 $17,676,257 $11,088,747
New Maryland Area 21 0 0 $232,832 $136,960 $0 $0 $0 $0 $232,832 $136,960
Nackawic Area 52 0 0 $571,613 $336,243 $0 $0 $0 $0 $571,613 $336,243
Douglas Area 0 0 0 $0 $0 $0 $0 $0 $0 $0 $0
Florenceville-Bristol Area 371 516 598 $4,104,812 $2,414,595 $4,607,212 $2,710,125 $864,041 $864,041 $9,576,065 $5,988,761
Perth-Andover Area 56 0 0 $620,885 $365,227 $0 $0 $0 $0 $620,885 $365,227
Kedgwick Area 51 35 76 $567,305 $333,709 $307,999 $181,176 $109,357 $109,357 $984,661 $624,241
Grand Falls Area 23 0 0 $252,002 $148,237 $0 $0 $0 $0 $252,002 $148,237
Edmundston Area 215 175 104 $2,371,077 $1,394,751 $1,565,139 $920,670 $150,503 $150,503 $4,086,718 $2,465,924
Campbellton Area 89 0 0 $983,906 $578,768 $0 $0 $0 $0 $983,906 $578,768
Dalhousie Area 112 117 150 $1,237,737 $728,080 $1,044,390 $614,347 $216,786 $216,786 $2,498,913 $1,559,213
Bathurst Area 223 0 99 $2,467,329 $1,451,370 $0 $0 $142,441 $142,441 $2,609,771 $1,593,812
Caraquet Area 109 13 0 $1,199,724 $705,720 $119,225 $70,132 $0 $0 $1,318,949 $775,852
Shippagan Area 94 38 60 $1,044,210 $614,241 $341,364 $200,802 $86,696 $86,696 $1,472,270 $901,740
Tracadie-Sheila Area 147 55 7 $1,619,117 $952,422 $488,998 $287,646 $10,191 $10,191 $2,118,306 $1,250,259
Neguac Area 77 86 174 $850,681 $500,401 $767,345 $451,380 $251,386 $251,386 $1,869,412 $1,203,166
Miramichi Area 309 134 403 $3,410,755 $2,006,327 $1,195,936 $703,492 $582,814 $582,814 $5,189,505 $3,292,632
Provincial Totals 7,521 7,666 10,916 $87,015,883 $66,484,045 $71,644,113 $54,739,322 $15,772,721 $21,450,900 $167,301,595 $104,907,532

33
Appendix Table E: Cost to Build or Renovate Child Care Centres by RegionINFANT SPACES PRESCHOOL SPACES
COMMUNITY/REGIONNUMBER OF SPACES
NEEDEDLEGISLATED REQUIRED
SPACE (M²) ESTIMATED COSTNUMBER OF SPACES
NEEDEDLEGISLATED REQUIRED
SPACE (M²) ESTIMATED COST
Bouctouche Area 146 474 $956,550 57 186 $375,628
Salisbury Area 60 195 $393,879 41 132 $266,173
Shediac Area 227 738 $1,488,503 79 257 $517,706
Sackville Area 47 153 $309,658 0 0 $0
Riverview Area 301 979 $2,633,169 452 1,468 $3,949,754
Moncton 1,073 3,487 $9,378,839 1,467 4,768 $12,826,823
Dieppe Area 478 1,553 $4,177,136 704 2,289 $6,156,423
Hillsborough Area 31 102 $206,182 0 0 $0
Sussex Area 260 844 $1,702,611 309 1,006 $2,029,237
Saint John Area 1,074 3,491 $9,392,034 1,583 5,145 $13,838,889
Grand Bay-Westfield Area 109 356 $957,160 107 348 $937,417
Quispamsis Area 489 1,591 $4,278,503 523 1,700 $4,573,086
St. George Area 143 464 $936,154 170 553 $1,115,657
St. Stephen Area 103 333 $672,639 3 11 $21,904
Minto Area 32 103 $207,659 0 0 $0
Oromocto Area 236 767 $1,547,067 153 498 $1,005,622
Fredericton 763 2,480 $6,671,655 848 2,755 $7,410,960
New Maryland Area 21 68 $184,211 0 0 $0
Nackawic Area 52 168 $339,269 0 0 $0
Douglas Area 0 0 $0 0 0 $0
Florenceville-Bristol Area 371 1,207 $2,436,326 516 1,678 $3,385,591
Perth-Andover Area 56 183 $368,514 0 0 $0
Kedgwick Area 51 167 $336,712 35 112 $226,332
Grand Falls Area 23 74 $149,571 0 0 $0
Edmundston Area 215 697 $1,407,304 175 570 $1,150,136
Campbellton Area 89 289 $583,977 0 0 $0
Dalhousie Area 112 364 $734,633 117 380 $767,466
Bathurst Area 223 726 $1,464,432 0 0 $0
Caraquet Area 109 353 $712,072 13 43 $87,612
Shippagan Area 94 307 $619,770 38 124 $250,850
Tracadie-Sheila Area 147 476 $960,994 55 178 $359,338
Neguac Area 77 250 $504,904 86 279 $563,880
Miramichi Area 309 1,003 $2,024,384 134 435 $878,829
Urban Total 4,309 14,005 $37,672,707 5,684 18,473 $49,693,354
Non-Urban Total 3,212 10,438 $21,063,763 1,982 6,443 $13,001,959
Provincial Totals 7,521 24,443 $58,736,470 7,667 24,916 $62,695,312