Embed Size (px)
Citation preview

MPRAMunich Personal RePEc Archive
Local Economic Impacts of PopularMusic Concerts
Todd Gabe and Nicholas Lisac
University of Maine
October 2013
Online at http://mpra.ub.uni-muenchen.de/65911/MPRA Paper No. 65911, posted 4. August 2015 10:31 UTC
1
LOCAL ECONOMIC IMPACTS OF POPULAR MUSIC CONCERTS
University of Maine
School of Economics (SOE) Staff Paper #612
October 2013
Todd M. Gabe ([email protected]), Professor of Economics1
Nicholas A. Lisac, Graduate Research Assistant
ABSTRACT. This study examines the local economic impacts of popular music concerts held
between 2010 and 2012 in Bangor, Maine. A regression analysis of the relationship between
monthly taxable retail sales—e.g., restaurant and lodging sales—in the Bangor region and the
number of attendees is used to estimate local spending per concertgoer on meals and
accommodations. Results suggest that an estimated 29 to 31 percent of attendees spend the night
in the local area, which is very similar to the share of concertgoers who travel more than two
hours to attend shows. The local economic impacts of 41 popular music concerts—featuring
artists such as Bob Dylan, Barenaked Ladies, Def Leppard, Jason Aldean, and Godsmack—
between 2010 and 2012 is an estimated $30.7 million in output, a yearly average of 156 full-time
and part-time jobs, and a combined $9.7 million in labor income.
Keywords: Popular Music Concerts, Economic Impact Analysis, Taxable Retail Sales, Tourism
JEL: R11, Z11, R15
Contact Information: Todd Gabe; 5782 Winslow Hall; University of Maine; Orono, ME 04469;
USA.
1 The authors would like to thank Waterfront Concerts (Alex Gray) for providing the data and assistance
needed to make this study possible.

2
LOCAL ECONOMIC IMPACTS OF POPULAR MUSIC CONCERTS
Large popular music concerts (e.g., festivals and shows by well known artists) are often
significant tourism events that create substantial fan interest and economic activity. The top 25
grossing music tours of 2012, as tracked by Billboard magazine, generated an aggregate $1.8
billion in gross revenues (i.e., ticket sales).2 More important to the places where concerts are
held, the 1,381 individual shows that made up these top-grossing tours had a combined
attendance of over 19.6 million people. The ability of popular music artists to draw fans who
reside outside the region to cities and other places where the venues are located means that
spending on concert tickets—counted in the $1.8 billion in gross revenue noted above—will be
accompanied by local expenditures on food, lodging and retail purchases.
The purpose of this study is to examine the local tourism-related expenditures made by
concertgoers and their associated multiplier effects (i.e., economic impact). The analysis focuses
on the relationship between monthly taxable retail sales—e.g., restaurant and lodging—and the
number of fans who attend concerts, which varies considerably by month of the year. Data used
in the regression analysis are from 41 outdoor shows, produced by Waterfront Concerts, that
took place between 2010 and 2012 in Bangor, Maine. These events featured acts such as Bob
Dylan, Barenaked Ladies, Def Leppard, Jason Aldean, and Godsmack, among others, which cut
across a wide range of musical tastes and genres. To put the regression results into perspective,
we use the estimated coefficients along with information on the number of tickets sold per
county in the broader region surrounding the venue to determine the “cutoff” in driving time that
2 http://www.billboard.com/articles/news/1481408/top-25-tours-of-2012, accessed on May 17, 2013.
3
separates fans who spend the night in Bangor and those who return home after the concerts. The
total economic impact, including multiplier effects, of concert-related spending in 2012 is an
estimated $16.0 million in output, 239 full- and part-time jobs, and $5.1 million in labor income.
A rich literature exists on the economic impacts of tourism events (Ritchie 1984; Long
and Perdue 1990; Tyrrell and Johnston 2001), but very few studies have looked specifically at
visitor spending related to popular music concerts (Gazel and Schwer 1997). The most common
approaches to measuring visitor spending and the economic impacts of tourism are conducting
surveys of tourists and/or local businesses, and developing expenditure models that, for example,
could be used to estimate overall visitor spending from secondary data on a measure such as
taxable lodging receipts (Frechtling 2006). The biggest challenges encountered when conducting
such studies include reducing measurement errors (e.g., survey recall and unrepresentative visitor
samples) and being able to separate “new” expenditures from spending that would have occurred
in the region even in the event’s absence (McHone and Rungeling 2000; Stynes and White
2006). For example, Tyrell and Johnston (2001) note that counting all expenditures related to a
folk festival in Newport, Rhode Island, would have overstated by almost 100 percent its “net”
economic impact, which properly accounts for the spending of locals as compared to those from
outside the region.
An article, by Gazel and Schwer (1997), examining the economic impact of the Grateful
Dead on the Las Vegas region is one of the most-cited studies on the local impacts of popular
music concerts. This study used surveys of concertgoers to estimate the overall tourism-related
(e.g., hotels, bars and restaurants, gambling) spending by non-local attendees and the
expenditures made by locals that would have leaked out of the region if the concerts had not
occurred (i.e., import substitution). After applying RIMS II multipliers to these direct spending
4
figures, Gazel and Schwer (1997) reported a total impact—based on over 50,000 concert
attendees—of between $16.9 million and $28.2 million, and an employment impact of between
346 and 590 jobs.
Several South African studies investigate the economic impact of music festivals, as
these types of events play a significant role in the tourism industry of this ‘event destination’
country (Saayman and Rossouw 2010). For example, visitor and business surveys collected
expenditure and other information related to the Klein Karoo Nasionale Kunstefees,
Grahamstown National Arts Festival, and Aardklop National Arts Festival—large multi-day
events that feature music of several genres (e.g., classical, rock, jazz) as well as visual arts.
Findings suggest that the size and the location of the host town are important factors in
determining the economic impact of the festival (Saayman and Saayman 2006). Another study
focusing on the Cape Town International Jazz Festival uses visitor surveys to dissect the
spending habits of festival-goers and quantify the regional economic impact of the event, found
to be in excess of R158 million with an employment impact of 1,059 jobs (Saayman and
Rossouw 2010).
Using methods similar to those outlined above, several reports in the “grey literature”
have examined the impacts of U.S. music concerts and festivals. For example, the 2005
Bonnaroo festival held in Coffee County, Tennessee (3 days and 76,145 attendees), the 2012
Electric Daisy Carnival in Las Vegas (3 days and 320,000 attendees), and the 2012 South by
Southwest festival in Austin (14 days and 147,000 attendees) generated economic impacts,
including multiplier effects, of $14.1 million, $207 million and $190 million in total output,
respectively (Arik and Penn 2005; Beacon Economics 2012, Greyhill Advisors and SXSW
2012). The Bonnaroo and Electric Daisy Carnival festivals had estimated employment impacts of
5
191 and 2,018 jobs. These reports—along with the Gazel and Schwer (1997) analysis of the
Grateful Dead in Las Vegas, and the studies of music festivals in South Africa—show a wide
range of economic impacts and numbers of jobs supported, even when differences in concert /
festival length and attendance figures are taken into account.
Along with the limitations of tourism event impact studies discussed above (e.g.,
measurement errors and the difficulty of identifying “new” spending to a region), Baade et al.
(2008) discuss “crowding out” and “leakages” as additional “deficiencies” of these types of
impact studies.3 Crowding out describes a phenomena by which area residents are likely to stay
away from tourism-related businesses located near the concert venue, which could reduce the
spending of locals and, therefore, offset the impacts of those involved in the event. Leakages
occur when expenditures related to an event do not translate into local economic activity. In an
analysis of the local impacts of sports teams, Siegfried and Zimbalist (2002) note that only 29
percent of NBA players live in the city where they play. For our analysis of popular music
concerts, none of the artists live in the region (i.e., Bangor, Maine) where the venue is located.
As an alternative to survey-based approaches, Baade et al. (2008) examine the impacts of
professional sports—e.g., large events and labor disputes—on the economies of selected cities in
Florida using regression analysis of taxable retail sales data. They note that taxable sales data are
“ideally suited” for the analysis of the impacts of large events because of the direct connection
between the events and tax collections (i.e., attendees purchase goods and services that are
subject to the tax) and the fact that taxable sales data are available monthly for individual
municipalities. This makes it possible to isolate the effect of narrowly focused and short-term
3 Baade et al. (2008) also discuss the “substitution effect,” which is similar to the challenge of measuring
“new” economic activity to the area (McHone and Rungeling 2000; Tyrrell and Johnston 2001).

6
events on local economic activity. Taxable retail sales data have also been used to examine,
among other things, the impacts of sports teams and events in Texas (Coates and Depken 2006),
and a ban on indoor smoking in New York City (Hyland et al. 1999).
The empirical analysis presented in this paper uses an approach similar to those
employed in these studies that focus on taxable retail sales data. The next section of the paper
describes our conceptual framework and data on retail sales and popular music concerts in
Bangor, Maine, and this section is followed by the regression results. After that, we use the
estimated coefficients of the regression analysis to estimate the percentage of concertgoers who
purchase lodging in the Bangor area, which we relate to the distances that visitors travel to the
venue, and discuss the overall economic impact of popular music concerts. The final section of
the paper provides a summary and conclusions.
7
REGRESSION MODELS AND DATA
The following two regression models are used to examine the relationship between
taxable restaurant and lodging sales, respectively, and the number of attendees at music concerts
in a given month (t):
(1) Restaurantt = 0 + 1Concert Attendeest + 2Casino Activityt +
3General Merchandise Salest + 4Restaurant Elsewheret + t
(2) Lodgingt = 0 + 1Concert Attendeest + 2Casino Activityt +
3General Merchandise Salest + 4Lodging Elsewheret + t
The dependent variables in the two regression models—Restaurantt and Lodgingt—are monthly
values for restaurant and lodging taxable retail sales in the Bangor Economic Summary Area
(ESA). The data cover the time periods of January 2000 to September 2012 and, in a separate
analysis, January 2004 to September 2012.4 The Bangor ESA includes the city itself and some
surrounding communities. The restaurant sales variable has an average value of $14.2 million
between January 2000 and November 2012, and the measure of lodging sales has an average
value of $2.63 million over the same period.
The explanatory variable of key interest, labeled as Concert Attendeest, is the number of
fans who attended concert events. As noted in the introduction, Waterfront Concerts has
produced 41 shows between 2010 (its inaugural year) and 2012, with the concerts taking place
during “warm weather” months.5 Between July of 2010 (the month of the first show) and
September of 2012 (the month of the last show in 2012), a total of 15 months had shows and the
busiest month, with a total of six concerts, was September of 2011 (B.B. King, Carnival of
4 The shorter time period includes fewer months prior to the first concert, which happened in July of 2010.
5 The concert venue is an outdoor pavilion. Shows took place between July and October, April and
September, and May and September, in 2010, 2011 and 2012, respectively.
8
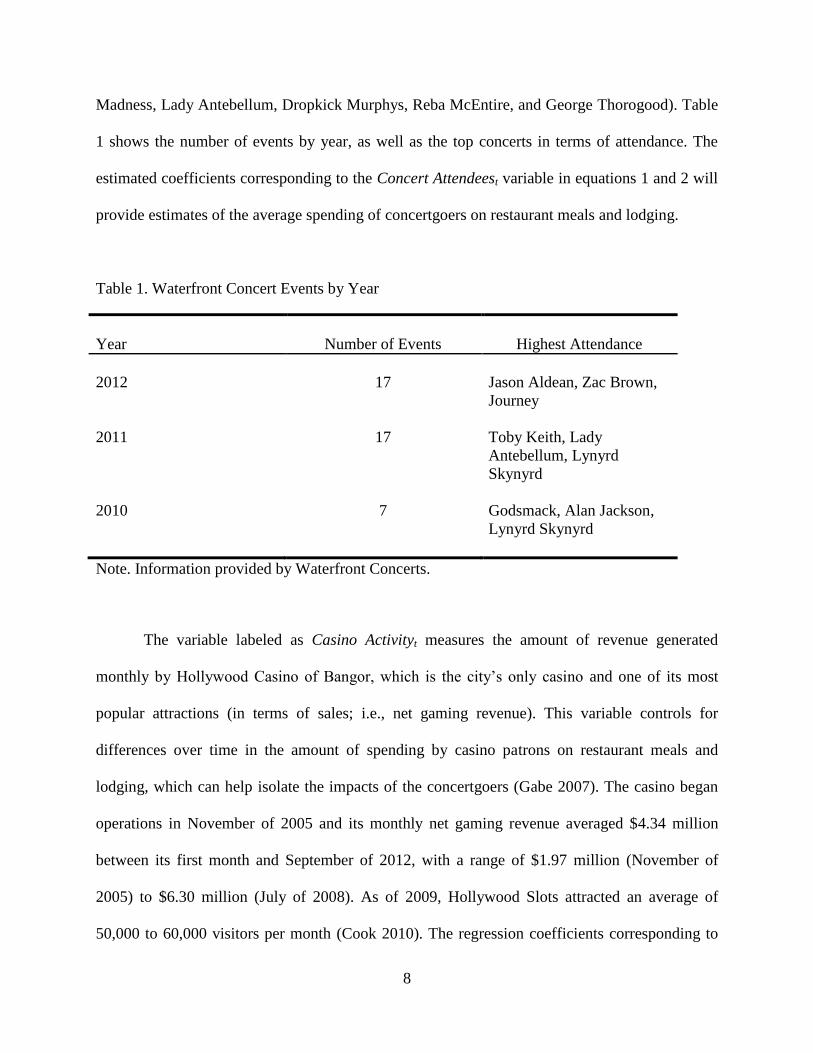
Madness, Lady Antebellum, Dropkick Murphys, Reba McEntire, and George Thorogood). Table
1 shows the number of events by year, as well as the top concerts in terms of attendance. The
estimated coefficients corresponding to the Concert Attendeest variable in equations 1 and 2 will
provide estimates of the average spending of concertgoers on restaurant meals and lodging.
Table 1. Waterfront Concert Events by Year
Year Number of Events Highest Attendance
2012 17 Jason Aldean, Zac Brown,
Journey
2011 17 Toby Keith, Lady
Antebellum, Lynyrd
Skynyrd
2010 7 Godsmack, Alan Jackson,
Lynyrd Skynyrd
Note. Information provided by Waterfront Concerts.
The variable labeled as Casino Activityt measures the amount of revenue generated
monthly by Hollywood Casino of Bangor, which is the city’s only casino and one of its most
popular attractions (in terms of sales; i.e., net gaming revenue). This variable controls for
differences over time in the amount of spending by casino patrons on restaurant meals and
lodging, which can help isolate the impacts of the concertgoers (Gabe 2007). The casino began
operations in November of 2005 and its monthly net gaming revenue averaged $4.34 million
between its first month and September of 2012, with a range of $1.97 million (November of
2005) to $6.30 million (July of 2008). As of 2009, Hollywood Slots attracted an average of
50,000 to 60,000 visitors per month (Cook 2010). The regression coefficients corresponding to
9
the Casino Activityt variable in equations 1 and 2 will provide estimates of the average
expenditures on restaurant meals and lodging per $1.00 spent at the casino in Bangor.
The variable labeled as General Merchandise Salest is used to control for the amount of
money spent per month in department stores (e.g., Macy’s and JC Penney) and general
merchandise retailers (e.g., Wal-Mart and Target) located in the Bangor ESA. This variable has
an average value of $34.7 million per month between January 2000 and September 2012.
General merchandise sales were 10.00 times larger than lodging sales in Bangor in 2012, which
is much higher than the statewide ratio of 4.21 (general merchandise sales divided by lodging
sales). This suggests that, compared to the state as a whole, Bangor is more aptly characterized
as a “shopping center” than a vacation destination. The Bangor region tends to capture retail
activity from areas in northern Maine and parts of Atlantic Canada, and the extent to which these
shoppers also spend money in restaurants and lodging establishments is captured by the
explanatory variable measuring the amount of general merchandise sales per month.
The final explanatory variables included in regression equations 1 and 2—Restaurant
Elsewheret and Lodging Elsewheret—account for the amounts of monthly restaurant and lodging
sales occurring outside of the Bangor ESA, but elsewhere in Maine. These variables control for
overall economic conditions in Maine’s hospitality sector, which would affect sales in the
Bangor region, as well as broader macroeconomic trends and seasonal swings in restaurant and
lodging sales.
10
REGRESSION RESULTS
Table 2 presents regression results on the effects of popular music concert attendees on
taxable restaurant and lodging sales in the Bangor ESA. Two sets of estimates are presented for
each of the dependent variables: the first set of results is based on 153 months of data from
January of 2000 to September of 2012, while the second set of results is based on 105 monthly
observations (starting in January of 2004). The values in parentheses are Newey-West (1987)
robust standard errors, used to correct for heteroskedasticity and serial correlation that are often
present in time series regression models. Overall, the explanatory variables used in the models
explain the month-to-month variation in hospitality spending well, with adjusted r-squared
values ranging between 0.72 and 0.83.
The regression results show a positive and statistically significant relationship between
monthly taxable restaurant sales and the number of concert attendees. More specifically, the
estimated coefficients corresponding to the Concert Attendeest variable suggest that a one-person
increase in concert attendance is associated with between $33.81 and $44.53 in additional
restaurant sales. Other results from the analysis of taxable restaurant sales in the Bangor ESA
uncover positive and statistical significant associations with gaming activity at the local casino,
general merchandise sales, and restaurant sales elsewhere in Maine. Although figures are not
publicly available for the average amount spent per person at the casino, the regression results
suggest that a patron spending $90.00 at Hollywood Casino would spend between $24.21 and
$37.89 on restaurant meals in the Bangor area.6
6 The 2012 “State of the States” report by the American Gaming Association shows that Maine (i.e.,
Hollywood Casino) had $59.45 million in gaming revenue in 2011. This amount applied to an estimated
55,000 visitors per month (Cook 2010) translates into an average expenditure of about $90.00 per patron.
11
Table 2. Regression Results: Effects of Waterfront Concert Attendees on Local Hospitality Sales
Estimated Coefficients
Variable Restaurant Sales Lodging Sales
Intercept 8,763,805* 9,898,039* 1,481,578* 1,688,402*
(313,213) (297,396) (93,761) (133,529)
Concert 33.81* 44.53* 18.92* 23.12*
Attendees (9.673) (10.01) (6.052) (5.752)
Casino 0.421* 0.269* 0.127* 0.096*
Activity (0.056) (0.038) (0.018) (0.021)
General 0.008* 0.006* -0.78D-04 -0.0002
Merchandise Sales (0.001) (0.001) (0.0004) (0.0005)
Lodging NA NA 0.018* 0.017*
Elsewhere (0.001) (0.001)
Restaurant 0.019* 0.019* NA NA
Elsewhere (0.002) (0.002)
Adjusted R-squared 0.791 0.716 0.827 0.789
Number of 153 105 153 105
Observations
Notes. Newey-West (1987) standard errors are in parentheses. The superscript * indicates
statistical significance at a 1-percent level.
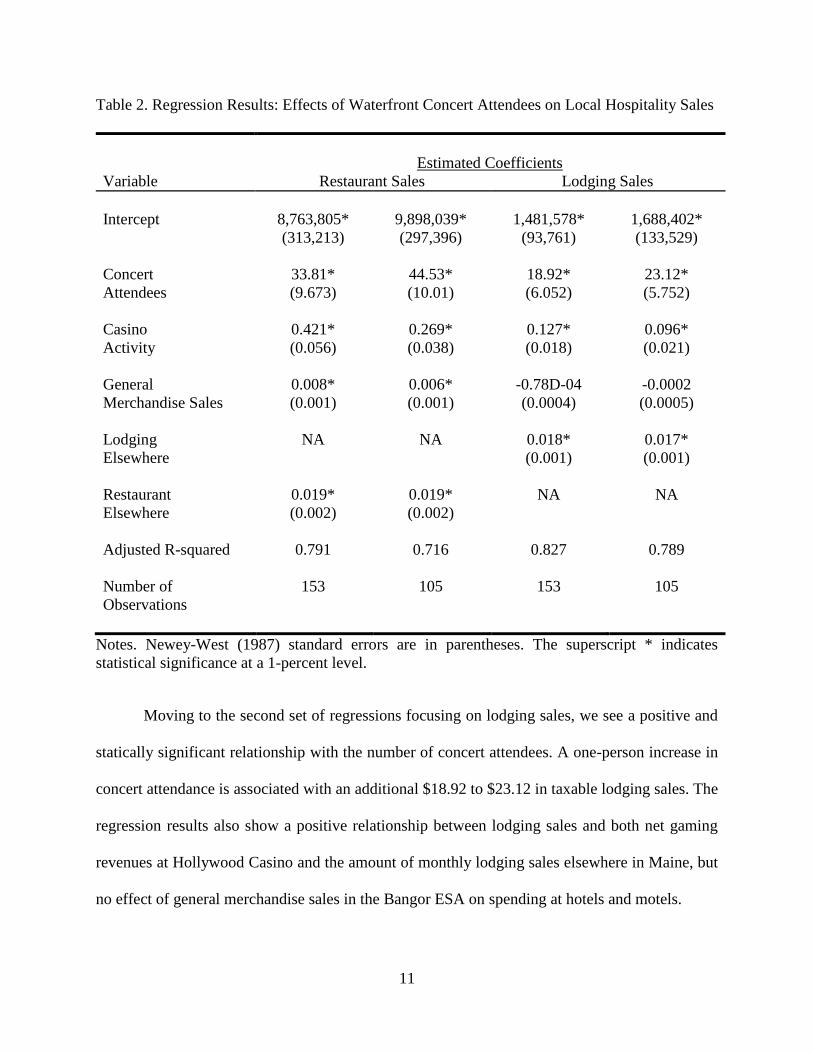
Moving to the second set of regressions focusing on lodging sales, we see a positive and
statically significant relationship with the number of concert attendees. A one-person increase in
concert attendance is associated with an additional $18.92 to $23.12 in taxable lodging sales. The
regression results also show a positive relationship between lodging sales and both net gaming
revenues at Hollywood Casino and the amount of monthly lodging sales elsewhere in Maine, but
no effect of general merchandise sales in the Bangor ESA on spending at hotels and motels.

12
The estimated coefficient corresponding to the Casino Activityt variable suggests that a
patron spending $90.00 at Hollywood Casino would spend an average of $8.64 to $11.43 on
lodging. A comparison of this effect (midpoint of $10.04) to the marginal effect on lodging
associated with concertgoers (midpoint of the two estimates equals $21.02) suggests that concert
attendees spend 109.4 percent more on lodging; that is, concertgoers are about 2.1 times more
likely than casino visitors to spend the night in the Bangor ESA. A similar analysis focusing on
restaurant sales indicates that concert attendees spend 26.2 percent more than Hollywood Slots
patrons on meals. The regression results pertaining to the General Merchandise Salest variable
suggest that, although shopping and eating in restaurants appear to be complementary activities
for some, the amount of general merchandise sales occurring in a month has no bearing on sales
at local hotels and motels.
13
ECONOMIC IMPACT ANALYSIS
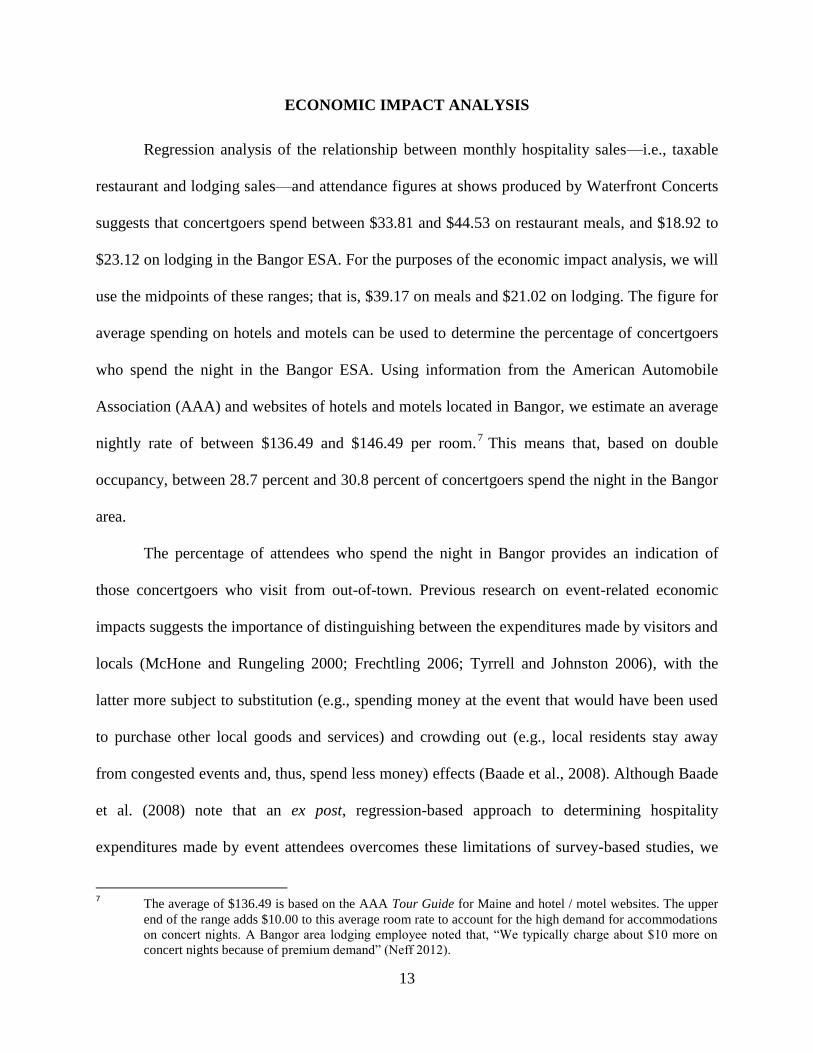
Regression analysis of the relationship between monthly hospitality sales—i.e., taxable
restaurant and lodging sales—and attendance figures at shows produced by Waterfront Concerts
suggests that concertgoers spend between $33.81 and $44.53 on restaurant meals, and $18.92 to
$23.12 on lodging in the Bangor ESA. For the purposes of the economic impact analysis, we will
use the midpoints of these ranges; that is, $39.17 on meals and $21.02 on lodging. The figure for
average spending on hotels and motels can be used to determine the percentage of concertgoers
who spend the night in the Bangor ESA. Using information from the American Automobile
Association (AAA) and websites of hotels and motels located in Bangor, we estimate an average
nightly rate of between $136.49 and $146.49 per room.7 This means that, based on double
occupancy, between 28.7 percent and 30.8 percent of concertgoers spend the night in the Bangor
area.
The percentage of attendees who spend the night in Bangor provides an indication of
those concertgoers who visit from out-of-town. Previous research on event-related economic
impacts suggests the importance of distinguishing between the expenditures made by visitors and
locals (McHone and Rungeling 2000; Frechtling 2006; Tyrrell and Johnston 2006), with the
latter more subject to substitution (e.g., spending money at the event that would have been used
to purchase other local goods and services) and crowding out (e.g., local residents stay away
from congested events and, thus, spend less money) effects (Baade et al., 2008). Although Baade
et al. (2008) note that an ex post, regression-based approach to determining hospitality
expenditures made by event attendees overcomes these limitations of survey-based studies, we
7 The average of $136.49 is based on the AAA Tour Guide for Maine and hotel / motel websites. The upper
end of the range adds $10.00 to this average room rate to account for the high demand for accommodations
on concert nights. A Bangor area lodging employee noted that, “We typically charge about $10 more on
concert nights because of premium demand” (Neff 2012).
14
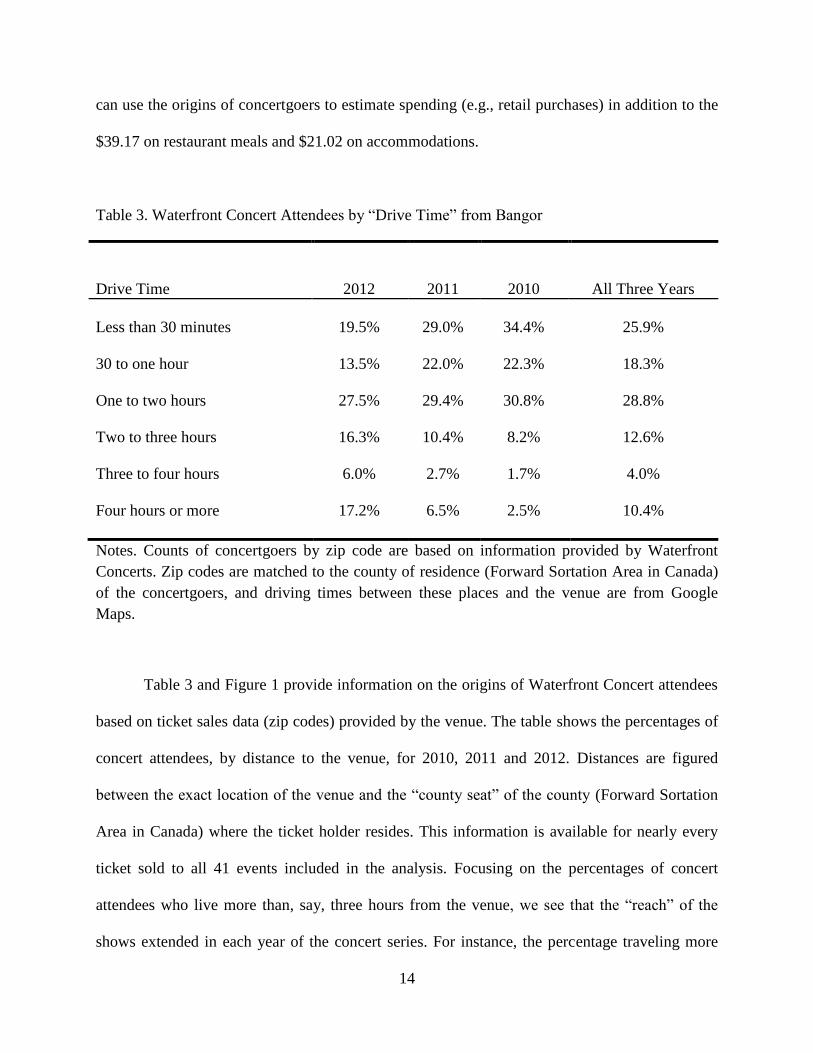
can use the origins of concertgoers to estimate spending (e.g., retail purchases) in addition to the
$39.17 on restaurant meals and $21.02 on accommodations.
Table 3. Waterfront Concert Attendees by “Drive Time” from Bangor
Drive Time 2012 2011 2010 All Three Years
Less than 30 minutes 19.5% 29.0% 34.4% 25.9%
30 to one hour 13.5% 22.0% 22.3% 18.3%
One to two hours 27.5% 29.4% 30.8% 28.8%
Two to three hours 16.3% 10.4% 8.2% 12.6%
Three to four hours 6.0% 2.7% 1.7% 4.0%
Four hours or more 17.2% 6.5% 2.5% 10.4%
Notes. Counts of concertgoers by zip code are based on information provided by Waterfront
Concerts. Zip codes are matched to the county of residence (Forward Sortation Area in Canada)
of the concertgoers, and driving times between these places and the venue are from Google
Maps.
Table 3 and Figure 1 provide information on the origins of Waterfront Concert attendees
based on ticket sales data (zip codes) provided by the venue. The table shows the percentages of
concert attendees, by distance to the venue, for 2010, 2011 and 2012. Distances are figured
between the exact location of the venue and the “county seat” of the county (Forward Sortation
Area in Canada) where the ticket holder resides. This information is available for nearly every
ticket sold to all 41 events included in the analysis. Focusing on the percentages of concert
attendees who live more than, say, three hours from the venue, we see that the “reach” of the
shows extended in each year of the concert series. For instance, the percentage traveling more
15
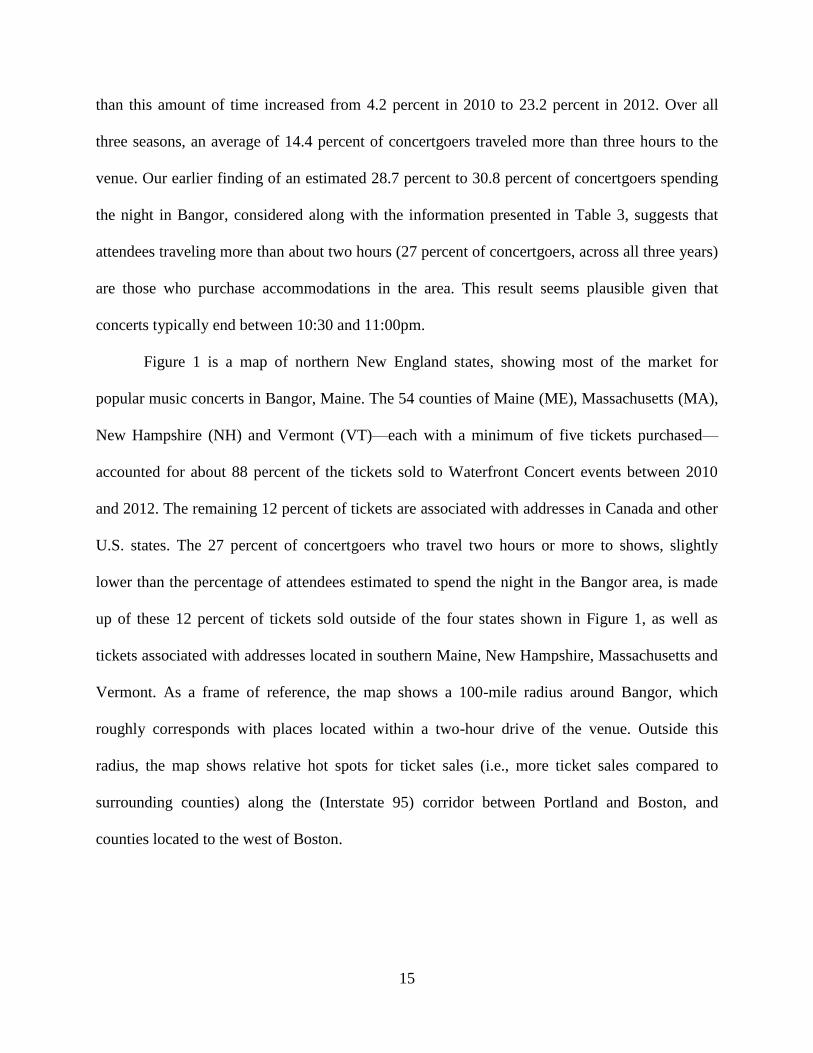
than this amount of time increased from 4.2 percent in 2010 to 23.2 percent in 2012. Over all
three seasons, an average of 14.4 percent of concertgoers traveled more than three hours to the
venue. Our earlier finding of an estimated 28.7 percent to 30.8 percent of concertgoers spending
the night in Bangor, considered along with the information presented in Table 3, suggests that
attendees traveling more than about two hours (27 percent of concertgoers, across all three years)
are those who purchase accommodations in the area. This result seems plausible given that
concerts typically end between 10:30 and 11:00pm.
Figure 1 is a map of northern New England states, showing most of the market for
popular music concerts in Bangor, Maine. The 54 counties of Maine (ME), Massachusetts (MA),
New Hampshire (NH) and Vermont (VT)—each with a minimum of five tickets purchased—
accounted for about 88 percent of the tickets sold to Waterfront Concert events between 2010
and 2012. The remaining 12 percent of tickets are associated with addresses in Canada and other
U.S. states. The 27 percent of concertgoers who travel two hours or more to shows, slightly
lower than the percentage of attendees estimated to spend the night in the Bangor area, is made
up of these 12 percent of tickets sold outside of the four states shown in Figure 1, as well as
tickets associated with addresses located in southern Maine, New Hampshire, Massachusetts and
Vermont. As a frame of reference, the map shows a 100-mile radius around Bangor, which
roughly corresponds with places located within a two-hour drive of the venue. Outside this
radius, the map shows relative hot spots for ticket sales (i.e., more ticket sales compared to
surrounding counties) along the (Interstate 95) corridor between Portland and Boston, and
counties located to the west of Boston.

16
17
The direct impact of the Waterfront Concerts is determined by the spending of
concertgoers on meals, accommodations and retail purchases, as well as spending on concert
tickets. Average spending on meals and lodging are an estimated $39.17 and $21.02,
respectively, based on the regression analysis. The average spending on retail purchases is
estimated using an expenditure ratio model, as described by Frechtling (2006). The basic
approach is to use visitor survey data to determine the ratio of expenditures on retail purchases
relative to lodging expenditures, and then apply this ratio to our estimates of lodging
expenditures from the regression analysis. The ratio of retail to lodging expenditures is 0.74 for
overnight leisure travelers, based on a 2010 Maine visitor research study (Davidson-Peterson
Associates 2011). Using this ratio, we estimate that concert attendees spend an average of $15.55
on retail purchases in addition to the $21.02 spent on accommodations.
The final component of expenditures considered in the economic impact analysis is
spending on the concert ticket itself. As is the case for many types of special events, the ticket
prices vary considerably depending on the seat location and specific show. For example, the
price of a single ticket for a Sting (Summer 2013) concert ranges from $63.25 to $103.25, while
the ticket price for a Daughtry (with 3 Doors Down and Halestorm) show ranges from $31.75
(lawn seats) to $67.75. The economic impact analysis is based on ticket sales data provided by
the venue, but the total amount of ticket revenue is not counted in the direct impact. This is
because the revenue generated by a show is used to pay the artist(s), as well as to cover local
expenditures such as concert operations and security.
As noted above, a study on the local impacts of professional sports by Baade et al. (2008)
suggests that “leakages” can be a source of (upward) bias on economic impact results. The logic
here is that spending that takes place during a major event “may not wind up in the pockets of
18
local residents” (Baade et al. 2008, p. 797). This is likely to be the case with the revenues
generated from concert ticket sales that are used to cover the costs of bringing the artists to town.
Whereas much of the spending that covers concert operations such as security, grounds keeping
and food concessions is indeed “local,” payments made to artists leak from the region when the
tour bus crosses the city line. Our treatment of removing the payments made to artists from
concert expenditures addresses the issue of leakages believed to be a source of bias in some
event impact studies.
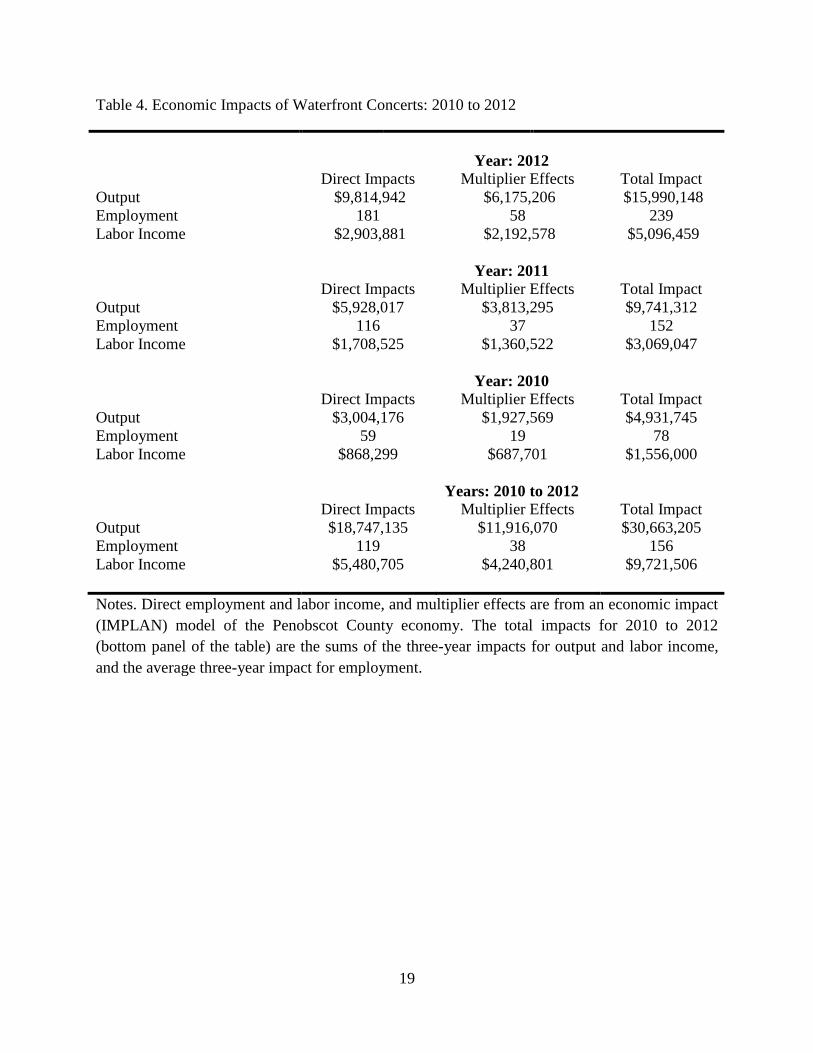
Table 4 shows results on the economic impact of popular music concerts in Bangor,
Maine, taking place in 2010, 2011 and 2012, as well as aggregate three-year impacts. As noted
above, the direct impacts are the estimated spending on restaurant meals, accommodations and
retail purchases, as well as the spending on concert tickets that does not cover the costs of the
artist(s). The multiplier (indirect and induced impacts) effects are estimated using the IMPLAN
input-output model of the Penobscot Count, Maine, economy. The results show that in 2012 the
Waterfront Concerts had an economic impact, including multiplier effects, of an estimated $16.0
million in output, 239 full- and part-time jobs, and $5.1 million in labor income. The economic
impacts grew between 2010 and 2012 due to increases in the number of shows—from 7 to 17—
as well as the growth in the percentage of concertgoers who reside from outside the region (and,
thus, spend the night as part of the concert experience). The results show that, over the first three
years of the series, the concerts had an economic impact, including multiplier effects, of an
estimated $30.7 million in output, a yearly average of 156 full-time and part-time jobs, and a
combined $9.7 million in labor income over the period.
19
Table 4. Economic Impacts of Waterfront Concerts: 2010 to 2012
Year: 2012
Direct Impacts Multiplier Effects Total Impact
Output $9,814,942 $6,175,206 $15,990,148
Employment 181 58 239
Labor Income $2,903,881 $2,192,578 $5,096,459
Year: 2011
Direct Impacts Multiplier Effects Total Impact
Output $5,928,017 $3,813,295 $9,741,312
Employment 116 37 152
Labor Income $1,708,525 $1,360,522 $3,069,047
Year: 2010
Direct Impacts Multiplier Effects Total Impact
Output $3,004,176 $1,927,569 $4,931,745
Employment 59 19 78
Labor Income $868,299 $687,701 $1,556,000
Years: 2010 to 2012
Direct Impacts Multiplier Effects Total Impact
Output $18,747,135 $11,916,070 $30,663,205
Employment 119 38 156
Labor Income $5,480,705 $4,240,801 $9,721,506
Notes. Direct employment and labor income, and multiplier effects are from an economic impact
(IMPLAN) model of the Penobscot County economy. The total impacts for 2010 to 2012
(bottom panel of the table) are the sums of the three-year impacts for output and labor income,
and the average three-year impact for employment.
20
SUMMARY AND CONCLUSIONS
Popular music concerts can have sizable local economic impacts by attracting fans from
outside the region and capturing the spending of local residents who might have otherwise left
the area to see their favorite artists. In 2012, the top 25 grossing popular music tours generated
$1.8 billion in ticket sales (see endnote 1). Along with the money spent on tickets, concertgoers
make expenditures on hotels and motels, food and beverages, and retail purchases. The types of
spending that they attract, along with the large-scale—yet temporary—nature of concerts, makes
analyzing the impacts of popular music shows similar to examining the impacts of other types of
tourism events.
The purpose of this study is to examine the local economic impacts of three seasons of
popular music concerts—including artists such as REO Speedwagon, Jason Mraz, Gov’t Mule
and Big Time Rush—held in Bangor, Maine. Insights from previous studies on the impacts of
tourism events were used to inform our estimates of the direct spending of concertgoers. First, an
econometric-based analysis of the relationship between monthly taxable retail sales and the
number of concert attendees provided an estimate of the average lodging and restaurant sales
associated with the concerts. Baade et al. (2008) note that an analysis of local taxable retail sales
is ideal to examine the impact of large events, as such an approach helps address the issues of
“crowding out” and “substitution” effects that characterize many survey-based tourism impact
studies. In our case, if the concert-related expenditures would have otherwise occurred even in
absence of the shows, the regression analysis would have likely revealed no statistical
relationship between taxable retail sales and the number of individuals attending concerts. The
positive impacts revealed by our regression analysis suggest that the concerts attracted new
spending into the region.
21
A comparison of our regression results to information about where concertgoers reside
suggests that a driving time of about two hours is the cut-off for people who spend the night in
the Bangor area versus those who drive home after a show. Although surveys of concertgoers
would be needed to determine exactly who spends the night in the Bangor region, a finding of
“all” or “none” of the concertgoers staying in Bangor would not seem plausible: our result of
between 29 and 31 percent of the attendees—roughly equivalent to those located more than
about two hours away—staying in Bangor seems realistic given the nature of the events (e.g.,
concerts end between 10:30 and 11pm) and the popularity of the artists, which enhances their
ability to attract fans from outside the local area.
Another insight from previous studies on the impacts of tourist events informed our use
of an expenditure ratio model to estimate retail spending associated with concertgoers. This
approach, outlined by Frechtling (2006), involved calculating the ratio of retail purchases to
lodging expenditures from a statewide visitor survey, and then applying this ratio to our
estimates for average lodging expenditures from the regression analysis. A third insight from
other “large event” impact studies was to consider the possibility of bias resulting from
“leakages.” As described by Baade et al. (2008), spending related to visitor events—in their case,
professional sports—may leak from the area if the event participants live outside the area. In our
case of popular music concerts, the fact that artists are coming from outside the Bangor area
means that counting the entire spending on concert tickets would result in an upward bias of the
estimated impact. Instead, our impact analysis uses data on concert-related expenditures not
including the amount provided to the artist(s).
Following these best practices as suggested by previous tourism and large-event impact
studies, our results indicate that the Bangor Waterfront Concerts had an overall economic impact

22
in 2012, including multiplier effects, of an estimated $16.0 million in output, 239 full- and part-
time jobs, and $5.1 million in labor income. The impact of 41 popular music shows between
2010 and 2012 is an estimated $30.7 million in output, an average of 156 full-time and part-time
jobs, and a combined $9.7 million in labor income. These results suggest that popular recording
artists bring economic activity, along with the music they play, to the places where they perform.
23
REFERENCES
American Gaming Association (2012). “2012 State of the States: The AGA Survey of Casino
Entertainment.” (http://www.americangaming.org/sites/default/files/uploads/docs/sos/
aga_sos_2012_web.pdf).
Arik, Murat, and David A. Penn (2005). “Economic Impact of Bonnaroo Music Festival on
Coffee County.” Business and Economic Research Center, Jennings A. Jones College of
Business, Middle Tennessee State University. (http://capone.mtsu.edu/berc/pdfs/
bonnaroo2005.pdf).
Baade, Robert A., Robert Baumann, and Victor A. Matheson (2008). “Selling the Game:
Estimating the Economic Impact of Professional Sports through Taxable Sales.” Southern
Economic Journal, 74(3): 794-810.
Beacon Economics (2012). “Electric Daisy Carnival, Las Vegas 2012: Economic Impact
Analysis.” (http://insomniac.com/reports/EDC_Las_Vegas_2011.pdf).
Coates, Dennis, and Craig A. Depken (2006). “Mega-Events: Is the Texas-Baylor Game to Waco
What the Super Bowl is to Houston?” Working Paper Series, Paper No. 06-06,
International Association of Sports Economics.
24
Cook, Robert M (2010). “A Q&A with John Osborne, GM of Hollywood Slots.” Mainebiz, April
1 (http://www.mainebiz.biz/article/20100401/NEWS01/304019995).
Davidson-Peterson Associates (2011). “Maine Office of Tourism Visitor Tracking Research
2010 Annual Report.” (http://www.visitmaine.com/resource/visitmaine/vault/
application/2010annualreport-final.pdf)
Frechtling, Douglas C. (2006). “An Assessment of Visitor Expenditure Methods and Models.”
Journal of Travel Research, 45(1): 26-35.
Gabe, Todd (2007). “Effects of Hollywood Slots on Bangor-Area Restaurant and Lodging
Sales.” School of Economics, University of Maine, Staff Paper 568.
Gazel, Ricardo C., and R. Keith Schwer (1997). “Beyond Rock and Roll: The Economic Impact
of the Grateful Dead on a Local Economy.” Journal of Cultural Economics, 21(1): 41-55.
Greyhill Advisors and SXSW (2012). “2012 South by Southwest City of Austin Economic
Impact Analysis.” (http://sxsw.com/sites/default/files/attachments/2012%20SXSW%20
Economic%20Impact%20Analysis%20-%20FINAL.pdf).
Hyland, Andrew, K. Michael Cummings, and Eric Nauenberg (1999). “Analysis of Taxable
Sales Receipts: Was New York City’s Smoke-Free Air Act Bad for Restaurant
Business?” Journal of Public Health Management and Practice, 5(1): 14-21.
25
Long, Patrick T., and Richard R. Perdue (1990). “The Economic Impact of Rural Festivals and
Special Events: Assessing the Spatial Distribution of Expenditures.” Journal of Travel
Research, 28(4): 10-14.
McHone, W. Warren, and Brian Rungeling (2000). “Practical Issues in Measuring the Impact of
a Cultural Tourist Event in a Major Tourist Destination.” Journal of Travel Research,
38(3): 300-302.
Neff, Andrew (2012). “Waterfront Concert series has increasing ‘ripple effect’ for hotels,
restaurants.” Bangor Daily News, October 3.
Newey, Whitney, and Kenneth West (1987). “A Simple, Positive Semi-Definite,
Heteroskedasticity and Autocorrelation Consistent Covariance Matrix.” Econometrica,
55(3): 703-708.
Ritchie, J.R. Brent (1984). “Assessing the Impact of Hallmark Events: Conceptual and Research
Issues.” Journal of Travel Research, 23(1): 2-11.
Saayman, Melville, and Andrea Saayman (2006). “Does the Location of Arts Festivals Matter for
the Economic Impact?” Papers in Regional Science, 85(4): 569-584.
26
Saayman, Melville, and Riaan Rossouw (2010). “The Cape Town International Jazz Festival:
More than Just Jazz.” Development Southern Africa, 27(2): 255-272.
Siegfried, John, and Andrew Zimbalist (2002). “A Note on the Local Economic Impact of Sports
Expenditures.” Journal of Sports Economics, 3(4): 361-366.
Stynes, Daniel J., and Eric M. White (2006). “Reflections on Measuring Recreation and Travel
Spending.” Journal of Travel Research, 45(1): 8-16.
Tyrrell, Timothy J., and Robert J. Johnston (2001). “A Framework for Assessing Direct
Economic Impacts of Tourism Events: Distinguishing Origins, Destinations, and Causes
of Expenditures.” Journal of Travel Research, 40(1): 94-100.