Embed Size (px)
Citation preview
Chico Municipal Airport
Catchment Area AnalysisResults

2
• Chico market overview 4
• Comparative market analysis 9
• Regional airport discussion 14
• CIC catchment area results 19
Table of Contents
3
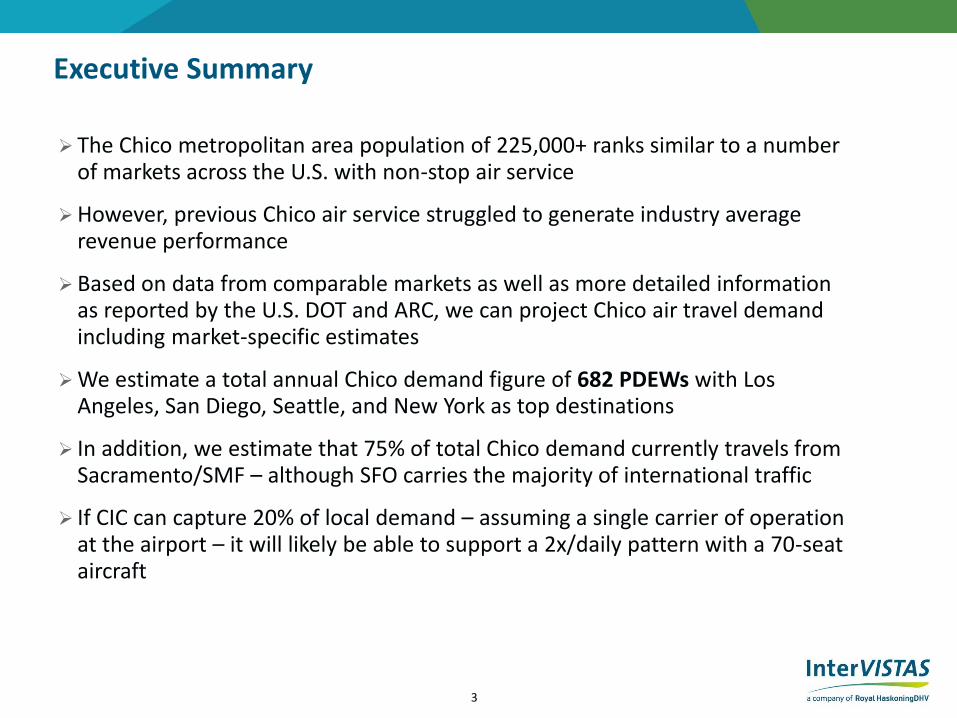
The Chico metropolitan area population of 225,000+ ranks similar to a number of markets across the U.S. with non-stop air service
However, previous Chico air service struggled to generate industry average revenue performance
Based on data from comparable markets as well as more detailed information as reported by the U.S. DOT and ARC, we can project Chico air travel demand including market-specific estimates
We estimate a total annual Chico demand figure of 682 PDEWs with Los Angeles, San Diego, Seattle, and New York as top destinations
In addition, we estimate that 75% of total Chico demand currently travels from Sacramento/SMF – although SFO carries the majority of international traffic
If CIC can capture 20% of local demand – assuming a single carrier of operation at the airport – it will likely be able to support a 2x/daily pattern with a 70-seat aircraft
Executive Summary

Chico market overview
5
100
120
140
160
180
200
220
240
2000 2001 2002 2003 2004 2005 2006 2007 2008 2009 2010 2011 2012 2013 2014 2015
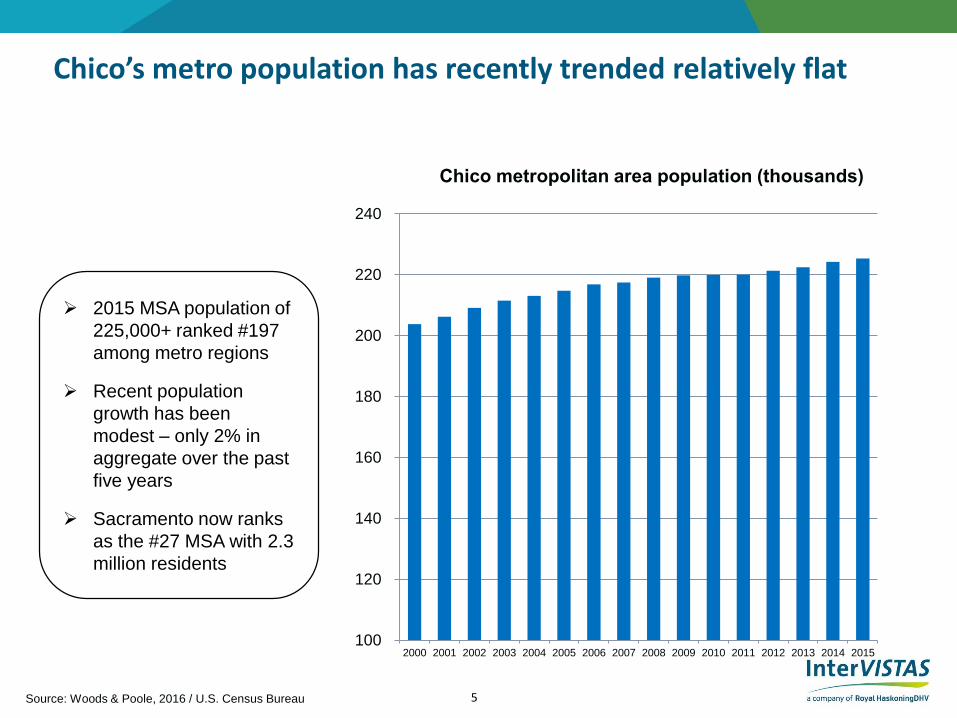
Chico’s metro population has recently trended relatively flat
Chico metropolitan area population (thousands)
Source: Woods & Poole, 2016 / U.S. Census Bureau
2015 MSA population of
225,000+ ranked #197
among metro regions
Recent population
growth has been
modest – only 2% in
aggregate over the past
five years
Sacramento now ranks
as the #27 MSA with 2.3
million residents

6
-
20
40
60
80
100
120
140
0.0
0.5
1.0
1.5
2.0
2.5
3.0
3.5
4.0
4.5
2004 2005 2006 2007 2008 2009 2010 2011 2012 2013 2014
Daily departures Daily seats
Scheduled service from Chico ceased in 2014
Deps SeatsCIC average daily service capacity
All recent service was
branded as United with
30-seat EMB-120 turbo
prop aircraft
Service levels had been
reduced prior to the
4Q14 cessation of
service
Source: Innovata schedule data via Diio online portal

7
Chico’s load factor trailed overall domestic averages …
Chico’s rolling 12 month
load factor at the
cessation of service was
just under 63%
Overall domestic
industry load factor has
plateaued at 85%
Service patterns and
local fares can directly
impact these figures
CIC/U.S. rolling 12 month load factor data
0%
10%
20%
30%
40%
50%
60%
70%
80%
90%
100%
'03 '06 '09 '12 '14
CIC U.S. aggregate
Source: US DOT/T100 data via Diio online portal

8
…while fares had improved by the cessation of service
CIC rolling four quarter domestic faresAdjusted to 1,000 miles
Chico domestic fares
trailed US averages
through much of their
service period
However, fare
performance exceeded
domestic averages* by
2013-14 (on reduced
service levels)
$0
$50
$100
$150
$200
$250
2003 2006 2009 2012 2014
CIC US
Source: US DOT O&D data via Diio online portal
* All data and comparisons adjusted to 1,000 mile stage length

Comparative market analysis
10
180
190
200
210
220
230
240
250
260
YKM BGM CLL YUM CIC TYR RST SPI FLO
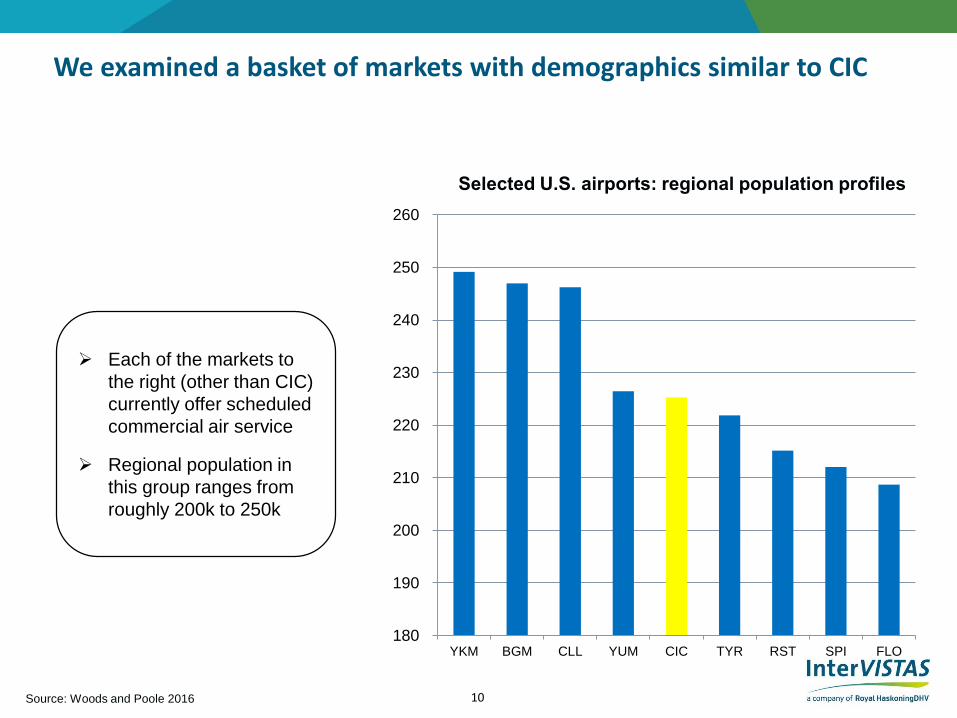
We examined a basket of markets with demographics similar to CIC
Selected U.S. airports: regional population profiles
Source: Woods and Poole 2016
Each of the markets to
the right (other than CIC)
currently offer scheduled
commercial air service
Regional population in
this group ranges from
roughly 200k to 250k
11
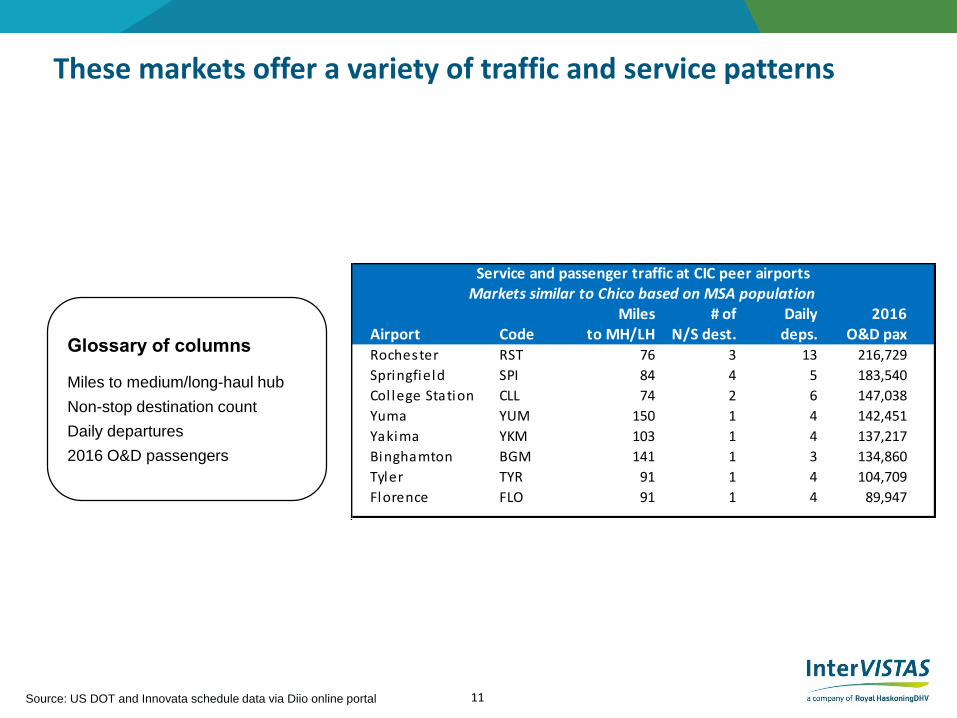
These markets offer a variety of traffic and service patterns
Glossary of columns
Miles to medium/long-haul hub
Non-stop destination count
Daily departures
2016 O&D passengers
Source: US DOT and Innovata schedule data via Diio online portal
Miles # of Daily 2016Airport Code to MH/LH N/S dest. deps. O&D paxRochester RST 76 3 13 216,729
Springfield SPI 84 4 5 183,540
Col lege Station CLL 74 2 6 147,038
Yuma YUM 150 1 4 142,451
Yakima YKM 103 1 4 137,217
Binghamton BGM 141 1 3 134,860
Tyler TYR 91 1 4 104,709
Florence FLO 91 1 4 89,947
Service and passenger traffic at CIC peer airportsMarkets similar to Chico based on MSA population

12
Evaluating these markets can estimate CIC market potential
Travel propensity reflects each market’s ratio of O&D traffic to regional population
This group of eight markets was chosen to reflect a diverse set of market conditions –
albeit with similarities to Chico
Market specific results reflect this wide range of conditions
Source: Woods and Poole 2016; US DOT data via Diio online portal
Reported Est. capture Catchment TravelAirport Code Population O&D pax rate area traffic propensityRochester RST 215,175 216,729 35% 619,226 2.88Springfield SPI 212,063 183,540 35% 524,399 2.47College Station CLL 246,231 147,038 35% 420,108 1.71Yuma YUM 226,444 142,451 35% 407,004 1.80Yakima YKM 249,147 137,217 35% 392,049 1.57Binghamton BGM 246,980 134,860 35% 385,313 1.56Tyler TYR 221,871 104,709 35% 299,169 1.35Florence FLO 208,691 89,947 35% 256,992 1.23
Total / average 1,826,602 1,156,491 35% 3,304,260 1.81
Travel propensity at CIC peer airports
13
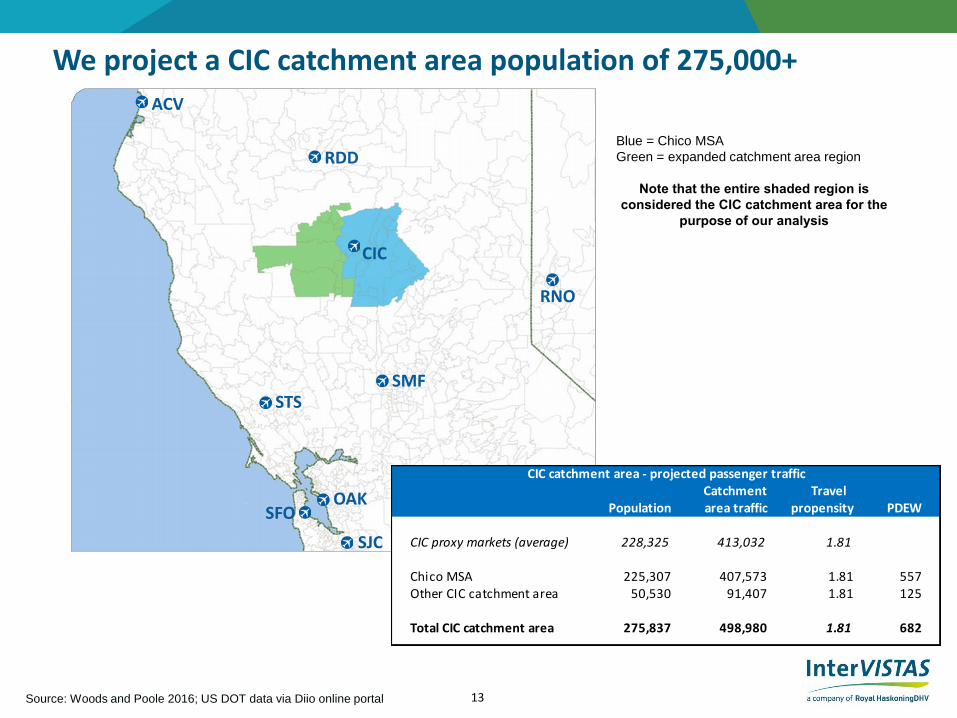
We project a CIC catchment area population of 275,000+
MSAOther CIC Catchment
Area
Source: Woods and Poole 2016; US DOT data via Diio online portal
CIC
RNO
STS
RDD
ACV
SMF
OAK
SJC
SFO
Blue = Chico MSA
Green = expanded catchment area region
Note that the entire shaded region is considered the CIC catchment area for the
purpose of our analysis
Catchment Travel Population area traffic propensity PDEW
CIC proxy markets (average) 228,325 413,032 1.81
Chico MSA 225,307 407,573 1.81 557Other CIC catchment area 50,530 91,407 1.81 125
Total CIC catchment area 275,837 498,980 1.81 682
CIC catchment area - projected passenger traffic

Regional airport discussion

15
-
500
1,000
1,500
2,000
2,500
3,000
3,500
4,000
4,500
5,000
SF/OAK S'mnto San Jose Santa Rosa Reno Chico Redding
Regional population varies across nearby markets
Regional Bay Area population
now exceeds 4.5 million
population – not including the
South Bay/San Jose
Incorporating the South Bay
drives the total to over 6
million residents
Source: Woods and Poole 2016
Note: no distinct MSA for the ACV region
Regional MSA population totals
16
-
2,000,000
4,000,000
6,000,000
8,000,000
10,000,000
12,000,000
14,000,000
16,000,000
SFO OAK SJC SMF RNO STS ACV RDD
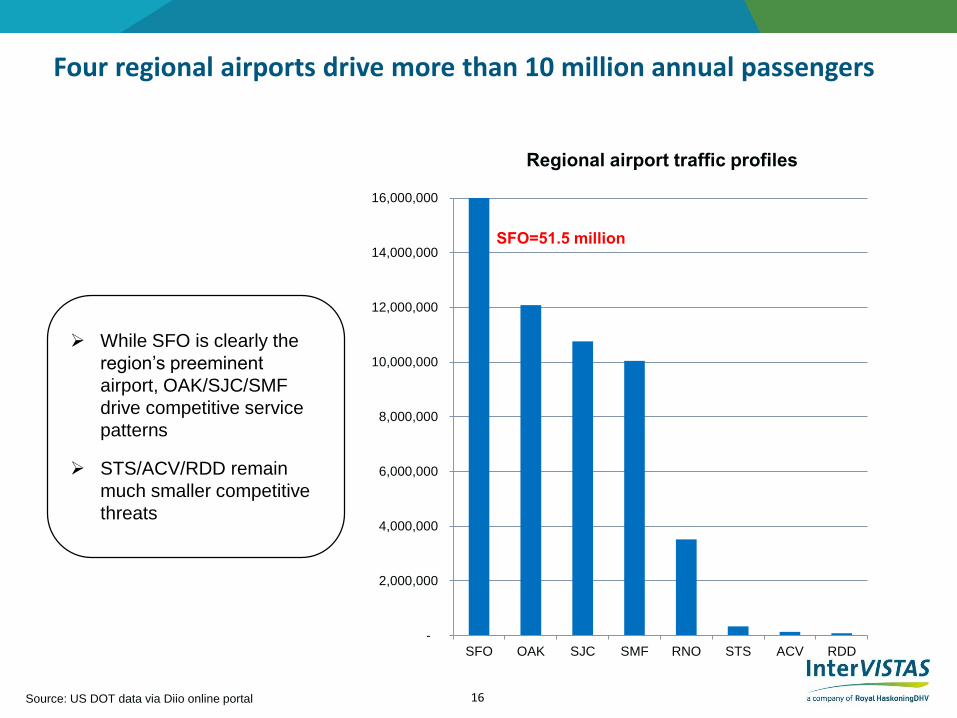
Four regional airports drive more than 10 million annual passengers
SFO=51.5 million
While SFO is clearly the
region’s preeminent
airport, OAK/SJC/SMF
drive competitive service
patterns
STS/ACV/RDD remain
much smaller competitive
threats
Regional airport traffic profiles
Source: US DOT data via Diio online portal

17
CIC
ACV
STS
SFO
SJC
OAK
RDD
RNO
SMF
SMF drives a large service profile within a reasonable drive
Drivetime Departures Seats
RDD 1:10 4 185
SMF 1:35 139 18,622
OAK 3:01 154 22,978
SFO 3:10 590 92,940
RNO 3:10 58 6,986
STS 3:20 11 784
SJC 3:28 164 22,149
ACV 4:16 6 270
Daily
CIC Neighboring Airport Profile
Source: US DOT and Innovata schedule data via Diio online portal; mapquest.com

18
-
5,000
10,000
15,000
20,000
-
20
40
60
80
100
120
140
160
2012 2013 2014 2015 2016 2017
Departures Seats
Capacity growth has recently resumed at SMF
Recent SMF capacity data
SMF will operate over 160
peak day/peak month
departures (July) on nine
carriers
SMF’s annual domestic
load factor of 84% is
roughly in line with
industry totals
SMF’s domestic O&D
fare* of $158 is also
roughly in line with
aggregate industry figures
Source: US DOT and Innovata schedule data via Diio online portal
* adjusted to stage length of 1,000 miles

CIC catchment area results

20
CIC annual O&D demand is estimated at just over 680 PDEW
Summary – Projected CIC DemandChico catchment area population 275,837
Estimated propensity to travel 1.81
Estimated annual O&D demand 498,980
PDEWs 682
Aggregate PDEW
estimates are driven by
previously discussed
propensity to travel data
We utilize ARC data to
further refine this data to
airport and market levels
throughout the coming
pages
Source: Internal InterVISTAS analysis

21
75%
19%
2% 1% 1% 2%
0%
10%
20%
30%
40%
50%
60%
70%
80%
SMF SFO RNO OAK SJC Other
An estimated 75% of Chico passengers utilize SMF
Heavy SMF usage
estimates are driven
primarily by proximity and
robust schedule profiles
The three Bay Area
airports in total comprise
21% of total Chico usage
Chico market: projected current airport usage
Source: Internal InterVISTAS analysis

22
80%
13%
2% 1% 1% 2%0%
10%
20%
30%
40%
50%
60%
70%
80%
90%
SMF SFO RNO OAK SJC Other
SFO’s international service profile drives heavy Chico usage
38%
58%
2% 2% 1%0%
10%
20%
30%
40%
50%
60%
70%
SMF SFO OAK SJC Other
Chico region projected domestic passenger usage Chico region projected international passenger usage
Source: Internal InterVISTAS analysis

23
LAX represents the largest projected O&D market from Chico
Source: Internal InterVISTAS analysis
City / O&D ChicoRank Code market O&D SMF SFO RNO OAK SJC Other Total
1 LAX Los Angeles 31,765 88% 9% 1% 1% 1% 1% 100%2 SAN San Diego 27,786 76% 16% 2% 0% 0% 6% 100%3 SEA Seattle 26,353 94% 2% 2% 1% 0% 1% 100%4 NYC New York 22,097 71% 22% 3% 1% 2% 1% 100%5 LAS Las Vegas 21,921 59% 39% 0% 0% 1% 0% 100%6 SNA Orange County 20,856 67% 13% 13% 0% 0% 7% 100%7 BUR Burbank 17,096 75% 25% 0% 0% 0% 0% 100%8 PDX Portland 16,816 79% 6% 1% 3% 1% 11% 100%9 ONT Ontario 16,177 50% 20% 10% 0% 0% 20% 100%
10 PHX Phoenix 15,651 85% 12% 1% 2% 1% 0% 100%11 DEN Denver 13,883 81% 9% 6% 0% 2% 1% 100%12 CHI Chicago 13,046 63% 31% 4% 1% 1% 1% 100%13 DFW Dallas 10,793 77% 19% 3% 0% 1% 0% 100%14 WAS Washington 9,232 85% 12% 1% 2% 0% 2% 100%15 BOS Boston 8,429 81% 17% 0% 2% 0% 1% 100%16 ATL Atlanta 7,346 93% 6% 1% 0% 0% 0% 100%17 LGB Long Beach 7,336 93% 1% 1% 5% 0% 0% 100%18 HNL Honolulu 6,304 61% 11% 0% 22% 6% 0% 100%19 SLC Salt Lake City 6,262 89% 7% 0% 3% 0% 2% 100%20 HOU Houston 6,246 92% 4% 3% 0% 0% 0% 100%
Subtotal Top 20 305,398 77% 15% 3% 1% 1% 3% 100%
Total 498,980 75% 19% 2% 1% 1% 2% 100%
CIC's top 20 largest O&D marketsCY 2016
Alternate airports share of CIC passenger demand

24
Regional western markets dominate top Chico destinations
via SMF
Top CIC O&D markets w/projected 2016 passengersvia SFO
Top CIC O&D markets w/projected 2016 passengers
Source: Internal InterVISTAS analysis
O&D PercentRank Market pax of total
1 Los Angeles 27,908 7.5%2 Seattle 24,877 6.7%3 San Diego 21,064 5.6%4 New York 15,784 4.2%5 Orange County 13,904 3.7%6 Phoenix 13,260 3.5%7 Portland 13,222 3.5%8 Las Vegas 12,900 3.5%9 Burbank 12,822 3.4%
10 Denver 11,183 3.0%
Other 206,700 55.3%
Total via SMF 373,624 100%
O&D PercentRank Market pax of total
1 Las Vegas 8,633 9.3%2 New York 4,840 5.2%3 San Diego 4,482 4.9%4 Burbank 4,274 4.6%5 Chicago 4,002 4.3%6 Ontario 3,235 3.5%7 Los Angeles 2,875 3.1%8 Orange County 2,781 3.0%9 Dallas/Fort Worth 2,076 2.2%
10 Phoenix 1,848 2.0%
Other 53,309 57.7%
Total via SFO 92,354 100%

25
SMF drives lower fares from CIC passengers than does SFO
SMF drove on average a 16%
lower domestic fare than SFO
for Chico area passengers
Source: Internal InterVISTAS analysis; US DOT data via Diio online portal
Rank Code Market SMF SFO
1 LAX Los Angeles $105 $1072 SAN San Diego $121 $1143 SEA Seattle $102 $1264 NYC New York $220 $2905 LAS Las Vegas $127 $806 SNA Orange County $119 $1147 BUR Burbank $117 $1138 PDX Portland $107 $1139 ONT Ontario $119 $125
10 PHX Phoenix $155 $10511 DEN Denver $177 $14312 CHI Chicago $234 $19013 DFW Dallas $206 $16814 WAS Washington $261 $30015 BOS Boston $217 $28416 ATL Atlanta $236 $25817 LGB Long Beach $78 $7918 HNL Honolulu $287 $26819 SLC Salt Lake City $162 $14220 HOU Houston $240 $262
Top 20 average $143 $184
Average domestic $167 $200
Average domestic fares CIC's top 20 O&D markets
via

26
International 11.7%
West Coast42.5%
SMF: 75.4%SFO: 14.1%
Mountain5.6%
SMF: 86.1%SFO: 6.6%
Great Lakes6.1%
SMF: 76.7%SFO: 18.9%
Central3.5%
SMF: 89.3%SFO: 8.6%
Southwest9.7%
SMF: 85.6%SFO: 10.9%
Southeast5.5%
SMF: 92.8%SFO: 6.4%
Florida3.3%
SMF: 78.5%SFO: 20.0%
Northeast11.9%
SMF: 80.9%SFO: 14.7%
Chico catchment areaprojected passengers by region
CY 2016
West Coast markets drive 40+% of Chico traffic
U.S. Territories 0.2%SMF: 55.1%SFO: 44.9%
Source: Internal InterVISTAS analysis
27
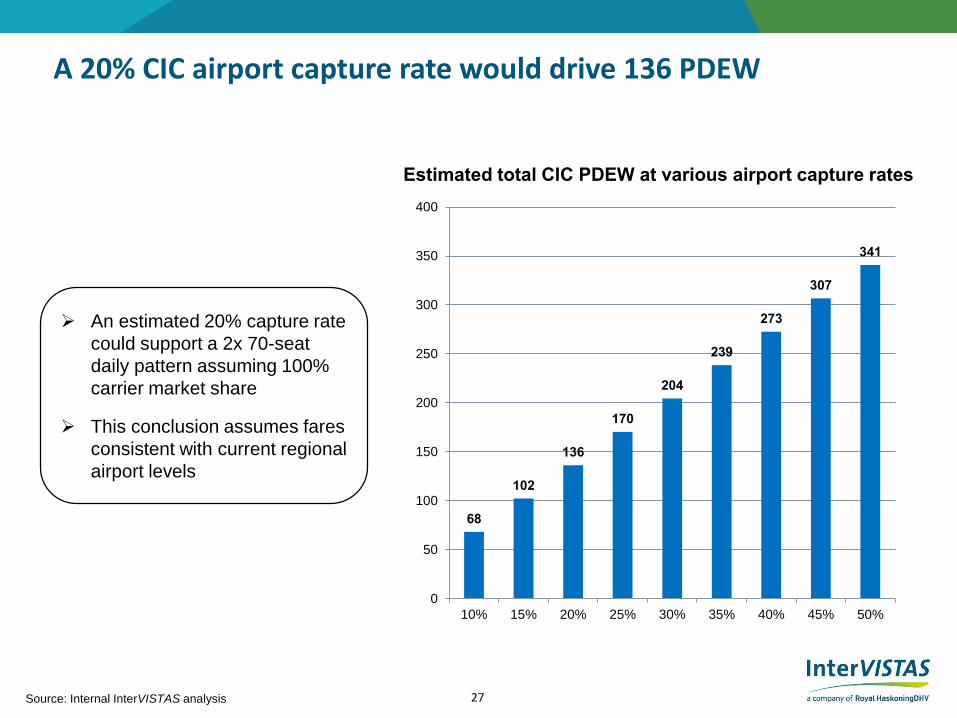
A 20% CIC airport capture rate would drive 136 PDEW
Estimated total CIC PDEW at various airport capture rates
An estimated 20% capture rate
could support a 2x 70-seat
daily pattern assuming 100%
carrier market share
This conclusion assumes fares
consistent with current regional
airport levels
Source: Internal InterVISTAS analysis
68
102
136
170
204
239
273
307
341
0
50
100
150
200
250
300
350
400
10% 15% 20% 25% 30% 35% 40% 45% 50%