Embed Size (px)
Citation preview
Charles Darwin University
The utility of high-resolution melting analysis of SNP nucleated PCR amplicons-anMLST based Staphylococcus aureus typing scheme
Lilliebridge, Rachael Anne; Tong, Steven; Giffard, Philip; Holt, Deborah
Published in:PLoS One
DOI:10.1371/journal.pone.0019749
Published: 01/01/2011
Document VersionPublisher's PDF, also known as Version of record
Link to publication
Citation for published version (APA):Lilliebridge, R. A., Tong, S., Giffard, P., & Holt, D. (2011). The utility of high-resolution melting analysis of SNPnucleated PCR amplicons-an MLST based Staphylococcus aureus typing scheme. PLoS One, 6(6), 1-11.[e19749]. DOI: 10.1371/journal.pone.0019749
General rightsCopyright and moral rights for the publications made accessible in the public portal are retained by the authors and/or other copyright ownersand it is a condition of accessing publications that users recognise and abide by the legal requirements associated with these rights.
• Users may download and print one copy of any publication from the public portal for the purpose of private study or research. • You may not further distribute the material or use it for any profit-making activity or commercial gain • You may freely distribute the URL identifying the publication in the public portal
Take down policyIf you believe that this document breaches copyright please contact us providing details, and we will remove access to the work immediatelyand investigate your claim.
Download date: 29. Jul. 2018

The Utility of High-Resolution Melting Analysis of SNPNucleated PCR Amplicons—An MLST BasedStaphylococcus aureus Typing SchemeRachael A. Lilliebridge., Steven Y. C. Tong., Philip M. Giffard, Deborah C. Holt*
Tropical and Emerging Infectious Diseases Division, Menzies School of Health Research, Charles Darwin University, Darwin, Northern Territory, Australia
Abstract
High resolution melting (HRM) analysis is gaining prominence as a method for discriminating DNA sequence variants. Itsadvantage is that it is performed in a real-time PCR device, and the PCR amplification and HRM analysis are closed tube, andeffectively single step. We have developed an HRM-based method for Staphylococcus aureus genotyping. Eight singlenucleotide polymorphisms (SNPs) were derived from the S. aureus multi-locus sequence typing (MLST) database on thebasis of maximized Simpson’s Index of Diversity. Only G«A, G«T, C«A, C«T SNPs were considered for inclusion, tofacilitate allele discrimination by HRM. In silico experiments revealed that DNA fragments incorporating the SNPs give muchhigher resolving power than randomly selected fragments. It was shown that the predicted optimum fragment size for HRManalysis was 200 bp, and that other SNPs within the fragments contribute to the resolving power. Six DNA fragmentsranging from 83 bp to 219 bp, incorporating the resolution optimized SNPs were designed. HRM analysis of thesefragments using 94 diverse S. aureus isolates of known sequence type or clonal complex (CC) revealed that sequencevariants are resolved largely in accordance with G+C content. A combination of experimental results and in silico predictionindicates that HRM analysis resolves S. aureus into 268 ‘‘melt types’’ (MelTs), and provides a Simpson’s Index of Diversity of0.978 with respect to MLST. There is a high concordance between HRM analysis and the MLST defined CCs. We havegenerated a Microsoft Excel key which facilitates data interpretation and translation between MelT and MLST data. Thepotential of this approach for genotyping other bacterial pathogens was investigated using a computerized approach toestimate the densities of SNPs with unlinked allelic states. The MLST databases for all species tested contained abundantunlinked SNPs, thus suggesting that high resolving power is not dependent upon large numbers of SNPs.
Citation: Lilliebridge RA, Tong SYC, Giffard PM, Holt DC (2011) The Utility of High-Resolution Melting Analysis of SNP Nucleated PCR Amplicons—An MLST BasedStaphylococcus aureus Typing Scheme. PLoS ONE 6(6): e19749. doi:10.1371/journal.pone.0019749
Editor: Michael Otto, National Institutes of Health, United States of America
Received December 13, 2010; Accepted April 15, 2011; Published June 22, 2011
Copyright: � 2011 Lilliebridge et al. This is an open-access article distributed under the terms of the Creative Commons Attribution License, which permitsunrestricted use, distribution, and reproduction in any medium, provided the original author and source are credited.
Funding: SYCT is supported by an Australian National Health and Medical Research Council Postdoctoral Training Fellowship (508829). The funders had no rolein study design, data collection and analysis, decision to publish, or preparation of the manuscript.
Competing Interests: PG is an inventor on a patent application disclosing elements of this technology (specifically, strategies for the computerised derivationof resolution optimised sets of SNPs from DNA sequence alignments), and would be eligible for a portion of the proceeds if this were to be commercialized (USpatent office data: Application number: 10/508,579; Publication number: US 2006/0218182 A1; Title: Assessing Data Sets). This does not alter the authors’adherence to all the PLoS ONE policies on sharing data and materials.
* E-mail: [email protected]
. These authors contributed equally to this work.
Introduction
The identification and monitoring of strains of pathogenic
bacteria by genotyping is central to public health, infection
control, and veterinary and food microbiology. Electrophoretic
techniques such as pulsed-field gel electrophoresis and amplified
fragment length polymorphism have been used extensively for
many years. More recently, methods that involve the interrogation
of known polymorphic regions, such as multi-locus variable
number tandem repeat analysis and multilocus sequence typing
(MLST), have become prominent. Rapid advances in whole
genome sequencing using ‘‘next generation’’ technology means
that time consuming and/or expensive genotyping methods will
likely become non-competitive in the short to medium term.
However, methods based on single-nucleotide polymorphisms
(SNPs) will likely remain attractive due to the many efficient and
adaptable methods for SNP interrogation, the increasing amount
of publicly available comparative sequence data, and increasing
understanding of the informative power of SNPs and SNP
combinations.
A previously described approach to SNP-based bacterial
genotyping involved the computerized derivation from sequence
alignments of sets of SNPs that are optimized with respect to the
Simpson’s Index of Diversity (D), and the interrogation of these
SNPs using allele specific real-time PCR (kinetic PCR). In this
context, D is the probability that two sequences in the alignment,
selected at random without replacement, will be discriminated by
the SNPs. This approach has been applied to several species, and
in general has been based upon SNPs derived from MLST
datasets [1,2,3,4,5].
In the case of Staphylococcus aureus it was found that eight SNPs
divided the MLST database into 47 genotypes that are concordant
with the major clonal complexes (CCs) [3]. In a completely clonal
population structure, the number of genotypes defined by SNPs
will equal the number of SNPs+1 [3,5,6,7], assuming the SNPs are
bi-allelic. It was inferred that an excess of genotypes over SNPs is a
PLoS ONE | www.plosone.org 1 June 2011 | Volume 6 | Issue 6 | e19749
consequence of horizontal gene transfer (HGT), while concor-
dance between SNP genotypes and the population structure is a
consequence of HGT being quite rare, and the CCs reflecting
actual biological entities that are genetically isolated from each
other to a significant extent.
Recently, a variant of this approach has been described, in
which DNA fragments encompassing the resolution-optimized
SNPs are interrogated by high-resolution melting (HRM) analysis
[8]. The fragments may also include other SNPs that increase the
resolving power. The method is ‘‘single-step, closed tube’’, and
requires only a real-time PCR device, generic master-mix and
unlabelled primers. This has been termed ‘‘SNP nucleated mini-
MLST typing’’, which we abbreviate to ‘‘Minim typing’’. Integral
to the method are bioinformatic tools that allow facile translation
between MLST and Minim data [8].
Here we describe a method for Minim typing of S. aureus, and also
explore the properties of the Minim typing approach and it’s
potential to be applied to other bacterial species. This study showed
that Minim typing subdivides S. aureus in a manner concordant with
its population structure. It also revealed that prominent species of
bacterial pathogens contain large numbers of SNPs that have been
subjected to HGT and so have the potential to underpin highly
discriminatory genotyping methods. As larger datasets of whole
genome data become available this approach will facilitate an
optimized but parsimonious use of genome wide SNPs.
Results
To investigate the properties of the Minim typing approach we
began by determining that fragment sizes of 150–200 bp
represented a good compromise between sequence diversity, and
the ability to reliably resolve distinct. We then identified a set of
SNPs optimised for resolving S. aureus strains from each other, and
designed HRM fragments of the appropriate size that contained
these SNPs. The high resolving power of the six chosen fragments
in relation to MLST was confirmed by comparing the chosen
fragments with random fragments of the same size and also
demonstrating that the fragments covered regions of the
concatenated MLST sequence that are associated with a high
Simpson’s Index of Diversity. Following these in silico analyzes, we
tested the method on 95 clinical S. aureus isolates and found that
the HRM curves were reproducible and the order of curves
essentially as predicted with minor exceptions. We generated a key
that facilitates translation between HRM based genotypes and
MLST and demonstrated that the clustering of HRM genotypes is
concordant with the S. aureus population structure as defined by
MLST.
Prediction of effective fragment sizes for Minim typingThe predicted effective fragment sizes for Minim typing were
calculated. We conservatively assumed that sequence variations
that do not affect the G+C content are not revealed by HRM,
even though this is not always the case. First, we addressed the
question as to the upper limit on the size of fragments for which
sequence variants may be reliably discriminated by HRM analysis.
Our experience with the Corbett Rotorgene is that the limit for the
reliable detection of differences in melting temperatures (DTm) is
0.2uC. The predicted DTm caused by a single change in the
number of G or C residues decreases as the length of the fragment
increases. Assuming a constant ionic environment, this is described
by DTm = 41((GC2–GC1)/N), where GC is the number of G+C
residues and N is the length of the fragments [9,10]. According to
this equation, the DTm conferred by a single change in the number
of G or C residues in a 200 bp fragment is approximately 0.2uC. It
was concluded that variants of fragments .200 bp may not always
be discriminated by HRM analysis, even when they differ in G+C
content.
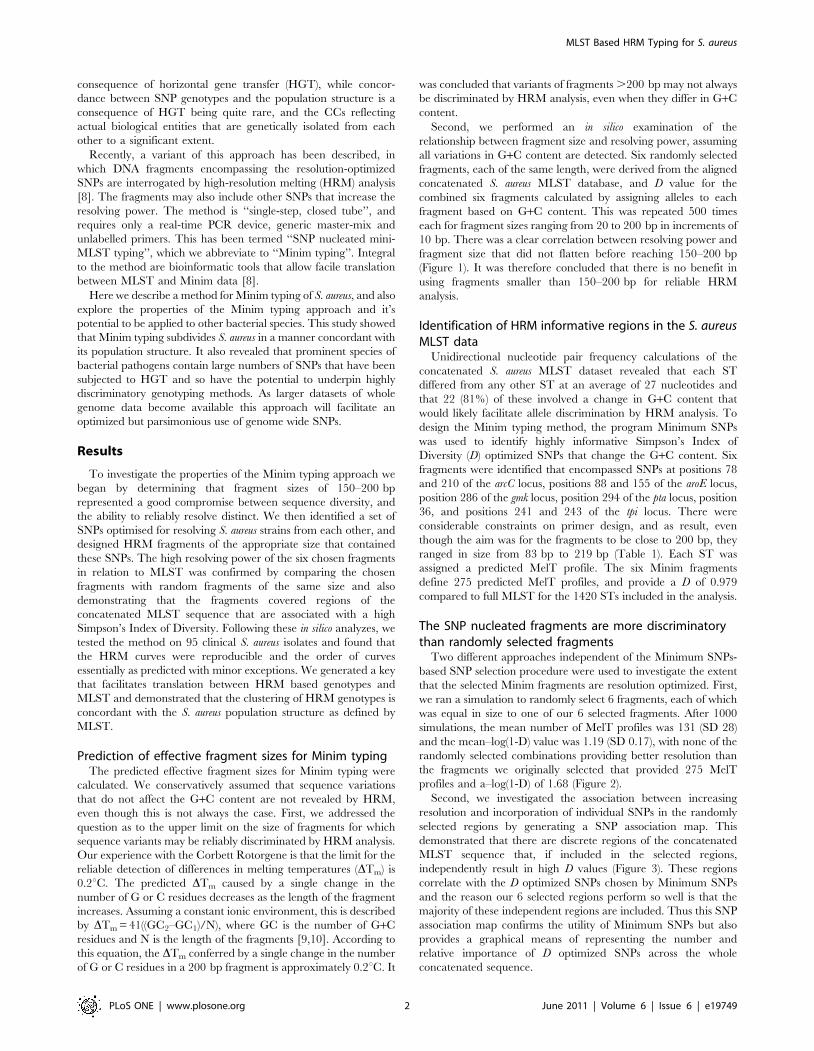
Second, we performed an in silico examination of the
relationship between fragment size and resolving power, assuming
all variations in G+C content are detected. Six randomly selected
fragments, each of the same length, were derived from the aligned
concatenated S. aureus MLST database, and D value for the
combined six fragments calculated by assigning alleles to each
fragment based on G+C content. This was repeated 500 times
each for fragment sizes ranging from 20 to 200 bp in increments of
10 bp. There was a clear correlation between resolving power and
fragment size that did not flatten before reaching 150–200 bp
(Figure 1). It was therefore concluded that there is no benefit in
using fragments smaller than 150–200 bp for reliable HRM
analysis.
Identification of HRM informative regions in the S. aureusMLST data
Unidirectional nucleotide pair frequency calculations of the
concatenated S. aureus MLST dataset revealed that each ST
differed from any other ST at an average of 27 nucleotides and
that 22 (81%) of these involved a change in G+C content that
would likely facilitate allele discrimination by HRM analysis. To
design the Minim typing method, the program Minimum SNPs
was used to identify highly informative Simpson’s Index of
Diversity (D) optimized SNPs that change the G+C content. Six
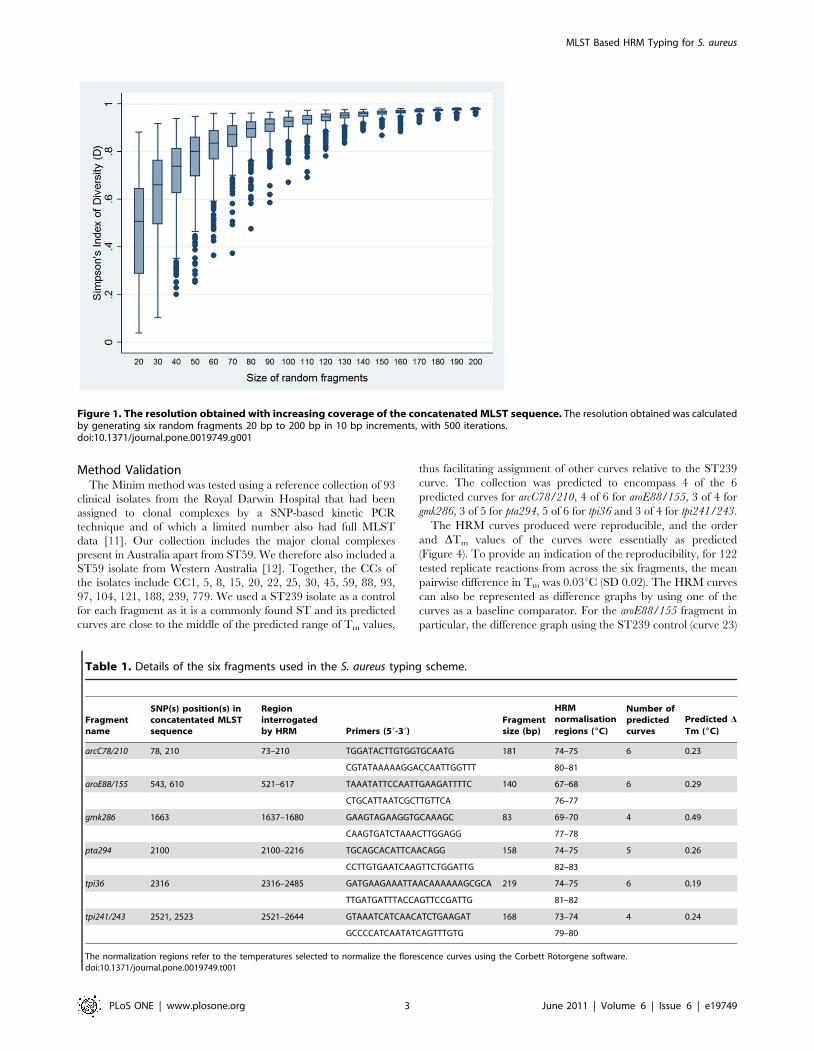
fragments were identified that encompassed SNPs at positions 78
and 210 of the arcC locus, positions 88 and 155 of the aroE locus,
position 286 of the gmk locus, position 294 of the pta locus, position
36, and positions 241 and 243 of the tpi locus. There were
considerable constraints on primer design, and as result, even
though the aim was for the fragments to be close to 200 bp, they
ranged in size from 83 bp to 219 bp (Table 1). Each ST was
assigned a predicted MelT profile. The six Minim fragments
define 275 predicted MelT profiles, and provide a D of 0.979
compared to full MLST for the 1420 STs included in the analysis.
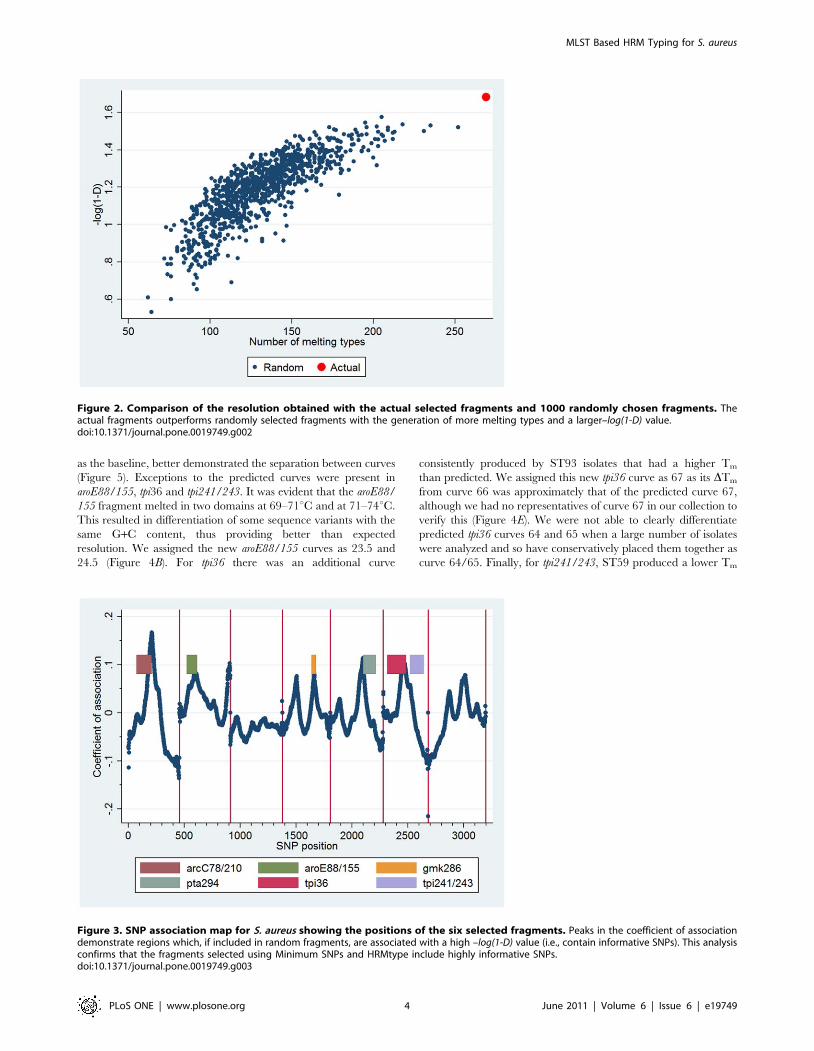
The SNP nucleated fragments are more discriminatorythan randomly selected fragments
Two different approaches independent of the Minimum SNPs-
based SNP selection procedure were used to investigate the extent
that the selected Minim fragments are resolution optimized. First,
we ran a simulation to randomly select 6 fragments, each of which
was equal in size to one of our 6 selected fragments. After 1000
simulations, the mean number of MelT profiles was 131 (SD 28)
and the mean–log(1-D) value was 1.19 (SD 0.17), with none of the
randomly selected combinations providing better resolution than
the fragments we originally selected that provided 275 MelT
profiles and a–log(1-D) of 1.68 (Figure 2).
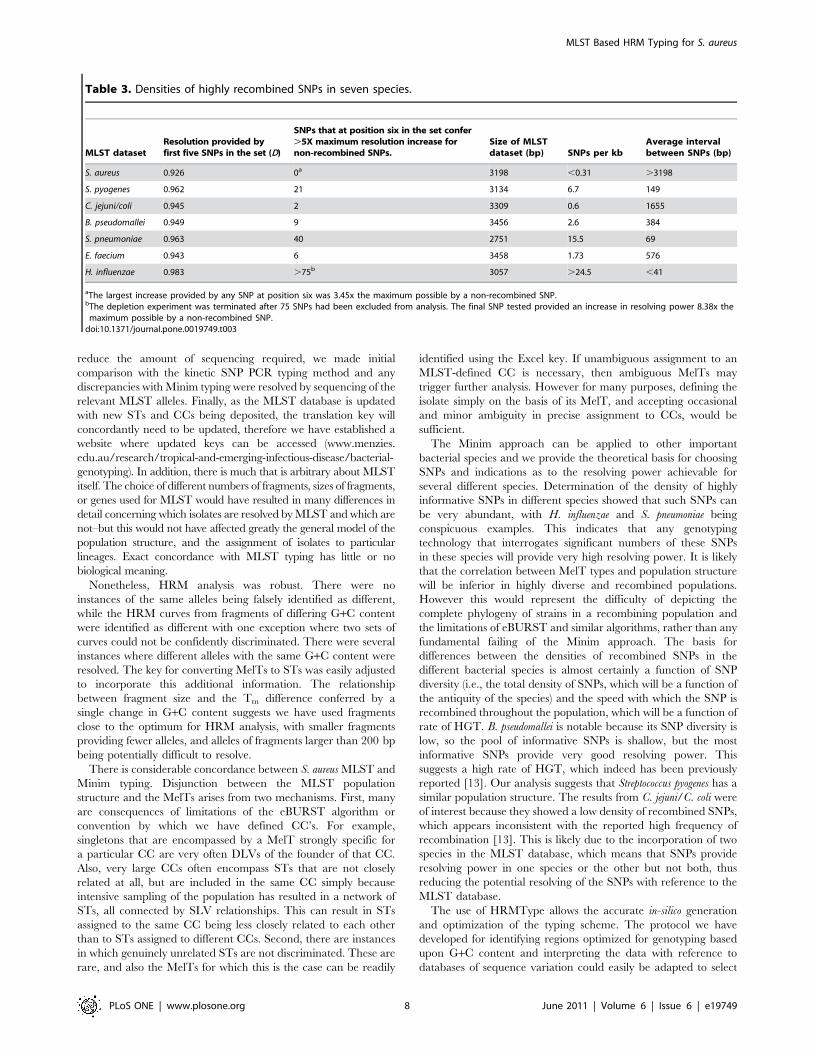
Second, we investigated the association between increasing
resolution and incorporation of individual SNPs in the randomly
selected regions by generating a SNP association map. This
demonstrated that there are discrete regions of the concatenated
MLST sequence that, if included in the selected regions,
independently result in high D values (Figure 3). These regions
correlate with the D optimized SNPs chosen by Minimum SNPs
and the reason our 6 selected regions perform so well is that the
majority of these independent regions are included. Thus this SNP
association map confirms the utility of Minimum SNPs but also
provides a graphical means of representing the number and
relative importance of D optimized SNPs across the whole
concatenated sequence.
MLST Based HRM Typing for S. aureus
PLoS ONE | www.plosone.org 2 June 2011 | Volume 6 | Issue 6 | e19749
Method ValidationThe Minim method was tested using a reference collection of 93
clinical isolates from the Royal Darwin Hospital that had been
assigned to clonal complexes by a SNP-based kinetic PCR
technique and of which a limited number also had full MLST
data [11]. Our collection includes the major clonal complexes
present in Australia apart from ST59. We therefore also included a
ST59 isolate from Western Australia [12]. Together, the CCs of
the isolates include CC1, 5, 8, 15, 20, 22, 25, 30, 45, 59, 88, 93,
97, 104, 121, 188, 239, 779. We used a ST239 isolate as a control
for each fragment as it is a commonly found ST and its predicted
curves are close to the middle of the predicted range of Tm values,
thus facilitating assignment of other curves relative to the ST239
curve. The collection was predicted to encompass 4 of the 6
predicted curves for arcC78/210, 4 of 6 for aroE88/155, 3 of 4 for
gmk286, 3 of 5 for pta294, 5 of 6 for tpi36 and 3 of 4 for tpi241/243.
The HRM curves produced were reproducible, and the order
and DTm values of the curves were essentially as predicted
(Figure 4). To provide an indication of the reproducibility, for 122
tested replicate reactions from across the six fragments, the mean
pairwise difference in Tm was 0.03uC (SD 0.02). The HRM curves
can also be represented as difference graphs by using one of the
curves as a baseline comparator. For the aroE88/155 fragment in
particular, the difference graph using the ST239 control (curve 23)
Table 1. Details of the six fragments used in the S. aureus typing scheme.
Fragmentname
SNP(s) position(s) inconcatentated MLSTsequence
Regioninterrogatedby HRM Primers (59-39)
Fragmentsize (bp)
HRMnormalisation
regions (6C)
Number ofpredictedcurves
Predicted D
Tm (6C)
arcC78/210 78, 210 73–210 TGGATACTTGTGGTGCAATG 181 74–75 6 0.23
CGTATAAAAAGGACCAATTGGTTT 80–81
aroE88/155 543, 610 521–617 TAAATATTCCAATTGAAGATTTTC 140 67–68 6 0.29
CTGCATTAATCGCTTGTTCA 76–77
gmk286 1663 1637–1680 GAAGTAGAAGGTGCAAAGC 83 69–70 4 0.49
CAAGTGATCTAAACTTGGAGG 77–78
pta294 2100 2100–2216 TGCAGCACATTCAACAGG 158 74–75 5 0.26
CCTTGTGAATCAAGTTCTGGATTG 82–83
tpi36 2316 2316–2485 GATGAAGAAATTAACAAAAAAGCGCA 219 74–75 6 0.19
TTGATGATTTACCAGTTCCGATTG 81–82
tpi241/243 2521, 2523 2521–2644 GTAAATCATCAACATCTGAAGAT 168 73–74 4 0.24
GCCCCATCAATATCAGTTTGTG 79–80
The normalization regions refer to the temperatures selected to normalize the florescence curves using the Corbett Rotorgene software.doi:10.1371/journal.pone.0019749.t001
Figure 1. The resolution obtained with increasing coverage of the concatenated MLST sequence. The resolution obtained was calculatedby generating six random fragments 20 bp to 200 bp in 10 bp increments, with 500 iterations.doi:10.1371/journal.pone.0019749.g001
MLST Based HRM Typing for S. aureus
PLoS ONE | www.plosone.org 3 June 2011 | Volume 6 | Issue 6 | e19749
as the baseline, better demonstrated the separation between curves
(Figure 5). Exceptions to the predicted curves were present in
aroE88/155, tpi36 and tpi241/243. It was evident that the aroE88/
155 fragment melted in two domains at 69–71uC and at 71–74uC.
This resulted in differentiation of some sequence variants with the
same G+C content, thus providing better than expected
resolution. We assigned the new aroE88/155 curves as 23.5 and
24.5 (Figure 4B). For tpi36 there was an additional curve
consistently produced by ST93 isolates that had a higher Tm
than predicted. We assigned this new tpi36 curve as 67 as its DTm
from curve 66 was approximately that of the predicted curve 67,
although we had no representatives of curve 67 in our collection to
verify this (Figure 4E). We were not able to clearly differentiate
predicted tpi36 curves 64 and 65 when a large number of isolates
were analyzed and so have conservatively placed them together as
curve 64/65. Finally, for tpi241/243, ST59 produced a lower Tm
Figure 2. Comparison of the resolution obtained with the actual selected fragments and 1000 randomly chosen fragments. Theactual fragments outperforms randomly selected fragments with the generation of more melting types and a larger–log(1-D) value.doi:10.1371/journal.pone.0019749.g002
Figure 3. SNP association map for S. aureus showing the positions of the six selected fragments. Peaks in the coefficient of associationdemonstrate regions which, if included in random fragments, are associated with a high –log(1-D) value (i.e., contain informative SNPs). This analysisconfirms that the fragments selected using Minimum SNPs and HRMtype include highly informative SNPs.doi:10.1371/journal.pone.0019749.g003
MLST Based HRM Typing for S. aureus
PLoS ONE | www.plosone.org 4 June 2011 | Volume 6 | Issue 6 | e19749

than predicted and its curve was reassigned from 43 to 42; and
ST93 was predicted to produce curve 44 but produced a Tm
between that of curve 44 and curve 43 that could not always be
distinguished from curve 43. In the context of using the other five
loci where ST93 has a unique profile this does not result in any
confusion in distinguishing ST93. Sequence determination
demonstrated complete concordance between sequence and these
new HRM curves. Following these re-assignments the method
provides a total of 268 MelT profiles and a D value of 0.978 (95%
confidence interval 0.976–0.981) with respect to the 1420 MLST
sequence types. A Microsoft Excel ‘‘MelT key’’ that facilitates
Minim data interpretation and translation between MelT and
MLST data was assembled (Data S1). This encompasses the
information regarding the unexpected HRM curves. A suggested
protocol for applying the Minim technique and use of the MelT
key is provided in Text S1.
The results obtained with the Minim typing method largely
correlated with the results previously obtained using the kinetic
PCR SNP typing method. For isolates where a discrepancy
occurred between the methods, the relevant MLST locus of the
Figure 4. High-resolution melting curves for the six fragments. The six fragments are (A) arcC78/210, (B) aroE88/155, (C) gmk286, (D) pta294,(E) tpi36 and (F) tpi241/243. The curves are labeled by the number of G+C residues contained in the corresponding fragment. For arcC78/210 a total of24 curves are presented to demonstrate the reproducibility and ability to discriminate multiple curves (replicate curves colored grey). All otherregions are presented with one representative of each curve present in the isolate collection.doi:10.1371/journal.pone.0019749.g004
MLST Based HRM Typing for S. aureus
PLoS ONE | www.plosone.org 5 June 2011 | Volume 6 | Issue 6 | e19749

isolate was sequenced. In all cases the Minim typing result was
correct, with the kinetic PCR SNP result failing to resolve single
locus variants within clonal complexes (Data S2). A comparison of
Minim typing with the kinetic PCR SNP method for the 1420
MLST sequence types confirmed the concordance between the
methods with the Wallace’s coefficient for (MelTRSNP) = 0.90
(95% CI 0.87–0.92) and Wallace (SNPRMelT) = 0.34 (95% CI
0.31–0.37). This indicates that if two strains are clustered together by
MelT, there is a 90% probability they will be clustered together by
the SNP method; however, due to the lower resolution of the SNP
method, there is only a 34% probability that two strains clustered
together by the SNP method will be clustered together by MelT.
On the basis of the criteria we have developed for discriminating
HRM curves, on no occasion did replicate analysis of the same isolate
yield discrepant results. This indicates a reproducibility of 100%.
This was determined from eight isolates that were completely
analysed more than once, with the total number of analyses being 38
(i.e a mean of 4.75 replicates per isolate). Additional replicate analyses
of these isolates were carried out at subsets of the loci. The total
number of individual HRM assays carried out was 640, which may
be regarded as equivalent to 107 complete Minim typing procedures,
with a mean of 13.4 replicates per isolate. Another indication of
robustness was that 155 HRM analyses, spread approximately
equally across the loci, were performed on known sequences. The
HRM data was all in accordance with the sequence data.
The clustering of HRM genotypes is concordant with theS. aureus population structure as defined by MLST
It is desirable that S. aureus Minim typing be concordant with the
population structure defined by MLST. In particular, this would
allow the inference of the CC from the MelT data. We tested this
by two means. First, we calculated Wallace’s coefficient to
compare MelT with clonal complexes and sub-clonal complexes
(subCC) as defined by eBURST analysis for the 1420 STs,
including 201 singletons. This yielded Wallace (MelT RCC) = 0.85 (95% CI 0.82–0.88) and Wallace (MelTRsubCC) = 0.73 (95% CI 0.69–0.77). This indicates that if two
strains are in the same cluster by MelT they have an 85% chance
of having the same CC and 73% chance of having the same
subCC. This analysis assumes an equal abundance of all STs, so
the calculations were repeated using MLST data that better
reflects the differing abundances of STs. In the MLST database,
3318 submitted isolates had STs that were present in the 1420 STs
used to generate the MelT key. The ST data from these yielded
Wallace (MelTRCC) = 0.949 (95% CI 0.938–0.961) and Wallace
(MelTRsubCC) = 0.841 (95% CI 0.0.823–0.860). These higher
values reflect the abundance in the database of isolates with CC
and subCC founder STs, and the effectiveness of Minim typing at
discriminating these founder STs. The discriminatory power of
Minim typing with this data set of 3318 isolates is D = 0.961 (95%
CI 0.959–0.963), which is comparable to that of MLST at
D = 0.987 (95% CI 0.983–0.989). The subCC data using MLST
provides D = 0.957, which is less than that provided by Minim
typing. Therefore Minim typing is concordant with MLST and
provides discriminatory power significantly beyond assignment
into CCs and subCCs.
Second, the STs defined by MelTs were examined individually.
In general, for CCs of significant size, a single MelT encompasses
a CC founder and large proportion of its SLVs, and this MelT
does not encompass the founder of any other CCs. Many MelTs
Figure 5. Difference graph for aroE88/155. The high-resolution melting curves are compared with curve 23 (represented by ST239) as thebaseline. The two melting domains are evident with the first between 68 and 71uC and the second between 71 and 74uC.doi:10.1371/journal.pone.0019749.g005
MLST Based HRM Typing for S. aureus
PLoS ONE | www.plosone.org 6 June 2011 | Volume 6 | Issue 6 | e19749

encompass no major CC founder, but rather encompass a small
number of closely related STs, such as SLVs of the same CC
founder. These findings may be illustrated using the large and
diverse CC8. The sensitivity, specificity and positive predictive
values (PPV) of Minim typing for CCs and subCCs were
calculated, using the simplifying assumption that all STs are
equally abundant (Table 2). MelTs diagnostic for a CC or subCC
were defined as MelTs for which at least 50% of the STs belong to
the CC or subCC of interest. False positives were STs that are
encompassed by a diagnostic MelT and not belonging to the CC
or subCC of interest. False negatives were STs belonging to the
CC or subCC of interest, but defined by MelTs that were not
diagnostic for the CC or subCC of interest. The specificities were
universally high, and this is primarily a function of the high
numbers of true negatives (Table 2). Sensitivities and PPVs were
also high, but more variable, primarily because of the smaller and
more variable number of true positives, with the PPVs for the
small subCCs being depressed by small absolute numbers of false
positives. If singletons that are DLVs of a CC founder are assigned
to that CC, and STs that are SLVs of two founders are assigned to
the CC that provides the ‘‘best’’ diagnostic parameters, then the
enhanced parameters show large improvements, particularly for
the PPVs (Table 2). This is primarily due to the reclassification of
false positives as true positives. The generation of new false
negatives that are singleton DLVs of CC/subCCs of interest, and
not within MelTs diagnostic for the CC/subCCs of interest, had
only a very small effect. The only significant anomaly brought into
focus by this analysis was that the founders of CC7 and the
subCC8-247 are not discriminated.
The potential resolving powers of SNP typing in otherbacterial species
The value of the Minim approach is in part a function of the
density of informative SNPs. If a sequence alignment can be
converted to a completely consistent dendrogram, then there is no
homoplasy, no evidence for recombination involving the SNPs and
the resolving power of SNPs defined by the sequence variants can
only increase arithmetically as SNPs are added to the typing set.
Conversely, if recombination is extensive, the resolving power can
increase exponentially as SNPs are added.
At any point in the assembly of a set of resolution optimized
SNPs, a pool of SNPs is available for selection as the next SNP to
be added to the set. It was reasoned that the absolute number of
such SNPs that individually provide a much greater increase in
resolving power than is possible for an unrecombined SNP, is a
useful measure of the density of recombined SNPs that confer
considerable resolving power when used for genotyping. To
determine the densities of such SNPs in different bacterial
pathogens, an in silico ‘‘SNP depletion’’ experiment was carried
out using the different MLST datasets. Highly resolving SNPs
were least dense in S. aureus, confirming a previous analysis [13],
while Haemophilus influenzae and Streptococcus pneumoniae have
particularly high densities of informative SNPs (Table 3).
Discussion
Despite the increasing capability to rapidly generate sequencing
data at multilocus and genome wide levels, genetic analysis
methods that are inherently rapid and simple, and that make use
of generic equipment and reagents, are likely to remain useful for
some time. The large volume of comparative sequence data on the
internet provides an excellent resource for the identification of
highly informative subsets of known polymorphic sites or regions
that may be used in such methods. We demonstrate the practical
application of such an approach to genotyping S. aureus by
identifying resolution optimized SNP combinations in MLST
datasets and interrogating these SNPs with the low cost HRM
platform. Six single-step PCR and HRM reactions were shown to
provide a high degree of resolution compared to full MLST with a
D value of 0.978.
There are several limitations to this Minim typing approach.
First, given the available HRM technology, it is not usually
possible to discriminate fragments with the same G+C content but
of a different sequence. Therefore, in generating the translation
key we conservatively assumed that fragments with the same G+C
content will produce the same curve. As a consequence, the
discriminatory power of HRM typing will always be less than that
of full MLST. Also, new MLST alleles that have the same G+C
content as previous alleles in the interrogated fragment will not be
revealed through Minim typing. Although it would have been
ideal to have had full MLST sequences for all tested isolates, to
Table 2. Diagnostic parameters of Minim typing for CC8 and subCCs within CC8.
CC/subCC STsa MelTsb Sensitivity Specificity PPV
Rawc Enhancedd Raw Enhanced Raw Enhanced
8 (all) 185 22 0.973 0.965 0.976 0.983 0.863 0.906
8–8 110 10 0.891 0.935 0.992 0.998 0.899 0.972
8–239 44 7 0.911 0.948 0.992 0.997 0.788 0.932
8–72 14 1 0.717 0.733 0.996 0.996 0.630 0.688
8–247 11 0e ND ND ND ND ND ND
8–770 6 2 0.830 0.897 0.997 0.997 0.560 0.625
The calculations assumed equal abundance of all STs. ND = not determined.aNumber of STs belonging to the CC/subCC.bNumber of MelTs diagnostic for the CC/subCC. Each MelT defines either a single ST belonging to the CC/subCC of interest, or a group of STs of which at least 50% are
of the CC/subCC of interest.cThe CC and subCC assignments for STs in the Excel key were used without modification.dSingletons that are DLVs of the founder of the CC/subCC were classified as true positives, and false positive and false negative STs that are SLVs for more than one CC/
subCC founder were assigned to the CC/subCC that maximizes the diagnostic parameters. Additional singletons that are founder DLVs and do not correspond to MelTdiagnostic for the CC/subCC of interest were identified as new false negatives.
eThere are no MelTs diagnostic for subCC 8–247 according to the criterion used, primarily because CC7 and subCC 8–247 are not discriminated by Minim typing.doi:10.1371/journal.pone.0019749.t002
MLST Based HRM Typing for S. aureus
PLoS ONE | www.plosone.org 7 June 2011 | Volume 6 | Issue 6 | e19749
reduce the amount of sequencing required, we made initial
comparison with the kinetic SNP PCR typing method and any
discrepancies with Minim typing were resolved by sequencing of the
relevant MLST alleles. Finally, as the MLST database is updated
with new STs and CCs being deposited, the translation key will
concordantly need to be updated, therefore we have established a
website where updated keys can be accessed (www.menzies.
edu.au/research/tropical-and-emerging-infectious-disease/bacterial-
genotyping). In addition, there is much that is arbitrary about MLST
itself. The choice of different numbers of fragments, sizes of fragments,
or genes used for MLST would have resulted in many differences in
detail concerning which isolates are resolved by MLST and which are
not–but this would not have affected greatly the general model of the
population structure, and the assignment of isolates to particular
lineages. Exact concordance with MLST typing has little or no
biological meaning.
Nonetheless, HRM analysis was robust. There were no
instances of the same alleles being falsely identified as different,
while the HRM curves from fragments of differing G+C content
were identified as different with one exception where two sets of
curves could not be confidently discriminated. There were several
instances where different alleles with the same G+C content were
resolved. The key for converting MelTs to STs was easily adjusted
to incorporate this additional information. The relationship
between fragment size and the Tm difference conferred by a
single change in G+C content suggests we have used fragments
close to the optimum for HRM analysis, with smaller fragments
providing fewer alleles, and alleles of fragments larger than 200 bp
being potentially difficult to resolve.
There is considerable concordance between S. aureus MLST and
Minim typing. Disjunction between the MLST population
structure and the MelTs arises from two mechanisms. First, many
are consequences of limitations of the eBURST algorithm or
convention by which we have defined CC’s. For example,
singletons that are encompassed by a MelT strongly specific for
a particular CC are very often DLVs of the founder of that CC.
Also, very large CCs often encompass STs that are not closely
related at all, but are included in the same CC simply because
intensive sampling of the population has resulted in a network of
STs, all connected by SLV relationships. This can result in STs
assigned to the same CC being less closely related to each other
than to STs assigned to different CCs. Second, there are instances
in which genuinely unrelated STs are not discriminated. These are
rare, and also the MelTs for which this is the case can be readily
identified using the Excel key. If unambiguous assignment to an
MLST-defined CC is necessary, then ambiguous MelTs may
trigger further analysis. However for many purposes, defining the
isolate simply on the basis of its MelT, and accepting occasional
and minor ambiguity in precise assignment to CCs, would be
sufficient.
The Minim approach can be applied to other important
bacterial species and we provide the theoretical basis for choosing
SNPs and indications as to the resolving power achievable for
several different species. Determination of the density of highly
informative SNPs in different species showed that such SNPs can
be very abundant, with H. influenzae and S. pneumoniae being
conspicuous examples. This indicates that any genotyping
technology that interrogates significant numbers of these SNPs
in these species will provide very high resolving power. It is likely
that the correlation between MelT types and population structure
will be inferior in highly diverse and recombined populations.
However this would represent the difficulty of depicting the
complete phylogeny of strains in a recombining population and
the limitations of eBURST and similar algorithms, rather than any
fundamental failing of the Minim approach. The basis for
differences between the densities of recombined SNPs in the
different bacterial species is almost certainly a function of SNP
diversity (i.e., the total density of SNPs, which will be a function of
the antiquity of the species) and the speed with which the SNP is
recombined throughout the population, which will be a function of
rate of HGT. B. pseudomallei is notable because its SNP diversity is
low, so the pool of informative SNPs is shallow, but the most
informative SNPs provide very good resolving power. This
suggests a high rate of HGT, which indeed has been previously
reported [13]. Our analysis suggests that Streptococcus pyogenes has a
similar population structure. The results from C. jejuni/C. coli were
of interest because they showed a low density of recombined SNPs,
which appears inconsistent with the reported high frequency of
recombination [13]. This is likely due to the incorporation of two
species in the MLST database, which means that SNPs provide
resolving power in one species or the other but not both, thus
reducing the potential resolving of the SNPs with reference to the
MLST database.
The use of HRMType allows the accurate in-silico generation
and optimization of the typing scheme. The protocol we have
developed for identifying regions optimized for genotyping based
upon G+C content and interpreting the data with reference to
databases of sequence variation could easily be adapted to select
Table 3. Densities of highly recombined SNPs in seven species.
MLST datasetResolution provided byfirst five SNPs in the set (D)
SNPs that at position six in the set confer.5X maximum resolution increase fornon-recombined SNPs.
Size of MLSTdataset (bp) SNPs per kb
Average intervalbetween SNPs (bp)
S. aureus 0.926 0a 3198 ,0.31 .3198
S. pyogenes 0.962 21 3134 6.7 149
C. jejuni/coli 0.945 2 3309 0.6 1655
B. pseudomallei 0.949 9 3456 2.6 384
S. pneumoniae 0.963 40 2751 15.5 69
E. faecium 0.943 6 3458 1.73 576
H. influenzae 0.983 .75b 3057 .24.5 ,41
aThe largest increase provided by any SNP at position six was 3.45x the maximum possible by a non-recombined SNP.bThe depletion experiment was terminated after 75 SNPs had been excluded from analysis. The final SNP tested provided an increase in resolving power 8.38x the
maximum possible by a non-recombined SNP.doi:10.1371/journal.pone.0019749.t003
MLST Based HRM Typing for S. aureus
PLoS ONE | www.plosone.org 8 June 2011 | Volume 6 | Issue 6 | e19749

fragments and generate a key for other platforms such as with base
composition analysis using PCR/ESI-MS [14]. The method is also
flexible in that the number, size and position of the fragments can
be varied and therefore a typing scheme can be tailored according
to the needs of the user, balancing convenience, resolving power
and cost.
HRM based typing has several attractive features including that
the amplification and HRM analysis is a single-step, closed tube
process. The only manipulations required are DNA extraction and
PCR reaction set-up, and the cost is minimal with only six PCR
reactions using generic real-time PCR master-mix. It is equally
cost effective as a high-throughput method or for small numbers of
samples and allows for easy inter-laboratory comparison of results.
Our typing scheme for S. aureus could usefully be incorporated into
a progressive hierarchical typing scheme [6]. For S. aureus this
could be used in conjunction with interrogation of hypervariable
regions (e.g., spa typing [15,16]) and virulence and resistance
genes, all of which could be performed on the same technology
platform.
Materials and Methods
Concatenated S. aureus MLST sequencesThe concatenated MLST sequences for 1444 STs (ie up to
ST1508) were downloaded from the S. aureus MLST web site
(saueus.mlst.net) in November 2009. Four STs (STs 753, 957,
1166 and 1471) with an incorrect concatenated sequence length
and one ST (ST1110) with a likely frame shift at position 81 of the
glpF locus were subsequently removed from the alignment. Ten
STs (STs 102, 202, 204, 208, 215, 220, 663, 723, 1079, 1407) were
removed on the basis that their tpi alleles and in some cases pta
alleles were .13% diverged from the other S. aureus alleles and all
but one had a best BLASTn hit to a Staphylococcus species other
than S. aureus. These alleles would likely fail to amplify or amplify
late during PCR using the primers we designed using the S. aureus
allele sequences, due to polymorphisms in the primer binding
regions. These STs were appended to the MelT key (see below)
with a note indicating that one or more of the regions may fail to
amplify, and thus they will not produce a complete MelT profile.
A further nine STs which are likely members of clonal complex 75
(STs 75, 258, 850, 883, 1223, 1284, 1288, 1303, and 1304) were
also removed as this clonal complex shows significant divergence
from other S. aureus and may represent a distinct species or sub-
species [17]. The remaining 1420 concatenated sequences were
analyzed using MEGA 4.02 [18].
Identification of D optimized SNPs useful for HRManalysis
We had previously identified a set of eight SNPs with a
Simpsons Index of Diversity (D) of 0.95 for the MLST dataset [3].
We now aimed to generate a set of D optimized SNPs which were
likely to contribute to a change in the melting temperature of the
DNA (i.e., principally transitions) for interrogation by HRM.
From the original SNP set, we used SNPs which were transitions
for most STs (positions 210, 2100, 2316 and the 2521/2523
combination) as forced inclusions and SNPs which were
transversions (positions 162, 1695 and 2189) as forced exclusions
in Minimum SNPs [1,19]. Any additional SNPs identified by
Minimum SNPs which were transversions for most STs were
further excluded. Transitions which were in close proximity to
each other were favored as they could be included in a single small
PCR product for HRM analysis. Primers were manually designed
in the regions flanking the identified SNPs in each locus to give
products ranging in size from 83–219 bp (Table 1).
HRM curve prediction and assignment of ‘‘Melting Type’’We wrote in-house programs as do files in Stata 10.9
(StataCorp, Texas) to analyze regions internal to the primers.
We have called the program HRMType and it generates a
prediction of the number and order of HRM curves for specified
regions from an input sequence alignment (Text S2 and Text S3).
For simplicity we assumed that amplicons of a given region would
melt in an order based on their G+C content. Each predicted
curve was given a number based on its G+C content and an HRM
profile was generated for each ST based on the expected curve
number for each region. This profile was designated the ‘‘Melting
Type’’ (MelT) for the ST and a key was generated which
facilitated the translation between MelT profile and ST (Data S1).
Comparison with randomly generated fragmentsWe adapted HRMType to calculate the D value for randomly
generated fragments from the concatenated sequence. Individual
fragments were not allowed to span more than one MLST loci in
the concatenated sequence. Initially regions with fixed sizes ranging
from 20 to 200 bp were used and subsequently regions with the
same size as our 6 chosen regions were used. Multiple iterations
allowed us to determine the distributions of D and the transforma-
tion –log10(1-D) for these randomly generated fragments. Addition-
ally, for each position in the MLST concatenated sequence we
performed a multivariate regression analysis with the outcome
variable –log10(1-D) and the independent variable the absence or
presence of that position within the selected fragments. Adjustment
was made for fragment size. The coefficient from the regression
analysis provided a measure of association between each position of
the concatenated sequence and the overall resolving power
obtained. These coefficients of association were plotted against the
concatenated position to generate a SNP association map (Figure 3).
Isolates collection for validation of methodologyIsolates used for this study were clinical S. aureus isolates
collected as part of a case-control study at the Royal Darwin
Hospital from April 2006 to April 2007 [11]. These isolates had
previously been assigned to a clonal complex using a kinetic real
time PCR method [20]. A single colony on Horse Blood agar was
inoculated into 5 mL of Todd-Hewitt broth (Oxoid) and grown
overnight at 37uC with agitation. DNA was extracted from the
pelleted cells using a QIAamp DNA mini kit (Qiagen) using the
protocol for Gram positive bacteria with lysostaphin. Purified
DNA was eluted in 200 ul 10 mM TrisCl, 0.5 mM EDTA, pH9,
and diluted 1:10 in H2O prior to use in real time PCR.
Real time PCR and HRM analysisReal time PCR reactions contained 5 mL 2x PlatinumH SYBRH
Green qPCRSuperMix-UDG (Invitrogen Life Technologies),
0.4 uM each primer and 1 ul of the diluted DNA extraction in
a total volume of 10 ul. The reactions were performed on a on a
Rotorgene 6000 device (Corbett Life Science). Cycling conditions
were 50uC for 2 minutes, 95uC for 2 minutes followed by 40 cycles
of 95uC for 3 seconds, 56uC for 18 seconds and 72uC for 12
seconds. HRM was carried out from 66uC to 84uC in 0.1uCincrements for 2 seconds each. Raw HRM curves were
normalized by the Rotorgene 6000 software v 1.7 (Table 1).
Difference graphs of the normalized curves were obtained using a
ST239 isolate as the baseline curve.
MLST of specific isolates and lociSequencing of selected MLST loci of some isolates was carried out
using standard MLST primers and methodology for S. aureus [21].
MLST Based HRM Typing for S. aureus
PLoS ONE | www.plosone.org 9 June 2011 | Volume 6 | Issue 6 | e19749

Determination of the concordance between HRM typingand the MLST-defined S. aureus population structure
Wallace’s Coefficient was calculated using Comparing Parti-
tions [22]. Determination of the concordance between the
predicted MelT and the MLST-defined population structure of
S. aureus was carried out in silico. An eBURST analysis [23] was
performed on the entire S. aureus MLST database. The group
definition was set to ‘‘six alleles in common’’, and each group was
defined as a clonal complex (CC). ‘‘SubCCs’’ within CCs were
identified on the basis of the presence of a progenitor with at least
five SLVs. In the case of large CCs with several subCCs and
chains of STs with SLV relationships, the boundary between sub-
CCs was placed at the half way point between sub-CC progenitors
on the eBURST diagram. The sensitivity (true positives/(true
positives+false negatives)), specificity (true negatives/(true negati-
ves+false positives)) and positive predictive value (true positives/
(true positives+false positives)) of MelTs for a CC or sub-CC of
interest were calculated.
Estimation of the density of recombined SNPs in MLSTdatasets from different bacterial species
For the MLST datasets of S. aureus, Streptococcus pyogenes,
Campylobacter jejuni, Burkeholderia pseudomallei, Streptococcus pneumoniae,
Enterococcus faecium and Haemophilus influenzae, the following
procedure was followed. Firstly a set of six SNPs that provided
an optimized D value was derived using the software Minimum
SNPs. The derivation was then iterated, with the first five SNPs in
the set held constant, and the increase in resolving power provided
by the 6th SNP recorded. This 6th SNP was then excluded from
analysis in subsequent iterations. This was continued until the
increase in resolving power was five times the maximum increase
that can be conferred by a non-recombined SNP. Six member
SNP sets were used because this provides a comprehensive test of
SNP performance, and also yields manageable numbers of
alterative SNPs that provide a .5X the maximum increase in
resolving power possible for non-recombined SNPs. The ‘‘5X’’
parameter was chosen arbitrarily as representing a figure
considerably greater than that possible from a non-recombined
SNP.
Normalization was required to determine the maximum
increase in resolving power that can be conferred by a non-
recombined SNP for each of the different MLST datasets. This is
because the different datasets provided different resolving powers
from the first five SNPs. Maximum resolving power from
recombined SNPs, expressed in terms of number of genotypes,
increases logarithmically as SNPs are added to the set. Conversely,
maximum resolving power from non-recombined SNPs increases
linearly. The log(number of genotypes), assuming all genotypes all
contain the same number of STs, is equal to –log(1-D). Therefore,
the higher the value of –log(1-D) conferred by the first five SNPs in
the set, the smaller the maximum increase in this parameter that
can be conferred by the addition of a non-recombined SNP to the
set. This may be represented by an exponential decay function: if
PR is the resolving power conferred by a set of SNPs, and MI is the
maximum increase in resolving power that can be conferred by the
addition of a non-recombined SNP to the set, then:
MI = 0.3389e22.116PR (PR and MI are both expressed in terms
of –log(1-D)). For each of the MLST datasets, this function was
used to derive MI from the PR value conferred by the first five
SNPs in the set.
Supporting Information
Data S1 Staphylococcus aureus MelT key.
(XLSX)
Data S2 Comparison of MelT and kinetic PCR SNP typing
results.
(XLS)
Text S1 Suggested protocol for typing of clinical isolates.
(DOC)
Text S2 HRMType program.
(TXT)
Text S3 HRMType Manual.
(PDF)
Acknowledgments
The authors thank Leisha Richardson and staff of the Northern Territory
Government Pathology Service Microbiology Laboratory for technical
assistance. We also thank Geoff Coombs and Julie Pearson of PathWest
Laboratory Medicine, Royal Perth Hospital, Western Australia for
providing an isolate of ST59.
Author Contributions
Conceived and designed the experiments: RAL SYCT PMG DCH.
Performed the experiments: RAL SYCT. Analyzed the data: RAL SYCT
PMG DCH. Contributed reagents/materials/analysis tools: RAL SYCT
PMG DCH. Wrote the paper: SYCT PMG DCH. Wrote the Stata do file
used to generate the Mimin key: SYCT.
References
1. Robertson GA, Thiruvenkataswamy V, Shilling H, Price EP, Huygens F, et al.(2004) Identification and interrogation of highly informative single nucleotide
polymorphism sets defined by bacterial multilocus sequence typing databases.
J Med Microbiol 53: 35–45.
2. Price EP, Thiruvenkataswamy V, Mickan L, Unicomb L, Rios RE, et al. (2006)Genotyping of Campylobacter jejuni using seven single-nucleotide polymor-
phisms in combination with flaA short variable region sequencing. J MedMicrobiol 55: 1061–1070.
3. Huygens F, Inman-Bamber J, Nimmo GR, Munckhof W, Schooneveldt J, et al.
(2006) Staphylococcus aureus genotyping using novel real-time PCR formats. J Clin
Microbiol 44: 3712–3719.
4. Honsa E, Fricke T, Stephens AJ, Ko D, Kong F, et al. (2008) Assignment of
Streptococcus agalactiae isolates to clonal complexes using a small set of single
nucleotide polymorphisms. BMC Microbiol 8: 140.
5. Stephens AJ, Huygens F, Inman-Bamber J, Price EP, Nimmo GR, et al. (2006)Methicillin-resistant Staphylococcus aureus genotyping using a small set of
polymorphisms. J Med Microbiol 55: 43–51.
6. Keim P, Van Ert MN, Pearson T, Vogler AJ, Huynh LY, et al. (2004)Anthrax molecular epidemiology and forensics: using the appropriate
marker for different evolutionary scales. Infect Genet Evol 4: 205–
213.
7. Filliol I, Motiwala AS, Cavatore M, Qi W, Hazbon MH, et al. (2006) Globalphylogeny of Mycobacterium tuberculosis based on single nucleotide polymorphism
(SNP) analysis: insights into tuberculosis evolution, phylogenetic accuracy of
other DNA fingerprinting systems, and recommendations for a minimalstandard SNP set. J Bacteriol 188: 759–772.
8. Richardson LJ, Tong SYC, Towers RJ, Huygens F, McGregor K, et al. (2010)
Preliminary validation of a novel high resolution melt-based typing method basedon the multilocus sequence typing scheme of Streptococcus pyogenes.
Clin Microbiol Infect (in press). doi: 10.1111/j.1469-0691.2010.03433.x.
9. Kibbe WA (2007) OligoCalc: an online oligonucleotide properties calculator.
Nucleic Acids Res 35: W43–46.
10. Schildkraut C (1965) Dependence of the melting temperature of DNA on salt
concentration. Biopolymers 3: 195–208.
11. Tong SY, Bishop EJ, Lilliebridge RA, Cheng AC, Spasova-Penkova Z, et al.
(2009) Community-associated strains of methicillin-resistant Staphylococcus aureus
and methicillin-susceptible S. aureus in Indigenous northern Australia: epidemi-
ology and outcomes. J Infect Dis 199: 1461–1470.
12. Coombs GW, Monecke S, Ehricht R, Slickers P, Pearson JC, et al. (2010)Differentiation of clonal complex 59 community-associated methicillin-resistant
Staphylococcus aureus in Western Australia. Antimicrob Agents Chemother 54:
1914–1921.
MLST Based HRM Typing for S. aureus
PLoS ONE | www.plosone.org 10 June 2011 | Volume 6 | Issue 6 | e19749

13. Pearson T, Giffard P, Beckstrom-Sternberg S, Auerbach R, Hornstra H, et al.
(2009) Phylogeographic reconstruction of a bacterial species with high levels oflateral gene transfer. BMC Biol 7: 78.
14. Hall TA, Sampath R, Blyn LB, Ranken R, Ivy C, et al. (2009) Rapid molecular
genotyping and clonal complex assignment of Staphylococcus aureus isolates byPCR coupled to electrospray ionization-mass spectrometry. J Clin Microbiol 47:
1733–1741.15. Shopsin B, Gomez M, Montgomery SO, Smith DH, Waddington M, et al.
(1999) Evaluation of protein A gene polymorphic region DNA sequencing for
typing of Staphylococcus aureus strains. J Clin Microbiol 37: 3556–3563.16. Tong SY, Lilliebridge RA, Holt DC, McDonald MI, Currie BJ, et al. (2009)
High-resolution melting analysis of the spa locus reveals significant diversitywithin sequence type 93 methicillin-resistant Staphylococcus aureus from northern
Australia. Clin Microbiol Infect 15: 1126–1131.17. Ng JW, Holt DC, Lilliebridge RA, Stephens AJ, Huygens F, et al. (2009)
Phylogenetically distinct Staphylococcus aureus lineage prevalent among indigenous
communities in northern Australia. J Clin Microbiol 47: 2295–2300.18. Tamura K, Dudley J, Nei M, Kumar S (2007) MEGA4: Molecular Evolutionary
Genetics Analysis (MEGA) software version 4.0. Mol Biol Evol 24: 1596–1599.
19. Price EP, Inman-Bamber J, Thiruvenkataswamy V, Huygens F, Giffard PM
(2007) Computer-aided identification of polymorphism sets diagnostic for groups
of bacterial and viral genetic variants. BMC Bioinformatics 8: 278.
20. Tong SY, Lilliebridge RA, Bishop EJ, Cheng AC, Holt DC, et al. (2010) Clinical
correlates of Panton-Valentine leukocidin (PVL), PVL isoforms, and clonal
complex in the Staphylococcus aureus population of Northern Australia. J Infect Dis
202: 760–769.
21. Enright MC, Day NP, Davies CE, Peacock SJ, Spratt BG (2000) Multilocus
sequence typing for characterization of methicillin-resistant and methicillin-
susceptible clones of Staphylococcus aureus. J Clin Microbiol 38: 1008–1015.
22. Carrico JA, Silva-Costa C, Melo-Cristino J, Pinto FR, de Lencastre H, et al.
(2006) Illustration of a common framework for relating multiple typing methods
by application to macrolide-resistant Streptococcus pyogenes. J Clin Microbiol
44: 2524–2532.
23. Feil EJ, Li BC, Aanensen DM, Hanage WP, Spratt BG (2004) eBURST:
Inferring Patterns of Evolutionary Descent among Clusters of Related Bacterial
Genotypes from Multilocus Sequence Typing Data. J Bacteriol 186: 1518–1530.
MLST Based HRM Typing for S. aureus
PLoS ONE | www.plosone.org 11 June 2011 | Volume 6 | Issue 6 | e19749