Embed Size (px)
Citation preview

Charitable Behaviour and the Big Five Personality Traits: Evidence from UK Panel Data Sarah Brown and Karl Taylor ISSN 1749-8368 SERPS no. 2015017 July 2015

Charitable Behaviour and the Big Five Personality Traits:
Evidence from UK Panel Data Sarah Brown and Karl Taylor
Department of Economics University of Sheffield
9 Mappin Street Sheffield S1 4DT
Abstract: This paper investigates the association between personality traits and charitable behaviour, namely donations of time and money, using data from Understanding Society, the most recent large scale UK longitudinal household survey. Due to the censored nature of the outcome variables, i.e. some individuals do not engage in charitable behaviour, we employ tobit and censored quantile regression models. Personality traits are classified according to the ‘Big Five’ taxonomy: openness to experience; conscientiousness; extraversion; agreeableness; and neuroticism. In general, after conditioning on an extensive set of controls, conscientiousness and neuroticism are found to be inversely related to donating time and money, whilst openness to experience, which has a positive effect, is the dominant trait in terms of magnitude. Interestingly, personality traits are found to have a stronger correlation with donations of time and money at the extreme points of the distribution of donations relative to that at the median, thereby highlighting the additional information revealed by the quantile approach.
Keywords: Charitable donations; Volunteering; Personality traits; Tobit model; Censored quantile regression.
JEL classification: C24; D03; H41; N3.
Acknowledgements: We are grateful to the Data Archive at the University of Essex for supplying Understanding Society waves 1 to 4. We would like to thank Pamela Lenton and Bert van Landeghem for helpful suggestions. We are grateful to participants at the European Research Network on Philanthropy, 7th International Conference, Paris, July 2015, for excellent suggestions and advice.
July 2015

2
1. Introduction and Background
Recent figures from Giving U.S.A. 2014 estimate total charitable contributions in the U.S. in
2013 at $335.17 billion, whilst, for the UK, the Charities Aid Foundation estimates total
donations by adults in 2012/13 at £10.4 billion. According to the Corporation for National
and Community Service (2012), about 64.5 million Americans, or 26.5% of the adult
population, gave 7.9 billion hours of volunteer service worth $175 billion in 2012.
Corresponding figures for volunteering time in the UK produced by the Office for National
Statistics (ONS) estimate that in 2012 2.29 billion hours were volunteered which equates to
an average of 8 hours per individual,1 see ONS (2013). Hence, it is not surprising that an
extensive economics literature on charitable donations exists, which has focused on the
decision to donate at the individual or household level, with much attention paid to the impact
of tax deductibility and the associated price and income effects.
In contrast to the disciplines of psychology and sociology, the role of personality traits
on charitable behaviour has arguably attracted limited attention in the economics literature.
Personality traits are described by McCrae and Costa (1999) as ‘enduring patterns of
thoughts, feelings, and actions’ (p. 140). Hence, it is not surprising that the implications of
personality traits for economic outcomes such as earnings, employment status and financial
decision-making, have started to attract the attention of economists (see, for example,
Almlund et al., 2011, Caliendo et al., 2012, and Heineck and Anger, 2010). However, to date
there is little evidence in the economics literature on the role of personality traits in
influencing charitable behaviour. It is this gap in the existing economics literature, which this
paper aims to contribute to.
In terms of reasons why individuals may choose to donate either time and/or money,
in general, the economics literature has adopted a utility maximising framework, where utility
1 Note that both figures are based upon those who volunteer at least once per year.
3
= (ℎ , ,ℎ , ) is an increasing function of: hours volunteered (unpaid labour) ℎ ;
monetary donations to charity ; hours worked in the labour market ℎ ; and hours not
worked, i.e. leisure time, . It is possible to think of two mechanisms by which time and
money donations may impact upon utility in a positive way with both operating through the
impure altruistic motive. The first is warm glow which arises as a feel good factor from
donating, Andreoni and Payne (2013), whilst the second operates through perceived social
image, the prestige motive, whereby social approval is sought by the individual, Ellingsen
and Johannesson (2009) and Cappellari et al. (2011). Whilst a large number of both empirical
and theoretical studies exist in the economics literature exploring why individuals make
monetary contributions to charity, in contrast the economics literature on volunteering is
much smaller. The following provides a brief discussion of the literature on money and time
donations.
Andreoni (2006) and Andreoni and Payne (2013) provide extensive surveys of the
influences on charitable donations established in the existing literature. Common findings are
that monetary donations are influenced by income (Auten et al., 2002) and that they fluctuate
over the lifecycle: for example Glenday et al. (1986) found monetary donations to be an
increasing function of age. Similarly, Schokkaert (2006) finds that older and more educated
individuals give more. Household composition has been found to play a role, where evidence
from existing studies has generally shown that married households, households with
dependent children, households with a female head and religious households give more in
absolute terms.
Menchik and Weisbrod (1987) was one of the first papers in the economics literature
to explicitly investigate the supply of volunteer labour. They found that in the U.S. price and
income effects were important determinants of volunteering time, a finding similar to that of
monetary donations (see, for example, Andreoni and Payne, 2013). An influential paper by

4
Freeman (1997) noted that volunteering is a substantial economic activity in the U.S. yet it
receives no monetary compensation. By adopting standard labour supply side analysis, he
argued that volunteering is a “conscience good or activity” which individuals feel morally
obligated to undertake through, for example, peer and/or social pressure. Moreover, contrary
to the labour supply model, he finds little evidence that the amount of time volunteered is
influenced by the opportunity cost of time, i.e. in a standard labour supply model people
should volunteer less when the wage offer is high.
Brown and Lankford (1992) was one of the first papers in the economics literature to
explicitly investigate whether monetary and time donations were complements or substitutes,
whereby they simultaneously estimated the determinants of both types of charitable
behaviour allowing for censoring at zero, i.e. some individuals donate neither time and/or
money. Based upon a unique U.S. sample, they found evidence in favour of complementarity.
More recently, the literature has continued to investigate donations of time and money in a
bivariate framework, for example Apinunmahakul et al. (2009), Cappellari et al. (2011) and
Bauer et al. (2013), i.e. thereby allowing for potential simultaneous decision making. Based
on a large cross sectional Canadian sample of individuals, Apinunmahakul et al. (2009)
examine the number of hours volunteered and the amount donated to charity in 1997. They
show that there is a positive correlation in the unobservables between time and money
donations suggesting complementarity between the two forms of charitable behaviour. Using
cross-sectional data for Italian individuals, Cappellari et al. (2011) also find evidence in
favour of complementarity. In addition, they report differences across gender relating in
particular to the responsiveness of males to changing opportunity costs. Using data from the
European Social Survey for nineteen countries, Bauer et al. (2013) focus on the role of
income and opportunity costs in influencing time and money donations and the extent to
which the different types of charitable behaviour are interrelated. They report positive
5
associations between monetary and time donations, although the extent of the correlation
varies according to the type of charitable organisation – being largest for religious
organisations. In accordance with the existing literature, higher educational attainment,
higher income and religious individuals are more likely to donate money. Whilst those with a
lower opportunity cost of time, for example part-time workers or those without dependent
children, are more likely to volunteer time.2
Other factors which may affect volunteering and monetary donations, which are
typically difficult to isolate and until recently were generally absent from large scale sample
surveys, are personality traits. The “Big Five” personality traits, which are analysed in this
paper, have been increasingly incorporated in such surveys and, hence, have started to be
incorporated into models of economic behaviour and decision-making. The Big Five
personality trait taxonomy was developed by Costa and McCrae (1992) and has been widely
used to classify personality traits in the psychology literature (see Gosling et al., 2003). This
taxonomy classifies individuals according to five factors: openness to experience;
conscientiousness; extraversion; agreeableness and neuroticism (emotional instability).
Almlund et al. (2011), p. 18, comment that “the Big Five factors represent personality traits at
the broadest level of abstraction.”
Other disciplines, such as psychology, political science and sociology, have
recognised the potential effects of personality traits on charitable behaviour and have tended
to focus on volunteering and prosocial behaviour (rather than donations of money). Existing
studies have found a positive relationship between extraversion and the likelihood of
volunteering, see, for example, Bekkers (2010), Okun et al. (2007) and Omoto et al. (2010),
whilst Bekkers (2005) finds that volunteering is related to openness, conscientiousness and 2 Although not the primary focus of our analysis, ascertaining whether money and time donations are complements or substitutes is important for policy analysis. For example, if they are complements then tax deduction for cash gifts has the additional benefit of increasing the amount of time volunteered, Andreoni (2006). Interestingly, a recent paper employing a full structural model of time and money donations reports evidence that the two are substitutes, see Feldman (2010).

6
extraversion. Such findings indicate the importance of the unobserved heterogeneity of
individuals in determining charitable behaviour.
In this paper, we use Understanding Society, the UK Household Longitudinal Study
(UKHLS), to investigate the relationship between the Big Five personality traits and
charitable donations of both time (unpaid volunteering) and money from an empirical
perspective. This paper makes three main contributions to the existing literature. Firstly, we
are aware of no other empirical study for the UK which has analysed the relationship between
the Big Five personality traits and charitable behaviour. Moreover, the sample is large scale
and representative of the population whereas the literature to date, which has examined the
role of personality on charitable behaviour for other countries, has tended to use small sample
surveys or experiments which are arguably not representative of the population, e.g. Ben-Ner
et al. (2004), where the empirical analysis is based on 50 observations. Our second main
contribution relates to the fact that the UKHLS is panel survey, which allows us to track
individuals over time. The existing literature, which has focused on both donations of time
and money, has predominantly used cross-sectional data. The availability of panel data
enables us to reduce the potential for reverse causality since the measurement of personality
traits and charitable behaviour occurs at different points in time.3 Finally, as well as
evaluating the effects of personality traits at the mean via the use of tobit estimators, which
have been commonly used in the existing literature, we also explore their association with
donations of time and money across the entire distribution of charitable behaviour using a
censored quantile regression approach. The flexibility of such an approach potentially unveils
a more detailed picture of the determinants of charitable behaviour.
3 This approach to reduce causality by exploiting timing differences between personality traits and the outcome of interest is akin to that taken by Heineck and Anger (2010) who investigate the relationship between cognitive ability, personality and earnings.

7
2. Data
We use data drawn from Understanding Society, the UK Household Longitudinal Study
(UKHLS), to investigate the relationship between the Big Five personality traits and
charitable donations of time (i.e. unpaid volunteering) and money. The UKHLS is designed
to capture life in the UK and how it is changing over time. The survey builds upon its
predecessor, the British Household Panel Survey (BHPS), which covered the period 1991 to
2008. Participants live in Scotland, Wales, Northern Ireland and England. The survey
contains information about people’s social and economic circumstances, attitudes, behaviours
and health. In the first wave of the UKHLS, over 50,000 individuals were interviewed
between 2009 and 2011, correspondingly in the latest wave (wave 4) over 47,000 individuals
were interviewed between 2012 and 2014.
Interviews for wave 4 contain information on the monetary amount donated to charity
over the last twelve months and the number of hours of unpaid labour volunteered in the last
four weeks. Interviews for wave 3 of the UKHLS, which were conducted between 2011 and
2013, contain information on the Big Five personality traits, namely openness to experience,
conscientiousness, extraversion, agreeableness and neuroticism. Matching the two waves, i.e.
waves 3 and 4, and dropping observations with missing responses to the key questions yield a
sample size of 31,409 individuals aged 16 and over.
We estimate models of: (i) the amount of charitable donations; (ii) the amount of
charitable donations as a proportion of the individual’s annual total income (from
employment, benefits and other sources); and (iii) the number of hours volunteered,
conditional on an extensive set of socio-economic covariates, , as well as the Big Five
personality traits, . The modelling approaches are detailed in Section 3 below. In order to
mitigate against the potential problem of life cycle effects influencing personality traits and
the subsequent measurement error this might induce, following the existing literature, we

8
condition each personality trait (i.e. one of the Big Five =1,…,5) on a polynomial in age , i.e. = + . The resulting residuals, i.e. = , are standardised (zero mean
and unit standard deviation) and used as indicators of personality traits net of life cycle
influences (see, for example, Nyhus and Pons, 2005, and Brown and Taylor, 2014).
Furthermore, as is common in the existing literature, we expect personality traits to be stable
amongst adults, see, for example, Cobb-Clark and Schurer (2012, 2013) and, hence, fixed
(i.e. time invariant), see Nyhus and Pons (2005) and Heineck and Anger (2010). This implies
that they are not driven by the outcome of interest, i.e. in the current application charitable
behaviour, and can effectively be deemed as plausibly exogenous.
Covariates in include: gender; ethnicity, whether white British, black and Asian
(other ethnicity is the reference category); age,4 specifically aged 16-24, aged 25-29, aged 30-
34, aged 35-39, aged 40-44, aged 45-49, aged 50-54, aged 55-59, aged 60-64, aged 65-69 and
aged 70-74 (75 plus is the reference category); the number of children in the household, aged
2 or under, aged between 3-4, aged 5-11 and aged 12-15; the number of adults in the
household; married or cohabiting; highest educational qualification, i.e. degree
(undergraduate or postgraduate), Advanced (A) level, General Certificate of Secondary
Education (GCSE), and all other qualifications (no education is the omitted category);5 the
natural logarithm of monthly labour income; the natural logarithm of monthly non-labour
income; the natural logarithm of monthly savings; labour force status, specifically whether
employed, self-employed, or unemployed (all other labour market states constitute the
reference category);6 housing tenure, whether the home is owned outright, owned via a
4 Whilst personality traits have been purged of life cycle effects, by also conditioning charitable outcomes on age this enables the age of the individual to have a direct influence upon their donating behaviour in addition to the influence of age on personality traits. 5 GCSE level qualifications are taken after eleven years of formal compulsory schooling and approximate to the U.S. honours high school curriculum. The A level qualification is a public examination taken by 18 year olds over a two year period studying between one to four subjects and is the main determinant of eligibility for entry to higher education in the UK. 6 This includes retirement, family care, full time students and the long-term sick or disabled.

9
mortgage or privately rented (all other types of tenure make up the omitted category);
religious denomination, whether Church of England, Roman Catholic, other Christian,
Muslim, or other religion (no religion is the reference category); active membership of a
church or religious group; to capture peer effects (see Andreoni and Payne, 2013, and Smith,
2012), the number of friends the individual has and whether the individual currently belongs
to a social website; current health state, specifically whether in excellent health, very good
health, good health or fair health (with poor and very poor health the reference category);
whether currently living in an urban area; eleven region of residence controls (with London
as the reference category); and eleven month of interview binary controls (with January as the
reference category).
Following Freeman (1997) and Bauer et al. (2013), additional variables are included
in the vector when modelling the number of hours volunteered to proxy the opportunity
cost of time. In particular, we include the following controls: total hours per week spent in
paid employment,7 doing housework and travelling to work; being completely dissatisfied
with the amount of leisure time; and the number of hours spent caring per week, specifically
whether up to 4 hours, 5-9 hours, 10-19 hours, 20-34 hours, 35-49 hours, 50-99 hours and
100 hours or above (no time spent caring is the omitted category).
When modelling the level of charitable donations and donations as a proportion of
total income, the additional covariates included in the vector are: the frequency of using the
internet, i.e. daily, weekly or monthly (never is the reference category). The logic behind its
inclusion is to account for the individual’s social networks, see Andreoni and Payne (2013).
We also include controls for how the individual receives news, namely via the radio,
television, internet or newspaper (with other means as the reference category); and the
proportion of households donating by local area district (LAD) for age specific reference 7 If labour markets are imperfect then the individual’s working hours become the theoretically relevant variable in determining voluntary labour supply, rather than the market wage since this is no longer measuring the opportunity cost of an additional hour of time, see Clotfelter (1985) and Brown and Lankford (1992).

10
groups. The idea here is that individual donations may be influenced by the donations of
those in the same social reference space, i.e. LAD-age group, see Andreoni and Scholz
(1998).
Summary statistics are given in Table 1A for the three dependent variables.8 The top
part of the table reports the descriptive statistics including individuals who do not donate time
and/or money. The average number of hours volunteered during the last 4 weeks is just over
2 and the natural logarithm of the monetary amount donated to charitable causes during the
past year is 2.89 or approximately £142. Evaluated as a weekly amount, i.e. £2.73, this figure
is comparable to that found by Smith (2012) using an alternative UK data source, the Living
Costs and Food Survey (LCFS).9 Charitable donations over the past year as a proportion of
annual income are low, on average, at around 0.7% However, based on those who do donate
to charity, this figure increases to over 1%, see final row of Table 1A. Focusing on each of
the dependent variables for non-zero values, it can be seen from Table 1A that around 15% of
individuals volunteer unpaid hours, with the mean at 12 hours over the last 4 weeks, and 67%
of the sample made a monetary donation to charity during the past year with an average of
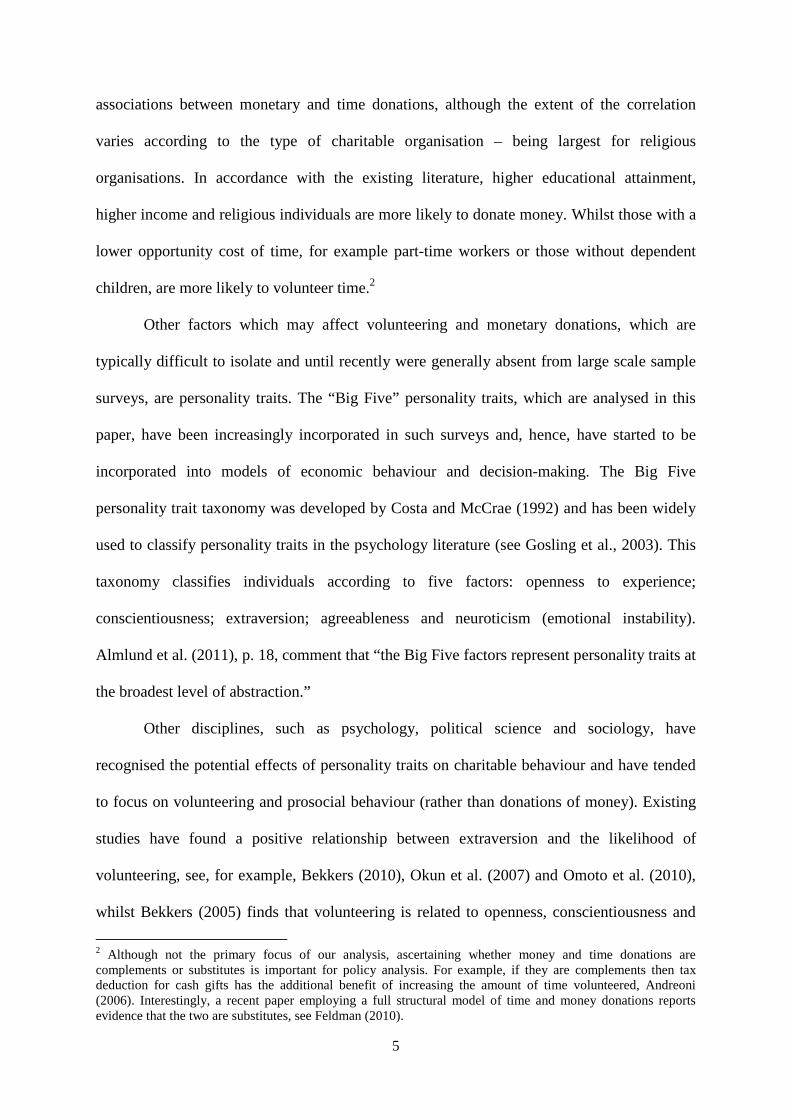
4.34 log units or approximately £213. Figures 1 to 3 show the distributions of the dependent
variables conditional on non-zero values. In Table 1B, summary statistics are provided for the
explanatory variables, where around 44% are male and 39% are aged between 35 and 54.
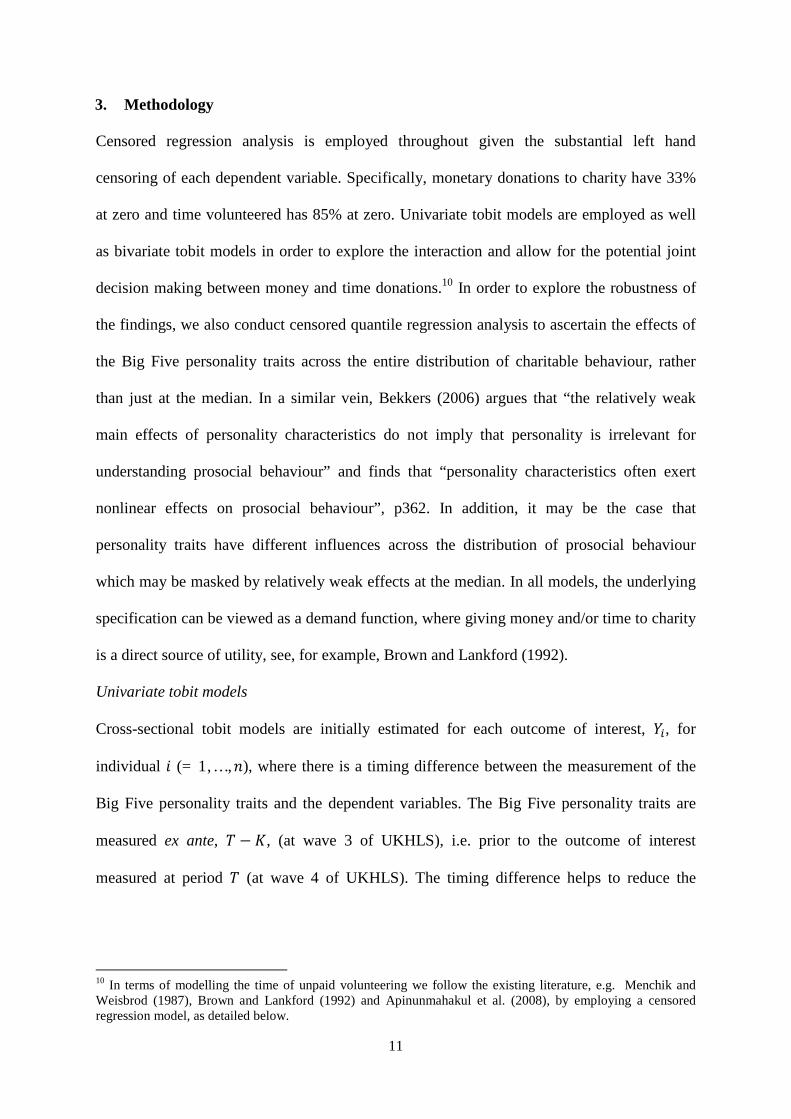
Finally, Figure 4 shows the distribution of the standardised residuals for each personality trait
where clearly both agreeableness and conscientiousness are skewed to the left hand side of
the distribution compared to other elements of the Big Five personality traits. Hence, even
though personality traits have been standardised, in terms of their first and second moments,
the presence of skewness might imply that they will have differential effects on charitable
behaviour.
8 All monetary variables are deflated to 2009 constant prices. 9 The LCFS was formerly known as the Expenditure and Food Survey and the Family Expenditure Survey.
11
3. Methodology
Censored regression analysis is employed throughout given the substantial left hand
censoring of each dependent variable. Specifically, monetary donations to charity have 33%
at zero and time volunteered has 85% at zero. Univariate tobit models are employed as well
as bivariate tobit models in order to explore the interaction and allow for the potential joint
decision making between money and time donations.10 In order to explore the robustness of
the findings, we also conduct censored quantile regression analysis to ascertain the effects of
the Big Five personality traits across the entire distribution of charitable behaviour, rather
than just at the median. In a similar vein, Bekkers (2006) argues that “the relatively weak
main effects of personality characteristics do not imply that personality is irrelevant for
understanding prosocial behaviour” and finds that “personality characteristics often exert
nonlinear effects on prosocial behaviour”, p362. In addition, it may be the case that
personality traits have different influences across the distribution of prosocial behaviour
which may be masked by relatively weak effects at the median. In all models, the underlying
specification can be viewed as a demand function, where giving money and/or time to charity
is a direct source of utility, see, for example, Brown and Lankford (1992).
Univariate tobit models
Cross-sectional tobit models are initially estimated for each outcome of interest, , for
individual (= 1, … , ), where there is a timing difference between the measurement of the
Big Five personality traits and the dependent variables. The Big Five personality traits are
measured ex ante, − , (at wave 3 of UKHLS), i.e. prior to the outcome of interest
measured at period (at wave 4 of UKHLS). The timing difference helps to reduce the
10 In terms of modelling the time of unpaid volunteering we follow the existing literature, e.g. Menchik and Weisbrod (1987), Brown and Lankford (1992) and Apinunmahakul et al. (2008), by employing a censored regression model, as detailed below.

12
potential for reverse causality since, as argued by Angrist and Pischke (2009), the Big Five
personality traits are measured ex ante, that is, predating the outcome variable of interest:
∗ = + + (1)
= max[0, ∗ ] . Equation (1) is estimated as a tobit regression model, where ∗ is the unobserved untruncated
latent dependent variable and is the censored dependent variable.
Wave 2 of UKHLS also provides comparable information on charitable behaviour.
Specifically, there are two periods, = 1, 2, waves 2 and 4, providing information on
charitable behaviour, enabling us to track individuals over time. Hence, in order to explore
the robustness of our cross-sectional findings, we construct an unbalanced panel of 66,193
observations (36,070 individuals) and estimate a random effects tobit model as follows:
∗ = + + + (2)
= max[0, ∗] where ∗ is the unobserved untruncated latent dependent variable and is the censored
dependent variable. The individual specific unobservable effect in the error term is denoted
by , i.e. a random effect ~ (0, ), and is a white noise error term, i.e. ~ (0, ).11 This specification allows for correlation between the error terms of
individuals over time, i.e. = ( + )⁄ , which represents the proportion of the total
unexplained variance in the dependent variable contributed by the panel level variance
components. If the panel component of the data is important then we would expect ≠ 0 ,
where the magnitude of the parameter indicates the extent of the unobservable intra-personal
correlation in donating behaviour over time.
11 It is not possible to estimate a fixed effects tobit model (see, for example Honoré, 1992, for a semi parametric approach) in this particular application whereby is a fixed rather than a random effect, since personality traits are time invariant, which makes the estimation of the key parameters of interest, , infeasible.

13
Bivariate tobit models
Following Brown and Lankford (1992), we also estimate bivariate tobit models to investigate
whether there is a positive correlation in the unobservables driving monetary donations, ,
and volunteering, i.e. time donations, , as follows:
∗ = + + (3)
∗ = + + = max[0, ∗ ], = max[0, ∗ ] where , ~ (0,0, , , )
and the covariance between the error terms is denoted by , = . In the bivariate tobit model, the disturbance terms, and , are jointly
normally distributed with variances and , respectively. If the correlation term, , is
zero, then the amount donated to charity and the number of hours volunteered are
independent. If ≠ 0, then this implies a degree of inter-dependence between charitable
donations of time and money. For example, if is positive, this accords with them being
complements.
In each of the above models, the parameters of interest are the estimates of: (equation 1); (equation 2); and (equation 3), which will inform us of the
association between the individual elements of the Big Five personality traits and each
outcome of interest, whilst controlling for an extensive set of explanatory variables.
Censored quantile regression models
As detailed in the previous section, many individuals in the sample do not make monetary or
time donations and, hence, a significant proportion of the data is censored. The univariate and
bivariate tobit models assume normality and homoscedasticity and the estimates are based at
the mean of the outcome. An alternative estimator, which allows an examination of the
complete distribution, is a censored quantile regression (CQR), see Powell (1986) and

14
Chernozhukov and Hong (2002). The CQR is thus able to capture heterogeneous effects
across the distribution by computing estimates at different quantiles (Koenker, 2005). The
following discussion explains how the CQR model is estimated.
The quantile regression model of Koenker and Bassett (1978) is given by: ( | ) = (4)
where denotes the conditional quantile of the dependent variable and ⊆ , . The estimator is found by the following minimisation problem:
min 1 | − | + (1 − )| − | . (5)
The CQR estimator is found by solving the following (Powell, 1986):
min 1 [{ − ( < max{0, })}( − max{0, })] (6)
where is a binary indicator equal to unity if the expression holds and zero otherwise. Powell
(1986) showed that the CQR estimator is consistent, independent of the distribution of the
error term, not based on the assumption of constant variance: so heteroscedasticity is not a
problem and the model is robust to outliers. Whilst equation (5) is a linear function, max{0, } in equation (6) is non-linear. In order to solve the model, we follow the three
step approach of Chernozhukov and Hong (2002).12 The resulting estimator is shown by
Chernozhukov and Hong (2002) to be both consistent and efficient. The CQR model is
estimated in STATA using the ‘cqiv’ routine and standard errors are obtained via a weighted
bootstrap with 200 replications, see Chernozhukov et al. (2015).
12 In the first step, the sub-sample of individuals who donated to charity (i.e. time or money) is predicted by a logit model. The sub-sample is defined as = { : ∗ > 1 − − }, where defines the quantile of interest, is a trimming constant (set equal to 0.05, see Buchinsky and Hahn, 1998) and ∗ is a desired transformation of ( , ), with denoting the censoring points (see Chernozhukov and Hong, 2002). In the second step, the initial estimator is determined from equation (5) for the sample . The initial estimator is used to select the sub-sample = ∗ > 0 and then the model is estimated in the third step with equation (5) for the sample .
15
4. Results
In what follows, we present results for each outcome of interest based on univariate and
bivariate tobit specifications followed by the results from the censored quantile regression
analysis. For the univariate tobit models, we present average marginal effects (dy/dx)
throughout based on the expected value of the dependent variable for uncensored
observations given a vector of covariates and parameters , i.e. for a unit change in ℎ , defined as follows: [ | > 0, ] ℎ = 1 − − (7)
where = /Φ and and Φ denote the density and cumulative distributions of
the standard normal distribution, respectively, see Wooldridge (2010). This allows us to
ascertain the association of covariates with the outcome of interest conditional on selection,
i.e. making a monetary donation or volunteering time, i.e. > 0.
Univariate tobit results – monetary donations
The estimates of equations (1) and (2) appertaining to cross-sectional and panel tobit models,
respectively, are reported in Tables 2A and 2B, which present the results for the natural
logarithm of charitable donations, and Tables 3A and 3B, which present the equivalent
estimates for charitable donations as a proportion of income. Finally, Tables 4A and 4B
present the results relating to the number of hours volunteered. In each table, there are two
columns, where the first column provides the estimates of the cross-sectional analysis and the
second column shows the panel data results, which take into account intra-personal
correlation in donating behaviour over time.
We initially focus on the results from modelling the natural logarithm of charitable
donations. Table 2A reports the full results for both the cross-sectional and panel data
specifications, where each of the Big Five personality traits are measured ex ante, i.e. at time

16
− . Before focusing on the association between personality traits and charitable
donations, i.e. the estimates of from equation (1) and from equation (2), we briefly
comment on the other covariates and how the findings relate to the existing literature.
Compared to the omitted age category of 75 and above, individuals in all other age
categories donate a lower monetary amount. These findings are consistent with the evidence
in the existing literature, such as Lankford and Wyckoff (1991), Auten and Joulfaian (1996)
and Schokkaert (2006). With the exception of those aged 16-24, the effects are statistically
significant. Evaluating the expected value function (from equation 1) of logged charitable
donations, when all covariates, including the dummy variables, are equal to 0 (in the
reference categories), then: = 0, = 0 = Φ( ⁄ ) + ( ⁄ ). (8)
The intercept from the model is denoted by and is the standard error of the regression
equation. Hence, from Table 2A:
= 0, = 0 = [Φ(−5.34 2.91⁄ ) × −5.34] + [2.91 × (−5.34 2.91⁄ )] = 0.038
The log level of charitable donations is 0.038 for those aged 75 and over as compared to {0.038 + (−)0.86} = −0.82 for those aged 35 to 44. Thus, evaluated at the mean (see Table
1A), individuals in this mid-age category make monetary donations 22 times lower than those
aged 75 and over, i.e. 0.134 compared to 2.891 log units or £6.58 compared to £142.
Males donate approximately 25 percentage points less than females, which is
consistent with the existing literature, see, for example, Brown et al. (2012). Household
composition is clearly of importance where having children aged 2 or under, in comparison to
having no children, is inversely related to the level of donations. Interestingly, there are no
statistically significant effects from having children aged between 3 and 15. Furthermore, the
amount donated is inversely (positively) related to the number of adults in the household
17
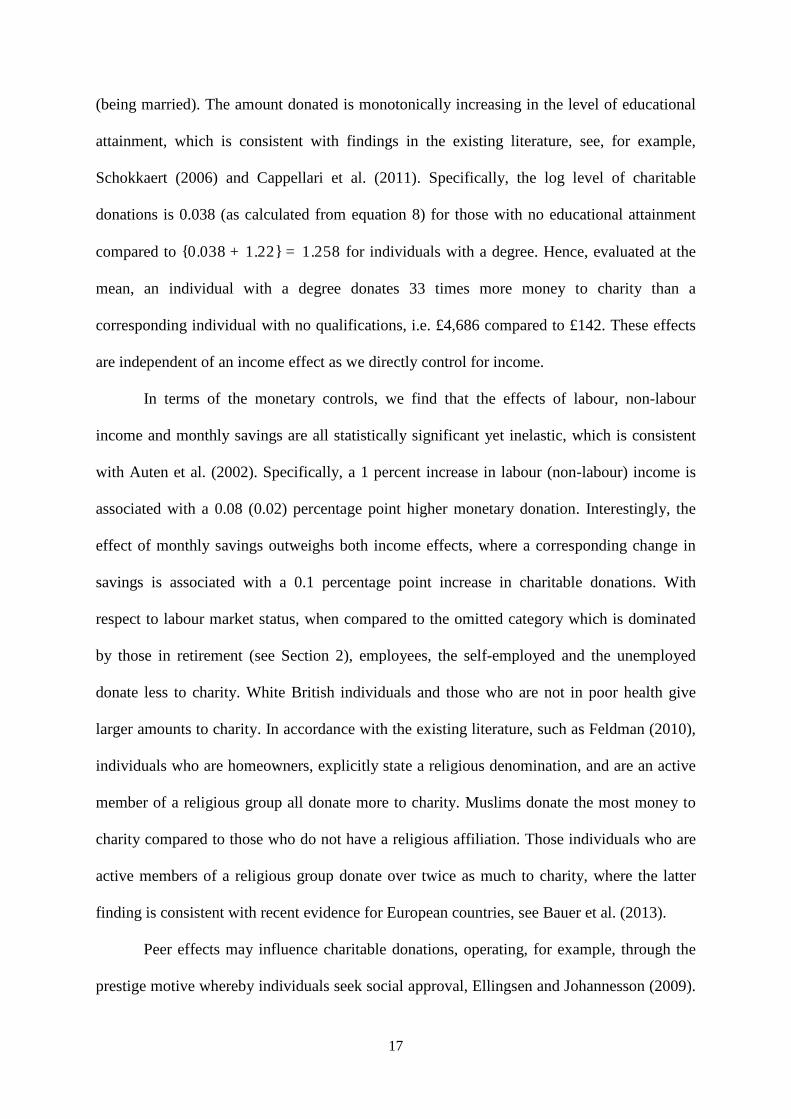
(being married). The amount donated is monotonically increasing in the level of educational
attainment, which is consistent with findings in the existing literature, see, for example,
Schokkaert (2006) and Cappellari et al. (2011). Specifically, the log level of charitable
donations is 0.038 (as calculated from equation 8) for those with no educational attainment
compared to {0.038 + 1.22} = 1.258 for individuals with a degree. Hence, evaluated at the
mean, an individual with a degree donates 33 times more money to charity than a
corresponding individual with no qualifications, i.e. £4,686 compared to £142. These effects
are independent of an income effect as we directly control for income.
In terms of the monetary controls, we find that the effects of labour, non-labour
income and monthly savings are all statistically significant yet inelastic, which is consistent
with Auten et al. (2002). Specifically, a 1 percent increase in labour (non-labour) income is
associated with a 0.08 (0.02) percentage point higher monetary donation. Interestingly, the
effect of monthly savings outweighs both income effects, where a corresponding change in
savings is associated with a 0.1 percentage point increase in charitable donations. With
respect to labour market status, when compared to the omitted category which is dominated
by those in retirement (see Section 2), employees, the self-employed and the unemployed
donate less to charity. White British individuals and those who are not in poor health give
larger amounts to charity. In accordance with the existing literature, such as Feldman (2010),
individuals who are homeowners, explicitly state a religious denomination, and are an active
member of a religious group all donate more to charity. Muslims donate the most money to
charity compared to those who do not have a religious affiliation. Those individuals who are
active members of a religious group donate over twice as much to charity, where the latter
finding is consistent with recent evidence for European countries, see Bauer et al. (2013).
Peer effects may influence charitable donations, operating, for example, through the
prestige motive whereby individuals seek social approval, Ellingsen and Johannesson (2009).

18
The number of friends that the individual has is statistically significantly associated with the
level of monetary donations, and the positive relationship is consistent with a priori
expectations. Membership of social networks is also found to be important with those
individuals who are a member of a social website donating 6.7 percentage points more to
charity than those who do not belong to such a website. Similarly, the frequency of using the
internet is positively related to the amount donated. For example, those who use the internet
on a daily basis donate {0.038 + 0.29} = 0.33, i.e. 9 times the amount compared to those
who do not use the internet. Evaluated at the mean, this equates to donations of £1,233
compared to £142. Such findings endorse the importance of social networks in influencing
charitable behaviour, as discussed by Andreoni and Payne (2013).
Information sources, such as how news is acquired, may also be important for
donating behaviour. For example, media coverage of natural disasters, such as the 2004
Indian Ocean tsunami or Hurricane Katrina, may raise awareness of the need for donations
(sometimes including specific appeals for donations in news bulletins) thereby increasing
donations to charity. We find that each key source of news is positively associated with the
level of charitable donations. The proportion of individuals who donate to charity in the same
local area district and age group also has a positive relationship with the level of money
given, which is consistent with peer group effects from those in the same social reference
space, see Andreoni and Scholz (1998). Specifically, a 1 percent increase in those donating to
charity within the same LAD-age group is associated with a 1.08 percentage point increase in
the donation level. Similarly, the social context has been shown to be an important factor in
potentially influencing donation behaviour, where larger social networks seem to increase the
propensity to volunteer (Okun et al., 2007).
With respect to the Big Five personality traits, we find that agreeableness,
extraversion and openness to experience are all positively and significantly related to
19
monetary donations to charitable causes. The positive effect for agreeableness ties in with the
description of agreeable individuals being altruistic and trusting (McCrae and Costa, 1999).
The largest effect stems from openness to experience, where a one standard deviation
increase is associated with a 6.4 percentage point rise in the amount given. Interestingly, this
contrasts with the findings of Bekkers (2010), who found no role for openness to experience
on influencing the probability of donating, but is consistent with the experimental evidence of
Ben-Ner et al. (2004). Conscientiousness is inversely related to charitable donations, albeit, at
the 10 percent level of statistical significance. This finding is consistent with the results of
Donnelly et al. (2012), who report that individuals who are highly conscientious are more
able to manage their money through greater levels of financial self-control.
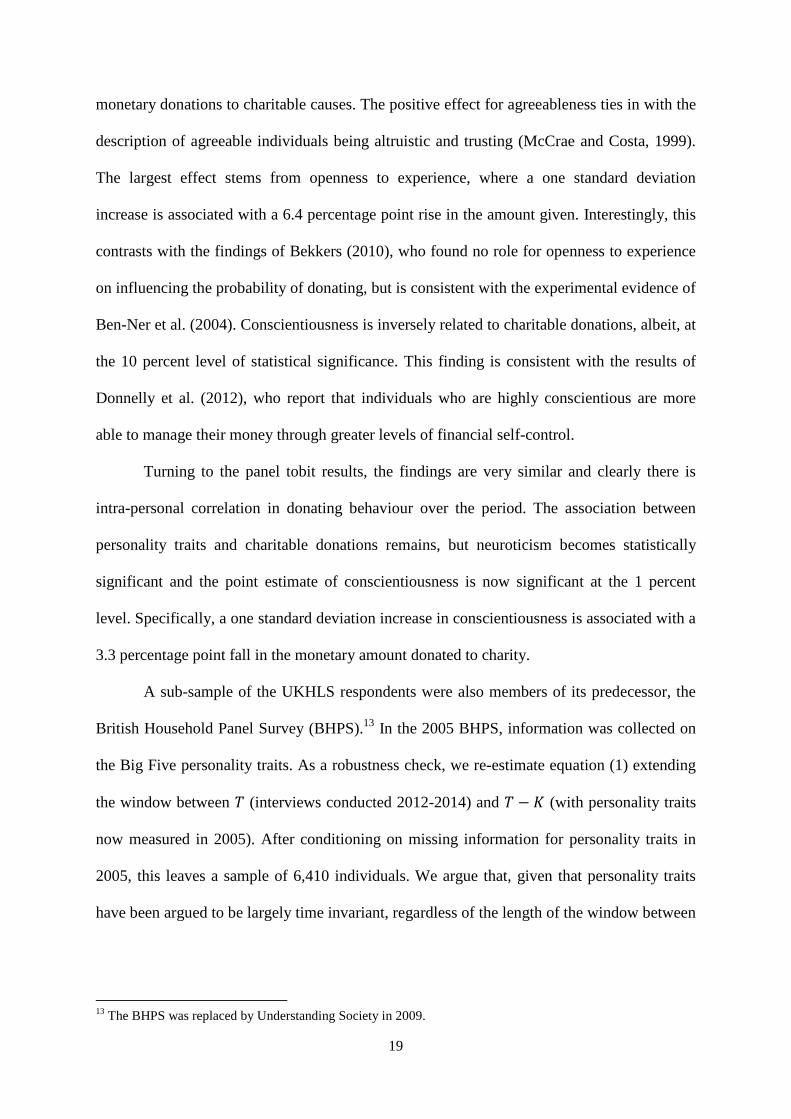
Turning to the panel tobit results, the findings are very similar and clearly there is
intra-personal correlation in donating behaviour over the period. The association between
personality traits and charitable donations remains, but neuroticism becomes statistically
significant and the point estimate of conscientiousness is now significant at the 1 percent
level. Specifically, a one standard deviation increase in conscientiousness is associated with a
3.3 percentage point fall in the monetary amount donated to charity.
A sub-sample of the UKHLS respondents were also members of its predecessor, the
British Household Panel Survey (BHPS).13 In the 2005 BHPS, information was collected on
the Big Five personality traits. As a robustness check, we re-estimate equation (1) extending
the window between (interviews conducted 2012-2014) and − (with personality traits
now measured in 2005). After conditioning on missing information for personality traits in
2005, this leaves a sample of 6,410 individuals. We argue that, given that personality traits
have been argued to be largely time invariant, regardless of the length of the window between
13 The BHPS was replaced by Understanding Society in 2009.

20
and − , there should be similar effects from personality traits measured in 2005 in
terms of their direction of influence, magnitude and statistical significance.14
Figure 5 shows the distribution of each of the Big Five personality traits measured in
the UKHLS (i.e. 2011-2013) and the BHPS in 2005. Clearly, the distribution of each
personality trait is very similar between the two time periods in which the individual is
observed and consequently is suggestive of time invariance, which gives credence to the
notion that the Big Five personality traits are exogenous. Table 2B has the same structure as
Table 2A, and only coefficients and marginal effects associated with the Big Five personality
traits are shown for brevity. The relationship between agreeableness, extraversion and
openness to experience and charitable donations is similar for this sub-sample. For a one
standard deviation increase in a given personality trait the largest differential in comparison
to the full sample comes from openness to experience where the difference between the
marginal effects of the full sample (Table 2A) and the sub-sample (Table 2B) is 0.029, for
agreeableness and extraversion the corresponding differences are 0.006 and 0.0008,
respectively. This suggests that personality traits are stable over time and can hence
potentially be considered as exogenous. Similar effects are also apparent for when a panel is
created from the sub-sample of individuals, where consistent with the analysis for the full
14 Prevoo and ter Weel (2015) examine the role of conscientiousness upon a number of socio-economic outcomes, e.g. adult wages, employment, education, health and savings. Using British cohort data they argue that if a personality trait is measured at two intervals it may be possible to alleviate potential measurement error in personality traits. If measurement error does exist in the Big Five then this could bias our analysis. Hence, following Prevoo and ter Weel (2015), in the cross sectional models of equation (1) we have undertaken an instrumental variable approach to investigate the role of personality traits on charitable donations. Under the assumption that measurement error in the Big Five at time − (i.e. 2012-2014) is uncorrelated with measurement error at time − =2005, which would seem valid given the gap in the measurement of personality traits, it is possible to use the 2005 BHPS personality traits as instruments for those measured later from the UKHLS. Hence, in the first stage we regress the following model, for each personality trait j, = + + , obtaining , which is standardised to have a zero mean and standard deviation of unity, then the second stage regression takes the form ∗ = + ∑ + where standard errors are bootstrapped with 200 repetitions given the generated nature of . The first stage results yield F-statistics for each trait in excess of the threshold of 10 suggested by Stock et al. (2002). The results of the second stage are similar to those reported in Table 2 in terms of the ranking of magnitudes of the Big Five, direction of association with charitable donations, and statistical significance. Full results are available on request.

21
sample, statistical precision is improved and there is clear evidence of intra-personal
correlation in the unobservables over time.
We also consider charitable donations of money over the past twelve months as a
proportion of annual income. The results are shown in Tables 3A and 3B, where, for brevity,
only the parameters and marginal effects associated with personality traits are provided and
both tables have the same structure as Tables 2A and 2B. Table 3A focuses on personality
traits measured from wave 2 of the UKHLS at time − with the dependent variable
measured at time , whilst Table 3B provides analysis with personality traits measured from
the 2005 BHPS for the sub-sample of individuals who were interviewed in both the BHPS
and UKHLS. The results are consistent with those found in Tables 2A and 2B when focusing
on the level of monetary donations in that the personality trait which has the largest effect is
openness to experience. For example, a one standard deviation increase in openness to
experience is associated with a 2.7 percentage point increase in the proportion of annual
income donated to charitable causes. The direction of correlation and ranking of the
magnitude of the effects of the other personality traits are also in line with the results found
when analysing the level of monetary donations.
Univariate tobit results – time donation
In Tables 4A and 4B rather than focusing on monetary contributions to charity, attention is
turned to investigating the association between personality traits and the number of hours of
unpaid volunteering during the past month. The tables are constructed as previously showing
cross-sectional and panel results where Table 4A (4B) employs measures of personality traits
at − from the UKHLS (2005 BHPS). Before focusing on the relationship between
personality traits and hours volunteered, i.e. the estimates of from equation (1) and from equation (2), we briefly comment on the other covariates and how the findings relate to
the existing literature.

22
Considering Table 4A, contrary to the results obtained from modelling monetary
donations, the effects of age, where statistically significant, are positive: relative to those
aged over 75, individuals in the age groups covering ages 45 to 74 volunteer more of their
time (this is evident in the results from the cross-section and panel data analysis). These
findings are consistent with those of Menchik and Weisbrod (1987) and Freeman (1997) for
the U.S. Similarly, whilst there was no association found between the number of children and
charitable donations of money, there is clearly a statistically significant relationship between
the composition of the family and volunteering. It should be noted that this effect exists after
controlling for time commitments. For example, the number of children aged 2 or under is
inversely associated with the number of hours volunteered, whilst having children aged
between 5 and 11 is positively related with volunteering. This finding, which is consistent
with Bauer et al. (2013), may reflect a network effect once the child starts school and parents,
for example, discuss issues with their contemporaries and/or participate in school clubs.
Hence, it appears that the age of child is important and this helps to shed further light on the
finding of Freeman (1997) that volunteering is positively associated with the number of
children.
Volunteering is increasing in educational attainment, which is consistent with the
findings of Cappellari et al. (2011) for Italy and Freeman (1997) for the U.S. In terms of
monetary effects, there is a positive association between non-labour income and volunteering,
and between savings and time volunteered, where a 1 percent increase in monthly saving is
associated with a 0.13 hour increase in volunteering (approximately 8 minutes). Perhaps
surprisingly, labour income is statistically insignificant in determining time volunteered (yet
was significantly positively associated with monetary donations). This may be because we
explicitly control for the opportunity cost of time, which includes the number of hours in
employment, although Bauer et al. (2013) still found a role for income (however their

23
measure is household labour income rather than that of the individual). We define the
opportunity cost of time as the sum of the number of hours per week spent in paid
employment, doing housework and commuting to work. As argued by Clotfelter (1985), if
labour markets are imperfect focusing on hours in paid employment is relevant for
determining volunteer labour supply rather than income from employment. In accordance
with Bauer et al. (2013), we find a negative association between hours in paid employment
and time volunteered which is as expected since this picks up the opportunity cost of
volunteering. However, whether the individual is dissatisfied with the amount of leisure time
they have is perhaps surprisingly unrelated to hours volunteered. Interestingly, in terms of
time spent caring for others per week compared to the omitted category of zero hours,
spending up to 19 hours caring for others is associated with a higher amount of hours
volunteered. Consistent with the findings for monetary donations, social connections appear
to be important as the number friends that the individual has, being an active member of a
religious group, and being a member of a social website are all positively related to time
spent volunteering. Whilst living in an urban area has no impact on charitable donations of
money, those individuals who live in an urban area spend less time volunteering, which
accords with the results of Bekkers (2010).
In terms of the role of the Big Five personality traits, we find that extraversion and
openness to experience are both positively and significantly associated with the time spent
volunteering, whilst neuroticism is inversely related to hours volunteered. The positive role
found for extraversion is consistent with Bekkers (2010), Okun et al. (2007) and Omoto et al.
(2010), and in accordance with the characteristics of extraversion put forward by McCrae and
Costa (1999) including sociability and activity. The largest absolute effect stems from
openness to experience, as found when focusing on monetary donations, where a one
standard deviation increase is associated with 0.36 more hours volunteered, i.e.

24
approximately 20 minutes. These results hold in the panel data analysis, with the exception
that agreeableness now becomes statistically significant, and when we focus upon the sub-
sample of individuals where personality traits are measured from the 2005 BHPS.
Specifically, as can be seen from Table 4B, a one standard deviation increase in neuroticism
(openness to experience) is associated with 0.29 (0.42) less (more) hours volunteered, i.e.
approximately 18 (25) minutes.
After including an extensive set of controls, in the univariate tobit specifications,
personality traits are found to influence charitable behaviour, i.e. donating money and/or
volunteering time, and the effects are not arguably trivial in terms of economic magnitude. To
evaluate the role of personality traits on model performance, we consider alternative
specifications where the Big Five personality traits are omitted from the analysis and we
compare the pseudo R-squared, Akaike’s and Schwarz’s Bayesian information criteria (AIC
and BIC) between the specifications. The results are shown in Table 5, where each column
shows an alternative outcome of charitable behaviour. The first row of the table provides the
model diagnostics when personality traits are excluded from the set of control variables,
whilst the second row provides the corresponding summary statistics once the Big Five
personality traits are included. Clearly, across each outcome of charitable behaviour, the
pseudo R-squared is higher and both the AIC and BIC are lower when personality traits are
included as covariates revealing that they improve model performance in terms of modelling
charitable behaviour.
Bivariate tobit results – monetary and time donations
We now turn to consider joint models of money donations to charity and volunteering unpaid
labour. Estimates of equation (3) are reported in: Table 6 which shows the results of jointly
modelling the natural logarithm of charitable donations, , and the number of hours
volunteered, ; whilst Table 7 provides the analysis of jointly modelling charitable donations

25
as a proportion of annual income and of the number of hours volunteered, . Equation (3) is
estimated by a Conditional (recursive) Mixed Process estimator in STATA using the ‘cmp’
routine, see Roodman (2011).
We provide four sets of conditional average marginal effects:15 (i) dy/dx| denotes
average marginal effects for log charitable donations (or donations as a proportion of income,
see Table 7) conditional on covariates and hours volunteered, i.e. the other dependent
variable, being equal to zero; (ii) dy/dx| denotes average marginal effects for log
charitable donations (or donations as a proportion of income, see Table 7) conditional on
covariates and hours volunteered, i.e. the other dependent variable, being non-zero
(volunteers); (iii) dy/dx| denotes average marginal effects for hours volunteered
conditional on covariates and log charitable donations (or donations as a proportion of
income, see Table 7), i.e. the other dependent variable, being equal to zero; and (iv) dy/dx| denotes average marginal effects for hours volunteered conditional on covariates and
log charitable donations (or donations as a proportion of income, see Table 7), i.e. the other
dependent variable, being non-zero (donators).
Both Tables 5 and 6 have two panels where for brevity only the estimates of the Big
Five personality traits are presented, i.e. the estimates of and , which are measured ex
ante, i.e. at time − : in Panel A, the Big Five are obtained from the UKHLS, whilst in
Panel B, we focus on a sub-sample where personality traits are merged in from the 2005
BHPS. Figure 6 shows two plots of charitable donations against the number of hours
volunteered, in Panel A the scatter plot is conditional on evidence of charitable behaviour,
that is making a monetary donation or volunteering time, whilst in Panel B the scatter plot is
conditional on individuals making both a monetary donation and volunteering time. The
positive correlation found (shown by the line of best fit) accords with complementarity
15 That is conditional on covariates and the value of the other dependent variable.

26
between the two types of charitable behaviour. Further light is shed on this by the fact that,
across all the results shown in Tables 5 and 6, we find that the correlation in the error terms
of equation (3), , is positive and statistically significant. Hence, there is a degree of inter-
dependence between charitable donations of time and money which is consistent with
complementarity and a result, which is in common with the much of the existing literature,
such as Apinunmahakul et al. (2009), Hartmann and Werding (2012) and Bauer et al. (2013),
but is at odds with Feldman (2010), who employs a full structural model of time and money
donations to analyse the impact of a preferential tax price for monetary donations. Our results
suggest that, even after conditioning upon an extensive set of controls, there are unobserved
characteristics, such as an individual's altruistic attitude, that determine whether a person
contributes to charity or not in terms of time or money. Alternatively, as argued by Freeman
(1997), it may be the case that those individuals who provide voluntary labour to a specific
organisation have more information about its activities than non-volunteers and hence have a
higher probability of making a monetary donation.
Considering the joint estimation of log charitable donations and hours volunteered,
the results in Table 6 indicate a role for agreeableness, extraversion, neuroticism and
openness to experience. For example, focusing on the full sample in Panel A, the effect of a
one standard deviation increase in extraversion (openness to experience) upon charitable
donations conditional on being a non-volunteer, i.e. = 0, is for donations to increase by
3.74 (4.81) percentage points. Correspondingly, the same effect conditional on the individual
also volunteering unpaid labour, i.e. ≠ 0, is for donations to increase by 3.9 percentage
points for extraversion and 5.14 percentage points for openness to experience. Hence, not
surprisingly, the effects of personality traits where statistically significant are larger when
individuals undertake both types of charitable behaviour. Turning attention to the number of
hours volunteered, it can be seen that extraversion and openness to experience are both

27
positively associated with volunteer labour supply, whilst neuroticism has a statistically
significant inverse relationship. Again the marginal effects are slightly larger when
individuals undertake both types of charitable behaviour. For example, the effect of a one
standard deviation increase in openness to experience on time spent volunteering, conditional
on being a non-donator, i.e. =0, is to provide 0.33 hours (20 minutes). This compares to
0.38 hours or 23 minutes when we condition on donators, i.e. ≠ 0. Similar results are
found when personality traits are measured from the 2005 BHPS, see Panel B of Tables 5 and
6.
Extending the above analysis for the full UKHLS sample in Figure 7, we plot average
marginal effects of personality traits for log charitable donations, , conditional on
covariates and the decile of hours volunteered, , i.e. the other dependent variable (for
volunteers), that is from the tenth decile dy/dx| [ ] through to the ninetieth decile dy/dx| [ ]. Similarly, in Figure 8 we do this for the number of hours volunteered conditional
on covariates and the decile of the log charitable donation, i.e. from the tenth decile dy/dx| [ ] through to the ninetieth decile dy/dx| [ ]. In both figures, only statistically
significant conditional marginal effects associated with the personality traits are shown. It is
evident from Figures 7 and 8 that the conditional marginal effects from personality traits
increase or decrease monotonically in terms of magnitude across the distribution of the other
dependent variable, which is again consistent with complementarity between the two forms
of giving.
Censored quantile regression results – money and time donations
Table 8 presents the results of estimating equation (6). For brevity, we only report the
coefficients associated with the personality traits. The advantage of the CQR estimator is that
it is robust to both heteroscedasticity and non-normality. In addition, it allows an examination
of the entire distribution rather than focusing solely on the mean. In Panels A and B,

28
coefficients are reported across each decile of the distribution from modelling the natural
logarithm of charitable donations and donations as a proportion of annual income,
respectively. Panel C of Table 8 presents the results of estimating the model for the number
of hours volunteered, where, given the extensive amount of censoring, we focus on
conditional quantiles from the fortieth decile and above. For all estimates reported, we focus
on the full sample of 31,409 individuals, where the dependent variable is measured at time
(2012-2014) and the Big Five personality traits are observed ex ante at time − (2011-
2013).16
Consistent with the results reported in Tables 2A and 2B, where statistically
significant, conscientiousness has a negative association with charitable donations across the
distribution, see Table 8 Panel A. Interestingly, agreeableness, extraversion and openness to
experience have the largest associations with monetary donations to charity below the
median, specifically, for each of the aforementioned personality traits, this is at the twentieth
decile. For example, a one standard deviation increase in openness to experience is associated
with an 11.75 percent increase in charitable donations at the twentieth decile. This effect is
much larger than the corresponding increase at the median at around 7.52 percent, where the
association at the median is in line with the tobit estimates of Table 2A based on the mean (at
6.4 percent).
Whilst the largest effects on monetary donations to charity are largely evident below
the median, indeed towards the bottom end of the distribution, when we consider charitable
donations as a proportion of income and the number of hours volunteered, see Panels B and C
respectively, the largest correlations, where statistically significant, are observed above the
median – usually at the eightieth or ninetieth decile. For example, a one standard deviation
increase in agreeableness (openness to experience) is associated with a 2.85 (8.26) percent 16 For brevity, we do not report the results based on the sub-sample of 6,410 individuals, where personality traits are measured from the 2005 BHPS. In general, the results which follow are consistent with those based on this sub-sample. These results are available on request.

29
increase in donations as a proportion of income at the eightieth (ninetieth) decile. In
accordance with the tobit analysis of Tables 4A and 4B, neither agreeableness nor
conscientiousness are found to have any statistically significant association with the number
of hours volunteered across any point of the distribution. Neuroticism, where statistically
significant, is negatively correlated with volunteer labour supply, whilst extraversion and
openness to experience have a positive relationship with hours volunteered, which is again
consistent with the tobit analysis of Tables 4A and 4B. The association between openness to
experience and number of hours volunteered is large at the top end of the distribution, with a
one standard deviation increase associated with 0.97 more of an hour, or 58 minutes,
volunteered at the ninetieth decile. Similar effects are found from extraversion and
neuroticism increasing and decreasing the number of hours volunteered in the top decile by
49 and 50 minutes, respectively.
In summary, the censored quantile regression results have revealed that, in general,
personality traits have the largest association with each type of charitable behaviour away
from the median, specifically at the extreme points of the distribution. Whilst the effects at
the median are found to be similar to those from the tobit estimates, which are based on the
mean, the correlation between personality traits and charitable donations of time and money
are much larger in magnitude at the bottom and top of the respective distributions, thereby
endorsing the use of the quantile regression approach to further our understanding of the
determinants of charitable behaviour.
5. Conclusion
This paper has investigated the relationship between personality traits and charitable
behaviour in the UK using the latest panel data available drawn from a large scale household
survey, which is representative of the population. Our contribution to the existing literature is
threefold. Firstly, we are aware of no other empirical study for the UK which has analysed

30
the relationship between the Big Five personality traits and charitable behaviour. Our second
contribution relates to the fact that the UKHLS is a panel survey, which has allowed us to
track individuals over time. The availability of panel data has enabled us to reduce the
potential for reverse causality since the measurement of personality traits and charitable
behaviour occurs at different points in time. Finally, as well as evaluating the effects of
personality traits at the mean via the use of tobit estimators, which have been commonly used
in the existing literature, we have also explored their association with donations of time and
money across the entire distribution of charitable behaviour using a censored quantile
regression approach.
After including an extensive set of controls, in the univariate tobit specification
personality traits are found to influence charitable behaviour, based on the univariate tobit
estimates, where statistically significant, conscientiousness and neuroticism are found to be
inversely associated with donations of both time and money. Openness to experience is found
to have the largest positive association with charitable donations and the number of hours
volunteered. These results also hold when we focus on parts of the distribution of charitable
behaviour other than the mean via censored quantile regression analysis. There is also some
evidence that money and time donations are complementary which is consistent with recent
findings in the literature for European countries, see Bauer et al. (2013). Hence, in terms of
policy, tax breaks for monetary donations may be associated with an increase in volunteer
labour supply. One area which we are unable to explore relates to whether the effects of
personality traits differ across different charitable causes such as helping the homeless versus
contributing to appeals for foreign aid. Unfortunately the UKHLS does not allow a
decomposition of monetary donations and time donations by charitable cause. Thus, this
remains an interesting potential avenue for future research.

References
Almlund, M., Duckworth, A. L., Heckman, J. and Kautz, T. (2011). Personality psychology
and economics. IZA DP. Number 5500.
Andreoni, J. (2006). Philanthropy. In The handbook of the economics of giving, altruism and
reciprocity, (eds) Kolm, S. C. and Ythier, J. M., Chapter 18, pages 1201-69. Elsevier
North Holland.
Andreoni, J. and Payne, A. (2013). Charitable giving. In Handbook of public economics,
Volume Five, (eds) Auerbach, A. J., Chetty, R., Feldstein, M. and Saez, E., Chapter 1,
pages 1-50. Elsevier North Holland.
Andreoni, J. and Scholz, J. (1998). An econometric analysis of charitable giving with
interdependent preferences. Economic Inquiry, 36, 410-28.
Angrist, J. and Pischke, J.-S. (2009). Mostly harmless econometrics: An empiricists
companion. Princeton: Princeton University Press.
Apinunmahakul, A., Barham, V. and Devlin, R. (2009). Charitable giving, volunteering and
the paid labour market. Nonprofit and Voluntary Sector Quarterly, 38, 77-94.
Auten, G. E. and Joulfaian, D. (1996). Charitable contributions and intergenerational
transfers. Journal of Public Economics, 59, 55-68.
Auten, G. E., Sieg, H. and Clotfelter, C. T. (2002). Charitable giving, income, and taxes: An
analysis of panel data. American Economic Review, 92, 371-82.
Bauer, T. K., Bredtmann, J. and Schmidt, C. M. (2013). Time vs. money – The supply of
voluntary labor and charitable donations across Europe. European Journal of Political
Economy, 32, 80-94.
Bekkers, R. (2005). Participation in voluntary associations: Relations with resources,
personality, and political values. Political Psychology, 26, 439-54.

32
Bekkers, R. (2006). Traditional and health-related philanthropy: The role of resources and
personality. Social Psychology Quarterly, 69, 349-66.
Bekkers, R. (2010). Who gives what and when? A scenario study of intentions to give time
and money. Social Science Research, 39, 369-81.
Ben-Ner, A., Putterman, L., Kong, F. and Magan, D. (2004). Reciprocity in a two-part
dictator game. Journal of Economic Behavior and Organization, 53, 333-52.
Brown, V. and Lankford, H. (1992). Gifts of money and gifts of time: Estimating the effects
of tax prices and available time. Journal of Public Economics, 47, 321-41.
Brown, S., Harris, M. N. and Taylor, K. (2012). Modelling charitable donations to an
unexpected natural disaster: Evidence from the U.S. Panel Study of Income Dynamics.
Journal of Economic Behavior and Organization, 84, 97-110.
Brown, S. and Taylor, K. (2014). Household finances and the ‘big five’ personality traits.
Journal of Economic Psychology, 45, 197-212.
Buchinsky, M. and Hahn, J. (1998). An alternative estimator for the censored quantile
regression model. Econometrica. 66, 653-71.
Caliendo, M., Fossen, F. and Kritikos, A. (2012). Trust, positive reciprocity, and negative
reciprocity: Do these traits impact entrepreneurial dynamics? Journal of Economic
Psychology, 33, 394-409.
Cappellari, L., Ghinetti, P. and Turati, G. (2011). On time and money donations. Journal of
Socio-Economics, 40, 853-67.
Chernozhukov, V. and Hong, H. (2002). Three-step censored quantile regression and
extramarital affairs. Journal of the American Statistical Association, 97, 872-82.
Chernozhukov, V., Fernández-Val, I. and Kowalski, A. (2015). Quantile regression with
censoring and endogeneity. Journal of Econometrics, 186, 201-21.

33
Clotfelter, C. T. (1985). Federal tax policy and charitable giving. University of Chicago
Press, Chicago IL.
Cobb-Clark, D. and Schurer, S. (2012). The stability of Big-Five personality traits.
Economics Letters, 115, 11-5.
Cobb-Clark, D. and Schurer, S. (2013). Two economists’ musings on the stability of locus of
control. Economic Journal, 123, F358-400.
Corporation for National and Community Service (2012). Research brief: Volunteering in
America research highlights. https://www.independentsector.org/volunteer_time.
Costa, P. T. and McCrae, R. R. (1992). Revised NEO personality inventory (NEO-PI-R) and
NEO five factor inventory (NEO-FFI) professional manual. Odessa, FL: Psychological
Assessment Resources.
Donnelly, G., Iyer, R. and Howell, R. (2012). The big five personality traits, material values,
and financial well-being of self-described money managers. Journal of Economic
Psychology, 33, 1129-42.
Ellingsen, T. and Johannesson, M. (2009). Time is not money. Journal of Economic Behavior
and Organization, 72, 96-102.
Feldman, N. E. (2010). Time is money: Choosing between charitable activities. American
Economic Journal: Economic Policy, 2, 103-30.
Freeman, R. (1997). Working for nothing: The supply of volunteer labor. Journal of Labor
Economics, 15, S140-66.
Glenday, G., Gupta, A. K. and Pawlak, H., (1986). Tax incentives for personal charitable
donations. Review of Economics and Statistics, 68, 688-93.
Gosling, S., Rentfrow, P. and Swann, W. (2003). A very brief measure of the big-five
personality domains. Journal of Research in Personality, 37, 504-28.

34
Hartmann, B. and Werding, M. (2012). Donating time or money: Are they substitutes or
complements? CESifo working paper: Behavioural Economics, No. 3835
Heineck, G. and Anger, S. (2010). The returns to cognitive skills abilities and personality
traits in Germany. Labour Economics, 17, 535-46.
Hill, M. (2012). The relationship between volunteering and charitable giving: A review of the
evidence. CGAP Working Paper.
Honoré, B. (1992). Trimmed lad and least squares estimation of truncated and censored
regression models with fixed effects. Econometrica, 60, 533-65.
Koenker, R. and Bassett Jr., G. (1978). Regression quantiles. Econometrica, 46, 33-50.
Koenker, R. (2005). Quantile Regression. Cambridge University Press.
Lankford, R. H. and Wyckoff, J. H. (1991). Modeling charitable giving using a Box–Cox
standard tobit model. Review of Economics and Statistics, 73, 460-70.
McCrae, R. R., and Costa, P. T. (1999). A five-factor theory of personality. In Handbook of
personality: Theory and research (2nd ed.), (eds) Pervin, L. A. and John, O. P., Chapter
5, pages 139-53. New York: Guilford Press.
Menchik, P. L. and Weisbrod, B. A. (1987). Volunteer labor supply. Journal of Public
Economics, 32, 159-83.
Nyhus, E. K. and Pons, E. (2005). The effects of personality on earnings. Journal of
Economic Psychology, 26, 363-84.
Okun, M. A., Pugliese, J. and Rook, K. S. (2007). Unpacking the relation between
extraversion and volunteering in later life: The role of social capital. Personality and
Individual Differences, 42, 1467-77.
Omoto, A., Snyder, M. and Hackett, J. (2010). Personality and motivational antecedents of
activism and civic engagement. Journal of Personality, 78, 1703-34.
35
ONS, (2013). Household satellite accounts: Valuing voluntary activity in the UK
http://www.ons.gov.uk/ons/rel/wellbeing/household-satellite-accounts/valuing-
voluntary-activity-in-the-uk/art--valuing-voluntary-activity-in-the-uk.html.
Powell, J. L. (1986). Censored regression quantiles. Journal of Econometrics. 32, 143-55.
Prevoo, T. and ter Weel, B. (2015). The importance of early conscientiousness for socio-
economic outcomes: Evidence from the British Cohort Study. Oxford Economic
Papers. Forthcoming.
Roodman, D. (2011). Fitting fully observed recursive mixed-process models with CMP. The
Stata Journal, 11, 159-206.
Schokkaert, E. (2006). Empirical analysis of transfer motives. In The handbook of the
economics of giving, altruism and reciprocity, (eds) Kolm, S. C. and Ythier, J. M.,
Chapter 2, pages 127-81. Elsevier North Holland.
Smith, S. (2012). Increasing charitable giving: What can we learn from economics? Fiscal
Studies, 33, 449-66.
Stock, J. H., Wright, J. H. and Yogo, M. (2002). A survey of weak instruments and weak
identification in Generalized Method of Moments. Journal of Business and Economic
Statistics, 20, 518-29.
Wooldridge, J. (2010). Econometric Analysis of Cross Section and Panel Data. MIT Press.

FIGURE 1: Number of hours volunteered in the last 4 weeks (volunteers only)
FIGURE 2: Natural logarithm of charitable donations over past 12 months (donators only)
010
2030
40Pe
rcen
t
25 50 75 100 125 150 175 2001Hours spent volunteering in last 4 weeks
05
1015
Perc
ent
0 2 4 6 8 10Log charitable donations

FIGURE 3: Charitable donations over past 12 months (donators only) as a proportion of total income
FIGURE 4: Distributions of the standardised Big5 personality traits (residuals)
010
2030
40Pe
rcen
t
0 .01 .02 .03 .04 .05 .06 .07 .08 .09 .1 .11 .12Charitable donations as a proportion of annual income
0.1
.2.3
.4
-5 -4 -3 -2 -1 0 1 2
Agreeableness
0.1
.2.3
.4
-4 -3 -2 -1 0 1 2
Conscientiousness
0.1
.2.3
.4
-2 -1 0 1 2 3
Neuroticism
0.1
.2.3
.4
-4 -2 0 2
Extraversion
0.1
.2.3
.4
-3 -2 -1 0 1 2
Openness to experience

FIGURE 5: Distributions of the Big 5 personality traits in the UKHLS and BHPS 2005: sub-sample of 6,410 individuals
0.1
.2.3
.4
-4 -3 -2 -1 0 1 2
UKHLS BHPS 2005
Agreeableness
0.1
.2.3
.4
-4 -3 -2 -1 0 1 2 3
UKHLS BHPS 2005
Conscientiousness
0.1
.2.3
.4
-2 -1 0 1 2 3
UKHLS BHPS 2005
Neuroticism0
.1.2
.3.4
-4 -3 -2 -1 0 1 2
UKHLS BHPS 2005
Extraversion0
.1.2
.3.4
-3 -2 -1 0 1 2
UKHLS BHPS 2005
Openness to experience

FIGURE 6: Scatter plot of log charitable donations against number of hours volunteered
02
46
810
Log
char
itabl
e do
natio
n
0 50 100 150 200hours spent volunteering in last 4 weeks
Panel A: Donator or volunteer0
24
68
10Lo
g ch
arita
ble
dona
tion
0 50 100 150 200hours spent volunteering in last 4 weeks
Panel B: Donator and volunteer

FIGURE 7: Bivariate tobit model log charitable donations and hours volunteered – Conditional marginal effects over distribution of the second outcome
All marginal effects shown are significant at the 5 or 1 percent level.
.048
.048
3.0
486
.048
9.0
492
.049
5.0
498
Mar
gina
l effe
ct o
penn
ess
to e
xper
ienc
e
10 20 30 40 50 60 70 80 90Decile of volunteering (volunteers)
Log charitable donations
.037
4.0
3755
.037
7.0
3785
.038
.038
15.0
383
.038
45M
argi
nal e
ffect
ext
rave
rsio
n
10 20 30 40 50 60 70 80 90Decile of volunteering (volunteers)
Log charitable donations
.045
.045
25.0
455
.045
75.0
46.0
4625
.046
5M
argi
nal e
ffect
agr
eeab
lene
ss
10 20 30 40 50 60 70 80 90Decile of volunteering (volunteers)
Log charitable donations.3
4.3
45.3
5.3
55.3
6.3
65.3
7.3
75.3
8M
argi
nal e
ffect
ope
nnes
s to
exp
erie
nce
10 20 30 40 50 60 70 80 90Decile of log charitable donation (donators)
Hours volunteered.1
25.1
275
.13
.132
5.1
35.1
375
.14
Mar
gina
l effe
ct e
xtra
vers
ion
10 20 30 40 50 60 70 80 90Decile of log charitable donation (donators)
Hours volunteered
-.17
-.167
5-.1
65-.1
625
-.16
-.157
5-.1
55-.1
525
-.15
Mar
gina
l effe
ct n
euro
ticis
m
10 20 30 40 50 60 70 80 90Decile of log charitable donation (donators)
Hours volunteered

FIGURE 8: Bivariate tobit model charitable donations/income and hours volunteered – Conditional marginal effects over distribution of the second outcome
All marginal effects shown are significant at the 5 or 1 percent level.
.022
55.0
2275
.022
95.0
2315
.023
35.0
2355
.023
75.0
2395
Mar
gina
l effe
ct o
penn
ess
to e
xper
ienc
e
10 20 30 40 50 60 70 80 90Decile of volunteering (volunteers)
Charitable donations/total income
.023
8.0
24.0
242
.024
4.0
246
.024
8.0
25M
argi
nal e
ffect
agr
eeab
lene
ss
10 20 30 40 50 60 70 80 90Decile of volunteering (volunteers)
Charitable donations/total income
-.010
5-.0
104
-.010
3-.0
102
-.010
1-.0
1M
argi
nal e
ffect
con
scie
ntio
usne
ss
10 20 30 40 50 60 70 80 90Decile of volunteering (volunteers)
Charitable donations/total income.3
35.3
4.3
45.3
5.3
55.3
6M
argi
nal e
ffect
ope
nnes
s to
exp
erie
nce
10 20 30 40 50 60 70 80 90Decile of charity/income (donators)
Hours volunteered.1
36.1
39.1
42.1
45.1
48M
argi
nal e
ffect
ext
rave
rsio
n
10 20 30 40 50 60 70 80 90Decile of charity/income (donators)
Hours volunteered
-.148
-.146
-.144
-.142
-.14
-.138
Mar
gina
l effe
ct n
euro
ticis
m
10 20 30 40 50 60 70 80 90Decile of charity/income (donators)
Hours volunteered

TABLE 1A: Summary statistics – dependent variables MEAN STD. DEV. MIN MAX
Number of hours volunteered in last 4 weeks 2.2265 9.5639 0 200 Natural logarithm of charitable donations over past 12 months 2.8905 2.3418 0 9.2100 Charitable donations as a proportion of annual income 0.0067 0.0145 0 0.1259 OBSERVATIONS 31,409 IF NOT EQUAL TO ZERO MEAN STD. DEV. MIN MAX Number of hours volunteered in last 4 weeks 12.1995 18.6712 1 200 OBSERVATIONS (% non-zero) 4,601 (14.65%)
MEAN STD. DEV. MIN MAX IF NOT EQUAL TO ZERO Natural logarithm of charitable donations over past 12 months 4.3410 1.3926 0.6931 9.2100 OBSERVATIONS (% non-zero) 20,914 (66.59%)
MEAN STD. DEV. MIN MAX IF NOT EQUAL TO ZERO Charitable donations as a proportion of annual income 0.0102 0.0168 7.25e-5 0.1259 OBSERVATIONS (% non-zero) 20,914 (66.59%)

TABLE 1B: Summary statistics – explanatory variables Common variables in across models MEAN STD. DEV. MIN MAX
Aged 16-24 0.0763 0.2654 0 1 Aged 25-34 0.1385 0.3454 0 1 Aged 35-44 0.1942 0.3956 0 1 Aged 45-54 0.1952 0.3964 0 1 Aged 55-64 0.1645 0.3708 0 1 Aged 65-75 0.1461 0.3532 0 1 Male 0.4365 0.4960 0 1 Number of children aged 2 or under 0.0988 0.3298 0 3 Number of children aged 3-4 0.0741 0.2757 0 3 Number of children aged 5-11 0.2547 0.5928 0 5 Number of children aged 12-15 0.1534 0.4223 0 5 Number of adults in household 1.9915 0.9080 1 15 Married or cohabiting 0.5477 0.4977 0 1 GCSE 0.2017 0.4013 0 1 A level 0.1980 0.3985 0 1 Degree 0.3686 0.4824 0 1 Other qualification 0.0991 0.2988 0 1 Natural logarithm of monthly labour income 4.4467 3.5979 0 9.6158 Natural logarithm of monthly non-labour income 4.4003 3.0683 0 11.9476 Natural logarithm of monthly savings 1.8073 2.2499 0 10.1266 Employed 0.5108 0.4999 0 1 Self-employed 0.0764 0.2657 0 1 Unemployed 0.0373 0.1895 0 1 Home owned outright 0.3370 0.4727 0 1 Home owned on a mortgage 0.3922 0.4883 0 1 Home privately rented 0.0997 0.2997 0 1 White British 0.6091 0.4880 0 1 Black 0.0259 0.1589 0 1 Asian 0.0501 0.2181 0 1 Church of England 0.2157 0.4113 0 1 Roman Catholic 0.0743 0.2622 0 1 Christian 0.0345 0.1825 0 1 Muslim 0.0355 0.1850 0 1 Other religion 0.1135 0.3172 0 1 Active member of religious group 0.1269 0.3329 0 1 Number of friends 4.1689 2.0866 0 7 Health excellent 0.1576 0.3643 0 1 Health very good 0.3417 0.4743 0 1 Health good 0.2957 0.4564 0 1 Health fair 0.1421 0.3492 0 1 Member of social website 0.4497 0.4975 0 1 Lives in an urban area 0.7366 0.4405 0 1 OBSERVATIONS 31,409

TABLE 1B: Summary statistics – explanatory variables (cont.) variables only in number of hours volunteered models MEAN STD. DEV. MIN MAX
Opportunity cost of time# 27.7783 18.5194 0 168 Dissatisfied with leisure time 0.0458 0.2092 0 1 Cares up to 4 hours per week 0.0703 0.2557 0 1 Cares 5-9 hours per week 0.0365 0.1875 0 1 Cares 10-19 hours per week 0.0286 0.1667 0 1 Cares 20-34 hours per week 0.0232 0.1506 0 1 Cares 35-49 hours per week 0.0055 0.0742 0 1 Cares 50-99 hours per week 0.0045 0.0671 0 1 Cares 100+ hours per week 0.0158 0.1248 0 1 variables only in charitable donations models Use the internet daily 0.4926 0.5000 0 1 Use the internet weekly 0.1909 0.3930 0 1 Use the internet monthly 0.0658 0.2480 0 1 Main source of news via newspaper 0.1265 0.3324 0 1 Main source of news via television 0.4193 0.4935 0 1 Main source of news via radio 0.1076 0.3099 0 1 Main source of news via internet 0.1213 0.3265 0 1 % donating at LAD level by age (16+) 73.0751 15.0885 35.7143 100 OBSERVATIONS 31,409
# This is calculated as the sum of total hours spent per week in: employment; doing housework and commuting to work.
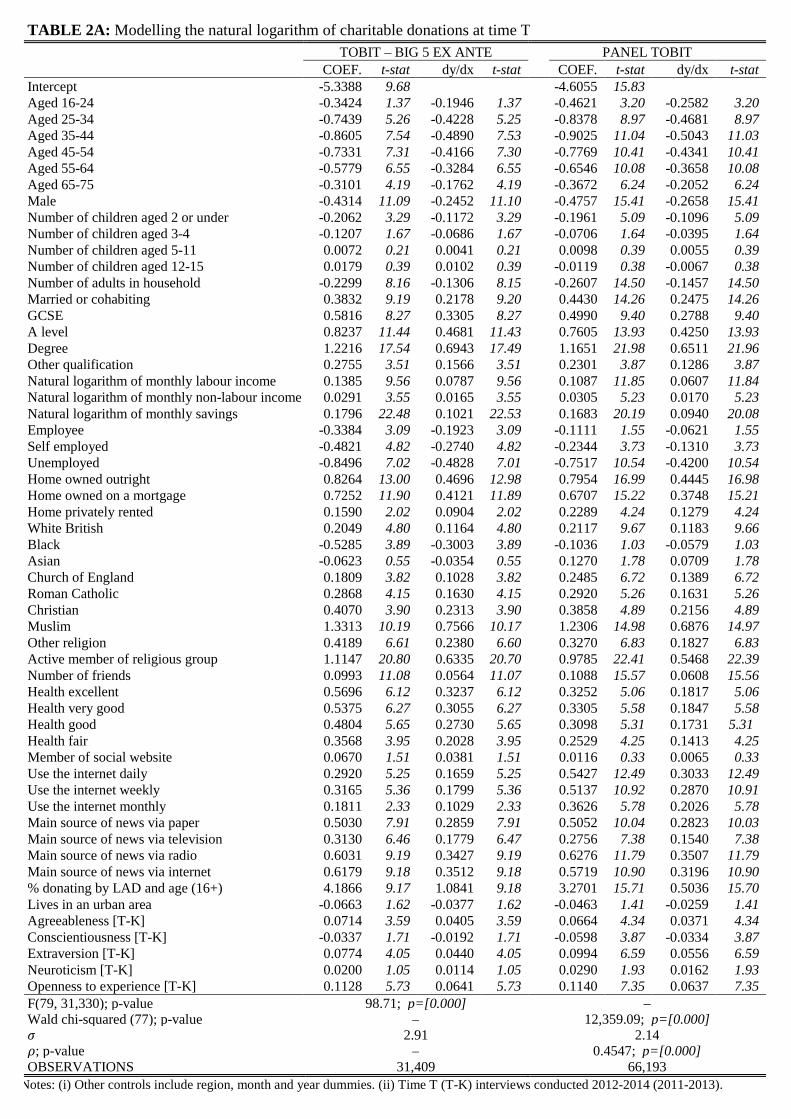
TABLE 2A: Modelling the natural logarithm of charitable donations at time T TOBIT – BIG 5 EX ANTE PANEL TOBIT
COEF. t-stat dy/dx t-stat COEF. t-stat dy/dx t-stat Intercept -5.3388 9.68 -4.6055 15.83 Aged 16-24 -0.3424 1.37 -0.1946 1.37 -0.4621 3.20 -0.2582 3.20 Aged 25-34 -0.7439 5.26 -0.4228 5.25 -0.8378 8.97 -0.4681 8.97 Aged 35-44 -0.8605 7.54 -0.4890 7.53 -0.9025 11.04 -0.5043 11.03 Aged 45-54 -0.7331 7.31 -0.4166 7.30 -0.7769 10.41 -0.4341 10.41 Aged 55-64 -0.5779 6.55 -0.3284 6.55 -0.6546 10.08 -0.3658 10.08 Aged 65-75 -0.3101 4.19 -0.1762 4.19 -0.3672 6.24 -0.2052 6.24 Male -0.4314 11.09 -0.2452 11.10 -0.4757 15.41 -0.2658 15.41 Number of children aged 2 or under -0.2062 3.29 -0.1172 3.29 -0.1961 5.09 -0.1096 5.09 Number of children aged 3-4 -0.1207 1.67 -0.0686 1.67 -0.0706 1.64 -0.0395 1.64 Number of children aged 5-11 0.0072 0.21 0.0041 0.21 0.0098 0.39 0.0055 0.39 Number of children aged 12-15 0.0179 0.39 0.0102 0.39 -0.0119 0.38 -0.0067 0.38 Number of adults in household -0.2299 8.16 -0.1306 8.15 -0.2607 14.50 -0.1457 14.50 Married or cohabiting 0.3832 9.19 0.2178 9.20 0.4430 14.26 0.2475 14.26 GCSE 0.5816 8.27 0.3305 8.27 0.4990 9.40 0.2788 9.40 A level 0.8237 11.44 0.4681 11.43 0.7605 13.93 0.4250 13.93 Degree 1.2216 17.54 0.6943 17.49 1.1651 21.98 0.6511 21.96 Other qualification 0.2755 3.51 0.1566 3.51 0.2301 3.87 0.1286 3.87 Natural logarithm of monthly labour income 0.1385 9.56 0.0787 9.56 0.1087 11.85 0.0607 11.84 Natural logarithm of monthly non-labour income 0.0291 3.55 0.0165 3.55 0.0305 5.23 0.0170 5.23 Natural logarithm of monthly savings 0.1796 22.48 0.1021 22.53 0.1683 20.19 0.0940 20.08 Employee -0.3384 3.09 -0.1923 3.09 -0.1111 1.55 -0.0621 1.55 Self employed -0.4821 4.82 -0.2740 4.82 -0.2344 3.73 -0.1310 3.73 Unemployed -0.8496 7.02 -0.4828 7.01 -0.7517 10.54 -0.4200 10.54 Home owned outright 0.8264 13.00 0.4696 12.98 0.7954 16.99 0.4445 16.98 Home owned on a mortgage 0.7252 11.90 0.4121 11.89 0.6707 15.22 0.3748 15.21 Home privately rented 0.1590 2.02 0.0904 2.02 0.2289 4.24 0.1279 4.24 White British 0.2049 4.80 0.1164 4.80 0.2117 9.67 0.1183 9.66 Black -0.5285 3.89 -0.3003 3.89 -0.1036 1.03 -0.0579 1.03 Asian -0.0623 0.55 -0.0354 0.55 0.1270 1.78 0.0709 1.78 Church of England 0.1809 3.82 0.1028 3.82 0.2485 6.72 0.1389 6.72 Roman Catholic 0.2868 4.15 0.1630 4.15 0.2920 5.26 0.1631 5.26 Christian 0.4070 3.90 0.2313 3.90 0.3858 4.89 0.2156 4.89 Muslim 1.3313 10.19 0.7566 10.17 1.2306 14.98 0.6876 14.97 Other religion 0.4189 6.61 0.2380 6.60 0.3270 6.83 0.1827 6.83 Active member of religious group 1.1147 20.80 0.6335 20.70 0.9785 22.41 0.5468 22.39 Number of friends 0.0993 11.08 0.0564 11.07 0.1088 15.57 0.0608 15.56 Health excellent 0.5696 6.12 0.3237 6.12 0.3252 5.06 0.1817 5.06 Health very good 0.5375 6.27 0.3055 6.27 0.3305 5.58 0.1847 5.58 Health good 0.4804 5.65 0.2730 5.65 0.3098 5.31 0.1731 5.31 Health fair 0.3568 3.95 0.2028 3.95 0.2529 4.25 0.1413 4.25 Member of social website 0.0670 1.51 0.0381 1.51 0.0116 0.33 0.0065 0.33 Use the internet daily 0.2920 5.25 0.1659 5.25 0.5427 12.49 0.3033 12.49 Use the internet weekly 0.3165 5.36 0.1799 5.36 0.5137 10.92 0.2870 10.91 Use the internet monthly 0.1811 2.33 0.1029 2.33 0.3626 5.78 0.2026 5.78 Main source of news via paper 0.5030 7.91 0.2859 7.91 0.5052 10.04 0.2823 10.03 Main source of news via television 0.3130 6.46 0.1779 6.47 0.2756 7.38 0.1540 7.38 Main source of news via radio 0.6031 9.19 0.3427 9.19 0.6276 11.79 0.3507 11.79 Main source of news via internet 0.6179 9.18 0.3512 9.18 0.5719 10.90 0.3196 10.90 % donating by LAD and age (16+) 4.1866 9.17 1.0841 9.18 3.2701 15.71 0.5036 15.70 Lives in an urban area -0.0663 1.62 -0.0377 1.62 -0.0463 1.41 -0.0259 1.41 Agreeableness [T-K] 0.0714 3.59 0.0405 3.59 0.0664 4.34 0.0371 4.34 Conscientiousness [T-K] -0.0337 1.71 -0.0192 1.71 -0.0598 3.87 -0.0334 3.87 Extraversion [T-K] 0.0774 4.05 0.0440 4.05 0.0994 6.59 0.0556 6.59 Neuroticism [T-K] 0.0200 1.05 0.0114 1.05 0.0290 1.93 0.0162 1.93 Openness to experience [T-K] 0.1128 5.73 0.0641 5.73 0.1140 7.35 0.0637 7.35 F(79, 31,330); p-value 98.71; p=[0.000] – Wald chi-squared (77); p-value – 12,359.09; p=[0.000] 2.91 2.14 ; p-value – 0.4547; p=[0.000] OBSERVATIONS 31,409 66,193
Notes: (i) Other controls include region, month and year dummies. (ii) Time T (T-K) interviews conducted 2012-2014 (2011-2013).

TABLE 2B: Modelling the natural logarithm of charitable donations at time T – Big 5 measured in 2005
TOBIT – BIG 5 EX ANTE PANEL TOBIT – BIG 5 EX ANTE
COEF. t-stat dy/dx t-stat COEF. t-stat dy/dx t-stat Intercept -5.5339 4.78 -4.7502 7.64 Agreeableness [2005] 0.0816 2.84 0.0465 2.84 0.1039 2.94 0.0583 2.94 Conscientiousness [2005] -0.0359 0.82 -0.0205 0.82 -0.0676 1.91 -0.0379 1.91 Extraversion [2005] 0.0786 1.90 0.0448 1.90 0.0890 2.62 0.0499 2.62 Neuroticism [2005] 0.0459 1.07 0.0262 1.07 0.0434 1.26 0.0243 1.26 Openness to experience [2005] 0.1636 3.69 0.0933 3.69 0.1887 5.34 0.1058 5.34 F(79, 6,334); p-value 92.87; p=[0.000] – Wald chi-squared (77); p-value – 2,247.89; p=[0.000] 2.93 2.09 ; p-value – 0.4845; p=[0.000] OBSERVATIONS 6,410 13,519
Notes: other controls as in Table 2A.
TABLE 3A: Modelling charitable donations as a proportion of total income at time T
TOBIT – BIG 5 EX ANTE PANEL TOBIT COEF. t-stat dy/dx t-stat COEF. t-stat dy/dx t-stat
Intercept -3.4803 9.85 -6.7599 14.55 Agreeableness [T-K] 0.0492 4.21 0.0195 4.21 0.0256 4.36 0.0107 4.36 Conscientiousness [T-K] -0.0255 2.04 -0.0101 2.04 -0.0181 3.04 -0.0076 3.04 Extraversion [T-K] 0.0121 1.01 0.0048 1.01 0.0325 5.59 0.0135 5.59 Neuroticism [T-K] -0.0179 1.54 -0.0071 1.54 0.0153 2.65 0.0064 2.65 Openness to experience [T-K] 0.0665 5.53 0.0264 5.53 0.0419 7.09 0.0175 7.03 F(79, 31,330); p-value 38.87; p=[0.000] – Wald chi-squared (77); p-value – 8,742.63; p=[0.000] 1.74 0.67 ; p-value – 0.4280; p=[0.000] OBSERVATIONS 31,409 66,193
Notes: other controls as in Table 2A. TABLE 3B: Modelling charitable donations as a proportion of total income at time T – BIG5 measured in 2005
TOBIT – BIG 5 EX ANTE PANEL TOBIT – BIG 5 EX ANTE
COEF. t-stat dy/dx t-stat COEF. t-stat dy/dx t-stat Intercept -3.3227 4.28 -1.7292 6.30 Agreeableness [2005] 0.0409 2.51 0.0163 2.51 0.0126 2.10 0.0044 2.10 Conscientiousness [2005] -0.0325 1.15 -0.0130 1.15 -0.0122 2.03 -0.0042 2.03 Extraversion [2005] 0.0150 0.54 0.0060 0.54 0.0087 1.52 0.0030 1.52 Neuroticism [2005] 0.0243 0.89 0.0097 0.89 -0.0012 0.21 -0.0004 0.21 Openness to experience [2005] 0.1052 3.58 0.0419 3.58 0.0241 4.03 0.0084 4.03 F(79, 6,334); p-value 21.27; p=[0.000] – Wald chi-squared (77); p-value – 1,428.22; p=[0.000] 1.80 0.42 ; p-value – 0.3179; p=[0.000] OBSERVATIONS 6,410 13,519
Notes: other controls as in Table 2A.

TABLE 4A: Modelling the number of hours volunteered at time T TOBIT – BIG 5 EX ANTE PANEL TOBIT
COEF. t-stat dy/dx t-stat COEF. t-stat dy/dx t-stat Intercept -71.4039 19.25 -72.1747 31.65
Aged 16-24 4.1946 1.95 0.7735 1.95 1.1200 0.70 0.2046 0.70 Aged 25-34 2.8262 1.52 0.5211 1.52 -1.6007 1.15 -0.2924 1.15 Aged 35-44 2.9270 1.70 0.5397 1.70 -0.1474 0.11 -0.0269 0.11 Aged 45-54 6.3010 4.00 1.1619 4.00 2.8630 2.38 0.5230 2.38 Aged 55-64 7.5975 5.44 1.4009 5.45 4.3318 4.09 0.7912 4.09 Aged 65-75 8.5470 6.88 1.5760 6.89 5.8783 6.08 1.0737 6.08 Male -0.3627 0.55 -0.0669 0.55 -0.7689 1.46 -0.1405 1.46 Number of children aged 2 or under -10.6478 7.50 -1.9634 7.51 -8.3856 10.75 -1.5317 10.76 Number of children aged 3-4 -0.5703 0.49 -0.1052 0.49 -0.5723 0.74 -0.1045 0.74 Number of children aged 5-11 1.7650 3.25 0.3254 3.25 1.8247 4.32 0.3333 4.32 Number of children aged 12-15 1.5680 2.12 0.2891 2.12 1.7496 3.33 0.3196 3.33 Number of adults in household -1.1304 2.53 -0.2084 2.53 -0.9256 2.87 -0.1691 2.87 Married or cohabiting 2.4891 3.58 0.4590 3.59 2.3826 4.37 0.4352 4.37 GCSE 8.1123 6.56 1.4959 6.57 8.8174 9.03 1.6106 9.03 A level 11.2396 8.66 2.0725 8.69 11.5488 11.65 2.1095 11.65 Degree 17.7127 14.05 3.2661 14.16 18.4785 19.65 3.3752 19.66 Other qualification 5.6525 4.00 1.0423 4.01 5.5465 4.99 1.0131 4.99 Natural logarithm of monthly labour income -0.2860 1.22 -0.0527 1.22 -0.3588 2.38 -0.0655 2.38 Natural logarithm of monthly non-labour income 0.5010 3.64 0.0924 3.64 0.5009 4.97 0.0915 4.97 Natural logarithm of monthly savings 0.6803 5.27 0.1254 5.27 0.5755 7.07 0.1051 7.07 Employee -5.3250 3.23 -0.9818 3.24 -3.9024 3.74 -0.7128 3.74 Self employed -2.8617 1.63 -0.5277 1.63 -0.7515 0.64 -0.1373 0.64 Unemployed 1.4299 0.75 0.2637 0.75 -0.0820 0.07 -0.0150 0.07 Home owned outright 5.2068 4.86 0.9601 4.87 4.6386 5.59 0.8473 5.59 Home owned on a mortgage 2.1888 2.12 0.4036 2.12 2.5643 3.24 0.4684 3.24 Home privately rented 0.5281 0.41 0.0974 0.41 0.6960 0.72 0.1271 0.72 White British 1.8523 2.64 0.3416 2.64 0.1903 0.51 0.0348 0.51 Black -6.6744 3.28 -1.2307 3.28 -4.2240 2.52 -0.7715 2.52 Asian -5.1627 2.83 -0.9520 2.83 -3.2929 2.48 -0.6015 2.48 Church of England 2.1924 2.76 0.4043 2.76 0.8798 1.42 0.1607 1.42 Roman Catholic -0.1068 0.09 -0.0197 0.09 -1.3104 1.37 -0.2394 1.37 Christian 8.5864 6.18 1.5833 6.19 6.5237 5.53 1.1916 5.53 Muslim 4.1007 1.98 0.7561 1.98 0.5287 0.36 0.0966 0.36 Other religion 6.2182 6.00 1.1466 6.01 4.1612 5.48 0.7601 5.48 Active member of religious group 18.3135 21.01 3.3769 21.30 19.1574 29.32 3.4993 29.22 Number of friends 1.3486 8.93 0.2487 8.96 1.4335 11.95 0.2618 11.95 Health excellent 12.1132 6.98 2.2336 7.00 12.0467 9.87 2.2004 9.87 Health very good 12.3524 7.54 2.2777 7.56 11.5207 10.02 2.1043 10.02 Health good 11.8809 7.32 2.1908 7.34 11.2735 9.90 2.0592 9.90 Health fair 9.2795 5.51 1.7111 5.52 8.3524 7.14 1.5256 7.14 Member of social website 4.5892 6.46 0.8462 6.47 4.7828 8.29 0.8736 8.29 Opportunity cost of time -0.1098 3.84 -0.0202 3.85 -0.1049 5.54 -0.0192 5.54 Dissatisfied with leisure time 0.7924 0.58 0.1461 0.58 -0.4978 0.48 -0.0909 0.48 Cares up to 4 hours per week 6.7620 6.92 1.2469 6.93 5.4271 7.94 0.9913 7.94 Cares 5-9 hours per week 6.4850 4.66 1.1958 4.66 4.8231 5.08 0.8810 5.08 Cares 10-19 hours per week 4.4868 2.65 0.8273 2.65 4.7341 4.37 0.8647 4.37 Cares 20-34 hours per week 0.7621 0.36 0.1405 0.36 3.3236 2.48 0.6071 2.48 Cares 35-49 hours per week -2.2414 0.64 -0.4133 0.64 1.7952 0.74 0.3279 0.74 Cares 50-99 hours per week -1.5196 0.35 -0.2802 0.35 1.6449 0.59 0.3004 0.59 Cares 100+ hours per week 0.8385 0.33 0.1546 0.33 1.2080 0.69 0.2207 0.69 Lives in an urban area -3.7647 5.55 -0.6942 5.55 -3.7342 6.80 -0.6821 6.80 Agreeableness [T-K] -0.3731 1.20 -0.0688 1.20 -0.6649 2.51 -0.1214 2.51 Conscientiousness [T-K] -0.2283 0.71 -0.0421 0.71 -0.2213 0.83 -0.0404 0.83 Extraversion [T-K] 0.8473 2.71 0.1562 2.71 1.1579 4.49 0.2115 4.49 Neuroticism [T-K] -0.8486 2.70 -0.1565 2.70 -0.4089 1.87 -0.0747 1.87 Openness to experience [T-K] 1.9370 5.89 0.3572 5.89 2.2425 8.37 0.4096 8.38 F(80, 31,329); p-value 14.15; p=[0.000] – Wald chi-squared (78); p-value – 3,536.86; p=[0.000] 32.18 20.43 ; p-value – 0.6167; p=[0.000] OBSERVATIONS 31,409 66,193
Notes: (i) Other controls include region, month and year dummies. (ii) Time T (T-K) interviews conducted 2012-2014 (2011-2013).

TABLE 4B: Modelling the number of hours volunteered at time T – Big 5 measured in 2005
TOBIT – BIG5 EX ANTE PANEL TOBIT – BIG5 EX ANTE
COEF. t-stat dy/dx t-stat COEF. t-stat dy/dx t-stat Intercept -74.9801 8.37 -78.0132 13.53 Agreeableness [2005] -0.0740 0.09 -0.0134 0.09 -0.6549 0.10 -0.0119 0.10 Conscientiousness [2005] 0.0753 0.10 0.0136 0.10 -0.1765 0.27 -0.0319 0.27 Extraversion [2005] 0.2646 0.36 0.0479 0.36 0.5269 1.87 0.0953 1.87 Neuroticism [2005] -1.6256 2.12 -0.2946 2.12 -1.0898 2.75 -0.1972 2.75 Openness to experience [2005] 2.3078 2.95 0.4183 2.95 2.9225 4.56 0.5288 4.56 F(80, 6,333); p-value 11.28; p=[0.000] – Wald chi-squared (78); p-value – 781.57; p=[0.000] 33.72 20.58 ; p-value – 0.6504; p=[0.000] OBSERVATIONS 6,410 13,519
Notes: other controls as in Table 4A.
TABLE 5: Comparison of model performance for univariate tobit specifications (full sample)
LOG CHARITABLE DONATIONS CHARITABLE DONATION / INCOME HOURS VOLUNTEERED
Personality traits excluded
Pseudo R-squared 0.0537 0.0544 0.0495
AIC 122,962.2 95,405.7 58,526.2
BIC 123,597.1 96,039.9 59,169.6
Personality traits included Based on Table 2A Based on Table 3A Based on Table 4A
Pseudo R-squared 0.0545 0.0551 0.0506
AIC 122,880.9 95,345.6 58,471.4
BIC 123,557.7 96,021.5 59,156.5
OBSERVATIONS 31,409
Notes: AIC denotes the Akaike Information Criteria and BIC denotes the Schwarz Bayesian Information Criteria.
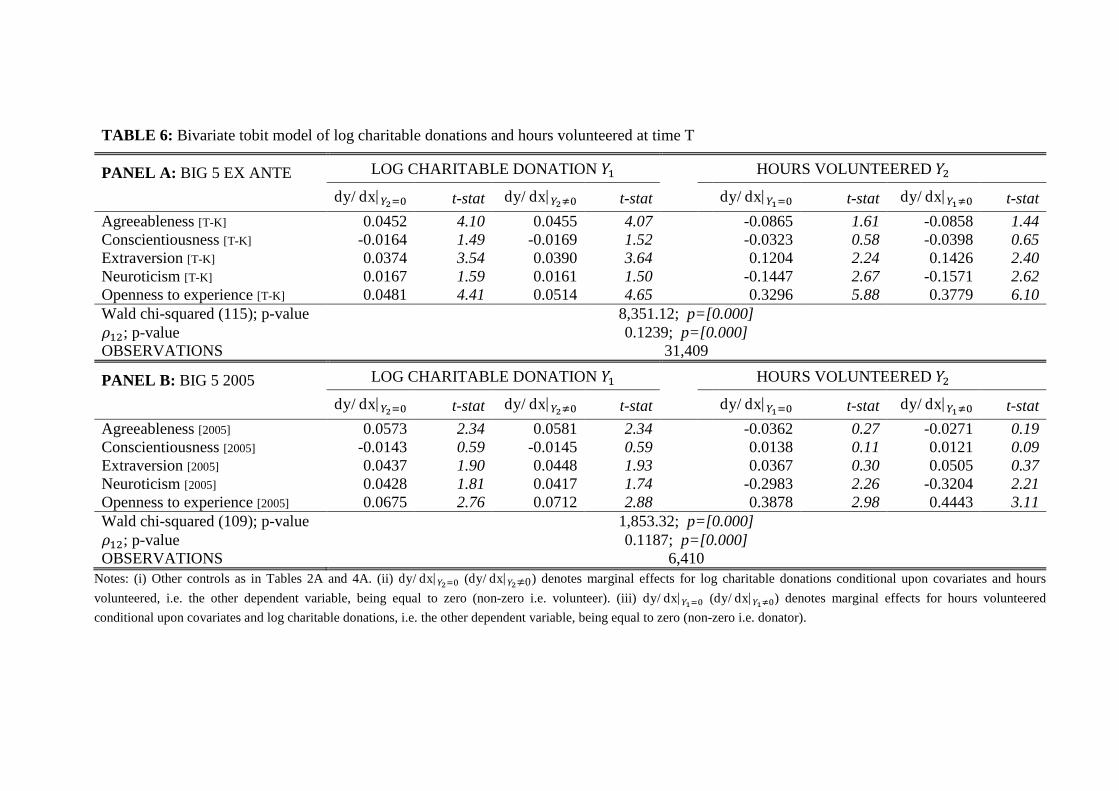
TABLE 6: Bivariate tobit model of log charitable donations and hours volunteered at time T
PANEL A: BIG 5 EX ANTE LOG CHARITABLE DONATION HOURS VOLUNTEERED dy/dx| t-stat dy/dx| t-stat dy/dx| t-stat dy/dx| t-stat Agreeableness [T-K] 0.0452 4.10 0.0455 4.07 -0.0865 1.61 -0.0858 1.44 Conscientiousness [T-K] -0.0164 1.49 -0.0169 1.52 -0.0323 0.58 -0.0398 0.65 Extraversion [T-K] 0.0374 3.54 0.0390 3.64 0.1204 2.24 0.1426 2.40 Neuroticism [T-K] 0.0167 1.59 0.0161 1.50 -0.1447 2.67 -0.1571 2.62 Openness to experience [T-K] 0.0481 4.41 0.0514 4.65 0.3296 5.88 0.3779 6.10 Wald chi-squared (115); p-value 8,351.12; p=[0.000] ; p-value 0.1239; p=[0.000] OBSERVATIONS 31,409
PANEL B: BIG 5 2005 LOG CHARITABLE DONATION HOURS VOLUNTEERED dy/dx| t-stat dy/dx| t-stat dy/dx| t-stat dy/dx| t-stat Agreeableness [2005] 0.0573 2.34 0.0581 2.34 -0.0362 0.27 -0.0271 0.19 Conscientiousness [2005] -0.0143 0.59 -0.0145 0.59 0.0138 0.11 0.0121 0.09 Extraversion [2005] 0.0437 1.90 0.0448 1.93 0.0367 0.30 0.0505 0.37 Neuroticism [2005] 0.0428 1.81 0.0417 1.74 -0.2983 2.26 -0.3204 2.21 Openness to experience [2005] 0.0675 2.76 0.0712 2.88 0.3878 2.98 0.4443 3.11 Wald chi-squared (109); p-value 1,853.32; p=[0.000] ; p-value 0.1187; p=[0.000] OBSERVATIONS 6,410
Notes: (i) Other controls as in Tables 2A and 4A. (ii) dy/dx| (dy/dx| ≠0) denotes marginal effects for log charitable donations conditional upon covariates and hours volunteered, i.e. the other dependent variable, being equal to zero (non-zero i.e. volunteer). (iii) dy/dx| (dy/dx| ) denotes marginal effects for hours volunteered conditional upon covariates and log charitable donations, i.e. the other dependent variable, being equal to zero (non-zero i.e. donator).

TABLE 7: Bivariate tobit model of charitable donations as a proportion of annual income and hours volunteered at time T
PANEL A: BIG 5 EX ANTE CHARITABLE DONATION / INCOME HOURS VOLUNTEERED dy/dx| t-stat dy/dx| t-stat dy/dx| t-stat dy/dx| t-stat Agreeableness [T-K] 0.0238 4.70 0.0244 4.68 -0.0809 1.47 -0.0760 1.30 Conscientiousness [T-K] -0.0100 1.84 -0.0105 1.88 -0.0400 0.70 -0.0475 0.78 Extraversion [T-K] 0.0026 0.52 0.0032 0.60 0.1367 2.47 0.1479 2.51 Neuroticism [T-K] -0.0050 1.01 -0.0057 1.10 -0.1374 2.49 -0.1499 2.54 Openness to experience [T-K] 0.0226 4.35 0.0246 4.58 0.3334 5.82 0.3683 6.04 Wald chi-squared (115); p-value 4,027.56; p=[0.000] ; p-value 0.0601; p=[0.000] OBSERVATIONS 31,409
PANEL B: BIG 5 2005 CHARITABLE DONATION / INCOME HOURS VOLUNTEERED dy/dx| t-stat dy/dx| t-stat dy/dx| t-stat dy/dx| t-stat Agreeableness [2005] 0.0230 1.95 0.0238 1.96 -0.0190 0.15 -0.0105 0.08 Conscientiousness [2005] -0.0120 0.97 -0.0124 0.98 -0.0076 0.06 -0.0133 0.10 Extraversion [2005] 0.0056 0.47 0.0061 0.49 0.0729 0.60 0.0805 0.62 Neuroticism [2005] 0.0184 1.54 0.0181 1.48 -0.2886 2.28 -0.3015 2.24 Openness to experience [2005] 0.0368 2.89 0.0393 2.99 0.3409 2.81 0.3812 2.94 Wald chi-squared (109); p-value 930.86; p=[0.000] ; p-value 0.0672; p=[0.000] OBSERVATIONS 6,410
Notes: (i) Other controls as in Tables 2A and 4A. (ii) dy/dx| (dy/dx| ≠0) denotes marginal effects for log charitable donations conditional upon covariates and hours volunteered, i.e. the other dependent variable, being equal to zero (non-zero i.e. volunteer). (iii) dy/dx| (dy/dx| ) denotes marginal effects for hours volunteered conditional upon covariates and log charitable donations, i.e. the other dependent variable, being equal to zero (non-zero i.e. donator).

TABLE 8: Censored quantile regression estimates of charitable donations (of time and money) and the Big 5 personality traits
PANEL A: Log charitable donations [T] AGREEABLENESSS [T-K] CONSCIENTIOUS-
NESS [T-K] EXTRAVERSION [T-K] NEUROTICISM [T-K] OPENNESS TO EXPERIENCE [T-K]
COEF. S.E. t-stat COEF. S.E. t-stat COEF. S.E. t-stat COEF. S.E. t-stat COEF. S.E. t-stat 10th decile 0.0242 0.0801 0.30 -0.0067 0.0531 0.13 0.0111 0.0746 0.15 0.0061 0.0581 0.10 0.0326 0.1198 0.27 20th decile 0.1049 0.0526 2.01 -0.0639 0.0432 1.48 0.1033 0.0429 2.41 0.0242 0.0333 0.73 0.1175 0.0513 2.29 30th decile 0.0962 0.0311 3.10 -0.0405 0.0294 1.38 0.0929 0.0276 3.36 0.0322 0.0279 1.15 0.0915 0.0276 3.32 40th decile 0.0647 0.0225 2.87 -0.0359 0.0238 1.51 0.0843 0.0253 3.33 0.0251 0.0239 1.05 0.0815 0.0201 4.05 50th decile 0.0567 0.0209 2.71 -0.0384 0.0188 2.04 0.0653 0.0210 3.10 -0.0043 0.0214 0.20 0.0752 0.0174 4.31 60th decile 0.0408 0.0180 2.27 -0.0209 0.0172 1.22 0.0398 0.0177 2.25 -0.0083 0.0158 0.53 0.0723 0.0162 4.45 70th decile 0.0299 0.0137 2.19 -0.0264 0.0141 1.88 0.0208 0.0141 1.48 -0.0190 0.0139 1.37 0.0728 0.0128 5.71 80th decile 0.0194 0.0169 1.15 -0.0281 0.0144 1.95 0.0107 0.0129 0.83 -0.0260 0.0118 2.21 0.0661 0.0150 4.40 90th decile 0.0064 0.0161 0.40 -0.0300 0.0141 2.13 -0.0098 0.0145 0.67 -0.0416 0.0161 2.58 0.0660 0.0139 4.75 PANEL B: Charitable donations as a proportion of total income [T]
AGREEABLENESSS [T-K] CONSCIENTIOUS-NESS [T-K] EXTRAVERSION [T-K] NEUROTICISM [T-K] OPENNESS TO
EXPERIENCE [T-K] COEF. S.E. t-stat COEF. S.E. t-stat COEF. S.E. t-stat COEF. S.E. t-stat COEF. S.E. t-stat 10th decile 0.0007 0.0005 1.35 -0.0001 0.0004 0.29 0.0001 0.0001 1.00 -0.0004 0.0024 0.16 0.0010 0.0036 0.27 20th decile 0.0096 0.0055 1.73 -0.0061 0.0036 1.71 0.0072 0.0038 1.88 -0.0005 0.0040 0.14 0.0088 0.0050 1.75 30th decile 0.0082 0.0038 2.20 -0.0076 0.0046 1.67 0.0096 0.0037 2.56 0.0037 0.0038 0.97 0.0135 0.0048 2.84 40th decile 0.0039 0.0036 3.20 -0.0122 0.0041 2.96 0.0121 0.0040 3.03 0.0065 0.0033 1.95 0.0161 0.0039 4.18 50th decile 0.0161 0.0048 3.35 -0.0135 0.0044 3.09 0.0104 0.0041 2.52 0.0017 0.0033 0.50 0.0203 0.0050 4.08 60th decile 0.0184 0.0050 3.67 -0.0145 0.0049 2.93 0.0126 0.0047 2.66 -0.0033 0.0051 -0.65 0.0261 0.0054 4.80 70th decile 0.0211 0.0050 3.51 -0.0163 0.0068 2.41 0.0081 0.0067 1.21 -0.0045 0.0068 0.66 0.0388 0.0082 4.72 80th decile 0.0285 0.0101 2.83 -0.0186 0.0095 1.96 -0.0055 0.0078 0.71 -0.0113 0.0095 1.19 0.0560 0.0102 5.50 90th decile 0.0256 0.0180 1.42 -0.0119 0.0183 0.65 -0.0174 0.0188 0.93 -0.0264 0.0178 1.48 0.0826 0.0183 4.50 PANEL C: Number of hours volunteered [T]
AGREEABLENESSS [T-K] CONSCIENTIOUS-NESS [T-K] EXTRAVERSION [T-K] NEUROTICISM [T-K] OPENNESS TO
EXPERIENCE [T-K] COEF. S.E. t-stat COEF. S.E. t-stat COEF. S.E. t-stat COEF. S.E. t-stat COEF. S.E. t-stat 40th decile 0.0368 0.1189 0.31 -0.0230 0.0681 0.34 0.0216 0.0755 0.29 -0.5001 0.1695 0.29 0.0210 0.0844 0.25 50th decile 0.0824 0.2702 0.31 -0.0730 0.2513 0.29 0.1586 0.2638 0.60 -0.4122 0.3654 1.13 0.1941 0.2632 0.74 60th decile 0.0673 0.2137 0.32 -0.1328 0.1519 0.87 0.1445 0.2043 0.71 -0.5033 0.3069 1.64 0.3532 0.2205 1.60 70th decile -0.0382 0.1590 0.24 -0.1480 0.1752 0.84 0.1306 0.1942 0.67 -0.5947 0.2061 2.89 0.4090 0.2277 1.80 80th decile -0.2179 0.1772 1.23 -0.0915 0.1891 0.48 0.2693 0.2338 1.15 -0.4994 0.2355 2.12 0.9109 0.2707 3.37 90th decile -0.4469 0.2924 1.52 0.2067 0.3127 0.66 0.8138 0.3312 2.46 -0.8324 0.3049 2.73 0.9721 0.3038 3.20
Notes: (i) Other controls as in Tables 2A and 4A. (ii) Standard errors are obtained by weighted bootstrap with 200 replications. (iii) Dependent variables (Big5) measured at time T (T-K).