Embed Size (px)
Citation preview

CHARACTERIZING THE OPERATION OF A DUAL-FUEL DIESEL-HYDROGEN
ENGINE NEAR THE KNOCK LIMIT
A Thesis Submitted to the Graduate Faculty
of the North Dakota State University
of Agriculture and Applied Science
By
Lee Allan Kersting
In Partial Fulfillment for the Degree of
MASTER OF SCIENCE
Major Department: Mechanical Engineering
May 2014
Fargo, North Dakota

North Dakota State University
Graduate School
Title
Characterizing the Operation of a Dual Fuel Diesel-Hydrogen Engine Near the Knock Limit
By
Lee Kersting
The Supervisory Committee certifies that this disquisition complies with North
Dakota State University’s regulations and meets the accepted standards for the
degree of
MASTER OF SCIENCE
SUPERVISORY COMMITTEE:
Dr. Robert Pieri
Chair
Dr. Majura Selekwa
Dr. Yildirim Bora Suzen
Dr. Mariusz Ziejewski
Dr. Scott Pryor
Approved:
7/7/2014 Dr. Alan R. Kallmeyer
Date Department Chair

iii
ABSTRACT A CAT C6.6 turbocharged diesel engine was operated in dual-fuel diesel-hydrogen mode.
Hydrogen was inducted into the intake and replaced a portion of the diesel fuel. Hydrogen was
added across multiple engine speeds and loads until reaching the knock limit, identified by a
threshold on the rate of in-cylinder pressure rise. In-cylinder pressure and emissions data were
recorded and compared to diesel-only operation. Up to 74% H2 substitution for diesel fuel was
achieved. Hydrogen addition increased thermal efficiency up to 32.4%, increased peak in-cylinder
pressure up to 40.0%, increased the maximum rate of pressure rise up to 281%, advanced injection
timing up to 13.6°, increased NOx emissions up to 224%, and reduced CO2 emissions up to 47.6%.
CO and HC emissions were not significantly affected during dual-fuel operation. At 25% load an
operating condition was observed with low NOx and nearly 0 CO2 emissions, which however
exhibited unstable combustion.

iv
TABLE OF CONTENTS
ABSTRACT .........................................................................................................................................iii
LIST OF TABLES ............................................................................................................................... vi
LIST OF FIGURES .............................................................................................................................vii
LIST OF ABBREVIATIONS ................................................................................................................ ix
LIST OF APPENDIX FIGURES..........................................................................................................xii
CHAPTER 1. RESEARCH IMPORTANCE ......................................................................................... 1
1.1. World Petroleum Overview ...................................................................................................... 1
1.2. Global Warming........................................................................................................................ 4
1.3. Emissions Regulations ............................................................................................................. 6
CHAPTER 2. RESEARCH OBJECTIVES ........................................................................................... 8
CHAPTER 3. BACKGROUND ............................................................................................................ 9
3.1. Hydrogen as a Fuel .................................................................................................................. 9
3.2. CI Diesel Combustion ............................................................................................................ 13
CHAPTER 4. LITERATURE REVIEW .............................................................................................. 19
4.1. NDSU Engine Research Lab ................................................................................................. 19
4.2. Dual-Fuel Combustion ........................................................................................................... 20
4.3. Knock Mechanisms ................................................................................................................ 23
4.4. Knock Detection ..................................................................................................................... 25
4.5. Engine Performance in Dual-Fuel Operation ......................................................................... 26
4.6. Emissions in Dual-Fuel Operation.......................................................................................... 27
CHAPTER 5. RESEARCH APPROACH ........................................................................................... 31
5.1. Experimental Setup ................................................................................................................ 31

v
5.2. Data Acquisition ..................................................................................................................... 34
5.3. Experiment Design ................................................................................................................. 36
5.4. Experimental Procedure ......................................................................................................... 37
CHAPTER 6. RESULTS AND DISCUSSION ................................................................................... 39
6.1. Engine Performance............................................................................................................... 39
6.2. Combustion ............................................................................................................................ 42
6.3. Emissions ............................................................................................................................... 55
CHAPTER 7. CONCLUSIONS .......................................................................................................... 61
REFERENCES .................................................................................................................................. 63
APPENDIX A. SAMPLE SPREADSHEETS ...................................................................................... 67
APPENDIX B. ADDITIONAL EMISSIONS RESULTS ...................................................................... 71
APPENDIX C. INJECTION DELAY CIRCUIT ................................................................................... 73

vi
LIST OF TABLES
Table Page
1. Properties of diesel and hydrogen fuel [16] [23]. ............................................................................. 9
2. CAT C6.6 Engine Specifications. .................................................................................................. 31

vii
LIST OF FIGURES
Figure Page
1. World Liquid Fuels Consumption by Sector, 2008-2035 (million barrels per day) [1]. .................... 2
2. 2008 Fuel Shares of Total Final Consumption (million tons of oil equivalent) [2]. .......................... 2
3. Primary (U.S.) Energy Consumption by Source and Sector, 2011 (Quadrillion Btu) [3]. ................ 3
4. EPA/EU non-road emissions regulations: 37-560 kW (50-750 hp) [11]. ......................................... 7
5. Energy density of H2 at various states compared to diesel. .......................................................... 12
6. Four stroke engine cycle operation [31]. ....................................................................................... 14
7. Idealized air-standard dual cycle pressure-specific volume diagram [31]. ................................... 16
8. Idealized fuel zones around an injection jet [31]. .......................................................................... 17
9. Shift in air-standard cycle with increasing hydrogen percentage. ................................................. 21
10. Schematic diagram of the hydrogen induction system................................................................ 32
11. CAT C6.6 engine setup in test cell. ............................................................................................. 33
12. LabVIEW front panel. .................................................................................................................. 35
13. Operable and inoperable speed-load set points for the experiment. .......................................... 37
14. Hydrogen percentage at the knock limit on an energy basis. ..................................................... 40
15. Thermal efficiency of both diesel-only and dual-fuel operation at different loads. ...................... 41
16. In-cylinder pressure curves at 1300 rpm. .................................................................................... 43
17. In-cylinder pressure curves at 1500 rpm. .................................................................................... 44
18. In-cylinder pressure curves at 1800 rpm. .................................................................................... 45
19. In-cylinder pressure curves at 2100 rpm. .................................................................................... 46
20. Comparison of variability in the shape of averaged pressure curves between 25% load and 77.5% load. .................................................................................................................. 47
21. Comparison of the curves for individual combustion cycles between 25% load and 77.5% load. .................................................................................................................................. 47
22. Example of the rate of pressure rise in the absence of combustion in a reciprocating piston engine. .............................................................................................................................. 48
23. Rate of pressure rise curves for 1300 rpm. ................................................................................. 49
24. Rate of pressure rise curves for 1500 rpm. ................................................................................. 50
25. Rate of pressure rise curves for 1800 rpm. ................................................................................. 51
viii
26. Rate of pressure rise curves for 2100 rpm. ................................................................................. 52
27. Main injection timing during diesel-only and dual-fuel operation. ............................................... 53
28. Shift in injection timing between dual-fuel and diesel-only combustion. ..................................... 54
29. Pilot injection timing during diesel-only and dual-fuel operation. ................................................ 55
30. NOx emissions for diesel-only and dual-fuel operation. .............................................................. 56
31. NO2/NOx ratio for diesel-only and dual-fuel operation. ................................................................ 57
32. CO2 emissions for diesel-only and dual-fuel operation. .............................................................. 58
33. CO emissions for diesel-only and dual-fuel operation. ............................................................... 59
34. HC emissions for diesel-only and dual-fuel operation. ................................................................ 59

ix
LIST OF ABBREVIATIONS
Φ ....................... Equivalence Ratio
ACERT ............. Advanced Combustion Emission Reduction Technology
AF ..................... Air-Fuel
ATDC ................ After Top Dead Center
BDC .................. Bottom Dead Center
BTDC ................ Before Top Dead Center
Btu .................... British Thermal Unit
CA .................... Crank Angle
CAD .................. Crank Angle Degrees
CAFE ................ Corporate Average Fuel Economy
CAT .................. Caterpillar
CI ...................... Compression Ignition
CNG ................. Compressed Natural Gas
CO .................... Carbon Monoxide
CO2 ................... Carbon Dioxide
DAQ .................. Data Acquisition System
DEF .................. Diesel Exhaust Fluid
DI ...................... Direct Injection
ECM ................. Engine Control Module
EGR .................. Exhaust Gas Recirculation
EPA .................. Environmental Protection Agency
EU .................... European Union
FA ..................... Fuel-to-Air
GHG ................. Greenhouse Gas
H2 ...................... Hydrogen
H2O ................... Water
HC .................... Hydrocarbon

x
HCCI ................. Homogeneous Charge Compression Ignition
HCN .................. Hydrogen Cyanide
HPCR ............... High Pressure Common Rail
HRR .................. Heat Release Rate
IC ...................... Internal Combustion
LFL ................... Lower Flammability Limit
LHV .................. Lower Heating Value
LPG .................. Liquefied Petroleum Gas
MC .................... Measurement Computing
mpg .................. Miles per Gallon
MRPR ............... Maximum Rate of Pressure Rise
Mtoe ................. Million Tons of Oil Equivalent
N2 ...................... Nitrogen
N2O ................... Nitrous Oxide
NDSU ............... North Dakota State University
NO .................... Nitric Oxide
NO2 ................... Nitrogen Dioxide
NOx ................... Nitrogen Oxides
O2 ..................... Oxygen
OECD ............... Organization for Economic Cooperation and Development
OEM ................. Original Equipment Manufacturer
PCB .................. Printed Circuit Board
PID ................... Proportional-Integral-Derivative
PM .................... Particulate Matter
ppm .................. Parts per Million
psi ..................... Pounds per Square Inch
rpm ................... Revolutions per Minute
RPR .................. Rate of Pressure Rise

xi
SCR .................. Selective Catalyst Reduction
SOC .................. Start of Combustion
TDC .................. Top Dead Center
xii
LIST OF APPENDIX FIGURES
Figure Page
A1. Partial sample of output file from LabVIEW with calculations. .................................................... 67
A2. Partial sample of DYNOmite output data spreadsheet with calculations.................................... 68
A3. Partial sample of pressure curve averaging spreadsheet. ......................................................... 69
A4. Sample of injection timing graph. ................................................................................................ 70
B1. O2 emissions for diesel-only and dual-fuel operation. ................................................................ 71
B2. NO emissions for diesel-only and dual-fuel operation. ............................................................... 71
B3. NO2 emissions for diesel-only and dual-fuel operation. .............................................................. 72
C1. Injector signal with injector delay circuit parameters and values. ............................................... 74
C2. Nearly complete circuit on the left. A model of the injector delay circuit on the right. ............... 74

1
CHAPTER 1. RESEARCH IMPORTANCE
1.1. World Petroleum Overview
Petroleum, herein used as synonymous with the term “crude oil,” is formed when organic
materials, such as zooplankton and algae, are subject to intense heat and pressure far beneath the
earth’s surface. This natural process, which is a form of anaerobic decomposition, takes millions of
years to produce petroleum. The current rate of petroleum usage is far higher than the rate at
which it can be produced by anaerobic decomposition. This unsustainability makes it imperative to
investigate alternative sources of energy which can be responsibly sustained into the future.
According to the 2011 International Energy Outlook, a report by the US Energy Information
Administration, world consumption of petroleum and other liquid fuels (including petroleum-derived
fuels and non-petroleum-derived liquid fuels, natural gas liquids, crude oil consumed as a fuel, and
liquid hydrogen) is projected to increase from 85.7 million barrels per day in 2008 to 112.2 million
barrels per day in 2035, a 31% increase [1]. Figure 1 is a graph of projected world liquid fuels
consumption by sector. Of the total liquid fuel consumed, the transportation sector is projected to
increase in percentage from 54% in 2008 to 60% in 2035, accounting for 79% of the increased
demand [1]. The transportation sector, which is defined as moving people or goods via road, air,
water, rail, or pipeline [1], is a strategic target for reducing liquid fuel usage. Additionally, the largest
increases in liquid fuel consumption are expected in non-member countries of the Organization for
Economic Cooperation and Development (OECD), particularly China and India who are expected to
increase their consumption of liquid fuels by 2.6% per year. This is in contrast to the 0.3% per year
increase in liquid fuel consumption expected in OECD countries [1]. The increased consumption in
non-OECD countries is due mainly to the increased ability of consumers to acquire vehicles and
expansion of the transportation sector. The expected increase of liquid fuel consumption by the
transportation sector highlights the importance of seeking alternative sustainable fuels as a means
to replace petroleum-based fuels for the future.

2
As discussed above, transportation accounts for the majority of liquid fuel consumption.
Liquid fuels, of which petroleum (oil) products are the chief component, represent a significant
portion (41.6%) of the total world energy usage as seen in Figure 2 [2]. This again reinforces the
impact reducing petroleum usage will have on energy security for the future.
Figure 1. World Liquid Fuels Consumption by Sector, 2008-2035
(million barrels per day) [1].
Figure 2. 2008 Fuel Shares of Total Final Consumption (million tons of oil equivalent) [2].

3
Figure 3 shows the primary energy usage in the U.S. in 2011, broken out into the source
and sector. In the U.S, petroleum accounts for 36% of the total energy supplied and the
transportation sector accounts for 28% of all energy consumed [3]. Of the total petroleum supply,
71% goes to the transportation sector; this accounts for 93% of the energy supplied to the
transportation sector. This is the largest percentage any one energy source has for a sector.
Reducing petroleum usage by the transportation sector would have the greatest impact on reducing
total petroleum usage in the U.S., and since petroleum is the largest energy source in the U.S. it
would also have the greatest impact on reducing total energy usage.
A popular discussion in the world oil debate is about the timing of peak oil. Peak oil is
defined as when the rate of oil production reaches a maximum. After peak oil occurs, the rate of oil
production will begin to decrease, making oil increasingly scarce, though not necessarily meaning it
is close to exhaustion [4]. Some experts maintain peak oil occurred in 2005, while others expect it
to occur sometime after 2030 [4]. Regardless of when it happens, peak oil will occur at some point.
When it occurs, oil prices will begin to rise due to a reduction in supply. This price increase will be
Figure 3. Primary (U.S.) Energy Consumption by Source and Sector, 2011 (Quadrillion Btu) [3].

4
accelerated when coupled with the predicted increase in demand for oil. Eventually, oil will become
an uneconomical energy solution. When this happens, alternative energy technologies must be
ready.
One aim of this work is to provide technical information to advance the possibility of using
hydrogen as a large portion of the fuel in a diesel engine. Diesel engines are already popular in
heavy-duty on-highway, off-highway, and agricultural applications; these three account for 74.6% of
distillate fuel oil (diesel) consumption in the US [3]. Increasingly, passenger and light-duty vehicles
are adopting diesel engine solutions as well. In Europe, approximately 50% of new passenger
vehicles are diesel powered [5]. The widespread use of diesel engine technology makes the
potential impact of reducing diesel fuel usage significant. Distillate fuel oil (which includes No. 1,
No. 2, and No. 4 diesel fuels and No. 1, No. 2, and No. 4 fuel oils) in the U.S. was consumed at a
rate of 3.85 million barrels per day in 2011 while motor gasoline was consumed at a rate of 8.47
million barrels per day, which together account for 67% of petroleum use in the U.S. in 2011 [3].
Motor gasoline has more than double the use of distillate fuel oils in the U.S. and so represents a
greater potential for reducing petroleum usage. Distillate fuel oil, which includes diesel fuel, still
represents over 20% of petroleum usage in the U.S. In markets such as Europe that have more
readily adopted diesel technology in light-duty vehicles, the impact of reducing diesel consumption
would be even greater. Additionally, on-highway applications, which accounted for 65% of distillate
fuel oil usage in the U.S. in 2011 [3], use much more fuel per vehicle than light-duty applications.
Heavy-duty trucks used 4,174 gallons per vehicle in the U.S. in 2011 versus 894 and 453 gallons
per vehicle for light-duty long and short wheelbase vehicles, respectively. Such high fuel usage per
vehicle means that implementing changes on a smaller number of vehicles can have a greater
impact on reducing total fuel usage.
1.2. Global Warming
Global climate change is a scientifically verifiable phenomenon: the earth goes through
natural cycles of warming and cooling. In recent decades the earth’s temperature has been rising,

5
giving way to a debate over global warming, its potential impacts, and what role burning carbon-
based fuels has had on the earth’s current climate trends.
Greenhouse gases such as water vapor, carbon dioxide, methane, nitrous oxide, and
ozone help maintain a moderate climate on earth. These gases help regulate the temperature of
the planet by absorbing and emitting infrared thermal radiation. At night these gases absorb heat
radiated from the earth’s surface and re-radiate it in all directions. Some of the re-radiated heat is
directed back towards the earth keeping it much warmer than without the gases. This phenomenon
is often called the greenhouse effect. The two gases that contribute most to the greenhouse effect
are water vapor and CO2, in that order [6]. Though water is a greater contributor to the greenhouse
effect, its residence time in the atmosphere is on the order of 10 days –- very short compared to the
residence time of CO2 which is on the order of decades to centuries [6]. This indicates that
perturbations of CO2 in the atmosphere will have long lasting effects. It is also important to note
that water vapor reacts to rather than drives climate change. Water vapor in the atmosphere is a
direct function of temperature: it will remain stable at any given temperature. This means that any
increase in CO2 also brings with it an increase in water vapor, amplifying the greenhouse effect.
It is widely believed that human activity has been the leading cause of the increase in
atmospheric CO2 levels, mainly through the burning of fossil fuels. Burning large quantities of
carbon-based fuels starting in the industrial revolution has increased the atmospheric CO2 level. A
1987 study measured historical CO2 level fluctuations over the last 400,000 years from as low as
180 ppm up to 280 ppm from cores cut from central Antarctica [7]. The current atmospheric CO2
level is about 400 ppm and has been steadily rising since the 1950s [8]. Since 1750, roughly just
before the industrial revolution, global average temperature has risen by 1.4 degrees F [8].
Regardless of the cause of global warming, it is a phenomenon that needs to be given
attention. The appropriate response depends on the effects global warming will have on the planet
and its inhabitants, which is still the topic of much debate. Among the proposed effects are:
extreme polar climate change, melting of glaciers and ice sheets, increased extreme weather
events, a rise in the sea level, and shifts in plant and animal territory. There are those who raise
much alarm about the potential impacts of global warming as well as those who think global

6
warming may even be a positive change. As time continues, the effects of global climate change
will manifest themselves and at that time it will be too late to avoid any negative impacts. Given the
potential for drastic negative impacts and the unprecedented levels of CO2, it would seem prudent
to undertake efforts to reduce the amount of CO2 emissions.
1.3. Emissions Regulations
Emissions regulations have been implemented to limit the amount of harmful pollutants
produced by internal combustion (IC) engines in most places where they are used. The U.S. EPA
has placed regulations on light-duty cars and trucks, heavy-duty on-highway vehicles, agricultural
and construction equipment, locomotives, marine vessels, recreational vehicles, and aircraft [10].
European emissions regulations, which are controlled by the European Union (EU), are very similar
to the U.S. regulations. Some developing world economies, most notably India and China, are
starting to adopt similar regulations to those in Europe and the U.S. The exhaust constituents
regulated by the EPA in the U.S. include: Nitrogen Oxides (NOx), Hydrocarbons (HC), Particulate
Matter (PM), and Carbon Monoxide (CO). Regulations are implemented incrementally, giving
original equipment manufacturers (OEMs) time to develop technology and comply with the
regulations. The EPA first started regulating on-highway vehicle emissions and later off-highway
emissions. The aforementioned pollutants have been targeted for regulation because of their short-
term, negative health effects, especially in heavily populated urban environments. Also, due to acid
rain, sulfur content in fuels has been heavily regulated, being reduced from 300 ppm down to 30
ppm for gasoline and from 500 ppm down to 15 ppm for diesel [10].
U.S. EPA off-highway emissions regulations for compression ignition (CI) engines started in
1996 with Tier 1 and are set to be fully implemented by 2015 with Final Tier 4. Figure 4 shows the
progression of the regulation of PM and NOx by power range of the EPA’s (and EU’s) non-road
emissions regulations [11]. Both species are given an allowance in g/kWhr with lower power
engines getting a larger allowance.
Carbon dioxide as a pollutant does not pose any immediate, direct risk to human health.
Rather, the negative effects of CO2 emissions are experienced by way of climate change, which

7
may have adverse, long-lasting effects on the planet as a whole. Currently there are no direct
regulations on CO2 as an exhaust emission for any type of vehicle in the U.S. Via the corporate
average fuel economy (CAFE) standards, CO2 emissions are indirectly regulated by mandating
automakers meet certain fleet fuel economy targets. Current regulations, which run through 2016,
require auto manufacturers to have an average fleet fuel economy of 35.5 mpg. The next set of
regulations, which runs through 2025, will require an average of 54.5 mpg for automakers [12].
Although no CO2 regulations have been announced for non-road applications, as fuel prices
continue to increase, OEMs will likely look for ways to improve fuel efficiency to foster
environmental responsibility and gain a competitive advantage.
Burning hydrogen as a fuel would reduce CO2, CO, and HC emissions by directly displacing
petroleum fuels. It has also been shown that H2 addition greatly reduces smoke (PM) emissions
from IC engines [13] [14] [15] [16] [17] [18] [19]. Engines in dual-fuel operation with hydrogen
typically have higher NOx emissions than diesel-only operation [14] [15] [16] [17] [18] [20] [21]. This
presents a challenge to meeting emissions regulations. There are a number of technologies that
can mitigate NOx including exhaust gas recirculation (EGR), charge dilution, and selective catalyst
reduction (SCR). Additionally, with a reduction in each of the other regulated exhaust gas
constituents, vehicle manufacturers could place additional focus on reducing NOx emissions.
Figure 4. EPA/EU non-road emissions regulations: 37-560 kW (50-750 hp) [11].

8
CHAPTER 2. RESEARCH OBJECTIVES
The primary objective of the current work is to investigate the combustion process of a dual-
fuel diesel-hydrogen engine operating near the knock limit. This technical knowledge is important
for finding means to increase H2 substitution. By increasing H2 substitution in a diesel engine, a
greater amount of carbon-based fuel can be displaced, extending the availability of fossil fuels
further into the future.
The combustion process will be analyzed on the basis of the size and shape of the in-
cylinder pressure trace, from which peak pressure, rate of pressure rise, and start of combustion
can be determined. Another important parameter that will be considered is injection timing. These
main combustion parameters along with engine speed, engine load, diesel energy, hydrogen
energy, and NO, NO2, CO, CO2, and HC emissions will be used to characterize engine performance
and suggest how increased H2 substitution may be achieved.

9
CHAPTER 3. BACKGROUND
3.1. Hydrogen as a Fuel
Many different alternative fuels have been proposed for use in transportation including:
ethanol, methane (CH4), liquefied petroleum gas (LPG), compressed natural gas (CNG), and
hydrogen (H2) [22]. Of these fuels, H2 is the only carbon-free option. For this reason H2 has the
greatest potential to reduce CO2 emissions. Being a non-carbon fuel, H2 would also eliminate CO,
HC, and smoke (PM) emissions. Assuming no impurities in the H2, there would also be no sulfur
oxides, lead, sulfuric acid, ozone, benzene, or formaldehydes produced during combustion [17]. If
H2 can be produced from renewable sources it also has the potential to be a sustainable source of
fuel and produce near-zero “well-to-wheel” CO2 emissions.
Many properties of H2 make it an attractive choice as a fuel for combustion. The first of
these is its lower heating value (LHV). Hydrogen has a LHV of 51,500 Btu/lb compared to 18,250
Btu/lb for diesel. This means that on a per mass basis H2 contains over 2.5 times the amount of
energy as diesel. Other notable H2 properties are its high diffusivity, large range of flammability (4-
75% in air), high autoignition temperature (1085 F), low ignition energy (.1.9e-8 Btu), low quench
gap (.025 in) and high flame speed (8.7-10.7 ft/s) [23]. A comparison of the properties of H2 and
diesel can be seen in Table 1.
The wide flammability range of H2 allows flexibility in the fuel-to-air (FA) equivalence ratio (φ) during
engine operation, where the FA equivalence ratio is the actual FA ratio divided by the stoichiometric
FA ratio. The range of equivalence ratios for H2 is 0.1<φ<7.1 [24]. This wide range allows a H2
Table 1. Properties of diesel and hydrogen fuel [16] [23].

10
engine to be run lean where high thermal and combustion efficiencies and lower NOx emissions can
be obtained.
Hydrogen’s high autoignition temperature presents challenges when used as the sole fuel
source in a CI engine. Szwaja and Grab-Rogalinski [25] propose a minimum compression ratio of
16:1 based on numerical analysis for the autoignition of H2 in a CI engine. This is in the range of a
typical diesel engine; however, in practice, H2 compression ignition does not appear to be
sustainable under such conditions. Szwaja and Grab-Rogalinski [25] conducted experiments with
H2-only operation on a diesel engine with a 17:1 compression ratio. The results showed a highly
stochastic combustion process. It was concluded that H2 was not being auto-ignited by
compression but ignited by hot spots in the combustion chamber. Stable operation was not
achieved during testing. Antunes et al. [26] were able to achieve stable compression ignition of H2
over a limited operating range via an inlet air heating system. The incoming fuel-air charge was
heated to 80 °C to ensure adequate temperature for auto-ignition. Although it presents challenges
when used as the sole fuel in CI combustion, when used in dual-fuel applications, hydrogen’s high
autoignition temperature can be a benefit. It allows higher compression ratios, which yield higher
theoretical thermal efficiencies, to be used before the onset of knock. It also means that at the
same compression ratio, H2 is more resistant to knock than diesel. This is confirmed by hydrogen’s
much higher Octane Number, which is a measure of the knock-resistance of a fuel.
The low ignition energy of H2 means that initiating combustion of H2 requires little energy.
This allows a wide variety of ignition sources to be used. In the case of dual-fuel operation, ignition
is typically initiated by the autoignition of diesel fuel. It has also been suggested that a glow plug
could be used to initiate combustion in a H2-only CI engine [27] [28]. The low-ignition energy also
requires care to be taken to avoid unintended ignition due to in-cylinder hot spots which can cause
pre-ignition or backfire, which will produce unstable operation.
The high flame speed, small quench gap, and high diffusivity of H2 all promote complete
combustion and therefore contribute to excellent combustion efficiency. The low quench gap
leaves less unburned fuel along the cylinder walls and piston face at the end of combustion. The
high flame speed promotes rapid, turbulent combustion which promotes better mixing of the fuel-air

11
mixture which produces better combustion. Hydrogen’s high flame speed also leads to higher
thermal efficiencies; with a quicker burn, combustion approaches a constant-volume process which
is thermodynamically more efficient that the typical constant-pressure combustion process of pure
diesel. The high diffusivity of H2 helps form a uniform mixture for combustion.
Hydrogen is often dismissed as dangerous due to the infamous Hindenburg accident. This,
however, is a misconception. Hydrogen is no more dangerous than petroleum-based fuels; it simply
has different safety considerations than either diesel or gasoline. Hydrogen is in fact safer than
diesel/gasoline in many respects. Hydrogen is non-toxic and will not cause contamination in the
event of a spill. Any H2 leaks or spills will quickly rise and diffuse into the surrounding air.
Hydrogen is dangerous primarily when used in enclosed spaces where it can collect to flammable
concentrations. For this reason, H2 should always be used in a ventilated area. If H2 is being used
in a test cell, the design should be such that the air in the test cell is refreshed 1-2 times every
minute and appropriate H2 sensors should be used [24]. Typically a warning will sound when the H2
concentration reaches 1%, and an alarm and emergency ventilation will be initiated at the detection
of 2% H2 concentration. Although it burns hotter than diesel, H2 has less time to transfer heat due to
its high flame speed. In the case of a punctured H2 tank that ignites, the flame will be predominantly
vertical due to the high buoyancy of H2 which can help prevent the flame from spreading [23].
Additionally, the gases produced in a H2 fire are non-toxic, the only by-product being water vapor.
Though the combustion products are non-toxic, the combustion process may consume enough
oxygen in enclosed environments to be a risk for asphyxiation. Hydrogen flames burn very pale
blue and are almost impossible to see. In darker lighting conditions, the visibility of the flame
improves, but caution should be used whenever working with a H2 flame. With small leaks, H2
diffuses quickly enough to avoid the lower flammability limit except very near the leak source.
Large leaks pose a much higher safety risk. Hydrogen also has poor electrical conductivity, which
requires all H2 conveying equipment to be grounded to avoid electrical discharge.
Although H2 has many desirable characteristics that make in an attractive alternative fuel, it
also poses a number of challenges. Among these are: storage, production, transportation, and
acceptance of H2 as a fuel.
12
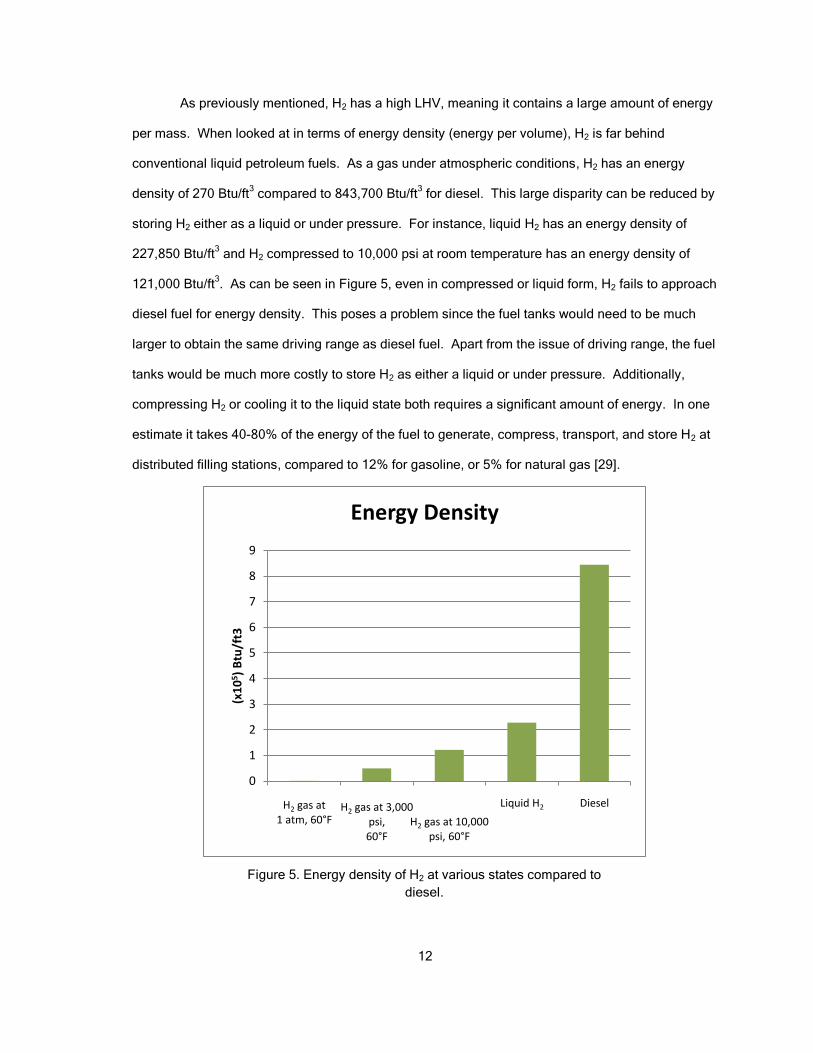
As previously mentioned, H2 has a high LHV, meaning it contains a large amount of energy
per mass. When looked at in terms of energy density (energy per volume), H2 is far behind
conventional liquid petroleum fuels. As a gas under atmospheric conditions, H2 has an energy
density of 270 Btu/ft3 compared to 843,700 Btu/ft
3 for diesel. This large disparity can be reduced by
storing H2 either as a liquid or under pressure. For instance, liquid H2 has an energy density of
227,850 Btu/ft3 and H2 compressed to 10,000 psi at room temperature has an energy density of
121,000 Btu/ft3. As can be seen in Figure 5, even in compressed or liquid form, H2 fails to approach
diesel fuel for energy density. This poses a problem since the fuel tanks would need to be much
larger to obtain the same driving range as diesel fuel. Apart from the issue of driving range, the fuel
tanks would be much more costly to store H2 as either a liquid or under pressure. Additionally,
compressing H2 or cooling it to the liquid state both requires a significant amount of energy. In one
estimate it takes 40-80% of the energy of the fuel to generate, compress, transport, and store H2 at
distributed filling stations, compared to 12% for gasoline, or 5% for natural gas [29].
Figure 5. Energy density of H2 at various states compared to
diesel.
H2 gas at 1 atm, 60°F
H2 gas at 3,000 psi, 60°F
H2 gas at 10,000 psi, 60°F
Liquid H2 Diesel
0
1
2
3
4
5
6
7
8
9
(x1
05 )
Btu
/ft3
Energy Density

13
This last statistic brings up another of the difficulties with H2 as a fuel: a lack of
infrastructure. The production, distribution, and storage of H2 remain a large challenge to its
widespread use as a fuel. Currently 95% of US H2 is produced by steam-methane reforming, a
process that produces 10-tons of CO2 for every ton of H2 [29]. This quickly eliminates the
advantage H2 brings to reducing GHG emissions. Electrolysis from renewable sources is the only
sustainable means of producing H2. Electrolysis is 3-4 times more expensive than steam-methane
reforming, however, and is expensive compared to directly using the electricity [29]. One situation
that may favor H2 production is if it can be used as a medium to store excess electrical production.
Another barrier to widespread H2 adoption is public acceptance. Diesel and gasoline are
widely accepted and familiar to the public. As with any new technology, there must be clear public
and private (personal) benefits [30]. Although the benefits exist in theory, they have yet to be made
feasible. It addition, push from the automotive industry would be necessary to foster a wider
acceptance of the new technology. This is no trivial matter as can be seen with the slow
acceptance of electric vehicle technology in spite of a push from automakers.
Were H2 to gain prominence as an alternative fuel in IC engines, it could act as a bridge to
H2 fuel cell technology in the future. Internal combustions engines currently can be made to run on
a large portion, if not entirely on H2, and provide the benefit of zero CO2 emissions. This can
provide an impetus for building H2 infrastructure: production, storage, and distribution facilities.
With H2 infrastructure in place, fuel cell technology, which promises efficiency increases over H2
combustion in IC engines, can be more easily introduced.
3.2. CI Diesel Combustion
A diesel engine runs on a four-stroke cycle. The operation of a four-stroke engine is
outlined in Figure 6. During the intake stroke (a) the intake valve is open and air is drawn into the
cylinder while the piston travels from top-dead-center (TDC), or the highest point in the cylinder, to
bottom-dead-center (BDC), or the lowest point in cylinder. In a naturally aspirated engine, air is
drawn into the cylinder by the downward motion of the piston, while in a turbocharged or
supercharged engine, the intake air is compressed above atmospheric pressure and is forced into

14
the cylinder when the intake valve opens. Only air is drawn into the cylinder of a diesel engine
during the intake stroke.
After the intake stroke, the compression stroke (b) occurs. During the compression stroke,
both the intake and exhaust valves are closed, making the combustion chamber a closed
thermodynamic system. As the piston travels from BDC to TDC, it does work on the air in the
combustion chamber, raising the temperature and pressure of the enclosed mass of air. Near the
end of the compression stroke, fuel is injected into the combustion chamber in a diesel engine.
Figure 6. Four stroke engine cycle operation [31].

15
Fuel is injected at high pressure to produce a fine mist of fuel droplets. These droplets must then
go through additional processes before they can be ignited, which will be explained later in this
section.
After fuel preparation has taken place, ignition (c) will occur due to the elevated
temperature and pressure in the cylinder of a CI engine. This will typically occur 5-10 degrees
before TDC (BTDC). The temperature and pressure required for auto-ignition of the fuel is largely
dependent on the fuel properties.
Once ignition has taken place, the engine will go through the power stroke (d). In a diesel
engine, combustion occurs well into the power stroke, over a range of 40-50 crank angle degrees
(CAD). The gases in the combustion chamber are at a very high temperature after combustion and
rapidly expand. During this time both the intake and exhaust valves are closed, allowing the
expanding gases to do work on the piston, which forces it back down toward BDC.
When the piston is nearing BDC during the power stroke, the exhaust valve will open and
blowdown (e) will occur. The exhaust valve opens prior to BDC, when temperature and pressure in
the cylinder are still relatively high compared to the atmosphere. This causes the majority of the
exhaust gases to rush out of the combustion chamber the moment the exhaust valve is opened.
After reaching BDC, with the exhaust valve open, the exhaust stroke (f) occurs. During the
exhaust stroke, the piston travels from BDC to TDC, forcing out any remaining exhaust gas from the
cylinder. As the piston nears TDC, the exhaust valve will close and the intake valve will open,
starting the cycle again.
An idealized P-V cycle diagram of a modern CI engine can be seen in Figure 7. Piston
motion from 1-2 represents the compression stroke. At 2, ignition occurs and premixed combustion
takes place from 2-x. From x-3 diffusion-controlled combustion occurs. The power stroke takes
place as the piston moves from x-3-4. From 4-5 is blowdown, from 5-6 is the exhaust stroke, and
from 6-1 is the intake stroke.

16
The steps fuel must go through before combustion play an important role in CI engines.
Since the fuel is not injected until late in the compression stroke, the fuel must quickly form a
combustible fuel-air mixture. The steps the fuel undergoes to prepare for combustion are: injection,
atomization, vaporization, and mixing [31]. Fuel is first injected into the cylinder at high pressure,
over 20,000 psi in many modern high-pressure common rail (HPCR) fuel injection systems. The
high injection pressure causes the fuel to enter the combustion chamber at high velocity. The
higher the injection pressure, the smaller the initial fuel drops will be. Turbulence of the air in the
cylinder helps to break up the fuel drops. After injection the fuel undergoes atomization, where the
fuel drops split up into smaller droplets. The droplets then vaporize very quickly due to the high
combustion chamber temperatures. Once vaporized, the fuel needs to mix with air in the cylinder to
form a combustible fuel-air mixture. The fuel-air mixture is heterogeneous, existing in various
zones at different concentrations, as shown by the idealized representation in Figure 8.
Immediately surrounding the fuel jet in zone A is a fuel-air mixture that is too rich (deficient oxygen)
to burn. Zone B is rich-combustible, zone C is near stoichiometric, zone D is lean combustible, and
zone E is too-lean to burn (excessive oxygen). Turbulence and swirl in the combustion chamber
help the fuel to mix with the surrounding air.
Figure 7. Idealized air-standard dual cycle pressure-specific volume diagram [31].

17
Combustion in a CI engine is initiated when the combustible regions of the air-fuel (AF)
mixture in the combustion chamber reach their auto-ignition temperature. Ignition is therefore
caused solely by the increase in temperature related with compression by the ideal gas law. Diesel
engines generally burn at a lean overall mixture with local combustion taking place in rich zones
[31]. Once ignition starts, two modes of combustion occur: premixed and diffusive [32]. Pre-mixed
combustion is the burning of the portions of the AF mixture which are at a combustible equivalence
ratio at the start of combustion. In premixed combustion the rate of reaction is a function of
temperature, equivalence ratio, and activation energy, but it is independent of location [32].
Diffusive combustion occurs as a mixture outside the combustible equivalence ratio becomes
combustible due to diffusion of O2 into the too-rich-to-burn zones. Gradients of both equivalence
ratio and temperature are present. The rate of reaction during diffusive combustion is determined
by the rate of diffusion [32].
Combustion in a CI engine is a complex process that can be broken up into a few basic
steps: ignition delay, premixed burning, main diffusion burning, and end burning [32]. Ignition delay
is the period between the start of injection and the start of combustion. The length of the ignition
delay period depends on physical processes such as droplet size and combustion chamber
temperature, as well as chemical processes such as the temperature at injection and the Cetane
Figure 8. Idealized fuel zones around an injection jet [31].
18
number of the fuel. In practice, the injection delay can be measured as the time from when the
injector fires to when there is a noticeable increase in pressure due to combustion. During the
premixed burning period, the premixed fuel is burned and a sharp pressure rise occurs. A longer
ignition delay will lead to more premixed fuel available at the start of the premixed burning period
and lead to a sharper rise in pressure. This period is where engine knock associated with high
rates of pressure rise is expected to occur. During the main diffusion burning period, fuel continues
to be injected into an already present flame. The fuel burns as it reaches an ignitable mixture
through diffusion. During the main diffusion burning period, the rate of reaction is lower than during
the premixed burning period. The end burning period is defined as from the end of fuel injection to
flame termination. The rate of reaction during end burning is lower yet due to decreased
temperature in the expanding combustion chamber [32].
19
CHAPTER 4. LITERATURE REVIEW
4.1. NDSU Engine Research Lab
Dual-fuel diesel-hydrogen research has been ongoing at the North Dakota State University
(NDSU) engine research lab since 2005. Stousland, in a work in progress, investigated the
feasibility of operating a 4-cylinder CAT engine with a fixed-timing, mechanical injection system in
dual-fuel mode with minimal modifications. The engine adapted easily to the introduction of H2 and
ran on 50% H2 by energy-input before reaching the knock limit. The effect of H2 substitution on
emissions, engine efficiency and combustion were also investigated.
Next, Bottelberghe conducted testing with a 6-cylinder CAT C6.6 engine equipped with an
Advanced Combustion Emission Reduction Technology (ACERT) engine control module (ECM),
designed to meet the U.S. EPA Tier 3 emissions standards [33]. The ECM controls the engine
electronically and was able to adapt to engine operation changes due to increased amounts of H2
by shifting injection timing, boost pressure, and other operating parameters. Bottelberghe observed
a knock limit at roughly 60% H2 by energy. The effects of H2 substitution on exhaust emissions,
operating efficiency, and combustion were investigated.
Stousland and Bottelberghe were both able to achieve significant H2 substitution before the
knock limit was reached. Both found that as operation approached the knock limit, the peak
cylinder pressure increased and occurred earlier in the cycle. Bottelberghe additionally found that
the ACERT ECM compensated for H2 addition by advancing the injection timing and adjusting boost
pressure. Stousland observed a slight increase in operating efficiency up to a point at each speed
tested, after which the efficiency began to drop. Bottelberghe observed a decrease in engine
efficiency with the addition of H2 up to a point, after which the efficiency began to increase. The
difference in these observations may be due to the different fuel delivery systems on the two
engines. The engine Stousland used for testing was a mechanically injected, mechanically
governed engine, while the engine Bottelberghe used was ECM controlled with a HPCR fuel system
and unit injectors. The presence of H2 may have initially increased the combustion efficiency of the
mechanically injected engine by promoting better fuel preparation.
20
In both prior research projects at the NDSU engine research lab, the engine was run only at
50% load, initially due to engine limitations with a mechanical fuel injection system, and later to
compare directly with previous research. The research presented in this paper is aimed at
expanding understanding of the H2 substitution limit over a broader range of operating conditions.
In the future, being able to control injection timing (and other operating parameters) via an
aftermarket ECM would allow for a more systematic investigation of dual-fuel combustion.
4.2. Dual-Fuel Combustion
There are three main H2 injection strategies for dual-fuel diesel-hydrogen engines: manifold
injection, port injection, and direct injection. Manifold and port injection can be either continuous or
intermittent. Direct injection is always intermittent.
In manifold injection, H2 is introduced into the intake manifold. Introducing the H2 a
distance upstream from the intake valve ensures adequate time to form a homogeneous mixture of
H2 and air. Manifold injection is often done in a continuous manner by passing H2 from a high
pressure storage tank through a pressure regulator and needle valve to control the flow rate. One
of the main advantages of continuous manifold injection is a low implementation cost in terms of
both price and complexity. The main disadvantage is that a portion of the incoming air is displaced
by H2, lowering the volumetric efficiency of the engine. This is termed the displacement effect, and
is particularly distinct with H2 due to its low density.
In port injection, H2 is introduced near the intake valve. For consistent mixture formation, a
H2 injector capable of injecting H2 timed to intake valve opening is necessary. Increased complexity
and the high cost of gas injectors coupled with failure to resolve the undesirable displacement effect
give port injection a poor cost/benefit ratio compared to manifold injection. In addition, Saravanan
and Nagarajan [16] report negligible differences between manifold and port injection operation.
In direct injection, H2 is introduced directly in the combustion chamber after intake valve
closure. This type of injection strategy requires expensive double injectors for dual-fuel operation.
The main advantage of direct injection is the elimination of the displacement effect. For the reasons
indicated, this method will not be considered here.
21
Dual-fuel combustion differs from diesel-only combustion. Using either of the first two H2
injection methods, the mixture of air and H2 can be considered homogeneous when it enters the
combustion chamber. This increases the fuel available during the premixed burning period of
combustion (assuming the H2 concentration is at least at the LFL). As H2 is added in dual-fuel
combustion, the constant volume combustion portion of the air-standard dual cycle is increased and
the constant pressure portion is decreased. This is because of the increase in premixed fuel which
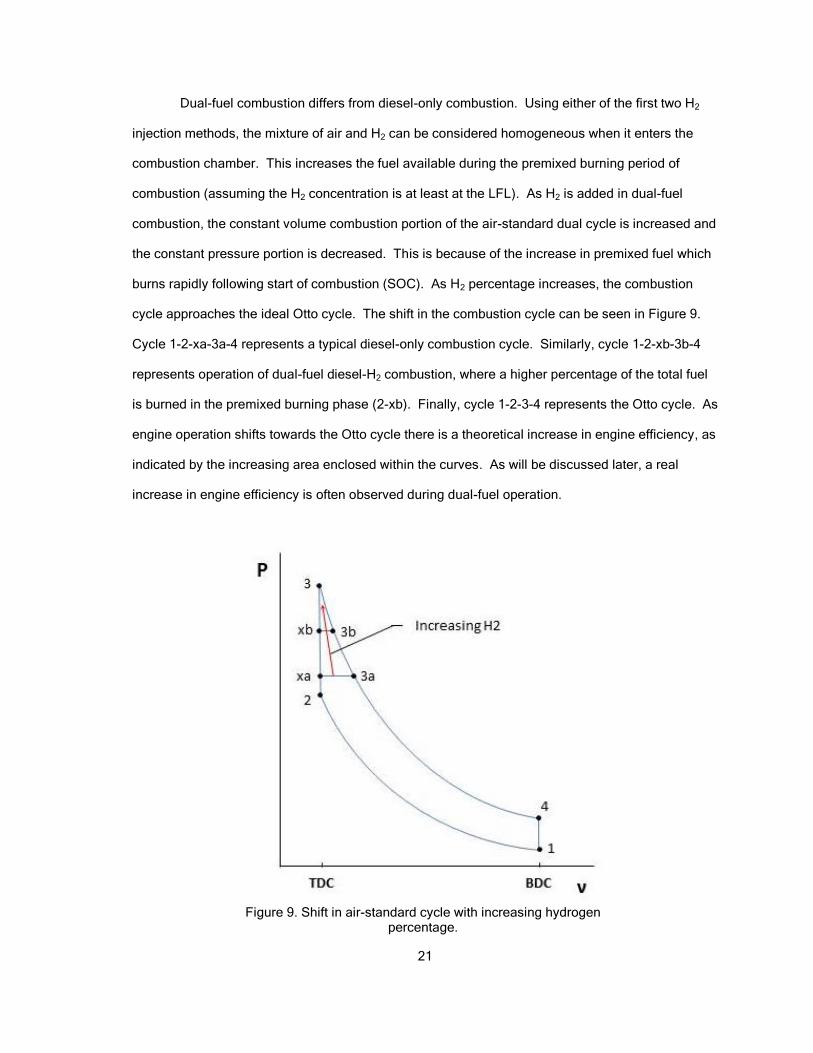
burns rapidly following start of combustion (SOC). As H2 percentage increases, the combustion
cycle approaches the ideal Otto cycle. The shift in the combustion cycle can be seen in Figure 9.
Cycle 1-2-xa-3a-4 represents a typical diesel-only combustion cycle. Similarly, cycle 1-2-xb-3b-4
represents operation of dual-fuel diesel-H2 combustion, where a higher percentage of the total fuel
is burned in the premixed burning phase (2-xb). Finally, cycle 1-2-3-4 represents the Otto cycle. As
engine operation shifts towards the Otto cycle there is a theoretical increase in engine efficiency, as
indicated by the increasing area enclosed within the curves. As will be discussed later, a real
increase in engine efficiency is often observed during dual-fuel operation.
Figure 9. Shift in air-standard cycle with increasing hydrogen percentage.

22
More fuel burned during the premixed burning period leads to an increase in the heat
release rate (HRR) at the beginning of combustion and a faster rate of pressure rise: these results
are verified in the literature [16] [25] [15]. A higher peak pressure occurring earlier in the cycle
would result from the increased HRR. This is consistent with work performed at NDSU [33] and
elsewhere [25] [20] where peak pressure increased and occurred earlier in the cycle with increasing
H2 percentage.
The effect that H2 addition has on ignition delay has been investigated by several authors.
Factors that affect the ignition delay in dual-fuel diesel-H2 engines are: temperature, pressure, and
charge concentration. Changes in the physicochemical properties and pre-ignition reactions make
dual-fuel ignition delays different from diesel-only [34]. In an investigation by Lata and Misra,
ignition delay decreased as load increased across all H2 fuel substitutions up to 50%. Ignition delay
increased at each load until 20-30% H2 substitution, then decreased up to 50% H2 substitution [34].
Similar results were obtained with LPG substitution. It has been shown that the ignition delay has
an Arrhenius temperature dependence, with increased ambient temperature reducing ignition delay
[35] [26]. At higher load conditions, residual cylinder temperature increased. This explains the
decrease in ignition delay with increasing load. It is suggested that the initial increase in ignition
delay was caused by a reduction in the partial pressure of oxygen due to gaseous fuel aspiration or
by unknown pre-ignition reactions [34] [36] [37]. Contrary to rest of the literature reviewed, Szwaja
and Grab-Rogalinski report a decrease in ignition delay with the addition of 5% H2 [25].
Tomita et al. [18] report an increase in ignition delay of a dual-fuel engine with advanced
diesel injection timing. Fuel injected at advanced timing would be injected at a lower cylinder
temperature, causing increased ignition delays, and likewise, fuel injected later in the compression
process would be injected at a higher cylinder temperature, resulting in reduced ignition delays.
Naber and Siebers [35] investigated the ignition delay of H2 using a constant volume
combustion chamber. They reported a decrease in ignition delay with increasing fuel temperature.
However, fuel temperature had less of an effect on ignition delay than ambient air temperature.
They also identified ambient pressure and, H2O, CO2, and O2 concentration as having a small effect

23
on ignition delay. This suggests pre-ignition reactions, rather than reduced O2 as being the
dominant mechanism in the initial increase in ignition delay in dual-fuel engines.
Many times it is assumed that H2 burns completely when supplied to a diesel engine.
Research has shown this is not true. Gatts et al. [38] investigated the H2 emissions and combustion
efficiency of a dual-fuel diesel-hydrogen engine. A modern, 6-cylinder heavy-duty engine with a
Variable Geometry Turbocharger (VGT) and cooled EGR was used for testing. It was found that at
low loads (10%), combustion efficiency of H2 was low, in the range of 75-80%. As load was
increased up to 70%, H2 combustion efficiency came into the range of 95-98%. Only a slight
increase in H2 combustion efficiency was observed with increasing H2 percentage.
The limiting factor on the amount of H2 that can be substituted in dual-fuel combustion is
knock. Understanding and mitigating knock is vital to achieving higher H2 substitution percentages
to reduce oil consumption. The increased burn rate of H2 leads to higher in-cylinder temperatures
and pressures during combustion. This can lead to excessive rates of energy release, causing a
high rate of pressure rise. One method to mitigate knock is exhaust gas recirculation (EGR). The
presence of exhaust gases in the combustion chamber lowers the temperature and slows the
combustion process. Another similar method is intake charge dilution. An inert gas such as N2 or
He is added along with H2 during intake. The gas does not take part in the combustion reaction, but
serves as a heat sink, lowering the combustion temperature. It has also been proposed that DI of
H2 can help to mitigate knock [27]. By being able to control the timing and amount of H2 added, pre-
ignition could be eliminated and knock could be better controlled. This method would be benefited
by the development of a double injector for both diesel and H2 injection [27]. Knock could also be
controlled by varying diesel injection timing to control the timing of peak pressure relative to TDC.
Changing the injection timing would also change the ignition delay period, affecting the amount of
premixed fuel, and thus the rate of pressure rise, during the premixed burning period.
4.3. Knock Mechanisms
Engine knock is the main limiting factor in the amount of H2 that can be substituted in a
diesel engine. Engine knock can be defined as a combustion event producing abnormally high

24
pressures and temperatures after the normal initiation of combustion. This phenomenon can
manifest itself in two different ways: the first will be referred to as end gas knock, the second as
diesel knock [38]. One or both types of knock may be present during dual-fuel operation.
End gas knock can be defined as the autoignition of the end gas region toward the end of
combustion. This type of knock is typically associated with gasoline engines. As the flame front
propagates through the premixed air-fuel charge, the gases behind the flame front, which are
already burned, are at much higher temperature and thus expand. This expansion compresses the
gases ahead of the flame front which are called end gases. If the end gases are compressed
enough, autoignition may occur in the end gas region. This results in a high energy release rate
which produces abnormally high temperatures and pressures and sends a pressure wave though
the combustion chamber [31].
Diesel knock can be defined as an excessive rate of pressure rise [39]. This can occur
when the pre-mixed charge at the start of combustion is large and burns rapidly. This causes
excessive loads and is accompanied by increased operating noise. In an engine burning only
diesel, this occurs when a large quantity of the fuel reaches a combustible mixture during the fuel
preparation phase, such as with a low-Cetane fuel. In dual-fuel operation, a larger quantity of pre-
mixed fuel is available at the start of combustion from the gaseous fuel content. When H2 is used
as the gaseous fuel, diesel knock is especially significant due to the fast burn rate of H2. Liu and
Karim [40], in a study on the knock characteristics of dual-fuel engines, concluded that the range of
operating conditions that will produce knock is wider with H2 than with other gaseous fuels.
Injection timing plays an important role in the heat release process and consequently in
controlling knock. In a study by Miyamoto et al. [13], the maximum rate of pressure rise decreased
as diesel injection was retarded from TDC to 6° ATDC in a naturally aspirated engine with 10.3% by
volume H2. This can be explained by combustion occurring at lower cylinder pressures as injection
moves away from TDC and into the expansion stroke. Roy et al. [41] also reported a decrease in
the maximum rate of pressure rise with retarded injection timing at different equivalence ratios in a
supercharged engine operating on around 90% H2 by energy. Injection timings tested were in the
range of 4°-18° BTDC. A comprehensive study of the effect of diesel injection timing on the rate of
25
pressure rise in a dual-fuel diesel-hydrogen engine could help solve the problem of diesel knock.
Tomita et al. [18] reported on the effect of diesel injection timing on the heat release rate of a dual-
fuel engine. The heat release rate is related to rate of pressure rise except it is independent from
the component of cylinder pressure from compression/expansion of the piston. Similarly, they
found that retarding the diesel injection timing reduces the rate of heat release in the approximate
range of 30° BTDC-5° ATDC. At significantly advanced injection timings, in the range of 30°-60°
BTDC, the rate of heat release was found to increase when injection was retarded.
Other factors also affect the knock in dual fuel engines. Selim [22] reports that lowering the
compression ratio retards the onset of knock in dual-fuel engines operating on LPG, methane, and
natural gas. This is intuitively consistent with an understanding of diesel combustion since cylinder
pressures in general are lower at lower compression ratios. Selim also reports a decrease in the
rate of pressure rise as engine speed increases. This could be because, assuming a similar
combustion event with respect to time, the engine travels through a greater CAD, lowering the
pressure rise per CAD.
4.4. Knock Detection
Knock should be avoided for its negative effects on engine durability and performance. In
order to avoid knock, it is necessary to identify when knock is occurring. End gas and diesel knock
can both be detected audibly. End gas knock produces a characteristic “pinging” noise from the
pressure wave created by the rapid combustion of the end gases. The tone of an engine with diesel
knock is harsher than during normal operation. These methods of audible detection are
unquantifiable and rely on an experienced ear, and therefore, are not well applied in scientific
studies.
Other forms of knock detection can be classified as either indirect or direct methods.
Indirect methods rely on the measurement of parameters outside the combustion chamber such as
engine block vibration. The advantage of indirect methods is that they are cheaper to implement -
from both a price and computational standpoint – than direct methods. This comes at the cost of
decreased accuracy and effectiveness over direct methods. Direct methods measure in-cylinder

26
parameters directly: in-cylinder pressure being the most often used parameter. The sensors are
costly since they are subject to the harsh in-cylinder conditions during combustion [42].
Burgdorf and Denbratt [43] compared a number of in-cylinder pressure based methods for
end gas knock detection. The following methods were compared: maximum amplitude of bandpass
filtered pressure, integral of bandpass filtered pressure, KI20 (a variant of the integral of bandpass
filtered pressure), peak cylinder pressure, peak rate of pressure rise, third time derivative of cylinder
pressure, and power spectral density. Of these, the maximum amplitude of cylinder pressure was
least sensitive to the frequency window selected for analysis. By this method, a band pass filter is
used to select the frequency range of interest, typically in the range of 5-25 kHz. End gas knock is
then defined as when the maximum amplitude of the filtered pressure is greater than an
experimentally determined threshold value.
Diesel knock can also be detected from the in-cylinder pressure signal. The rate of
pressure rise can be found by taking the first derivative of the pressure signal with respect to crank
angle. In order to avoid erroneous peaks due to high frequency pressure oscillations, the signal
should first be filtered to obtain a smooth pressure curve. The maximum value of the rate of
pressure rise can then be compared to a threshold value to identify diesel knock. A value of 6
atm/CAD is suggested in the literature [39].
While knock detection methods are well established, it also needs to be shown that these
same methods can be applied to dual-fuel operation. In a study by Swaja, Bahandary, and Naber, it
has been confirmed that this is the case [44]. The main difference is a shift to higher frequencies
due to a change in the speed of sound in the cylinder with the presence of H2.
4.5. Engine Performance in Dual-Fuel Operation
Hydrogen addition is generally reported as having a positive effect on the thermal
efficiency, though the results vary somewhat. There are a number or sources that report an
increase in thermal efficiency across all loads [14] [16] [17] [45] [46]. These researchers all used
small, single-cylinder, naturally aspirated engines. It is difficult to tell from these papers what
amount of H2 is being added. Others report a drop in thermal efficiency with the addition of H2 at

27
low loads, but an increase at high loads [19] [37]. In these papers, 50% or more H2 substitution is
being used. In an investigation by Lambe and Watson [19], water injection was used at high engine
loads to avoid engine knock. Shirk et al. reported changes in efficiency for 5% and 10% H2
substitution on a 1.3L engine at 8 steady-state points. The points at high engine speeds showed a
consistent increase in thermal efficiency with H2 substitution, while the results at low speeds did not
show a consistent trend. Finally, there are those that report little or no change in thermal efficiency
with H2 substitution such as Tomita et al. [18].
Manifold injection of H2 for dual-fuel operation is simple and low-cost, making it a widely
used solution. Because a portion of the incoming air is displaced by gaseous H2, power density is
limited. The solution is to directly inject the H2 into the combustion chamber. By switching from
manifold H2 injection to direct H2 injection, a theoretical power density increase of 38% is possible
under 100% H2 operation [24].
Injection timing plays an important role in engine performance. In the case of dual-fuel
diesel-hydrogen operation, the diesel fuel initiates combustion. Advanced injection timings
generally lead to higher peak pressure and combustion temperatures. This is beneficial for power,
but also increases NOx emissions. Retarded injection timings generally reduce NOx emissions and
the occurrence of knock, but limit the engine power.
Roy et al. [40] investigated the effect of diesel injection timing in a dual-fuel engine with
various gaseous fuels containing H2. In their experiments with H2 as the sole gaseous fuel, H2
accounted for approximately 90% of the energy supplied for combustion. Compared to the other
gaseous fuels tested, H2 was limited to lower power and equivalence ratios to avoid knock. At a
constant φ, retarding timing led to a drop in thermal efficiency and peak cylinder pressure.
4.6. Emissions in Dual-Fuel Operation
One large benefit of dual-fuel diesel-H2 engines is their potential to greatly reduce the
amount of CO2 emissions by reducing the overall carbon content of the fuel. Hydrogen addition
also tends to lower smoke emissions in diesel engines. These two benefits are typically countered
by an increase in NOx emissions.

28
There are three main mechanisms for NOx formation: thermal formation, prompt formation,
and N2O intermediate mechanism. Thermal formation is due to the Zeldovich mechanism which is
when O2 molecules split into two oxygen atoms and attack N2 molecules to form NO. This reaction
starts around 1000 C and increases drastically beyond 1300 C [32]. This form of NOx formation is
the most prevalent in dual-fuel diesel-H2 combustion. The prompt mechanism is observed in rich
fuel zones and is due to the formation and subsequent oxidation of HCN. This mechanism is of little
importance in diesel engine NOx formation [32]. The N2O intermediate mechanism is of importance
only at low engine loads [47].
In the literature, it is typically reported that H2 addition to a diesel engine has the effect of
increasing NOx and reducing particulate matter (PM or smoke) emissions. [14] [15] [17] [18]. These
two emissions are of primary importance since they are subject to governmental regulations. The
tradeoff where NOx increases when PM decreases and PM increases when NOx decreases is
inherent in any diesel engine, whether dual-fuel or not. High combustion temperatures favor the
formation of NOx as well as the oxidation of PM, whereas low combustion temperatures tend to
subdue NOx formation but decrease PM oxidation. Given the higher flame temperature of H2 than
diesel it follows that H2 combustion would increase NOx while reducing PM. Since PM is composed
of carbon-containing compounds, reducing the available carbon in the combustion chamber by
replacing diesel with H2 would also have the effect of decreasing PM emissions.
Hydrogen addition to a diesel engine reduces CO2 emissions, and typically, CO and HC
emissions as well. These carbon-containing emissions are expected to decrease from replacing a
portion of the diesel fuel by H2. In many cases CO and HC emissions of a diesel engine are already
low enough to be of little interest.
H2 addition, then, leaves the problem of high NOx emissions to solve. Researchers have
sought the solution to this problem in varied ways: changing injection timing, using EGR, using
charge dilution, or using a Selective Catalytic Reduction (SCR) system. Many of these methods are
already established as means to reducing NOx during diesel-only operation.
By retarding injection timing so that ignition and combustion occur later in the cycle,
especially after TDC, the in-cylinder temperatures and pressures will be lower, leading to lower

29
combustion temperatures. This is why retarding injection timing has the effect of reducing NOx
during dual-fuel combustion. This explanation is supported by the results of Roy et. al [21] [41],
Tomita et al. [18], Miyamoto et. al [13], and Lilik et al. [20].
EGR is well established as a means to reducing NOx. The recirculated exhaust gas acts as
an inert heat sink, reducing combustion temperatures. Since H2 has the effect of greatly reducing
PM emissions, EGR can be used, even in relatively high quantities, to reduce NOx emissions. Both
Saravanan et Al. [14] and Bose and Maji [17] achieved a reduction of both NOx and PM over diesel-
only by using a combination of H2 and EGR.
Charge dilution is another method for reducing NOx which works on the same principle as
EGR: an inert heat sink will reduce combustion temperatures, thereby reducing NOx. Instead of
using recirculated exhaust gas though, an inert substance from an external source is added. Roy et
al. was able to achieve zero NOx emissions by using 40-60% dilution with N2. This method greatly
limits the power density possible since a large portion of the incoming air is being displaced by an
inert diluent.
In order to meet the stringent Final Tier 4 EPA regulations, many major diesel engine OEMs
employ the use of an SCR system to reduce NOx. An SCR system consists of a Diesel Exhaust
Fluid (DEF) injector, a mixer, and a catalyst. DEF, which is a urea solution, is mixed with the
exhaust gases and passed through a catalyzed substrate where the NOx compounds are reduced
to N2 and H2O. Saravanan and Nagarajan [16] have demonstrated the use of an SCR system with
a dual-fuel engine. The NOx emissions from a diesel engine are typically composed of mostly NO.
In order for a SCR system to be effective, it is desirable to have the NOx emissions divided evenly
between NO and NO2. The effect of H2 addition on NO2/NOx ratio has been investigated by several
authors. Chong et al. [47] report an increase in both NO2 and NOx when using H2 and reformate
gas in a diesel engine. Liu et al. [46] found that adding small amounts of H2 increases NOx very
slightly, however greatly increases the NO2/NOx ratio. The ideal NO2/NOx ratio was only observed
at low loads. They also reported that unburned H2 is an important factor in NO2 formation: more
unburned H2 leading to higher levels of NO2. Lilik et al. [20] reported a decrease in NO and an

30
increase in NO2 with increasing H2 up to 15% by energy. These studies indicate dual-fuel
combustion with H2 as being favorable for NOx conversion by an SCR system.

31
CHAPTER 5. RESEARCH APPROACH
5.1. Experimental Setup
A CAT C6.6, 6.6L, 6-cylinder diesel engine equipped with ACERT technology was used for
testing. ACERT is a combination of technologies including a solenoid-actuated wastegate
turbocharger, high-pressure common rail fuel delivery, direct injection, and electronic control
designed to meet U.S. EPA Tier 3 emissions standards. Additional engine details can be seen in
Table 2.
Table 2. CAT C6.6 Engine Specifications.
CAT C6.6 Engine Specifications
Cylinders 6
Displacement 6.6L
Bore 4.13 in.
Stoke 5.0 in.
Compression Ratio 16.2:1
Rated power 183 hp @ 2100 rpm
Peak torque 582 ft-lb @ 1400 rpm
Valves/cylinder 4
Load was applied to the engine with a Land & Sea DYNOmite 13” single-rotor water brake
dynamometer. The engine and dynamometer were controlled using DYNO-MAX software and
operator console. The water supplied to the dynamometer for load control also served to cool the
dynamometer and was discharged to a floor drain.
An Optrand D322B1-Q-WJ optical pressure transducer was used to measure in-cylinder
pressure. The transducer was mounted in place of the glow plug in cylinder 6 with the tip flush with
the inside of the cylinder head.
Exhaust emissions were analyzed with a Nova 7466K exhaust gas analyzer which reads
O2, CO, and CO2 in percent and HC, NO and NO2 in PPM. Exhaust gas was continuously drawn
through a probe, probe-mounted filter, and two internal filters before being analyzed for constituent
composition. The probe was mounted in the exhaust elbow while the analyzer sat outside the test
cell. Emissions constituent readings were displayed on digital readouts and recorded manually.

32
Hydrogen was continuously inducted into the engine intake between the turbocharger and
aftercooler. The position was chosen to allow the H2 to mix well with the incoming air before
entering the cylinder. Hydrogen was supplied from high pressure bottles then passed through a
regulator to reduce the pressure. After the regulator, the H2 passed through a heat exchanger to
bring it up to room temperature before passing through a mass flow meter.
A Fox Thermal Instruments model 10A thermal mass flow meter was used to measure H2
flow rate. After the flow meter, a needle valve was used to control the flow rate of H2 entering the
intake. The needle valve was equipped with a motor and pulley system so it could be operated
remotely during testing. The addition of the motorized needle valve for H2 flow rate adjustment was
an innovation of the author to increase test cell safety. A schematic of the H2 induction system can
be seen in Figure 10.
Diesel fuel was delivered to the engine from a remote fuel tank. A fuel pump at the tank
outlet ensured consistent delivery of fuel to the engine. The flow rate of diesel fuel was measured
using a FloScan 236C flow meter.
An Omega JLD-612 PID temperature controller was used to control temperature of the
engine coolant exiting the engine and the temperature of the air exiting the aftercooler. The flow
rate of cooling water through the two heat exchangers was controlled by a circuit which included
Figure 10. Schematic diagram of the hydrogen induction system.

33
two valves that ran on a 2 second cycle. During each cycle the valves would start closed, open,
and close again. The length of time the valve was open depended upon the level of cooling
required.
Pressure variations from the PID controlled valves opening and closing were detected in
the water supply system. The variations were large enough to affecting the ability of the
dynamometer to hold the engine at a steady load. In order to remedy this problem, a Well-X-Trol
WX-202 water pressure damper was installed between the valves and the water supply.
Air to the engine was drawn from the test cell through a volumetric flow meter and air filter.
A weather station recorded temperature, pressure, and humidity in order to calculate correction
factors. Figure 11 shows a picture of the engine setup in the test cell.
Figure 11. CAT C6.6 engine setup in test cell.

34
The engine was instrumented with thermocouples to record temperatures at compressor
inlet, compressor outlet, coolant inlet, turbine inlet, and turbine outlet. Additionally there were
thermocouples at coolant outlet and aftercooler outlet as inputs to the PID temperature controllers.
An inductive sensor mounted on the back of the engine was positioned to read at TDC.
This signal was used to time in-cylinder events to crankshaft position.
5.2. Data Acquisition
Three types of data acquisition were employed during testing: high sample-rate, low
sample-rate, and hand recorded.
A Measurement Computing (MC) USB-1208FS data acquisition system (DAQ) was used to
capture high sample rate data. The MC DAQ had a total sample rate of 50 kHz with 4 differential
analog inputs. Three signals were recorded using differential inputs yielding a sample rate of 16.6
kHz per channel. The resolution of the data at the highest engine speed (2100 rpm) was one
sample every 0.76 degrees of crankshaft rotation.
The three signals recorded with the MC DAQ were: the pressure transducer signal, the
inductive timing signal, and the injector pulse signal. The pressure transducer signal was read
directly from the pressure transducer, which gave a 0.5-5 V output. A voltage dividing circuit was
incorporated into the leads of the inductive sensor to bring the signal into the 0-5 V range. The
signal sent from the ECM to the injectors was a 0-90 V signal. Since the maximum voltage range of
the DAQ was ±20 V, an indirect means of recording the signal was used. Only the timing, not the
magnitude, of the injector signal was of importance. Thus the injector signal was read by wrapping
a length of wire around the insulated injector wire. The current traveling through the injector wire
induced a signal in the wrapped wire by electromagnetic induction.
The MC DAQ was used in conjunction with a National Instruments LabVIEW program
developed by the author to perform signal operations and write data to comma separated variable
(CSV) files. Board time and the three signals from the DAQ were recorded directly. Board time
starts at zero when recording is initiated and records in “real-time” along with the data. Additional
signals that were recorded were: in-cylinder pressure calculated from the pressure transducer

35
signal, in-cylinder pressure after passing through a high-pass filter with a cutoff frequency of 4 kHz,
in-cylinder pressure after passing through a low-pass filter with a cut off frequency of 2 kHz, and the
derivative of the in-cylinder pressure after passing through the low-pass filter. Additionally, the
LabVIEW program was used give a visual indicator of diesel knock. The derivative of the in-cylinder
pressure was taken with respect to crank angle. The amplitude of this signal was monitored and a
binary indicator would light up when it exceeded 90 psi/deg. Important elements of the LabVIEW
front panel, which can be seen in Figure 12, include: waveform graphs of the various signals, the
knock indicator, and the button to record data.
Low sample-rate data was also recorded. This was done at 2 Hz using the DYNOmite data
computer included with the dynamometer software. Channels recorded with the DYNOmite DAQ
were: board time, engine speed, engine torque, diesel flow rate, barometer, percent humidity, air
temperature, and thermocouple readings (described in the previous section). Since the engine was
run at steady state conditions, the low sample-rate data was averaged over 30 seconds.
Figure 12. LabVIEW front panel.

36
Data from the exhaust gas analyzer was recorded by hand once per set-point during
testing. Each exhaust gas constituent was displayed in an individual digital display. The H2 flow
rate was also recorded by hand at each set point.
5.3. Experiment Design
Testing was done in a steady state manner at a range of speed and load combinations.
Four engine speeds were chosen for testing: 1300 rpm, 1500 rpm, 1800 rpm, and 2100 rpm.
Around 1350 rpm, the ECM-controlled injection strategy switched from a single main injection to
both a pilot and primary main injection. The 1300 rpm speed was selected to perform
experimentation during single main injection operation. The 2100 rpm point was chosen since it is
the rated speed of the engine. The 1500 rpm and 1800 rpm points were chosen as intermediate
speeds to fill in the speed-load test matrix. Five different engine loads were chosen for testing:
25%, 50%, 65%, 77.5%, and 90%. The 50% load was chosen for comparison with past research at
NDSU. The remaining load points were chosen to fill in the speed-load test matrix, with more points
concentrated at higher loads, where there was more interest. Not all points in the test matrix could
be reached; at 1300 rpm the dyno could not load the engine to 77.5% or 90% load and at 1500 rpm
the dyno could not load the engine to 90% load. A chart of the operable and inoperable set points
can be seen in Figure 13. An engine is typically not run at these low speed, high load points so
their exclusion is acceptable.
Diesel-only runs were made at each of the matrix set points in order to characterize the
change from diesel-only to dual-fuel diesel-hydrogen operation. In dual-fuel mode, H2 was added at
each set point until the LabVIEW program indicated the presence of diesel knock. This is the
maximum amount of H2 that can be safely added at each speed-load point.
Each speed-load set point was run at least three times to obtain statistical confidence in the
results. The in-cylinder pressure data was analyzed by first averaging eight consecutive firing
events to produce one pressure vs. CA curve for each separate run. The three (or more) pressure
vs. CA curves were then averaged together to obtain a single curve for each set point.

37
5.4. Experimental Procedure
Before performing any testing, the engine was warmed up. Warm up was done by idling
the engine for 5 minutes with light load (10-20 ft-lb). After idling, the engine was brought to 1200
rpm and additional load was applied until the engine-out coolant temperature reached 150 °F. Next,
the engine was brought to the desired set point and allowed to reach equilibrium. Equilibrium
conditions were identified as when the thermocouples read a constant temperature. For dual-fuel
runs, H2 was then added and manually adjusted until engine knock was indicated. As H2 was
added, diesel fuel was automatically reduced by the ECM to keep the engine speed approximately
constant. A speed increase of around 30 rpm was seen with H2 addition. This was corrected by
adjusting the throttle and load to reach the original set point. For dual-fuel runs, H2 flow was
reduced to zero after each run. When testing was finished the engine was cooled down at idle for 5
minutes before being shut down.
A consistent data acquisition sequence was followed once equilibrium was reached at each
set point. First, the LabVIEW program was started to read data from the MC DAQ. Next, the H2
0
10
20
30
40
50
60
70
80
90
100
1300 1400 1500 1600 1700 1800 1900 2000 2100
Engi
ne
Lo
ad (
% L
oad
)
Engine Speed (rpm)
Test Matrix
Operable Inoperable
Figure 13. Operable and inoperable speed-load set points for the experiment.

38
flow rate in standard cubic feet per minute (SCFM) was recorded for H2 runs. Then, recording was
started with the DYNO-max software and the board time was recorded for later reference. Next,
approximately 2 seconds of data was recorded from the MC DAQ using the LabVIEW program.
The file name was then recorded next to the DYNO-max board time for that run. After that, the
emissions readings were recorded by hand from the exhaust gas analyzer. Finally, data recording
from DYNO-max DAQ was stopped. Testing then proceeded to the next set point and the process
was repeated.
Diesel-only testing and dual-fuel diesel-hydrogen testing were done separately. During
diesel-only testing, testing was first done at 25% load. The order of the runs was to first make a
single run at the lowest speed then move up to the next speed until the highest speed was reached.
The sequence was then repeated two more times. For example, at 25% load the testing sequence
was as follows: 1300 rpm – 25% load, 1500 rpm – 25% load, 1800 rpm - 25% load, 2100 rpm – 25%
load, repeated two more times. Then the engine was brought to 50% load, 65% load, 77.5% load,
and 90% load respectively. By testing in this sequence, the 3 runs at each set-point were spread
out.
The dual-fuel testing sequence was done differently from the diesel-only sequence. First,
all three runs at the lowest speed and load were run then all three runs at the next speed until the
highest speed was reached. For example, all three runs were first done at 1300 rpm – 25% load,
followed by all three runs at 1500 rpm – 25% load, 1800 rpm – 25% load, and 2100 rpm – 25% load.
Since the speed and load needed to be adjusted at each set-point when H2 was added, H2 was
being consumed during the adjustment. Once the adjustment was made, the H2 could be shut off
and reintroduced at that set-point without the need to readjust the speed or load. The reason all
three dual-fuel runs at each set point were recorded in succession was to conserve H2 usage.
During dual-fuel testing, the H2 was turned off between each of the runs at each set point and the
engine was allowed to reach equilibrium before reintroducing H2 for the next run.

39
CHAPTER 6. RESULTS AND DISCUSSION
The results and discussion chapter is split up into 3 sections: engine performance,
combustion, and emissions. The first section will discuss the effects on percent H2 substitution and
thermal efficiency with H2 addition up to the knock limit. The section on combustion will discuss the
effects of H2 addition on various combustion parameters such as the peak cylinder pressure, the
shape of the in-cylinder pressure curve, the rate of pressure rise, and the injection timing. Finally,
the effect on the emissions of NOx, CO2, CO, and HC from H2 addition will be discussed.
6.1. Engine Performance
Engine power was held constant as H2 was added up to the knock limit. The engine
adapted to the induction of H2 by reducing the amount of diesel fuel injected. Only slight
adjustments were necessary to keep the engine at the same operating point during H2 addition.
Past research at NDSU [33] investigated H2 addition up to the knock limit at only 50% load and
1300, 1800, and 2100 rpm. The current research expands the knock limit to a wider range of
speeds and loads across the entire operating range of the engine. The maximum H2 addition at
each operating point can be seen in Figure 14, given in percent energy supplied to the engine. This
was calculated by dividing the energy content of the H2 by the total energy content of both H2 and
diesel. Hydrogen percentage at 25% load is not reported because the diesel flow rate for those
cases was below the range of the diesel flow meter.
A maximum H2 substitution of 74% was achieved at 2100 rpm and 50% load. At each rpm
the maximum H2 substitution decreased as load increased. This can be explained by observing the
maximum rate of pressure rise (MRPR) at each rpm (as seen later in this chapter). As load
increased at each rpm, the MRPR without H2 also increased. Hydrogen has the effect of increasing
the MRPR due to its rapid combustion and high flame speed. Since the H2 substitution was limited
by setting a threshold on MRPR, the lower loads, which had a lower MRPR to begin with, could be
run with a higher percentage of H2 before hitting the MRPR threshold for knock.

40
It was also observed that at each load, maximum H2 substitution increased with increasing
engine rpm. Maximum H2 percentages at 1500 and 1800 rpm were almost identical, with the max
H2 percent being lower at 1300 rpm at each load, and the max H2 percent being higher at 2100 rpm
at each load. Increasing H2 substitution with increasing speed can be attributed to the reaction of
the ECM to H2 substitution.
Also of interest to engine performance is thermal efficiency. Thermal efficiency was
calculated by dividing the measured engine power by the total rate of energy supplied to the engine.
In dual-fuel operation, the total energy rate included energy from both diesel and H2. Again, since
the diesel flow rate was out of the range of the diesel flow meter during dual-fuel operation at 25%
load, no thermal efficiency is reported at these points. The results of thermal efficiency for both
diesel-only and dual-fuel operation are shown in Figure 15. The results show that thermal efficiency
decreased with increasing load at constant engine speed. This is contrary to what is reported in
most of the literature, where thermal efficiency increased with increasing load, peaking around 80%
load [14] [15] [19] [37] [46]. The difference may be that injection timing was intentionally fixed in the
literature, while in the current research injection timing was shifted by the ECM. As load was
0%
10%
20%
30%
40%
50%
60%
70%
80%
20% 30% 40% 50% 60% 70% 80% 90% 100%
Pe
rce
nt
H2
Percent Load
Maximum Hydrogen Energy
1300
1500
1800
2100
Figure 14. Hydrogen percentage at the knock limit on an energy basis.
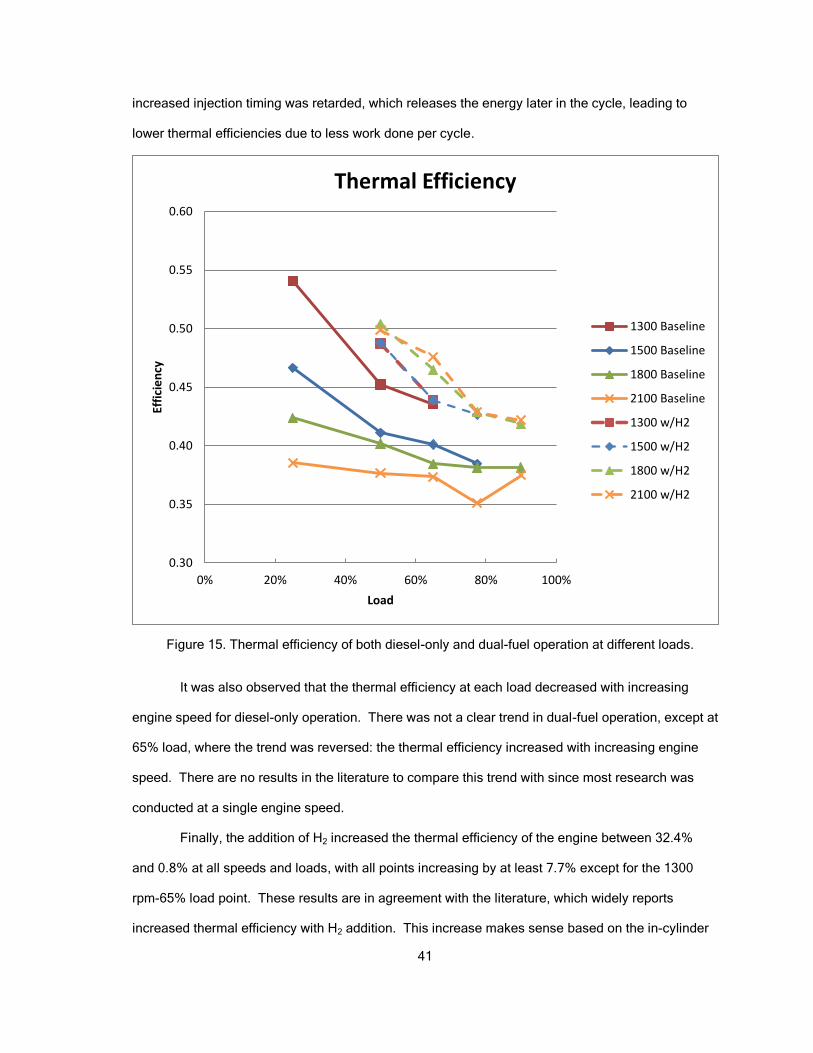
41
increased injection timing was retarded, which releases the energy later in the cycle, leading to
lower thermal efficiencies due to less work done per cycle.
It was also observed that the thermal efficiency at each load decreased with increasing
engine speed for diesel-only operation. There was not a clear trend in dual-fuel operation, except at
65% load, where the trend was reversed: the thermal efficiency increased with increasing engine
speed. There are no results in the literature to compare this trend with since most research was
conducted at a single engine speed.
Finally, the addition of H2 increased the thermal efficiency of the engine between 32.4%
and 0.8% at all speeds and loads, with all points increasing by at least 7.7% except for the 1300
rpm-65% load point. These results are in agreement with the literature, which widely reports
increased thermal efficiency with H2 addition. This increase makes sense based on the in-cylinder
0.30
0.35
0.40
0.45
0.50
0.55
0.60
0% 20% 40% 60% 80% 100%
Effi
cie
ncy
Load
Thermal Efficiency
1300 Baseline
1500 Baseline
1800 Baseline
2100 Baseline
1300 w/H2
1500 w/H2
1800 w/H2
2100 w/H2
Figure 15. Thermal efficiency of both diesel-only and dual-fuel operation at different loads.
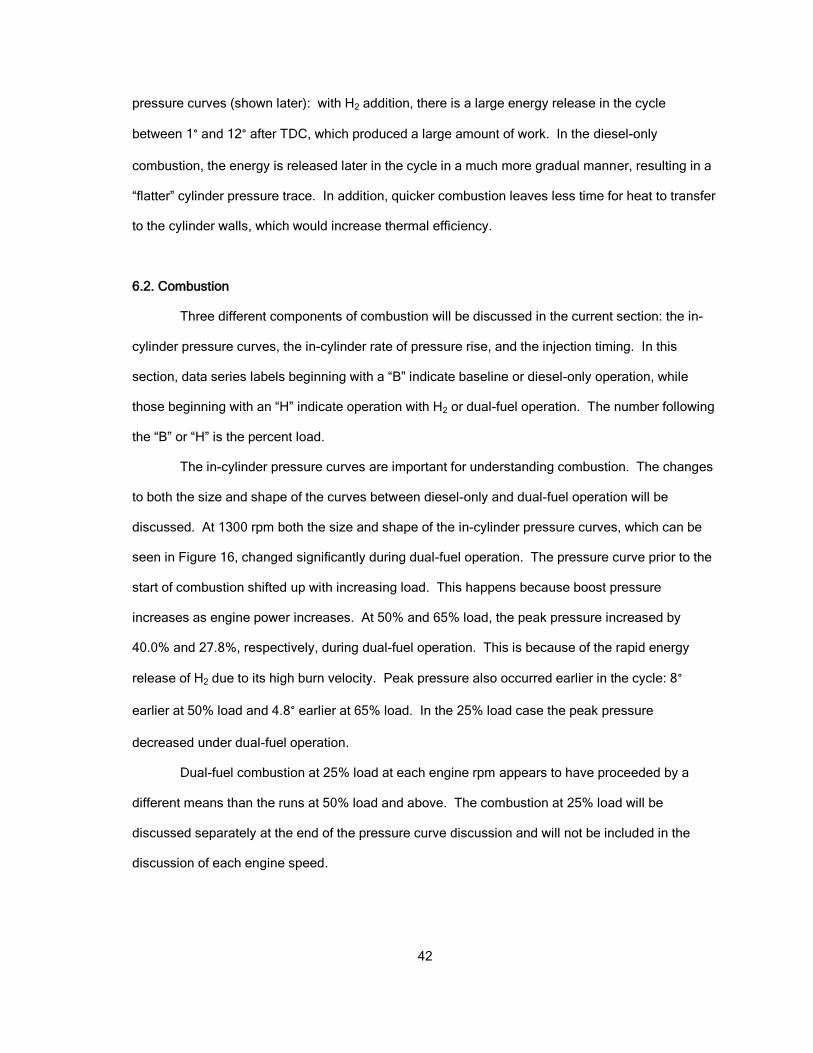
42
pressure curves (shown later): with H2 addition, there is a large energy release in the cycle
between 1° and 12° after TDC, which produced a large amount of work. In the diesel-only
combustion, the energy is released later in the cycle in a much more gradual manner, resulting in a
“flatter” cylinder pressure trace. In addition, quicker combustion leaves less time for heat to transfer
to the cylinder walls, which would increase thermal efficiency.
6.2. Combustion
Three different components of combustion will be discussed in the current section: the in-
cylinder pressure curves, the in-cylinder rate of pressure rise, and the injection timing. In this
section, data series labels beginning with a “B” indicate baseline or diesel-only operation, while
those beginning with an “H” indicate operation with H2 or dual-fuel operation. The number following
the “B” or “H” is the percent load.
The in-cylinder pressure curves are important for understanding combustion. The changes
to both the size and shape of the curves between diesel-only and dual-fuel operation will be
discussed. At 1300 rpm both the size and shape of the in-cylinder pressure curves, which can be
seen in Figure 16, changed significantly during dual-fuel operation. The pressure curve prior to the
start of combustion shifted up with increasing load. This happens because boost pressure
increases as engine power increases. At 50% and 65% load, the peak pressure increased by
40.0% and 27.8%, respectively, during dual-fuel operation. This is because of the rapid energy
release of H2 due to its high burn velocity. Peak pressure also occurred earlier in the cycle: 8°
earlier at 50% load and 4.8° earlier at 65% load. In the 25% load case the peak pressure
decreased under dual-fuel operation.
Dual-fuel combustion at 25% load at each engine rpm appears to have proceeded by a
different means than the runs at 50% load and above. The combustion at 25% load will be
discussed separately at the end of the pressure curve discussion and will not be included in the
discussion of each engine speed.
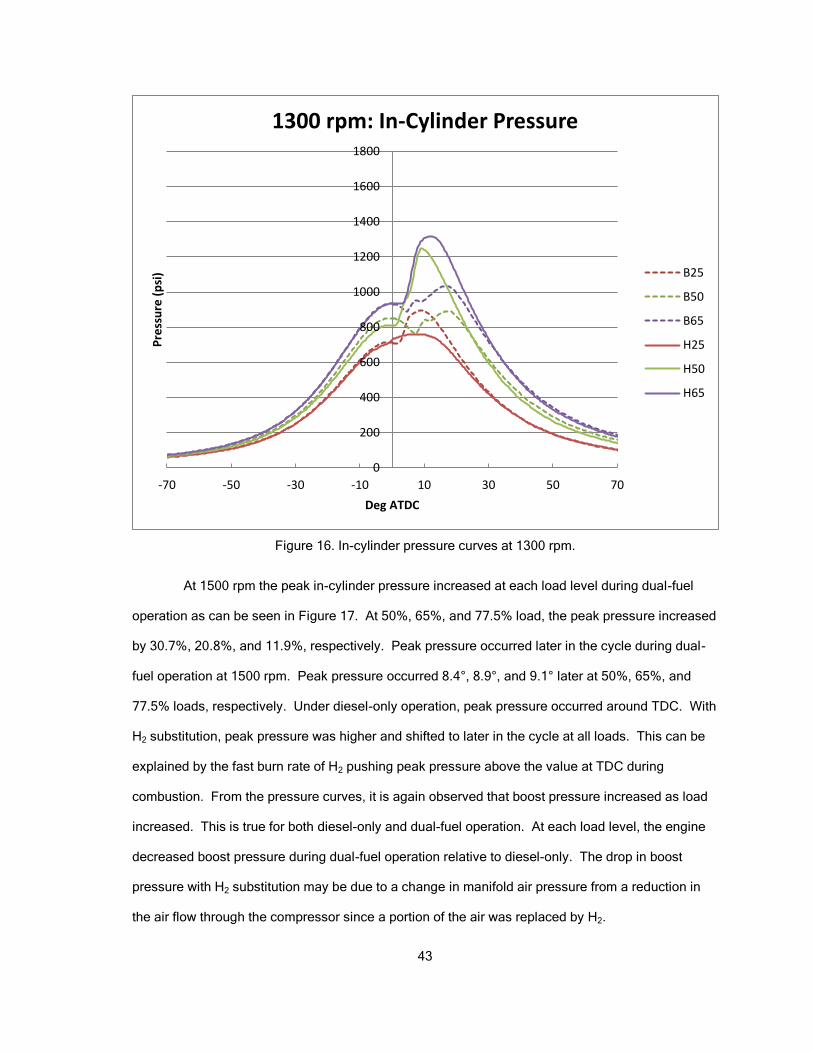
43
At 1500 rpm the peak in-cylinder pressure increased at each load level during dual-fuel
operation as can be seen in Figure 17. At 50%, 65%, and 77.5% load, the peak pressure increased
by 30.7%, 20.8%, and 11.9%, respectively. Peak pressure occurred later in the cycle during dual-
fuel operation at 1500 rpm. Peak pressure occurred 8.4°, 8.9°, and 9.1° later at 50%, 65%, and
77.5% loads, respectively. Under diesel-only operation, peak pressure occurred around TDC. With
H2 substitution, peak pressure was higher and shifted to later in the cycle at all loads. This can be
explained by the fast burn rate of H2 pushing peak pressure above the value at TDC during
combustion. From the pressure curves, it is again observed that boost pressure increased as load
increased. This is true for both diesel-only and dual-fuel operation. At each load level, the engine
decreased boost pressure during dual-fuel operation relative to diesel-only. The drop in boost
pressure with H2 substitution may be due to a change in manifold air pressure from a reduction in
the air flow through the compressor since a portion of the air was replaced by H2.
0
200
400
600
800
1000
1200
1400
1600
1800
-70 -50 -30 -10 10 30 50 70
Pre
ssu
re (
psi
)
Deg ATDC
1300 rpm: In-Cylinder Pressure
B25
B50
B65
H25
H50
H65
Figure 16. In-cylinder pressure curves at 1300 rpm.

44
The in-cylinder pressure curves at 1800 rpm can be seen in Figure 18. At 50%, 65%,
77.5%, and 90% load, peak pressure increased by 33.3%, 13.8%, 8.4%, and 9.4%, respectively,
during dual-fuel combustion. Again, as H2 was added, the engine reduced the boost pressure.
Boost pressure was reduced by less at low loads compared to high loads, which led to larger
increases in peak pressure at lower loads than at higher loads. The timing of peak pressure at
1800 rpm was similar to that at 1500 rpm: peak pressure occurred near TDC for diesel-only runs,
and in the range of 10° ATDC for dual-fuel runs. For diesel-only runs, start of combustion occurred
after TDC and the pressure rise was low enough that the cylinder pressure never exceeded the
value at TDC. For dual-fuel combustion, pressure rise increased due to the high burn rate of H2 and
the peak pressure surpassed the value at TDC. At 50%, 65%, 77.5%, and 90% load, the timing of
peak pressure occurred 2.6°, 8.9°, 6.3°, and 7.2° later, respectively, during dual-fuel combustion.
At 1800 rpm, peak pressure increased more in dual-fuel operation at 90% load than at 77.5% load.
The pressure curves indicate that the engine reduced boost to a greater extent during dual-fuel
0
200
400
600
800
1000
1200
1400
1600
1800
-70 -50 -30 -10 10 30 50 70
Pre
ssu
re (
psi
)
Deg ATDC
1500 rpm: In-Cylinder Pressure
B25
B50
B65
B77.5
H25
H50
H65
H77.5
Figure 17. In-cylinder pressure curves at 1500 rpm.

45
operation at 77.5% load than at 90% load. This can be observed by looking at the difference in
cylinder pressures at TDC between baseline and dual-fuel operation.
The in-cylinder pressure curves at 2100 rpm, which can be seen in Figure 19, exhibited
different behavior from 1500 rpm and 1800 rpm. At 50%, 65%, 77.5%, and 90% load, peak
pressure increased by 22.7%, 11.8%, -3.1%, and 0.12%, respectively, during dual-fuel combustion.
The percent increase in peak pressure between diesel-only and dual-fuel operation decreased as
engine load increased, except for at 90% load where it increased from 77.5% load. At 2100 rpm,
however, peak pressure actually decreased at 77.5% load during dual-fuel operation. The pressure
curves reveal a significant reduction in boost pressure at 77.5% load. During dual-fuel combustion
at 50%, 65%, 77.5%, and 90% load, the timing of peak pressure occurred 7.7°, 9.0°, 8.0°, and 5.9°
later, respectively. The analysis of the change in peak pressure timing is similar to 1500 rpm and
1800 rpm: start of combustion ATDC combined with a low rate of pressure rise for diesel-only
0
200
400
600
800
1000
1200
1400
1600
1800
-70 -50 -30 -10 10 30 50 70
Pre
ssu
re (
psi
)
Deg ATDC
1800 rpm: In-Cylinder Pressure
B25
B50
B65
B77.5
B90
H25
H50
H65
H77.5
H90
Figure 18. In-cylinder pressure curves at 1800 rpm.

46
combustion and a high rate of pressure rise for dual-fuel combustion lead to a peak pressure above
the value at TDC during dual-fuel combustion, but not diesel-only combustion.
As stated earlier, dual-fuel combustion at 25% load was different than dual-fuel combustion
at all other loads. At 25% load, the rate of pressure rise never reached a value that tripped the
knock detection trigger. Hydrogen was added until the engine started to “surge,” then backed off
until steady operation was achieved. A large variation in the shape of the pressure curves was
observed, even at the same speed, load, and H2 flow rate. Figure 20 shows a comparison of the
average pressure curves from individual runs at 25% load–1300 rpm and 77.5% load–1800 rpm.
Although the four runs at 77.5% load differ in magnitude, the basic profile shape remains the same.
The runs at 25% load differ in shape in the rage of 0-25° ATDC. The reason for the variability in the
shape of the run-averaged curves is inconsistency in the shape of the pressure curves for individual
combustion events. The variability between combustion events for run 2 at 1300 rpm-25% load and
run 1 at 1800 rpm–77.5% load can be seen in Figure 21. The individual cycle pressure curves at
0
200
400
600
800
1000
1200
1400
1600
1800
-70 -50 -30 -10 10 30 50 70
Pre
ssu
re (
psi
)
Deg ATDC
2100 rpm: In-Cylinder Pressure
B25
B50
B65
B77.5
B90
H25
H50
H65
H77.5
H90
Figure 19. In-cylinder pressure curves at 2100 rpm.
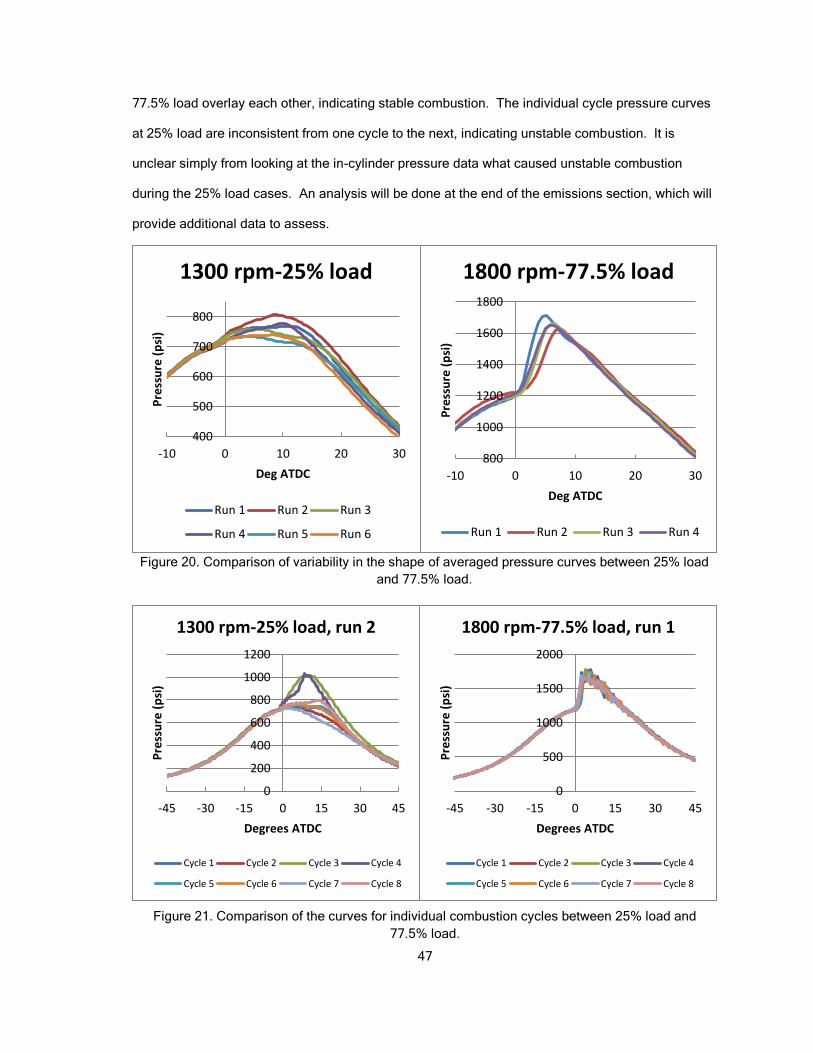
47
77.5% load overlay each other, indicating stable combustion. The individual cycle pressure curves
at 25% load are inconsistent from one cycle to the next, indicating unstable combustion. It is
unclear simply from looking at the in-cylinder pressure data what caused unstable combustion
during the 25% load cases. An analysis will be done at the end of the emissions section, which will
provide additional data to assess.
Figure 20. Comparison of variability in the shape of averaged pressure curves between 25% load
and 77.5% load.
400
500
600
700
800
-10 0 10 20 30
Pre
ssu
re (
psi
)
Deg ATDC
1300 rpm-25% load
Run 1 Run 2 Run 3
Run 4 Run 5 Run 6
800
1000
1200
1400
1600
1800
-10 0 10 20 30
Pre
ssu
re (
psi
)
Deg ATDC
1800 rpm-77.5% load
Run 1 Run 2 Run 3 Run 4
Figure 21. Comparison of the curves for individual combustion cycles between 25% load and
77.5% load.
0
200
400
600
800
1000
1200
-45 -30 -15 0 15 30 45
Pre
ssu
re (
psi
)
Degrees ATDC
1300 rpm-25% load, run 2
Cycle 1 Cycle 2 Cycle 3 Cycle 4
Cycle 5 Cycle 6 Cycle 7 Cycle 8
0
500
1000
1500
2000
-45 -30 -15 0 15 30 45
Pre
ssu
re (
psi
)
Degrees ATDC
1800 rpm-77.5% load, run 1
Cycle 1 Cycle 2 Cycle 3 Cycle 4
Cycle 5 Cycle 6 Cycle 7 Cycle 8

48
The next parameter that is important to combustion analysis is the rate of pressure rise
(RPR), which is calculated by taking the first derivative of the in-cylinder pressure curve. The
maximum rate of pressure rise (MRPR) was used in this study to detect the occurrence of diesel
knock at a threshold of 90 psi/deg. It can also be used to give an indication of the start of
combustion (SOC) and the rate of heat release. Without a combustion event, the shape of the
graph for the RPR would be symmetric about TDC as the example in Figure 22 shows. The point at
which the measured rate of pressure rise deviates from the no-combustion curve would indicate
SOC. The higher the peak above the no-combustion curve, the larger the heat release rate.
Multiple peaks in the rate of pressure rise indicate multi-phase combustion [37]. An increased
number of peaks can be thought of as indicating a more complex combustion process.
The RPR curves for 1300 rpm can be seen in Figure 23. At 50% load and 65% load during
dual-fuel combustion, the MRPR increased by 156% and 204%, respectively, compared to diesel-
only combustion. Higher rates of pressure rise indicated an increase in the rate of combustion. The
SOC also occurred earlier in dual-fuel combustion. Again, dual-fuel combustion at 25% load at all
speeds was different, so the results for RPR differ from other load levels. At 1300 rpm MRPR
decreased by 61% from diesel-only to dual-fuel combustion at 25% load.
Figure 22. Example of the rate of pressure rise in the absence of combustion in a
reciprocating piston engine.
TDC

49
The RPR curves for 1500 rpm can be seen in Figure 24. At 25%, 50%, 65%, and 77.5%
load during dual-fuel combustion the MRPR increased by 39%, 281%, 215% and 190%,
respectively, compared to diesel-only combustion. The curves also indicate an advanced SOC
under dual-fuel combustion compared with diesel-only combustion. At 1500 rpm the MRPR at 25%
increases during dual-duel operation, but to a much smaller degree than at other loads. The 50%
dual-fuel case shows a small peak before the main peak. The double peak in the 65% load curve is
a product of how the average rate of pressure rise curves for each run averaged together. In each
case of diesel-only combustion, the MRPR occurs during compression, before TDC, and not during
combustion. This is because of the relatively retarded SOC combined with the slower diffusion
combustion mode. During dual-fuel combustion, the fast premixed burning phase dominates and
the MRPR occurs during this phase of combustion rather than during compression.
-60
-40
-20
0
20
40
60
80
100
120
-70 -50 -30 -10 10 30 50 70Rat
e o
f P
ress
ure
Ris
e (
psi
/CA
D)
Deg ATDC
1300 rpm: Rate of Pressure Rise
B25
B50
B65
H25
H50
H65
Figure 23. Rate of pressure rise curves for 1300 rpm.
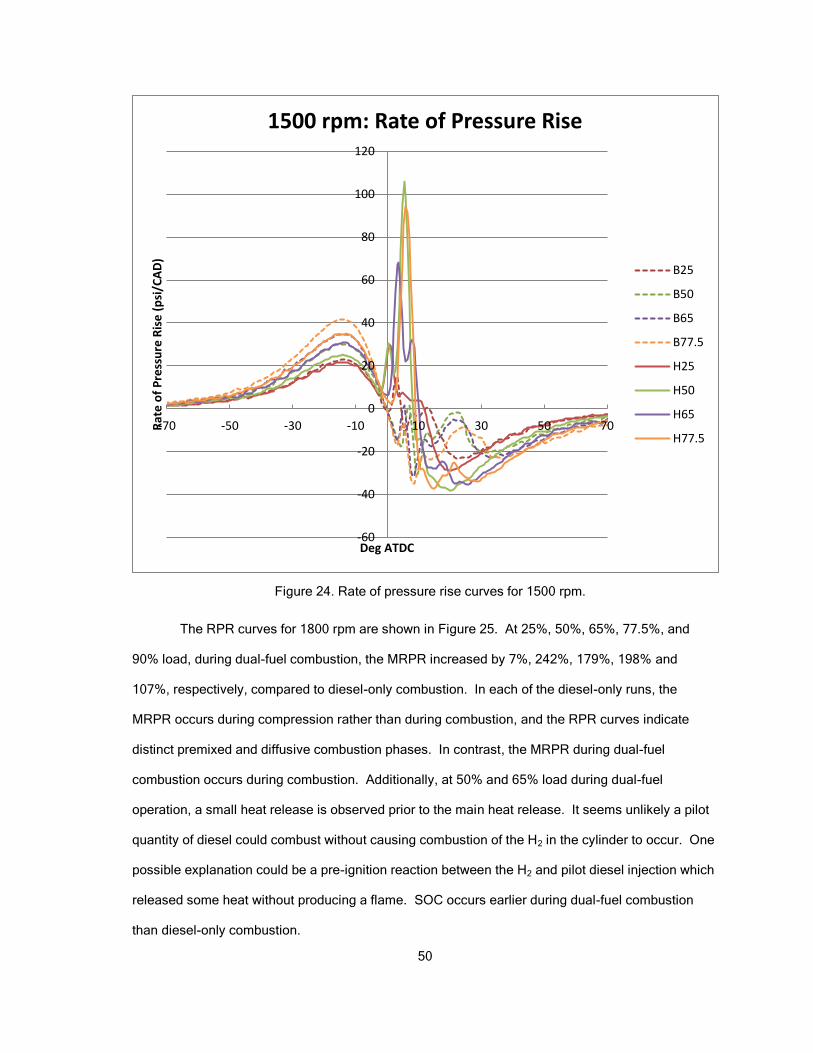
50
The RPR curves for 1800 rpm are shown in Figure 25. At 25%, 50%, 65%, 77.5%, and
90% load, during dual-fuel combustion, the MRPR increased by 7%, 242%, 179%, 198% and
107%, respectively, compared to diesel-only combustion. In each of the diesel-only runs, the
MRPR occurs during compression rather than during combustion, and the RPR curves indicate
distinct premixed and diffusive combustion phases. In contrast, the MRPR during dual-fuel
combustion occurs during combustion. Additionally, at 50% and 65% load during dual-fuel
operation, a small heat release is observed prior to the main heat release. It seems unlikely a pilot
quantity of diesel could combust without causing combustion of the H2 in the cylinder to occur. One
possible explanation could be a pre-ignition reaction between the H2 and pilot diesel injection which
released some heat without producing a flame. SOC occurs earlier during dual-fuel combustion
than diesel-only combustion.
-60
-40
-20
0
20
40
60
80
100
120
-70 -50 -30 -10 10 30 50 70Rat
e o
f P
ress
ure
Ris
e (
psi
/CA
D)
Deg ATDC
1500 rpm: Rate of Pressure Rise
B25
B50
B65
B77.5
H25
H50
H65
H77.5
Figure 24. Rate of pressure rise curves for 1500 rpm.

51
The RPR curves for 2100 rpm can be seen in Figure 26. At 25%, 50%, 65%, 77.5%, and
90% load, during dual-fuel combustion, the MRPR increased by 8%, 155%, 96%, 85% and 60%,
respectively, compared to diesel-only combustion. The 2100 rpm cases produced very similar
results to the 1800 rpm cases. For diesel-only combustion, MRPR occurred during compression,
while for dual fuel combustion, MRPR occurred during combustion. Again, as with the 1800 rpm
case, the diesel-only cases showed a distinctive two phase combustion while the dual-fuel
combustion showed a small heat release prior to the main combustion event for the 50% and 65%
load cases. The SOC was advanced for dual-fuel combustion compared to diesel-only combustion.
The percent increase in the MRPR during dual-fuel combustion was less for the 2100 rpm cases
than the 1800 rpm cases. This was due to lower MRPR during dual-fuel combustion at 2100 rpm
compared to 1800 rpm.
-60
-40
-20
0
20
40
60
80
100
120
140
-70 -50 -30 -10 10 30 50 70
Rat
e o
f P
ress
ure
Ris
e (
psi
/CA
D)
Deg ATDC
1800 rpm: Rate of Pressure Rise
B25
B50
B65
B77.5
B90
H25
H50
H65
H77.5
H90
Figure 25. Rate of pressure rise curves for 1800 rpm.

52
In each of the 1300 rpm, 1500 rpm, and 1800 rpm cases (excluding the 25% load cases)
the MRPR under dual-fuel operation was near 90 psi/deg, which was the established knock
threshold. The MRPR in the dual-fuel 2100 rpm cases fell short of 80 psi/deg. Due to limitations in
the H2 delivery system, the 2100 rpm case was receiving the maximum possible H2 delivery.
Although the knock indicator did trigger at 2100 rpm, it did so less frequently than in the other
cases. This indicates that the same level of knock was not reached. Fewer combustion cycles
reached the 90 psi/deg threshold, lowering the average MRPR for the runs.
Injection timing is another parameter that greatly affects combustion. An attempt was made
to control the injection timing with a circuit that was intended to augment the injection signal
between the ECM and the injectors. This was pursued in the absence of an unlocked ECM where
the injection timing values could be modified by changing the ECM maps. Issues with supply of
electrical components and a compressed time schedule lead to the decision to abandon the circuit
before it was finished. The circuit design is briefly outlined in Appendix C.
-60
-40
-20
0
20
40
60
80
100
-70 -50 -30 -10 10 30 50 70
Rat
e o
f P
ress
ure
Ris
e (
psi
/CA
D)
Deg ATDC
2100 RPM: Rate of Pressure Rise
B25
B50
B65
B77.5
B90
H25
H50
H65
H77.5
H90
Figure 26. Rate of pressure rise curves for 2100 rpm.

53
The engine was allowed to change injection timing as H2 was added. The injection strategy
used by the ECM at 1300 rpm was a single main injection. Above 1300 rpm the ECM used a pilot
and a main injection. It was observed that the pilot injection duration, the main injection duration,
and the timing between the pilot and main injections were constant with respect to time.
Figure 27 shows the main injection timing for both diesel-only and dual-fuel operation. The
main injection timing for dual-fuel operation was advanced compared to diesel-only, with the two
becoming approximately equal at the maximum load at each engine speed. As the load decreased,
the amount the main injection timing for dual-fuel operation advanced compared to diesel-only
operation increased. This can be seen in Figure 28 which shows the shift in timing between diesel-
only and dual-fuel operation. Under diesel-only operation, the main injection timing was somewhat
constant at 50% load and above, with 25% load main injection timing being advanced compared to
higher loads. A different trend was seen with dual-fuel operation: main injection timing was
continually retarded as load increased at each speed.
20%
30%
40%
50%
60%
70%
80%
90%
-18.00 -15.00 -12.00 -9.00 -6.00 -3.00 0.00 3.00 6.00
Engi
ne
Lo
ad
Deg ATDC
Main Injection Timing
1300 Diesel 1500 Diesel 1800 Diesel 2100 Diesel
1300 Dual-Fuel 1500 Dual-Fuel 1800 Dual-Fuel 2100 Dual-Fuel
Figure 27. Main injection timing during diesel-only and dual-fuel operation.

54
The values in Figure 28 were calculated by taking the injection timing during dual-fuel
operation and subtracting the injection timing during diesel-only operation at each point. Both main
injection timing and pilot injection timing were shifted by the same amount at each point. The graph
of the pilot injection values can be seen in Figure 29. As was mentioned above, the injection
strategy at 1300 rpm did not use a pilot injection. In dual-fuel operation at 25% load there was no
pilot injection.
Had the ECM not reduced boost pressure during dual-fuel operation, the increase in peak
in-cylinder pressure and MRPR would have been even greater. Being able to retard the injection
timing would allow for SOC later in the cycle. Maximum cylinder pressure and MRPR would remain
lower and would potentially allow a greater amount of H2 to be added while avoiding diesel knock.
This comes with the tradeoff of reduced thermal efficiency.
Without precise knowledge of the ECM logic, it is difficult to be sure of why boost pressure
was reduced and injection timing was advanced during dual-fuel operation. The change in control
could have been caused by a change in physical sensor readings, virtual sensor readings, or a shift
in control maps. The answer is most likely a complex combination of all three. Inlet manifold
20%
30%
40%
50%
60%
70%
80%
90%
-15.0 -13.0 -11.0 -9.0 -7.0 -5.0 -3.0 -1.0 1.0
Engi
ne
Lo
ad
Timing Shift (CA deg)
Shift in Injection Timing
1300 rpm 1500 rpm 1800 rpm 2100 rpm
Figure 28. Shift in injection timing between dual-fuel and diesel-only combustion.
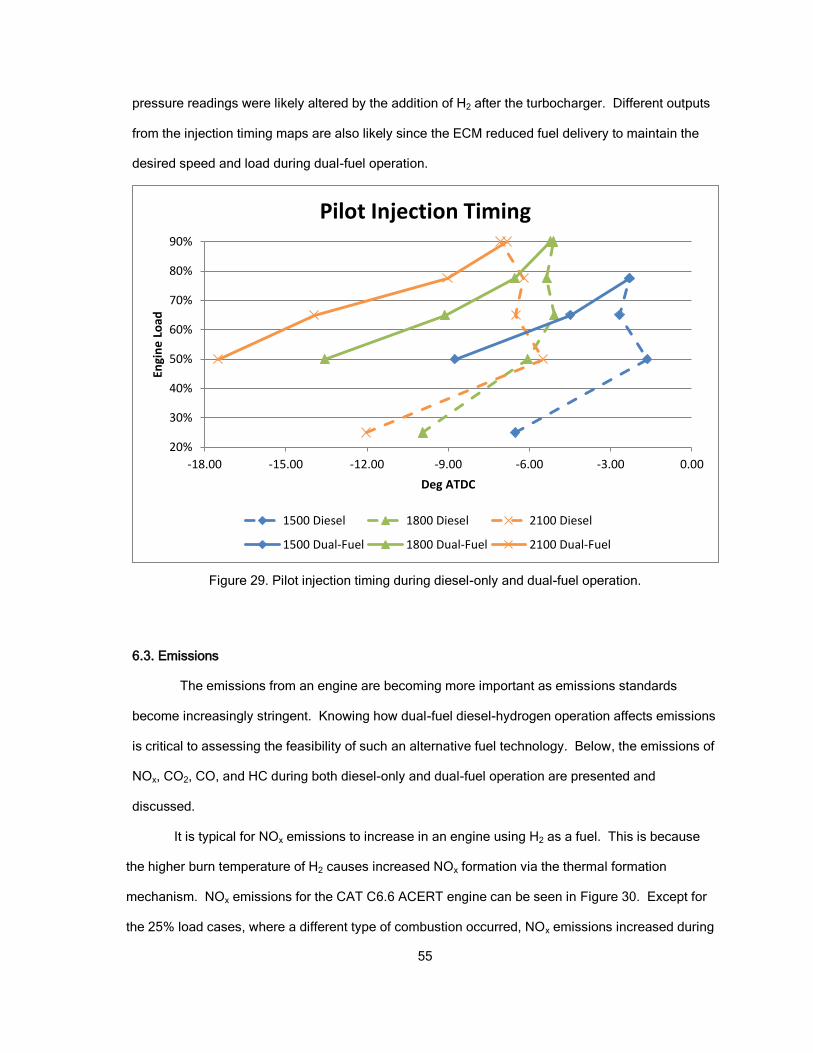
55
pressure readings were likely altered by the addition of H2 after the turbocharger. Different outputs
from the injection timing maps are also likely since the ECM reduced fuel delivery to maintain the
desired speed and load during dual-fuel operation.
6.3. Emissions
The emissions from an engine are becoming more important as emissions standards
become increasingly stringent. Knowing how dual-fuel diesel-hydrogen operation affects emissions
is critical to assessing the feasibility of such an alternative fuel technology. Below, the emissions of
NOx, CO2, CO, and HC during both diesel-only and dual-fuel operation are presented and
discussed.
It is typical for NOx emissions to increase in an engine using H2 as a fuel. This is because
the higher burn temperature of H2 causes increased NOx formation via the thermal formation
mechanism. NOx emissions for the CAT C6.6 ACERT engine can be seen in Figure 30. Except for
the 25% load cases, where a different type of combustion occurred, NOx emissions increased during
20%
30%
40%
50%
60%
70%
80%
90%
-18.00 -15.00 -12.00 -9.00 -6.00 -3.00 0.00
Engi
ne
Lo
ad
Deg ATDC
Pilot Injection Timing
1500 Diesel 1800 Diesel 2100 Diesel
1500 Dual-Fuel 1800 Dual-Fuel 2100 Dual-Fuel
Figure 29. Pilot injection timing during diesel-only and dual-fuel operation.

56
dual-fuel operation. For diesel-only combustion, NOx emissions were relatively constant at each
speed and as speed increased NOx emissions were reduced. For dual-fuel operation (ignoring the
25% load points), NOx emissions decreased as load increased at each speed. As speed increased,
NOx emissions decreased with 1500 rpm and 1800 rpm producing near identical NOx emissions.
Maximum load at 1500 rpm, 1800 rpm, and 2100 rpm produced NOx emissions that were close to
diesel-only operation, a 27%, -3%, and 28% increase, respectively. NOx emissions were highest at
50% load, increasing 106%, 150%, 210%, and 224% at 1300 rpm, 1500 rpm, 1800 rpm, and 2100
rpm, respectively.
The two emissions currently regulated by the EPA are NOx and particulate matter (PM).
The literature indicates that H2 addition reduces the amount of particulate matter. This result could
not be verified since the lab was not equipped with an emissions sampler that can measure PM.
However, NOx increased, which is consistent with the literature. The increased level of NOx would
need to be reduced be some suitable means as discussed in the literature review. One of the
leading strategies used by diesel OEMs is SCR. Since the ratio of NO2 to NOx is of interest for the
0.00
200.00
400.00
600.00
800.00
1000.00
1200.00
1400.00
20% 30% 40% 50% 60% 70% 80% 90%
NO
x Em
issi
on
s (p
pm
)
Load
NOx Emissions
1300
1500
1800
2100
1300 w/H2
1500 w/H2
1800 w/H2
2100 w/H2
Figure 30. NOx emissions for diesel-only and dual-fuel operation.
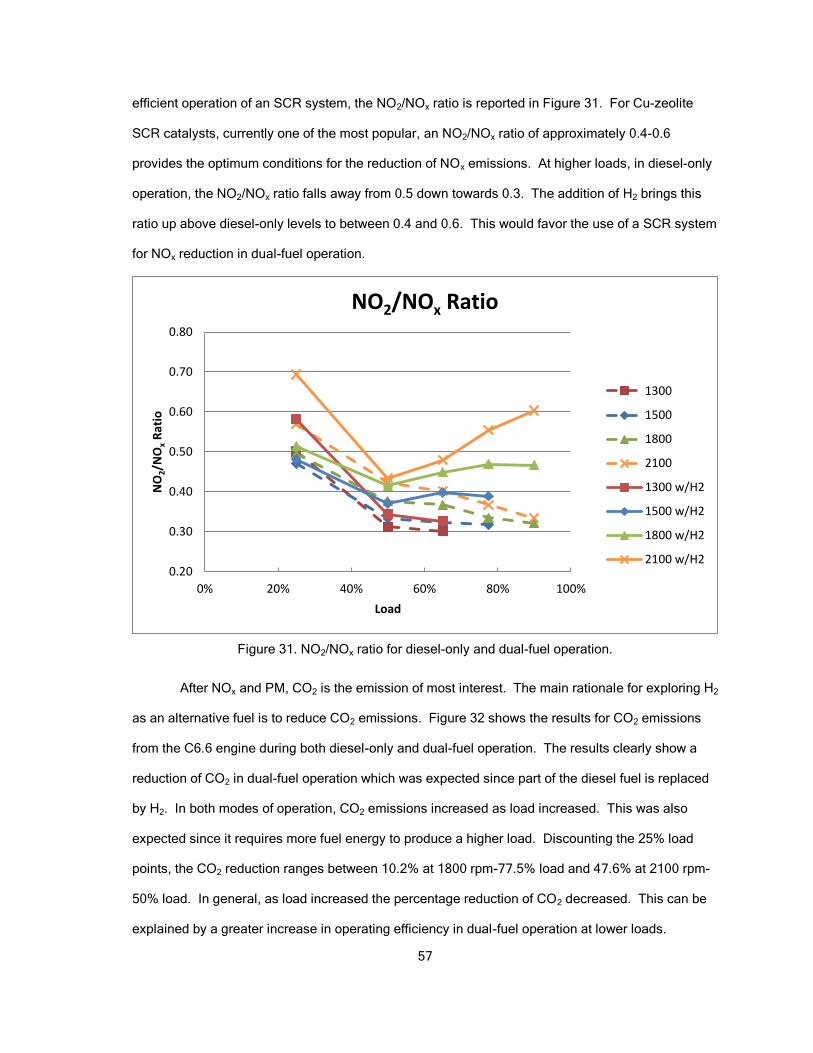
57
efficient operation of an SCR system, the NO2/NOx ratio is reported in Figure 31. For Cu-zeolite
SCR catalysts, currently one of the most popular, an NO2/NOx ratio of approximately 0.4-0.6
provides the optimum conditions for the reduction of NOx emissions. At higher loads, in diesel-only
operation, the NO2/NOx ratio falls away from 0.5 down towards 0.3. The addition of H2 brings this
ratio up above diesel-only levels to between 0.4 and 0.6. This would favor the use of a SCR system
for NOx reduction in dual-fuel operation.
After NOx and PM, CO2 is the emission of most interest. The main rationale for exploring H2
as an alternative fuel is to reduce CO2 emissions. Figure 32 shows the results for CO2 emissions
from the C6.6 engine during both diesel-only and dual-fuel operation. The results clearly show a
reduction of CO2 in dual-fuel operation which was expected since part of the diesel fuel is replaced
by H2. In both modes of operation, CO2 emissions increased as load increased. This was also
expected since it requires more fuel energy to produce a higher load. Discounting the 25% load
points, the CO2 reduction ranges between 10.2% at 1800 rpm-77.5% load and 47.6% at 2100 rpm-
50% load. In general, as load increased the percentage reduction of CO2 decreased. This can be
explained by a greater increase in operating efficiency in dual-fuel operation at lower loads.
0.20
0.30
0.40
0.50
0.60
0.70
0.80
0% 20% 40% 60% 80% 100%
NO
2/N
Ox
Rat
io
Load
NO2/NOx Ratio
1300
1500
1800
2100
1300 w/H2
1500 w/H2
1800 w/H2
2100 w/H2
Figure 31. NO2/NOx ratio for diesel-only and dual-fuel operation.
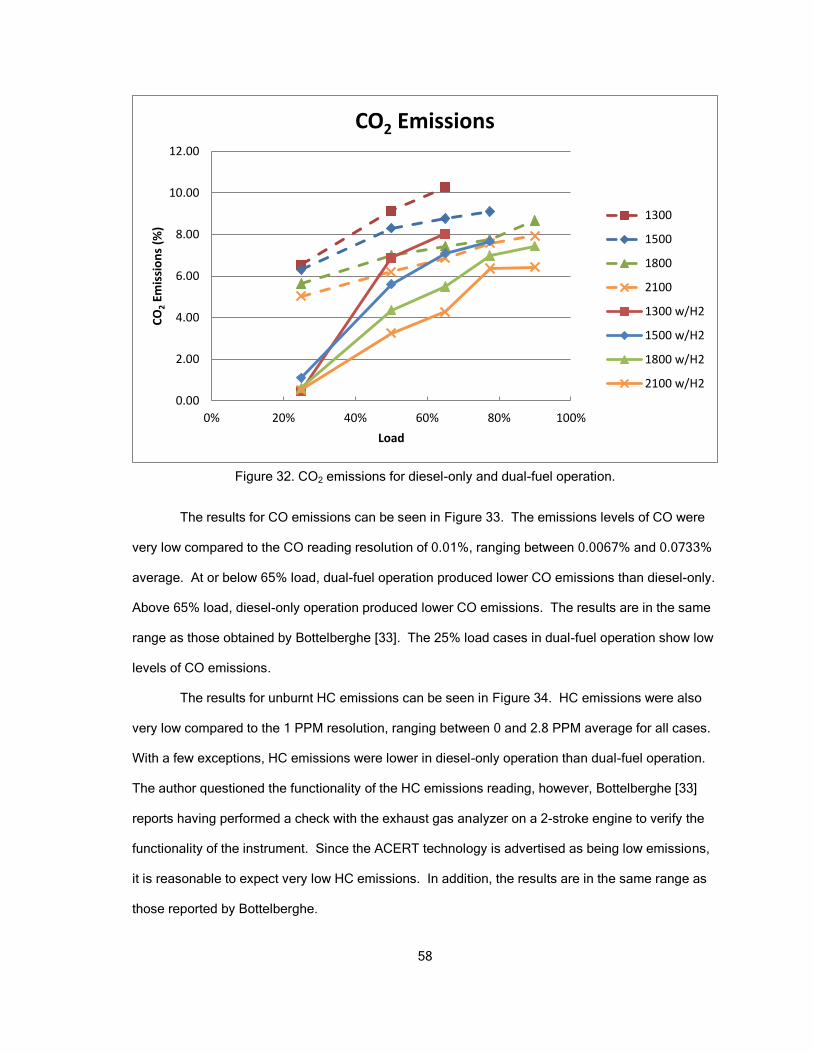
58
The results for CO emissions can be seen in Figure 33. The emissions levels of CO were
very low compared to the CO reading resolution of 0.01%, ranging between 0.0067% and 0.0733%
average. At or below 65% load, dual-fuel operation produced lower CO emissions than diesel-only.
Above 65% load, diesel-only operation produced lower CO emissions. The results are in the same
range as those obtained by Bottelberghe [33]. The 25% load cases in dual-fuel operation show low
levels of CO emissions.
The results for unburnt HC emissions can be seen in Figure 34. HC emissions were also
very low compared to the 1 PPM resolution, ranging between 0 and 2.8 PPM average for all cases.
With a few exceptions, HC emissions were lower in diesel-only operation than dual-fuel operation.
The author questioned the functionality of the HC emissions reading, however, Bottelberghe [33]
reports having performed a check with the exhaust gas analyzer on a 2-stroke engine to verify the
functionality of the instrument. Since the ACERT technology is advertised as being low emissions,
it is reasonable to expect very low HC emissions. In addition, the results are in the same range as
those reported by Bottelberghe.
0.00
2.00
4.00
6.00
8.00
10.00
12.00
0% 20% 40% 60% 80% 100%
CO
2 Em
issi
on
s (%
)
Load
CO2 Emissions
1300
1500
1800
2100
1300 w/H2
1500 w/H2
1800 w/H2
2100 w/H2
Figure 32. CO2 emissions for diesel-only and dual-fuel operation.

59
0.00
0.01
0.02
0.03
0.04
0.05
0.06
0.07
0.08
0% 20% 40% 60% 80% 100%
CO
Em
issi
on
s (%
)
Load
CO Emissions
1300
1500
1800
2100
1300 w/H2
1500 w/H2
1800 w/H2
2100 w/H2
Figure 33. CO emissions for diesel-only and dual-fuel operation.
0.00
0.50
1.00
1.50
2.00
2.50
3.00
0% 20% 40% 60% 80% 100%
HC
Em
issi
on
s (P
PM
)
Load
HC Emissions
1300
1500
1800
2100
1300 w/H2
1500 w/H2
1800 w/H2
2100 w/H2
Figure 34. HC emissions for diesel-only and dual-fuel operation.
60
It was previously discussed that unstable combustion was occurring for the 25% load
cases: cycle to cycle variations in the shape of the in-cylinder pressure curves were high. From the
emissions results it was observed that CO2 emissions at the 25% load cases were near zero. This
indicates one of two things: either diesel fuel was being injected but not burned, or diesel injection
was reduced to near zero. A further look at the emissions reveals that HCs did not increase during
dual-fuel combustion at 25% load. If diesel fuel had been injected but not burned, there would have
been a spike in HC emissions. Therefore, it seems likely that the supply of diesel fuel was
practically zero. In this case, the NOx emissions would be expected to increase from the high
temperatures of H2-only combustion. The results show that NOx emissions actually decreased in
these cases. One explanation for this is that the engine was operating in homogeneous charge
compression ignition (HCCI) mode. HCCI combustion is characterized by a lean, homogeneous
mixture of air and fuel in the combustion chamber which is auto-ignited by compression resulting in
near constant volume combustion. As discussed by Antunes et al. [49], this mode of combustion
with H2 can produce near-zero NOx emissions. This mode of combustion is difficult to obtain
because of the high autoignition temperature of H2. It is difficult to control the ignition timing in
HCCI operation which would produce unstable combustion.

61
CHAPTER 7. CONCLUSIONS
In this work a 6-cylinder, heavy-duty diesel engine was run near the knock limit in diesel-
hydrogen dual-fuel operation across a wide range of operating conditions. A number of
observations were made from the in-cylinder pressure trace and emissions measurements.
A maximum H2 substitution of 74% was achieved at 2100 rpm and 50% load. As load
increased, the percentage of H2 that could be supplemented decreased.
H2 addition increased the thermal efficiency of the engine at all operating points; up to a
32.4% increase over diesel-only operation.
Peak in-cylinder pressure increased by up to 40% during dual-fuel operation. As load
increased, the percent increase in peak in-cylinder pressure decreased.
In dual-fuel operation a large peak in the RPR occurred after TDC corresponding to the
combustion of H2. MRPR increased by up to 281%. Except for at 1300 rpm, the increase in
MRPR decreased as load increased.
Injection timing was advanced by up to 13.6° during dual-fuel operation. As the load
increased, the injection timing was advanced less until timing between dual-fuel and diesel-
only were approximately equal at the maximum load at each speed.
NOx emissions increased by up to 224% during dual-fuel operation. The increase in NOx
emissions decreased as load increased. Hydrogen addition increased the NO2/NOx ratio,
favoring high SCR efficiency.
CO2 reduction ranged between 10.2% and 47.6% during dual-fuel operation.
CO and HC emissions were largely unchanged during dual-fuel operation.
At 25% the engine was run on nearly 100% H2. NOx emissions were below diesel-only
levels and CO2 emissions were nearly 0, however, the combustion was unstable.
These observations show that a large percentage of H2 can be used to displace diesel fuel in a
compression ignition engine. Dual-fuel diesel-hydrogen operation, though not without challenges,
may provide a feasible means to reducing C02 emissions and mitigating global warming.
Future work in the NDSU engine test lab could include completion of the injection delay
circuit to investigate the possibility of extending the envelope of the knock limit by delaying injection

62
timing. Even more helpful to the investigation of the injection timing would be acquiring an unlocked
ECU. This would allow not only injection timing to be controlled, but a large number of other
parameters such as rail pressure, injection quantity, boost pressure, injection strategy, etc. A study
with an SCR system during dual-fuel operation would give insight into the possibility of meeting
emissions regulations during dual-fuel operation. Other work could include investigating the mode
of combustion observed at 25% load in this study.

63
REFERENCES
[1] J. Conti and P. Holtberg, "International Energy Outlook 2011," U.S. Energy Information
Administration, eia.gov, 2011.
[2] "Key World Energy Statistics," International Energy Agency, Paris, 2010.
[3] B. T. Fichman and R. Repice, "Annual Energy Review 2011," US Energy Information
Administration, eia.gov, 2012.
[4] P. McCaffrey, "The Hydrogen Revolution: Is It Feasible?," in U.S. National Debate Topic 2008-
2009: Alternative Energy, New York, The H.W. Wilson Company, 2008.
[5] L. Webster, "The Future of Diesel in the US: Analysis," Popular Mechanics, 10 September
2009. [Online]. Available: http://www.popularmechanics.com/cars/alternative-
fuel/diesel/4330313. [Accessed 28 May 2013].
[6] G. Schmidt, "Water Vapor: Forcing or Feedback?," RealClimate.org, 6 April 2005. [Online].
Available: http://www.realclimate.org/index.php?p=142. [Accessed 9 June 2013].
[7] I. Sample, "Heat: How We Got Here," The Guardian, 30 June 2005.
[8] McGee and Michael, "CO2 Now," Pro Oxygen, 2013. [Online]. Available: co2now.org.
[Accessed 12 June 2013].
[9] R. Di Silvestro, "The Proof Is in the Science," National Wildlife, April/May 2005.
[10] O. o. T. a. A. Quality, "Emission Standards Reference Guide," United Stated Environmental
Protection Agency, 14 November 2012. [Online]. Available:
http://www.epa.gov/otaq/standards/allstandards.htm. [Accessed 15 June 2013].
[11] D. &. Company, "Understanding Emissions Regulations," John Deere, 2013. [Online].
Available:
http://www.deere.com/wps/dcom/en_US/services_and_support/emissions_information/unders
tanding_emission_regulations/regulations.page?. [Accessed 16 June 2013].
[12] O. o. t. P. Secretary, "President Obama Announces Historic 54.5 mpg Fuel Efficiency
Standard," The White House, 29 July 2011. [Online]. Available:
http://www.whitehouse.gov/the-press-office/2011/07/29/president-obama-announces-historic-
545-mpg-fuel-efficiency-standard. [Accessed 16 June 2013].
[13] T. Miyamoto, H. Hasegawa, M. Mikami, N. Kojima, H. Kabashima and Y. Urata, "Effect of
Hydrogen Addition to Intake Gas on Combustion and Exhaust Emission Characteristics of a
Diesel Engine," International Journal of Hydrogen Energy, vol. 36, no. 20, pp. 13138-13149,
2011.
64
[14] N. Saravanan, G. Nagarajan, K. M. Kalaiselvan and C. Dhanasekaran, "An Experimental
Investigation on Hydrogen as a Dual Fuel for Diesel Engine System with Exhaust Gas
Recirculation Technique," Renewable Energy, vol. 33, no. 3, pp. 422-427, 2008.
[15] N. Saravanan, G. Nagarajan, G. Sanjay, C. Dhanasekaran and K. Kalaiselvan, "Combustion
Analysis on a DI Diesel Engine with Hydrogen in Dual Fuel Mode," Fuel, vol. 87, no. 17-18,
pp. 3591-3599, 2008.
[16] N. Saravanan and G. Nagarajan, "An Insight on Hydrogen Fuel Injection Techniques with SCR
System for NOx Reduction in a Hydrogen-Diesel Dual Fuel Engine," Internaltional Journal of
Hydrogen Engergy, vol. 34, no. 21, pp. 9019-9032, 2009.
[17] P. K. Bose and D. Maji, "An Experimental Investigation on Engine Performance and Emissions
of a Single Cylinder Diesel Engine Using Hydrogen as Inducted Fuel and Diesel as Injected
Fuel with Exhaust Gas Recirculation," International Journal of Hydrogen Engergy, vol. 34, no.
11, pp. 4847-4854, 2009.
[18] E. Tomita, N. P. Z. Kawahara and S. Fujita, "Hydrogen Combustion and Exhaust Emissions
Ignited with Diesel Oil in a Dual Fuel Engine," in International Fall Fuels and Lubricants
Meeting and Exposition, San Antonio, TX, 2001.
[19] S. Lambe and H. Watson, "Optimizing the Design of a Hydrogen Engine with Pilot Diesel Fuel
Ignition," International Journal of Vehicle Design, vol. 14, no. 4, pp. 370-389, 1993.
[20] G. K. Lilik, H. Zhang, J. M. Herreros, D. C. Haworth and A. L. Boehman, "Hydrogen Assisted
Diesel Combustion," Internation Journal of Hydrogen Energy, vol. 35, no. 9, pp. 4382-4398,
2010.
[21] M. M. Roy, E. Tomita, N. Kawahara, Y. Harada and A. Sakane, "An Experimental Investigation
on Engine Performance and Emissions of a Supercharged H2-Diesel Dual-Fuel Engine,"
International Journal of Hydrogen Energy, vol. 35, no. 2, pp. 844-853, 2010.
[22] M. Y. Selim, "Sensitivity of Dual Fuel Engine Combustion and Knocking Limits to Gaseous
Fuel Composition," Energy Conversion and Management, vol. 45, no. 3, pp. 411-425, 2004.
[23] College of the Desert, "Hydrogen Fuel Cell Engines and Related Technologies Course
Manual," December 2001. [Online]. Available:
http://www1.eere.energy.gov/hydrogenandfuelcells/tech_validation/h2_manual.html.
[Accessed 29 October 2011].
[24] S. Verhelst and T. Wallner, "Hydrogen-Fueled Internal Combustion Engines," Progress in
Energy and Combustion Science, vol. 35, pp. 490-527, 2009.
[25] S. Szwaja and K. Grab-Rogalinski, "Hydrogen Combustion in a Compression Ignition Diesel
Engine," Internation Journal of Hydrogen Engergy, vol. 34, no. 10, pp. 4413-4421, 2009.
[26] J. Gomes Antunes, R. Mikalsen and A. Roskilly, "An Experimental Study of a Direct Injection
Compression Ignition Hydrogen Engine," International Journal of Hydrogen Energy, vol. 34,

65
no. 15, pp. 6516-6522, 2009.
[27] A. Boretti, "Advantages of the Direct Injection of Both Diesel and Hydrogen in a Dual Fuel
H2ICE," International Journal of Hydrogen Energy, vol. 36, no. 15, pp. 9312-9317, 2011.
[28] A. Boretti, "Advances in Hydrogen Compression Ignition Internal Combustion Engines,"
International Journal of Hydrogen Energy, vol. 36, no. 19, pp. 12601-12606, 2011.
[29] M. K. Heiman and B. D. Solomon, "Fueling U.S. Transportation: The Hydrogen Economy and
Its Alternatives," Environment, October 2007.
[30] J. Ogden and D. Sperling, "The Hope for Hydrogen," Issues in Science and Techonology,
Spring 2004.
[31] W. W. Pulkrabek, Engineering Fundamentals of the Internal Combustion Engine, New Jersey:
Prentice Hall, 1997.
[32] B. D. Hsu, Practical Diesel-Engine Combustion Analysis, Warrendale, PA: Society of
Automotive Engineers, 2002.
[33] K. J. Bottelberghe, Performance Analysis of an Advanced Emission Reduction Technology
Engine During Diesel-Hydrogen Dual-Fuel Operation, North Dakota State University: Thesis,
2011.
[34] D. Lata and A. Misra, "Analysis of Ignition Delay Period of a Dual Fuel Diesel Engine with
Hydrogen and LPG as Secondary Fuels," International Journal of Hydrogen Energy, vol. 36,
no. 5, pp. 3746-3756, 2011.
[35] J. Naber and D. Siebers, "Hydrogen Combustion Under Diesel Engine Conditions,"
International Journal of Hydrogen Energy, vol. 23, no. 5, pp. 363-371, 1998.
[36] D. B. Lata, A. Misra and S. Medhekar, "Investigations on the Combustion Parameters of a
Dual Fuel Diesel Engine with Hydrogen and LPG as Secondary Fuels," International Journal
of Hydrogen Engergy, vol. 36, no. 21, pp. 13808-13819, 2011.
[37] D. Lata and A. Misra, "Theoretical and Experimental Investigations on the Performance of
Dual Fuel Diesel Engine with Hydrogen and LPG as Secondary Fuels," International Journal
of Hydrogen Energy, vol. 35, no. 21, pp. 11918-11931, 2010.
[38] T. Gatts, H. Li, C. Liew, S. Liu, T. Spencer, S. Wayne and N. Clark, "An Experimental
Investigation of H2 Emissions of a 2004 Heavy-Duty Diesel Engine Supplemented with H2,"
International Journal of Hydrogen Energy, vol. 35, no. 20, pp. 11349-11356, 2010.
[39] J. Kubesh and D. D. Brehob, "Analysis of Knock in a Dual-Fuel Engine," SAE Technical
Paper, no. 922367, 1992.
[40] Z. Liu and G. A. Karim, "Knock Characteristics of Dual-Fuel Engine Fuelled with Hydrogen
Fuel," International Association for Hydrogen Energy, vol. 20, no. 11, pp. 919-924, 1995.
66
[41] M. M. Roy, E. Tomita, N. Kawahara, Y. Harada and A. Sakane, "Comparison of Performance
and Emissions of a Supercharged Dual-Fuel Engine Fueled by Hydrogen and Hydrogen-
Containing Gaseous Fuels," International Journal of Hydrogen Energy, vol. 36, no. 12, pp.
7339-7352, 2011.
[42] M. Ettefagh, M. Sadeghi, V. Pirouzpanah and H. Arjmandi Tas, "Knock Detection in Spark
Ignition Engines by Vibration Analysis of Cylinder Block: A Parametric Modeling Approach,"
Mechanical Systems and Signal Processing, vol. 22, no. 6, pp. 1495-1514, 2008.
[43] K. Burgdorf and I. Denbratt, "Comparison of Cylinder Pressure Based Knock Detection
Methods," SAE Techinical Paper, no. 972932, 1997.
[44] S. Szwaja, K. R. Bhandary and a. J. D. Naber, "Comparisons of Hydrogen and Gasoline
Combustion Knock in a Spark Ignition Engine," International Journal of Hydrogen Energy, vol.
32, no. 18, pp. 5076-5087, 2007.
[45] N. Saravanan and G. Nagarajan, "Performance and Emissions Study in Manifold Hydrogen
Injection with Diesel as an Ignition Source for Different Start of Injection," Renewable Energy,
vol. 34, no. 1, pp. 328-334, 2009.
[46] H. Mathur, L. Das and T. N. Patro, "Hydrogen-Fuelled Diesel Engine: Performance
Improvement Through Charge Dilution Techniques," International Journal of Hydrogen
Energy, vol. 18, no. 5, pp. 421-431, 1993.
[47] S. Liu, H. Li, C. Liew, T. Gatts, S. Wayne, B. Shade and N. Clark, "An Experimental
Investigation of NO2 Emission Characteristics of a Heavy-Duty H2-Diesel Dual Fuel Engine,"
International Journal of Hydrogen Energy, vol. 36, no. 18, pp. 12015-12024, 2011.
[48] J. Chong, A. Tsolakis, S. Gill, K. Theinnoi and S. Golunski, "Enhancing the NO2/NOx Ratio in
Compression Ignition Engines by Hydrogen and Reformate Combustion, for Improved
Aftertreatment Performance," International Journal of Hydrogen Energy, vol. 35, no. 16, pp.
8723-8732, 2010.
[49] J. Gomez Antunes, R. Mikalsen and A. Roskilly, "An Investigation of Hydrogen-Fuelled HCCI
Engine Performance and Operation," International Journal of Hydrogen Energy, vol. 33, no.
20, pp. 5823-5828, 2008.

67
APPENDIX A. SAMPLE SPREADSHEETS
Figure A1. Partial sample of output file from LabVIEW with calculations.
LabVIEW Measurement
H2 Rate
[SCFM]
Fuel Rate
[gal/h]
Pulse dt
[ms]
Exhaust
Manifold
[F]
Air Flow
[CFM]
Power
EnginePower H2
Power
Diesel% H2 Therm Eff
Writer_Version 2
Speed
[RPM]
Torque
[ft-lb]
Speed
[Deg/s]Deg/sample 24 1.9237 0.6151 692.9 291.0 300776 386592 250082 0.607 0.472
Reader_Version 2 2118.5 293.0 12711.0 7.63E-01 1.04786
Separator Tab
Decimal_Separator. Cycle Time Tvalue Pvalue Cell Begin End
Multi_HeadingsNo 1 0.049802 -0.05739 1211.050417 854 655 1054 57.266 7.627 1527.281 10.678 1500.642 9.915 -14.492 -6.865
X_ColumnsOne 2 0.106385 0.085226 1211.050417 1797 1598 1997 62.386 7.627 1530.795 9.152 1511.662 10.678 -14.492 -6.865
Time_PrefAbsolute 3 0.162967 0.045177 1218.077762 2740 2541 2940 68.191 6.864 1504.442 10.678 1506.962 9.915 -14.492 -6.865
Operator lee.kersting 4 0.219609 0.125763 1198.752649 3684 3485 3884 55.372 7.627 1478.090 9.915 1468.998 10.678 -14.492 -6.865
DescriptionData from the LabVIEW VI5 0.276431 0.013919 1196.995727 4631 4432 4831 61.701 8.390 1481.603 9.915 1476.629 10.678 -14.492 -6.102
Date 7/12/12 6 0.333194 -0.12479 1225.105106 5577 5378 5777 62.544 6.864 1529.038 9.152 1505.336 9.915 -14.492 -6.865
Time 12:12.7 7 0.389836 0.032479 1198.752649 6521 6322 6721 72.336 7.627 1557.147 9.152 1533.772 9.915 -14.492 -6.102
***End_of_Header*** 8 0.446478 -0.1072 1204.023072 7465 7266 7665 68.435 6.864 1513.226 10.678 1511.165 9.915 -14.492 -6.865
1207.975975 Average 63.529 7.436 1515.203 9.915 1501.896 10.201 -14.492 -6.674
Channels 7 Stdev 5.791 0.539 26.634 0.706 20.553 0.395 0.000 0.353
Samples 83 83 83 83 83 83 83 d(Ave.)/dCAD 60.527 6.865
Date 7/12/12 7/12/12 7/12/12 7/12/12 7/12/12 7/12/12 7/12/12 %O2 %CO %CO2 ppm HC ppm NO ppm NO2
Time 12:12.7 12:12.7 12:12.7 12:12.7 12:12.7 12:12.7 12:12.7 12.7 0.03 4.1 2 319 329
X_DimensionTime Time Time Time Time Time Time
X0 0.00E+00 0.00E+00 0.00E+00 0.00E+00 0.00E+00 0.00E+00 0.00E+00 Flags 0
Delta_X 6.00E-05 6.00E-05 6.00E-05 6.00E-05 6.00E-05 6.00E-05 6.00E-05
Time (s)
Raw
Pressure
Sensor (V)
TDC Sensor
(V)
Injector
Pulse (V)
Raw
Pressure
Reading
(psi)
High
Frequency
Pressure
Component
(psi)
Filtered Raw
Pressure Reading
(psi)
Rate or
Pressure Rise
(psi/deg)
Adjusted
Rate of
Pressure
Rise
(psi/deg)
X_Value Dev0/Ai0 Dev0/Ai1 Dev0/Ai2 Dev0/Ai0
(Formula
Result)
Dev0/Ai0
(Filtered)
Dev0/Ai0
(Filtered) 1
Dev0/Ai0
(Formula
Result) 1
Rate of
Pressure
Rise
0 0.60928 -0.00122 1.361416 104.2436 -1.80159 108.994588 -2.19087 -2.17173
6.00E-05 0.604396 -0.00122 1.363858 100.7299 1.421379 107.706462 -1.703803 -1.68892
0.00012 0.601954 -0.00122 1.363858 98.97311 0.732406 106.421166 -1.700059 -1.68521
0.00018 0.601954 -0.00122 1.363858 98.97311 -0.83111 104.808316 -2.133314 -2.11468
0.00024 0.604396 0.000733 1.363858 100.7299 -0.41191 102.847128 -2.594061 -2.5714
0.0003 0.59707 -0.00073 1.363858 95.45944 -0.5894 100.886043 -2.593924 -2.57127
0.00036 0.599512 0.000733 1.361416 97.21628 2.498555 99.29439 -2.105276 -2.08689
0.00042 0.589744 0.001221 1.363858 90.18893 -2.49232 98.104551 -1.573799 -1.56005
0.00048 0.594628 0.001709 1.361416 93.7026 2.100569 97.025004 -1.427915 -1.41544
0.00054 0.594628 0.000733 1.363858 93.7026 -1.89711 95.783039 -1.642745 -1.62839
0.0006 0.58486 0.001221 1.356532 86.67526 -0.33991 94.396299 -1.834239 -1.81822
0.00066 0.582418 0.001221 1.361416 84.91842 2.678632 92.951543 -1.910977 -1.89428
0.00072 0.587302 -0.00024 1.358974 88.4321 -0.82187 91.340687 -2.130676 -2.11206
0.00078 0.58486 -0.00024 1.358974 86.67526 -2.54806 89.545542 -2.374437 -2.3537
0.00084 0.582418 -0.00073 1.361416 84.91842 1.783121 87.87177 -2.213894 -2.19455
0.0009 0.57265 -0.00024 1.361416 77.89108 0.340211 86.569724 -1.722215 -1.70717
0.00096 0.579976 -0.00024 1.361416 83.16159 1.531626 85.463951 -1.462604 -1.44983
0.00102 0.57265 -0.00024 1.361416 77.89108 -4.1194 84.210501 -1.657935 -1.64345
0.00108 0.577534 -0.00073 1.358974 81.40475 3.061803 82.740236 -1.944718 -1.92773
0.00114 0.570208 -0.00024 1.361416 76.13424 -1.36591 81.265105 -1.951154 -1.93411
0.0012 0.570208 -0.00073 1.358974 76.13424 1.473463 79.975278 -1.706053 -1.69115
0.00126 0.562882 -0.00122 1.361416 70.86373 -1.53482 78.81414 -1.535835 -1.52242
0.00132 0.570208 -0.00122 1.361416 76.13424 1.733827 77.553082 -1.668 -1.65343
0.00138 0.570208 -0.00024 1.3663 76.13424 -2.25995 76.152599 -1.852416 -1.83623
0.00144 0.565324 -0.00024 1.363858 72.62057 0.581608 74.930465 -1.616516 -1.6024
0.0015 0.56044 -0.00024 1.3663 69.1069 1.478156 74.156979 -1.023088 -1.01415
0.00156 0.562882 0.000733 1.361416 70.86373 0.024536 73.643135 -0.679661 -0.67372
0.00162 0.567766 0.000244 1.351648 74.37741 -1.59963 73.02407 -0.818837 -0.81168
0.00168 0.562882 0.000244 1.339438 70.86373 -0.78396 72.289447 -0.971685 -0.9632
0.00174 0.565324 0.001221 1.336996 72.62057 2.882454 71.734292 -0.734302 -0.72789
0.0018 0.553114 0.000733 1.34188 63.83639 -2.20416 71.470758 -0.348576 -0.34553
0.00186 0.557998 0.000733 1.346764 67.35006 2.344645 71.178191 -0.386978 -0.3836
0.00192 0.557998 -0.00024 1.351648 67.35006 -2.5454 70.413383 -1.011609 -1.00277
0.00198 0.56044 0.002198 1.351648 69.1069 0.561429 69.158562 -1.65975 -1.64525
0.00204 0.553114 0.001709 1.356532 63.83639 -0.03261 67.865275 -1.71063 -1.69569
0.0021 0.550672 0.001709 1.356532 62.07955 1.645783 66.889025 -1.291285 -1.28001
0.00216 0.555556 0.004151 1.35409 65.59322 -0.5962 66.139516 -0.991374 -0.98271
0.00222 0.553114 0.006593 1.349206 63.83639 -2.22413 65.398969 -0.979521 -0.97096
0.00228 0.550672 0.010012 1.336996 62.07955 1.682722 64.668934 -0.965616 -0.95718
0.00234 0.555556 0.015873 1.297924 65.59322 1.311272 64.063919 -0.800253 -0.79326
0.0024 0.550672 0.020757 1.249084 62.07955 -2.55599 63.657117 -0.538076 -0.53338
0.00246 0.550672 0.023687 1.20757 62.07955 1.477128 63.44878 -0.275567 -0.27316
0.00252 0.550672 0.026618 1.173382 62.07955 0.011063 63.315692 -0.176035 -0.1745
0.00258 0.538462 0.023199 1.153846 53.29537 -1.39564 63.015867 -0.396578 -0.39311
0.00264 0.540904 0.015385 1.14652 55.05221 2.859678 62.20847 -1.067943 -1.05861
0.0027 0.550672 0.003175 1.141636 62.07955 -1.5056 60.685559 -2.014353 -1.99676
0.00276 0.543346 -0.00806 1.124542 56.80904 -3.00021 58.820402 -2.467039 -2.44549
0.00282 0.543346 -0.01783 1.151404 56.80904 4.1295 57.384768 -1.898912 -1.88232
0.00288 0.543346 -0.0232 1.178266 56.80904 -0.40339 56.778302 -0.802171 -0.79516
0.00294 0.538462 -0.02271 1.173382 53.29537 -1.98638 56.764672 -0.018029 -0.01787
0.003 0.543346 -0.02076 1.15873 56.80904 1.573355 56.835068 0.093112 0.092299
0.00306 0.538462 -0.01685 1.156288 53.29537 -1.47641 56.624924 -0.277956 -0.27553
0.00312 0.540904 -0.01294 1.14652 55.05221 1.73607 56.087036 -0.711464 -0.70525
0.00318 0.53602 -0.00904 1.136752 51.53854 -1.34015 55.366505 -0.953046 -0.94472
0.00324 0.528694 -0.00659 1.139194 46.26803 0.350651 54.535268 -1.099475 -1.08987
0.0033 0.53602 -0.00611 1.131868 51.53854 1.733999 53.468853 -1.410546 -1.39822
0.00336 0.538462 -0.00171 1.136752 53.29537 -2.77934 52.134499 -1.764947 -1.74953
0.00342 0.53602 -0.0022 1.13431 51.53854 0.239978 50.919488 -1.607094 -1.59306
0.00348 0.533578 -0.00171 1.1221 49.7817 1.833836 50.319948 -0.79301 -0.78608
0.00354 0.53602 -0.00122 1.126984 51.53854 0.044886 50.394677 0.098844 0.097981
0.0036 0.533578 -0.00073 1.126984 49.7817 -1.96063 50.783018 0.513658 0.509171
0.00366 0.528694 -0.00122 1.141636 46.26803 0.661556 51.053429 0.357673 0.354549
SAE J1349
Correction
Factor
0.462759
Filtered Pressure
Pilot Deg
ATDC
Main Deg
ATDC
Minimum Pressure
Raw Pressure Max Rate
Press Rise
Raw Pressure Filtered Pressure
Peak
Pressure PP Timing
Peak
Pressure
PP
Timing
Max Rate
Timing

68
Figure A2. Partial sample of DYNOmite output data spreadsheet with calculations.
Board
Time
Absorber
RPM-C
Fuel Flow
[gal/h]
EGT #5
Comp In
[F]
Torque
[ft-lb]
Barometer
[psi]Pressure
Humidity
[%]
EGT #1
Exh Man
[F]
EGT #2 Exh
Elbow [F]
EGT #4
Comp
Out [F]
EGT #8
Coolant In
[F]
Air
Temp. [F]
Supply
Volts
Air Flow
[CFM]
Water
Vapor
[psi]
Dry Air
[psi]
Average 2118.506 1.92370389 61.30311 279.5938 14.48256 0.348182 55.58485 692.9163 564.79105 198.0695 139.1963 95 13.2988 290.9991 0.8165 14.028709
1339.939 2122 1.840107 61.83801 267.6852 14.482853 0.349432 56.17762 682.7986 553.49527 214.4899 139.37647 95 13.3 289.7631 Temp [F] Press [psi]
1340.442 2122 1.675381 62.36654 272.9039 14.482366 0.347906 56.17609 689.4518 560.77033 213.8992 145.34575 95 13.3 289.112 60 0.2563
1340.946 2119 1.731629 61.77583 273.6875 14.482853 0.349432 56.19593 681.3063 552.71802 212.1271 137.54216 95 13.3 288.6896 62 0.2751
1341.449 2127 1.767788 60.90531 269.5859 14.482853 0.347906 56.21424 672.6322 544.32372 210.2617 129.11677 95 13.3 289.4639 64 0.2952
1341.953 2127 1.65931 61.49602 267.1183 14.482853 0.34638 56.24018 679.3165 551.35006 209.7953 135.33477 95 13.3 288.8832 66 0.3165
1342.457 2122 1.595027 61.90019 272.7705 14.483097 0.347906 56.25849 685.006 557.81678 209.3912 140.74443 95 13.3 287.3869 68 0.3391
1342.961 2122 1.687434 61.90019 273.1206 14.48261 0.349432 56.26154 684.7573 557.7546 208.3341 140.68225 95 13.3 287.5101 70 0.3632
1343.465 2120 1.775823 61.62038 273.4707 14.482853 0.347906 56.26459 682.8608 555.8892 207.3703 138.19505 95 13.3 288.144 72 0.3887
1343.967 2125 1.731629 61.99346 271.5867 14.483097 0.347906 56.25544 685.8765 559.3091 206.7796 140.93097 95 13.3 288.6896 74 0.4158
1344.471 2122 1.7477 62.36654 273.8209 14.48261 0.347906 56.24476 691.1929 564.9053 206.2511 145.87428 95 13.3 288.6544 76 0.4446
1344.975 2123 1.771806 61.83801 273.2707 14.482853 0.347906 56.2829 684.2909 558.15877 205.194 139.03448 95 13.2 288.3024 78 0.475
1345.477 2122 1.731629 61.80692 271.7701 14.483097 0.347906 56.29664 685.9387 560.05526 204.6344 140.37135 95 13.3 287.9151 80 0.5073
1345.981 2120 1.71154 61.83801 268.3688 14.482853 0.347906 56.26612 684.9749 559.3091 203.9504 139.74955 95 13.3 288.0735 82 0.5414
1346.485 2123 1.687434 62.05564 271.0031 14.483097 0.347906 56.22034 688.3015 562.60464 203.5462 142.82746 95 13.3 287.739 84 0.5776
1346.989 2122 1.651275 61.93128 271.4033 14.483097 0.347906 56.16999 686.6848 561.42322 202.8933 141.61495 95 13.3 286.6648 86 0.6158
1347.493 2123 1.675381 61.74474 271.9202 14.483341 0.347906 56.11963 684.2909 559.3091 202.2094 139.09666 95 13.3 286.4886 88 0.6562
1347.997 2116 1.683416 62.02455 272.1536 14.483584 0.347906 56.08606 687.1512 562.26265 201.8985 142.20566 95 13.3 286.4005 90 0.6988
1348.501 2117 1.727611 62.05564 276.5219 14.48261 0.347906 56.0586 688.2393 563.44407 201.4321 142.98291 95 13.3 286.929 92 0.7439
1349.005 2113 1.824036 62.05564 277.6056 14.482366 0.349432 56.04639 689.1099 564.15914 201.1523 143.6358 95 13.3 288.1087 94 0.7914
1349.509 2119 1.86823 61.46493 282.5409 14.482853 0.347906 56.02808 682.1146 556.88408 200.1574 136.39183 95 13.3 289.0768 96 0.8416
1350.01 2110 1.968673 61.96237 280.9069 14.482853 0.347906 55.97925 689.3586 563.75497 200.1574 142.23675 95 13.3 289.9214 98 0.8945
1350.514 2112 2.093222 61.90019 283.6413 14.48261 0.347906 55.90295 691.6281 565.5271 200.0331 143.13836 95 13.3 291.2756 100 0.9503
1351.016 2122 2.121346 62.08673 286.9592 14.48261 0.349432 55.84497 695.1102 568.6361 199.9398 145.12812 95 13.3 292.5062
1351.52 2117 1.984744 61.90019 282.3408 14.482853 0.347906 55.81598 695.2968 567.98321 199.5978 143.88452 95 13.3 292.5413
1352.022 2120 1.984744 61.46493 283.4745 14.482122 0.347906 55.79004 691.4727 563.94151 198.9449 139.34538 95 13.3 292.2601
1352.523 2112 1.988762 61.80692 281.2904 14.48261 0.347906 55.78088 696.5715 568.51174 199.1625 143.26272 95 13.3 292.2601
1353.025 2112 2.016885 61.74474 280.7735 14.48261 0.347906 55.77325 697.5663 569.32008 199.0693 143.54253 95 13.3 291.9789
1353.529 2123 2.036974 61.40275 282.4575 14.482853 0.349432 55.76562 693.4625 564.87421 198.3853 138.87903 95 13.3 292.5413
1354.033 2123 1.928496 61.30948 280.6401 14.48261 0.347906 55.74579 695.7631 566.95724 198.292 140.34026 95 13.3 292.5765
1354.537 2122 1.912425 60.96749 280.8402 14.482853 0.347906 55.73816 691.9701 562.91554 197.9189 136.67164 95 13.3 292.1898
1355.037 2122 1.964655 61.68256 281.7072 14.482853 0.347906 55.70611 699.7737 570.87458 198.2298 143.54253 95 13.3 291.8207
1355.54 2114 1.924478 61.06076 279.8398 14.48261 0.347906 55.67865 691.6281 562.63573 197.4526 136.11202 95 13.3 291.1174
1356.042 2122 1.928496 61.43384 281.107 14.48261 0.347906 55.63134 696.4471 567.64122 197.7324 140.5268 95 13.3 291.3284
1356.546 2123 1.948585 61.37166 280.8402 14.48261 0.349432 55.58099 696.8824 567.88994 197.6391 140.77552 95 13.3 291.68
1357.05 2122 1.880284 61.52711 279.2063 14.483097 0.347906 55.53521 698.2192 569.5688 197.7635 142.45438 95 13.3 291.5218
1357.554 2121 1.828054 61.30948 278.0558 14.482853 0.349432 55.51232 693.4625 564.93639 197.1106 138.10178 95 13.3 290.8184
1358.058 2122 1.811983 60.43896 277.0888 14.482366 0.347906 55.49096 684.9749 556.8219 196.1157 130.578 95 13.3 290.1501
1358.561 2122 1.783859 60.87422 277.0221 14.482122 0.349432 55.4818 689.3897 561.42322 196.3334 135.17932 95 13.3 289.9214
1359.065 2119 1.811983 61.12294 278.6227 14.48261 0.347906 55.48943 691.4727 563.75497 196.3955 137.44889 95 13.3 289.7631
1359.567 2113 1.832071 61.09185 279.3063 14.48261 0.347906 55.49096 690.0115 562.26265 196.0846 136.29856 95 13.3 290.0797
1360.071 2114 1.924478 61.27839 279.5731 14.482366 0.347906 55.48943 692.8096 565.43383 196.2401 139.18993 95 13.3 290.6602
1360.575 2113 1.988762 60.87422 279.2729 14.481878 0.347906 55.49706 690.5711 562.97772 195.6805 136.70273 95 13.3 291.4691
1361.079 2123 1.940549 61.34057 281.2404 14.48261 0.347906 55.50469 694.3019 566.67743 195.9603 140.18481 95 13.3 292.0668
1361.581 2116 1.86823 61.02967 280.4734 14.482853 0.349432 55.48486 690.8509 563.25753 195.6183 136.88927 95 13.3 291.3636
1362.085 2115 1.928496 61.15403 278.2559 14.48261 0.347906 55.45281 692.0634 564.2835 195.525 137.69761 95 13.3 291.0822
1362.588 2125 1.984744 61.09185 279.1896 14.48261 0.347906 55.38567 693.2759 565.46492 195.4939 138.63031 95 13.3 291.5921
1363.092 2123 1.932514 61.18512 279.5564 14.48261 0.347906 55.29564 693.0583 565.15402 195.3074 138.25723 95 13.3 291.7855
1363.596 2121 1.86823 61.30948 279.7231 14.482366 0.347906 55.23156 695.3279 567.33032 195.3696 140.5268 95 13.3 291.2053
1364.1 2121 1.856177 60.99858 280.4234 14.482853 0.347906 55.16899 692.9961 565.30947 195.183 138.22614 95 13.3 290.5722
1364.604 2117 1.848142 61.09185 279.0729 14.48261 0.347906 55.11711 692.4365 564.68767 194.9032 138.19505 95 13.3 290.1501
1365.108 2113 1.888319 61.15403 278.3059 14.482366 0.349432 55.10491 692.8407 565.30947 194.9343 138.87903 95 13.3 290.7305
1365.61 2123 1.892337 61.09185 280.7735 14.482366 0.347906 55.10948 691.939 564.47004 194.6856 137.79088 95 13.3 291.4339
1366.114 2120 1.856177 61.37166 279.4063 14.482122 0.347906 55.11559 695.3589 567.92103 194.8099 141.21078 95 13.3 291.1701
1366.616 2122 1.880284 60.96749 280.7402 14.48261 0.347906 55.12627 690.9131 563.78606 194.4058 137.23126 95 13.3 291.1174
1367.12 2113 1.900372 60.53223 280.3067 14.482366 0.347906 55.14 685.5656 558.31422 193.8462 132.31904 95 13.3 291.1174
1367.622 2113 1.960638 60.68768 280.4567 14.48261 0.349432 55.16594 687.3688 560.02417 193.8151 133.62482 95 13.3 291.4339
1368.126 2111 2.036974 60.99858 281.3237 14.48261 0.347906 55.19951 690.5089 562.729 194.0949 136.08093 95 13.3 291.557
1368.63 2116 2.06108 60.59441 281.5738 14.482122 0.347906 55.22087 688.83 560.89469 193.6907 133.81136 95 13.3 292.348
1369.131 2116 1.972691 61.06076 283.0577 14.482366 0.347906 55.2224 694.9237 566.73961 194.1881 138.72358 95 13.3 292.6995
1369.635 2121 1.980726 60.90531 282.1741 14.482853 0.347906 55.21019 694.0221 565.49601 194.0016 137.51107 95 13.3 292.5062
1370.139 2115 2.024921 60.34569 281.924 14.48261 0.349432 55.17968 687.7419 558.93602 193.3798 131.54179 95 13.3 292.1898
1370.641 2122 2.065098 60.87422 283.5579 14.482366 0.347906 55.19341 693.8666 565.18511 193.7529 136.60946 95 13.3 292.0668
1371.145 2123 1.972691 60.90531 282.841 14.482366 0.34638 55.23003 694.8615 566.1489 193.8772 137.85306 95 13.3 292.5413
1371.649 2116 1.95662 61.37166 281.1403 14.481878 0.347906 55.30633 700.209 571.37202 194.3125 142.51656 95 13.3 292.2953
1372.149 2114 2.053045 60.90531 282.9577 14.482122 0.347906 55.38109 695.8564 566.80179 193.7218 138.16396 95 13.3 292.225
1372.652 2122 2.032956 60.9364 284.3082 14.482366 0.347906 55.45281 698.0949 569.04027 193.8772 139.56301 95 13.3 292.6116
1373.156 2113 1.968673 60.96749 283.4412 14.48261 0.347906 55.49096 696.2606 567.01942 193.7218 137.82197 95 13.3 292.2601
1373.66 2111 2.073133 61.15403 283.5746 14.482366 0.347906 55.51843 699.3385 569.78643 193.8151 140.15372 95 13.3 292.348
1374.164 2119 2.105275 60.99858 286.9926 14.482366 0.347906 55.51995 698.499 569.00918 193.5974 139.00339 95 13.3 292.5413
1374.666 2109 2.036974 60.99858 285.0085 14.482366 0.349432 55.50317 699.4317 569.81752 193.7218 139.34538 95 13.3 292.1371
1375.17 2121 2.133399 61.06076 285.8588 14.482366 0.347906 55.45281 699.4006 569.72425 193.5974 139.34538 95 13.3 293.2442
1375.674 2115 2.137416 61.30948 285.0418 14.482122 0.349432 55.39788 703.6911 573.79704 193.9083 142.7031 95 13.3 293.2969
1376.178 2114 2.173576 61.40275 285.7254 14.48261 0.347906 55.3048 705.3388 575.22718 193.9705 143.76016 95 13.3 293.4024
1376.682 2117 2.129381 61.02967 284.4583 14.482122 0.347906 55.23156 702.0744 571.80728 193.6285 140.06045 95 13.3 293.6132
1377.186 2122 2.081169 60.74986 285.0251 14.482366 0.349432 55.1812 699.525 568.947 193.3798 137.1069 95 13.3 293.5605
1377.69 2114 2.077151 60.47005 283.7246 14.482122 0.349432 55.14305 696.8824 566.27326 193.0378 134.65079 95 13.3 293.0509
1378.194 2116 2.125363 61.12294 283.8414 14.482122 0.347906 55.11254 706.085 575.41372 193.8772 142.85855 95 13.3 293.0861
1378.698 2113 2.081169 61.18512 284.8751 14.48261 0.347906 55.06981 706.8933 575.66244 193.8151 142.54765 95 13.3 292.6644
1379.202 2116 2.169558 60.6255 285.2586 14.482122 0.347906 55.04692 700.7375 569.59989 193.2244 136.42292 95 13.3 293.2442
1379.706 2116 2.081169 60.96749 283.808 14.482366 0.347906 55.04082 705.0901 573.73486 193.442 140.34026 95 13.3 293.2442
1380.21 2115 2.069116 61.34057 282.6909 14.482122 0.347906 55.00572 709.6914 578.64708 193.8772 144.94158 95 13.3 292.7698
1380.714 2115 2.14947 60.6255 283.2245 14.481391 0.347906 54.98131 702.9138 571.65183 193.2244 137.94633 95 13.3 292.8928
1381.217 2123 2.105275 60.65659 283.6746 14.482122 0.347906 54.95689 702.8516 571.62074 193.1311 137.85306 95 13.3 293.3321

69
Figure A3. Partial sample of pressure curve averaging spreadsheet.
.
Deg Time 1 2 3 4 5 6 7 8 Average Stdev %
-16.7792 -1.32E-03 25.18597 23.42914 23.42914 19.91546 21.6723 21.6723 23.42914 25.18597 22.98993 1.818498 7.90998
-16.0165 -1.26E-03 21.6723 23.42914 23.42914 21.6723 19.91546 26.94283 25.18597 19.91546 22.77032 2.47343 10.86252
-15.2539 -1.20E-03 23.42914 21.6723 23.42914 21.6723 25.18597 23.42914 23.42914 25.18597 23.42913 1.328044 5.668342
-14.4912 -1.14E-03 21.6723 23.42914 23.42914 21.6723 23.42914 21.6723 23.42914 25.18597 22.98993 1.242271 5.403546
-13.7285 -1.08E-03 26.94283 26.94283 26.94283 21.6723 23.42914 28.69967 25.18597 25.18597 25.62519 2.251817 8.787512
-12.9658 -1.02E-03 25.18597 23.42914 23.42914 19.91546 23.42914 23.42914 25.18597 23.42914 23.42913 1.626514 6.942273
-12.2031 -9.60E-04 23.42914 21.6723 23.42914 18.15863 25.18597 26.94283 23.42914 23.42914 23.20953 2.561011 11.03431
-11.4404 -9.00E-04 23.42914 21.6723 18.15863 26.94283 21.6723 23.42914 26.94283 25.18597 23.42914 2.969602 12.67482
-10.6777 -8.40E-04 23.42914 21.6723 25.18597 21.6723 26.94283 26.94283 25.18597 19.91546 23.86835 2.614263 10.95284
-9.915 -7.80E-04 25.18597 21.6723 19.91546 23.42914 25.18597 23.42914 25.18597 23.42914 23.42913 1.878137 8.016246
-9.15231 -7.20E-04 23.42914 23.42914 21.6723 19.91546 25.18597 26.94283 21.6723 19.91546 22.77032 2.47343 10.86252
-8.38962 -6.60E-04 28.69967 23.42914 19.91546 19.91546 23.42914 28.69967 25.18597 28.69967 24.74677 3.726822 15.05983
-7.62693 -6.00E-04 21.6723 23.42914 21.6723 28.69967 28.69967 21.6723 26.94283 25.18597 24.74677 3.078952 12.44183
-6.86423 -5.40E-04 21.6723 25.18597 25.18597 26.94283 16.40179 23.42914 21.6723 23.42914 22.98993 3.218968 14.00165
-6.10154 -4.80E-04 23.42914 19.91546 16.40179 19.91546 28.69967 23.42914 23.42914 25.18597 22.55072 3.756279 16.65702
-5.33885 -4.20E-04 23.42914 30.4565 21.6723 23.42914 16.40179 26.94283 23.42914 23.42914 23.64874 4.032265 17.05065
-4.57616 -3.60E-04 19.91546 23.42914 25.18597 23.42914 25.18597 25.18597 28.69967 25.18597 24.52716 2.47343 10.08445
-3.81346 -3.00E-04 26.94283 26.94283 26.94283 23.42914 21.6723 25.18597 25.18597 26.94283 25.40559 1.978192 7.786446
-3.05077 -2.40E-04 21.6723 16.40179 23.42914 19.91546 25.18597 25.18597 25.18597 23.42914 22.55072 3.114538 13.81126
-2.28808 -1.80E-04 23.42914 26.94283 19.91546 25.18597 21.6723 23.42914 23.42914 23.42914 23.42914 2.099826 8.962456
-1.52539 -1.20E-04 21.6723 23.42914 25.18597 23.42914 21.6723 23.42914 26.94283 25.18597 23.86835 1.818503 7.618892
-0.76269 -6.00E-05 28.69967 25.18597 23.42914 25.18597 23.42914 25.18597 23.42914 26.94283 25.18598 1.878145 7.457108
0 0 25.18597 26.94283 23.42914 26.94283 23.42914 21.6723 28.69967 26.94283 25.40559 2.382636 9.378394
0.762693 6.00E-05 25.18597 19.91546 23.42914 25.18597 25.18597 26.94283 26.94283 26.94283 24.96637 2.382633 9.54337
1.525385 1.20E-04 21.6723 21.6723 25.18597 26.94283 19.91546 25.18597 26.94283 23.42914 23.86835 2.614263 10.95284
2.288078 1.80E-04 28.69967 21.6723 25.18597 26.94283 26.94283 28.69967 30.4565 28.69967 27.16243 2.727756 10.04239
3.050771 2.40E-04 25.18597 26.94283 26.94283 21.6723 25.18597 25.18597 25.18597 32.21334 26.0644 2.969603 11.39333
3.813463 3.00E-04 28.69967 23.42914 21.6723 25.18597 26.94283 25.18597 25.18597 30.4565 25.84479 2.807416 10.8626
4.576156 3.60E-04 25.18597 23.42914 25.18597 21.6723 25.18597 25.18597 28.69967 25.18597 24.96637 1.978189 7.923414
5.338849 4.20E-04 28.69967 28.69967 28.69967 28.69967 26.94283 26.94283 30.4565 26.94283 28.26046 1.242271 4.395793
6.101541 4.80E-04 25.18597 26.94283 25.18597 23.42914 28.69967 30.4565 28.69967 30.4565 27.38203 2.614266 9.547377
6.864234 5.40E-04 25.18597 26.94283 25.18597 25.18597 28.69967 28.69967 25.18597 28.69967 26.72321 1.74109 6.515273
7.626927 6.00E-04 26.94283 26.94283 25.18597 25.18597 26.94283 26.94283 28.69967 30.4565 27.16243 1.741087 6.409908
8.389619 6.60E-04 28.69967 25.18597 25.18597 25.18597 28.69967 32.21334 30.4565 32.21334 28.48005 3.03387 10.65261
9.152312 7.20E-04 28.69967 28.69967 25.18597 25.18597 30.4565 30.4565 30.4565 32.21334 28.91926 2.561016 8.855743
9.915005 7.80E-04 30.4565 28.69967 25.18597 30.4565 28.69967 26.94283 30.4565 32.21334 29.13887 2.251812 7.727864
10.6777 8.40E-04 28.69967 23.42914 30.4565 30.4565 30.4565 28.69967 32.21334 30.4565 29.35848 2.645698 9.0117
11.44039 9.00E-04 28.69967 30.4565 32.21334 30.4565 28.69967 28.69967 26.94283 32.21334 29.79769 1.863406 6.253526
12.20308 9.60E-04 28.69967 25.18597 28.69967 30.4565 28.69967 30.4565 28.69967 32.21334 29.13887 2.046658 7.023807
12.96578 1.02E-03 33.97017 30.4565 32.21334 28.69967 28.69967 32.21334 28.69967 32.21334 30.89571 2.046652 6.624389
13.72847 1.08E-03 26.94283 28.69967 30.4565 23.42914 28.69967 28.69967 30.4565 30.4565 28.48006 2.382632 8.365968
14.49116 1.14E-03 30.4565 28.69967 26.94283 28.69967 30.4565 28.69967 32.21334 32.21334 29.79769 1.863406 6.253526
15.25385 1.20E-03 28.69967 28.69967 30.4565 32.21334 25.18597 30.4565 25.18597 32.21334 29.13887 2.777811 9.533008
16.01655 1.26E-03 32.21334 28.69967 26.94283 30.4565 26.94283 28.69967 35.72701 32.21334 30.2369 3.03386 10.03363
16.77924 1.32E-03 32.21334 28.69967 32.21334 25.18597 28.69967 28.69967 33.97017 28.69967 29.79768 2.807411 9.421575
Cycle

70
Figure A4. Sample of injection timing graph.
1.15
1.2
1.25
1.3
1.35
1.4
1.45
1.5
1.55
1.6
-31 -26 -21 -16 -11 -6 -1 4
Series1
Series2
Series3
Series4
Series5
Series6
Series7
Series8

71
APPENDIX B. ADDITIONAL EMISSIONS RESULTS
Figure B1. O2 emissions for diesel-only and dual-fuel operation.
Figure B2. NO emissions for diesel-only and dual-fuel operation.
6.00
8.00
10.00
12.00
14.00
16.00
18.00
0% 20% 40% 60% 80% 100%
O2 E
mis
sio
ns
(%)
Load
O2 Emissions
1300
1500
1800
2100
1300 w/H2
1500 w/H2
1800 w/H2
2100 w/H2
0.00
100.00
200.00
300.00
400.00
500.00
600.00
700.00
800.00
900.00
0% 20% 40% 60% 80% 100%
NO
Em
issi
on
s (%
)
Load
NO Emissions
1300
1500
1800
2100
1300 w/H2
1500 w/H2
1800 w/H2
2100 w/H2

72
Figure B3. NO2 emissions for diesel-only and dual-fuel operation.
0.00
50.00
100.00
150.00
200.00
250.00
300.00
350.00
400.00
450.00
500.00
0% 20% 40% 60% 80% 100%
NO
2 E
mis
sio
ns
(%)
Load
NO2 Emissions
1300
1500
1800
2100
1300 w/H2
1500 w/H2
1800 w/H2
2100 w/H2
73
APPENDIX C. INJECTION DELAY CIRCUIT
One key engine control that can be used to help control start of combustion is ignition
timing. Retarding the SOC brings the potential to increase the amount of H2 added during dual-fuel
operation. If combustion started later in the cycle, cylinder pressures and temperatures would be
lower, leading to a reduction in the maximum in-cylinder pressure and MRPR for the same heat-
release profile.
The CAT ACERT ECM provided for testing was a “locked” unit, meaning it could not be
modified. Ideally, with an “unlocked” ECM, the values for injection timing and other operating
characteristics could be modified though a computer program, allowing many more variables to be
controlled.
One idea to gain partial control over the injection timing was to design an “injection delay
circuit,” to be used between the ECM and the injector. The injector signals would pass through the
circuit and be delayed by some time, allowing the injection timing to be retarded but not advanced.
This was acceptable since interest was only in retarding the timing. The circuit was design to delay
the injection signal by up to 1 ms and could be controlled by the operator. This would allow control
of injection timing relative to the ECM’s timing. A schematic of the injector signal and how it could
be controlled can be seen in Figure C1.
Both pilot and main injection signals were in the form of a step-function that started at 0 V,
held at 90 V for 0.2 ms, and dropped back to 0 V. After the main injection there were also a varying
number of quick “pulses” up to 30 V. The circuit was designed to eliminate the pulses after the
main injection, which controlled the load of the engine. In order to regain the ability to control load,
the circuit was designed to extend the injection pulse duration.
The circuit was designed, modeled, and tested using computer software. A prototype
printed circuit board (PCB) and components for the circuit were ordered and assembled by hand.
Each of the 6 injector leads would split and run through the board on its own separate delay circuit.
Due to component availability and time constraints, the circuit was never finished or physically
tested. Much thanks to Dr. Majura Selekwa for his help in designing the circuit. Pictures of the
modeled and nearly complete assembled board can be seen in Figure C2.

74
Figure C2. Nearly complete circuit on the left. A model of the injector delay circuit on the right.
Figure C1. Injector signal with injector delay circuit parameters and values.