Embed Size (px)
Citation preview

- 251 -
a.
Characterization of producers and quinoa supply chains in
the Peruvian regions of Puno and Junin
Waldemar Mercado*; Karina Ubillus Facultad de Economía y Planificación – Universidad Nacional Agraria La Molina, UNALM, Apartado postal 12-056, La
Molina, Lima, Peru.
Received December 21, 2016. Accepted May 26, 2017.
Abstract The present study aims to categorize quinoa producers and examine and compare quinoa supply chains in the
Peruvian regions of Puno and Junin. This research was conducted in the provinces of San Roman and El
Collao in Puno and Jauja and Huancayo in Junin using surveys of producers selected according to stratified
sampling, along with interviews and workshops with traders and agents in the supply chain. Cluster analysis
was used to examine the producers’ attributes, the supply chain, and the profit margins of conventional and
organic producers. In both regions, most producers were small and medium sized (100% in Puno and 91.6% in
Junin). The supply chains in Puno and Junin comprised 24 and 31 channels, respectively. It was found that
numerous collectors, formal and informal processors, and exporters mainly linked with organized producers
participated in these supply chains and this made trade efficient and coordinated. In contrast, trade among
individual producers in the domestic markets through agents in the supply chain was highly disjointed, tending
toward high centralization and without added value. It is concluded that quinoa supply is complex, centralized,
traditional, and somewhat inefficient since asymmetrical relations were found between agents favoring
commercial intermediaries.
Keywords: quinoa; commercialization; production costs; agricultural markets; supply chains.
1. Introduction
Agrarian commerce comprises all activities
undertaken to achieve the delivery of
agricultural products from the point of
production to the final consumer through
internal and external markets (Martínez,
2005; Mendoza, 1991).
The supply chain is a network that allows
the transfer of a product, representing the
relationship among agents and the
movement of the product from its origin to
its destination (Coscia, 1978). According
to Alarcón and Ordinola (2002), the
typology of the network determines
whether the chain is direct or indirect and
whether the commerce is centralized
(when one agent primarily dominates the
network) or decentralized.
Production costs are the economic value of
resources incurred for obtaining goods
over a period of production; in other
words, these are input costs associated
with manual labor, land costs, and depre-
ciation, among other variables (Álvarez
and Sánchez, 1998). To determine the
profitability of the producer, the produc-
tion costs and the producer’s selling price
are required. In general, the larger and
more complex the supply channel, the
greater will be the marketing costs and the
lesser will be the producer’s selling price.
The market tends to offer only one price at
the point of sale.
Research on quinoa marketing in Peru has
focused on the following aspects: (1)
exports, along with the identification of
Scientia Agropecuaria Website: http://revistas.unitru.edu.pe/index.php/scientiaagrop
Facultad de Ciencias Agropecuarias
Universidad Nacional de Trujillo
Scientia Agropecuaria 8 (3): 251 – 265 (2017)
---------
* Corresponding author © 2017 All rights reserved. E-mail: [email protected] (W. Mercado). DOI: 10.17268/sci.agropecu.2017.03.08

-252-
potential markets and the trends therein
and determination of requirements to
access wealthier countries (FAO and
ALADI, 2014; MINAGRI, 2013); (2) the
characteristics of quinoa demand in Lima,
Peru, and its consumption across various
socioeconomic strata (IMA Opinion and
Mercado, 2013; Chacchi, 2009); (3) regio-
nal marketing and identification of Puno’s
production chain (Bermejo, 2009; IICA,
2015; MINAGRI, 2013; MINCETUR,
2006) and the commercialization of quinoa
in Junin and Arequipa (IICA, 2015;
Mercado and Gamboa, 2014); and (4) food
security evidencing that producers prefer
to sell quinoa and consume foods that are
less expensive and less nutritious (IICA,
2015; Laqui, 2013).
In 2015, Peru exported 42 thousand tonnes
of quinoa, whereas Bolivia, another great
producer of the grain, exported 25.1
thousand tonnes. This made the country
former the world’s leading quinoa exporter
(CCEX, 2016). In 2016, according to
statistics from Agrodataperu (2016), the
volume exported by Peru reached 43.8
thousand tonnes, with quinoa ranking
14/150 in terms of exports of non-
traditional products. However, the free-on-
board (FOB) value decreased 27% from
U.S.$ 143.55 million in 2015 to U.S.$
103.16 million in 2016. Despite this
decrease, it must be recognized that in
Peru, the extraordinarily dynamic promo-
tion of quinoa over the past decade has
resulted in the expansion of its cultivation
from the Andes to the Coast.
Quinoa production in Peru has grown
significantly, from 22 thousand tonnes in
2001 to 105 thousand tonnes in 2015, with
an annual growth rate of 15% (MINAGRI,
2016).
In 2016, the Puno region exhibited the
highest quinoa production, although its
production has decreased relative to the
national production (Table 1). In 2001,
Puno was responsible for 81% of the
national production, but by 2016, this share
had fallen to 45.2%. Next, the Southern
high mountain region in Peru (comprising
four departments, including the depart-
ments of Arequipa and Ayacucho, which
have larger productions) accounted for
40.6% of the total in 2016. In third place
was the Peruvian Coast (with seven
departments), which represented 5.1% of
the total, followed by Junin in fourth place
with 4.9%. The Central and North high
mountain region came last, accounting for
4.1% of the total. In all cases, the mean
annual growth rate over 2001-2016 was
positive. In 2016, production in all regions
decreased as a result of falling selling
prices of quinoa producers. This study’s
objectives are to categorize quinoa
producers and determine and compare
quinoa supply chains in the principal
producing regions of Puno and Junin. The
Puno region “the Altiplano” is between
3812 and 5500 m.a.s.l. and has a cold but
temperate climate because of nearby Lake
Titicaca. The lake receives rainfall from
December to March and determines the
cultivating season (GRP, 2008).
Table 1
Quinoa production by region (2001–2016)
Region
Quinoa production (thousand tonnes)
Growth
rate
Percentage
in 2016 Mean
2001-2005
Mean
2006- 2010
2011 2012 2013 2014 2015 2016
Puno 22.9 27.3 32.8 30.2 29.3 36.2 38.2 35.2 5.6% 45.2%
Junin 1.4 1.3 1.4 1.9 3.9 10.5 8.5 3.8 5.6% 4.9%
Southern high mountain (1)
2.8 4.7 5.5 10.2 15.1 49.5 47.1 31.6 15.4% 40.6%
Central and North high mountain (2)
0.9 0.9 1 1.2 1.6 5.7 4.8 3.2 8.7% 4.1%
Coast (3) 0.4 0.4 0.5 0.8 2.2 12.8 6.9 4.0 15.1% 5.1%
Total 28.4 34.5 41.2 44.2 52.1 114.7 105.6 77.8 8.7% 100.0%
(1) Arequipa, Apurimac, Ayacucho, Cusco; Puno is excluded in this list. (2) Huancavelica, Ancash, Cajamarca, Amazonas, Pasco, Huanuco; Junín is excluded in this list. (3) Lambayeque, La Libertad, Ica, Lima, Moquegua, Piura, Tacna. Source:
Ministry of Agriculture and Irrigation (MINAGRI) (2016).
W. Mercado & K. Ubillus / Scientia Agropecuaria 8 (3) 251 – 265 (2017)

-253-
Table 2
Principal quinoa metrics for Junin and Puno regions (2008–2016)
2008–
2009
2009–
2010
2010–
2011
2011–
2012
2012–
2013
2013–
2014
2014–
2015
2015–
2016
Growth
rate
Puno region
Sown area (ha) 26 110 27 047 28 360 30 265 31 258 32 929 34 640 36 430 4.87% Production (t) 31 174 31 946 32 743 30 179 29 331 36 158 38 221 35 166 1.74%
Yield (kg/ha) 1 194 1 213 1 198 1 100 981 1 121 1 119 985 -2.71%
Farm price (soles/kg) 3.46 3.44 3.73 4.01 5.78 5.08 5.59 4.09 2.42%
Junin region
Sown area (ha) 1 028 1 153 1 211 1 432 5 404 4 191 4 272 2 012 10.10%
Production (t) 1 454 1 586 1 448 1 882 10 551 8 040 8 518 3 800 14.71% Yield (kg/ha) 1 414 1 375 1 216 1 314 1 998 2 002 1 994 1 893 4.30%
Farm price
(soles/kg) 3.20 3.53 3.91 4.10 5.79 3.28 3.27 3.79 2.45%
Source: Authors’ elaboration using data from DRAP (2017) and DRAJ (2017).
The agrarian sector represented 17% of the
gross regional product in 2011. The area of
land cultivated for quinoa expanded 4.9%
annually on average from 2008 to 2016;
planting occurs between August and
November and harvests from April to May.
During the same period, quinoa production
grew by 1.7% on average and the yield
decreased by 2.7% annually (Table 2).
According to National Institute of Agri-
cultural Innovation (INIA) interviewees,
this reduction is attributed to the delayed
rains that result in postponed sowing,
particularly since the yield in Puno is
influenced by climate and applied
technology.
In Puno, in 2016, the land cultivated for
quinoa was concentrated in Azangaro
(8220 ha), San Roman (5,130 ha), Puno
(4920 ha), El Collao (4728 ha), Huancane
(3690 ha), and Chucuito (3500 ha).
Further, quinoa is most important in terms
of cultivated areas in San Roman (27%)
and El Collao (22%) (DRAP, 2016). From
2008 to 2016, a positive correlation is
established between prior farm prices and
current sown area in El Collao (r = 0.76)
and San Roman (r = 0.45) according to
data from DRAP (2016).
Based on the National Agrarian Census
(INEI, 2012), the Puno region had 56353
farmers dedicated to quinoa production,
equivalent to 82% of the quinoa farmers in
Peru. These farmers, on average, cultivated
less than 3.0 ha, used traditional
technology, and farmed a great variety of
products to militate against climatic and
geophysical risks (in the mountainous
Puno region, the weather and altitude
prohibit drastic changes in production).
According to the same census, in Junin,
there were 1601 farmers producing quinoa,
which represents 2.3% of the national
total; of these farmers, 75.8% cultivated
the grain on less than 3.0 ha.
Junin is located in central Peru and has an
altitude that varies between 400 masl and
5,730 masl. In terms of prevailing climate
and biomes, the region varies from
mountainous glaciers to tropical forests
(GRJ, 2008). The agrarian sector repre-
sented 6.71% of the gross national agrarian
product in 2016. The surface area culti-
vated with quinoa increased at a rate of
10.1% on average between 2008 and 2016;
planting occurs from October to Decem-
ber, with harvests from May to July.
Production has grown by an average of
14.7% annually and the yield has increased
at a rate of 4.3% annually (Table 2). Ho-
wever, in 2016, the sown area fell by 53%
compared with the previous year, and the
total quinoa production decreased by 55%.
At the provincial level, quinoa cultivation
is most concentrated in Huancayo (848 ha)
and Jauja (669 ha). It is also cultivated in
Concepcion (329 ha), Chupaca (147 ha),
and Tarma (8 ha). Quinoa cultivation only
represents 1.62% of the total cultivated
land area in the region and only 0.14% of
total regional production (DRAJ, 2016).
According to data reported by DRAJ
(2016) from 2008 to 2016, there is a
positive correlation between prior farm
W. Mercado & K. Ubillus / Scientia Agropecuaria 8 (3) 251 – 265 (2017)

-254-
prices and current sown area in the
provinces of Huancayo (r = 0.76) and Jauja
(r = 0.89).
The present research used the following
categories to differentiate between quinoa
in terms of production regimes: (i) tradi-
tional quinoa, which is characterized by
the predominant use of organic fertilizers
and rain-fed irrigation in the production
process; (ii) conventional quinoa, which
principally uses chemical inputs as fertili-
zers and pesticides and is associated to
under irrigation crop by the contour-furrow
method; and (iii) certified organic quinoa,
for which the production process has been
adapted to standards required by certifiers.
2. Material and methods
This study considered the most represent-
tative provinces and districts of quinoa-
cultivating areas in Puno and Junin, where
information was gathered by surveying
quinoa producers in 2014 (Figure 1).
Following Arvizu et al. (2014), a mixed-
methods (qualitative and quantitative)
approach was followed.
In Puno, there were 11388 quinoa farmers
in the provinces/districts examined in the
present study (INEI, 2014), 240 of which
were sampled. Among the districts of San
Roman, 22 of these producers were based
in Cabana, 25 in Caracoto, and 6 in
Cabanillas. Among the districts of El
Collao, 136 producers were based in Ilave
and 51 in Pilcuyo. The sample size was
determined through an equation of finite
sample populations. Additionally, 30 fur-
ther surveys were administered to interme-
diate agents (collectors, wholesalers, mi-
llers, processors, retailers, nongovern-
mental organizations, and local govern-
ment officials) to identify the relation
between agents and market destinations.
To estimate the production costs, 30 addi-
tional surveys were administered to tradi-
tional producers and organically certified
producers: 21 in El Collao and 9 in San
Roman.
In Junin, there were 1690 quinoa farmers
in the districts covered by this study (INEI,
2014), of which 190 farmers were included
in the sample by using a two-stage
stratified sampling conglomerate, stratified
with probability proportional to the size of
the conglomerate that is used when the
population is divided in groups that
represent the total of the variable in the
study.
Figure 1. Maps of the main quinoa producer districts in Junin and Puno where the interviews were
conducted.
W. Mercado & K. Ubillus / Scientia Agropecuaria 8 (3) 251 – 265 (2017)

-255-
Specifically, 47, 20, and 18 producers were
surveyed in Sicaya, Colca, and Sapallanga,
respectively (districts of Huancayo), and
34, 16, 12, 8, 15, and 20 producers were
surveyed in Acolla, Marco, Yauyos, Tunan
Marca, Paccha, and Sincos, respectively
(districts of Jauja). Additionally, 36
additional surveys were administered to
various agents in the supply channel. To
estimate the production costs, information
was gathered from various local associa-
tions of producers and governmental
agricultural agencies in Jauja and Huan-
cayo. This information was contras-ted
with six surveys taken from producers in
Jauja and Huancayo, who represented the
average producers of those zones.
The surveys administered to producers
covered the following topics: (i) informa-
tion related to quinoa production (size of
cultivated land, access to productive
inputs, technical services, suppliers, and
quantity of production); (ii) distribution of
the harvest between sales, storage for later
sale, self-consumption, self-supply, and
destination of product according to the
buyer and the market; and (iii) details of
the producer.
The surveys administered to marketers
covered the following topics: (i) type of
agent and purchase volume; (ii) quinoa
source, purchase price, varieties, and color;
and (iii) destination, purchase price, volu-
me, commercialized quinoa products, and
certifications that are used (see Annex).
The surveys concerning production costs
covered the following topics: (i) details of
producers; (ii) property details, harvested
area, production and certifications; (iii) and
production costs, renting and land prepara-
tion, sowing, agricultural work, harvesting,
inputs used, applied fertilizers, cost of
packaging and transportation, credit, and
unexpected costs.
3. Results and discussion 3.1 Characterization of quinoa producers
Characterization, as per Tobar (2010),
involves determining the particular attribu-
tes of someone or something and distin-
guishing them or it from comparable
entities. Typing is the act of representing
the subject or object using types, classes,
or categories based on its principal
characteristics (Bolaños, 1999).
The characteristics of quinoa producers in
El Collao and San Roman are now
discussed. First, 20% of them belonged to
an association, whereas 98% of those
surveyed were owners of their own land.
The average area of land cultivated was
2.97 ha, distributed in 2 to 4 parcels. In El
Collao, 35% of the cultivated land was
dedicated to quinoa production, 30% to
oats, and 21% to potatoes. In San Roman,
39% of the land was dedicated to the
cultivation of oats, 27% to quinoa, and
14% to barley. On average, the producers
had cultivated quinoa in Puno for more
than 18 years.
Cluster analysis aims to classify
individuals into groups so that there is
more homogeneity within groups with
respect to the observed variables. This
methodology has hitherto been used
specifically in the context of quinoa by
Ton and Bijman (2006), coffee by
Hernández-Martínez (2008), and agricul-
tural products more generally by Santos
(2014). This analysis allowed the quinoa
producers to be classified in groups of
small- and medium-sized producers. Of
these, 65% were small-sized producers
who, on average, dedicated 0.51 ha to the
cultivation of quinoa for 2.49 ha that they
cultivated in total, producing 314 kg of
quinoa with an average yield of 603 kg/ha.
Further, 35% were medium-sized produ-
cers with 1.33 ha of cultivated quinoa,
producing 1 089.3 kg of quinoa with an
average yield of 803.4 kg/ha (Table 3).
Similar data were obtained by Flores and
Chura (2015) for the district of Cabana-
Puno.
Of the total interviewed in Puno, 91%
produced traditional quinoa and 9% certi-
fied organic quinoa; in San Roman, 35%
produced certified organic quinoa and 65%
produced traditional quinoa. The varieties
of quinoa cultivated in Puno were Kancolla
(34.4%), Pasankalla (24.8%), Blanca de
Juli (21.3%), and Salcedo INIA (18.4%).
W. Mercado & K. Ubillus / Scientia Agropecuaria 8 (3) 251 – 265 (2017)

-256-
Because of the market preference for white
quinoa, only 1% of the cultivated quinoa
was not white.
In Junin, 21.6% of the quinoa producers
belonged to an association (2.4% were
small-sized producers, 85.4% medium-
sized producers, and 12.2% large-sized
producers). The members of associations
were able to sell approximately 15% of
their quinoa through formal agreements for
which they received the highest price.
They also had greater accessibility to
financing, machinery, and training (Ton
and Bijman, 2006). Of all the producers
59% were owners of the land they
cultivated, and 72% of them obtained their
land through inheritance. On average, each
producer owned 4.8 ha under cultivation,
and all the Junin producers were charac-
terized by having a lower level of infor-
mation with respect to the market, such as
buyers, markets, characteristics the buyers
are looking for, and how prices are set.
Of the Junin producers, 24.2% were small-
sized producers who dedicated, on avera-
ge, 0.67 ha to quinoa cultivation (of the 1.9
ha under cultivation) to produce 780 kg of
quinoa with a yield of 1279 kg/ha (close to
the average yield of small familiar
producers in Northwest Argentina)
(Golsberg, 2013). They retained 25.9% of
the production for their own consumption.
The majority, i.e., 67.4%, were medium-
sized producers who dedicated, on avera-
ge, 1.42 ha to the quinoa cultivation (of the
3.9 ha under cultivation), produced an
average yield of 2125 kg/ha, and sold
93.9% of their total production. Finally,
8.4% were large-sized producers who
dedicated, on average, 9.23 ha to quinoa
cultivation (of the 20.4 ha under culti-
vation), produced a yield of 2617 kg/ha,
and sold 98.6% of their total production
(Table 4). For comparison, according to
Jacobsen (2003), the yield is, on average,
1000 kg/ha in the United States; 2280
kg/ha in Italy; and 3960 kg/ha in Greece.
Across all producers, 95.8% produced
conventional quinoa and traditional quinoa
and only 4.2% produced certified organic
quinoa, the latter being produced in the
districts of Sincos (Jauja) and Sapallanga
(Huancayo). The varieties cultivated are
white (84.7%), the two types being (1)
Hualhuas and Blanca de Junin and (2)
colored quinoa, black, and red (15.3%).
As seen from Tables 3 and 4, there are
significant differences between the
producers of quinoa in Puno and Junin.
The producers in Puno tended to be
smaller and produced smaller yields. In
Junin, they primarily produced
conventional quinoa, whereas in Puno,
they tended to produce traditional quinoa
and certified organic quinoa.
3.2 Chain of production and market
destination of quinoa
Identified herein is the farmers’ relation-
ships in the chain of quinoa production
“backward” and “forward” (Figure 2),
demonstrating that access of the producers
to the input providers and technical
services is better in Junin than in Puno.
Therefore, 86% of the farmers in Junin
used machinery such as tractors compared
with 82% in Puno (97% in Puno and 82%
in Junin rented the tractor). Further, 29%
had undergone training and 29% had
received technical assistance in Junin com-
pared with 16% and 6%, respectively, in
Puno.
Table 3
Characterization of surveyed quinoa producers in Puno’s provinces (2014)
Variables
San Roman El Collao Total
Small Medium Small Medium Small Medium
Number of producers 51 6 103 80 156 84
% of total 90% 10% 56% 44% 65% 35%
Cultivated area (ha) 2.05 3.98 2.71 3.84 2.49 3.85 Cultivated area of quinoa (ha) 0.46 1.75 0.53 1.30 0.51 1.33
Production of quinoa (kg) 229.4 1,266.7 358.4 1,076.7 314.1 1,089.3
Yield of quinoa (kg/ha) 554.3 788.8 732.8 817.9 603.0 803.4
W. Mercado & K. Ubillus / Scientia Agropecuaria 8 (3) 251 – 265 (2017)

-257-
(a)
(b)
Figure 2. Articulations of surveyed quinoa
producers in the supply chain in Puno and
Junin (2014): (a) Access to productive inputs;
(b) Destination of quinoa production.
Private financing was opted for by only
2% in Puno and 9% in Junin. Regarding
seeds, 96% of the producers in Puno
obtained them from previous production
processes and only 4% bought them from
the INIA; producers also exchanged seeds
among themselves. In Junin, 93% obtained
seeds from previous production processes
and 7% bought them from the INIA. In
Puno, producers tended to use local inputs
and had limited access to providers of
finance and technical assistance; this
situation is in contrast to the case of
producers in Bolivia (Montoya et al.,
2005), Colombia (Dueñas, 2014), and
Argentina (Golsberg, 2013). Production
“forward” represents the possible
destinations of the produced quinoa.
Although some quinoa was stored for later
sale in both regions, this was more evident
in Puno than in Junin (41% versus 9%).
Hence, in Junin, 88% of the quinoa pro-
duced was sold upon harvesting and 9%
was stored for future sale; this means that
97% of the production was commercial-
lized. In Puno, a relatively higher portion
of the quinoa produced was consumed by
the producer and set aside for the seeds
(9%) than in Junin (3%). In Puno, the
stored grain was sold when the producers
required capital. The harvest was sold to
Type I collectors (called “K’ato”), who
operated in local fairs (3.8%) and to Type
II collectors, who operated in urban areas
(93.2%).
In Puno, the producers delivered the
product to the point of sale 2.9% of the
time. In Junin the harvest was sold to Type
I collectors (22%) wholesalers (21%)
retailers (14.5%) and businesses (16.4%).
The remaining 14% was sold directly to
consumers at fairs (3.3%) the Jauja market
(0.6%) Huancayo (7.2%) and mills (2.9%).
The market destinations of quinoa from
Puno were as follows: (1) the regional
market in Puno accounted for 10.7%
(including the quantities consumed by the
producer and set aside for seeds) of the
total; (2) markets in other departments
(Arequipa Cusco and Tacna) represented
4.4% of the total; (3) the national market in
Lima received 24.4% for urban
consumption or processing for later sale to
consumers; and (4) international market
accounted for 19.5% (Table 5).
Table 4
Characterization of surveyed quinoa producers in Junin’s provinces through cluster analysis in two
phases
Variables Huancayo Jauja Total
Small Medium Large Small Medium Large Small Medium Large
Number of producers 12 63 10 34 65 6 46 128 16
% of total 14.1 74.1 11.8 32.4 61.9 5.71 24.2 67.4 8.4
Cultivated área (ha) 2.52 4.27 20.37 1.65 3.5 20.33 1.9 3.9 20.4 Cultivated area of quinoa (ha) 0.76 1.75 9.37 0.64 1.1 9.00 0.67 1.42 9.23
Production of quinoa (kg) 739 3 771 24 095 795 2 493 21 367 780 3 122 23 072
Yield of quinoa (kg/ha) 1 080 2 180 2 583 1 349 2 072 2 674 1 279 2 125 2 617
W. Mercado & K. Ubillus / Scientia Agropecuaria 8 (3) 251 – 265 (2017)
-258-
The market destinations of quinoa from
Junin were as follows: (1) the regional
market in Junin accounted for 44.1%
(including the quantities consumed by the
producer and set aside for seeds) of the
total; (2) markets in other departments
(Jungle) represented 0.1%; (3) the national
market in Lima accounted for 42.4%; and
(4) international markets received 3.8%.
Under the assumption that the stored
quinoa for later sale (41% and 9% in Puno
and Junin respectively) is sold to desti-
nations similar to those sold to after
harvesting in 2014 Puno’s production
would have first supplied the Lima market
(24.4%) followed by the international
market (19.5%) and regional markets
including nearby departments (15.1%). For
Junin the main destination was the regional
market (54%) followed by the Lima
market (42%) and the international market
(4%). Thus, Puno’s production exhibited
better performance in dynamic markets
positioning the traditional quinoa and the
certified organic quinoa. Meanwhile
Junin’s production of conventional quinoa
mainly served regional markets and given
to its proximity to Lima its destination
markets were mostly the popular ones.
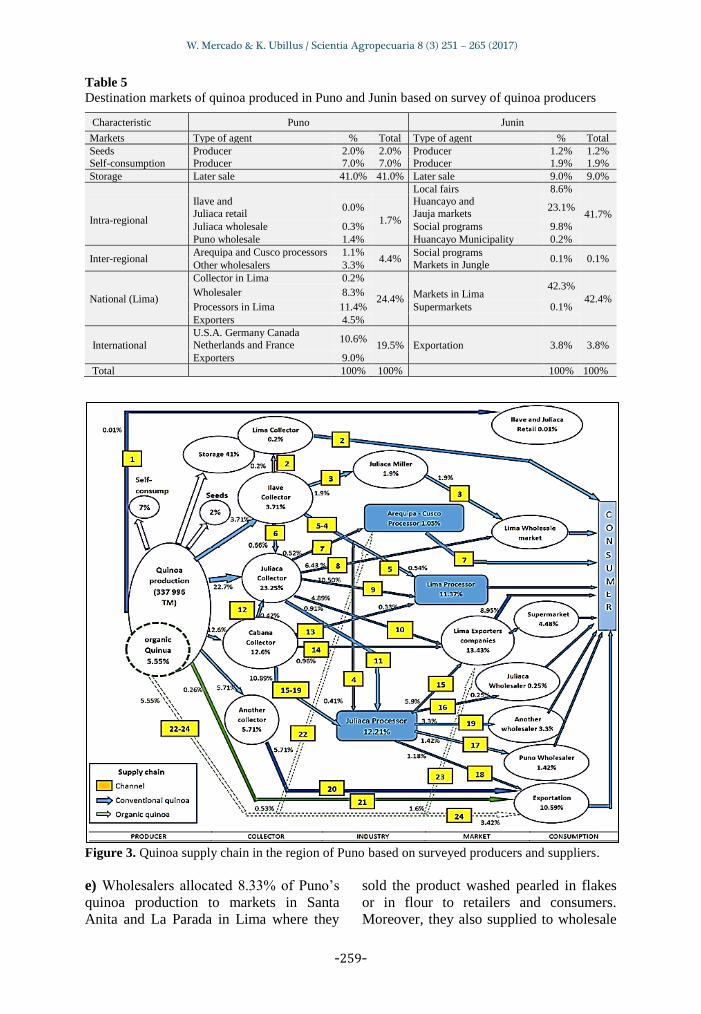
3.3 Intermediary agents in the quinoa
supply chain
Puno’s quinoa supply chain is illustrated
in Figure 3 representing all commercial
agents therein.
a) Producers sold 22.02% of the total
quinoa produced to Type I collectors in
local fairs (well known as K’ato) and
22.17% to Type II collectors at regional
fairs. The latter also bought from Type I
collectors (1.09%) and commercialized
23.25% of the total volume. There were
also direct channels wherein the producer
sold 0.01% to retail markets in Ilave and
Juliaca (channel 1) and 5.80% was
commercialized by organized producers
such as Cooperativa Agro Industrial
Cabana Ltda (COOPAIN) which sold
traditional quinoa (channel 21, 0.26% of
the total) and certified organic quinoa
(5.55%). COOPAIN exported quinoa to
the U.S.A., Germany, Canada, the Nether-
lands and France (channels 22, 23 and 24)
via the Cabana 3901 Organic Whole Foods
brand.
b) Collectors gathered produce for whole-
sale. Type I collectors collected quinoa in
local fairs and sold to millers and
processors in Juliaca (13.2% of the total)
and to Type II collectors in Juliaca (1.1%).
Type II collectors were provided by
producers (22.17%) and Type I collectors
who in turn sold to Lima processors
(Channel 9, 10.5%) wholesalers (6.43%)
exporters (4.9%) Juliaca processors (0.9%)
and Arequipa and Cusco markets (0.52%).
According to the calculations from collec-
tors interviewed in Juliaca in 2014 30
collectors existed in Juliaca and around 80
in the province of San Roman this number
is higher than reported by Sierra
Exportadora (2013).
c) Among the processors Juliaca millers
channeled 1.9% of the output (channel 3)
consisting of washed white quinoa (90%)
and colored (10%). They also bought
recently harvested quinoa at prices bet-
ween 8 and 10 soles/kg and sold the
product washed between 13 and 15
soles/kg. Of the total production 24.63%
was channeled through processors that
transformed the product into quinoa pear-
led washed in flakes and in flour among
other processed products. There were 13
companies identified at that level that
commercialized organic and traditional
quinoa. Exporter companies based in Puno
(there were 11 in 2013) exported washed
quinoa organic colored quinoa tricolor
quinoa and other processed products;
traditional white quinoa quinoa flakes
precooked quinoa gourmet pearled quinoa
and colored quinoa in the fair-trade market
(Flo Fair Trade) (Adex Data Trade, 2015).
d) Processing and exporting companies in
Lima were supplied from several parts of
Peru. In 2013 there were 86 such com-
panies that exported 13301 tonnes of
quinoa in total; 9% of Puno’s production
was delivered to these companies.
W. Mercado & K. Ubillus / Scientia Agropecuaria 8 (3) 251 – 265 (2017)
-259-
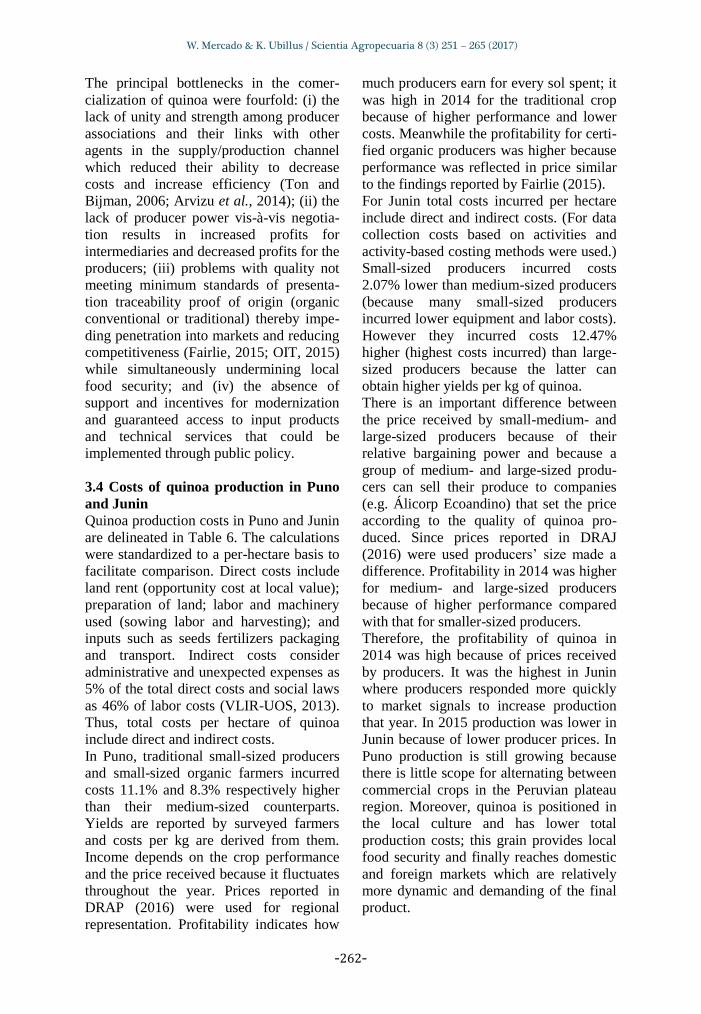
Table 5
Destination markets of quinoa produced in Puno and Junin based on survey of quinoa producers
Characteristic Puno Junin
Markets Type of agent % Total Type of agent % Total
Seeds Producer 2.0% 2.0% Producer 1.2% 1.2%
Self-consumption Producer 7.0% 7.0% Producer 1.9% 1.9%
Storage Later sale 41.0% 41.0% Later sale 9.0% 9.0%
Local fairs 8.6%
41.7% Intra-regional
Ilave and
Juliaca retail 0.0%
1.7%
Huancayo and
Jauja markets 23.1%
Juliaca wholesale 0.3% Social programs 9.8%
Puno wholesale 1.4% Huancayo Municipality 0.2%
Inter-regional Arequipa and Cusco processors 1.1%
4.4% Social programs
Markets in Jungle 0.1% 0.1%
Other wholesalers 3.3%
National (Lima)
Collector in Lima 0.2%
24.4%
Markets in Lima 42.3%
42.4% Wholesaler 8.3%
Processors in Lima 11.4% Supermarkets 0.1%
Exporters 4.5%
International
U.S.A. Germany Canada
Netherlands and France 10.6%
19.5% Exportation 3.8% 3.8%
Exporters 9.0%
Total
100% 100%
100% 100%
Figure 3. Quinoa supply chain in the region of Puno based on surveyed producers and suppliers.
e) Wholesalers allocated 8.33% of Puno’s
quinoa production to markets in Santa
Anita and La Parada in Lima where they
sold the product washed pearled in flakes
or in flour to retailers and consumers.
Moreover, they also supplied to wholesale
W. Mercado & K. Ubillus / Scientia Agropecuaria 8 (3) 251 – 265 (2017)

-260-
markets in Juliaca and Puno (1.42%) and
to extra-regional wholesalers in Arequipa
Tacna and Cusco (3.3%).
f) Supermarkets in Puno and Juliaca (Plaza
Vea and Via Market) and Arequipa and
Cusco (Plaza Vea) along with the super-
market network in Lima (which received
4.48% of Puno’s production) sold pocketed
pearled quinoa and quinoa as flakes grains
energy bars breakfast items candies and
other variants. District fairs and the retail
trade in municipal markets in El Collao
Puno and Juliaca where quinoa was
marketed jointly with other grains beans
and cereals accounted for 0.01% of the
total sold. The local governments of llave
Cabana and Juliaca used to buy quinoa for
social programs; this was terminated in
2014 because of rising prices.
Therefore, the quinoa supply chain in Puno
comprised 21 indirect channels involving
individual and organized producers collec-
tors millers processors and export markets
(Fig. 3). The quinoa supply chain was
mainly centralized and governed by collec-
tors (Type I and II) who comercialized
39.56% of the total production (50% of
which was commercialized at harvest). The
direct organic marketing channels (chan-
nels 1, 21 and 24) of producer organiza-
tions were also identified. Channel 1 was
short and with close spatial proximity
thereby guaranteeing availability to the
Juliaca market of Ilave and local food
security therein. Channels 21 and 24 were
short channels but far in spatial terms
because they consisted of an intermediary
for the international market through
COOPAIN which sells with certifications
and incorporates added value through
product brands.
Junin’s quinoa supply chain is presented
in Figure 4. a) Producers sold at local fairs 22.02% of
the total quinoa through indirect channels
to Type I collectors (small) next 20.97%
was sold to Type II collectors (medium)
14.53% to Type III collectors (whole-
salers) and 2.88% to millers. Through
direct channels 16.43% was sold to Type I
companies that transformed and sold
directly to Lima’s market which were
exporters 3.31% in fairs (channel 1) 7.17%
to the Huancayo wholesale market (chan-
nel 3) and 0.59% to the Jauja market.
Finally, 12.1% was allocated for self-
consumption storage and seeds.
b) Collectors gathered produce to sell it
directly without intermediation. Type I
collectors gathered quinoa at fairs and sold
directly to final consumers (1.55%) millers
and processors in Jauja and Huancayo
(10.76%) and wholesalers (9.72%) (Type
II collectors). Type II collectors were
supplied by producers (20.97%) and Type
I collectors with the main destination being
processors in Lima through Type III
collectors (channel 26 12.16%) and direct
means 6.62% (channel 19). The retail Type
III collectors sold to Type II companies
that supplied quinoa to social programs
(17.17%) Type I companies (0.95%) and
markets in Lima (12.16%). According to
interviews to collectors and processors
calculations 67 such collectors consisting
of at least 30 millers and 30 processor
companies which agrees with data
obtained by SNV (2013).
c) Millers of Huancayo transformed up to
22.47% of the produce (20.53% washed
and 1.94% pearled). They were supplied
by Type I collectors (10.76%) producers
(2.88%) and Type III collectors (6.81%).
Of the total production 20.08% was sup-
plied to formal processors (Type I compa-
nies) that transformed the quinoa into
pearled washed extruded and processed
quinoa and as flakes and flour. A total of
20 companies were identified at that level
that commercialized conventional quinoa
in small proportions. Four of these com-
panies were exporters based in Junin that
exported 3.78% in grain (Adex Data Trade,
2015). Type II companies only packaged
the quinoa and branded it for comer-
cialization prior to serving social programs
such as Qali Warma. These companies
sold 16.72% of the processed quinoa to
markets in Lima.
d) Wholesalers allocated 6.62% of the
quinoa production to markets in Santa
Anita and La Parada in Lima (channel 19)
W. Mercado & K. Ubillus / Scientia Agropecuaria 8 (3) 251 – 265 (2017)

-261-
where commercialized the product for
retailers and consumers as washed and
pearled quinoa or as flakes and flour. A
further 6.12% was allocated to the
Huancayo market (channel 22) and 0.66%
to Type II companies. Retailers supplied
mainly to Type II companies (17.17%)
markets in Lima (12.16%) and Type I
companies (0.95%).
e) Supermarkets sold quinoa pocketed and
pearled and as flakes grain energy bars
breakfast items candies and other variants
in Huancayo (Plaza Vea) and the network
of supermarkets in Lima which received
0.082% of the production. Social programs
in Huancayo received 9.81% extra-
regional social programs accounted for
0.051% and local government received
0.22%.
Junin’s quinoa supply chain comprised 28
indirect channels involving individual and
organized producers collectors millers
processors exporters and traders and target
markets (Figure 4). It was a centralized
supply chain and governed by Type II
collectors (who commercialized 37.31% of
the quinoa production) and companies
(both Type I and Type II which comer-
cialized 51.9% of the production). Three
direct channels existed from producer to
consumer (channel 1 at local fairs channel
2 to Jauja markets and channel 3 to
Huancayo markets). These channels were
short and close in spatial terms guaran-
teeing availability to local markets and
providing a basis for the maintenance of
food security.
Figure 4. Quinoa supply chain in the region of Junin based on surveyed producers and suppliers.
W. Mercado & K. Ubillus / Scientia Agropecuaria 8 (3) 251 – 265 (2017)
-262-
The principal bottlenecks in the comer-
cialization of quinoa were fourfold: (i) the
lack of unity and strength among producer
associations and their links with other
agents in the supply/production channel
which reduced their ability to decrease
costs and increase efficiency (Ton and
Bijman, 2006; Arvizu et al., 2014); (ii) the
lack of producer power vis-à-vis negotia-
tion results in increased profits for
intermediaries and decreased profits for the
producers; (iii) problems with quality not
meeting minimum standards of presenta-
tion traceability proof of origin (organic
conventional or traditional) thereby impe-
ding penetration into markets and reducing
competitiveness (Fairlie, 2015; OIT, 2015)
while simultaneously undermining local
food security; and (iv) the absence of
support and incentives for modernization
and guaranteed access to input products
and technical services that could be
implemented through public policy.
3.4 Costs of quinoa production in Puno
and Junin
Quinoa production costs in Puno and Junin
are delineated in Table 6. The calculations
were standardized to a per-hectare basis to
facilitate comparison. Direct costs include
land rent (opportunity cost at local value);
preparation of land; labor and machinery
used (sowing labor and harvesting); and
inputs such as seeds fertilizers packaging
and transport. Indirect costs consider
administrative and unexpected expenses as
5% of the total direct costs and social laws
as 46% of labor costs (VLIR-UOS, 2013).
Thus, total costs per hectare of quinoa
include direct and indirect costs.
In Puno, traditional small-sized producers
and small-sized organic farmers incurred
costs 11.1% and 8.3% respectively higher
than their medium-sized counterparts.
Yields are reported by surveyed farmers
and costs per kg are derived from them.
Income depends on the crop performance
and the price received because it fluctuates
throughout the year. Prices reported in
DRAP (2016) were used for regional
representation. Profitability indicates how
much producers earn for every sol spent; it
was high in 2014 for the traditional crop
because of higher performance and lower
costs. Meanwhile the profitability for certi-
fied organic producers was higher because
performance was reflected in price similar
to the findings reported by Fairlie (2015).
For Junin total costs incurred per hectare
include direct and indirect costs. (For data
collection costs based on activities and
activity-based costing methods were used.)
Small-sized producers incurred costs
2.07% lower than medium-sized producers
(because many small-sized producers
incurred lower equipment and labor costs).
However they incurred costs 12.47%
higher (highest costs incurred) than large-
sized producers because the latter can
obtain higher yields per kg of quinoa.
There is an important difference between
the price received by small-medium- and
large-sized producers because of their
relative bargaining power and because a
group of medium- and large-sized produ-
cers can sell their produce to companies
(e.g. Álicorp Ecoandino) that set the price
according to the quality of quinoa pro-
duced. Since prices reported in DRAJ
(2016) were used producers’ size made a
difference. Profitability in 2014 was higher
for medium- and large-sized producers
because of higher performance compared
with that for smaller-sized producers.
Therefore, the profitability of quinoa in
2014 was high because of prices received
by producers. It was the highest in Junin
where producers responded more quickly
to market signals to increase production
that year. In 2015 production was lower in
Junin because of lower producer prices. In
Puno production is still growing because
there is little scope for alternating between
commercial crops in the Peruvian plateau
region. Moreover, quinoa is positioned in
the local culture and has lower total
production costs; this grain provides local
food security and finally reaches domestic
and foreign markets which are relatively
more dynamic and demanding of the final
product.
W. Mercado & K. Ubillus / Scientia Agropecuaria 8 (3) 251 – 265 (2017)

-263-
Table 6
Total costs per sown hectare and economic metrics associated with quinoa rates in Puno and Junin
based on surveyed quinoa producers in Puno and Junin
Characteristic
Puno Junin
Traditional Organic Conventional
Small Medium Small Medium Small Medium Large
Total costs (soles) 2410 2190 2420 2234 5423 9301 9861
Yield (kg/ha) 732 792 701 735 1279 2125 2617
Cost (soles/kg) 3.29 2.77 3.45 3.04 4.0 4.0 4.0 Prices (soles/kg) 6.5 6.5 7.2 7.2 6.0 7.0 7.0
Average income (soles) 4758 5148 5047.2 5292 7572 15714 19106
Profitability 97% 135% 109% 137% 140% 169% 194%
For producers to obtain a greater portion of
the price paid by consumers they must
establish more direct relationships with
purchasers of quinoa in the supply channel.
Additionally, the government should pur-
chase quinoa for food programs directly from
the producer and promote local programs to
finance quinoa producers and add value to
quinoa as proposed by Furche et al. (2013).
It is also necessary to create a system that
would identify the traceability of the
collective brand of Puno and Junin because
these are the only two Peruvian regions that
continue to produce native varieties of
quinoa.
4. Conclusions
(i) In Puno, the principal destination for
quinoa was outside of the region although
the local market was also significant. In this
region producers tended to use local inputs
and had limited access to providers of
finance and technical assistance. In Junin the
farmers enjoyed greater access to these
providers and were able to respond more
rapidly to market/price changes. However,
they still lack the ability to penetrate larger
markets and negotiate with local commercial
agents. Further there is no possibility of
adding value to the raw quinoa resource and
the local producer associations are weakly
organized.
(ii) In general, when producers interact with
the supply chain at a smaller level
(individual) rather than through an organi-
zed association the supply channels are
centralized through collectors. Consequen-
tly, the supply chain leading to the final
consumer is highly disorganized and
inefficient characterized by asymmetries.
Further the limited ability of the small-sized
producers to negotiate impedes cooperation
between producers and other members of the
supply chain. In contrast when producers are
well organized they sell through supply
chains that are more efficient and have direct
links to processors as demonstrated in Puno.
(iii) In the production of traditional and
organic quinoa in Puno the costs for small-
sized producers were greater than those
incurred by medium-sized producers. This
demonstrates the possibility of reducing
costs through economies of scale and
stronger producer associations. The profi-
tability of organic production was slightly
higher than that of traditional production
owing principally to the reduced price
received upon sale. In Junin the medium- and
large-sized producers obtained greater profit
owing to their greater yields. In both cases
cultivation was profitable but could be
improved if crop yields were improved
through financing technology training and
research.
Taking this study’s findings into consi-
derations the following recommendations for
future research: (a) broaden and deepen the
typology of producers by for example
recognizing that because different categories
exist differentiated public policies are
necessary; (b) further explore supply chain
nuances and complexities by identifying
interactions between agents so that public
policies can promote productive improve-
ment and added value through trade; (c)
identify new alternatives as vertical inte-
gration between producers and marketing
agents; and (d) examine the short-circuit
promotion at the regional and national levels and its relation with food security public
purchased fair market and the boom of
gastronomy.
W. Mercado & K. Ubillus / Scientia Agropecuaria 8 (3) 251 – 265 (2017)

-264-
Acknowledgments
To the staff at the Agrarian Agency of El
Collao and San Roman (DRA-Puno) and
Huancayo and Jauja (DRA-Junin). I also thank
the research assistants (M. Apaza, C. Gamboa
and G. Díaz) and translators (M. Altshuler and
J. Huerta) involved in this research for their
support and inputs. I duly acknowledge finan-
cial support from Mercados Campesinos
(AVSF-CEPES) and the University Coopera-
tion VLIRUOS - UNALM.
References
Alarcón, J.; Ordinola, M. 2002. Mercadeo de Productos Agropecuarios: Teoría y aplicaciones al Caso Peruano.
First edition. Lima Peru.
Adex Data Trade Aduanas 2015. Estadísticas sobre las exportaciones de quinua. Database.
AGRODATAPERU. 2016. Estadísticas Exportaciones
Agropecuarias. Lima-Perú. Álvarez, A.; Sánchez, B. 1998. Costos y métodos de
costeo: Aplicación y análisis para el sector agropecua-
rio. First edition. Bogota Colombia. Arvizu, E.; Jiménez, L.; Jimenes, A. 2014. Análisis de
producción y comercialización de hortalizas: caso del
mercado de Huixcolotla Puebla. Revista Mexicana de Ciencias Agrícolas 5: 687-694.
Bermejo, R. 2009. Producción y comercialización de
quinua y cañihua ecológica en la Provincia de Melgar-Puno. First edition. Puno Peru.
Bolaños, O. 1999. Caracterización y tipificación de
organizaciones de productores y productoras. Paper presented at XI Congreso Nacional Agronómico. July
19-23 Costa Rica.
CCEX. 2016. Cámara de Comercio de Lima. Estadísticas Importaciones/Exportaciones. Lima-Perú.
Chacchi, K. 2009. Demanda de la quinua a nivel industrial.
UNALM. Lima Peru. Coscia, A. 1978. Comercialización de productos agrope-
cuarios. First edition. Buenos Aires Argentina.
DRAJ - Dirección Regional de Agricultura de Junin. 2016. Estadisticas agropecuarias del departamento de Junin
de los años 2008-2016. Junin, Peru.
DRAP - Dirección Regional de Agricultura de Puno. 2016. Estadisticas agropecuarias del departamento de Puno
de los años 2008-2016. Puno, Peru.
Dueñas, D. 2014. Vigilancia competitiva de la quinua: potencialidad para el departamento de Boyacá. Ed.
Elsevier. Revista Suma de Negocios 5 (12): 85-95.
Fairlie, A. 2015. Cadena exportadora y políticas de gestión
ambiental de la quinua en el Peru. Red LATN Serie
Crecimiento Verde e Inclusivo. Working Paper 179.66.
FAO; ALADI. 2014. Tendencias y Perspectivas del comercio internacional de la Quinua. Santiago Chile.
Furche, C.; Salcedo, S; Krivonos, E. 2013. International
quinoa trade. In State of the art report on quinoa around the world in 2013. Edited by D. Bazile D.
Bertero & C. Nieto. Chapter 4.1 316-329 (Rome: FAO
& CIRAD) 605. GRJ - Gobierno Regional de Junin. 2008. Plan Desarrollo
Regional Concertado Junin al 2015. Junin, Peru. GRP - Gobierno Regional de Puno. 2008. Plan Desarrollo
Regional Concertado Puno al 2021. Puno, Peru.
Golsberg, C. 2013. Organización de la Agricultura Familiar en el Noroeste de Argentina para la producción de
quinua. INTA. Revista Ciencia y Tecnología de los
Cultivos Industriales 3(5): 85-92.
Hernández-Martínez, G. 2008. Clasificación Agroecológi-
ca. In Agroecosistemas cafetaleros de Veracruz:
biodiversidad manejo y conservación. Edited by Manson R.H. Hernández-Ortiz V. Gallina S. y
Mehltreter K. Chapter 2, 14-34 (Mexico: Instituto de
Ecología A.C. e Instituto Nacional de Ecología) 348. IICA - Instituto Interamericano de Cooperación para la
Agricultura. 2015. El mercado y la producción de
quinua en el Peru. First edition. Lima, Peru. IMA Opinión; Mercado. 2013. Sondeo de consumo en
quinua: Lima Metropolitana y Callao. Lima.
Documento en ppt sin publicar. Database. INEI - Instituto Nacional de Estadística e Informática.
2014. IV Censo Nacional Agropecuario 2012.
CENAGRO Database. Jacobsen, S. 2003. The Worldwide Potential for Quinoa
(Chenopodium quinoa Willd.). Food Reviews
International 19: 167–177. Laqui, C. 2013. Cadena productiva de la quinua en la
Región Puno. Documento sin publicar.
Martínez, F. 2005. Comercialización Agropecuaria: Un enfoque económico de las estrategias comerciales.
First edition. Santiago, Chile.
Mendoza, G. 1991. Compendio de Mercadeo de Productos Agropecuarios. Second Edition.
Mercado, W.; Gamboa, C. 2014. Comercialización de la
quinua en las provincias de Chupaca y Jauja en la Región Junin. In Debate Agrario Análisis y
Alternativas 46. Lima, Peru. 93-117.
MINCETUR - Ministerio de Comercio Exterior y Turismo. 2006. Plan operativo de la quinua en la Región Puno.
Mesa de trabajo de la quinua en Puno. Puno, Peru.
MINAGRI - Ministerio de Agricultura y Riego. 2016. Estadísticas Agrarias. Lima, Peru.
MINAGRI - Ministerio de Agricultura y Riego. 2013.
Principales Aspectos de la cadena agroproductiva de la quinua en el Peru. Lima, Peru.
Montoya, L. Martínez L.; Peralta J. 2005. Análisis de
variables estratégicas para la conformación de una cadena productiva de quinua en Colombia. Revista
INNOVAR 15(25): 113-119.
Santos, V. 2014. Tipología de productores agropecuarios para la orientación de políticas públicas: Aproxima-
ción a partir de un estudio de caso en la región
Texcoco, Estado de Mexico. Revista Sociedades rura-les producción y medio ambiente 14(28): 47-69.
Sierra Exportadora. 2013. Directorio 2013 cadena produc-
tiva de la quinua en el Perú. Lima, Peru. SNV - Servicio Holandés de Cooperación al Desarrollo.
2013. Análisis de la cadena de valor de la quinua en los distritos de Sapallanga y Sincos – Región Junin.
OIT - Oficina Internacional del Trabajo. 2015. Análisis de
la cadena de valor en el sector de la quinua en Peru: aprovechando las ganancias de un mercado creciente a
favor de los pobres. First edition. Ginebra Switzerland.
Tobar, J. 2010. Criterios de tipificación y caracterización de la Agricultura Familiar en El Salvador. Nota
Técnica No 5 FAO-AECID GCP/ELS/008/SPA.
Ton, G.; Bijman J. 2006. The role of producer organizations in the process of developing an
integrated supply chain; experiences from Quinoa
chain development in Bolivia. 7th International Conference on Management in AgriFood Chains and
Networks Ede The Netherlands 31 May – 2 June.
VLIR- UOS 2013. Manual de cultivo de la quinua. Second Edition. (Lima: Universidad Nacional Agraria La
Molina y CONCYTEC) 48.
W. Mercado & K. Ubillus / Scientia Agropecuaria 8 (3) 251 – 265 (2017)

-265-
Anex
Survey administered to quinoa marketers
Name: Districts of provenance: N°
A.
Type of agent
( ) Producer ( ) Transformer (new products)
( ) Collector ( ) Retailer
( ) Processor (post-harvest)
( ) Wholesaler
B.
What is the volume of quinoa you bought in the last campaign and/or year? ___Kg/year
( ) Certified ______ ( ) Conventional ______ ( ) Both___
C. What is the origin the volume and purchase price of quinoa?
Agent Region Province District Volume (kg) Price (soles/kg)
Total
D. What is the destination volume and sale price of quinoa?
Agent* Region Province District Volume (kg) Price (soles/kg)
Total
* Agroindustry processor export market (local/regional) and fairs
E. Which products are marketed (in %)?
Products %
Certification
Organic Sanitation Quality Others
At harvest
Flour
Flakes
Pearled
Washes
Others
F. What kind of activities do you undertake before selling quinoa?
Why?
YES NO
Washing
Selection
Packing
Storage
Transportation
Others
G. Are there purchase contracts or agreements? With whom?
YES NO
Collector
Producer
Wholesaler
Retail
Financial entity
H. Do you provide some kind of proof of payment for buying and selling? ( ) Yes ( ) No
W. Mercado & K. Ubillus / Scientia Agropecuaria 8 (3) 251 – 265 (2017)


![quinoa collateral 2010[1] · Quinoa m i n u t e s o r … o M i c r o w a v All Hail Quinoa the Super Crop! *Quinoa is a wonder grain that came from the Andean civilization. *Quinoa](https://img.dokumen.tips/doc/110x75/5ed18e675053201b4d5aaa35/quinoa-collateral-20101-quinoa-m-i-n-u-t-e-s-o-r-o-m-i-c-r-o-w-a-v-all-hail-quinoa.jpg)