Embed Size (px)
Citation preview

International Journal of Pure and Applied Science
Published by Cambridge Research and Publications
IJPAS ISSN-2743-6264 (Print) 226
Vol. 19 No.9
September, 2020.
CHARACTERIZATION OF OIL SHALE FROM
THE BIDA BASIN, USING TGA, TOC AND ROCK
EVAL PYROLYSIS.
DAVID DAKUP GEORGE; A. G. OLUGBENGA
Department of Chemical Engineering, Federal University of Technology,
Minna, Nigeria
ABSTRACT
The earth contains large amounts of hydrocarbons that are not contained in
what might be called conventional hydrocarbons. With increasing demand for
energy both domestically and industrially, a major challenge facing the world,
the society is driven to search for alternative energy sources. In this work, oil
shale samples were collected from the Bida formation of the Bida Basin, Niger
state, Nigeria. Analytical tools such as Rock Eval Pyrolysis, Total Organic
Carbon (TOC) and Thermographic Analysis (TGA) were used to characterize
the sample. From the Pyrolysis results, the Hydrogen Index (HI) was 45.71
mgHC/gTOC, the Production Index (PI), 0.42 and the Tmax, 342 OC. The TOC
was 1.40 wt%. From the TGA results, the activation energy of the oil shale was
calculated using the Arrhenius equation and found to be 48.40 KJ/Mol, while
the pre-exponential factor was 884.025 min-1. Consequently, the oil shale is
gas-prone and contains migratory hydrocarbons. Also, the content of organic
matter in the sample is good.
Keywords: Oil shale, TOC, Rock Eval Pyrolysis, TGA, Hydrocarbons.
INTRODUCTION
Increasing energy demand is one of the most important problems facing the
world. In addition to the search for new energy sources, energy demand is
driving society to search for more efficient energy conversion systems. Yang et
al., 2016. In these times of global market uncertainties and harsh economic
realities, the world needs energy in increasing quantity for both industrial and
domestic uses. With the world’s population growing rapidly, energy will go a
long way to support economic and social progress, and also build a better quality

International Journal of Pure and Applied Science
Published by Cambridge Research and Publications
IJPAS ISSN-2743-6264 (Print) 227
Vol. 19 No.9
September, 2020.
of life especially in developing countries (Imperial Oil Limited, 2019). Energy
is the key input in economic growth since it is essential in the process of various
production. The process of economic development requires the use of various
higher levels of energy consumption. Now, almost everything can be traced to
the use of one form of energy or another. Interestingly, more energy reaches the
earth from the sun (which is the most important source of energy) in an hour
than its use in a year. Aside from direct solar energy, the sun's energy manifests
in different ways such as in wind power, tidal power, fossil fuels, nuclear
energy, Natural gas and Petroleum, etc.
Petroleum is a naturally occurring liquid located beneath the Earth’s surface
which can be refined into fuel. Petroleum is a fossil fuel i.e. it has been created
by the decomposition of organic matter over millions of years ago. Its formation
is in sedimentary rocks under intense heat and pressure for so long. Petroleum
may be used as fuel to power vehicles, heating units and machines of all sorts,
as well as being converted into plastics and other materials (Tissot et al., 1984).
With conventional hydrocarbon reserves being rapidly utilized, a future in
which demand for conventional deposits exceed supply is apparently inevitable.
Wright et al., (2015). The alternative sources such as oil shale are available
globally which may breach the gap developing between remaining conventional
resources and demand. There are significant resources of oil shale in Nigeria
and the world at large, which if exploited in an environmentally safe manner,
would provide secure source of transportation fuels.
Oil shale deposits are found in virtually all world oil provinces because in most
cases, they are source rocks for conventional oil reservoirs, although most of
them are too deep to be exploited economically. There are more than 600 known
oil shale deposits around the world. Although resources of oil shale occur in
many countries, only 33 countries possess known deposits of possible economic
value (Youngquist, 1998). Nigerian is blessed with an abundance resource of
crude oil and its alternatives such oil shale, oil sand, tar, asphaltite, shale gas
which can be transformed to increase supply of energy. It has an oil shale
deposit of high economic value with the highest concentration in Imo (Okigwe)
and Abia states. Other African countries with oil shale include South Africa,
Egypt and Madagascar. The oil shale reserve in Nigeria remains untapped
because of the large deposit of the conventional oil wells (crude oil). Overland,
I. (2016). However, petroleum potentials of Nigeria have not been fully

International Journal of Pure and Applied Science
Published by Cambridge Research and Publications
IJPAS ISSN-2743-6264 (Print) 228
Vol. 19 No.9
September, 2020.
explored, especially hydrocarbon resources in the inland basins. The
underutilized basins include Anambra Basin, Benue Trough, Benin Basin, Bida
Basin, Borno Basin, Niger Delta Basin and Sokoto Basin (Geologin, 2012).
Therefore, there is the need to utilized the use of energy sources in order to meet
huge energy demand.
Oil shale is an organic-rich sedimentary rock that can be considered as a viable
source of alternative energy to conventional petroleum. The organic matter
enclosed in the oil shale is largely an insoluble solid matter referred to as
kerogen. Thermal degradation of the kerogen at a temperature in the range of
400-600 oC will volatilize from oil, gas and a solid residue of coke. The yield
of the oil during pyrolysis depends on the quantity or quality of the kerogen
contained in the oil shale and its evolution. Understanding the behavior of the
thermal degradation of the kerogen in oil shale and its geochemical features are
very vital for effective exploitation of this natural resource as alternative source
of energy.
Pyrolysis is a general technique used for the decomposition of complex organic
material at elevated temperatures in the absence of oxygen (or any halogens);
in such a way that low energy kerogen can be transformed into high energy
hydrocarbon (shale oil). Shale oil is close to oil crude when its composition is
being compared. It can be utilized as a fuel or feedstock for the production of
derivatives of oil and chemicals. However, shale oil usually contains olefinic
and polar heteroatomic compounds which makes it less attractive than the crude
oil. Consequently, further treatment to increase the content of desirable
compounds in shale oil may be necessary ( Lai et al 2016). The characterization
of organic matter for oil shale is a crucial step in the evaluation of hydrocarbon
potentials of oil shale. Therefore, this study provides insight into the
hydrocarbon potential oil shale sample from the Bida Basin, using TGA, TOC
and Rock-Eval Pyrolysis as the analytical tools.
THE MID-NIGER (BIDA) BASIN.
The Mid-Niger Basin otherwise known as the Bida Basin or the Nupe Basin is
a NW–SE trending intracratonic sedimentary basin extending from Kontagora
in Niger State of Nigeria to areas slightly beyond Lokoja in the south. It is
delimited inthe northeast and southwest by the basement complex while it
merges with Anambra and Sokoto basins in sedimentary fill comprising post

International Journal of Pure and Applied Science
Published by Cambridge Research and Publications
IJPAS ISSN-2743-6264 (Print) 229
Vol. 19 No.9
September, 2020.
orogenic molasse facies and a few thin unfolded marine sediments (Adeleye,
1974). The orogenic movements of southeastern Nigeria and the Benue valley,
nearby. The basin is a NW–SE trending embayment, perpendicular to the main
axis of the Benue Trough and the Niger Delta Basin (Fig. 2.1). It is frequently
regarded as the northwestern extension of the Anambra Basin, both of which
were major depocentres during the third major transgressive cycle of southern
Nigeria in Late Cretaceous times. Interpretations of Landsat images, borehole
logs, as well as geophysical data across the entire Mid-Niger Basin suggest that
the basin is bounded by a system of linear faults trending NW–SE (Kogbe et
al., 1983). Gravity studies also confirm central positive anomalies flanked by
negative anomalies as shown for the adjacent Benue Trough and typical of rift
structures (Ojo, 1984; Ojo and Ajakaiye, 1989).
Figure 1 Sedimentary Basins of Nigeria.
Previous studies on the geology of the Bida Basin were reported in Adeleye
(1973) and the micropaleontological studies of Jan du Chene et al. (1979) which
documented the palynomorph-foraminiferal associations including the

International Journal of Pure and Applied Science
Published by Cambridge Research and Publications
IJPAS ISSN-2743-6264 (Print) 230
Vol. 19 No.9
September, 2020.
interpretation of the paleoenvironments of the Lokoja and Patti Formations.
Akande et al. (2005) interpreted the paleoenvironments of the sedimentary
successions in the southern Bida Basin as ranging from continental to marginal
marine and marsh environments for the Cretaceous lithofacies. Whereas, the
origin of the oolitic ironstones in the Bida Basin has been a principal subject of
several workers (e.g. Adeleye,1973; Ladipo et al., 1994; Abimbola, 1997), only
few investigations have been made on the hydrocarbon prospectivity of the
basin.
Stratigraphic Framework
The stratigraphic succession of the Mid-Niger Basin, collectively referred to as
the Nupe Group (Adeleye, 1973) comprises a two fold Northern Bida Basin
(Sub-Basin) and Southern Bida Sub-Basin or Lokoja Sub-Basin. The Bida
Basin is assumed to be a northwesterly extension of the Anambra Basin
(Akande et al.,2005). The basin fill comprises a north west trending belt of
Upper Cretaceous sedimentary rocks that were deposited as a result of block
faulting, basement fragmentation, subsidence, rifting and drifting consequent to
the Cretaceous opening of the South Atlantic Ocean. Major horizontal (sinistral)
movements along the northeast–southwest axis of the adjacent Benue Trough
appear to have been translated to the norths-south and northwesterly trending
shear zones to form the Mid-Niger Basin perpendicular to the Benue Trough
(Benkhelil, 1989). Although the sedimentary fill of the Benue Trough consists
of three unconformity-bounded depositional successions (Petters, 1978), the
Bida and Anambra geographical regions were platforms until the Santonian.
Pre-Santonian sediments are recorded principally in the older Benue Trough
and parts of the southern Anambra Basin. The collapse of the Mid-Niger and
Anambra platforms led to the sedimentation of the Upper Cretaceous
depositional cycle commencing with the fully marine shales of the Campanian
Nkporo and Enugu Formations which may have some lateral equivalents in the
Lokoja Formation of the Bida Basin. Overlying the Nkporo Formation is the
sedimentary units of the Mamu Formation. These consist of shales, siltstones,
sandstones and coals of fluvio-deltaic to fluvio-estuarine environments whose
lateral equivalents are the conglomerates, cross-bedded and poorly sorted
sandstones and claystones of the Lokoja and Bida Formations in the Bida Basin.

International Journal of Pure and Applied Science
Published by Cambridge Research and Publications
IJPAS ISSN-2743-6264 (Print) 231
Vol. 19 No.9
September, 2020.
The Mamu Formation is succeeded by sandstones of the Lower Maastrichtian
Ajali Formation laterally equivalent to the Patti, Sakpe and Enagi Formations
of the Bida Basin. These sandstones are well sorted, quartz arenite that are
commonly interbedded with siltstones and clay stones and similar in part to the
lithologies of the Patti and Enagi Formations. The Patti and Enagi Formations
are overlain by the Agbaja and Batati Formations (lateral equivalents) of Upper
Maastrichtian age
(Fig. 2.2).
Figure 2 Stratigraphic successions in the Mid-Niger Basin (Also known as Bida
or Nupe Basin).
MATERIALS AND METHODS
Sample
The oil shale used in this study was collected from Lapai Local Government
Area of Niger State, Middle Belt, Nigeria. The sample was treated with
hydrochloric acid and rinsing with hot water to remove the potential
contamination from drilling mud and evaporative loss. The oil shale samples
were grounded to particle size <100 meshes and prepared following standard
procedure according to ASTM (ASTM D 2013-72).
Total Organic Carbon (TOC)
In every organic compound there is always the presence of carbon and the
composition of this carbon are usually kerogen, bitumen, and hydrocarbon

International Journal of Pure and Applied Science
Published by Cambridge Research and Publications
IJPAS ISSN-2743-6264 (Print) 232
Vol. 19 No.9
September, 2020.
(HC). Total Organic Carbon (TOC) content, is a very important parameter to
determine the quality of any source rock in a reservoir. Hence, TOC is a measure
of the organic carbon present in a unit weight of any source rock (Espitale et.
al.1980). determination of TOC is a rapid and inexpensive method of screening
for source rocks. The total organic carbon (TOC), was determined using
Walkley Method of organic Carbon in soil; conducted at the School of
Agriculture, Federal University of Technology, Minna, Nigeria.
Rock Eval Pyrolysis
The Rock Eval Pyrolysis involves the use of heat break down complex chemical
substances into simpler ones. It is a screening technique that gives indication of
generated or migratory hydrocarbons, source rock maturity, hydrocarbon source
potential and quality. This analysis was done in order to determine the
hydrocarbon generative potential of the organic matter, to determine the
maturity of the source rock (PI) and to evaluate the relative proportion of the
hydrocarbon (HI) in the samples. The samples are then introduced into the
LECO combustion oven and the amount of carbon is measured as
carbon(IV)oxide by Infra-Red Detector. The temperature-programmed applied
in pyrolysis mode is 3000C (3min) and 6500C (25min). HI and PI can be
deduced from the following expression in equation 1 and 2:
HI=S2×100/TOC 1
PI=S1/(S1+S2) 2
Where S1 represents the free or mobile hydrocarbons present in the source rock
sample that can be volatile with kerogen decomposition while S2 represents
bonded hydrocarbons that indicate the potential of the source rock.
Thermogravimetric Analysis
Thermal techniques are used to measure physical property as a function of
temperature program (heating, cooling or isothermal). Differential Thermal
Analysis (DTA) helps to find out the temperature at reactions take place in a
given sample while TGA essentially, measures mass loss. Thermal properties
and kinetics parameters such as activation energy and pre-exponential factor of
kerogen decomposition can be identified by the use of TGA. It is a useful tool
to obtain thermal characteristics of compounds by microscopic weight loss in
few milligrams of the sample at varied atmospheres and temperature conditions.

International Journal of Pure and Applied Science
Published by Cambridge Research and Publications
IJPAS ISSN-2743-6264 (Print) 233
Vol. 19 No.9
September, 2020.
The unit is often coupled with Mass spectrometer to determine the off gases
from the sample decomposition or oxidation which is measured as a function of
temperature.
RESULTS AND DISCUSSION
TOC/Rock Eval Pyrolysis
The TOC and Rock-Eval pyrolysis are applied to classify the organic matter in
a source rock into S1, S2 and S3 peaks. Table 4 represents the results from the
oil shale sample. Source Rock Analysis (SRA) also known as Rock Eval
Analysis is a quick and conventional technique used in the field of petroleum
exploration to assess different source rocks, their petroleum potential, maturity
and to characterize the degree of evolution of gas/oil, type of kerogen and
depositional environment.
Table 1 Rock-Eval Pyrolysis data of oil shale (hydrocarbon) from the Bida
Basin.
S1(mg/g) S2(mg/g) S3(mg/g) HI(mgHC/gTOC) Tmax(OC) PI TOC(wt %)
0.47 0.64 3.55 45.71 342 0.42 1.40
The Total Organic Carbon (TOC) obtained was 1.40 wt %. S1 represents the
quantity of free hydrocarbon present in the source rock sample that can be
volatile with kerogen decomposition which is 0.47. S2 represents the quantity
of hydrocarbons obtained through thermal cracking of nonvolatile organic
matter which is 0.64. S2, therefore, represents the existing potential of rock to
generate petroleum. The Tmax is the measure of the organic matter potential
and maturity. Tmax is equivalent to the temperature of the maximum production
of hydrocarbon during pyrolysis (S2 peak maximum). Tmax value relies on the
kerogen type. Tmax result of 342OC. It signifies immature to early mature stage.
Tmax further gives detail explanations of where does the maturity fall in
relation to oil generation window. It can either be immature for oil generation,
mature for oil generation or overmatured for oil generation.
HI: is the normalized hydrogen content. From the standard parameters for
generative potentials listed in Table 5, The hydrogen index (HI) of 45.71 mg
HC/gTOC indicates that the sample is prone to gas. Production index

International Journal of Pure and Applied Science
Published by Cambridge Research and Publications
IJPAS ISSN-2743-6264 (Print) 234
Vol. 19 No.9
September, 2020.
(PI=S1/(S1+S2) which defined the thermal maturity of the hydrocarbons. The
PI value of 0.42 in this study is above which signifies organic matter is matured.
Table 2 Petroleum potential (quantity) of an immature source rock (Peters and
Cassa, 1994)
Thermogravimetric Analysis
Figure 3 TGA for oil shale
Figure 3 shows the overall profile of weight loss in oil shale. The overall profile
can be divided into three stages: Weight loss due to moisture content/water
removal (stage I); Decomposition due to the presence of organic matter (stage
II); and Inorganic decomposition/weight loss due to minerals present (stage III).
The second stage, which is the most important of the three, takes place between
(280 & 520) OC. Furthermore, Stage II can be divided into two sub-stages i and
ii of weight loss. These two sub-stages occurring during pyrolysis process can
International Journal of Pure and Applied Science
Published by Cambridge Research and Publications
IJPAS ISSN-2743-6264 (Print) 235
Vol. 19 No.9
September, 2020.
be identified as bitumen and oil regimes. The first sub-stage decomposition
occurs generally until 350 °C and represents organic decomposition; where
degradation of kerogen produces bitumen. This stage produces gas, bitumen,
and carbon residue. In the second sub-stage the produced gas, bitumen, and
carbon residue de-volatilized further to produce oil, coke, and gas. This occurs
between 350 and 520 °C. Wei-Gang, & Wen-Li, 2010; Aijuan, Jingru, &
Shaohua, 2007.
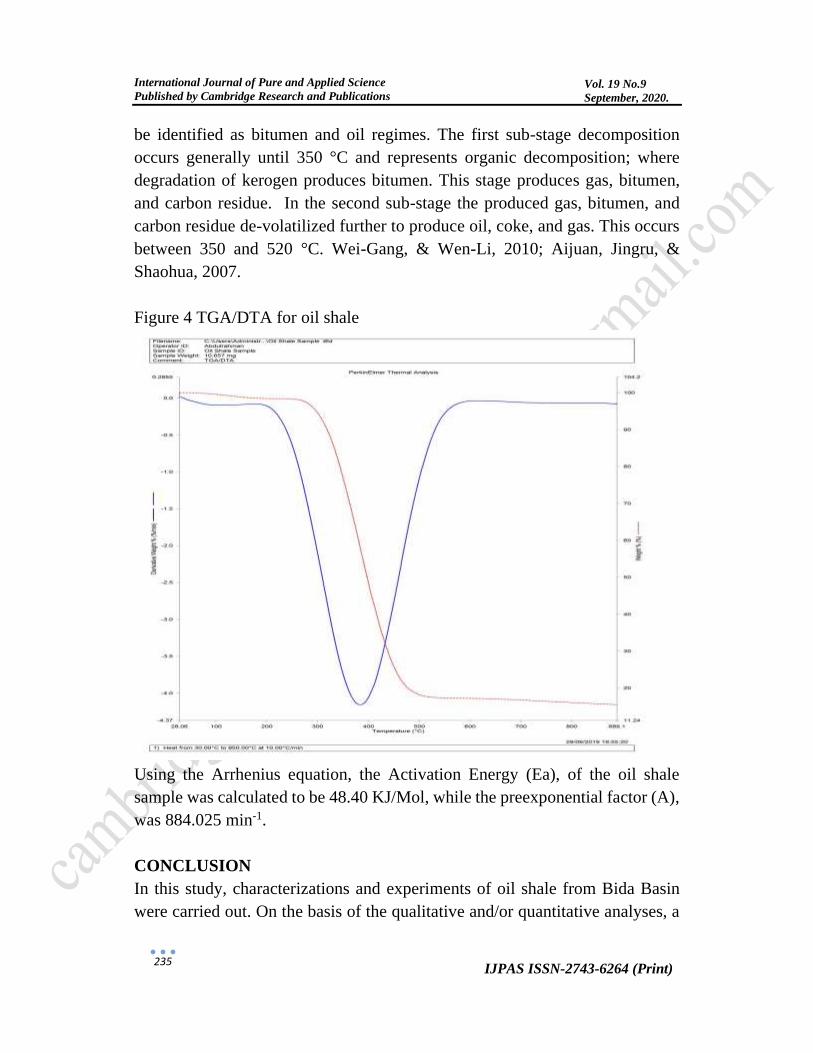
Figure 4 TGA/DTA for oil shale
Using the Arrhenius equation, the Activation Energy (Ea), of the oil shale
sample was calculated to be 48.40 KJ/Mol, while the preexponential factor (A),
was 884.025 min-1.
CONCLUSION
In this study, characterizations and experiments of oil shale from Bida Basin
were carried out. On the basis of the qualitative and/or quantitative analyses, a
International Journal of Pure and Applied Science
Published by Cambridge Research and Publications
IJPAS ISSN-2743-6264 (Print) 236
Vol. 19 No.9
September, 2020.
better understanding on the properties of the oil shale has been obtained. Some
of the main findings are summarized as follows.
The oil shale sample has a TOC value of 1.40 wt %. It has a Tmax of 342OC,
which gives an indication that the kerogen type is gas prone and shows a good
maturity.
The apparent activation energy and pre-exponential factor were determined to
be 48.40 KJ/mol and 884,025 min-1.
The TGA shows the temperature range where the products of the shale can be
obtained, between 280OC and 520OC.
REFERENCES
Wright, M. C., Court, R. W., Kafantaris, F. C. A., Spathopoulos, F., & Sephton, M. A. (2015).
A new rapid method for shale oil and shale gas assessment. Fuel, 153, 231-239.
Jiang, H., Song, L., Cheng, Z., Chen, J., Zhang, L., Zhang, M., ... & Li, J. (2015). Influence of
pyrolysis condition and transition metal salt on the product yield and characterization via
Huadian oil shale pyrolysis. Journal of analytical and applied pyrolysis, 112, 230-236.
Saif, T., Lin, Q., Bijeljic, B., & Blunt, M. J. (2017). Microstructural imaging and
characterization of oil shale before and after pyrolysis. Fuel, 197, 562-574.
Adekoya, J. A., Ola, P. S., & Olabode, S. O. (2014). Possible Bornu Basin Hydrocarbon
Habitat—A Review. International Journal of Geosciences, 5(09), 983.
Ola, P. S., Adekoya, J. A., & Olabode, S. O. (2017). Source Rock Evaluation in The Lake
Chad Area of the Bornu Basin, Nigeria. J Pet Environ Biotechnol, 8(346), 2.
NG, N. O. (2011). The Bida Basin in north-central Nigeria: sedimentology and petroleum
geology. Journal of Petroleum and Gas Exploration Research, 1(1).
Guo, H., Pei, Y., Wang, K., Cheng, Q., Ding, Y., Jin, Z., ... & Liu, Y. (2015). Identifying the
reaction mechanism of oil-shale self-heating retorting by thermal analysis techniques.
Fuel, 160, 255-264.
Lai, D., Zhang, G., & Xu, G. (2017). Characterization of oil shale pyrolysis by solid heat
carrier in moving bed with internals. Fuel Processing Technology, 158, 191-198.
Lee, K. J., Finsterle, S., & Moridis, G. J. (2018). Estimating the reaction parameters of oil
shale pyrolysis and oil shale grade using temperature transient analysis and inverse
modeling. Journal of Petroleum Science and Engineering, 165, 765-776.
Obaje, N. G., Wehner, H., Hamza, H., & Scheeder, G. (2004). New geochemical data from
the Nigerian sector of the Chad basin: implications on hydrocarbon prospectivity. Journal
of African Earth Sciences, 38(5), 477-487.
Yang, Q., Qian, Y., Kraslawski, A., Zhou, H., & Yang, S. (2016). Framework for advanced
exergoeconomic performance analysis and optimization of an oil shale retorting process.
Energy, 109, 62-76.
Zhou, H., Zeng, S., Yang, S., Xu, G., & Qian, Y. (2018). Modeling and analysis of oil shale
refinery process with the indirectly heated moving bed. Carbon Resources Conversion,
1(3), 260-265.
Oja, V., Yanchilin, A., Kan, T., & Strezov, V. (2015). Thermo-swelling behavior of Kukersite
oil shale. Journal of Thermal Analysis and Calorimetry, 119(2), 1163-1169.

International Journal of Pure and Applied Science
Published by Cambridge Research and Publications
IJPAS ISSN-2743-6264 (Print) 237
Vol. 19 No.9
September, 2020.
Overland, I. (2016). “Energy: The missing link in globalization”. Energy Research and Social
Science”. Vol. 14, 122-130.
M. J. Gavin, Oil shale: An Historical, Technical, and Economic Study (Sigaud Press, 2011).
P. E. Potter, J. B. Maynard and P. J. Depetris, Mud and Mudstones: Introduction and Overview
(Springer, 2005).
D. M. Jarvie, "Shale Resource Systems For Oil and Gas: Parts 1 and 2," in Shale Reservoirs:
Giant Resources for the 21st Century, ed. by J. A. Breyer (Am. Assn. Pet. Geologists,
2012), p. 69.
A. Andrews, "Development in Oil Shale," in Oil Shale Developments, ed. by I. S. Bussell
(Nova Science, 2009), p. 39.
Wu, K. et al., 2014. Pyrolysis characteristics and kinetics of aquatic biomass using the
thermogravimetric analyzer. Bioresour. Technol. 163, 18–25.
Idris, S.S. et al., 2010. Investigation on thermochemical behavior of low-rank Malaysian coal,
oil palm biomass, and their blends during pyrolysis via thermogravimetric analysis (TGA).
Bioresour. Technol. 101 (12), 4584–4592
Tissot BP, Welte DH. Petroleum formation and occurrence. 3rd ed. Heidelberg, Berlin, New
York: Springer- Verlag; 1978. p. 231.
Ballice L, Yuksel M, Saglam M, Reimert R, Schulz H (2002). “Classification of volatile
products evolved during temperatureprogrammed co-pyrolysis of Turkish oil shales with
low density polyethylene.” Fuel, 81: 1233-1240.
Encinar JM, Gonzalez JF (2008). “Pyrolysis of synthetic polymers and plastic wastes. Kinetic
study,” Fuel Process. Technol., 89: 678-686. Sorum L, Grønli MG, Hustad JE (2001)
“Pyrolysis characteristics and kinetics of municipal solid wastes,” Fuel, 80: 1217-1227.
![Benin and Western Nigeria Offshore Basins: A Stratigraphic ...offshore basin is correlated with the Nkporo Shale in the Anambra Basin by [13]. Therefore, the Npkoro shale, as it named](https://img.dokumen.tips/doc/110x75/5e6f81aaec5eee485975692f/benin-and-western-nigeria-offshore-basins-a-stratigraphic-offshore-basin-is.jpg)