Embed Size (px)
Citation preview

1
Desalination and Water Purification Research and Development Program Report No. 142
Characterization of Membrane Foulants in Seawater Reverse Osmosis Desalination
U.S. Department of the Interior Bureau of Reclamation July 2009

REPORT DOCUMENTATION PAGE Form Approved OMB No. 0704-0188
Public reporting burden for this collection of information is estimated to average 1 hour per response, including the time for reviewing instructions, searching existing data sources, gathering and maintaining the data needed, and completing and reviewing this collection of information. Send comments regarding this burden estimate or any other aspect of this collection of information, including suggestions for reducing this burden to Department of Defense, Washington Headquarters Services, Directorate for Information Operations and Reports (0704-0188), 1215 Jefferson Davis Highway, Suite 1204, Arlington, VA 22202-4302. Respondents should be aware that notwithstanding any other provision of law, no person shall be subject to any penalty for failing to comply with a collection of information if it does not display a currently valid OMB control number. PLEASE DO NOT RETURN YOUR FORM TO THE ABOVE ADDRESS.
T1. REPORT DATE (DD-MM-YYYY)T
June 23, 2008 T2. REPORT TYPE T
Final T3. DATES COVERED (From - To)T
2009 T4. TITLE AND SUBTITLE Characterization of Membrane Foulants in Seawater Reverse Osmosis Desalination
5a. CONTRACT NUMBER Agreement No. 05-FC-81-1169
5b. GRANT NUMBER
5c. PROGRAM ELEMENT NUMBER
6. AUTHOR(S) David A. Ladner Mark M. Clark.
5d. PROJECT NUMBER
5e. TASK NUMBER Task A
5f. WORK UNIT NUMBER
7. PERFORMING ORGANIZATION NAME(S) AND ADDRESS(ES) University of Illinois at Urbana-Champaign 204 North Mathews Avenue, Urbana, Illinois 61801
8. PERFORMING ORGANIZATION REPORT NUMBER
9. SPONSORING / MONITORING AGENCY NAME(S) AND ADDRESS(ES) U.S. Department of the Interior Bureau of Reclamation, Denver Federal Center PO Box 25007, Denver CO 80225-0007
10. SPONSOR/MONITOR’S ACRONYM(S)
11. SPONSOR/MONITOR’S REPORT NUMBER(S) DWPR Report No. 142
12. DISTRIBUTION / AVAILABILITY STATEMENT Report can be downloaded from Reclamation Web site: https://www.usbr.gov/research/dwpr/DWPR_Reports.html
13. SUPPLEMENTARY NOTES T
14. ABSTRACT (Maximum 200 words) This project studies fouling at the bench scale where well-controlled tests can elucidate fouling mechanisms and natural water samples can be used to identify the type of material responsible for fouling. A series of experiments was conducted in three phases for this project, based on the knowledge gleaned in the literature review and in discussions with operators, and in consultation with technical reviewers at the Bureau of Reclamation,. The first phase involved building and optimizing a bench-scale reverse osmosis unit for experiments. Several iterations were completed to determine the positive and negative aspects of different testing strategies. The second phase involved testing membrane fouling with natural and synthetic waters to determine the range of fouling potential that could be experienced in a bench-scale system. The third phase consisted of a set of experiments using cultured phytoplankton as the source of foulant material. 15. SUBJECT TERMS Reverse osmosis, membrane foulants, ultrafiltration, microfiltration, bench-scale system 16. SECURITY CLASSIFICATION OF: 17. LIMITATION
OF ABSTRACT SAR
18. NUMBER OF PAGES
102
19a. NAME OF RESPONSIBLE PERSONT
Katherine Guerra a. REPORT
U b. ABSTRACT
U c. THIS PAGE
U 19b. TELEPHONE NUMBER (include area code)
303-445-2013 SS Standard Form 298 (Rev. 8/98)
P Prescribed by ANSI Std. 239-18

3
Desalination and Water Purification Research and Development Program Report No. 142
Characterization of Membrane Foulants in Seawater Reverse Osmosis Desalination Prepared for the Bureau of Reclamation Under Agreement No. 05-FC-81-1169 Task A by David A. Ladner Mark. M. Clark

Mission Statements The U.S. Department of the Interior protects America’s natural resources and heritage, honors our cultures and tribal communities, and supplies the energy to power our future.
The mission of the Bureau of Reclamation is to manage, develop, and protect water and related resources in an environmentally and economically sound manner in the interest of the American public.
Disclaimer The views, analyses, recommendations, and conclusions in this report are those of the authors and do not represent official or unofficial policies or opinions of the U.S. Government, and the United States takes no position with regard to any findings, conclusions, or recommendations made. As such, mention of trade names or commercial products does not constitute their endorsement by the U.S. Government.
Acknowledgements
Aside from Bureau of Reclamation funding, the U.S. Environmental Protection Agency (EPA), Science to Achieve Results (STAR) program provided support in the form of a fellowship for David Ladner, Samer Adham, and Manish Kumar of Montgomery Watson Harza (MWH) (Pasadena, California) and facilitated shipment of San Diego seawater used throughout this project. Robert Cheng and Tai Tseng from Long Beach Water Department supplied the Long Beach, California, sample. Jess Brown and Chance Lauderdale from Carollo Engineers (Sarasota, Florida) collected the seawater sample containing red tide phytoplankton. Gary Kirkpatrick at the Mote Marine Laboratory (Sarasota, Florida) provided useful information about phytoplankton culture methods. Robert Andersen at the Provasoli-Guillard National Center for Culture of Marine Phytoplankton (West Boothbay Harbor, Maine) provided further cultural information. Timothy Selle of Dow-Filmtech provided the SW30HR membranes. Russ Steinhilber (Millipore, Billerica, Massachusetts) provided the ultrafiltration membranes. Derek Vardon (undergraduate researcher, University of Illinois at Urgana-Champaign [UIUC]) collected much of the laser-scanning cytometry data and aided with phytoplankton culturing. Helpful discussions with Kim Milferstedt, Adrienne Menitti, and Won-Young Ahn, graduate students in the Department of Civil and Environmental Engineering at UIUC, were also appreciated. Shaoying Qi, manager of the Environmental Engineering laboratory, is acknowledged for his constant efforts at maintaining equipment, providing training, ordering supplies, and keeping the facilities up and running.

Characterization of Membrane Foulants in Seawater Reverse Osmosis Desalination
i
ACRONYMS AND ABBREVIATIONS AOM algogenic organic matter ATR-FTIR attenuated total-reflectance, Fourier transform infrared BaIReMt the batch internal recycle membrane test BSA bovine serum albumin CaCl2∙2H2O calcium chloride dehydrate cm centimeter CO2 carbon dioxide DI deionized (water) DO dissolved oxygen DOC dissolved organic carbon DOM dissolved organic matter dpi dots per inch EPS extracellular polymeric substance ft2 square foot g/L grams per liter KBr potassium bromide KCl potassium chloride kDa kilodalton L liter Lmh liters per square meter per hour LSC laser-scanning cytometry LSF laser-scanning fluorometry MF microfiltration MFI Modified Fouling Index mg milligram MgCl2∙6H20 Magnesium chloride hexahydrate mg/L milligrams per liter mL milliliter mL/min milliliter per minute mm millimeter MPFI Mini Plugging Factor Index mS millisiemens mS/cm millisiemens per centimeter m/s meters per second

Characterization of Membrane Foulants in Seawater Reverse Osmosis Desalination MWH Montgomery Watson Harza NaCl sodium chloride NaHCO3 sodium bicarbonate Na2SO4 sodium sulfate nm nanometer NOM natural organic matter PES poly-ether-sulfone PMT photomultiplier tube ppm parts per million psi pounds per square inch psig pounds per square inch gauge Reclamation Bureau of Reclamation RO reverse osmosis SDI Silt Density Index SEM scanning electron microscopy SWRO seawater treated using reverse osmosis TOC total organic carbon UF ultrafiltration UV ultraviolet °C degrees Celsius ~ approximately µm micrometer µS micro Siemens % percent
Symbols °C degrees Celsius > greater than µm micron # number % percent ± plus or minus

Characterization of Membrane Foulants in Seawater Reverse Osmosis Desalination
i
Contents Executive Summary ................................................................................................ 1 Background ............................................................................................................. 1
Literature Review.............................................................................................. 1 Membrane Fouling ...................................................................................... 1 Phytoplankton Blooms and Membrane Fouling ......................................... 3
Project Scope .................................................................................................... 5 Phase One: Bench-scale Testing Optimization ....................................................... 7
Experimental Methods for Bench-Scale Optimization ................................... 11 Phase Two: Seeking Flux Decline ........................................................................ 23
Foulant Surrogates .......................................................................................... 23 Natural Waters ................................................................................................ 25
Long Beach Seawater ............................................................................... 25 Sarasota Seawater During a Phytoplankton Bloom .................................. 26 San Diego Seawater with Particulates ...................................................... 27
Long-Term Tests ............................................................................................. 28 Phase Three: Phytoplankton Fouling .................................................................... 33
Phytoplankton Culture .................................................................................... 33 Microfiltration and Ultrafiltration Experiments .............................................. 34 Reverse Osmosis Shear Experiments .............................................................. 36 Reverse Osmosis Experiments ........................................................................ 39 Fouled-Membrane Analysis ............................................................................ 40
Image Analysis.......................................................................................... 40 Scanning Electron Microscopy ................................................................. 45 ATR-FTIR................................................................................................. 47 4.5.4 Laser-Scanning Fluorometry ........................................................ 49 Protein Measurement ................................................................................ 50 Carbohydrate Measurement ...................................................................... 51 Total Organic Carbon Measurement ......................................................... 52
Conclusions ........................................................................................................... 55 Phase 1 Conclusions: Experimental Design Considerations .......................... 55 Phase 2 Conclusions: Optimization and Surrogate Foulants .......................... 58 Phase 3 Conclusions: Algogenic Organic Matter Fouling .............................. 59 Applicability to Full-Scale Desalination Facilities ......................................... 60
6. References ................................................................................................. 61
Characterization of Membrane Foulants in Seawater Reverse Osmosis Desalination
ii
Tables Table Page 1 Neutral solutes used for pore size distribution analysis ........................ 15 2 Compositions of synthetic brackish water ............................................ 17 3 FTIR peak descriptions ......................................................................... 19 4 FTIR peak descriptions ......................................................................... 19 5 Protein rejections of CA and copper-charged membranes ................... 23 6 Biofilm surface area coverage using Image J ....................................... 24 7 FTIR peak descriptions ......................................................................... 25 Figures Figure Page 1 Reaction scheme of the modification [92]. ........................................... 10 2 Biofoulant (P. fluorescens) growth curve. ............................................ 12 3 C. affinis observed with light microscopy at 5 days of incubation. ...... 12 4 Algae growth curve and the corresponding TEP concentration. .......... 13 5 TEP stained with alcian blue (20×). ...................................................... 13 6 Contact angle measurement. ................................................................. 14 7 Cross-flow experiment apparatus used for copper leaching studies. .... 16 8 Schematic of dead-end filtration cell [93]. ........................................... 17 9 Bioflim surface area coverage assessment using Image J.
(a) Biofouled membrane; (b) clean membrane; and (c) biofouled membrane. ................................................................... 18
10 FTIR spectra comparing pure CA membranes with CA-GMA membranes. ....................................................................................... 18
11 FTIR spectra comparing pure CA membranes with CA-GMA-IDA membranes. ............................................................. 19
12 SEM images of the treated membrane (left) and nontreated membranes (right). ............................................................................ 20
13 EDS images of the copper-charged membrane. .................................... 20 14 Contact angle of membranes. ................................................................ 21 15 Contact angle of membranes. ................................................................ 22 16 Cross-flow copper leaching results. ...................................................... 22 17 Permeation measurements with DI water (0–8 hours), BSA
(8–16 hours), and lipase (16–24 hours). ........................................... 23 18 Flux decline in 24-hour cross-flow filtration studies with
biofoulant. ......................................................................................... 24 19 Flux decline data with TEP (1 mg/L) in saline water
(35 g/L NaCl). ................................................................................... 25 20 FTIR spectra comparing clean membranes and fouled membranes. .... 26

Characterization of Membrane Foulants in Seawater Reverse Osmosis Desalination
iii
Appendices Appendix A Bacterial Growth Data B Fourier Transform Infrared Spectroscopy (FTIR) Peak Data C Flux Data


Characterization of Membrane Foulants in Seawater Reverse Osmosis Desalination
ES-1
EXECUTIVE SUMMARY Seawater treated using reverse osmosis is gaining momentum as a viable municipal drinking water source. Several pilot studies are underway or have been completed in the United States, and one full-scale facility is operational in Tampa Bay, Florida. Fouling that reduces membrane performance and increases operating cost is one of the key limitations to more widespread implementation of seawater reverse osmosis (SWRO). This project seeks to address fouling by studying the phenomenon at the bench scale, where well-controlled tests can elucidate fouling mechanisms and natural water samples can be used to identify the type of material responsible for fouling. The project has been performed in three phases. In Phase 1, the bench-scale SWRO unit was constructed and optimized. Several different testing strategies were evaluated to determine the advantages and disadvantages of the various configurations. These tests were performed with sodium chloride solutions, artificial seawater (containing a natural spectrum of salts), and a seawater source obtained from the northern coast of San Diego Bay, California. Experiments performed in Phase 1 considered such questions as:
• What volume of seawater is necessary to produce a fouling effect? • What length of testing time is required for a response? • What fluxes and salt rejection can be expected? • How can full-scale recovery be adequately simulated? • How should experiments be performed to provide sufficient repeatability?
As part of this phase, San Diego Bay seawater was fractionated via ultrafiltration with membranes of varying molecular-weight cutoff to test whether different size fractions of material had different fouling effects on SWRO membranes. Experiment results revealed the difficulty of evaluating reverse osmosis (RO) membrane fouling using short tests with small water samples. There was no appreciable difference among the different seawater molecular weight fractions. It was also of utmost importance to maintain a clean system, control operating parameters, and use appropriate modeling to truly evaluate changes in membrane performance. Phase 1 also presents an evaluation of modeling techniques. Phase 2 of the project involved testing the SWRO system with different source waters and foulant surrogates to determine if fouling could be evaluated effectively in more extreme or varied circumstances. Foulant surrogates (high concentrations of pure proteins and polysaccharides) were tested. Protein and polysaccharide samples resulted in drastic flux decline, as expected for such extreme conditions (concentrations of 265 milligrams per liter ([mg/L]). New source waters were also run, including a sample from Long Beach, California, and phytoplankton-laden seawater from Sarasota, Florida. The Long Beach sample did not appear to foul the RO membrane. The phytoplankton in the Sarasota
Characterization of Membrane Foulants in Seawater Reverse Osmosis Desalination
ES-2
seawater did make a significant difference, decreasing flux by a measurable level, but the loss of productivity was less than 20%. Further, longer-term tests spanning 4 days were completed. When San Diego water was run at high flux for four days, a general flux decline trend began to be noted. By the end of Phase 2, it became clear that a flux decline of roughly 20% was the most that could be expected in these bench-scale experiments—even for waters laden with high organic-matter concentrations. Since most natural waters have much lower concentrations, bench-scale tests must be carried out in a controlled manner to obtain high resolution and discern small values of flux decline. After finding that phytoplankton caused significant flux decline in the Sarasota experiment, it became interesting to further investigate the effects of phytoplankton. During Phase 3, phytoplankton were cultured in the laboratory, and a series of experiments was run to evaluate the RO performance. Cultures were spiked directly into seawater and RO performance was evaluated, resulting in significant flux decline (~20%) in 24 hours. A similar run with microfiltered phytoplankton also resulted in a fairly significant flux decline (~12%). With ultrafiltered phytoplankton, flux decline was much lower (~3%). These results show that algogenic organic matter can reduce flux significantly in RO. Also, there was a dramatic difference between ultrafiltration and microfiltration for pretreatment of phytoplankton-laden water sources. With Phase 3 experiments resulting in measurable and distinct fouling patterns, the groundwork was laid for an analysis of the fouled membranes in an attempt to correlate flux decline with other parameters. Images of the fouled membranes were evaluated with image processing techniques to measure the relative light absorbance of different fouling fractions. Foulant material was desorbed from the membranes, and polysaccharides were measured. These results were compared with polysaccharide and total organic carbon measurements for the tested waters. In a late development, it was discovered that the organic material in the foulant layer had fluorescent properties similar to the parent phytoplankton. A laser-scanning fluorometry (LSF) technique was used to measure the fluorescence. To the research team’s knowledge, this is the first time that such a technique has been used to evaluate membrane fouling. The major contribution of this research project to the field of SWRO desalination is the optimization of bench-scale testing protocols for use with natural seawater sources. Bench-scale testing is difficult because most natural waters do not exhibit dramatic flux decline trends during short-term tests. However, even when little flux decline is apparent, the amount of material deposited on the surface can be significant. Thus, flux decline alone is not a sufficient indicator of fouling. The membranes should be evaluated after the flux experiment to determine how much material has been deposited. Optical techniques like image analysis and LSF can be used, as well as wet-chemical techniques like polysaccharide measurement. In this way, several different parameters can be compared for each source water to get a broad understanding of the fouling potential.

Characterization of Membrane Foulants in Seawater Reverse Osmosis Desalination
1
BACKGROUND As populations increase and clean water becomes scarce, the United States, along with the rest of the world, is diversifying its portfolio of water resource options. One of these options is seawater desalination. As noted in the Desalination and Water Purification Technology Roadmap, one goal is to “accelerate the rate of improvement of current-generation desalination and water purification technologies, thus allowing these technologies to better meet the near-term needs of the nation” (Reclamation, 2003). This project focuses on improving the state of the art for one of the most viable current-generation technologies: seawater desalination via reverse osmosis (SWRO). An important issue facing SWRO is fouling of the membrane elements, resulting in a decline in productivity and higher cost. Literature has been explored to evaluate the current state of knowledge in SWRO membrane fouling. Literature Review Scientific literature related to the problem of SWRO fouling spans several arenas. On a fundamental level, it is important to evaluate what is known about fouling phenomena from well-controlled studies with surrogate foulants. A review of both low-pressure and high-pressure membrane studies has been undertaken, as the low-pressure literature can yield concepts that may be applicable to the high-pressure case. Due to the applied nature of the problem, it is also important to evaluate pilot and full-scale data. Much of the available data is in the form of qualitative observations and, certainly, the multitude of variables in pilot and full-scale work makes it hard to apply the observations at a general level; however, some common trends can be seen. The body of knowledge from oceanographic research is also useful. Studies of geochemical cycling and limnology have accomplished in characterizing marine organic matter. These studies can give insight into the type of organic matter one might expect as foulants. A specific area of oceanographic research that is explored has to do with phytoplankton blooms, or algal blooms, like the notorious “red tide” situations that often plague coastal areas. Their applicability to seawater desalination is quite important because many pilot projects have already experienced phytoplankton bloom events. Knowledge from oceanic research can give clues to the engineering community on how to prevent fouling by the organic matter from phytoplankton blooms. Membrane Fouling Membrane fouling depends heavily on the membrane material, with hydrophobic membranes generally fouling more readily than hydrophilic membranes (Laine et al., 1989; Jucker and Clark, 1994; and Howe and Clark, 2002). Membrane surface morphology is also important, as rough surfaces are sometimes more easily fouled than smooth surfaces (Elimelech et al., 1997). Low pH and high ionic strength can increase fouling, especially for extracted natural
Characterization of Membrane Foulants in Seawater Reverse Osmosis Desalination
2
organic matter (NOM) (Jucker and Clark, 1994 and Braghetta et al., 1998). All materials rejected by the membrane (including foulants) build up in the concentration polarization layer (DiGiano et al., 2000). When flux is increased, the balance of forces in the concentration polarization layer favors compaction of the foulant layer and increased concentrations; at some point, a “critical flux” may be reached. Beyond this critical flux, foulants interact more heavily with the membrane, often causing irreversible fouling (Zhu and Elimelech, 1997). It was found in some studies that calcium adsorbs together with humic acid (Jucker and Clark, 1994). Calcium appears to form a bridge between the membrane surface and the organic foulants. Aluminum and silica have been identified in surface water foulants (Howe and Clark, 2002). These results are consistent with previous research that claims that both inorganic and organic foulants should be studied simultaneously (Schafer et al., 2000). It is also becoming clear that foulants may fall into certain size or molecular weight ranges; in one lake water study, only a small fraction of dissolved organic matter (DOM), falling between 3 and 20 nanometers (nm) in size, fouled membranes (Howe and Clark, 2002).Foulant chemical structure is also important. Functional groups have been analyzed with Fourier transform infrared spectrometry (Lindau and Jonsson, 1994; Howe et al., 2002; and Her et al., 2004). Pyrolysis gas chromatography/mass spectroscopy has also been used to determine functional groups in bulk water samples (Bruchet et al., 1990 and van Heemst et al., 2000). The above-cited literature comprises a brief overview of fouling. Many of the studies were performed in fresh waters and with low-pressure microfiltration (MF) and ultrafiltration (UF) systems, and their significance in SWRO is not fully understood. For example, “cake-enhanced osmotic pressure” has been hypothesized for high-pressure systems (Hoek and Elimelech, 2003). In this “cake-enhanced osmotic pressure” model, the foulant layer does not allow salts to diffuse away from the membrane surface, hence increasing their concentration. Flux decline is considered to be caused by heightened osmotic pressure, rather than hydraulic resistance of the foulant layer. This fouling mechanism would not occur in low-pressure MF/UF membrane systems. Seawater fouling research clearly is needed. Fouling studies have mainly focused on water with extremely simplified chemistry. For instance, in Hoek and Elimelech’s (2003) study, monodisperse latex particles were used as model colloids. It is likely that their result will differ significantly from actual seawater fouling because seawater has a wide range of dissolved and colloidal organic material. Fouling by combined colloidal and dissolved materials has previously been shown to be different than fouling by either colloidal or dissolved material alone (Li and Elimelech, 2006). Most papers on seawater fouling are case studies, particularly from the Middle East (Butt et al., 1997; Abd El Aleem et al., 1998; and Dalvi et al., 2000). These studies are fairly qualitative in nature. Further work should be performed to determine the underlying causes of fouling that give rise to the qualitative observations.

Characterization of Membrane Foulants in Seawater Reverse Osmosis Desalination
3
To determine possible foulants present in seawater, oceanographic literature has been explored. Dissolved organic carbon (DOC) has been studied in detail (Harvey et al., 1983; Benner et al., 1992; Mccarthy et al., 1993; Vernon-Clark et al., 1995; Peltzer and Hayward, 1996; Aluwihare et al., 1997; and Ogawa and Tanoue, 2003). Researchers have determined that only 25 to 35% of DOC is of high enough molecular weight to be removed by UF (Aluwihare et al., 1997). Waters from around the world had similar patterns of organic matter composition. A large portion of seawater DOC is of low molecular weight and is largely uncharacterized. MF and UF pretreatment systems are often effective for mitigation of fouling in seawater RO (Wilf and Klinko, 1998; Drioli et al., 1999; Brehant et al., 2003; and Teng et al., 2003). UF membranes, especially, were able to remove many organic constituents released by phytoplanktonic organisms. However, in one study, even UF pretreatment did not prevent RO fouling at high flux (Glucina et al., 2000). It was assumed that the foulant was organic material small enough to pass through the UF membrane. From the oceanographic studies, it is known that there is certainly a large fraction of seawater DOC smaller than the molecular-weight cutoffs of UF membranes. A review of fouling indices and operational guidelines also has been performed. Membrane manufacturers often stipulate that source waters be pretreated to meet a specified Silt Density Index (SDI), a simple dead-end filtration test using an MF membrane. This provides a relative indication of fouling potential but gives no clear indication of fouling rate or long-term performance (Wilf and Klinko, 1998). Like the SDI, alternate methods such as the Modified Fouling Index (MFI) and the Mini Plugging Factor Index (MPFI) are based on batch microfiltration through a 0.45-micrometer (μm) microfilter, which is often insufficient to predict organic fouling (Yiantsios and Karabelas, 2003). The “UF-MFI” method employs an UF membrane, instead of a microfilter (Boerlage et al., 2003). While this may be a more adequate predictor of fouling potential, it is still based on particulate deposition and gives little or no indication of the effect of dissolved constituents. A better index for determining fouling potential is needed. This most likely will be based on one or a few water quality parameters characterizing the nature and size of DOM. Phytoplankton Blooms and Membrane Fouling From discussions with several pilot-plant operators and consultants, it is apparent that red tide algal bloom events are a common nuisance. When blooms occur, membranes are severely fouled, and pilot plants typically are taken off line for extensive membrane cleaning. Similar case studies have been reported in the literature (Petry et al., 2007 and Kim et al., 2007). One report systematically studied the effect of marine phytoplankton on membranes in reproducible laboratory experiments; but this evaluated only one type of MF membrane, and little organic characterization was attempted (Kim and Yoon, 2005). Another

Characterization of Membrane Foulants in Seawater Reverse Osmosis Desalination
4
paper sheds light on the importance of analyzing marine phytoplankton for optimal full-scale seawater desalination plant operation (Leparc et al., 2007). Dinoflagellate phytoplankton are often the culprits in algal bloom events. The dinoflagellate species, Lingulodinium polyedrum, has been the cause of massive red tide events in coastal California (Kahru and Mitchell, 1998 and Moorthi et al., 2006). In the Gulf of California, Dinophysis caudate and Alexandrium catenella have been identified (Lechuga-Deveze and Morquecho-Escamilla, 1998). Karenia brevis (previously known as Gymnodinium breve and Ptychodiscus brevis) is a dinoflagellate that causes toxic red tide blooms in coastal Florida (Kirkpatrick et al., 2004; Kirkpatrick et al., 2006). Heterocapsa pygmaea, Prorocentrum minimum, and many others have been identified (Johnsen et al., 1997; Trigueros and Orive, 2000; Heil et al., 2005; and Maso and Garces, 2006). Even in waters where blooms are rarely seen, like the San Francisco Bay, dinoflagellate species sometimes can find just the right water quality and weather conditions to make a cameo appearance (Cloern et al., 2005). Blooming dinoflagellates have a size range (10 to 30 µm) that easily passes through inlet screens. Their neutral buoyancy also makes settling chamber removal impractical, though certain types of coagulation/flocculation or floatation-based methods may be worth considering (Edzwald, 1993; Sengco et al., 2001; Sengco and Anderson, 2004; and Pierce et al., 2004). Dinoflagellates are easily rejected by MF and UF membranes, but a bloom with a high cell concentration (on the order of 105 cells per milliliter [mL]) will quickly form a thick cake layer and impede water passage. If cells are damaged, either through natural death cycles or through shear in the pumping system, they may release organic matter that passes through the pretreatment system to the RO membranes. That organic matter can possibly foul the RO membrane and/or serve as substrate for bacterial species that cause biofouling. As an algal bloom life cycle peaks and decays, a significant amount of organic material is released upon cell death (Whipple et al., 2005). Also, bacteria feed on the decaying material and release their own extracellular polymeric substance (EPS) that has the potential to foul pretreatment and RO membranes (Rosenberger et al., 2006). It is possible that the material from decomposition could have a greater impact on membrane fouling than the algal cells themselves. Currently, researchers and plant operators do not have a good understanding as to whether RO fouling is due to organic matter or biomass. Fouled membranes were autopsied and analyzed in the Marin Municipal Water District pilot plant study completed in 2006 (Reynolds, 2007). Bacteria and organic matter consisting of carbohydrates and proteins were identified in the fouling layer; however, the researchers were unable to determine how much of the organic matter originated in the seawater and how much was produced in the biofilm.

Characterization of Membrane Foulants in Seawater Reverse Osmosis Desalination
5
Project Scope Based on the knowledge gleaned in the literature review, in discussions with operators, and in consultation with technical reviewers at the Bureau of Reclamation (Reclamation), a series of experiments was conducted in three phases for this project. Phase 1 involved building and optimizing a bench-scale RO unit for experiments. Several iterations were completed to determine the positive and negative aspects of different testing strategies. Phase 2 involved testing membrane fouling with natural and synthetic waters to determine the range of fouling potential that could be experienced in a bench-scale system. Phase 3 consisted of a set of experiments using cultured phytoplankton as the source of foulant material. Each project phase is treated separately in the following three sections.


Characterization of Membrane Foulants in Seawater Reverse Osmosis Desalination
7
PHASE ONE: BENCH-SCALE TESTING OPTIMIZATION
Hardware and Setup The bench-scale RO unit was designed according to the diagram shown in Figure 1. The key components were the membrane test cell, pump, motor, pressure gauges, temperature control unit, valve, balance, and data acquisition equipment. Appendix A contains equipment specifications. Note that Figure 1 displays the final design of the RO unit as it was used to perform the experiments in Phase Three of the project. During the first two phases, several different configurations were used in an attempt to optimize the system; each configuration will be described where appropriate.
Figure 1. Diagram of the bench-scale SWRO membrane testing unit. Diamond symbols indicate electronic interface between the computer and components. Automated data acquisition locations are shown for feed conductivity (Cf), feed pressure (Pf), permeate flow rate (Qp), and permeate mass (Mp). Automated control of the high-pressure pump and, thereby, the feed flow rate (Qf) is also indicated. The membrane test cell was designed to simulate spiral-wound modules used in industrial RO applications. Wetted parts of the cell were 316 stainless steel, as were the tubing and wetted parts of the high-pressure pump. This grade of steel was necessary because of the high corrosion propensity of seawater. The only

Characterization of Membrane Foulants in Seawater Reverse Osmosis Desalination
8
components not comprised of 316 stainless steel were two flexible tubes (Tygon) used for the inlet to the pump and the outlet of the temperature control heat exchanger. The motor chosen was a 2-horsepower, variable frequency drive motor capable of 20:1 turndown at constant torque. It is an inverter-duty motor, meaning the insulation is sufficient to prevent failure as the motor temperature rises under low-frequency conditions. For motor control, a phase inverter was used. The inverter was configured for control using a 0- to 10-volt signal from the computer. It was found that a metering valve (designed specifically for pressure control at constant flow rate) was far easier to use than the needle valve (designed for flow control) that was originally installed. Though it may seem that valve selection is a trivial matter, proper valve selection is quite important for providing pressure control at the low flow rates used. Careful consideration and consultation with manufacturers are suggested for those wishing to duplicate similar bench-scale experiments in the future. For measurement of permeate flow rate, a flow meter with a voltage signal output was configured and installed. However, the flow meter proved to be somewhat unreliable because of interference from bubbles and drift over time. To ensure
proper flux measurement, a second method was used for calibration: the permeate was collected in a beaker held by a balance. Balance measurements were collected through an RS232 connection with the computer. For the bulk of experiments, flow meter data were taken continuously, and permeate was collected intermittently to check the calibration. The beaker had to be emptied manually back into the feed tank when recycle was needed. However, in later experiments, a simple system was set up to continually collect measurements by the balance without needing to manually empty the beaker. The beaker was replaced by a simple self-emptying collection vessel on top of the balance. The vessel was made with a 50-mL centrifuge tube and Tygon tubing, as depicted in Figure 2.
Figure 2. Schematic of permeate collection vessel and attached tubing. This setup was mounted on a balance for continuous permeate flow measurements. Permeate collects in the vessel until the fluid level reaches the dotted line. Flow commences through the tube and completely drains due to siphoning.
Characterization of Membrane Foulants in Seawater Reverse Osmosis Desalination
9
Permeate collected in the vessel until the level rose above the maximum tube height. At this point, it began to drain, and a siphon was formed, forcing complete drainage of the vessel. The vessel was mounted on the balance above the feed tank so permeate flowed by gravity into the tank. This resulted in quite accurate flow measurements over long periods of time without the noise that operator involvement created in initial experiments. Temperature control was provided by a heat exchanger made in the laboratory. Ten feet of stainless steel tubing was coiled and connected to the concentrate outlet of the membrane cell. The coil was immersed in a water bath, and water was recirculated through a temperature control unit. This method differs from what is often used in membrane applications; typically, coils are placed in the feed tank to maintain constant feed water temperature. Here, the concentrate line is cooled before it returns to the feed tank. This method was chosen because, in some testing schemes, the concentrate was recycled through a break tank with a very small volume that would not allow temperature coils. Also, various feed tanks and break tank designs were explored. If the temperatures were controlled via coils, a new coil system design would be required for each setup. By cooling the concentrate line, however, the temperature control was independent of the tank arrangement. To ensure that the temperature control was adequate, the temperature of the feed to the pump was monitored. Data acquisition and pump control equipment consisted of a personal computer with a data acquisition card capable of analog input and output. Inputs and outputs were routed through a shielded in/out connector block to and from the data acquisition card. LabView 7.0 software was used for programming and signal interpretation. Over the course of the experiments, several software upgrades were implemented. The final version featured continuous monitoring of feed conductivity, feed pressure, permeate flow rate from the flow meter, and permeate mass measurements from the balance. Pump speed was set by the user and controlled by Labview. In early experiments, the occurrence of pressure spikes, due to small particles clogging the concentrate valve, was a problem. The system had to be monitored continuously to avoid overpressurization that could damage the membrane, pump, or other components. A control scheme was incorporated into the Labview program so that, when a pressure spike was encountered, the computer decreased the pump speed to maintain the target pressure. When the blockage cleared (and pressure dropped), the computer ramped the pump gently back to its original speed. This was not a totally desirable control scheme because the crossflow velocity changed with pump speed, but it was better than the alternative of continuous monitoring, especially when experiments covering several days were desired. Data were automatically recorded every 100 milliseconds. After 10 seconds of collection, the values for conductivity, pressure, and permeate flow rate were

Characterization of Membrane Foulants in Seawater Reverse Osmosis Desalination
10
averaged and saved to a file. This method reduced the noise inherent in the voltage signals and removed oscillation in pressure readings due to the pump. The values of permeate mass (RS232), permeate conductivity (manual entry), and temperature (manual entry) did not have such noise, so the current value at each 10-second interval was stored. With 10-second sampling intervals and run times up to 4 days, a large amount of data was collected for each run. The data had to be processed further to derive meaningful information. To process the data in a timely fashion, scripts were written in the Matlab programming language. Scripts could be run at any point during an experiment to monitor performance. The most computationally demanding calculation was to derive flux from permeate mass measurements. It was simple to calculate the rate of change by subtracting one mass value from the next, but the data did not increase continuously because the permeate vessel emptied regularly or the user switched the collection vessel at times. Matlab scripts found the locations of data discontinuity and only calculated flux for the clean portions of the data set. Also, noise was introduced when only two mass values were used for each flux calculation. Instead, the scripts cut the clean data into subsets that spanned several minutes and fit a line through the data to calculate its slope and, thus, the flow rate. Specific flux was calculated by using such techniques and incorporating the other data that were collected. Charts were generated automatically with each script call. These methods were much simpler and streamlined compared to data analysis and plotting performed with spreadsheet software. Appendix B provides the Matlab scripts and Labview visual programming images. The RO membranes used throughout this study were Dow-Filmtec SW30HR; all cut from the same roll. The dry roll was wrapped in plastic and stored in a dark laboratory. Some membrane coupons were cut from the dry roll, placed directly in the membrane cell, and then equilibrated before experiments. Other membrane coupons were cut and placed in deionized (DI) water, then stored at 4 degrees Celsius (˚C), and DI water was replaced regularly. Experiments with dry membranes, compared to wet membranes, showed no noticeable differences during the compaction step that preceded each experiment. All seawater used during Phase One of the project was obtained from one shipment of San Diego seawater collected by project consultants at Montgomery Watson Harza (MWH) (Pasadena, California). Four 200-liter low-density polyethylene (LDPE) barrels were collected and shipped via refrigerated carrier. The barrels were stored in a walk-in refrigerator at 4 ˚C. Other samples, which were collected for later project phases from Long Beach, California, and Sarasota, Florida, were shipped overnight in 20-liter LDPE collapsible containers and cooled with ice packs in an ice chest. These samples were also stored in the walk-in refrigerator until use.

Characterization of Membrane Foulants in Seawater Reverse Osmosis Desalination
11
Experimental Methods for Bench-Scale Optimization The overall goal of the bench-scale membrane tests for this project was to evaluate fouling by natural waters under conditions similar to those found in full-scale desalination processes. One testing protocol found in the literature seemed to hold promise for accomplishing this goal—the batch internal recycle membrane test (BaIReMT) (DiGiano et al., 2000 and Kumar et al., 2006). The main advantage of the BaIReMT was that full-scale recovery could be simulated. Full-scale recovery, defined as the amount of clean water obtained per amount of seawater treated, would be 30 to 50%. This is achieved with a process train of several RO elements, each recovering a small percentage to make up the total. Bench-scale systems typically do not achieve such recovery because of the small membrane area. When high recovery is achieved at bench scale, the crossflow velocity must be set quite low—much lower than the full-scale system. The BaIReMT achieves a simulated high recovery with a realistic crossflow rate by recycling the concentrate and permeate streams in a well-defined way (described below). Early efforts in protocol optimization sought to implement the BaIReMT in a stable and reproducible manner. Limitations of the BaIReMT were discovered, and alternate testing methods were employed. The optimization work resulted in several testing protocols that could be used, depending on the requirements of a given experiment. The details of each protocol, the results of experiments performed, and the positive and negative points of their implementation are explored below. Figure 3 shows the basic schematic of the BaIReMT. This conceptual model is quite simple, but several key elements had to be incorporated in the design to make the RO unit function at the appropriate flow rates and pressures to mimic a full-scale RO system. Recovery (defined as the volume of clean water produced per volume feed water entering the system) is the most important full-scale parameter to mimic. Higher recovery means a higher salt and foulant concentration in the concentrate stream; therefore, to mimic full-scale recovery, the bench-scale system must be set up so that the membrane feed runs at the appropriate concentration (Cmf), which will always be higher than the feed tank concentration (Cf). A mathematical model of the system was developed and incorporated into a Microsoft Excel spreadsheet (see appendix C). The model allowed the user to specify the full-scale recovery to mimic, along with other known operating parameters. The model output contained the predicted steady-state flow rates and concentrations.

Characterization of Membrane Foulants in Seawater Reverse Osmosis Desalination
12
Figure 3. Batch internal recycle membrane test schematic. Flow rates are designated Q and concentrations are designated C. Subscripts indicate feed (f), membrane feed (mf) concentrate (c), internal recycle (ir), waste (w), and permeate (p). The feed tank volume is Vf.
Modeling revealed that the amount of concentrate wasted back to the feed tank (Qw) was very small; to model 50% recovery, Qw was only 4.04 milliliters per minute (mL/min). Further, the waste flow rate was quite dependent on the recovery; decreasing recovery to 30% only increased Qw to 9.81 mL/min. Compared to an anticipated crossflow rate (Qc) of 1,300 mL/min, tweaking a valve to accurately deliver a waste flow of 9.81 mL/min was a difficult proposition. In the modeling, it was also noted that the feed flow (Qf) would be quite small because it would be equal to the small waste flow (Qw) plus the small permeate flow (Qp; 4.59 mL/min for the flux desired). Another hindrance to BaIReMT implementation was the high-pressure pump requirement. The setup would require that the pump be operated in almost a closed-loop system, where the outlet is returned directly to the inlet. This is dangerous because a slight disturbance would cause the inlet flow rate to drop below the outlet flow rate, starving the pump and causing cavitation. It was more desirable to have an open reservoir under positive pressure at the pump inlet. The solution to the problem was to incorporate a break tank into the design. The break tank was placed in route of the internal recycle line (see Figure 4). The high-pressure pump was fed directly from the break tank, which was open to the atmosphere. The concentrate stream (Qc) flowed to the break tank after being cooled. The break tank effectively opened the loop, helping to mitigate pump starvation problems. To solve the problem of low waste flow rate (Qw) a peristaltic pump was incorporated that was capable of such flow rates. The peristaltic pump fed Qw from the break tank to the feed tank. Note that Qw theoretically should have come directly from the concentrate line, but the break tank was more accessible. This
Vf Cf
Qf Qmf Cmf
Qc Cc
Qir Cc
Qw Cc
Cf
Qp Cp

Characterization of Membrane Foulants in Seawater Reverse Osmosis Desalination
13
was justified because the break tank composition was effectively the same as the concentrate line, because the feed flow rate (Qf) was small, the concentrate line flow rate (Qc) was large, and the break tank was well mixed.
Figure 4. Bench-scale RO unit setup for BaIReMT. To adequately control the feed flow rate (Qf), the feed tank was elevated, and the tubing that carried water from the feed tank to the break tank was open to the atmosphere at the water level in the feed tank. In this way, feed water was gravity fed to the break tank; therefore, the feed flow (Qf) was always equal to the waste flow (Qw), plus the permeate flow (Qp), even though these flows were very small. The steady-state BaIReMT model was used to calculate flow rates and concentrations needed to achieve the desired system recovery. Further modeling using Matlab (see appendix C) allowed evaluation of the dynamic state at startup of the BaIReMT run. The variable of interest was the break tank concentration, which was also the concentrate stream concentration under the completely mixed tank assumption. After solving mass balances for the system, the concentrate concentration could be modeled as in Equation 1, with parameters defined in Equations 2 and 3:
)exp(, tCC obtbt ⋅−
−+= α
αβ
αβ (1)

Characterization of Membrane Foulants in Seawater Reverse Osmosis Desalination
14
( )( )
bt
mff
fbtpmf
c
cw
V
QVQV
rejQQQ
QQ−−−+
−
=1
α (2)
fbt
totf
VVMQ
=β (3)
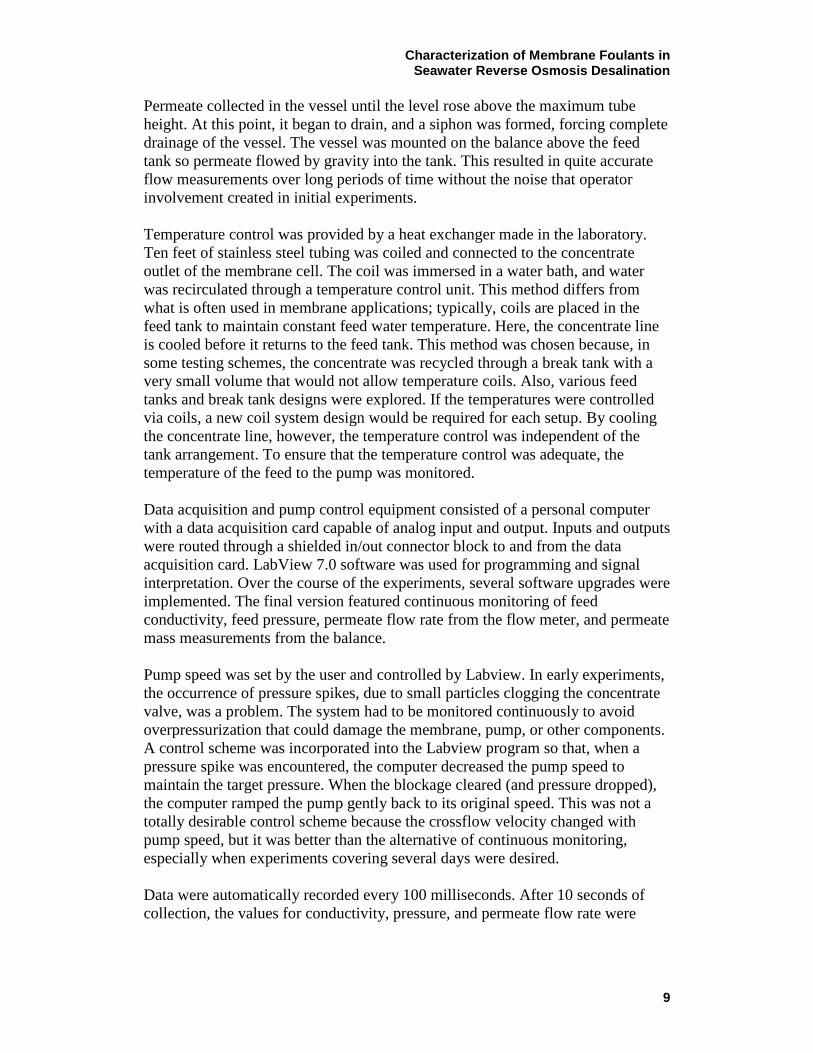
In equations 2 and 3, the measured parameters from which α and β were derived were flow rate (Q), volume (V), membrane rejection (rej), and total solute mass (Mtot). Subscripts indicate break tank (bt), concentrate (c), feed tank and feed line (f), waste line back to feed tank (w), membrane feed (mf), and permeate line (p). The α parameter has units of inverse time, so it is the time constant of the BaIReMT setup. If the permeate flow rate or the waste flow rate are increased (thereby increasing the feed flow rate), α will increase; and the system will reach equilibrium more quickly. If the membrane feed flow rate (and, thereby, the concentrate flow rate) is decreased, or if the break tank volume is increased, α will decrease, and more time will be required for equilibration. The β parameter has units of concentration per time and incorporates the total solute mass in the system. It can be thought of as the mass flow constant, analogous to a mass transfer coefficient. The steady state break tank concentration is determined by β over α. BaIReMT model parameters were measured during a run with sodium chloride (NaCl) as the solute. Modeling using measured parameters is shown by the red line in Figure 5. The model overshoots the data in this case. However, when α and β are found through a fit to the data using Equation 1, the model follows the data quite nicely. From this, it is assumed that the model is in the correct form. Additionally, if the parameters are more accurately measured, salt concentration can be predicted a priori for experimental runs. It should be noted that foulant concentration also could be predicted, with the adjustment of the rej parameter to the appropriate foulant rejection value for the membrane (probably very close to 1).
Characterization of Membrane Foulants in Seawater Reverse Osmosis Desalination
15
Figure 5. Concentrate NaCl concentration over the course of a 24-hour BaIReMT Correct interpretation of flux data is an important part of implementing the BaIReMT procedure. Because the salt concentration increases over the course of the run, the feed-side osmotic pressure will increase and flux will decrease. This can be seen in the simple Equation 4: ( )π∆−∆= PAJ (4) where J is the permeate flux, A is the apparent water permeability of the membrane, ΔP is the applied transmembrane pressure, and Δπ is the transmembrane osmotic pressure. The osmotic pressure for the feed and permeate depends on the respective solute concentrations in Equation 5. )( pwos CCf −=∆π (5) Here, fos is a term relating the solute concentration to the osmotic pressure, Cw is the concentration of solute at the membrane wall, and Cp is the solute concentration in the permeate. For converting conductivity to salt concentration, two relations were used, as derived by linear interpolation between table values for NaCl at 25 °C, as given by the manufacturer of the conductivity standards used (Oakton, Vernon Hills, Illinois). Equation 6 is for converting concentrate conductivity (σc in units of milliSiemens per centimeter [mS/cm]) to concentrate salt concentration (Cc in units of mg/L or parts per million [ppm]). This relationship is appropriate for conductivities between 15 and 80 mS/cm.

Characterization of Membrane Foulants in Seawater Reverse Osmosis Desalination
16
Equation 7 is for converting permeate conductivity (σp in units of mS/cm) to permeate salt concentration (Cp in units of mg/L or ppm). This relationship is appropriate for conductivities between 0.084 and 2.764 mS/cm: 664.62 - 613.1⋅= ccC σ (6) 15.299 - 512.1⋅= ppC σ (7) Clearly, seawater does not contain only sodium and chloride, but NaCl dominates the seawater composition, so the relationship should be close. In practice, NaCl and seawater solutions at the same conductivity have very similarly fluxes in RO tests, indicating that the solutions chemistries are comparable. To convert salt concentration to osmotic pressure for both the feed and permeate, the salt concentration in milligrams per liter (mg/L) was multiplied by 11.5, giving the osmotic pressure in pounds per square inch (psi). By comparison with literature data (Tribus et al., 1959), this may overestimate the osmotic pressure by about 15%. In most of the flux data in this final report, the osmotic pressure conversion factor does not affect the results. However, for future studies, it is recommended that the Tribus data or other sources be used to obtain an empirical relationship between dissolved solids and osmotic pressure. To correctly determine the flux decline due to fouling, the flux decline due to heightened osmotic pressure must be correctly modeled. In early experiments, modeling was done with a simple equation (Equation 8) to calculate the specific flux (Js), or the flux per unit driving force, where Jm is the measured flux:
π∆−∆
=P
JJ m
s (8)
The transmembrane osmotic pressure was calculated using the measured permeate concentration (Cp). It is not possible to measure the actual wall concentration (Cw) on the feed side of the membrane, so the bulk concentration was inserted for Cw. This method was used in a recent paper where flux decline was reported for seawater tested with the BaIReMT setup (Kumar et al., 2006). However, early in this project, it became clear that the method of calculating specific flux was flawed; when evaluating specific flux, a trend was clearly seen where specific flux declined linearly with increasing salt concentration. The relationship held in all experiments. Though the relationship was linear, it was hard to predict for changing pressures and local flux measurements. A detailed modeling effort was needed to properly account for the changing conditions over the course of the run, especially as pressure increased. Further, the membrane parameters could vary from coupon to coupon and skew the modeling results. To avoid relying solely on modeling to determine the extent of fouling, control experiments were performed immediately before each flux-decline experiment. In the control run, the salt

Characterization of Membrane Foulants in Seawater Reverse Osmosis Desalination
17
concentration changed in the same manner as in the fouling run; thus, if flux declined due to salt concentration effects, the same result could be expected in the fouling run. Several BaIReMT runs were performed, with the goal of adequately characterizing the system and developing appropriate methods for repeatability. It was possible to achieve a reasonable level of repeatability from one run to another, as shown in the conductivity data for the last two BaIReMT runs during Phase One of the project (Figure 7).The two runs performed similarly, demonstrating a reasonable level of repeatability for the BaIReMT procedure. However, the downward trend from 5 to 24 hours, and the dip in conductivity data between 12 and 18 for the San Diego run hours, show the variability that can result during the BaIReMT procedure. In these BaIReMT experiments, the operator manually observed the data and ensured that proper flux and conductivity were being achieved. Such manual control was necessary for the initial 3 or 4 hours of the experiments. After that point, the system was assumed to be running at steady state and was left on its own. It is apparent in Figure 7, however, that feed conductivity had an overall declining trend after 4 hours and that upsets did occur. The conductivity declined because one of the system’s settings was slightly out of the required set point. For instance, the very small waste flow rate (Qw) from the peristaltic pump could have been slightly increased; if it was off by only a fraction of 1 mL/min, the steady state concentration would be different from what was expected. Other parameters like permeate salt concentration, temperature, and flux also could have varied over time. Because constant vigilance is impractical and undesirable for long runs, other methods were sought to minimize the variability. The main advantage of the BaIReMT setup was that the feed salt concentration was elevated to mimic full-scale recovery. It was noted, however, that there was a period of time during the initial few hours of the test when the salt concentration increased to reach the desired set point. Instead of using the complex setup of the BaIReMT procedure, with a break tank and a peristaltic pump, a new procedure was devised where a single, small feed tank was used with no break tank. The permeate was wasted for a period of time until the feed tank concentration increased to the desired level. The permeate tube was then fed back to the feed
Figure 6. Concentrate (break-tank) conductivity measurements during two BaIReMT runs: a compaction run with only NaCl and a run of San Diego seawater.

Characterization of Membrane Foulants in Seawater Reverse Osmosis Desalination
18
tank for full recycle operation. With that setup, the break tank concentration was sure to remain constant, assuming no leaks, evaporation, or other upsets. This would also allow for steady runs where fouling effects would be less varied. Further, it would provide a more stable system that would require a minimal amount of modeling to interpret the data. Further, flux measurements could be made more readily; when the permeate was wasted continuously, the operator only needed to switch beakers occasionally. This procedure is not given an acronym designation; it is simply called a transient recovery test (Figure 7).
Figure 7. Schematics of flows for transient recovery membrane tests: (a) The initial phase is run with permeate being wasted from the system to increase the tank feed tank concentration. (b) After the desired concentration is reached, the permeate is fed back to the feed tank for a full recycle operation. As in Figure 3, flow rates are designated Q and concentrations are designated C. Subscripts indicate feed (f), membrane feed (mf) concentrate (c), internal recycle (ir), waste (w), and permeate (p). The feed tank volume is Vf. Figure 8 elucidates the major benefit of the transient recovery test procedure. Several BaIReMT runs are shown at the left, while transient recovery runs are plotted at right. In the BaIReMT procedure, total dissolved solids (which are linearly dependant on conductivity) varied greatly, and steady state was difficult to maintain. However, for transient recovery runs, the conductivity increased linearly and maintained a relatively constant value after the target concentration was attained and permeate was returned to the feed tank. Note, however, that the transient recovery procedure was highly dependant on tank volume. If tank volume was doubled, the time required to reach steady state would also double. For the BaIReMT, however, the unsteady period depends only on the break tank volume. As long as the break tank remains the same, the unsteady period remains the same, even with a large feed tank. Because the samples at this point in the project used small volumes, the transient recovery test was optimal.
Vf Cf
Qf
Qc Cc
Cf
Qp Cp
Vf Cf
Qf
Qc Cc
Cf Qp Cp
a. b.

Characterization of Membrane Foulants in Seawater Reverse Osmosis Desalination
19
Figure 8. Comparison of feed conductivity for several BaIReMT experiments (left) and several experiments with a transient recovery protocol (right). The transient recovery protocol allowed much greater control and repeatability of salt concentrations. A series of tests was performed to evaluate fouling by different fractions of material in San Diego seawater. Seawater was fractionated into different size classes using three UF membranes: 20-kilodalton (kDa) poly-ether-sulfone (PES), 30-kDa regenerated cellulose (RC), and 100-kDa RC (all membranes from Millipore, Billerica, Massachusetts). Each flat-sheet membrane coupon was rinsed in Nanopure water, loaded into a dead-end, unstirred acrylic Sepa cell (GE Osmonics), and placed in an Osmonics cell holder pressurized at 60 pounds per square inch gauge (psig). A clean water sample was run using Nanopure water to establish the membrane’s clean water flux. A seawater sample was prepared by prefiltering it through a glass fiber filter, a filter with a 0.7-μm nominal pore size (Millipore AP-40) to remove large particulate matter. The prefiltered sample was then brought to room temperature using a hot water bath and loaded into a stainless steel feed tank (Amicon). The tank was pressurized to 30 psig with a regulated nitrogen tank, and a valve was opened, allowing flow of seawater through the membrane. Pressure remained close to 30 psig for the duration of the fractionation run. Approximately 10 liters of filtrate were collected for each fraction. Each fraction of San Diego seawater was run in the bench-scale RO unit using the transient recovery test method. A nonfractionated seawater sample and a synthetic seawater sample were also tested. The nonfractionated seawater was treated only by glass fiber filtration (Millipore AP-40). The synthetic seawater was made by adding appropriate amounts of the major inorganic seawater species to deionized water in the following concentrations: 23.9 grams per liter (g/L) NaCl, 4 g/L, sodium sulfate (Na2SO4), 0.7 g/L potassium chloride (KCl), 0.2 g/L sodium bicarbonate (NaHCO3), 0.1 g/L potassium bromide (KBr), 10.8, g/L magnesium
0 5 1045
50
55
60
65
70
Time (hours)C
ondu
ctiv
ity (m
S/cm
)
30-kD prefiltered seawater100-kD prefiltered seawatersynthetic seawaterglass-fiber-filtered seawater20-kD prefiltered seawater
0 5 1045
50
55
60
65
70
Time (hours)
Con
duct
ivity
(mS/
cm)
seawaterseawaterNaClseawaterNaCl

Characterization of Membrane Foulants in Seawater Reverse Osmosis Desalination
20
chloride hexahydrate (MgCl2∙6H20), and 1.5 g/L calcium chloride dihydrate (CaCl2∙2H2O). The recipe resulted in a synthetic seawater having similar makeup as “standard seawater,” defined in the oceanographic literature as seawater with a salinity of 35 x 10-3 (Grasshoff et al., 1983). Figure 9 and Figure 10 present specific flux data for the bench-scale RO runs for each seawater fraction. To compare flux decline among runs, the data is normalized to the run’s initial flux. No significant difference in flux decline appears for any of the samples, including the synthetic seawater, which had no organic foulants present. Initial specific fluxes were 0.0485, 0.0470, 0.0513, 0.0503, and 0.0475 liters per square meter-hour-pounds per square inch (L/m2-hr-psi) for the synthetic, glass-fiber filtered, 100-kDa-RC fractionated, 30-kD-RC fractionated, and 20-kD-PES fractionated seawaters, respectively. Note also that, before each run, the clean water permeability and rejection characteristics of each membrane coupon were determined with a sodium chloride solution. Membrane coupons were only used if their NaCl rejection was greater than 97%.
Figure 9. Flux data for five bench-scale RO experiments with fractionated seawater. The data are normalized to the initial flux.
Though specific flux decline occurred in all seawater fraction runs, there was no significant difference in flux decline among the seawater fractions. Further, the synthetic seawater control showed the same flux decline as the other samples. As seen previously, the specific flux calculation using bulk feed concentration for osmotic pressure calculations was not accurate; specific flux should not decline unless fouling occurs.

Characterization of Membrane Foulants in Seawater Reverse Osmosis Desalination
21
Figure 10. Specific flux data from fractionation experiments plotted with respect to feed salt concentration. Specific flux appears linearly dependant on salt concentration.
It should be mentioned that the level of recovery that could be achieved by the bench-scale RO unit in a constant-flux test was limited. Once recovery reached approximately 25%, the highest possible pressure (1,000 psi) was required to maintain 20 L/m2/hr flux. The inlet pressure transducer and membrane cell were only rated to 1,000 psi. Recoveries greater than 25% could only be reached by running at lower flux, or by allowing flux to decline. Corrosion was an additional issue. During initial project planning, corrosion was recognized as a potential problem. Care was taken to purchase stainless steel components that would be resistant to corrosion. However, after several months of experiments, especially after long membrane runs, a dark reddish-brown material, assumed to be iron oxide rust, was seen on the membrane surface. The bench-scale RO unit was disassembled, and the components were evaluated. The pressure gauge and pressure transducer had significant rust on the wetted parts, which were made of 304 stainless steel, and the need to upgrade the components to 316 stainless steel became apparent. However, several of the components that were made of 316 stainless steel also showed varying levels of rust, including the pump head. The system components were cleaned using a 50% solution of household calcium-lime-rust remover, which quite effectively removed all apparent rust. It was determined that experiments would need to be conducted over the briefest

Characterization of Membrane Foulants in Seawater Reverse Osmosis Desalination
22
time period possible and that salt water should be flushed out immediately after each run. It was hoped that, in this way, any corrosion that occurred would be minimal and that rust would not build up enough to contaminate the liquid stream. A cleaning step of 7% phosphoric acid was implemented between runs to remove any small amount of rust that developed. The cleaning solution was run through the system in recycle mode for 10 minutes, and the system was then flushed with deionized water. The cleaning methods proved fairly successful. For several runs, no rust was apparent on the membranes. However, when a small amount of rust was seen, the system was again disassembled and evaluated. Corrosion had occurred mainly on the threaded ends of some fittings where Teflon tape was used. Apparently, the Teflon tape held salt water in contact with the metal surface, even after cleanings. A determination was made that after cleaning, the system should be left full of deionized water, so that salts still remaining in the Teflon tape would have time to diffuse out into the bulk solution. This method seemed effective throughout the remainder of the project. Note that the membrane cell was removed before cleaning, and the cell (which did not shown signs of corrosion) was cleaned separately.

Characterization of Membrane Foulants in Seawater Reverse Osmosis Desalination
23
PHASE TWO: SEEKING FLUX DECLINE The project’s initial concept was that bench-scale studies reflect the full-scale operation as closely as possible. Thus, operating parameters like pressure, flux, and crossflow velocity were kept as closely as possible to real-world values. During Phase 1, experiments were inadequate to determine the fouling propensity of natural waters because bench-scale fouling that causes significant flux decline did not occur. It became interesting, then, to challenge the bench-scale system in more extreme ways to determine a few “worst-case scenarios” of fouling for such a system. Foulant surrogates—protein and polysaccharide solutions—were tested at high concentrations. Two more natural water sources were also tested: one from Long Beach, California, and one from Sarasota, Florida. The Sarasota sample was collected during a “red tide” phytoplankton bloom event. The behavior of these waters in the bench-scale system shed more light on the fouling process. Finally, operator experience and modifications to the bench-scale setup enabled longer-term tests to be performed by the end of Phase 2. A few longer-term experiments helped elucidate the effect of run time on flux decline. Foulant Surrogates Foulant surrogates were used to evaluate the flux decline that could be seen in the bench-scale system at high organic matter loading. Foulant surrogates take the place of natural organic matter in the environment. Bovine serum albumin (BSA) was chosen as a model protein. Sodium alginate was chosen as a model polysaccharide. The proteins and polysaccharides present in natural seawater could have a much different effect on membrane fouling than these surrogates. However, protein and polysaccharide are two broad chemical classes of naturally occurring material, and BSA and sodium alginate have been studied in many previous membrane fouling projects (Kim et al., 1997; Li et al., 2007; and Asatekin et al., 2007). Synthetic seawater was prepared using the same recipe as in previous experiments: 23.9 g/L NaCl, 4 g/L Na2SO4, 0.7 g/L KCl, 0.2 g/L NaHCO3, 0.1 g/L KBr, 10.8, g/L MgCl2∙6H20, and 1.5 g/L CaCl2∙2H2O (Grasshoff et al., 1983). BSA was added to the synthetic seawater at a concentration of 265 mg/L. Sodium alginate was added to a separate sample, also at a concentration of 265 mg/L. Both solutions were difficult to prepare because of foaming and floc formation at this high concentration. The BSA solution was stirred for several hours, and the sodium alginate solution was stirred overnight. After cleaning the system, each membrane coupon was compacted and its performance was verified by running 2 liters (L) of NaCl solution at a starting conductivity of 50 mS/cm and pressure of 1,000 psi. The total times for each run were 7 hours for San Diego seawater, 8.5 hours for BSA, and 3.5 hours for sodium alginate, Permeate was wasted in these runs, so conductivity increased over time. . The permeate was wasted until the sample concentration reached 70

Characterization of Membrane Foulants in Seawater Reverse Osmosis Desalination
24
mS/cm. At least 98% rejection of NaCl was achieved (98.8% and 98.9% for the coupons used for BSA and alginate, respectively). After this compaction step, the feed was changed to the surrogate solution. Over 1 L of surrogate solution was wasted through the pump to flush out NaCl from the compaction step. When the sample tank volume reached 7 L, the system was set up in recycle mode, and the test began. Pressure was set at 1,000 psi, and the permeate was wasted throughout the run; thus, this was a constant-pressure, declining-flux experiment. This method was used because it resulted in the highest possible flux for the duration of the run and was, therefore, the worst-case fouling scenario. Also, leaving the pressure at 1,000 psi meant much less operator involvement in the experiment, which led to less variability in the data. Figure 11 shows the measured fluxes for BSA and sodium alginate experiments, where they are compared with a control run of San Diego seawater. The overall flux decline noted especially in San Diego seawater is due to the increasing osmotic pressure during the run as salt concentration—measured by conductivity—increased. However, the flux declined much more rapidly for BSA and sodium alginate samples than for the control run, which indicated fouling. For BSA, the fouling flux decline happened in the first 3 hours (50.7 to 55 mS/cm), then there appeared to be no additional decline due to fouling (i.e., the slope of the flux decline followed the slope of the San Diego seawater). For sodium alginate, the fouling continued during the entire run, and the run was cut short (to only 8 hours) because the flux decline was so dramatic. When the membrane from the sodium alginate run was removed, a thick gelatinous layer was present. In fact, the gel separated easily from the membrane and could be lifted off of the surface entirely intact. An imprint of the feed spacer was noticeable in the gel layer; it had formed to fill the space between the membrane and the spacer, as well as to fill voids in the spacer itself. The fouled membrane from the BSA experiment did not have such a gel layer; in fact, no adsorbed material could be observed. These tests indicated that, for the same mass concentration, protein fouling (BSA) was less drastic than polysaccharide fouling (sodium alginate). Additionally, because the flux decline leveled off earlier in the protein case than in the polysaccharide case, it is assumed that the protein cake layer did not continue to build and/or thicken as long as the polysaccharide cake layer. Finally, it was realized that a high concentration of foulants was needed to induce observable flux decline. The final flux after BSA fouling was 75% of the clean water flux (as determined using permeability data from the NaCl compaction run); so even with a very high protein concentration (265 mg/L), the flux decline was only 25%. If natural seawater organic matter has properties similar to proteins, very little flux decline would be seen in a bench-scale test (natural organic carbon concentrations are much lower than 265 mg/L). Based on the sodium alginate run, more flux decline would be expected with polysaccharidic material than with proteinaceous

Characterization of Membrane Foulants in Seawater Reverse Osmosis Desalination
25
material; but again, if the concentrations are low, the flux decline will still be small.
Figure 11. Flux values plotted verses conductivity for San Diego seawater, BSA (protein surrogate), and sodium alginate (polysaccharide surrogate) samples. Natural Waters Long Beach Seawater During Phase One, all seawater experiments were performed with the same source water. It is expected that there is a great deal of variability in seawater samples collected at the same location, due to weather, tidal, and other factors. It is possible that the sample was collected when fouling material in the seawater was low and/or that the sample condition changed during the several months that the sample was stored in the laboratory. A new seawater sample was obtained from Long Beach, California. The Long Beach Water Department, which was piloting a nanofiltration seawater desalination system, agreed to send a sample of its source water. At this point in the project, a decision was made to use larger sample volumes; therefore, 18 L of Long Beach seawater were used. The sample was run in the bench-scale RO unit for 17 hours at a constant pressure of 1,000 psi, just as was done in the foulant surrogate runs (including the compaction and membrane characterization step using NaCl to get at least 98% salt rejection). The salt concentration increased from 30,000 ppm to 37,000 ppm for a recovery of 19%. Figure 12 shows flux data comparing Long Beach seawater with San Diego seawater. Conductivity increased over time as permeate was wasted. The total
50 55 60 65 70 755
10
15
20
25
30
35
Conductivity (mS/cm)
Flux
(lm
h)
San Diego Seawater265 mg/l BSA265 mg/l Sodium Alginate

Characterization of Membrane Foulants in Seawater Reverse Osmosis Desalination
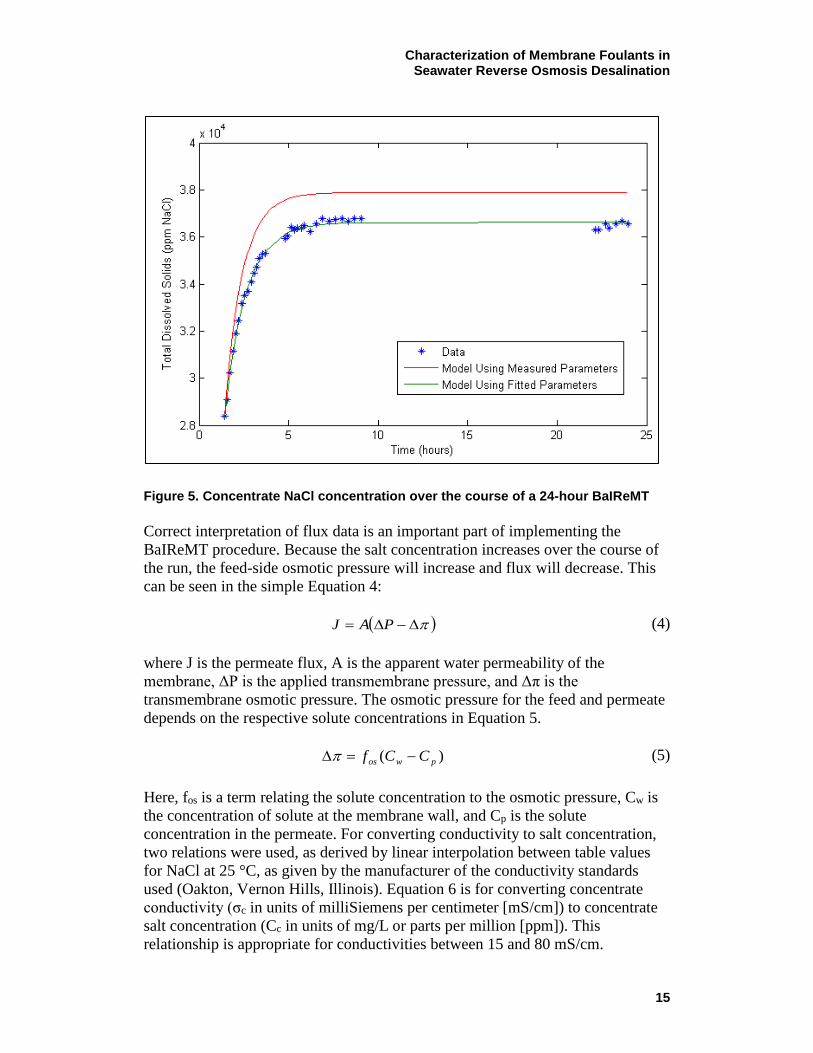
26
times for each run were 7 hours for San Diego seawater and 17 hours for Long Beach seawater. In the Long Beach run, no concentrate spacer was used, resulting in a low initial flux. The spacer was not used for the Long Beach run to evaluate the effect of a spacerless system. Without a spacer, the flux in the system was reduced, probably due to the lower flow and development of a larger concentration polarization layer. Figure 12 clearly shows the lowered flux. However, the slope of the flux decline was quite similar to the San Diego seawater run, indicating that a linear relationship exists between flux and salt concentration, regardless of hydrodynamic conditions. Further, since the slopes are similar, little or no flux decline appeared due to fouling in the Long Beach run.
Figure 12. Flux values plotted verses conductivity for San Diego seawater and Long Beach seawater. Sarasota Seawater During a Phytoplankton Bloom To test the effects of natural phytoplankton on RO membrane fouling, a seawater sample was collected in November 2006 from New Pass on Longboat Key (a location near Sarasota, Florida) during a red tide event. The phytoplankton in the sample were the dinoflagellate Karenia brevis, at an estimated concentration of 1,000 cells per mL. Eighteen liters of the sample were run in the bench-scale RO unit after an NaCl compaction and membrane characterization run (as performed in previous experiments). Pressure was held constant at 1,000 psi, and permeate was wasted continuously, as in the Long Beach and synthetic seawater runs shown in Figure 12 . For this run, the feed spacer was installed. The final recovery was 29%. Compared to synthetic seawater (Figure 13), the Sarasota sample showed fouling behavior in the first 6 hours (52.5 to 56.5 mS/cm). The total run time for the Sarasota sample was 22 hours. After 6 hours, the flux declined at the same rate as
55 60 65 70 75Conductivity (mS/cm)
San Diego SeawaterLong Beach Seawater
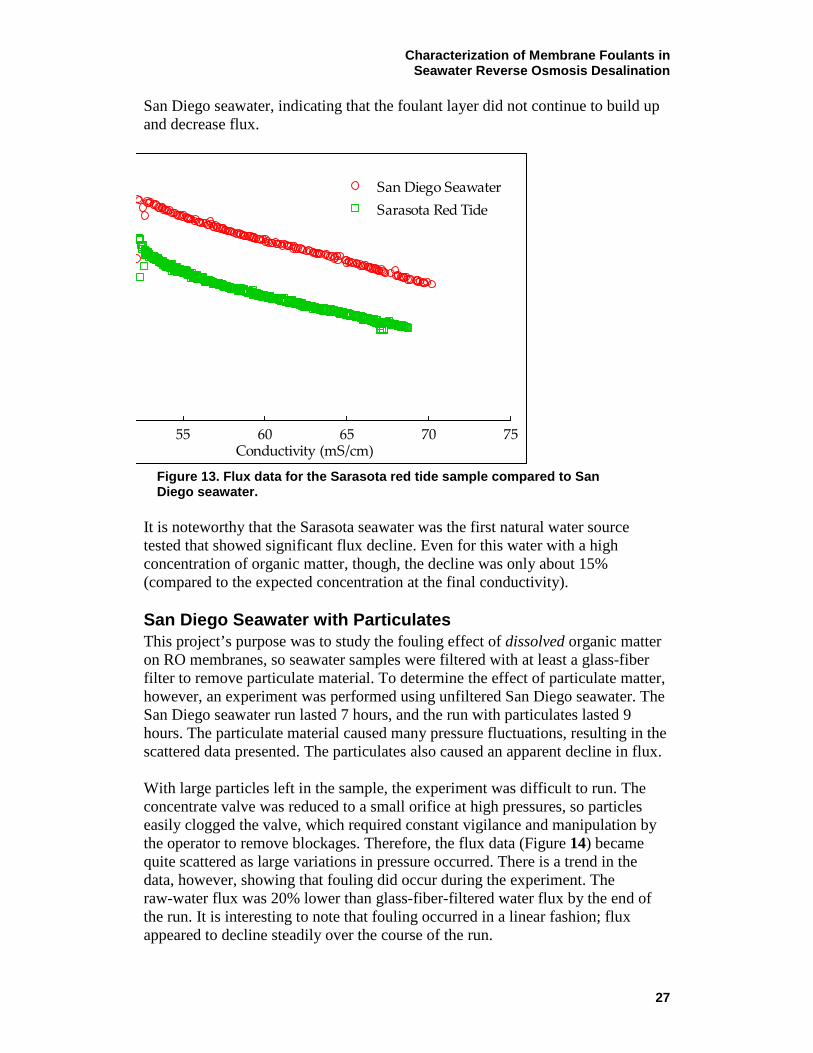
Characterization of Membrane Foulants in Seawater Reverse Osmosis Desalination
27
San Diego seawater, indicating that the foulant layer did not continue to build up and decrease flux.
Figure 13. Flux data for the Sarasota red tide sample compared to San Diego seawater.
It is noteworthy that the Sarasota seawater was the first natural water source tested that showed significant flux decline. Even for this water with a high concentration of organic matter, though, the decline was only about 15% (compared to the expected concentration at the final conductivity). San Diego Seawater with Particulates This project’s purpose was to study the fouling effect of dissolved organic matter on RO membranes, so seawater samples were filtered with at least a glass-fiber filter to remove particulate material. To determine the effect of particulate matter, however, an experiment was performed using unfiltered San Diego seawater. The San Diego seawater run lasted 7 hours, and the run with particulates lasted 9 hours. The particulate material caused many pressure fluctuations, resulting in the scattered data presented. The particulates also caused an apparent decline in flux. With large particles left in the sample, the experiment was difficult to run. The concentrate valve was reduced to a small orifice at high pressures, so particles easily clogged the valve, which required constant vigilance and manipulation by the operator to remove blockages. Therefore, the flux data (Figure 14) became quite scattered as large variations in pressure occurred. There is a trend in the data, however, showing that fouling did occur during the experiment. The raw-water flux was 20% lower than glass-fiber-filtered water flux by the end of the run. It is interesting to note that fouling occurred in a linear fashion; flux appeared to decline steadily over the course of the run.
55 60 65 70 75Conductivity (mS/cm)
San Diego SeawaterSarasota Red Tide

Characterization of Membrane Foulants in Seawater Reverse Osmosis Desalination
28
Figure 14. Flux data for San Diego seawater compared to flux data for San Diego seawater with particulate material.
Long-Term Tests In BaIReMT and transient recovery tests, no obvious fouling was observed. The total volume of water tested may have been insufficient to provide a significant cake layer—there may have been a foulant limitation. In addition, it was questioned whether the timeframe of experiments had been long enough and whether it was appropriate to run experiments in an increasing-salt-concentration manner. A third experimental protocol was then developed to address these limitations: the sample throughput test. The diagram in Figure 15 displays the sample throughput test. The setup was similar to the BaIReMT, except that the permeate and concentrate were not sent back to the feed tank. In this way, permeate and concentrate could be sampled and measured continuously throughout the experiment without disrupting the system. Also, because the permeate and concentrate were not mixed with the seawater sample, the sample was kept in its original, undiluted state. This ensured the preservation of the sample so that if an experiment failed in the middle of a run (for example, an overnight system glitch), the sample would not be lost. In BaIReMT experiments, the feed tank was diluted during the run, so a fresh sample was needed to restart an experiment.
50 55 60 65 70 750
5
10
15
20
25
30
35
Conductivity (mS/cm)
Flux
(lm
h)
San Diego SeawaterSan Diego Seawater with Particulates
Characterization of Membrane Foulants in Seawater Reverse Osmosis Desalination
29
Figure 15. Diagram of sample throughput test. The concentrate and permeate flow rates equal the feed flow rate at steady state. The feed flow rate in this experimental protocol is set by the desired recovery. The flow rate can be calculated simply with Equation 9:
RrQQ pf = (9)
where Qf and Qp are flow rates for feed and permeate, respectively, r is the membrane salt rejection, and R is recovery. The permeate flow rate was typically about 4 mL/min, r was about 99%, and a typical desired recovery was 30%. Under these conditions, Qf was 13.2 mL/min, which means that in a 24-hour period, 19 liters of seawater were used. This was small enough to be a “batch-type” system, where extreme volumes were not needed, but large enough (presumably) to provide a significant level of total organic mass to the membrane for adequate foulant characterization. At the same time, crossflow velocity could be maintained at a realistic level because it was independent of the other flows. There is an initial unsteady state inherent in this system, as with the BaIReMT, while the seawater in the break tank was concentrated to the desired salt concentration. This was minimized, however, by using a small initial break tank volume and keeping Qf at zero until the desired concentration was reached. The sample throughput protocol was implemented in a 4-day continuous test of San Diego seawater. This water had been in cold storage for a sufficient time to settle particulate matter, so, presumably, only dissolved material was present. The membrane was first compacted and achieved better than 98% rejection with NaCl, as in previous experiments. Seawater was then added to the system, and the control software was set to a target pressure of 1,000 psi. The program was fairly successful in maintaining a constant pressure over the course of the run by slightly adjusting the pump speed. This experiment had two periods of “unsteady state” where salt concentration (conductivity) was allowed to increase. These two periods were from 0 to 2 hours and 23 to 25 hours; thus, there was a 4-hour total
Feed Tank Break
Tank
RO Cell
Permeate
Concentrate
Feed
Recycle

Characterization of Membrane Foulants in Seawater Reverse Osmosis Desalination
30
unsteady-state period to reach the goal of 70 mS/cm conductivity, which represents about 30% recovery. Once a conductivity of 70 millisiemens (mS) was reached, the feed flow rate was set to maintain a steady state. The feed pump (a low-flow peristaltic pump) required occasional adjustment, but the pump was left unattended for up to 12 hours. Still, the conductivity varied by only ±0.5 mS/cm; the system stability was quite satisfactory. Flux decline was not apparent for the steady-state period of the test (Figure 16), indicating that no fouling occurred, even though new seawater was continuously fed to the membrane and the total organic matter load was quite high (the total feed volume used was about 89 liters, of which 26.7 liters passed through the membrane). The 51-mS/cm sample was run using the simple recycle test protocol. The 70-mS/cm test was run using the sample throughput protocol. The pressure for both runs was held constant at 1,000 psi (standard deviation: 5 psi). The discontinuity in flux for the 70-mS/cm test at ~42 hours resulted from a system shutdown and restart; conductivity dipped to 68 mS/cm and required about 1 hour to return to 70 mS/cm. Interestingly, upon inspection of the membrane after the run, a brown/yellow color was apparent on the membrane surface, and the spacer pattern could be seen (Figure 17). This did not rinse away, even with vigorous spraying of deionized water. Such a dramatic buildup of material on the membrane surface without significant flux decline was unexpected.
Figure 16. Flux measurements for two bench-scale tests of San Diego seawater: (1) 51 mS/cm, an (2) 70 mS/cm.
0 20 40 60 80 1000
10
20
30
Time (hours)
Flux
(lm
h)
San Diego Seawater at 51 mS/cm
San Diego Seawater at 70 mS/cm

Characterization of Membrane Foulants in Seawater Reverse Osmosis Desalination
31
Figure 17. Photograph of the RO membrane coupon after a 4-day test with the sample throughput protocol. Another long-term experiment was performed, this time under a “zero-recovery” condition. Zero recovery is mimicked by recycling the permeate back to the feed tank so that the feed conductivity does not change over time. San Diego seawater was first filtered with a 0.45-µm pore size mixed cellulose ester microfiltration membrane (Millipore, Billerica, Massachusetts). Then, 18 liters were run in zero-recovery mode at 1,000-psi pressure. As shown in Figure 16, the flux significantly declined (about 20%) over the course of the experiment. This was an interesting result. Most of the project, up to this point, involved attempts to increase the concentration of organic matter in the feed through BaIReMT, transient recovery, and sample throughput tests. It was believed that the higher organic matter concentrations were needed to mimic fouling in the later elements of a full-scale facility and that higher organic matter concentrations would lead to more extreme fouling conditions. However, with the two long-term experiments, the most important factor seemed to be the flux. Higher flux led to more extreme flux decline, while no decline was seen at lower flux. It appeared that the most effective way to see flux decline was to run in a simple recycle mode at high pressure where salt concentration would be kept low so that flux could be maintained at a high rate.


Characterization of Membrane Foulants in Seawater Reverse Osmosis Desalination
33
PHASE THREE: PHYTOPLANKTON FOULING Experiments with BSA and sodium alginate as foulant surrogates showed that fouling could be studied in a reasonable timeframe, as long as sufficient organic matter was present. However, whether BSA and sodium alginate behaved like natural foulants was questionable. The experiment with Sarasota red tide seawater showed that phytoplankton presence could cause significant fouling; but red tide blooms are unpredictable, and it would be difficult to run many experiments. The next step in the project, then, was to bridge the gap between natural waters and foulant surrogates by using a foulant source that could be well-characterized, yet represent the natural environment: cultured phytoplankton. Phase three of the project consisted of experiments to investigate fouling of RO membranes by phytoplankton (algae) and their associated algogenic organic matter (AOM). The phytoplankton species used was Heterocapsa pygmaea, a marine bloom-forming dinoflagellate. High-concentration cultures of phytoplankton were spiked into filtered, natural seawater and run on the bench-scale RO unit. During RO filtration, the phytoplankton cells were sheared and broken apart, releasing AOM into the bulk matrix. This release was characterized by manual cell counts and two types of fluorescence measurements: (1) bulk fluorescence in a fluorometer and (2) fluorescence of the filterable fraction detected by LSC. After shearing, AOM was fractionated by filtration through a 0.45-µm MF membrane and a 100-kDa UF membrane. MF and UF permeates were run on the RO unit, and the fouling by these fractions was compared to the fouling by total AOM plus cellular material. Several analytical methods were employed to elucidate the nature of the fouling fractions of AOM. Phytoplankton Culture A 15-mL seed culture of H. pygmaea (Provasoli-Guillard National Center for Culture of Marine Phytoplankton) containing about 430,000 cells per mL was spiked into f/2 media, which was made by filtering San Diego seawater through a 0.45-µm membrane, autoclaving to sterilize, and adding sterile stock solutions of nitrate, phosphate, trace metals, and vitamins (Andersen, 2005). Several initial lines were begun, and the volume of each line was increased gradually as the cells multiplied. Cultures were incubated at room temperature (21.7 ± 1.1 ˚C), and a variety of lighting conditions was explored. Most cells were placed approximately (~)33 cm away from a continuously lit, household, mercury-fluorescent light bulb (Sylvania Premium Cool White, 40 watts [W], 4,100 degrees Kelvin [K]). After a sufficient volume of high-concentration cells was obtained, a sequencing batch culture method was begun to keep the lines in perpetual growth for experiments. Using a hemocytometer and a microscope, algal cells were monitored for viability and counted regularly. After transfer of a culture into new nutrient media, a short lag time was followed by exponential growth, with a doubling time of 3 to 4 days. The strain was quite robust, with a

Characterization of Membrane Foulants in Seawater Reverse Osmosis Desalination
34
high viable cell concentration after 40 days without nutrient addition. Their size (10 to 20 µm) made it easy to evaluate the condition of cells via visible-light microscopy (Figure 18).
Figure 18. A single, intact H. pygmaea cell (left) compared with a single cell whose internal organelles have been released. The images were taken with visible-light microscopy in differential interference contrast mode. Microfiltration and Ultrafiltration Experiments To supplement RO experiments, MF and UF experiments were performed using water spiked with H. pygmaea. MF membranes were mixed cellulose ester and had a pore size of 0.45 µm, while the UF membranes were regenerated cellulose and had a molecular-weight cutoff of 100 kDa (both from Millipore, Billerica, Massachusetts). San Diego seawater was first prefiltered with the MF membranes, then spiked with H. pygmaea culture for a final concentration of 67,000 cells/mL (measured via hemocytometer). The sample was filtered through circular membrane coupons in a dead-end apparatus (“Amicon Cell,” Millipore) with an active membrane area of 39 mm in diameter. Deionized water was filtered through each coupon to test integrity and establish the clean water flux. Two liters of deionized water were used for MF membranes, and about 1 liter was used for UF membranes in this clean water flux test. Spiked seawater was brought to room temperature (~21 ˚C) and loaded into a stainless steel feed tank. The tank was pressurized to 30 psig with a regulated nitrogen tank, and a valve was opened, allowing the seawater to flow through the membrane. Pressure remained close to 30 psig for the duration of the filtration run. For MF runs, after the flux dipped below 500 liters per square meter per hour (Lmh) (2% of the clean water flux), the Amicon Cell was opened, and the membrane was thoroughly rinsed with a stream of deionized water to remove the foulant layer. For UF runs, the same cleaning method was employed when flux dropped below 100 Lmh (20% of the clean water flux).
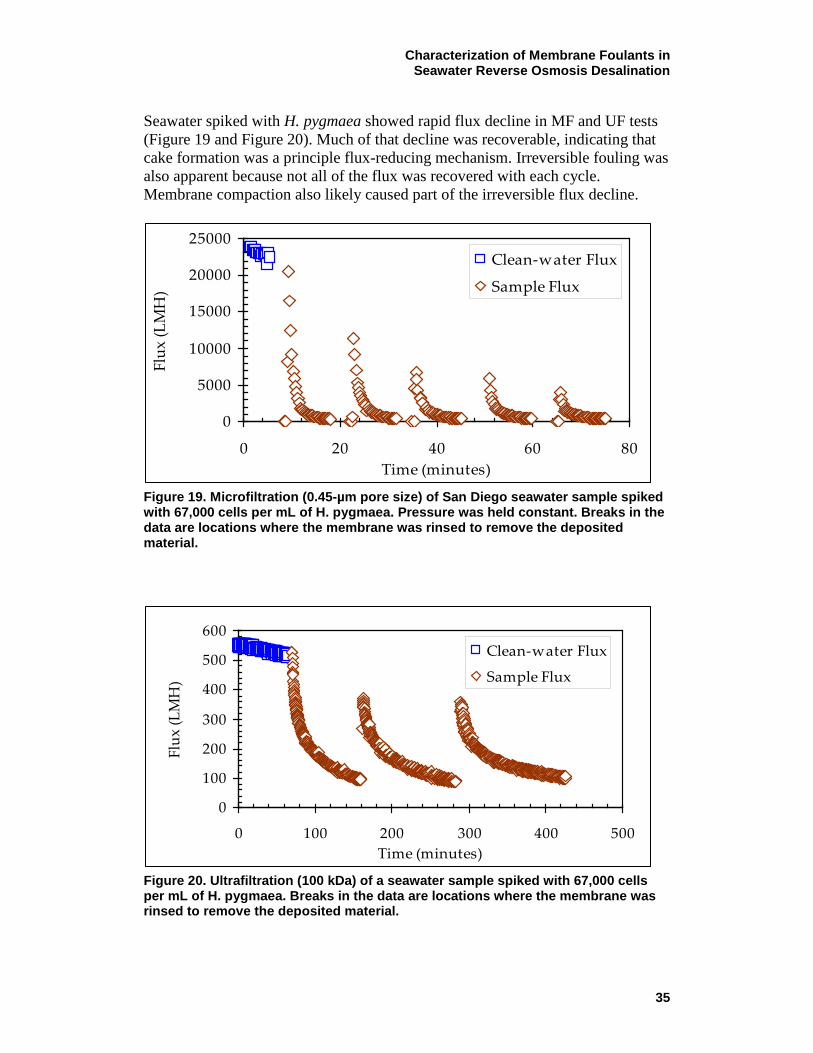
Characterization of Membrane Foulants in Seawater Reverse Osmosis Desalination
35
Seawater spiked with H. pygmaea showed rapid flux decline in MF and UF tests (Figure 19 and Figure 20). Much of that decline was recoverable, indicating that cake formation was a principle flux-reducing mechanism. Irreversible fouling was also apparent because not all of the flux was recovered with each cycle. Membrane compaction also likely caused part of the irreversible flux decline.
Figure 19. Microfiltration (0.45-µm pore size) of San Diego seawater sample spiked with 67,000 cells per mL of H. pygmaea. Pressure was held constant. Breaks in the data are locations where the membrane was rinsed to remove the deposited material.
Figure 20. Ultrafiltration (100 kDa) of a seawater sample spiked with 67,000 cells per mL of H. pygmaea. Breaks in the data are locations where the membrane was rinsed to remove the deposited material.
0
5000
10000
15000
20000
25000
0 20 40 60 80Time (minutes)
Flux
(LM
H)
Clean-water Flux
Sample Flux
0
100
200
300
400
500
600
0 100 200 300 400 500Time (minutes)
Flux
(LM
H)
Clean-water Flux
Sample Flux

Characterization of Membrane Foulants in Seawater Reverse Osmosis Desalination
36
Reverse Osmosis Shear Experiments H. pygmaea was spiked into prefiltered (0.45-µm) San Diego seawater to make a 20-liter sample with 40,000 cells per mL. Cells were harvested during their active growth phase and were observed to be swimming vigorously in the seawater matrix. The spiked seawater sample was run on the bench-scale RO unit in full recycle mode (permeate and concentrate fed back to the feed tank) at 1,000-psi pressure and a flow rate of 800 mL/min (which translates roughly to a crossflow velocity of 0.47 meters per second [m/s] and Reynolds number of 270). Temperature was held at 20 ˚C. The experiment was performed twice. Before each run, the membrane was compacted and greater than 98% salt rejection was verified using an NaCl solution, as done previously. In the bench-scale system, high pressure is achieved with a valve in the concentrate line. Because this valve must be closed to a tight orifice, the shear environment is extreme. Such high shear coupled with a 1,000-psi pressure drop causes a great deal of stress on the phytoplankton cells. Thus, the RO runs of phytoplankton-spiked seawater constituted a fouling experiment coupled with a shear-stress experiment. The cells were observed over time to determine the effects of this high-stress system (data for one of the runs is presented in Figure 21). Total cell number determined by hemacytometer counts decreased in an exponential-decay fashion.
Figure 21. Cell count over the course of the RO shear run. Counts were performed manually with a hemocytometer.
0
10000
20000
30000
40000
50000
60000
0 500 1000 1500
Time (min)
Cel
l Cou
nt (c
ells
/ml)
q

Characterization of Membrane Foulants in Seawater Reverse Osmosis Desalination
37
The status of AOM in the course of the RO shear experiment was further investigated with laser-scanning cytometry (LSC). The LSC technique was developed previously in our laboratory for microsphere and bacterial enumeration (Ladner et al., 2007). This technique involves filtering a small (5-mL) sample of the feed tank onto a 0.2-µm black polycarbonate membrane. The filter is then placed on a movable stage, and laser light is directed at the membrane so that it is scanned (in a way similar to a compact disk). Fluoresced light from algal cells or fluorescent organic matter on the membrane is detected with a photomultiplier tube (PMT). A cutoff filter in front of the PMT ensures that most of the detected light is indeed fluoresced, not merely reflected. The LSC was used to quantify the amount of fluorescent material greater than 0.2 µm in the sample. The results are reported in Figure 22. The Y-axis units of “percent positive detects” in Figure 22 indicate the relative number of data points that were positive fluorescence counts in the total scan data set. When Figure 22 is compared to Figure 22, it is apparent that the LSC and manual counts are correlated, indicating that most of the AOM detected in the LSC consisted of whole cells.
Figure 22. LSC data for the RO shear run. AOM was also measured by analyzing fluorescence in a microplate reader. Fluorescence measurements can be used to enumerate cells and have an almost linear response to cell number. Aliquots of 300 µL were sampled over the course of the shear run and placed in a 96-well plate. The plate was read with excitation at 450 nanometers (nm) and detection at 680 nm. These values for excitation and
0.00%
2.00%
4.00%
6.00%
8.00%
10.00%
0 500 1000 1500
Time (min)
Perc
ent P
osti
ve D
etec
ts

Characterization of Membrane Foulants in Seawater Reverse Osmosis Desalination
38
detection are often used to measure chlorophyll levels in natural water samples (Welschmeyer, 1994 and Gregor and Marsalek, 2004). Interestingly, fluorescence intensity increased over the initial phase of the experiment. However, by the end of the run, the fluorescence intensity had decreased, as shown in Figure 23. The initial increase could be due to breakup of cells and release of organelles that continue to fluoresce but are more spread out in the seawater matrix. The decrease at the end of the run could be due to the further breakup of organelles and quenching of fluorescent properties. Alternatively, bacterial activity may change the composition of organic matter during the 24-hour experiment.
Figure 23. Fluorescence intensity of phytoplankton-spiked seawater over the course of the RO shear run. After shearing cells in the RO unit and determining the flux decline, the AOM of the spiked samples was fractionated with MF and UF membranes. The 19-liter sample from the first RO shear experiment was filtered through a 0.45-µm MF membrane. The same volume from the second RO shear experiment was filtered through a 100-kDa UF membrane. The setup and pressure were the same for these runs as for prior MF and UF experiments with H. pygmaea-spiked samples. Several fractionation runs were required for each sample, as a large volume was filtered and membrane performance decreased significantly over time.
020406080
100120140160
0 500 1000 1500
Time (min)
Fluo
resc
ence
Inte
nsity

Characterization of Membrane Foulants in Seawater Reverse Osmosis Desalination
39
Reverse Osmosis Experiments Microfiltered and ultrafiltered AOM were tested on the bench-scale RO unit to determine the fouling propensity of the respective fractions. The experiments were conducted with the same operating conditions as used for the RO shear runs (full recycle mode, 1,000-psi pressure, 0.47-m/s crossflow velocity, 20 ˚C). The membranes were compacted before each run, and greater than 98% salt rejection was achieved with a NaCl solution, (as was done in previous experiments). Flux was measured over the entire 24-hour run and is shown, along with the flux from shear experiments, in Figure 24.
Figure 24. Normalized specific flux for four RO-fouling experiments. The actual initial flux values were 28.97, 28.28, 27.81, and 29.51 Lmh (top to bottom in the figure).
Flux trends during bench-scale RO experiments were as expected: the greatest flux decline was seen when phytoplankton cells were present, less flux decline was observed with microfiltered feed, and the least flux decline was observed for ultrafiltered feed. Notably, even when phytoplankton cells were present at this high concentration, the flux decline was less than 20%. This suggests that AOM does not form a thick cake layer like that observed with sodium alginate. Instead, it appears that a cake layer forms up to a point, then a steady state is reached; the flux curves seem to be approaching an asymptote by 24 hours. Data from the long-term San Diego seawater test contradict this point, where flux decline
5 10 15 20 25Time (hours)
Sheared H pygmaea, post-UFSheared H pygmaea, post-MFH pygmaea spike, 40000 cell/ml IH pygmaea spike, 40000 cell/ml II
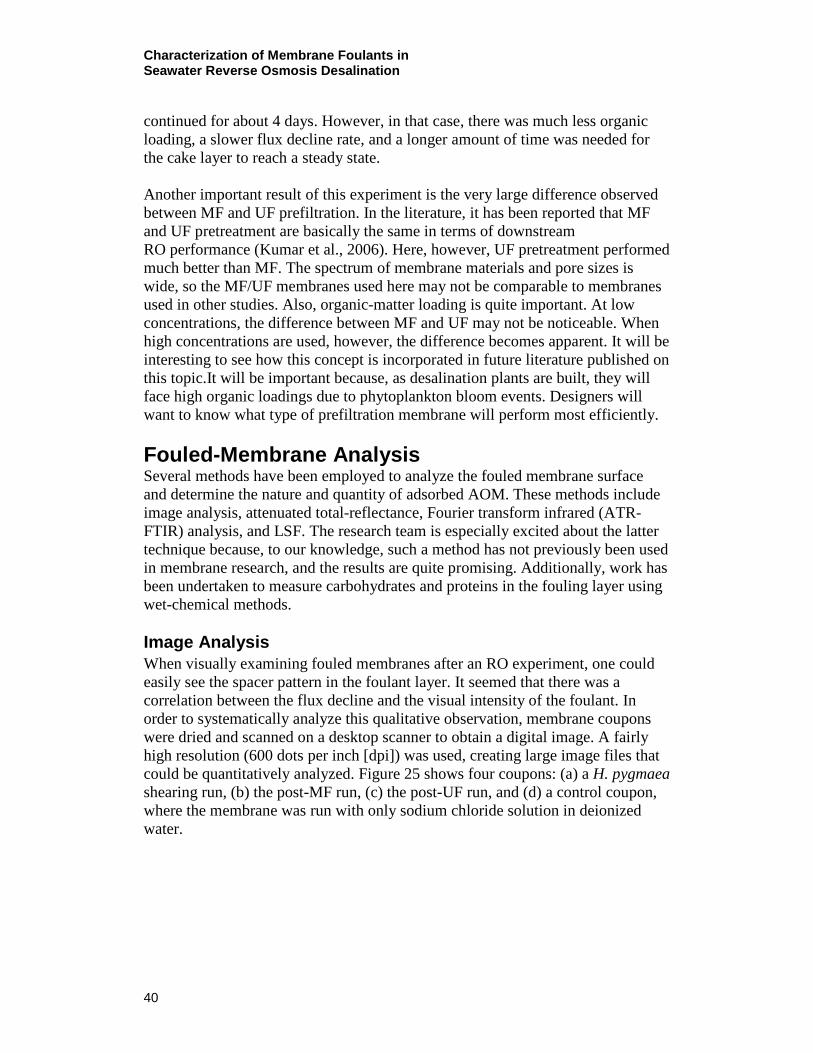
Characterization of Membrane Foulants in Seawater Reverse Osmosis Desalination
40
continued for about 4 days. However, in that case, there was much less organic loading, a slower flux decline rate, and a longer amount of time was needed for the cake layer to reach a steady state. Another important result of this experiment is the very large difference observed between MF and UF prefiltration. In the literature, it has been reported that MF and UF pretreatment are basically the same in terms of downstream RO performance (Kumar et al., 2006). Here, however, UF pretreatment performed much better than MF. The spectrum of membrane materials and pore sizes is wide, so the MF/UF membranes used here may not be comparable to membranes used in other studies. Also, organic-matter loading is quite important. At low concentrations, the difference between MF and UF may not be noticeable. When high concentrations are used, however, the difference becomes apparent. It will be interesting to see how this concept is incorporated in future literature published on this topic.It will be important because, as desalination plants are built, they will face high organic loadings due to phytoplankton bloom events. Designers will want to know what type of prefiltration membrane will perform most efficiently. Fouled-Membrane Analysis Several methods have been employed to analyze the fouled membrane surface and determine the nature and quantity of adsorbed AOM. These methods include image analysis, attenuated total-reflectance, Fourier transform infrared (ATR-FTIR) analysis, and LSF. The research team is especially excited about the latter technique because, to our knowledge, such a method has not previously been used in membrane research, and the results are quite promising. Additionally, work has been undertaken to measure carbohydrates and proteins in the fouling layer using wet-chemical methods. Image Analysis When visually examining fouled membranes after an RO experiment, one could easily see the spacer pattern in the foulant layer. It seemed that there was a correlation between the flux decline and the visual intensity of the foulant. In order to systematically analyze this qualitative observation, membrane coupons were dried and scanned on a desktop scanner to obtain a digital image. A fairly high resolution (600 dots per inch [dpi]) was used, creating large image files that could be quantitatively analyzed. Figure 25 shows four coupons: (a) a H. pygmaea shearing run, (b) the post-MF run, (c) the post-UF run, and (d) a control coupon, where the membrane was run with only sodium chloride solution in deionized water.

Characterization of Membrane Foulants in Seawater Reverse Osmosis Desalination
41
a
b
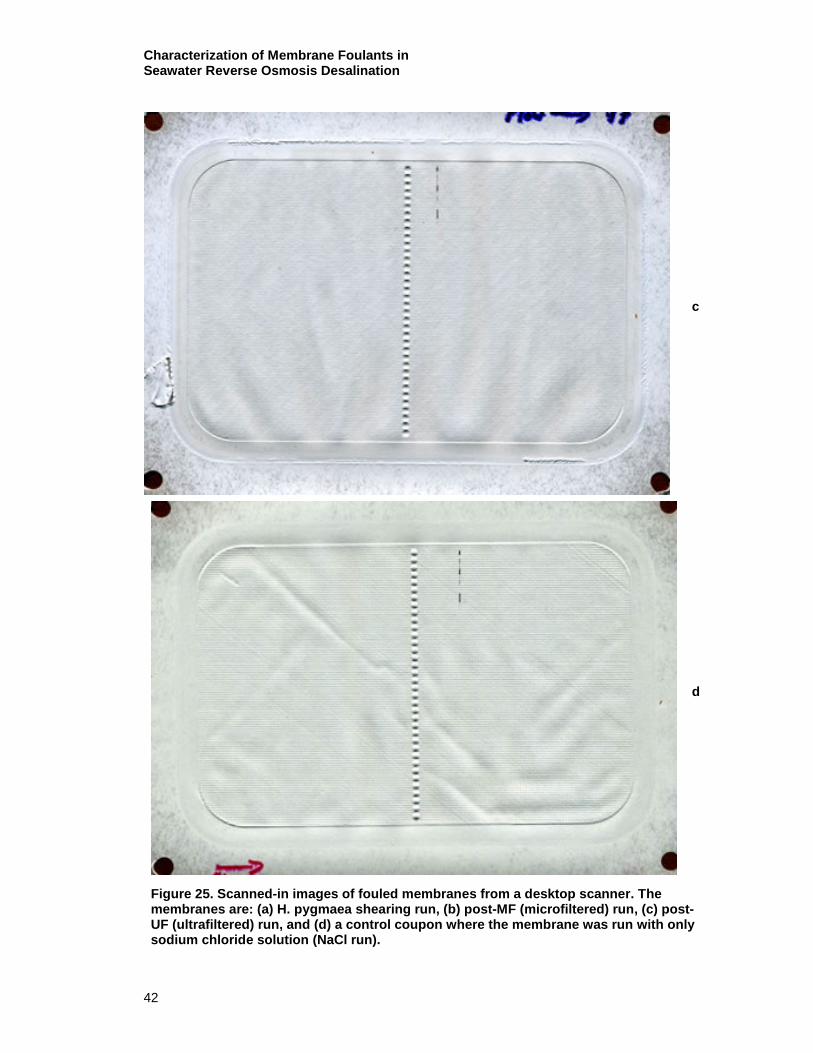
Characterization of Membrane Foulants in Seawater Reverse Osmosis Desalination
42
c
d
Figure 25. Scanned-in images of fouled membranes from a desktop scanner. The membranes are: (a) H. pygmaea shearing run, (b) post-MF (microfiltered) run, (c) post-UF (ultrafiltered) run, and (d) a control coupon where the membrane was run with only sodium chloride solution (NaCl run).

Characterization of Membrane Foulants in Seawater Reverse Osmosis Desalination
43
Color images such as these are comprised of red, green, and blue channels. The blue channel was the best indicator of fouling. This is a slightly counterintuitive result because the foulant appears red to the naked eye. In the images, however, the reddish color is due to a drop in blue intensity. A 300- by 300-pixel segment of each image was extracted, and the blue intensity was plotted to compare the membranes quantitatively ( Figure 28). There is clearly a decrease in blue intensity for the highly fouled H. pygmaea shearing run coupon. The post-MF run also shows some significant blue-intensity depression, but the bulk of the data points falls in the same range as the post-UF and NaCl runs. Thus, analysis of an image by strictly evaluating pixel intensity is useful, but limited. Fourier transform analysis was undertaken to quantitatively determine the qualitative pattern that we see with our natural eyes.
Figure 26. Blue-channel pixel intensities for the four fouled-membrane images shown in Figure 25. Note that low blue-channel intensity is indicative of high fouling. It is clear that the H. pygmaea shear run has less intensity (it is darker) and is, therefore, more highly fouled than the others. However, it is difficult to differentiate between the three other samples based solely on pixel intensity.
Fourier transform analysis of the blue-channel image data is a novel way to measure the fouling on RO membranes. The key to the applicability of this method is that the foulant pattern matches the well-defined spacer shape. A horizontal transect of the image data is converted into a frequency domain using a Fourier transform, and the power spectrum is plotted. Because the images are high resolution, the power spectra of many transects can be averaged to minimize noise. Figure 27 shows the power spectra for the coupons whose images are displayed in Figure 25. There are two clear sets of peaks in spectrum: those caused by dimple shadows and those caused by the spacer pattern. The coupons have dimples because the membrane deforms in the shape of the permeate carrier during operation. Those dimples cause shadows when scanned. The characteristic length for the dimples was typically about 20 to 22 pixels, translating to a

Characterization of Membrane Foulants in Seawater Reverse Osmosis Desalination
44
frequency of about 0.050 to 0.047 cycles per pixel. In Fourier analysis, it is often the case that a strong peak at one frequency will be found with smaller harmonic peaks at multiples or halves of its frequency. The frequency data can be converted to “wavelength” by taking the reciprocal. Thus, 0.008 cycles per pixel is indicative of a 125-pixel feature, which is one of the characteristic lengths of the feed spacer. Small harmonic peaks are present from dimples at around 0.095 cycles per pixel. The exception to this pattern is in the UF run, which used a permeate carrier membrane with a different weave than the others. The dimple characteristic length was about 14 pixels, yielding the peak at about 0.073 and harmonics at 0.037 and 0.15 cycles per pixel.
Figure 27. Power spectra for the blue channel of fouled membrane coupon images. In the inset, the region from 0.005 to 0.020 cycles per pixel is magnified to observe small but significant peaks. The permeate carrier dimples are fairly annoying in image analysis; they cause much more intensity variability and darker areas on the membrane than does the foulant. One of the beautiful characteristics of Fourier analysis, though, is that the dimple peaks can be separated easily from foulant peaks. The foulant lies on the spacer pattern with a characteristic repeating length of about 125 pixels (which at 600-dpi resolution is about 5 millimeter [mm]). This gives very strong peaks at 0.008 cycles per pixel and harmonics at multiples and halves of that frequency. The peak intensity is indicative of the level of fouling; the H. pygmaea fouling run had the highest intensity, with the MF run showing a lower, but fairly intense peak. Even for the UFrun, two small peaks at 0.08 and 0.016 are visible,
0 0.02 0.04 0.06 0.08 0.10
1
2
3
4
5
6
x 108
Frequency (cycles/pixel)
Inte
nsity
(Arb
itrar
y U
nits
)
H pygmaea shearing runMicrofiltered runUltrafiltered runNaCl run
0.008 0.016

Characterization of Membrane Foulants in Seawater Reverse Osmosis Desalination
45
while the NaCl run does not show these. This is especially informative, considering that the other features on the UF run were different because of the different permeate carrier membrane. It is hard to detect the foulant pattern in the UF run image, which makes the peaks in Fourier analysis small, but they are above the background and in the expected locations, so there is positive detection. An interesting observation is made about the intensity of the dimple-induced peaks: even though the dimples should be the same for each membrane, regardless of fouling, the dimple peaks at 0.047 cycles per pixel increase in intensity for increasing fouling. This may indicate that foulants accumulate in the dimples, which is what one would expect—permeate flows through the openings in the permeate carrier membrane and dimples form in those voids. The last noteworthy item is that there are clearly large wrinkles in the scanner images because of difficulty in flattening the membranes. However, the wrinkles are very low-frequency features and their peaks in the power spectrum lie far to the left and do not interfere with foulant peaks. Scanning Electron Microscopy To investigate the nature of foulants at the microscopic level, scanning electron microscopy (SEM) was employed. Membrane samples stored in a desiccator were sectioned into small (about 2-mm by 6-mm) strips and mounted with carbon tape on an SEM stage. Sputter coating for 30 seconds with gold palladium was employed to provide surface electrical conductivity. A JEOL 6060 SEM was employed in high vacuum mode at a voltage of 20 kilovolts (kV), and images were taken at 10,000 times magnification. Micrographs of the fouled membranes are displayed in Figure 28 along with a micrograph of a virgin Dow-Filmtec SW30HR membrane. Only a few SEM micrographs can be displayed, but the membranes were investigated at multiple locations to see the spatial variability in foulant-layer morphology. The images presented represent typical foulants seen across the coupons investigated. It is also recognized that foulant morphology in-situ could be very different than the morphologies visible by SEM because the samples had to be dried before examination. In the membrane coupon fouled by UF AOM (Figure 28b) there was foulant material present, though it did not cover the entire membrane surface. In the MF AOM case (Figure 28c) the membrane was more completely covered, though the underlying polymer morphology is still visible. In the direct spike of H. pygmaea phytoplankton (Figure 28d), the membrane was completely covered, and the foulant layer was quite thick. The image in Figure 28d was taken near the edge of the membrane section where, due to cutting, the foulant layer had separated and it was possible to see into the matrix of the cake layer. In Figure 28d, the cake layer is thick enough that the underlying membrane cannot be seen. This image was

Characterization of Membrane Foulants in Seawater Reverse Osmosis Desalination
46
taken from a section where the cake layer had cracked and separated near the edge of the coupon. Salt crystals formed during drying are present. It is interesting to note that there was only a 6% difference in flux decline between the membranes shown in Figure 28c and Figure 28d, so the thinner foulant layer was almost as detrimental to membrane performance as the thicker foulant layer. This could be due to the thick foulant layer being more porous, as it was comprised of larger particulate material.
Figure 28. SEM images of virgin and fouled Dow-Filmtec SW30HR RO membranes. a) Virgin membrane. b) Fouled by ultrafiltered AOM. c) Fouled by microfiltered AOM. d) Fouled by a direct spike of phytoplankton.

Characterization of Membrane Foulants in Seawater Reverse Osmosis Desalination
47
ATR-FTIR Another area where the Fourier transform is used is in attenuated total-reflectance Fourier transform infrared spectroscopy (ATR-FTIR). Of course, in this case it is impossible to see anything with the human eye in the time-domain data, so data are analyzed in the frequency domain only. One of the most useful ways to extract information from ATR-FTIR spectra is to compare the spectra in area plots, as in Figure 29. Each spectrum from the fouling runs is compared directly with the NaCl run, and differences indicate alterations caused by the foulant material. Red areas indicate locations where the fouled-membrane spectrum is higher than the control; these are wavelengths where foulant material absorbs infrared light more strongly than the membrane. Blue areas indicate locations where the fouled-membrane spectrum is lower than the control; these are wavelengths where foulant material absorbs less infrared light than the background membrane and effectively “blocks” the background. In the H. pygmaea shearing run, both of these effects are more prominent than the MF and UF runs, as expected. Nonabsorbing foulant areas are more prevalent in the MF run than US, also as expected. For the absorbing areas, however, the UF peaks are actually slightly larger than the MF peaks. (This was the same for triplicate scans at different locations on the membranes.) What seems apparent through ATR-FTIR analysis is that the dissolved foulant material (the fraction able to pass through MF and UF membranes) has strong infrared-absorbing character in the regions of 1545, 1655, and 3300 wavenumbers. The 3300 wavenumber region is likely due to O-H or N-H stretching of carbohydrates or proteins. The 1545 and 1655 wavenumber peaks could be interpreted as protein (amide I and II) peaks, but carbohydrates can also have strong absorbance in this region.

Characterization of Membrane Foulants in Seawater Reverse Osmosis Desalination
48
Figure 29. ATR-FTIR spectra of three fouled RO membranes compared with a control coupon of an NaCl run. Red indicates areas where the fouled membrane spectrum is higher than the control. Blue indicates areas where the fouled membrane spectrum is lower than the control.
10001500200025003000350040000
0.1
0.2
0.3
0.4
0.5
0.6
0.7
0.8
Wavenumber (cm-1)
Inte
nsity
Ultrafiltered runNaCl run
10001500200025003000350040000
0.1
0.2
0.3
0.4
0.5
0.6
0.7
0.8
Wavenumber (cm-1)
Inte
nsity
H pygmaea shearing runNaCl run
10001500200025003000350040000
0.1
0.2
0.3
0.4
0.5
0.6
0.7
0.8
Wavenumber (cm-1)
Inte
nsity
Microfiltered runNaCl run

Characterization of Membrane Foulants in Seawater Reverse Osmosis Desalination
49
4.5.4 Laser-Scanning Fluorometry Laser-scanning cytometry (LSC) was previously discussed as a technique for counting phytoplankton cells to characterize the extent of cell shearing. Because the technique was so responsive to phytoplankton (their fluorescence properties coincided well with the 635-nm excitation and 680-nm detection wavelengths), it was thought that the LSC might be useful in measuring foulant intensity. Strictly speaking, such a method is not “cytometry” as this term indicates single-cell counting, or analysis. Thus, instead of cytometry, the fouled-membrane scanning technique has been dubbed “LSF.” For LSF analysis, a small (1-inch square) section of membrane was cut out of the coupon, mounted on a microscope slide coverslip with double-sided tape, and placed on the sample stage. After scanning (as described previously for LSC work), the data were processed to generate a histogram of raw PMT data, as well as an image with spatial information. Figure 30 shows a side-by-side comparison of the LSF histogram and LSF image next to a visual image of the scanned coupon. In the histograms, one can see that the H. pygmaea run foulants covered the membrane surface and induced a quite high peak. The MF run also shows a strong tail on the high-voltage side, indicating a large amount of fluorescent material. In the UF run, the histogram seems to indicate that little or no fouling had occurred compared to the NaCl run control. The images in Figure 30 help visualize the data further. Note that to produce meaningful images, each data set was normalized to the edges of its histogram. Because of this, a particular gray-level in one image is not equivalent to the gray level of another image, so they should not be quantitatively compared. Also, it should be noted that the center of the LSF images is skewed because the scan does not cover the center region; strange features appearing in the center of the images should be ignored. Despite these caveats, plotting the LSF data in image form helps to see the foulant patterns (where white indicates intense fluorescence). Even in the UF run, the spacer lines can be detected using LSF while in the visual image those features are much less apparent. It appears, then, that the LSF is more sensitive than the scanner for fluorescent foulant detection. The fact that LSF worked so well for AOM detection lends insight into the nature of the organic foulants. Strict carbohydrates (starches, dextrans, or other polymers containing only sugar monomers) would not be expected to display significant fluorescence. Aminosugars or proteins, however, could exhibit fluorescence, and surely chlorophyll would yield a positive response. The literature needs to be explored and experiments need to be performed with a variety of organic-matter standards (proteins, polysaccharides, humic acids, etc.) to determine which kinds of materials have detectable fluorescence. There are many possible applications of the LSF technique, depending on the results of such work. For instance, bacterial biomass will likely have a much different fluorescence signature than AOM. If that is the case, LSF could be a powerful method of distinguishing between organic fouling and biofouling.
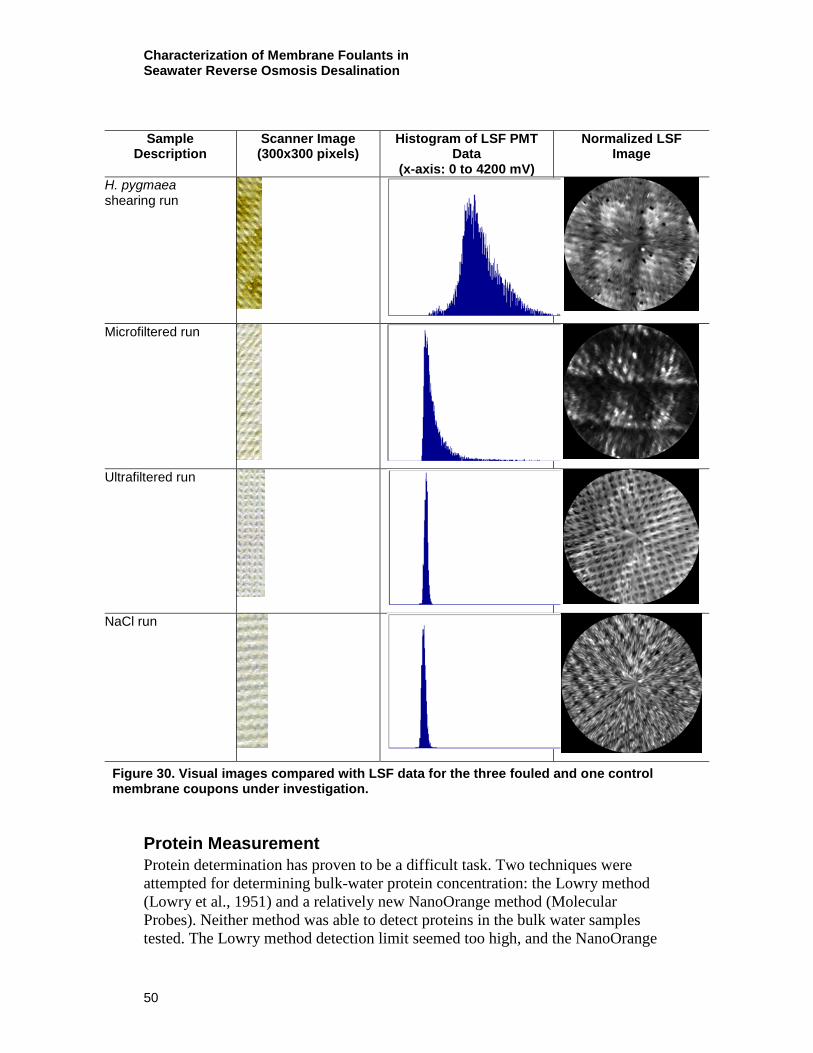
Characterization of Membrane Foulants in Seawater Reverse Osmosis Desalination
50
Sample
Description Scanner Image
(300x300 pixels) Histogram of LSF PMT
Data (x-axis: 0 to 4200 mV)
Normalized LSF Image
H. pygmaea shearing run
Microfiltered run
Ultrafiltered run
NaCl run
Figure 30. Visual images compared with LSF data for the three fouled and one control membrane coupons under investigation.
Protein Measurement Protein determination has proven to be a difficult task. Two techniques were attempted for determining bulk-water protein concentration: the Lowry method (Lowry et al., 1951) and a relatively new NanoOrange method (Molecular Probes). Neither method was able to detect proteins in the bulk water samples tested. The Lowry method detection limit seemed too high, and the NanoOrange
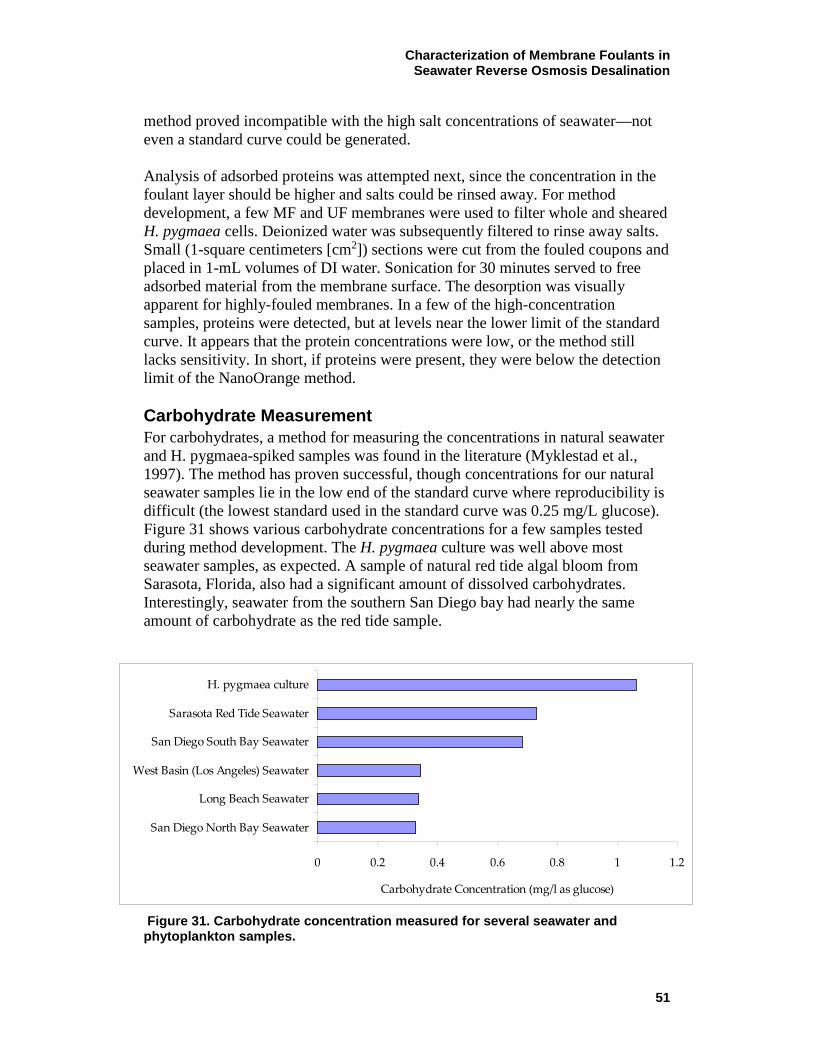
Characterization of Membrane Foulants in Seawater Reverse Osmosis Desalination
51
method proved incompatible with the high salt concentrations of seawater—not even a standard curve could be generated. Analysis of adsorbed proteins was attempted next, since the concentration in the foulant layer should be higher and salts could be rinsed away. For method development, a few MF and UF membranes were used to filter whole and sheared H. pygmaea cells. Deionized water was subsequently filtered to rinse away salts. Small (1-square centimeters [cm2]) sections were cut from the fouled coupons and placed in 1-mL volumes of DI water. Sonication for 30 minutes served to free adsorbed material from the membrane surface. The desorption was visually apparent for highly-fouled membranes. In a few of the high-concentration samples, proteins were detected, but at levels near the lower limit of the standard curve. It appears that the protein concentrations were low, or the method still lacks sensitivity. In short, if proteins were present, they were below the detection limit of the NanoOrange method. Carbohydrate Measurement For carbohydrates, a method for measuring the concentrations in natural seawater and H. pygmaea-spiked samples was found in the literature (Myklestad et al., 1997). The method has proven successful, though concentrations for our natural seawater samples lie in the low end of the standard curve where reproducibility is difficult (the lowest standard used in the standard curve was 0.25 mg/L glucose). Figure 31 shows various carbohydrate concentrations for a few samples tested during method development. The H. pygmaea culture was well above most seawater samples, as expected. A sample of natural red tide algal bloom from Sarasota, Florida, also had a significant amount of dissolved carbohydrates. Interestingly, seawater from the southern San Diego bay had nearly the same amount of carbohydrate as the red tide sample.
Figure 31. Carbohydrate concentration measured for several seawater and phytoplankton samples.
0 0.2 0.4 0.6 0.8 1 1.2
San Diego North Bay Seawater
Long Beach Seawater
West Basin (Los Angeles) Seawater
San Diego South Bay Seawater
Sarasota Red Tide Seawater
H. pygmaea culture
Carbohydrate Concentration (mg/l as glucose)

Characterization of Membrane Foulants in Seawater Reverse Osmosis Desalination
52
Carbohydrates in the foulant layer were desorbed with the same method used for protein analysis. Only a few samples were tested during method development, but the method appears to be very useful as a high concentration of carbohydrates was measured for a membrane fouled with H. pygmaea. Total Organic Carbon Measurement Measurement of total organic carbon (TOC) in seawater and algal-spiked samples was performed with an ultraviolet- (UV)-persulfate TOC analyzer (Phoenix 8000, Teledyne-Tekmar, Mason, Ohio). The UV-persulfate method is hindered greatly by the high chloride concentration in seawater, which interferes with the oxidation reaction that converts organic carbon into carbon dioxide (CO2). Samples were diluted approximately five-fold to decrease the chloride interference, which resulted in a higher detection limit. Even after dilution, the reaction is hindered, so CO2 detection must be integrated over a longer time period to capture the entire peak. This also results in a higher detection limit, because baseline CO2 readings are integrated along with the sample. Thus, whereas freshwater samples have a minimum detection limit of about 0.1 mg/L TOC, the minimum seawater sample detection limit is about 1.5 mg/L. The TOC for MF (0.45-µm) San Diego seawater was 1.07 ± 0.21 mg/L, where 0.21 is the standard error of triplicate measurements (standard error of triplicate measurements is used for reporting all concentration ranges in this section). This is below the reliable detection level established thus far for the method. Sarasota seawater with red tide phytoplankton had a TOC of 2.93 ± 0.11 mg/L. This TOC value is not extremely large, but fouling was evident in the RO system. In the RO shear experiments, phytoplankton cells were broken apart, releasing organic matter. To quantify this effect, samples were taken at different times during the RO shear run, filtered through a 0.22-µm nylon syringe filter, and frozen in 15-mL centrifuge tubes for later TOC analysis. A sample taken 5 minutes into the first shear run measured at 1.42 ± 0.10 mg/L. This was in the range of the method detection limit. After 6 hours, the TOC concentration was 4.40 ± 0.54 mg/L, indicating a significant increase in TOC. It appeared, then, that most of the TOC of the phytoplankton-spiked sample was within the cells and not released into the seawater matrix until after shearing. TOC was measured for algal cultures to quantify the change in TOC over incubation time. The data are shown in Figure 32. A sample of culture media (labeled “unspiked” in figure 32) was measured before addition of the culture spike. The media was made by adding nutrients and vitamins to 0.45-µm-filtered San Diego seawater. The organic matter already present in the seawater, and the vitamins contribute to the TOC for the unspiked sample. The algal spike was performed by adding a sample of ~250,000 cells per mL to the culture media at a ratio of 6:100 (culture volume : media volume). TOC measurements were made for cultures that were 2, 27, and 44 days old. To quantify the extracellular versus

Characterization of Membrane Foulants in Seawater Reverse Osmosis Desalination
53
intracellular TOC, samples were filtered through a 0.45-µm regenerated cellulose syringe filter. It was expected, based on previous TOC measurements, that filtration would remove most or all of the TOC. However, filtered samples actually showed a higher TOC concentration than unfiltered samples for the unspiked, 2-day, and 44-day cultures.
Figure 32. TOC measurements over time for cultures of H. pygmaea. Both unfiltered and filtered samples were measured. Error bars show the standard error of triplicate measurements; the ranges for some error bars were too small to be visible in the plot.
Clearly, there was a problem with the measurements, as the filtered samples should not contain more TOC than unfiltered samples. A possible explanation is that the syringe filter method involved rinsing with DI water, wasting several milliliters of sample through the filter, then collecting several milliliters for analysis. The wasting step was intended to remove any water left in the filter housing. However, during the wasting, phytoplankton formed a cake layer on the membrane; and the pressure needed for filtering was increased. It is possible that the higher pressure forced TOC from the cake layer into the sample. Further work will be needed to evaluate this explanation. Regardless, it can be inferred that the TOC in phytoplankton cultures was not all intracellular, as the cells (10 to 20 µm in diameter) are easily filtered out with 0.45-µm membranes. Perhaps the cells die and lyse during their life cycle, thus releasing their intracellular organic material into the seawater matrix, even without shearing. Also, the cultures contain bacteria; the sample purchased from the culture collection was xenic, as with most cultures in such collections. Many bacteria excrete extracellular organic material that would be measured in TOC analysis.
0
5
10
15
20
25
30
35
Unspiked 2 27 44
Days of Incubation
TOC
(mg/
l)
Unfiltered0.45-micron filtered


Characterization of Membrane Foulants in Seawater Reverse Osmosis Desalination
55
CONCLUSIONS Though the original intent of the project was to study RO membrane fouling by natural seawater organic matter, several hurdles had to be overcome in designing the experimental equipment and methods. Thus, some of the most important conclusions drawn during the project—principally from Phase 1—deal with practical issues that should be considered when attempting such experiments. From Phase 2, some conclusions are made about natural water sources and their fouling potential compared to surrogate foulants. In Phase 3, algogenic organic matter was utilized for several experiments; and it is possible to draw conclusions about the way AOM affected the membranes. Additionally, autopsy techniques for foulant characterization were developed and will be helpful for future researchers. Phase 1 Conclusions: Experimental Design Considerations The experimental design first attempted in this project was the batch internal recycle membrane test. The main reason for using this approach was to concentrate the foulant material in the membrane system and simulate later stages of a full-scale RO treatment train. It was anticipated that such a method would lead to more rapid fouling and more realistic results than a simple full-recycle setup. However, it was concluded that the BaIReMT approach suffered from several drawbacks. One of these was the inherent complexity in separating flux decline due to fouling from the decline due to increasing salt concentration. Both organics and salts increase in concentration over time with the BaIReMT method, but the salt effect dominates the flux decline. Thus, if the BaIReMT or similar procedures are to be employed, careful modeling of the salt concentration (or flux decline due to salt concentration) must be performed. In at least one study already published, it appears that fouling data with a BaIReMT system was probably erroneous (Kumar et al., 2006). In this study, the authors did not take appropriate measures to ensure that the flux decline curves presented were indeed caused by foulants and not by dissolved salts. The BaIReMT procedure also suffered from a lack of system stability. Small perturbations could cause wide swings in operating parameters, and control was difficult from one run to the next. In an effort to provide more control and repeatability, the “transient recovery test” procedure was used. This did, indeed, help with repeatability, but no flux decline difference was seen in waters with different organic-matter fractions. The transient recovery test, like the BaIReMT, involved high salt concentrations that limited the amount of flux that could be achieved in the system. There was an upper bound to pressure (1,000 psi); and at high salt concentrations, flux was limited by the heightened osmotic pressure. In other tests where full recycle was employed, salt concentrations were constant at

Characterization of Membrane Foulants in Seawater Reverse Osmosis Desalination
56
the initial level, and flux was maintained at a higher level during the run. There, the flux did tend to decline as foulants accumulated. It appeared, then, that high flux was more important than high organic matter concentration when fouling was to be studied in a short time period. For short-term bench-scale tests, it is advisable to run at the highest flux possible. That is achieved at the lowest salt concentration, which is obtained in the full recycle test. The full recycle test has another advantage over both the BaIReMT and the transient recovery tests: minimal operator involvement. The operator did not need to adjust the valves or tubing, and there was no change in crossflow velocity over the course of the run. The less the operator was involved, the more repeatable and stable were the tests. The BaIReMT procedure demands that an operator constantly monitor pressures and conductivities and decide when to make changes. It is difficult to make those changes in the exact same manner for each run. The transient recovery tests require less operator involvement because the salt concentration varied linearly and pressure was increased at defined intervals. But the least operator involvement was required—and the most repeatable results were obtained—with full recycle tests. In these, the operator simply set the pressure at a certain level and let the machine run. Simplicity and repeatability went hand in hand. Figure 33 displays a summary of the differences in operating parameters between bench-scale testing approaches. In the BaIReMT and Transient Recovery tests, the flux is held constant. Pressure is increased over time, with the largest increase in pressure at the beginning of the run where the salt concentration is changing. These tests enable a simulation of full-scale high-recovery and constant flux conditions. The transient recovery test is easier to control than the BaIReMT because the salt concentration and pressure change more steadily than in the BaIReMT test. In both the BaIReMT and Transient Recovery tests, flux decline must be modeled, taking into consideration the changing pressure and salt concentration. The Full Recycle test is performed at constant pressure and because the permeate is recycled directly back to the feed tank, the salt concentration does not change. The test can be run at higher initial pressure and, thus, higher initial flux than the BaIReMT and Transient Recovery tests. Flux decline is measured directly, since pressure and salt concentration are constant. Though this does not simulate the full-scale system, it is considered advantageous for bench-scale studies because of its ease of use and high flux leading to more rapid flux decline than in the other tests. In Figure 33, it is clear that the full recycle testing approach involves only one changing parameter: flux. In the other two tests, both pressure and salt concentration are changing. Thus, to determine membrane performance, one must consider both the salt concentration and the pressure. In the full recycle test, the flux is the only variable changing over time, so flux decline can be seen directly. The full recycle test does not simulate the full-scale system because at full scale a

Characterization of Membrane Foulants in Seawater Reverse Osmosis Desalination
57
constant flux is maintained. However, the full recycle test is advantageous for lab-scale work because it is easiest to perform and easiest to interpret. Some conclusions have been drawn about the time required for bench-scale tests. It appears that short-term tests (8 hours) for natural waters were insufficient because no significant flux decline could be observed. Twenty-four-hour tests seemed adequate when the organic-matter concentrations were sufficiently high. For natural waters with lower organic-matter loading, it seemed that a 4-day test at high flux (1,000-psi pressure) gave measurable flux decline. However, longer-term tests presented several challenges. For one, the system ran at very high pressure and needed a complex control system to avoid upsets, especially overnight when operators were absent. In that sense, the effort and complexity of the bench-scale test setup approached that required by pilot tests. If such a large effort is required, it decreases the attractiveness of bench-scale work. Secondly, corrosion is a problem. If a batch sample is used and the liquid is constantly recycled, any corrosion products present will increase in concentration over time and cause fouling. A small amount of corrosion almost always occurs, even with 316 stainless steel components. Thus, the longer a system is run, the more likely it is that corrosion products will affect the membranes. Thirdly, suspended biomass is present in all natural waters and will grow over time. For tests with high organic-matter content, bacterial numbers increased significantly over just 24 hours. When the system is run for several days in recycle mode, it is quite likely that the organic matter composition will change due the biological activity and biofilms will form. Thus, longer timeframes for bench-scale tests are not always advisable.
Figure 33. Diagram of operating conditions for three bench-scale testing schemes.

Characterization of Membrane Foulants in Seawater Reverse Osmosis Desalination
58
The volume of seawater used for bench-scale tests is also an important consideration. It was found that 20 liters of seawater were sufficient to observe flux decline due to fouling in 24 hours when the organic matter concentration was sufficiently high (as in the Sarasota red tide sample and in the AOM experiments). For natural waters, it is quite probable that a foulant limitation exists as there was not enough organic matter in the water to form a sufficiently thick foulant layer. For example, four days and 20 liters were needed in one case to observe flux decline. In many other cases, 8 liters were used and no significant flux could be observed. It is advisable, then, to use as much volume as possible in bench-scale testing so that no foulant limitation is experienced. Ideally, a flow-through system could be employed where the sample is continuously refreshed instead of completely recycled (as was done with the long-term sample throughput test). It is important to note, however, that the volume of seawater did not appear to be as important as the initial flux and foulant concentration. Even for long-term, high-volume experiments, flux decline was not observed with natural seawater if the initial flux was too low. Phase 2 Conclusions: Optimization and Surrogate Foulants During Phase Two of the project, many of the results obtained fed into the conclusions given above during Phase One. The experiments were used to optimize the bench-scale testing protocol and gain a better understanding of how the operating parameters affected the results. One of the most significant achievements was rather simple by outward appearance: developing a method to measure the very low permeate volumes and still maintain a full recycle system. The approach was to use a permeate collection device that emptied automatically (see Figure 2). This simple device made it possible to achieve high resolution in flux measurements over long periods of time. Such a tool can be fashioned in the lab for almost no cost, yet it provided better results than an expensive flow meter. The other main conclusion from Phase 2 was that even for very high levels of organic matter, the flux decline for bench-scale RO systems was small. This was an important realization for the research team that was much more experienced with MF and UF. In MF and UF, flux decline can be rapidly observed, and often the final flux will be an order of magnitude lower than the initial. This is because MF and UF have high initial fluxes that are quickly reduced when material blocks the pores. For RO systems, however, the membrane resistance is very high due to the nonporous polyamide layer and the initial flux is quite low. The membrane itself restricts water much more readily than any foulant layer of heterogeneous, deposited, noncross-linked material. Thus, it requires a very thick cake layer to induce flux decline.

Characterization of Membrane Foulants in Seawater Reverse Osmosis Desalination
59
Phase 3 Conclusions: Algogenic Organic Matter Fouling During Phase 3, the project focused on RO fouling by AOM. Phytoplankton spiked into natural seawater did reduce membrane performance by forming a cake layer at the membrane surface. A high concentration of phytoplankton (40,000 cells per milliliter; similar to what would be seen in a fairly intense bloom event) only caused a flux decline of about 18% in 24 hours. The membrane was completely covered with thick material, as seen in visual and SEM images. In the experiments, phytoplankton were sheared and internal organic matter was released into the water matrix. After fractionation through a 0.45-µm microfilter, significant flux decline still occurred, so dissolved organic matter (<0.45 µm) is suspected to be a fouling culprit. However, UF filtration did not result in as much fouling, so apparently the smaller material (<100 kDa) is not as significant in fouling. It is suspected that the bulk of fouling was caused by organic material in the size range between 100 kDa and 0.45 µm. In seawater literature, this is considered “very high molecular weight DOM” (Ogawa and Tanoue, 2003). It is concluded that very high molecular weight DOM is a principal foulant, when the concentrations are sufficient. Phytoplankton are composed of polysaccharides, proteins, lipids, and a variety of organic compounds. From the analyses, it appeared that polysaccharides were more abundant in the foulant layer than proteins, but due to issues with protein measurements, the results are inconclusive. It was shown in the foulant surrogate studies that polysaccharides form thick foulant layers, so it is reasonable to suspect polysaccharides as foulants. However, the foulant material fluoresced well with laser scanning fluorometry, which would not be expected for strict polysaccharides. The fluorescence properties indicate that chlorophyll, chlorophyll derivatives, or proteins, with aromatic ring structures were presenting in the foulant layer. Thus, the foulant is a heterogeneous mixture, and not one chemical species alone is to blame. Heterogeneity was also shown in the FTIR spectra, where peaks for both proteins and polysaccharides were present. Through image analysis and LSF data, it was concluded that fouling was influenced greatly by both the feed spacer and the permeate carrier spacer. Foulants accumulated in dead zones under the feed spacer and in dimples formed by the permeate carrier membrane. This leads to the hypothesis that fouling would be decreased if it were possible to make a module where dead zones were decreased and the permeate spacer had smaller holes that maintained a flatter (less dimpled) membrane.

Characterization of Membrane Foulants in Seawater Reverse Osmosis Desalination
60
Applicability to Full-Scale Desalination Facilities The results of this project lend insight into the type of fouling process that might occur at full scale. It was shown that natural waters do not cause flux decline in a short time period. However, this is not a complete indicator of fouling in and of itself. Significant levels of foulant can build up on the membrane long before flux decline is apparent. Once flux decline is noticed, there is probably a thick coat of material already attached. If operators wait until that point to clean the membranes, it may be difficult to remove the material. Additionally, a thick foulant layer may harbor and encourage bacterial biofilms that thicken the foulant layer and make it even more difficult to remove. It is advisable to perform frequent cleanings to remove deposited material. Exactly how often to clean would depend on source water and operating conditions, but it certainly should be done before flux decline is noticed. As for the applicability of the bench-scale tests to help engineers and operators characterize the fouling potential of natural waters, it is clear that the procedure is not as simple as one might hope, but the methods are still useful. Flux decline is minimal, so the flux data should have high resolution to really distinguish differences in flux from one sample to another. Even then, flux decline in the bench-scale system is not a sufficient predictor of fouling in and of itself; after a bench-scale test the membrane should be removed and examined. Fortunately, one simple way to examine the membrane is by image analysis. This can give an indication of the extent of fouling in the bench-scale test without costly wet-chemical techniques. Of course, wet-chemical techniques (TOC, polysaccharide, and protein measurements on the desorbed foulants) do lend valuable information, and these should be used where possible. ATR-FTIR also helps to characterize the foulant material. If these kinds of analytical techniques are used after the bench-scale test, one gains an understanding of the amount and type of foulants present in the tested water. In the future, LSF may be a valuable autopsy method. The key advantage of LSF is that it has the potential to distinguish between algogenic and bacterial organic matter because they have distinctive fluorescence properties. The prototype instrument used during this project is just the first step toward development of instruments with more chemical characterization capabilities. In summary, this project lends insight into the phenomenon of fouling in seawater RO desalination. We understand a little better how algogenic organic matter impacts the process and how future research can be performed to gain further insights. The techniques can be employed at bench, pilot, or full scale to aid in making desalination a more viable technology.
Characterization of Membrane Foulants in Seawater Reverse Osmosis Desalination
61
REFERENCES Abd El Aleem, F.A., K.A. Al-Sugair, and M.I. Alahmad. 1998. Biofouling
problems in membrane processes for water desalination and reuse in Saudi Arabia. International Biodeterioration & Biodegradation 41:1, 19–23.
Aluwihare, L.I., D.J. Repeta, and R.F. Chen. 1997. A major biopolymeric
component to dissolved organic carbon in surface sea water. Nature 387:6629, 166–169.
Andersen, R.A. 2005. Algal culturing techniques. Elsevier/Academic Press,
Burlington, Mass. Asatekin, A., S. Kang, M. Elimelech, and A.M. Mayes. 2007. Anti-fouling
ultrafiltration membranes containing polyacrylonitrile-graft-poly (ethylene oxide) comb copolymer additives. Journal of Membrane Science 298:1–2, 136–146.
Benner, R., J.D. Pakulski, M. Mccarthy, J.I. Hedges, and P.G. Hatcher. 1992.
Bulk Chemical Characteristics of Dissolved Organic-Matter in the Ocean. Science 255:5051, 1561–1564.
Boerlage, S.F.E., M. Kennedy, M.P. Aniye, and J.C. Schippers. 2003.
Applications of the MFI-UF to measure and predict particulate fouling in RO systems. Journal of Membrane Science 220:1–2, 97–116.
Braghetta, A., F.A. DiGiano, and W.P. Ball. 1998. NOM accumulation at
NF membrane surface: Impact of chemistry and shear. Journal of Environmental Engineering 124:11, 1087–1097.
Brehant, A., V. Bonnelye, and M. Perez. 2003. Assessment of ultrafiltration as a
pretreatment of reverse osmosis membranes for surface seawater desalination. Water Science and Technology: Water Supply 3:5–6, 437–445.
Bruchet, A., C. Rousseau, and J. Mallevialle. 1990. Pyrolysis-GC-MS for
investigating high-molecular-weight THM precursors and other refractory organics. Journal of the American Water Works Association 82:9, 66-74.
Bureau of Reclamation. 2003. Desalination and Water Purification Technology
Roadmap. DWPR Program Number 95. Butt, F.H., F. Rahman, and U. Baduruthamal. 1997. Characterization of foulants
by autopsy of RO desalination membranes. Desalination 114:1, 51–64.

Characterization of Membrane Foulants in Seawater Reverse Osmosis Desalination
62
Cloern, J.E., T.S. Schraga, C.B. Lopez, N. Knowles, R.G. Labiosa, and R. Dugdale. 2005. Climate anomalies generate an exceptional dinoflagellate bloom in San Francisco Bay. Geophysical Research Letters 32:14.
Dalvi, A.G.I., R. Al-Rasheed, and M.A. Javeed. 2000. Studies on organic foulants
in the seawater feed of reverse osmosis plants of SWCC. Desalination 132:1–3, 217–232.
DiGiano, F A., S. Arweiler, and J.A. Riddick. 2000. Alternative tests for
evaluating NF fouling. Journal American Water Works Association 92:2, 103–115.
Drioli, E., F. Lagana, A. Criscuoli, and G. Barbieri. 1999. Integrated membrane
operations in desalination processes. Desalination 122:2, 141–145. Edzwald, J.R. 1993 . Algae, bubbles, coagulants, and dissolved air flotation.
Water Science and Technology 27:10, 67–81. Elimelech, M., X. Zhu, A.E. Childress, and S. Hong. 1997. Role of membrane
surface morphology in colloidal fouling of cellulose acetate and composite aromatic polyamide reverse osmosis membranes. Journal of Membrane Science 127:1, 101–109.
Glucina, K., A. Alvarez, and J.M. Laine. 2000. Assessment of an integrated
membrane system for surface water treatment. Desalination 132:1–3, 73–82.
Grasshoff, K., M. Ehrhardt, and K. Kremling. 1983. Methods of Seawater
Analysis. Verlag Chemie GmbH, Weinheim. Gregor, J., and B. Marsalek. 2004. Freshwater phytoplankton quantification by
chlorophyll alpha: a comparative study of in vitro, in vivo and in situ methods. Water Research 38:3, 517–522.
Harvey, G.R., D.A. Boran, L.A. Chesal, and J.M. Tokar. 1983. The Structure of
Marine Fulvic and Humic Acids. Marine Chemistry 12:2–3, 119–132. Heil, C.A., P.M. Glibert, and C.L. Fan. 2005. Prorocentrum minimum (Pavillard)
Schiller – A review of a harmful algal bloom species of growing worldwide importance. Harmful Algae 4:3, 449–470.
Her, N., G. Amy, H.R. Park, and M. Song. 2004. Characterizing algogenic
organic matter (AOM) and evaluating associated NF membrane fouling. Water Research 38:6, 1427–1438.

Characterization of Membrane Foulants in Seawater Reverse Osmosis Desalination
63
Hoek, E.M.V., and M. Elimelech. 2003. Cake-Enhanced Concentration Polarization: A New Fouling Mechanism for Salt-Rejecting Membranes. Environmental Science and Technology 37:24, 5581–5588.
Howe, K.J., and M.M. Clark. 2002. Fouling of microfiltration and ultrafiltration
membranes by natural waters. Environmental Science & Technology 36:16, 3571–3576.
Howe, K.J., K.P. Ishida, and M.M. Clark. 2002. Use of ATR/FTIR spectrometry
to study fouling of microfiltration membranes by natural waters. Desalination 147:1–3, 251–255.
Johnsen, G., B.B. Prezelin, and R.V.M. Jovine. 1997. Fluorescence excitation
spectra and light utilization in two red tide dinoflagellates. Limnology and Oceanography 42:5, 1166–1177.
Jucker, C., and M.M. Clark. 1994. Adsorption of aquatic humic substances on
hydrophobic ultrafiltration membranes. Journal of Membrane Science 97:37–52.
Kahru, M., and B. G. Mitchell. 1998. Spectral reflectance and absorption of a
massive red tide off southern California. Journal of Geophysical Research-Oceans 103:C10, 21601–21609.
Kim, K.J., A.G. Fane, M. Nystrom, and A. Pihlajamaki. 1997. Chemical and
electrical characterization of virgin and protein-fouled polycarbonate track-etched membranes by FTIR and streaming-potential measurements. Journal of Membrane Science 134:2, 199–208.
Kim, S. H., and J. S. Yoon. 2005. Optimization of microfiltration for seawater
suffering from red-tide contamination. Desalination 182:1–3, 315–321. Kim, S.H., S.H. Lee, J.S. Yoon, S.Y. Moon, and C.H. Yoon. 2007. Pilot plant
demonstration of energy reduction for RO seawater desalination through a recovery increase. Desalination 203:1-3, 153–159.
Kirkpatrick, B., L.E. Fleming, L.C. Backer, J.A. Bean, R. Tamer, G. Kirkpatrick,
T. Kane, A. Wanner, D. Dalpra, A. Reich, and D.G. Baden. 2006. Environmental exposures to Florida red tides: Effects on emergency room respiratory diagnoses admissions. Harmful Algae 5:5, 526–533.
Kirkpatrick, B., L.E. Fleming, D. Squicciarini, L.C. Backer, R. Clark,
W.Abraham, J. Benson, Y.S. Cheng, D. Johnson, R. Pierce, J. Zaias, G.D. Bossart, and D.G. Baden. 2004. Literature review of Florida red tide: implications for human health effects. Harmful Algae 3:2, 99–115.

Characterization of Membrane Foulants in Seawater Reverse Osmosis Desalination
64
Kumar, M., S S. Adham, and W.R. Pearce. 2006. Investigation of seawater reverse osmosis fouling and its relationship to pretreatment type. Environmental Science & Technology 40:6, 2037–2044.
Ladner, D.A., B.W. Lee, and M M. Clark. 2007. Laser scanning cytometry for
enumeration of fluorescent microspheres. Journal / American Water Works Association 99:3, 110–117.
Laine, J.M., J.P. Hagstrom, M.M. Clark, and J. Mallevialle. 1989. Effects of
Ultrafiltration Membrane-Composition. Journal American Water Works Association 81:11, 61–67.
Lechuga-Deveze, C.H., and M.D. Morquecho-Escamilla. 1998. Early spring
potentially harmful phytoplankton in Bahia Concepcion, Gulf of California. Bulletin of Marine Science 63:3, 503–512.
Leparc, J., S. Rapenne, C. Courties, P. Lebaron, P. Jean, V. Jacquemet, and
G. Turner. 2007. Water quality and performance evaluation at seawater reverse osmosis plants through the use of advanced analytical tools. Desalination 203:1–3, 243–255.
Li, Q.L., and M. Elimelech. 2006. Synergistic effects in combined fouling of a
loose nanofiltration membrane by colloidal materials and natural organic matter. Journal of Membrane Science 278:1–2, 72–82.
Li, Q.L., Z.H. Xu, and I. Pinnau. 2007. Fouling of reverse osmosis membranes by
biopolymers in wastewater secondary effluent: Role of membrane surface properties and initial permeate flux. Journal of Membrane Science 290:1–2, 173–181.
Lindau, J., and A.S. Jonsson. 1994. Cleaning of ultrafiltration membranes after
treatment of oily waste water. Journal of Membrane Science 87:1–2, 71–78.
Lowry, O.H., N.J. Rosebrough, A.L. Farr, and R J. Randall. 1951. Protein
Measurement with the Folin Phenol Reagent. Journal of Biological Chemistry 193:1, 265–275.
Maso, M., and E. Garces. 2006. Harmful microalgae blooms (HAB); problematic
and conditions that induce them. Marine Pollution Bulletin 53:10–12, 620–630.
Mccarthy, M.D., J.I. Hedges, and R. Benner. 1993 . The Chemical-Composition
of Dissolved Organic-Matter in Seawater. Chemical Geology 107:3–4, 503–507.

Characterization of Membrane Foulants in Seawater Reverse Osmosis Desalination
65
Moorthi, S.D., P.D. Countway, B.A. Stauffer, and D.A. Caron. 2006. Use of quantitative real-time PCR to investigate the dynamics of the red tide dinoflagellate Lingulodinium polyedrum. Microbial Ecology 52:1, 136–150.
Myklestad, S.M., E. Skanoy, and S. Hestmann. 1997. A sensitive and rapid
method for analysis of dissolved mono- and polysaccharides in seawater. Marine Chemistry 56:3–4, 279–286.
Ogawa, H., and E. Tanoue. 2003. Dissolved Organic Matter in Oceanic Waters.
Journal of Oceanography 59:2, 129–147. Peltzer, E.T., and N.A. Hayward. 1996. Spatial and temporal variability of total
organic carbon along 140 degrees W in the equatorial Pacific Ocean in 1992. Deep-Sea Research Part Ii-Topical Studies in Oceanography 43:4–6, 1155–1180.
Petry, M., M.A. Sanz, C. Langlais, V. Bonnelye, J.P. Durand, D. Guevara,
W.M. Nardes, and C.H. Saemi. 2007. The El Coloso (Chile) reverse osmosis plant. Desalination 203:1–3, 141–152.
Pierce, R.H., M.S. Henry, C J. Higham, P. Blum, M.R. Sengco, and
D.M. Anderson. 2004. Removal of harmful algal cells (Karenia brevis) and toxins from seawater culture by clay flocculation. Harmful Algae 3:2, 141–148.
Reynolds, T K. 2007. Desalination in San Francisco Bay: Results from the
MMWD SWRO Pilot Program. AWWA Membrane Technology Conference and Exposition.
Rosenberger, S., C. Laabs, B. Lesjean, R. Gnirss, G. Amy, M. Jekel, and
J.C. Schrotter. 2006. Impact of colloidal and soluble organic material on membrane performance in membrane bioreactors for municipal wastewater treatment. Water Research 40:4, 710–720.
Schafer, A.I., U. Schwicker, M.M. Fischer, A.G. Fane, and T.D. Waite. 2000.
Microfiltration of colloids and natural organic matter. Journal of Membrane Science 171:2, 151–172.
Sengco, M.R., and D.M. Anderson. 2004. Controlling harmful algal blooms
through clay Flocculation. Journal of Eukaryotic Microbiology 51:2, 169–172.

Characterization of Membrane Foulants in Seawater Reverse Osmosis Desalination
66
Sengco, M.R., A.S. Li, K. Tugend, D. Kulis, and D.M. Anderson. 2001. Removal of red- and brown-tide cells using clay flocculation. I. Laboratory culture experiments with Gymnodinium breve and Aureococcus anophagefferens. Marine Ecology-Progress Series 210:41–53.
Teng, C.K., M.N. A. Hawlader, and A. Malek. 2003. An experiment with
different pretreatment methods. Desalination 156:1–3, 51–58. Tribus, M., R. Asimow, N. Richardson, C. Gastaldo, K. Elliott, J. Chambers, and
R. Evans. 1959. Thermodynamic and Economic Considerations in the Preparation of Fresh Water from the Sea. University of California, Los Angeles.
Trigueros, J.M., and E. Orive. 2000. Tidally driven distribution of phytoplankton
blooms in a shallow, macrotidal estuary. Journal of Plankton Research 22:5, 969–986.
van Heemst, J.D.H., L. Megens, P.G. Hatcher, and J.W. de Leeuw. 2000. Nature,
origin and average age of estuarine ultrafiltered dissolved organic matter as determined by molecular and carbon isotope characterization. Organic Geochemistry 31:9, 847–857.
Vernon-Clark, R.N., E.D. Goldberg, and K.K. Bertine. 1995. Organic and
Inorganic Characterization of Marine Colloids. Chemistry and Ecology 11:69–83.
Welschmeyer, N.A. 1994. Fluorometric Analysis of Chlorophyll-A in the
Presence of Chlorophyll-B and Pheopigments. Limnology and Oceanography 39:8, 1985–1992.
Whipple, S.J., B.C. Patten, and P.G. Verity. 2005. Life cycle of the marine alga
Phaeocystis: A conceptual model to summarize literature and guide research. Journal of Marine Systems 57:1–2, 83–110.
Wilf, M., and K. Klinko. 1998. Effective new pretreatment for seawater reverse
osmosis systems. Desalination 117:1-3, 323–331. Yiantsios, S.G., and A.J. Karabelas. 2003. An assessment of the Silt Density
Index based on RO membrane colloidal fouling experiments with iron oxide particles. Desalination 151:3, 229–238.
Zhu, X., and M. Elimelech. 1997. Colloidal fouling of reverse osmosis
membranes: Measurements and fouling mechanisms. Environmental Science and Technology 31:12, 3654–3662.