Embed Size (px)
Citation preview
CHARACTERIZATION OF
ADIPOSITY-ASSOCIATED CHANGES
IN THE ADIPOSE TISSUE OF
PERIPARTAL DAIRY COWS
by
Megan Lynn Clark
A thesis submitted to the Faculty of the University of Delaware in partial
fulfillment of the requirements for the degree of Honors Bachelor of Science in Pre-
Veterinary Medicine and Animal Biosciences with Distinction
Spring 2014
© 2014 Megan Lynn Clark
All Rights Reserved

CHARACTERIZATION OF
ADIPOSITY-ASSOCIATED CHANGES
IN THE ADIPOSE TISSUE OF
PERIPARTAL DAIRY COWS
by
Megan Lynn Clark
Approved: __________________________________________________________
Dr. Robert Dyer, VMD, Ph.D.
Professor in charge of thesis on behalf of the Advisory Committee
Approved: __________________________________________________________
Dr. Tanya Gressley, Ph.D.
Committee member from the Department of Animal and Food Sciences
Approved: __________________________________________________________
Dr. Nicole Donofrio, Ph.D.
Committee member from the Board of Senior Thesis Readers
Approved: __________________________________________________________
Michael Arnold, Ph.D.
Director, University Honors Program

iii
ACKNOWLEDGMENTS
I would like to extend a huge thank you to Dr. Robert Dyer who made this
entire project possible. As much as you’d like to debate the fact, you are the one who
has taught me all that I know (to date) about research and the one who has made this
entire project possible. Thank you for the countless hours of your time you donated,
your unwavering patience and your infectious optimism. Most of all, thank you for
bestowing the wonderful gift upon me which I will undoubtedly pass along to any and
every young, upcoming student I get the chance to. I truly cannot thank you enough
for all of the inspiration and encouragement you’ve given me over the years. I am so
honored to have met and worked with you, and look forward to being a fellow
colleague. Go Penn and go Quakers!
A special thank you goes out to Beth Morris who was a huge help in sizing
countless adipocytes and getting this project to where it is now. Likewise, thank you
to Amanda Barnard who helped to keep me sane in the lab, and who was there to
make some (now comical) mistakes with me! Thank you to the Undergraduate
Research Program for their generous, continued grant support and for making this
Senior Thesis possible.
iv
TABLE OF CONTENTS
LIST OF TABLES ....................................................................................................... vii
LIST OF FIGURES ..................................................................................................... viii ABSTRACT ................................................................................................................. xii
1 INTRODUCTION .............................................................................................. 1
1.1 Defining adiposity ..................................................................................... 1
1.1.1 White adipose tissue: Functional compartments ........................... 1
1.1.1.1 Adipocytes ...................................................................... 2 1.1.1.2 Stromal cell fraction ....................................................... 3
1.2 Murine and human models of adiposity and metabolic syndrome ............ 4
1.2.1 Adipocyte hypertrophy vs. hyperplasia ......................................... 4
1.2.1.1 Adipocyte hyperplasia .................................................... 5 1.2.1.2 Adipocyte hypertrophy ................................................... 7
1.2.2 T cell activation and dysregulation in adipose tissue .................. 10
1.3 Adiposity in dairy cows ........................................................................... 11
1.3.1 Industry standards to increase adiposity ...................................... 11 1.3.2 Shift from lipogenesis to lipolysis at parturition ......................... 12
1.3.2.1 Blood metabolite elevations ......................................... 13
1.3.3 Liver options for NEFA influx .................................................... 13 1.3.4 Previous studies of bovine AT inflammation .............................. 15 1.3.5 Importance of research ................................................................ 16
1.3.6 Hypothesis and Objectives .......................................................... 17
2 MATERIALS AND METHODS ..................................................................... 18
2.1 Materials .................................................................................................. 18
v
2.1.1 Reagents ...................................................................................... 18 2.1.2 Antibodies .................................................................................... 19
2.1.3 Equipment .................................................................................... 20 2.1.4 Supplies ....................................................................................... 20
2.2 Methods ................................................................................................... 20
2.2.1 Animal subjects ........................................................................... 20 2.2.2 Adipocyte sizing .......................................................................... 24
2.2.3 Lymph node crude cell fraction isolation .................................... 25 2.2.4 Adipose tissue SCF isolation ....................................................... 26
2.2.4.1 Collagenase preparation ............................................... 26
2.2.4.2 Adipose tissue SCF isolation ........................................ 26
2.2.5 Staining for flow cytometry ......................................................... 27 2.2.6 Fluorescence Activated Cell Sorting (FACS) analysis ............... 28
3 RESULTS ......................................................................................................... 31
3.1 Adipocyte area and BCS ......................................................................... 31 3.2 Adipocyte size across tissue depots ......................................................... 34
3.3 Frequency distribution of adipocyte area ................................................ 37 3.4 Immune cell infiltrates in mesenteric adipose tissue ............................... 40
3.4.1 LN population characteristics ...................................................... 40
3.4.2 ASCF population characteristics ................................................. 41
3.4.3 Gating controls ............................................................................ 42 3.4.4 CD11b .......................................................................................... 45 3.4.5 CD172 .......................................................................................... 46
3.4.6 CD3 .............................................................................................. 47 3.4.7 CD11b and CD172 ...................................................................... 48 3.4.8 CD11b and CD3 .......................................................................... 51
3.4.9 Mesenteric LN immune cell infiltrate profile .............................. 53 3.4.10 Mesenteric ASCF immune cell infiltrate profile ......................... 54
4 DISCUSSION ................................................................................................... 56
4.1 Adipocyte area and BCS ......................................................................... 56 4.2 Adipocyte area by tissue depot ................................................................ 60 4.3 Characterizing immune cell infiltrates .................................................... 60
4.3.1 Mesenteric lymph node ............................................................... 60
4.3.2 Adipose stromal cell fraction ....................................................... 61

vi
4.4 Conclusions ............................................................................................. 65 4.5 Future areas of research ........................................................................... 66
REFERENCES ............................................................................................................. 68
vii
LIST OF TABLES
Table 1: Monoclonal primary antibodies employed to immunophenotype AT
macrophages and lymphocytes in bovine ASCF and lymph node crude
cell fraction (Bill Davis, Washington State University School of
Veterinary Medicine, Monoclonal Antibody Center, Pullman, WA,
USA) and corresponding fluorescent-conjugated secondary antibodies
(Jackson ImmunoResearch, West Grove, PA, USA) .............................. 19
Table 2: Body condition score scale from 1-5 adapted from Penn State Body
Condition Scoring System (Heinrichs et al., 1989,
http://extension.psu.edu/animals/dairy/nutrition/nutrition-and-
feeding/body-condition-scoring, 2004) ................................................... 22

viii
LIST OF FIGURES
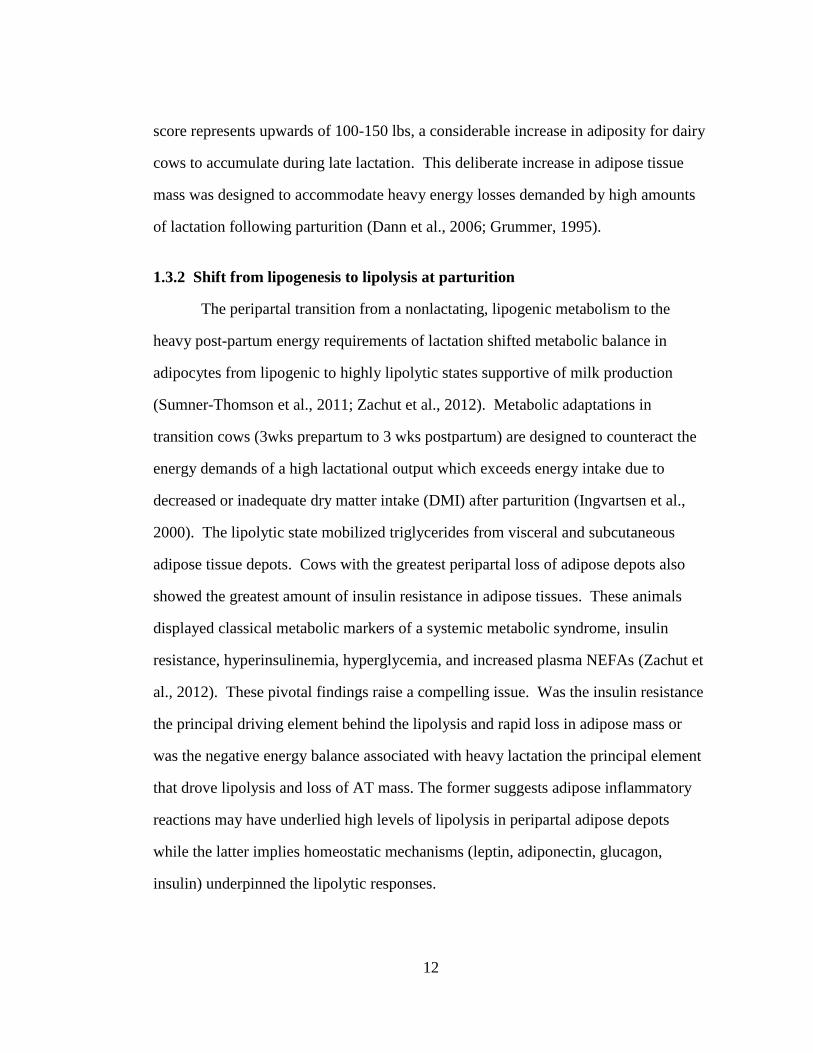
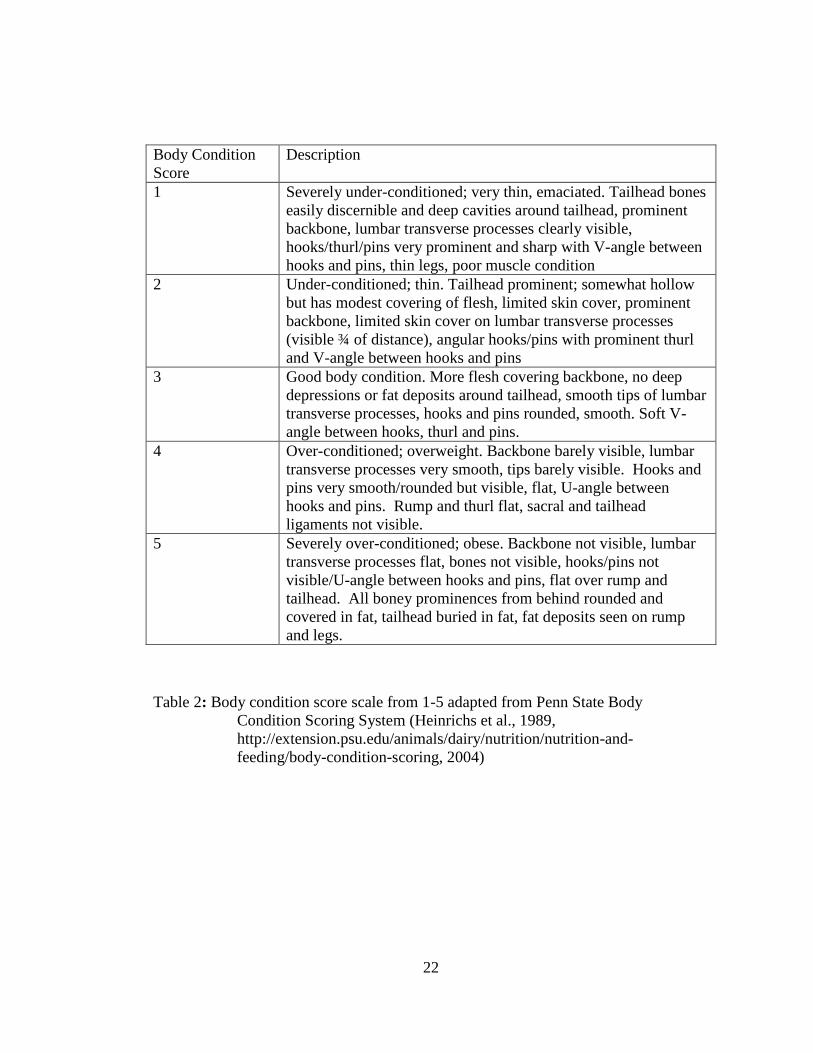
Figure 1. Underweight cow, BCS=2.25. Visible hooks and pin bones with a V-
shaped thurl. Backbone prominent; can easily see transverse lumbar
processes. ................................................................................................. 23
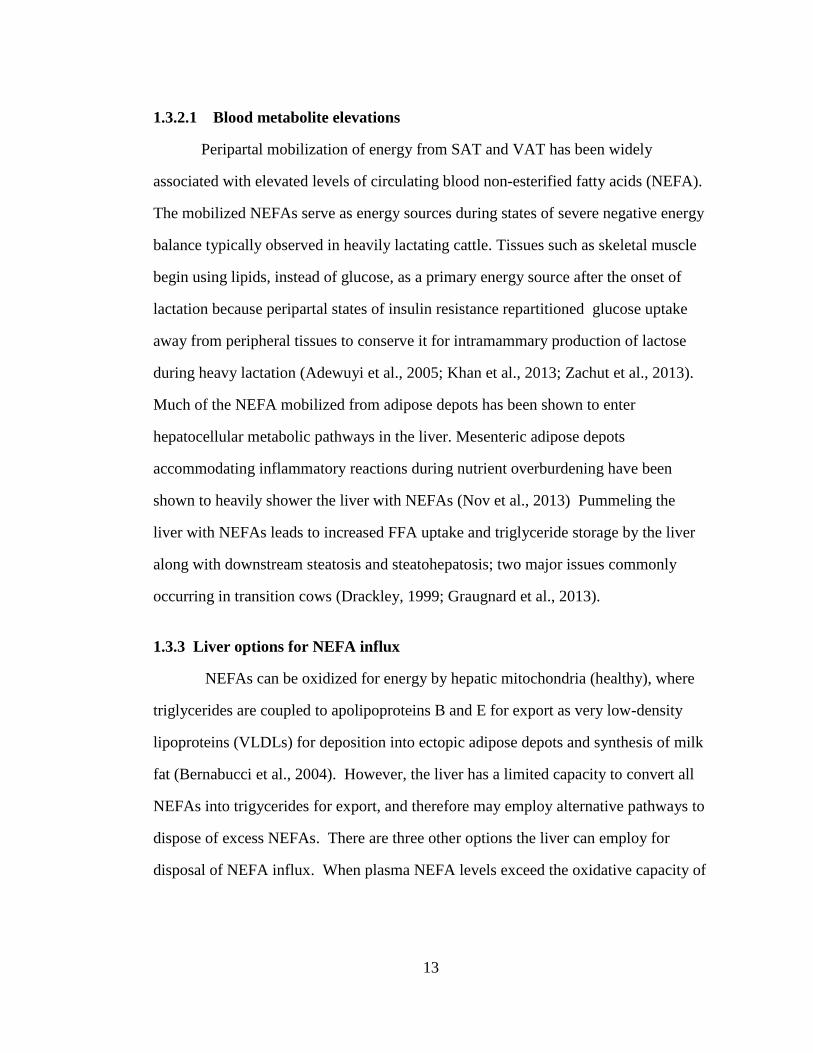
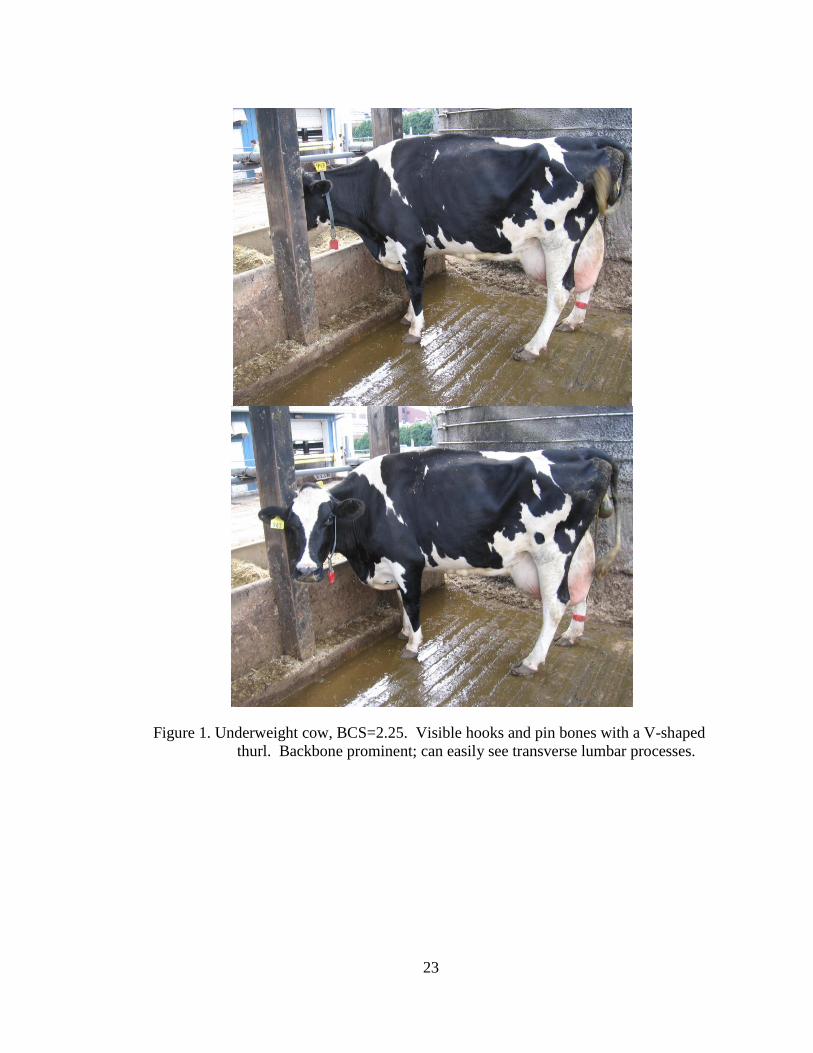
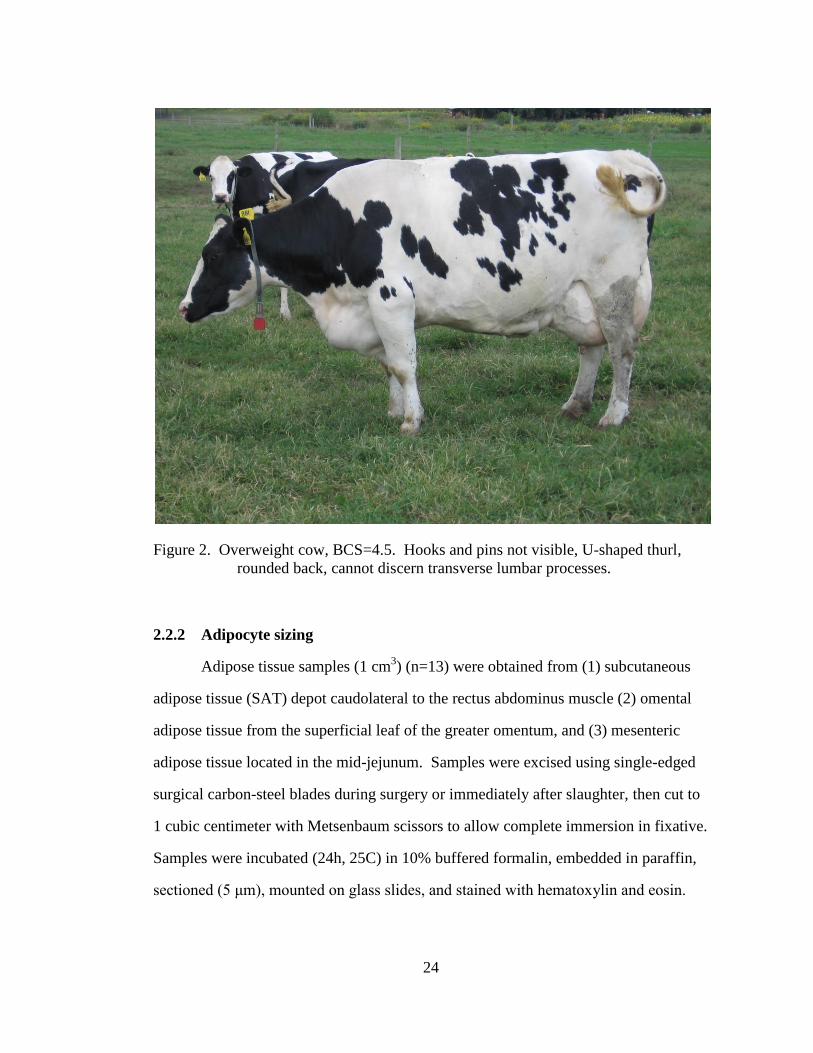
Figure 2. Overweight cow, BCS=4.5. Hooks and pins not visible, U-shaped thurl,
rounded back, cannot discern transverse lumbar processes. ................... 24
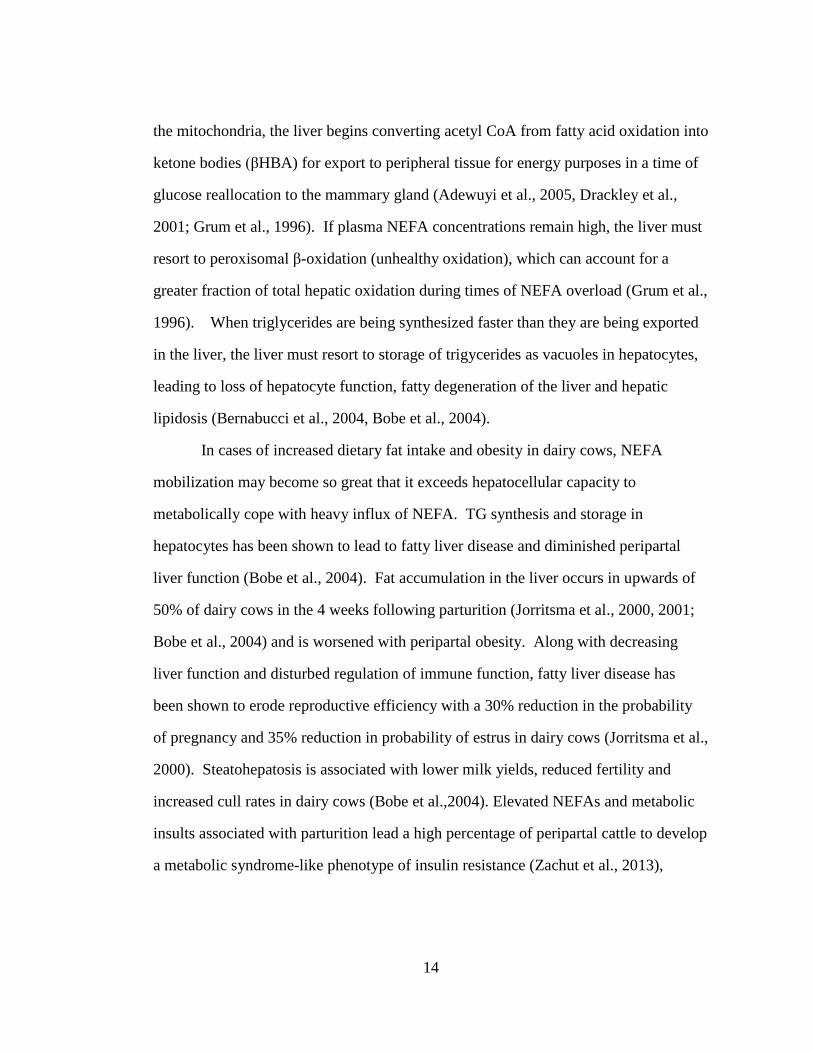
Figure 3. Mesenteric adipocyte cross-sectional area (μm) of 20 randomly selected
adipocytes from a randomly selected field (100X). ................................ 25
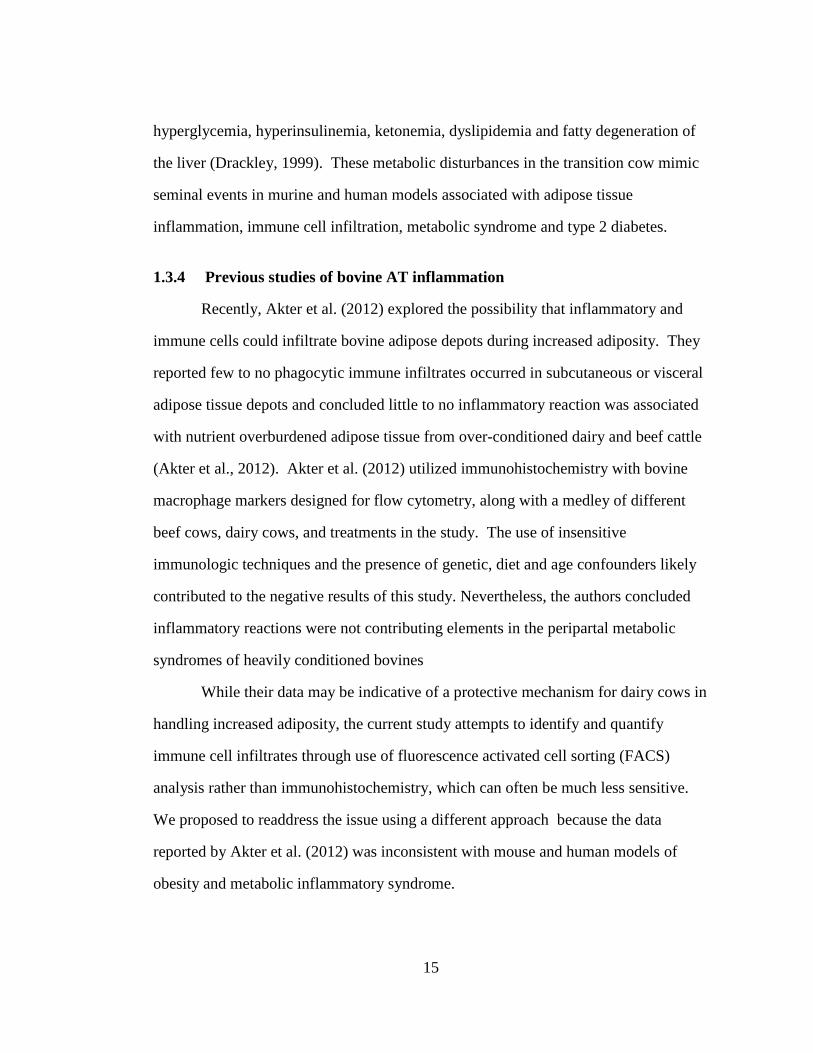
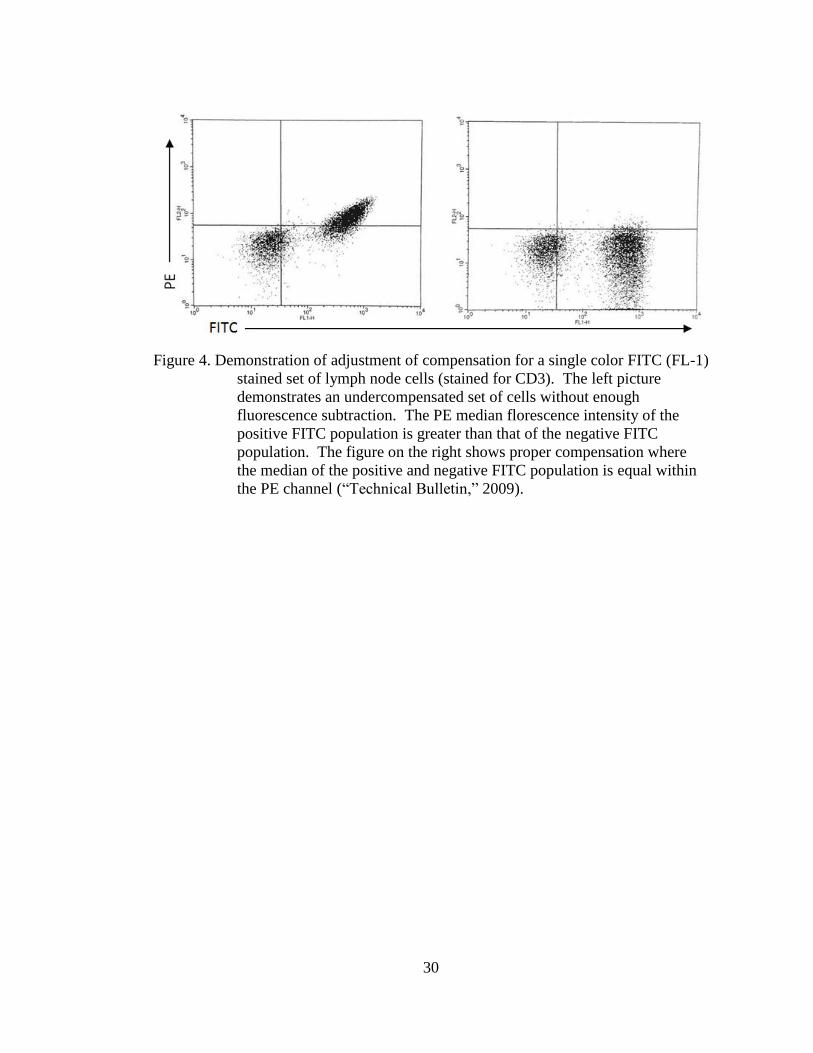
Figure 4. Demonstration of adjustment of compensation for a single color FITC
(FL-1) stained set of lymph node cells (stained for CD3). The left
picture demonstrates an undercompensated set of cells without enough
fluorescence subtraction. The PE median florescence intensity of the
positive FITC population is greater than that of the negative FITC
population. The figure on the right shows proper compensation where
the median of the positive and negative FITC population is equal
within the PE channel (“Technical Bulletin,” 2009). .............................. 30
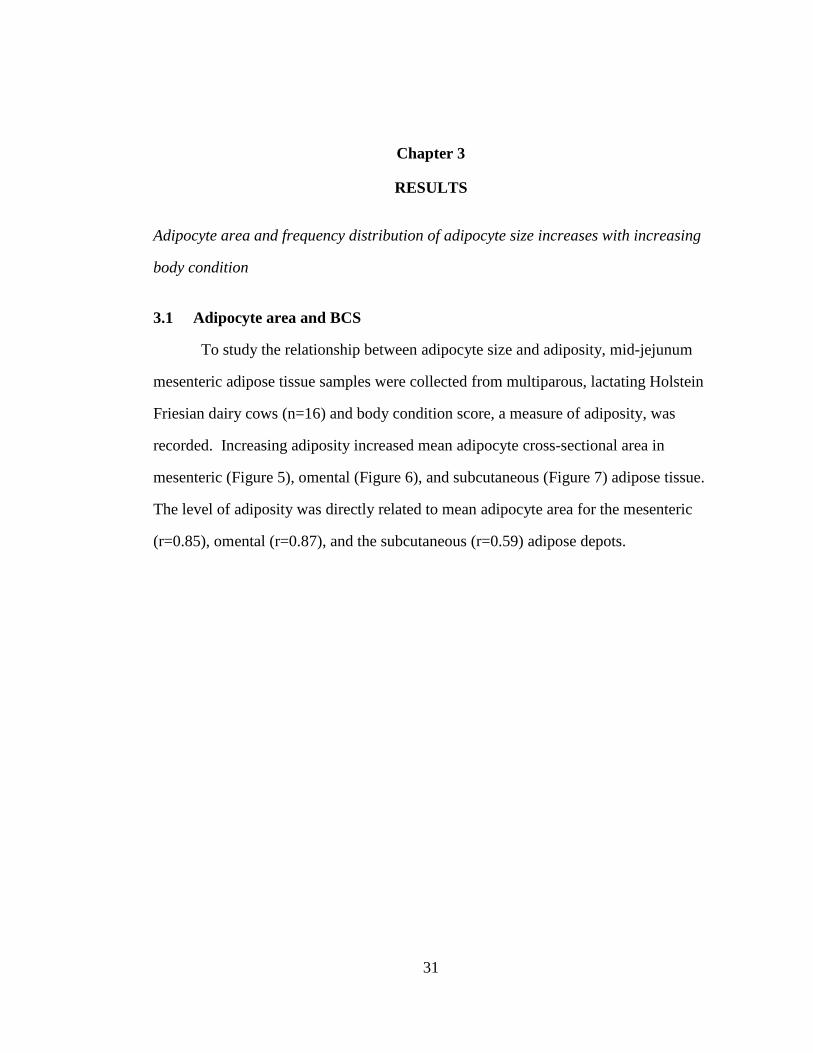
Figure 5. Level of adiposity (body condition) is directly correlated to mean
mesenteric cross-sectional adipocyte area (μm2) in bovine mid-
jejunum mesenteric adipose tissue (r=0.85) (n=16). ............................... 32
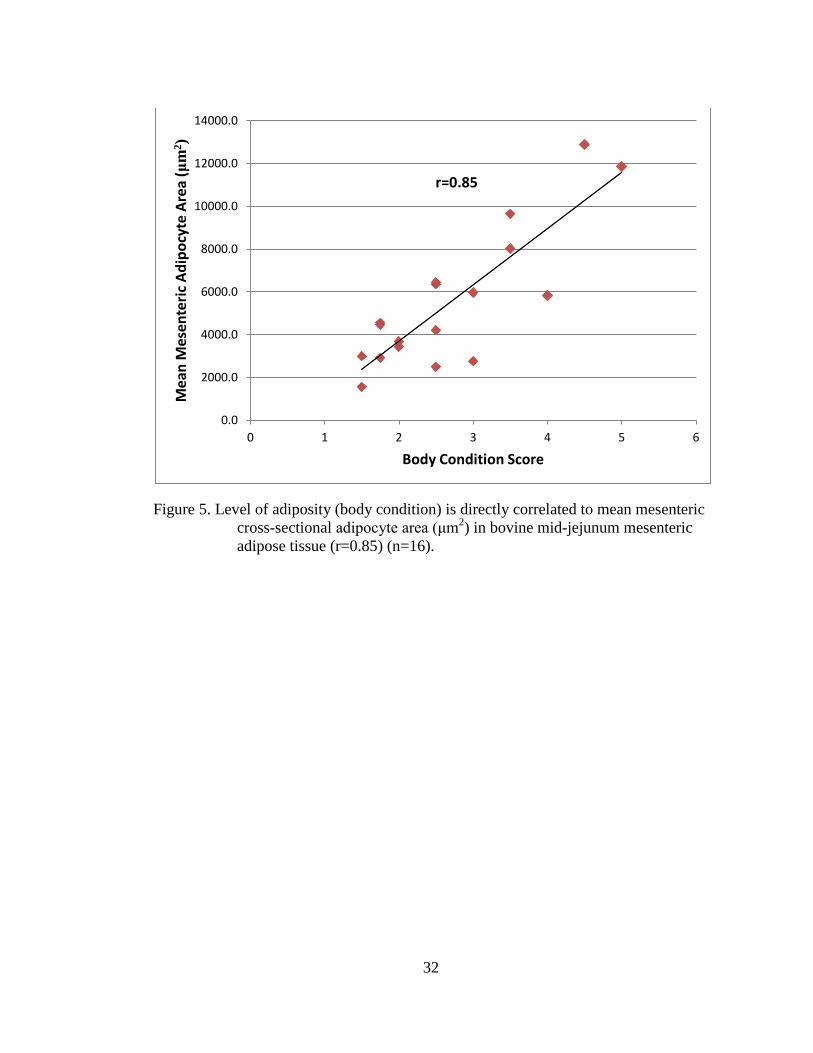
Figure 6. Level of adiposity (body condition) is directly correlated to mean omental
cross-sectional adipocyte area (μm2) in bovine omental adipose tissue
(r=0.87) (n=15). ....................................................................................... 33
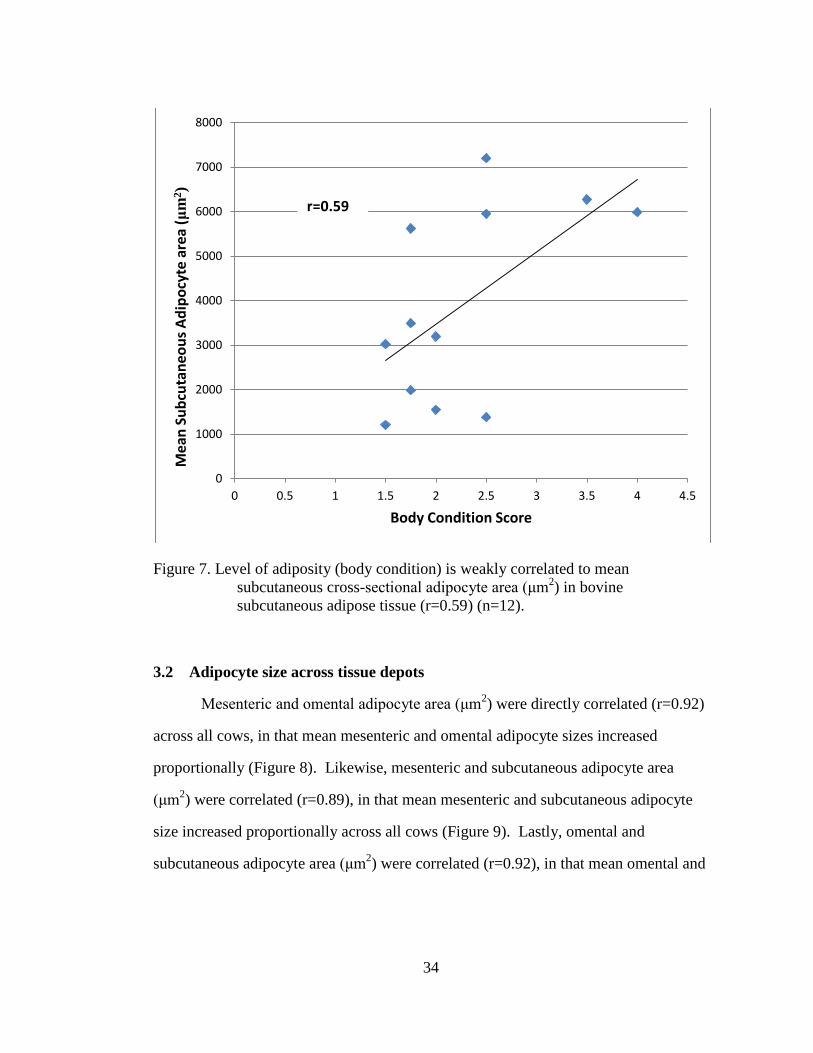
Figure 7. Level of adiposity (body condition) is weakly correlated to mean
subcutaneous cross-sectional adipocyte area (μm2) in bovine
subcutaneous adipose tissue (r=0.59) (n=12). ......................................... 34
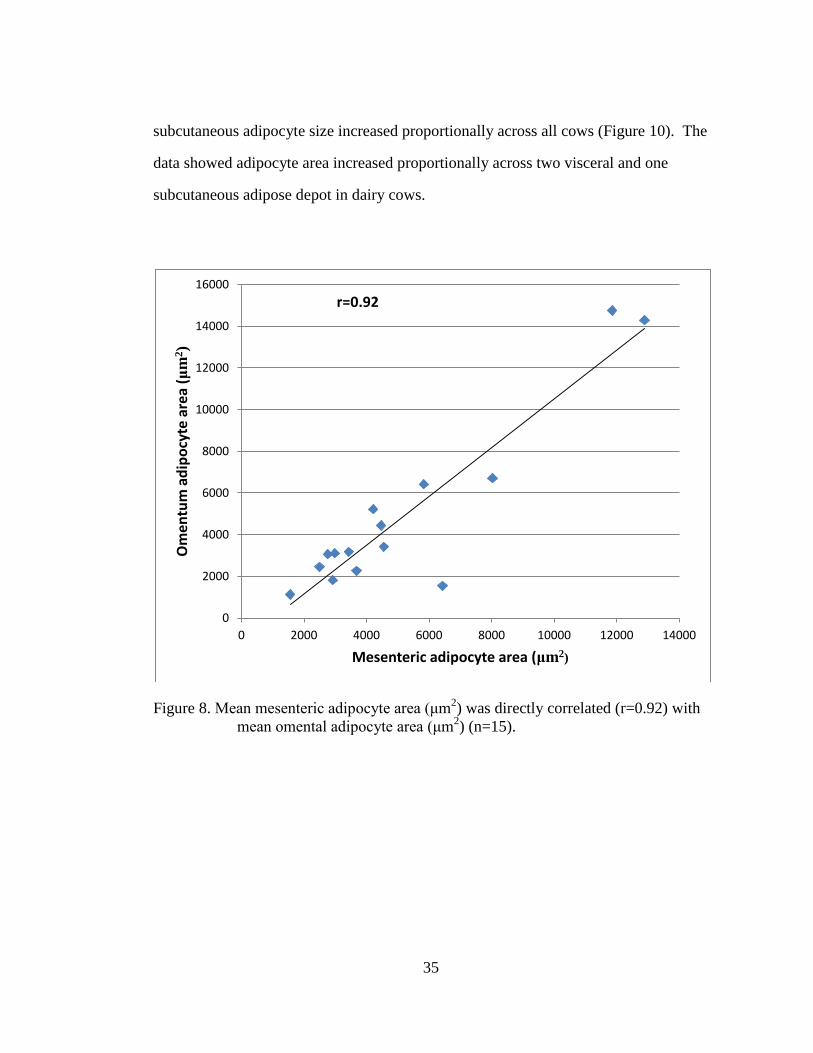
Figure 8. Mean mesenteric adipocyte area (μm2) was directly correlated (r=0.92)
with mean omental adipocyte area (μm2) (n=15). ................................... 35
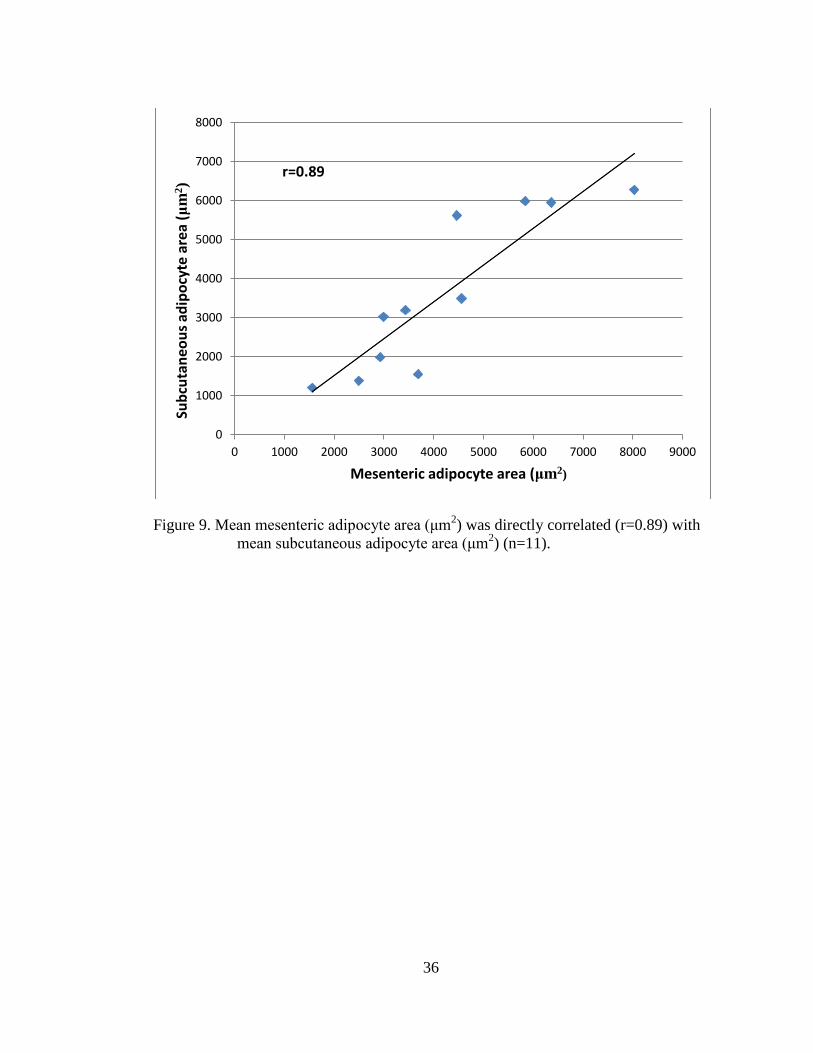
Figure 9. Mean mesenteric adipocyte area (μm2) was directly correlated (r=0.89)
with mean subcutaneous adipocyte area (μm2) (n=11). .......................... 36
ix
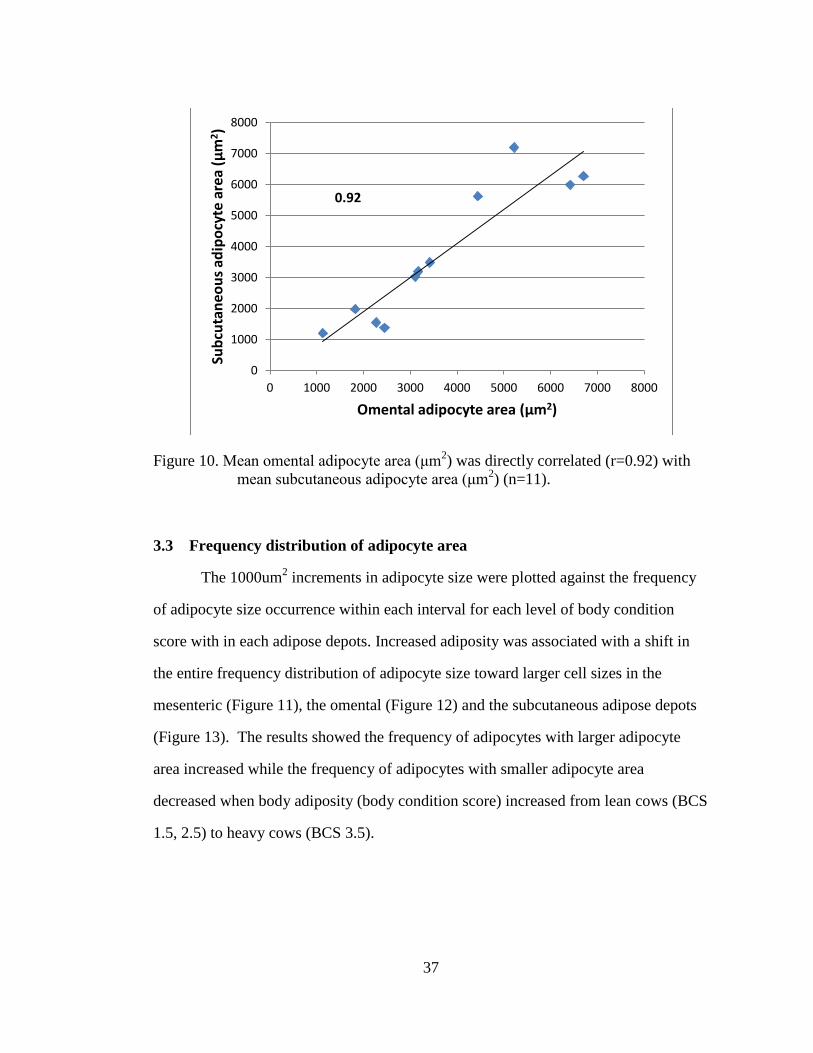
Figure 10. Mean omental adipocyte area (μm2) was directly correlated (r=0.92)
with mean subcutaneous adipocyte area (μm2) (n=11). .......................... 37
Figure 11. Increased level of adiposity (body condition) shifts the frequency of
mesenteric adipocyte cross-sectional area (μm) toward larger cell sizes
in lean (BCS 1.5 (n=5), 2.5 (n=2)) and heavy (BCS 3.5 (n=2)) dairy
cows. ........................................................................................................ 38
Figure 12. Increased level of adiposity (body condition) shifts the frequency of
omental adipocyte cross-sectional area (μm) toward larger cell sizes in
lean (BCS 1.5 (n=2), 2.5 (n=3)) and heavy (BCS 3.5 (n=1), 4.5 (n=1))
dairy cows. ............................................................................................... 39
Figure 13. Increased level of adiposity (body condition) shifts the frequency of
subcutaneous adipocyte cross-sectional area (μm) toward larger cell
sizes in lean (BCS <2.0 (n=5), 2.0-3.0 (n=5)) and heavy (BCS >3.5
(n=2)) dairy cows. ................................................................................... 40
Figure 14. Cytogram of lymph node crude cell fraction cells circled within the gate
labeled “R1”. Forward scatter (FSC) and side scatter (SSC) of light
from cells were measured by a FACSCalibur flow cytometer and
gated cells were analyzed for fluorescence. ............................................ 41
Figure 15. Cytogram of the mesenteric adipose stromal cell fraction circled within
the gate. Forward scatter (FSC) and side scatter (SSC) of light from
cells were measured by a FACSCalibur flow cytometer and gated
cells were analyzed for fluorescence. ...................................................... 42
Figure 16 Representative sample of double negative control lymph node crude
fraction (A) and adipose stromal cell fraction (B) cells stained with
both FITC and PE conjugated secondary antibodies, no primary
antibody stain. Quadrant gates were established through analyzing
secondary only stain after adjusting for single color stain
compensation levels. ............................................................................... 43
Figure 17. Representative quadrant statistics for control cells stained with
secondary antibodies only. Red circles highlight the intentional 1% of
cell events falling in the UL and LR quadrants with over 97% of gated
events in the LL quadrant. ....................................................................... 44
Figure 18. Representative sample of unstained LN crude cell fraction (A) and
unstained ASCF (B) for verification of gates set from cells stained
only secondary antibodies. ...................................................................... 45
x
Figure 19. Representative sample of CD11b+ macrophages, dendritic cells, and
CD8+ effector T lymphocytes comprise 24.9%±2.47 (mean±SEM)
(n=6) of the LN crude cell fraction (A) and 12.7%±4.3 (n=3) of the
ASCF (B) as seen in cells positively emitting PE fluorescence in the
UL quadrants. .......................................................................................... 46
Figure 20. Representative sample of CD172+ macrophages, dendritic cells, and
monocytes comprise 6.4%±0.9 (mean±SEM) (n=6) of the LN crude
cell fraction (A) and 14.8%±8.7 (n=3) of the ASCF (B) as seen in
cells positively emitting FITC fluorescence in the LR quadrants. .......... 47
Figure 21. Representative sample of CD3+ T lymphocytes comprise 77.9%±3.5
(mean±SEM) (n=6) of the LN crude cell fraction (A) and 7.9%±1.1
(n=3) of the ASCF (B) as seen in cells positively emitting FITC
fluorescence in the LR quadrants. ........................................................... 48
Figure 22. Representative sample of CD11b and CD172 double stained LN crude
cell fraction (n=7) (A) containing primarily CD11b+/CD172-
monocytes, macrophages, CD8+ lymphocytes and dendritic cells and
CD11b+/CD172+ macrophages and ASCF (n=3) (B) containing
primarily CD11b+/CD172- monocytes, macrophages, lymphocytes
and dendritic cells and CD11b-/CD172+ macrophages. ......................... 50
Figure 23. Mesenteric lymph nodes (n=7) contained CD11b+/CD172-
macrophages, monocytes and/or dendritic cells, CD11b+/CD172+
macrophages, and CD11b-/CD172+ macrophages. Mesenteric adipose
SCF (n=3) contained CD11b+/CD172- macrophages, monocytes
and/or dendritic cells, CD11b+/CD172+ macrophages, and CD11b-
/CD172+ macrophages. Note these early results showed the single
positive CD172 macrophage fractions in the SCF may be higher in
mesenteric adipose depots compared to the mesenteric lymph nodes.
Data expressed as mean±SEM ................................................................ 51
Figure 24. Representative sample of CD11b and CD3 double stained LN crude cell
fraction (n=2) (A) containing primarily CD11b-/CD3+ lymphocytes
and CD11b+/CD3+ T lymphocytes and ASCF (n=3) (B) containing
primarily CD11b+/CD3- monocytes, macrophages and dendritic cells
and CD11b-/CD3+ T lymphocytes.......................................................... 52
xi
Figure 25. Mesenteric lymph nodes (n=2) contained CD11b+/CD3- macrophages,
monocytes and/or dendritic cells, CD11b+/CD3+ T lymphocytes, and
CD11b-/CD3+ T lymphocytes. Mesenteric adipose SCF (n=2)
contained CD11b+/CD3- macrophages, monocytes and/or dendritic
cells, CD11b+/CD3+ lymphocytes, and CD11b-/CD3+ lymphocytes.
Note the double positive cell fractions in the SCF were nearly
nonexistent compared to the levels in the lymph node. Data expressed
as mean±SEM. ......................................................................................... 53
Figure 26. Mesenteric lymph node crude cell fraction contains 24.9%±2.47
(X±SEM) CD11b+ macrophages/dendritic cells (n=6), 6.4%±0.9
CD172+ macrophages (n=6), and 77.9%±3.5 CD3+ T lymphocytes
(n=3). Data expressed as mean±SEM. .................................................... 54
Figure 27. Mesenteric adipose stromal cell fraction (n=3) contains 12.7%±4.3
CD11b+ macrophages/dendritic cells, 14.8%±8.7 CD172+
macrophages, and 7.9%±1.1 CD3+ T lymphocytes. Data expressed as
mean±SEM. ............................................................................................. 55
xii
ABSTRACT
Modern nutritional programs in the dairy industry have been designed to
increase adiposity during late lactation. Energy stored as fat is subsequently mobilized
to support deep nadirs in lactational energy drain in the next lactation. Human and
murine obesity models showed nutrient overburdened adipose tissues developed
adipocyte hypertrophy and increased inflammatory and immune cell infiltration that
led to inflammation (metabolic inflammation). Very little is known about the
implications of increasing adipose tissue mass on metabolic inflammatory disorders in
dairy cattle even though insulin resistance, dyslipidemia, and steatohepatosis are
associated with heavy lactation. Accordingly, the purpose of this study was to begin to
relate adipocyte area and immune cell infiltrates in bovine adipose tissue to adiposity.
We hypothesized that bovine adipocytes expand in size (hypertrophy) in direct
proportion to increased states of adiposity, and that immune and inflammatory cells
exist as endogenous inhabitants of these adipose depots. Tissues were collected from
mesenteric, omental, and subcutaneous adipose tissue (AT) depots of lactating
Holstein dairy cows. Tissues were either fixed, stained and mounted to measure
adipocyte size, or digested for isolation of the AT stromal cell fraction (ASCF).
Isolated mesenteric ASCF cells, along with mesenteric lymph nodes (positive control),
were fixed and stained for flow cytometric analysis. Mean mesenteric and omental
adipocyte sizes increased in direct proportion (r=0.85, r=0.87) to body condition score
(BCS) indicating hypertrophy, whereas mean subcutaneous adipocyte area was weakly
correlated with BCS (r=0.59). Moreover, adipocyte hypertrophy caused a shift in the
xiii
frequency distribution of adipocyte size toward larger cell sizes. Mesenteric ASCF
contained 12.7%±4.3 CD11b+ macrophages/dendritic cells, 14.8%±8.7 CD172+
macrophages, and 7.9%±1.1 CD3+ T lymphocytes on average (n=3). These data
indicated that dairy cows respond to nutrient burdens with hypertrophic responses in
adipocytes across mesenteric and omental adipose tissue, parallel to adipocyte
responses in human and murine models of obesity. Likewise, the results suggested
that subcutaneous adipose tissue (SAT) was a highly variable depot which was not as
closely regulated as visceral adipose tissue. FACS analysis of mesenteric ASCF
showed that endogenous populations of T lymphocytes and macrophages/dendritic
cells exist in the mesenteric adipose tissue. Collectively, the data suggests immune
functions may impact metabolic homeostasis in bovine visceral adipose depots.
1
Chapter 1
INTRODUCTION
1.1 Defining adiposity
Adiposity is defined as the fraction of total body mass residing in adipose
tissue mass. In bovines, white adipose tissue is divided into visceral adipose tissue
(VAT) surrounding the organs and subcutaneous adipose tissue (SAT) depots lying
underneath the skin. In addition to VAT and SAT depots, adipose tissue
accompanying the mammary gland comprises a large amount of total body adipose,
especially in lactating bovines. Mesenteric adipose, the deepest VAT depot, suspends
the intestines in the abdomen in a web-like manner and is found in abundance around
the jejunum. A second visceral adipose tissue depot is omental adipose, which begins
at its attachment to the stomach and spleen and expands over the ventral abdomen,
lying superficial to the mesentery. Subcutaneous adipose tissue lies beneath the skin,
with larger depots localized around the tailhead, backbone, hook and pin bones, and
over the rectus abdominis muscles in bovines.
1.1.1 White adipose tissue: Functional compartments
Although white adipose tissue was once viewed as solely an energy storage
organ, various studies have illuminated its functions as one of the most important
endocrine organs in the body (Daniel et al., 2003, Suganami et al., 2012). Adipose
tissue is comprised of both the adipocyte parenchyma and the adipose stromal cell
fraction (ASCF) interspersed between the adipocytes.
2
1.1.1.1 Adipocytes
Adipocytes are the endemic cell type of adipose tissue, making up the
parenchyma of the tissue. Adipocytes are lipid droplets which have coalesced together
into a lipid vesicle to internalize triglycerides, the storage form of fat. As a major
energy source, triglycerides (TGs) have a 3 carbon sugar backbone (glycerol) with
three 18-22 carbon long fatty acid chains covalently linked via ester bonds to the
glycerol backbone. TGs are formed from metabolic intermediates (glycerol) derived
from glucose metabolism and long chain fatty acids (LCFAs). The LCFAs are derived
by absorption and digestion of exogenous sources like dietary fat or endogenous
sources such as fat mobilized from adipose or hepatic tissues. Adipocytes synthesize
and subsequently store TGs in large cytoplasmic fat vesicles. Ongoing TG synthesis
and storage leads to progressive distention of the cytoplasmic fat vacuole,
compression of the nucleus to one side of the cell, and over distention of the plasma
membrane. The primary metabolic function of an adipocyte is to serve as a storage
unit for triglycerides. TGs are mobilized from fat vesicles under states of heavy
activation of the sympathetic nervous system or during acute or chronic states of
negative energy balance.
Along with energy storage, adipocytes play a major functional role in the
crosstalk between endocrine and immune systems. Being that endocrine
communication is necessary for adipose tissue to remain in constant equilibrium with
the body’s energy state, heavy vascularization in the adipose tissue provides a vehicle
for this communication. Adipocytes secrete factors, known as adipokines, which have
a variety of cell signaling effects across a variety of organ systems. Adipokines can
have effects on the hypothalamus to signal satiety (leptin), the vasculature to recruit
immune cells (MCP-1), the surrounding tissue to create a pro-inflammatory
3
environment and activate macrophages (TNF-a), the adipocytes to regulate glucose
uptake and fatty acid metabolism (adiponectin), and many other organ systems in
through their various endocrine functions. Pro-inflammatory signals generated by
adipocytes support insulin resistance, lipolysis and suppression of preadipocyte
development. On the contrary, anti-inflammatory signals favor lipogenesis,
preadipocyte progenitor cell activity and expansion, and insulin sensitivity. This wide
range of functional effects demonstrates the crucial role of adipokines in maintenance
or perturbation of adipose tissue homeostasis.
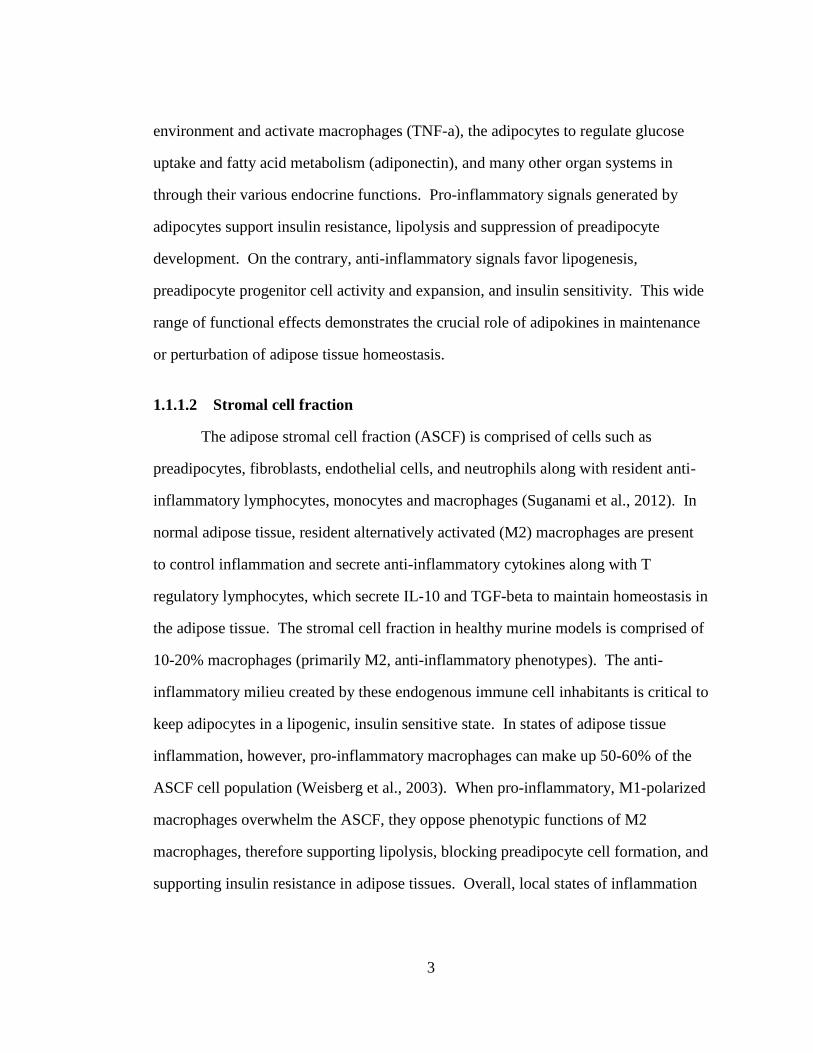
1.1.1.2 Stromal cell fraction
The adipose stromal cell fraction (ASCF) is comprised of cells such as
preadipocytes, fibroblasts, endothelial cells, and neutrophils along with resident anti-
inflammatory lymphocytes, monocytes and macrophages (Suganami et al., 2012). In
normal adipose tissue, resident alternatively activated (M2) macrophages are present
to control inflammation and secrete anti-inflammatory cytokines along with T
regulatory lymphocytes, which secrete IL-10 and TGF-beta to maintain homeostasis in
the adipose tissue. The stromal cell fraction in healthy murine models is comprised of
10-20% macrophages (primarily M2, anti-inflammatory phenotypes). The anti-
inflammatory milieu created by these endogenous immune cell inhabitants is critical to
keep adipocytes in a lipogenic, insulin sensitive state. In states of adipose tissue
inflammation, however, pro-inflammatory macrophages can make up 50-60% of the
ASCF cell population (Weisberg et al., 2003). When pro-inflammatory, M1-polarized
macrophages overwhelm the ASCF, they oppose phenotypic functions of M2
macrophages, therefore supporting lipolysis, blocking preadipocyte cell formation, and
supporting insulin resistance in adipose tissues. Overall, local states of inflammation
4
in the adipose tissue are determined and controlled by the balance between pro-
inflammatory and anti-inflammatory immune phenotypes.
1.2 Murine and human models of adiposity and metabolic syndrome
1.2.1 Adipocyte hypertrophy vs. hyperplasia
As adiposity increases adipocytes have two functional options available to
promote storage of triglycerides; adipocytes can employ hypertrophy, an increase in
cell size, or hyperplasia, an increase in cell number. Morbidly obese humans and mice
responding to increased triglyceride burdens with hyperplastic responses maintain a
normal, non-inflamed, insulin sensitive adipose tissue phenotype. On the other hand,
adipocyte hypertrophy is an event preceding adipose tissue inflammation which has
been linked to increased macrophage infiltrates in murine adipose tissue (Weisberg,
2003). Therefore, hyperplastic responses are deemed healthy methods of fat storage
while hypertrophic responses are regarded as the unhealthy alternative mechanism of
fat storage. In human and murine models of obesity and metabolic syndrome,
adipocytes tend to shift toward a hypertrophic, rather than a hyperplastic phenotype,
where individual adipocytes expand to accommodate greater triglyceride loading.
Some previous data showed hyperplastic or hypertrophic responses to nutrient
overloading may be controlled genetically. Animals responding through hypertrophic
mechanisms trigger the pro-inflammatory sequella that results in a sterile, sustained
and unresolving inflammatory reaction in the adipose tissues. The persistent, sterile
inflammation characteristic of obesity has been shown to lead to insulin resistance,
hyperglycemia, hyperinsulinemia, and steatosis, with downstream diseases such as
type 2 diabetes, fatty liver disease, atherosclerosis and various cancers, which increase
5
in prevalence as adipose tissue mass grows (Zhao et al., 2013, Yang et al., 2010,
Hotamisligil 2008).
1.2.1.1 Adipocyte hyperplasia
In normal, non-obese adipose tissue or hyperplastic adipose tissue in obesity,
adipocytes demonstrated equilibrium between lipogenic and lipolytic responses.
Under these conditions, fat cells have been shown to mobilize or store triglycerides in
response to systemic, metabolic demands for energy homeostasis (Guilherme et al.,
2008). Dispersal of triglycerides amongst an increased number of cells (hyperplasia)
preserves adipocyte function and prevents over-distension of adipocytes, which can
lead to inflammation (Weisberg et al., 2003; Jo et al., 2009).
Adipokines, such as leptin and adiponectin, are cytokines secreted by healthy
adipocytes. Adipocyte hyperplasia is positively correlated with leptin production
which is responsible for maintaining insulin sensitivity and communicating satiety
signals to the hypothalamus to decrease food intake or increase energy expenditure
(Weisberg et al., 2003; Guilherme et al., 2008; Rosenbaum et al, 1999). Genetic
modifications affecting the leptin protein or its receptor lead to hyperphagia, obesity,
fertility issues, preferential storage of calories in adipose tissue and many more
downstream metabolic issues, displaying the critical role of leptin in maintaining
metabolic function and whole-body homeostasis (Rosenbaum et al., 1999). Indeed,
the ob/ob knockout mouse model of obesity and metabolic syndrome is the classic
phenotypic manifestation of the leptin knockout genotype.
Likewise, adiponectin is responsible for maintaining insulin sensitivity and can
serve to decrease triglyceride content in the muscle and liver of obese mice, along with
reverse insulin resistance in mice (Yamauchi et al., 2001). Adiponectin expression
6
correlates with insulin sensitivity, therefore, secretion impairments of this adipokine
can result in serious consequences in the glucose metabolism of adipocytes (Yamauchi
et al., 2001). Adiposity along with adipocyte hypertrophy lowers adiponectin
secretion, which correlates with increased insulin resistance in murine models (Arita et
al., 1999; Yamauchi et al., 2001). Overall, both leptin and adiponectin play key roles
in maintaining adipose tissue homeostasis, favoring insulin sensitivity and stabilizing
nutrient intake.
Alongside the endocrine actions of adipocytes, the adipose stromal cell fraction
(ASCF) typically contains resident immune cells such as T regulatory lymphocytes
and anti-inflammatory, alternatively activated (M2) macrophages that have been
shown to orchestrate secretory functions in adipose tissue. Alternatively activated M2
macrophages along with T regulatory lymphocytes secrete anti-inflammatory
cytokines such as IL-10 and TGF-β that protect adipocytes against IL-1β-, TNFα- and
iNOS-mediated inflammatory responses, adipocyte lipolysis, and insulin resistance by
suppressing macrophage production of TNFα (Han et al., 2014; Lumeng et al., 2007).
M2 macrophages comprise roughly 10-15% of the SCF in traditional adipose tissue
depots (Weisberg et al., 2003). In addition to anti-inflammatory cytokines, M2-
polarized macrophages produce arginase, which downregulates the pro-inflammatory
activity of iNOS (inducible nitric oxide synthase). An endemic anti-inflammatory M2
phenotype contributes to an over-riding immune and inflammatory quiescence in
adipose depots. This phenotype has been proposed to sustain normal adipose tissue
homeostasis (Lumeng et al., 2007; Shaul et al., 2010; Weisberg et al., 2003).
Endemic T regulatory lymphocytes (Tregs) also have been proposed to
contribute substantially, with M2 macrophages, the homeostatic balance in adipose
7
tissues. Treg lymphocytes augment anti-inflammatory functions contributed by M2
macrophages in adipose depots and directly prevent inflammation by secreting IL-10.
In addition, Tregs indirectly blunt inflammatory reactions by promotion of IL-10
secretion from macrophages. Both sources of IL-10 have been determined to maintain
insulin sensitivity and adipose inflammatory reactions. In murine models, 10% of the
ASCF in non-obese adipose tissue have been determined to be CD3+ lymphocytes
(Feuerer et al., 2009). T regulatory lymphocytes comprise 5-20% of the CD4+ subset
of CD3+ lymphocytes in most tissues, however, in adipose tissue approximately 50%
of the CD4+ cells are Tregs. The data conclusively demonstrated that Treg
lymphocytes become selectively sequestered in adipose depots compared to levels
observed across other lymphoid and non-lymphoid tissues (Feuerer et al., 2009). The
marked increase of Tregs in normal adipose tissue serves to dampen the ongoing Th1
response by conventional T lymphocytes to prevent the synthesis of inflammatory
mediators, such as TNFα, which cause insulin resistance (Feuerer et al.,2009). Thus,
biased expression of T regulatory lymphocytes in the adipose tissue has been proposed
to favor an IL-10-mediated prevention of TNFα-induced insulin resistance in lean or
normal adipose tissue (Lumeng et al., 2007; Han et al., 2014).
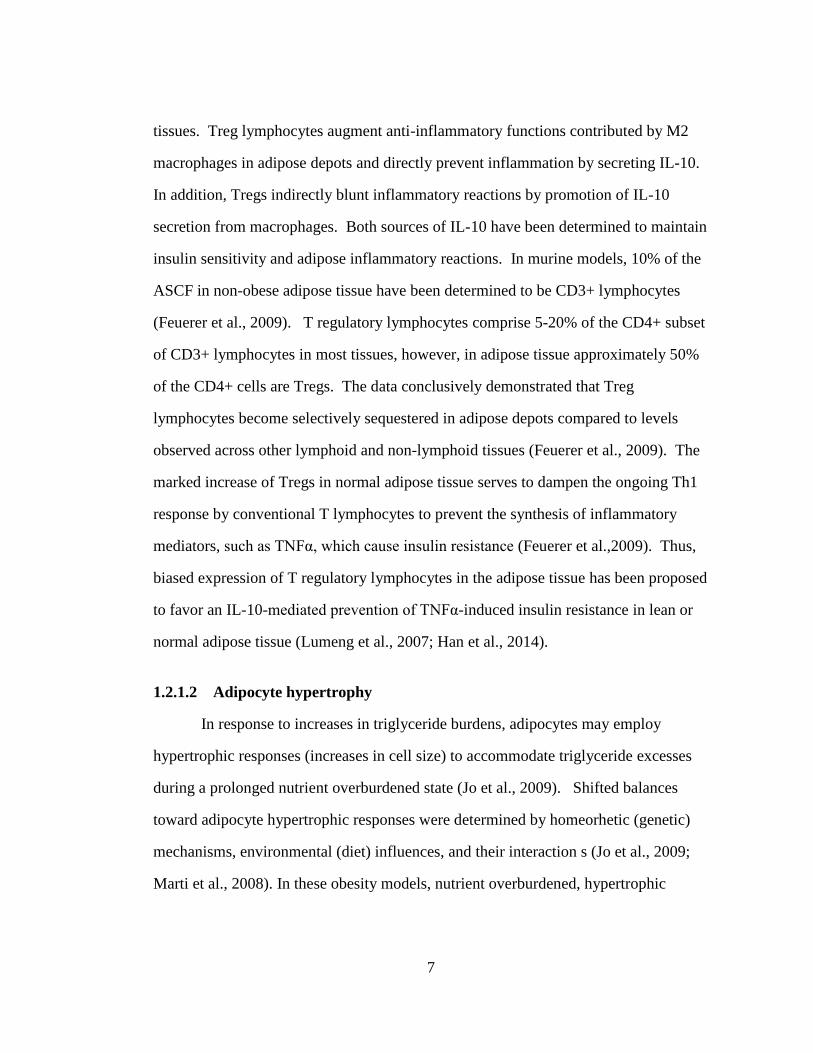
1.2.1.2 Adipocyte hypertrophy
In response to increases in triglyceride burdens, adipocytes may employ
hypertrophic responses (increases in cell size) to accommodate triglyceride excesses
during a prolonged nutrient overburdened state (Jo et al., 2009). Shifted balances
toward adipocyte hypertrophic responses were determined by homeorhetic (genetic)
mechanisms, environmental (diet) influences, and their interaction s (Jo et al., 2009;
Marti et al., 2008). In these obesity models, nutrient overburdened, hypertrophic
8
adipose tissue triggered a metabolic inflammatory reaction that ushered in a secondary
metabolic syndrome (Weisberg et al., 2003). Limitations on the hypertrophic response
of adipocytes to TG storage and overdistended adipocytes from overburdened depots
increased secretion of pro-inflammatory adipokines and demonstrated increased levels
of cellular apoptosis (Guilherme et al., 2008).
Nutrient-laden, hypertrophic adipocytes secreted higher amounts of pro-
inflammatory adipokines TNFα, IL-6, iNOS, and monocyte chemotactic protein 1
(MCP-1). Monocytes are driven into the adipose tissue in response to MCP-1, which
binds the CCR2 receptor to augment monocyte infiltration (Weisberg et al., 2006;
Lumeng et al., 2007). MCP-1 and CCR2, knockout approaches clearly demonstrated
these chemotactic agents increased monocyte and conventional Th1 T lymphocyte
infiltration to the adipose stromal cell fraction (ASCF) (Han et al., 2014; Weisberg et
al., 2003). In response to the pro-inflammatory milieu within the ASCF, recruited
monocytes are polarized by factors such as LPS and interferon gamma toward
differentiation into classically activated (M1), pro-inflammatory macrophage
phenotypes (Jo et al., 2009; Lumeng et al., 2007;Shaul et al., 2010; Weisberg et al.,
2003). Increased macrophage recruitment into the adipose tissue shifted the
composition of the ASCF from 5-10% M2 macrophages in lean animals to upwards of
60% macrophages in obese animals (Guilherme et al., 2008; Weisberg et al., 2003).
Newly infiltrated macrophages all differentiated into the M1, pro-inflammatory
macrophage and tipped the functional M1/M2 macrophage balance markedly toward
the M1 phenotype. Newly recruited M1 phenotypes moreover fused into
multinucleated, giant cells that formed crown-like structures around apoptotic,
hypertrophic adipocytes (Lumeng et al., 2007). Presumably, these lipid-laden,
9
multinucleated giant cells served as scavengers of degenerated, apoptotic adipocytes.
M1/M2 balances tipped in favor of the M1 phenotype contributed toward a milieu
dominated by the inflammatory mediators IL-1β, TNFα, IL-6, and nitric oxide.
Increased pro-inflammatory cytokine (IL-1β and TNFα) levels in the ASCF
increased inflammatory signal activity in adipocytes, activating MAPKinase (Jager et
al., 2010), JNK1 or 2 amino terminal kinase, and NFκB dependent signal pathways
(Zhang et al., 2011,Vallerie et al., 2008). Collectively, these signals phosphorylated
serine 307 and 632 on insulin receptors substrate protein 1 (IRS-1), diminished
perilipin expression and blocked Glut4 (glucose receptor) expression in adipocytes.
The changes are considered molecular hallmarks of inflammation and insulin
resistance in nutrient burdened adipose depots and shifted adipocyte metabolic activity
towards a lipolytic state. This insulin resistant state in adipose drove release of free
fatty acids (FFAs) from the adipocytes, increasing non-esterified fatty acids (NEFAs)
levels in circulation (Guilherme et al., 2008; Lumeng et al., 2007). Likewise, TNFα
diminished expression of the ligand activated transcription factor, PPARγ. This
transcription factor has been proposed to serve as the co-transactivator of genes whose
products drive lipogenesis and preadipocyte hyperplasia, anti-inflammatory
macrophage development and Treg T lymphocyte functions in adipose tissues.
Diminished PPARγ levels decreased lipogenesis and increased lipolysis. TNFα-
mediated loss of perilipin expression (the protective protein coat around lipid vacuoles
in adipocytes) in concert with increased activation of the hormone sensitive lipase
(HSL) was shown to drive adipocyte metabolic activity even deeper into a lipolytic
state (Guilherme, 2008).
10
Alongside TNFα-mediated dysregulation of adipocyte function, lipotoxicity
and apoptotic adipocytes triggered innate “danger-sensing” Nod-like receptors (NLRs)
to activate inflammasome bodies in obese adipose tissue macrophages.
Inflammasome activation enables the cleavage of the inactive pro-IL-1β to the active
pro-inflammatory cytokine IL-1β, which further compounds AT inflammation and the
development of insulin resistance (Chawla et al., 2012; Vandanmagsar et al., 2011).
These pro-lipolytic alterations in the adipocytes caused by macrophage and
hypertrophic adipocyte secretion of TNFα and IL-1β result in adipose tissue
inflammation, insulin resistance, increased lipolysis and increased plasma NEFA
levels; all elements seminal to the development of dyslipidemia, steatosis,
hyperglycemia, hyperinsulinemia and the onset of metabolic syndrome.
1.2.2 T cell activation and dysregulation in adipose tissue
Apoptotic adipocytes are cleared by tissue macrophages. In association with
this scavenger activity, others showed concurrent clonal expansion of T lymphocytes
established an adaptive immune response in nutrient burdened adipose depots (Yang et
al., 2010). The dominant lymphocyte phenotype belonged to the pro-inflammatory
Th1 T lymphocyte subset (Chawla et al., 2012). Both absolute number of T cells
(Winer et al., 2009) and proportion of conventional T cells to T regulatory cells (Han
et al., 2014) in visceral adipose tissue increased in diet-induced obese mice. Expanded
populations of Th1 T lymphocytes expressed high levels of the pro-inflammatory
cytokines interferon gamma (IFNγ), lymphotoxin B, and several chemokines that
further influenced the pro-inflammatory environment initiated by ATMs.
Not only are there more T-conventional cells in obese adipose tissue
undergoing clonal expansion, but the existing T regulatory cells have been shown to

11
lose their anti-inflammatory lineage and demonstrate a Th1-like phenotype in the
presence of excess insulin (Han et al., 2014). Hyperinsulinemia is an event
downstream of insulin resistance, caused by an increased secretion of insulin by the β
cells of the pancreas from inability of the liver, muscle, and adipose tissue to respond
to insulin. Increased concentrations of insulin cause alterations in Treg production of
anti-inflammatory cytokine IL-10, along with promote increases in the production of
IFN-γ and macrophage production of TNFα, a complete reversal of the traditional role
of T regulatory lymphocytes (Han et al., 2014). As adiposity increases, immune
dysregulation of both the innate and adaptive immune systems orchestrates upstream
adipose tissue inflammation. Adipose inflammation secondarily gives rise to systemic
insulin resistance, hyperglycemia, hyperinsulinemia, dyslipidemia, steatohepatitis and
the chronic, unresolving, systemic, sterile inflammation characteristic of obesity and
metabolic syndrome. The binary signal flow between immune and metabolic systems
underpins the pathogenesis of metabolic syndrome associated with adiposity.
1.3 Adiposity in dairy cows
1.3.1 Industry standards to increase adiposity
Universally, dairy industry nutritional programs are designed to deliberately
increase adiposity in dairy cattle during end stage lactation by adding 100-150 lbs of
weight to cows prior to entering the dry period. Nutritional programs increase fat
mass starting in mid lactation, where recommended body condition score is 2.5 or
below. Dairy cows are expected to complete a lactation with sufficient increase in
adipose tissue mass to achieve a recommended body condition score of 3.0 to 3.5
(Buckley et al., 2003; Mulligan et al., 2006). One numerical shift of body condition
12
score represents upwards of 100-150 lbs, a considerable increase in adiposity for dairy
cows to accumulate during late lactation. This deliberate increase in adipose tissue
mass was designed to accommodate heavy energy losses demanded by high amounts
of lactation following parturition (Dann et al., 2006; Grummer, 1995).
1.3.2 Shift from lipogenesis to lipolysis at parturition
The peripartal transition from a nonlactating, lipogenic metabolism to the
heavy post-partum energy requirements of lactation shifted metabolic balance in
adipocytes from lipogenic to highly lipolytic states supportive of milk production
(Sumner-Thomson et al., 2011; Zachut et al., 2012). Metabolic adaptations in
transition cows (3wks prepartum to 3 wks postpartum) are designed to counteract the
energy demands of a high lactational output which exceeds energy intake due to
decreased or inadequate dry matter intake (DMI) after parturition (Ingvartsen et al.,
2000). The lipolytic state mobilized triglycerides from visceral and subcutaneous
adipose tissue depots. Cows with the greatest peripartal loss of adipose depots also
showed the greatest amount of insulin resistance in adipose tissues. These animals
displayed classical metabolic markers of a systemic metabolic syndrome, insulin
resistance, hyperinsulinemia, hyperglycemia, and increased plasma NEFAs (Zachut et
al., 2012). These pivotal findings raise a compelling issue. Was the insulin resistance
the principal driving element behind the lipolysis and rapid loss in adipose mass or
was the negative energy balance associated with heavy lactation the principal element
that drove lipolysis and loss of AT mass. The former suggests adipose inflammatory
reactions may have underlied high levels of lipolysis in peripartal adipose depots
while the latter implies homeostatic mechanisms (leptin, adiponectin, glucagon,
insulin) underpinned the lipolytic responses.
13
1.3.2.1 Blood metabolite elevations
Peripartal mobilization of energy from SAT and VAT has been widely
associated with elevated levels of circulating blood non-esterified fatty acids (NEFA).
The mobilized NEFAs serve as energy sources during states of severe negative energy
balance typically observed in heavily lactating cattle. Tissues such as skeletal muscle
begin using lipids, instead of glucose, as a primary energy source after the onset of
lactation because peripartal states of insulin resistance repartitioned glucose uptake
away from peripheral tissues to conserve it for intramammary production of lactose
during heavy lactation (Adewuyi et al., 2005; Khan et al., 2013; Zachut et al., 2013).
Much of the NEFA mobilized from adipose depots has been shown to enter
hepatocellular metabolic pathways in the liver. Mesenteric adipose depots
accommodating inflammatory reactions during nutrient overburdening have been
shown to heavily shower the liver with NEFAs (Nov et al., 2013) Pummeling the
liver with NEFAs leads to increased FFA uptake and triglyceride storage by the liver
along with downstream steatosis and steatohepatosis; two major issues commonly
occurring in transition cows (Drackley, 1999; Graugnard et al., 2013).
1.3.3 Liver options for NEFA influx
NEFAs can be oxidized for energy by hepatic mitochondria (healthy), where
triglycerides are coupled to apolipoproteins B and E for export as very low-density
lipoproteins (VLDLs) for deposition into ectopic adipose depots and synthesis of milk
fat (Bernabucci et al., 2004). However, the liver has a limited capacity to convert all
NEFAs into trigycerides for export, and therefore may employ alternative pathways to
dispose of excess NEFAs. There are three other options the liver can employ for
disposal of NEFA influx. When plasma NEFA levels exceed the oxidative capacity of
14
the mitochondria, the liver begins converting acetyl CoA from fatty acid oxidation into
ketone bodies (βHBA) for export to peripheral tissue for energy purposes in a time of
glucose reallocation to the mammary gland (Adewuyi et al., 2005, Drackley et al.,
2001; Grum et al., 1996). If plasma NEFA concentrations remain high, the liver must
resort to peroxisomal β-oxidation (unhealthy oxidation), which can account for a
greater fraction of total hepatic oxidation during times of NEFA overload (Grum et al.,
1996). When triglycerides are being synthesized faster than they are being exported
in the liver, the liver must resort to storage of trigycerides as vacuoles in hepatocytes,
leading to loss of hepatocyte function, fatty degeneration of the liver and hepatic
lipidosis (Bernabucci et al., 2004, Bobe et al., 2004).
In cases of increased dietary fat intake and obesity in dairy cows, NEFA
mobilization may become so great that it exceeds hepatocellular capacity to
metabolically cope with heavy influx of NEFA. TG synthesis and storage in
hepatocytes has been shown to lead to fatty liver disease and diminished peripartal
liver function (Bobe et al., 2004). Fat accumulation in the liver occurs in upwards of
50% of dairy cows in the 4 weeks following parturition (Jorritsma et al., 2000, 2001;
Bobe et al., 2004) and is worsened with peripartal obesity. Along with decreasing
liver function and disturbed regulation of immune function, fatty liver disease has
been shown to erode reproductive efficiency with a 30% reduction in the probability
of pregnancy and 35% reduction in probability of estrus in dairy cows (Jorritsma et al.,
2000). Steatohepatosis is associated with lower milk yields, reduced fertility and
increased cull rates in dairy cows (Bobe et al.,2004). Elevated NEFAs and metabolic
insults associated with parturition lead a high percentage of peripartal cattle to develop
a metabolic syndrome-like phenotype of insulin resistance (Zachut et al., 2013),
15
hyperglycemia, hyperinsulinemia, ketonemia, dyslipidemia and fatty degeneration of
the liver (Drackley, 1999). These metabolic disturbances in the transition cow mimic
seminal events in murine and human models associated with adipose tissue
inflammation, immune cell infiltration, metabolic syndrome and type 2 diabetes.
1.3.4 Previous studies of bovine AT inflammation
Recently, Akter et al. (2012) explored the possibility that inflammatory and
immune cells could infiltrate bovine adipose depots during increased adiposity. They
reported few to no phagocytic immune infiltrates occurred in subcutaneous or visceral
adipose tissue depots and concluded little to no inflammatory reaction was associated
with nutrient overburdened adipose tissue from over-conditioned dairy and beef cattle
(Akter et al., 2012). Akter et al. (2012) utilized immunohistochemistry with bovine
macrophage markers designed for flow cytometry, along with a medley of different
beef cows, dairy cows, and treatments in the study. The use of insensitive
immunologic techniques and the presence of genetic, diet and age confounders likely
contributed to the negative results of this study. Nevertheless, the authors concluded
inflammatory reactions were not contributing elements in the peripartal metabolic
syndromes of heavily conditioned bovines
While their data may be indicative of a protective mechanism for dairy cows in
handling increased adiposity, the current study attempts to identify and quantify
immune cell infiltrates through use of fluorescence activated cell sorting (FACS)
analysis rather than immunohistochemistry, which can often be much less sensitive.
We proposed to readdress the issue using a different approach because the data
reported by Akter et al. (2012) was inconsistent with mouse and human models of
obesity and metabolic inflammatory syndrome.
16
1.3.5 Importance of research
Adipose tissue inflammation is widely accepted as part of the etiology behind
systemic inflammatory phenotypes associated with insulin resistance, dyslipidemia,
hepatosteatitis, and the subtle, chronic, unresolving inflammatory disease in models of
obesity. Nutritionists and endocrinologists have traditionally attributed these
adaptations in metabolism to accommodate heavy lactation and a negative energy
balance in peripartal dairy cows, however, adipose tissue physiology has yet to be
elucidated. Borrowing upon the body of data in other species, we hypothesize that the
industry-wide practice of expanding adipose tissue mass 8-12 weeks prior to calving
overloads visceral, omental, and subcutaneous adipose tissue with lipids, with
adipocytes storing nutrient excesses in a hypertrophic manner. We propose the
hypertrophic adipocyte response to fat storage triggers macrophage and lymphocyte
infiltration of visceral adipose tissue depots, which could lead to adipose tissue
inflammation in peri-parturient dairy cows. The importance of the research is to
determine if nutritional standards to deliberately increase fat mass in dairy cows
before parturition are potentiating a metabolic syndrome-like phenotype of chronic,
systemic, unresolving, sterile inflammation. If cows present with adipose tissue
inflammation, the chronic, sterile inflammation characteristic of obesity could be
partly responsible for the sterile inflammatory disease underpinning chronic,
nonhealing ulcerative diseases of the bovine foot; one of the largest, unresolved issues
in the dairy industry.
17
1.3.6 Hypothesis and Objectives
The hypothesis of this study is that bovine adipocytes increase in size
(hypertrophy) in direct proportion to increased states of adiposity, and that immune
and inflammatory cells exist as endogenous inhabitants of these adipose depots.
The objectives of this study are to characterize the relationship of body
condition score and adipocyte size in a library of mesenteric, omental and
subcutaneous AT depots from lean and heavy lactating dairy cows and to determine
immune cell infiltrates within mesenteric adipose tissue stromal cell fraction.
18
Chapter 2
MATERIALS AND METHODS
2.1 Materials
2.1.1 Reagents
Phosphate buffered saline (PBS) with dextrose, no divalent cations was used to
isolate the lymph node crude cell fraction. Hank’s Balanced Saline Solution (HBSS)
consisting of PBS with divalent cations, dextrose, 10mM HEPES was used to isolate
adipose tissue stromal cell fraction. Type II crude collagenase (100mg, 125U/mg)
from Clostridium histolyticum was obtained from Sigma Aldrich (St. Louis, MO,
USA). Heat inactivated (56C, 30min) horse serum was obtained from Sigma Aldrich,
(St. Louis, MO, USA) Heat inactivated (56C, 30min) goat serum was obtained from
Jackson ImmunoResearch (West Grove, PA, USA). Acid-citrate-dextrose (ACD)
consisting of 0.48% (w/v) citric acid, 1.32% (w/v) sodium citrate, 1.47% (w/v)
glucose in PBS (no divalent cations, with dextrose) was used to create buffer solutions
for antibody staining protocol. First wash buffer consisted of PBS (no divalent
cations, with dextrose), 10% acid-citrate-dextrose (ACD) and 2% equine serum.
Second wash buffer consisted of PBS (no divalent cations, with dextrose) and 10%
acid-citrate-dextrose (ACD). Third wash buffer consisted of PBS (no divalent cations,
with dextrose), 10% acid-citrate-dextrose (ACD) and 2% goat serum. Fixation
performed using 1% paraformaldehyde in PBS (no divalent cations, with dextrose).
19
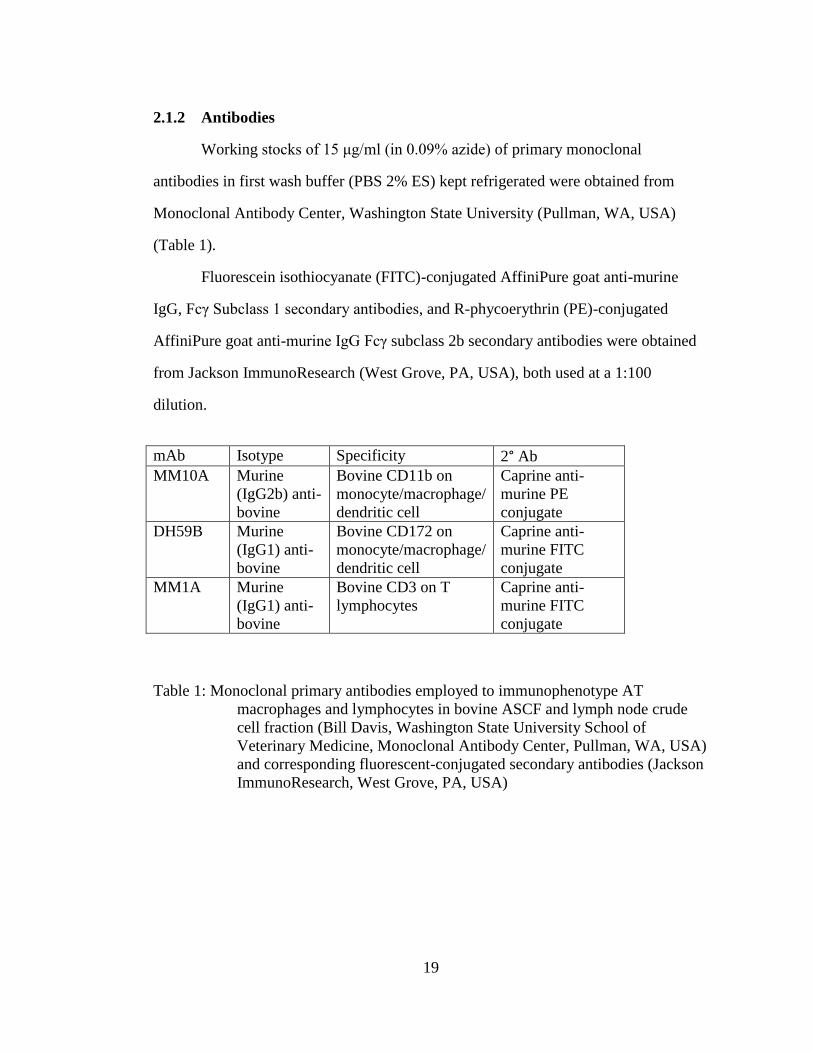
2.1.2 Antibodies
Working stocks of 15 μg/ml (in 0.09% azide) of primary monoclonal
antibodies in first wash buffer (PBS 2% ES) kept refrigerated were obtained from
Monoclonal Antibody Center, Washington State University (Pullman, WA, USA)
(Table 1).
Fluorescein isothiocyanate (FITC)-conjugated AffiniPure goat anti-murine
IgG, Fcγ Subclass 1 secondary antibodies, and R-phycoerythrin (PE)-conjugated
AffiniPure goat anti-murine IgG Fcγ subclass 2b secondary antibodies were obtained
from Jackson ImmunoResearch (West Grove, PA, USA), both used at a 1:100
dilution.
mAb Isotype Specificity 2° Ab
MM10A Murine
(IgG2b) anti-
bovine
Bovine CD11b on
monocyte/macrophage/
dendritic cell
Caprine anti-
murine PE
conjugate
DH59B Murine
(IgG1) anti-
bovine
Bovine CD172 on
monocyte/macrophage/
dendritic cell
Caprine anti-
murine FITC
conjugate
MM1A Murine
(IgG1) anti-
bovine
Bovine CD3 on T
lymphocytes
Caprine anti-
murine FITC
conjugate
Table 1: Monoclonal primary antibodies employed to immunophenotype AT
macrophages and lymphocytes in bovine ASCF and lymph node crude
cell fraction (Bill Davis, Washington State University School of
Veterinary Medicine, Monoclonal Antibody Center, Pullman, WA, USA)
and corresponding fluorescent-conjugated secondary antibodies (Jackson
ImmunoResearch, West Grove, PA, USA)
20
2.1.3 Equipment
A refrigerated centrifuge was used for centrifugation of 96-well plate carriers
and 50ml conical tubes during tissue isolation and staining procedures. A refrigerated
plate vortexer was employed during the staining procedure to loosen cell pellets.
Flow cytometric analyses were performed on a FACSCalibur flow cytometer.
2.1.4 Supplies
96-well polystyrene V-bottom plates were obtained from Costar, Sigma
Aldrich (St. Louis, MO, USA) for use in staining procedures. Micropipettor tips were
obtained from Fisher Scientific (Pittsburgh, PA, USA). Tissue culture flasks (25cm2)
were obtained from Corning Incorporated (Corning, NY, USA). Both 15ml and 50ml
conical tubes were obtained from BD Falcon (Franklin Lakes, NJ, USA). Tubes (12 x
75 mm) for flow cytometric analysis with a 35μm Cell Strainer Cap were obtained
from BD Falcon (Franklin Lakes, NJ, USA).
2.2 Methods
2.2.1 Animal subjects
Lactating, 3-5 year old, multiparous Holstein Friesian cows (n=13) presenting
to an abattoir for slaughter or to the George D. Widener Hospital for Large Animals
(School of Veterinary Medicine, University of Pennsylvania) for surgical correction of
uncomplicated left or right displacement of the abomasum, cesarean section, or cecal
torsion were scored for body condition (Table 2). Body condition was scored using a
scale of 1 to 5 in increments of 0.25 through visual assessment of the lumbar
transverse processes, tubur ischium (pin bones), tuber coxae (hook bones), thurl, tail
head, sacral ligament, and ribs according to Penn State Body Condition Scoring-Dairy

21
Cattle Nutrition (Heinrichs et al., 1989; Roche et al., 2009). Cows with a BCS below
2.5 (Figure 1) were considered lean and cows with a BCS of 3.5 and above (Figure 2)
were considered heavy.
22
Body Condition
Score
Description
1 Severely under-conditioned; very thin, emaciated. Tailhead bones
easily discernible and deep cavities around tailhead, prominent
backbone, lumbar transverse processes clearly visible,
hooks/thurl/pins very prominent and sharp with V-angle between
hooks and pins, thin legs, poor muscle condition
2 Under-conditioned; thin. Tailhead prominent; somewhat hollow
but has modest covering of flesh, limited skin cover, prominent
backbone, limited skin cover on lumbar transverse processes
(visible ¾ of distance), angular hooks/pins with prominent thurl
and V-angle between hooks and pins
3 Good body condition. More flesh covering backbone, no deep
depressions or fat deposits around tailhead, smooth tips of lumbar
transverse processes, hooks and pins rounded, smooth. Soft V-
angle between hooks, thurl and pins.
4 Over-conditioned; overweight. Backbone barely visible, lumbar
transverse processes very smooth, tips barely visible. Hooks and
pins very smooth/rounded but visible, flat, U-angle between
hooks and pins. Rump and thurl flat, sacral and tailhead
ligaments not visible.
5 Severely over-conditioned; obese. Backbone not visible, lumbar
transverse processes flat, bones not visible, hooks/pins not
visible/U-angle between hooks and pins, flat over rump and
tailhead. All boney prominences from behind rounded and
covered in fat, tailhead buried in fat, fat deposits seen on rump
and legs.
Table 2: Body condition score scale from 1-5 adapted from Penn State Body
Condition Scoring System (Heinrichs et al., 1989,
http://extension.psu.edu/animals/dairy/nutrition/nutrition-and-
feeding/body-condition-scoring, 2004)
23
Figure 1. Underweight cow, BCS=2.25. Visible hooks and pin bones with a V-shaped
thurl. Backbone prominent; can easily see transverse lumbar processes.
24
Figure 2. Overweight cow, BCS=4.5. Hooks and pins not visible, U-shaped thurl,
rounded back, cannot discern transverse lumbar processes.
2.2.2 Adipocyte sizing
Adipose tissue samples (1 cm3) (n=13) were obtained from (1) subcutaneous
adipose tissue (SAT) depot caudolateral to the rectus abdominus muscle (2) omental
adipose tissue from the superficial leaf of the greater omentum, and (3) mesenteric
adipose tissue located in the mid-jejunum. Samples were excised using single-edged
surgical carbon-steel blades during surgery or immediately after slaughter, then cut to
1 cubic centimeter with Metsenbaum scissors to allow complete immersion in fixative.
Samples were incubated (24h, 25C) in 10% buffered formalin, embedded in paraffin,
sectioned (5 μm), mounted on glass slides, and stained with hematoxylin and eosin.
25
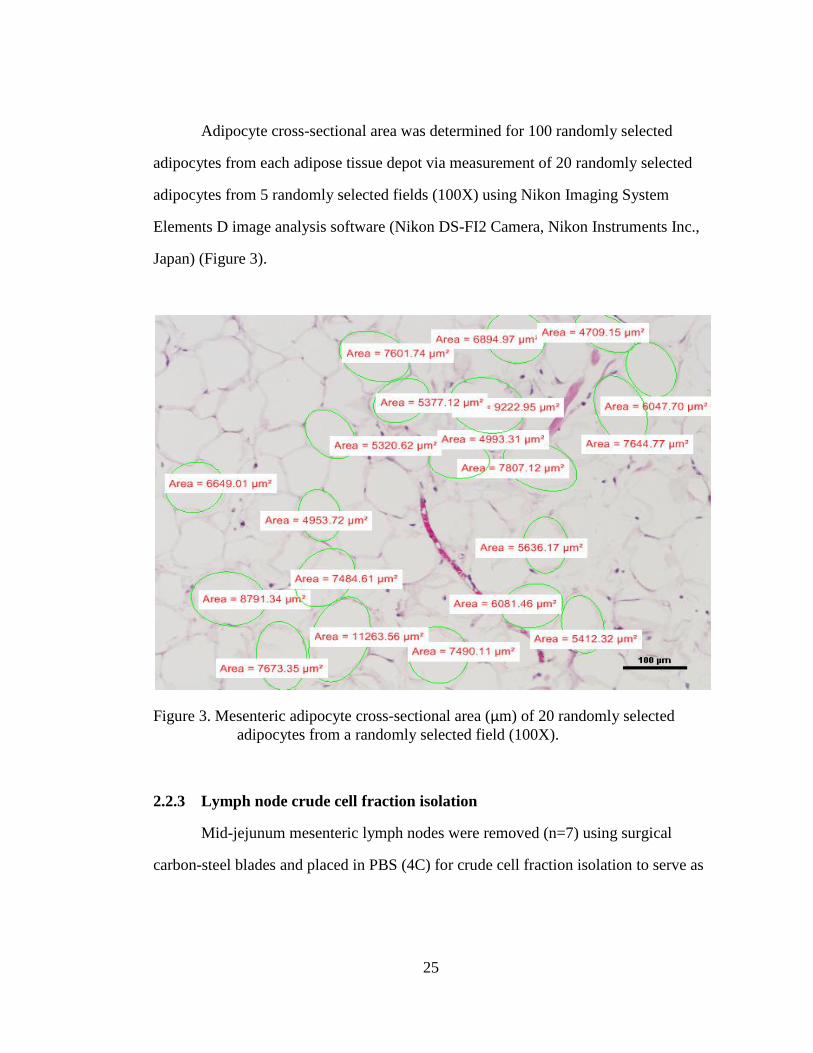
Adipocyte cross-sectional area was determined for 100 randomly selected
adipocytes from each adipose tissue depot via measurement of 20 randomly selected
adipocytes from 5 randomly selected fields (100X) using Nikon Imaging System
Elements D image analysis software (Nikon DS-FI2 Camera, Nikon Instruments Inc.,
Japan) (Figure 3).
Figure 3. Mesenteric adipocyte cross-sectional area (μm) of 20 randomly selected
adipocytes from a randomly selected field (100X).
2.2.3 Lymph node crude cell fraction isolation
Mid-jejunum mesenteric lymph nodes were removed (n=7) using surgical
carbon-steel blades and placed in PBS (4C) for crude cell fraction isolation to serve as
26
a positive control. Excised lymph nodes in PBS were cut longitudinally and the crude
cell fraction from the medulla and cortex (without the capsule) was scraped from the
node (4C). Lymphoid tissue was passed through a glass wool column and washed
with PBS to collect cell eluent from column. Cell eluents were washed with PBS (3X,
1200rpm, 20 min, 4C) and resuspended in first wash buffer (4C, 1.0 x 10⁷ cells/ml).
2.2.4 Adipose tissue SCF isolation
2.2.4.1 Collagenase preparation
Type II collagenase was suspended (10mg/ml) in PBS (with dextrose, no
divalent cations) with stirring (30 min, 25C). Solution was centrifuged (1200rpm,
25C, 20 min) and the supernatant was aliquoted and stored at -20C.
2.2.4.2 Adipose tissue SCF isolation
Mid-jejunum mesenteric adipose tissue samples were excised (n=3) using
surgical carbon-steel blades and placed in HBSS, 10mM HEPES, with divalent cations
(38C) for stromal cell fraction isolation. Excised adipose tissues were minced
(1mmx1mm) in HBSS, 10mM HEPES (38C) and washed once (800rpm, 5min, 25C)
to remove vascular components (RBCs, leukocytes) from tissue. Five (1g wet weight)
samples per subject were digested individually in tissue culture flasks with Type II
collagenase (2mg/ml) in HBSS (10mM HEPES, with divalent cations) and incubated
with shaking (150 rpm, 60min, 38C). A magnetic stir bar was added to each flask and
the mixtures were stirred for 15 min (38C) to complete digestion of the tissue.
Collagenase-digested adipose tissue samples were passed through a glass wool column
and washed with PBS, 10mM HEPES (38C) to collect cell eluents. Cell suspensions
27
were combined, washed (PBS, 10mM HEPES (1X, 1200rpm, 20 min, 25C)) and
resuspended in first wash buffer (4C, 1.0 x 10⁷ cells/ml).
2.2.5 Staining for flow cytometry
Lymph node and ASCF cell suspensions in the first wash buffer (1.0 x 10⁶
cells, 4C) were placed, separately, into wells of a 96 well v-bottomed plate (1 million
cells/well) on ice for staining with primary monoclonal antibodies (Table 1) as
follows: (1) control cells with no primary or secondary antibodies, (2) control cells
with FITC (green) and PE (red) fluorescent-conjugated secondary antibodies only; (3)
CD11b (macrophages, monocytes/dendritic cells) (4) CD172 (macrophages) (5) CD3
(lymphocytes) (6) CD11b and CD172 (macrophages), and (7) CD11b and CD3
(lymphocytes and macrophages/dendritic cells). Primary mAb cocktails described
above were added to the appropriate wells containing ASCF or lymph node crude cell
fraction (1.0 x 10⁶ cells) at equal concentrations(15 μg/ml), vortexed (30s, 1000g, 4C),
and incubated (30 min, 4C).
After incubation, the plate was centrifuged (5 min, 2500g, 4C). Supernatant
was removed by flicking the plate and cells were resuspended in a plate vortexer
(30sec, 1000g, 4C). Cells were washed (3X) with first wash buffer (4C). After the last
wash, appropriate secondary FITC- or PE-conjugated secondary antibodies (1:100
dilution) were added to wells as follows: (1) none, (2) FITC and PE, (3) PE only, (4)
FITC only, (5) FITC only, (6) FITC and PE, (7) FITC and PE (Table 1). Secondary
Ab cocktails (1:100 dilution) described above were added to the appropriate wells at
equal concentrations, vortexed (30s, 1000g, 4C), and incubated (30 min, 4C).
After incubation, plate was centrifuged (5 min, 2500g, 4C), and cells were
washed (2X) using second wash buffer. After the last wash, cells were incubated in

28
1% PBS buffered paraformaldehyde (15 min, 4C), the plate was centrifuged (5 min,
2500g, 4C), the supernatant removed, and the cells resuspended in the plate vortexer
(30s, 1000g, 4C). Cells were resuspended in first wash buffer (4C), transfer pipetted
through 12 x 75 mm Tube with 35μm Cell Strainer Cap and refrigerated (4C) in
preparation for FACS analysis on a FACSCalibur flow cytometer. Staining
procedures adapted from Dr. Bill Davis, Washington State University School of
Veterinary Medicine, Monoclonal Antibody Center, Pullman, WA, personal
communication.
2.2.6 Fluorescence Activated Cell Sorting (FACS) analysis
FACS analysis was performed on a BD (Becton Dickinson) FACSCalibur flow
cytometer (CTCR core facility, 007 Wolf Hall; www2.udel.edu/ctcr/ctcr-core-facility).
Flow cytometry was performed by analyzing cells traveling through a tube in single
file with a laser beam exciting the fluorochrome (FITC or PE) labeled secondary
antibody reacting with the primary antibody marker. Emitted fluorescence level is
measured for each cell and the flow cytometer gives a population profile of fluorescent
staining, displaying which cells express the fluorochrome label and which do not.
This fluorescence profile serves to quantify which markers are present on the cells
being analyzed within the gated population, expressed as percentage of cells gated in
the upper left (UL), upper right (UR) and lower right (LR) quadrants.
FACS analysis was performed to determine (1) percent
macrophages/monocytes/dendritic cells (CD11b+), (2) percent macrophages
(CD172+), and (3) percent T lymphocytes (CD3+) of both the adipose stromal cell
fraction and LN crude cell fraction from a minimum of 10,000 reads per cell fraction.
The percentage of total cell fractions was determined from the percentage of gated
29
events in the three positive quadrants (UL, UR, LR). Gates were established on
control cells stained with secondary antibodies only (no primary antibodies) to control
for non-specific secondary antibody conjugate binding and gate on a double negative
stained population of cells. Gates were deliberately positioned to have at least 97% of
negatively stained cells within the lower left quadrant, with 1% of cells in each of the
upper left, upper right, and lower right quadrants. Verification of the gating was
performed by examining unstained cells which also fell within the double negative
(lower left) gate.
Being the FITC (green) and PE (red) conjugates have emission spectra of
530±30nm and 585±40nm, respectively, the spectral overlap can cause the
fluorescence emission of the FITC fluorochrome to be detected in the PE
fluorochrome detector, and vice versa (“Flow,” 2012). Compensation was adjusted
using single color stained cells to assure proper analysis of multicolor samples through
adjusting the portion of one fluorescence detector’s signal (FL-2) from the second
detector’s signal (FL-1), leaving only the desired color signal to eliminate spectral
overlap (“Compensation,” 2003). Compensation adjustments were performed visually
using continuous single-color cell analysis until cells were evenly distributed across
the FITC or PE opposing channels for all three sets of single-stained cell controls
(Figure 4).
30
Figure 4. Demonstration of adjustment of compensation for a single color FITC (FL-1)
stained set of lymph node cells (stained for CD3). The left picture
demonstrates an undercompensated set of cells without enough
fluorescence subtraction. The PE median florescence intensity of the
positive FITC population is greater than that of the negative FITC
population. The figure on the right shows proper compensation where
the median of the positive and negative FITC population is equal within
the PE channel (“Technical Bulletin,” 2009).
31
Chapter 3
RESULTS
Adipocyte area and frequency distribution of adipocyte size increases with increasing
body condition
3.1 Adipocyte area and BCS
To study the relationship between adipocyte size and adiposity, mid-jejunum
mesenteric adipose tissue samples were collected from multiparous, lactating Holstein
Friesian dairy cows (n=16) and body condition score, a measure of adiposity, was
recorded. Increasing adiposity increased mean adipocyte cross-sectional area in
mesenteric (Figure 5), omental (Figure 6), and subcutaneous (Figure 7) adipose tissue.
The level of adiposity was directly related to mean adipocyte area for the mesenteric
(r=0.85), omental (r=0.87), and the subcutaneous (r=0.59) adipose depots.
32
Figure 5. Level of adiposity (body condition) is directly correlated to mean mesenteric
cross-sectional adipocyte area (μm2) in bovine mid-jejunum mesenteric
adipose tissue (r=0.85) (n=16).
0.0
2000.0
4000.0
6000.0
8000.0
10000.0
12000.0
14000.0
0 1 2 3 4 5 6
Mea
n M
ese
nte
ric
Ad
ipo
cyte
Are
a (μ
m2)
Body Condition Score
r=0.85
33
Figure 6. Level of adiposity (body condition) is directly correlated to mean omental
cross-sectional adipocyte area (μm2) in bovine omental adipose tissue
(r=0.87) (n=15).
0
2000
4000
6000
8000
10000
12000
14000
16000
0 1 2 3 4 5 6
Mea
n O
men
tal A
dip
ocy
te a
rea
(μm
2)
Body Condition Score
r=0.87
34
Figure 7. Level of adiposity (body condition) is weakly correlated to mean
subcutaneous cross-sectional adipocyte area (μm2) in bovine
subcutaneous adipose tissue (r=0.59) (n=12).
3.2 Adipocyte size across tissue depots
Mesenteric and omental adipocyte area (μm2) were directly correlated (r=0.92)
across all cows, in that mean mesenteric and omental adipocyte sizes increased
proportionally (Figure 8). Likewise, mesenteric and subcutaneous adipocyte area
(μm2) were correlated (r=0.89), in that mean mesenteric and subcutaneous adipocyte
size increased proportionally across all cows (Figure 9). Lastly, omental and
subcutaneous adipocyte area (μm2) were correlated (r=0.92), in that mean omental and
0
1000
2000
3000
4000
5000
6000
7000
8000
0 0.5 1 1.5 2 2.5 3 3.5 4 4.5
Mea
n S
ub
cuta
neo
us
Ad
ipo
cyte
are
a (μ
m2)
Body Condition Score
r=0.59
35
subcutaneous adipocyte size increased proportionally across all cows (Figure 10). The
data showed adipocyte area increased proportionally across two visceral and one
subcutaneous adipose depot in dairy cows.
Figure 8. Mean mesenteric adipocyte area (μm2) was directly correlated (r=0.92) with
mean omental adipocyte area (μm2) (n=15).
0
2000
4000
6000
8000
10000
12000
14000
16000
0 2000 4000 6000 8000 10000 12000 14000
Om
entu
m a
dip
ocy
te a
rea
(μm
2)
Mesenteric adipocyte area (μm2)
r=0.92
36
Figure 9. Mean mesenteric adipocyte area (μm2) was directly correlated (r=0.89) with
mean subcutaneous adipocyte area (μm2) (n=11).
0
1000
2000
3000
4000
5000
6000
7000
8000
0 1000 2000 3000 4000 5000 6000 7000 8000 9000
Sub
cuta
neo
us
adip
ocy
te a
rea
(μm
2)
Mesenteric adipocyte area (μm2)
r=0.89
37
Figure 10. Mean omental adipocyte area (μm2) was directly correlated (r=0.92) with
mean subcutaneous adipocyte area (μm2) (n=11).
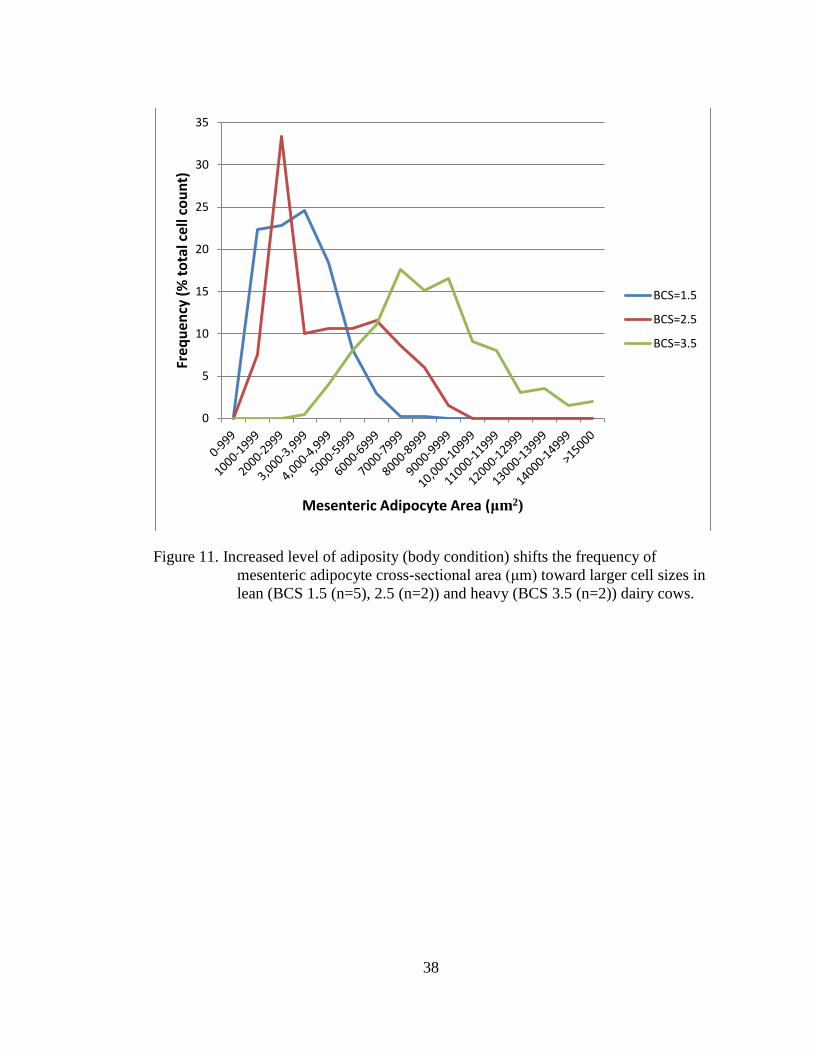
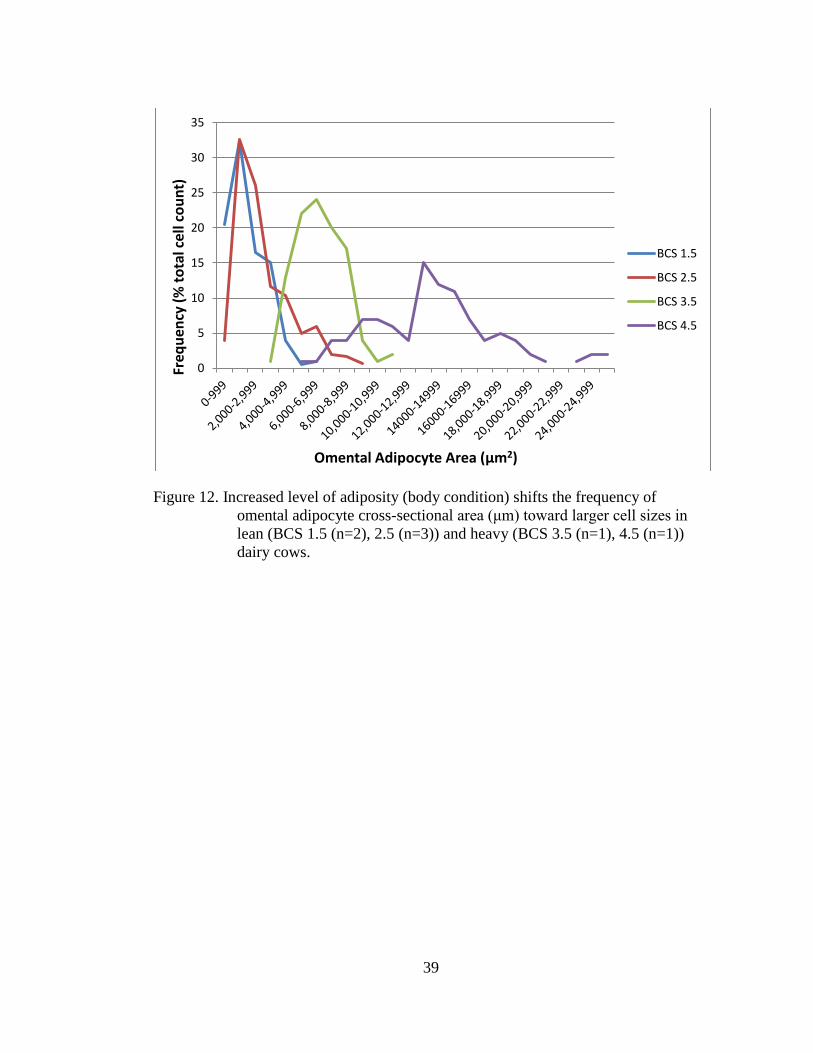
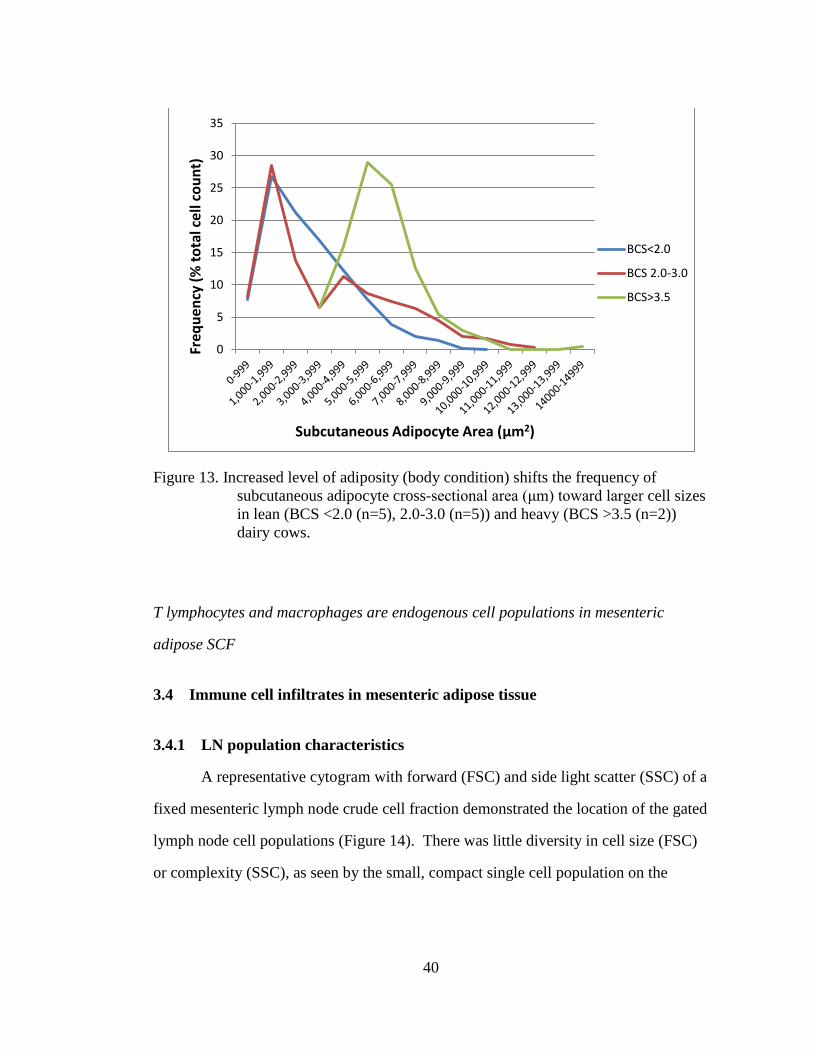
3.3 Frequency distribution of adipocyte area
The 1000um2 increments in adipocyte size were plotted against the frequency
of adipocyte size occurrence within each interval for each level of body condition
score with in each adipose depots. Increased adiposity was associated with a shift in
the entire frequency distribution of adipocyte size toward larger cell sizes in the
mesenteric (Figure 11), the omental (Figure 12) and the subcutaneous adipose depots
(Figure 13). The results showed the frequency of adipocytes with larger adipocyte
area increased while the frequency of adipocytes with smaller adipocyte area
decreased when body adiposity (body condition score) increased from lean cows (BCS
1.5, 2.5) to heavy cows (BCS 3.5).
0
1000
2000
3000
4000
5000
6000
7000
8000
0 1000 2000 3000 4000 5000 6000 7000 8000
Sub
cuta
neo
us
adip
ocy
te a
rea
(μm
2)
Omental adipocyte area (μm2)
0.92
38
Figure 11. Increased level of adiposity (body condition) shifts the frequency of
mesenteric adipocyte cross-sectional area (μm) toward larger cell sizes in
lean (BCS 1.5 (n=5), 2.5 (n=2)) and heavy (BCS 3.5 (n=2)) dairy cows.
0
5
10
15
20
25
30
35
Freq
uen
cy (
% t
ota
l ce
ll co
un
t)
Mesenteric Adipocyte Area (μm2)
BCS=1.5
BCS=2.5
BCS=3.5
39
Figure 12. Increased level of adiposity (body condition) shifts the frequency of
omental adipocyte cross-sectional area (μm) toward larger cell sizes in
lean (BCS 1.5 (n=2), 2.5 (n=3)) and heavy (BCS 3.5 (n=1), 4.5 (n=1))
dairy cows.
0
5
10
15
20
25
30
35
Freq
uen
cy (
% t
ota
l ce
ll co
un
t)
Omental Adipocyte Area (μm2)
BCS 1.5
BCS 2.5
BCS 3.5
BCS 4.5
40
Figure 13. Increased level of adiposity (body condition) shifts the frequency of
subcutaneous adipocyte cross-sectional area (μm) toward larger cell sizes
in lean (BCS <2.0 (n=5), 2.0-3.0 (n=5)) and heavy (BCS >3.5 (n=2))
dairy cows.
T lymphocytes and macrophages are endogenous cell populations in mesenteric
adipose SCF
3.4 Immune cell infiltrates in mesenteric adipose tissue
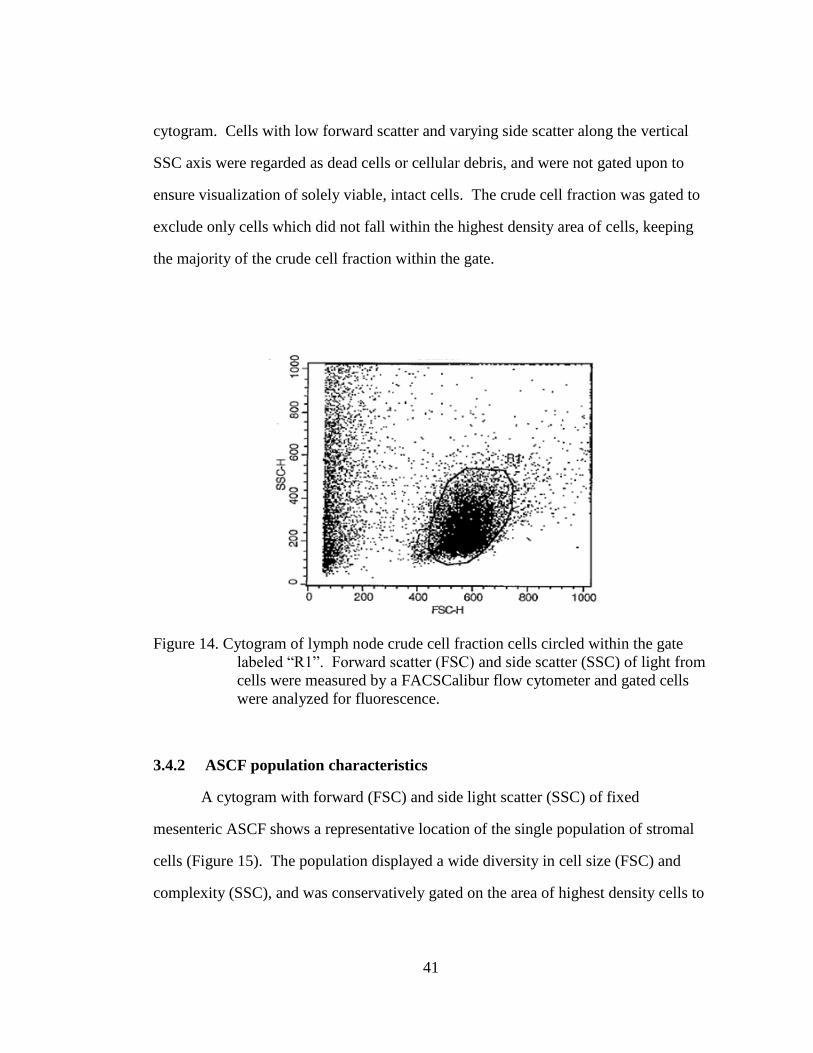
3.4.1 LN population characteristics
A representative cytogram with forward (FSC) and side light scatter (SSC) of a
fixed mesenteric lymph node crude cell fraction demonstrated the location of the gated
lymph node cell populations (Figure 14). There was little diversity in cell size (FSC)
or complexity (SSC), as seen by the small, compact single cell population on the
0
5
10
15
20
25
30
35
Freq
uen
cy (
% t
ota
l ce
ll co
un
t)
Subcutaneous Adipocyte Area (μm2)
BCS<2.0
BCS 2.0-3.0
BCS>3.5
41
cytogram. Cells with low forward scatter and varying side scatter along the vertical
SSC axis were regarded as dead cells or cellular debris, and were not gated upon to
ensure visualization of solely viable, intact cells. The crude cell fraction was gated to
exclude only cells which did not fall within the highest density area of cells, keeping
the majority of the crude cell fraction within the gate.
Figure 14. Cytogram of lymph node crude cell fraction cells circled within the gate
labeled “R1”. Forward scatter (FSC) and side scatter (SSC) of light from
cells were measured by a FACSCalibur flow cytometer and gated cells
were analyzed for fluorescence.
3.4.2 ASCF population characteristics
A cytogram with forward (FSC) and side light scatter (SSC) of fixed
mesenteric ASCF shows a representative location of the single population of stromal
cells (Figure 15). The population displayed a wide diversity in cell size (FSC) and
complexity (SSC), and was conservatively gated on the area of highest density cells to

42
exclude the cells along the periphery of the gate. The gating corresponded with the
location of the crude cell population in the lymph node (Figure 14), using the location
of macrophages and lymphocytes in the lymph node to determine presence or absence
of macrophages and/or lymphocytes in the ASCF. Cells with low forward scatter and
varying side scatter along the vertical SSC axis were regarded as dead cells or cellular
debris, and were not gated upon to ensure visualization of solely viable, intact cells.
Figure 15. Cytogram of the mesenteric adipose stromal cell fraction circled within the
gate. Forward scatter (FSC) and side scatter (SSC) of light from cells
were measured by a FACSCalibur flow cytometer and gated cells were
analyzed for fluorescence.
3.4.3 Gating controls
Lymph node and ASCF cell auto-fluorescence were accounted for through
gating control cells stained with no primary antibodies but double stained with FITC
and PE conjugated secondary antibodies. Gating ensured 97% or more of the total cell
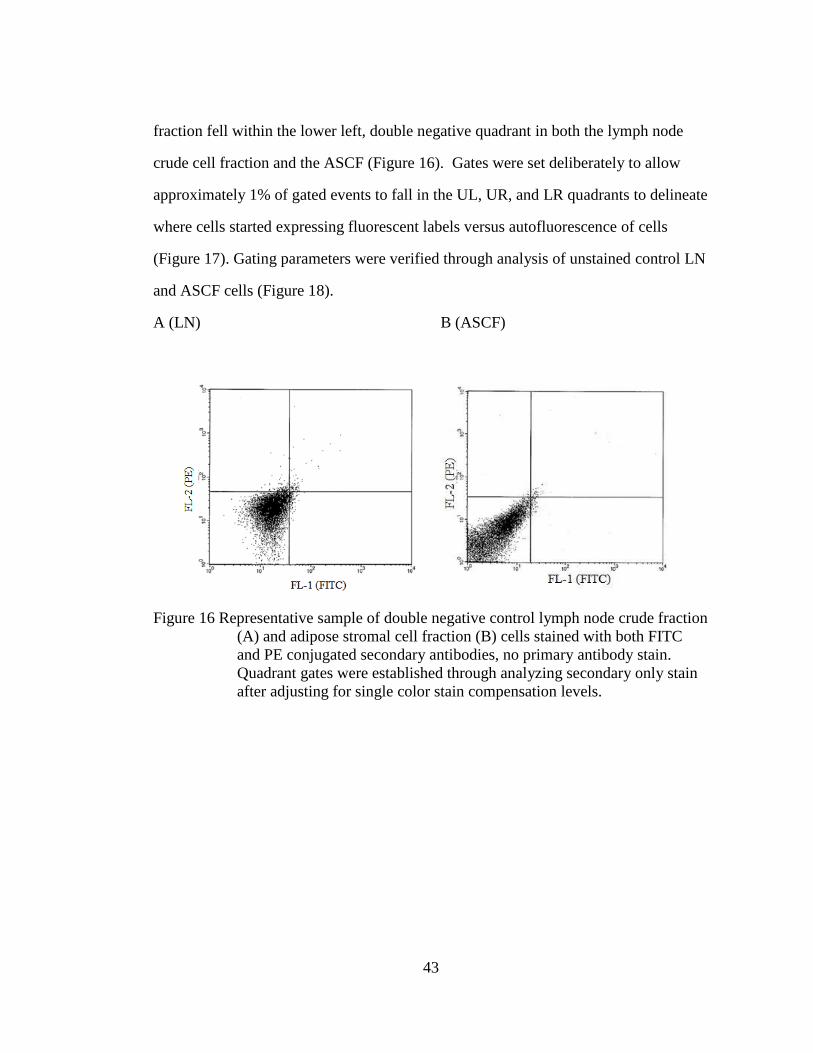
43
fraction fell within the lower left, double negative quadrant in both the lymph node
crude cell fraction and the ASCF (Figure 16). Gates were set deliberately to allow
approximately 1% of gated events to fall in the UL, UR, and LR quadrants to delineate
where cells started expressing fluorescent labels versus autofluorescence of cells
(Figure 17). Gating parameters were verified through analysis of unstained control LN
and ASCF cells (Figure 18).
A (LN) B (ASCF)
Figure 16 Representative sample of double negative control lymph node crude fraction
(A) and adipose stromal cell fraction (B) cells stained with both FITC
and PE conjugated secondary antibodies, no primary antibody stain.
Quadrant gates were established through analyzing secondary only stain
after adjusting for single color stain compensation levels.
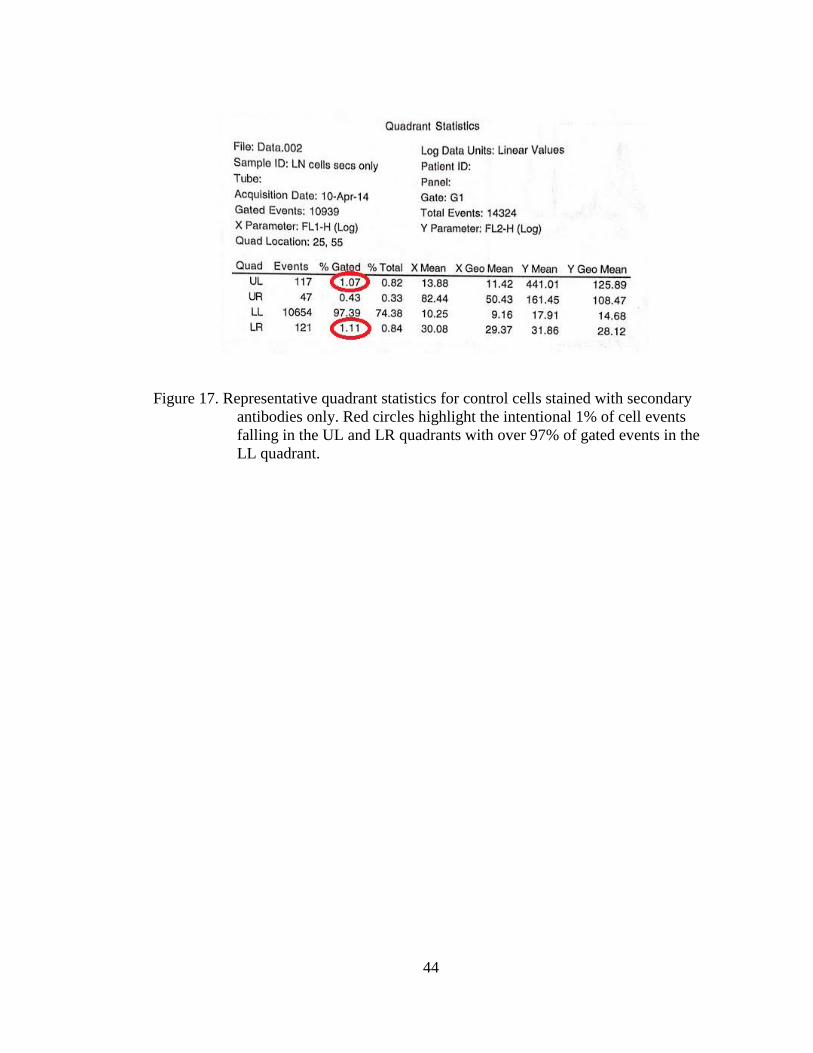
44
Figure 17. Representative quadrant statistics for control cells stained with secondary
antibodies only. Red circles highlight the intentional 1% of cell events
falling in the UL and LR quadrants with over 97% of gated events in the
LL quadrant.
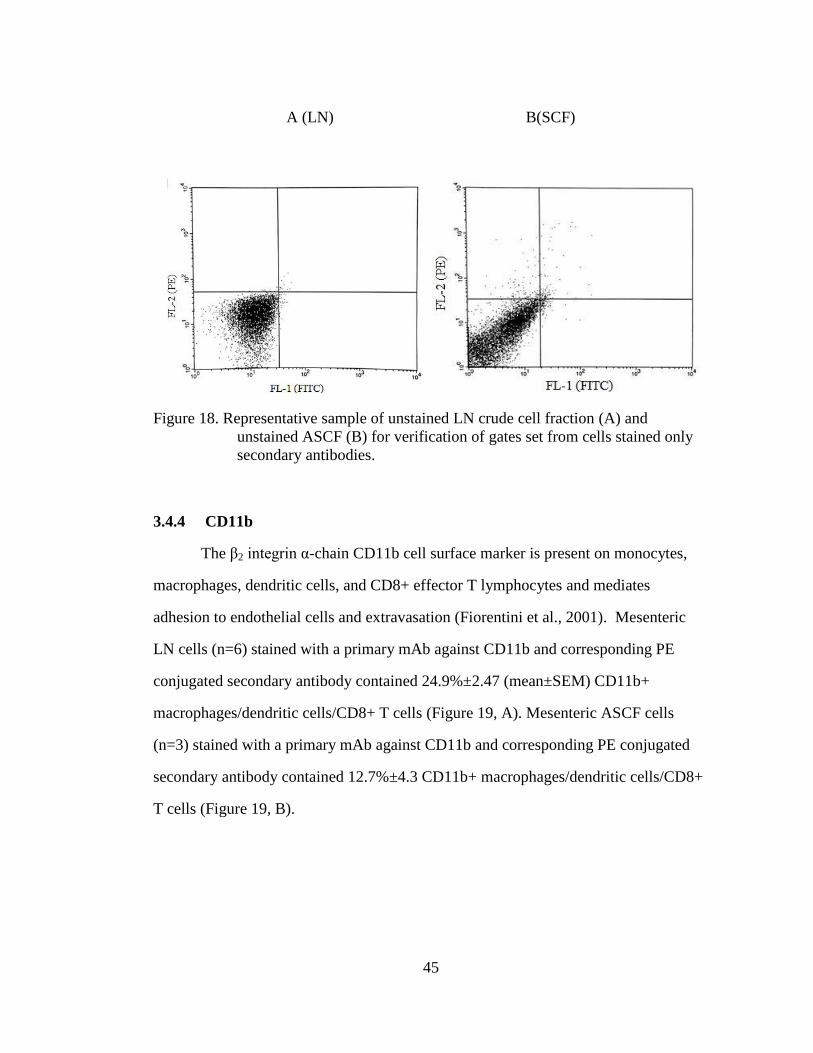
45
A (LN) B(SCF)
Figure 18. Representative sample of unstained LN crude cell fraction (A) and
unstained ASCF (B) for verification of gates set from cells stained only
secondary antibodies.
3.4.4 CD11b
The β2 integrin α-chain CD11b cell surface marker is present on monocytes,
macrophages, dendritic cells, and CD8+ effector T lymphocytes and mediates
adhesion to endothelial cells and extravasation (Fiorentini et al., 2001). Mesenteric
LN cells (n=6) stained with a primary mAb against CD11b and corresponding PE
conjugated secondary antibody contained 24.9%±2.47 (mean±SEM) CD11b+
macrophages/dendritic cells/CD8+ T cells (Figure 19, A). Mesenteric ASCF cells
(n=3) stained with a primary mAb against CD11b and corresponding PE conjugated
secondary antibody contained 12.7%±4.3 CD11b+ macrophages/dendritic cells/CD8+
T cells (Figure 19, B).
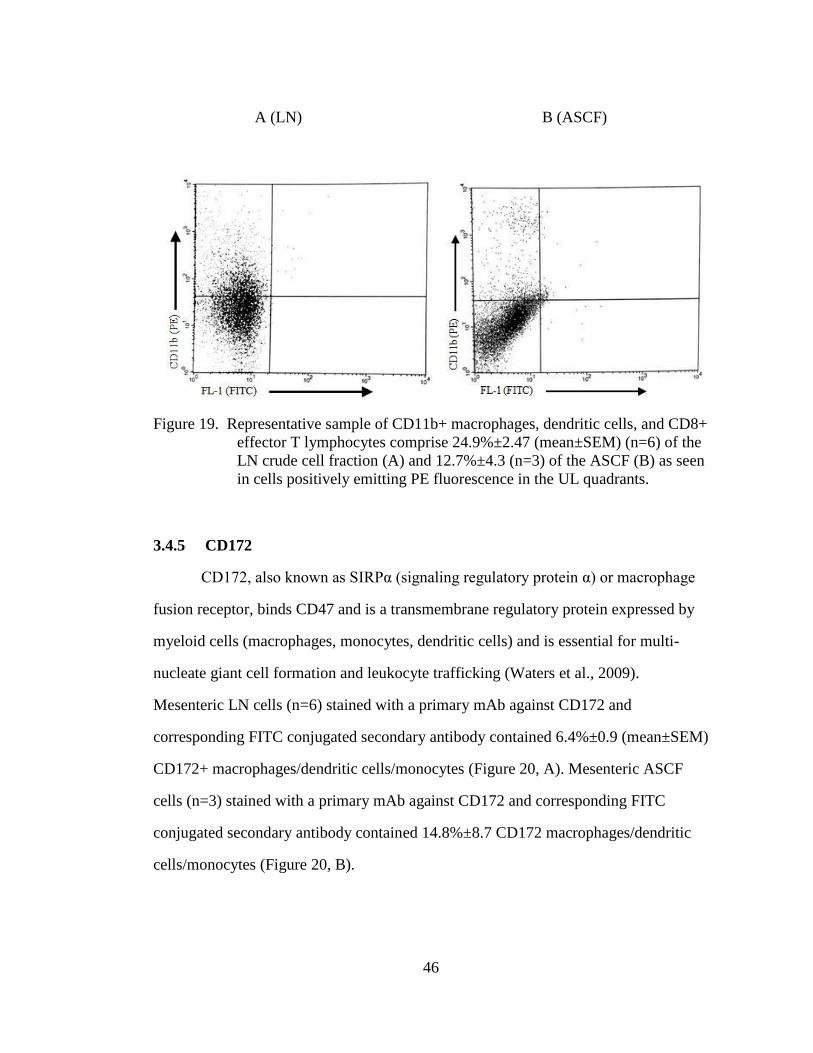
46
A (LN) B (ASCF)
Figure 19. Representative sample of CD11b+ macrophages, dendritic cells, and CD8+
effector T lymphocytes comprise 24.9%±2.47 (mean±SEM) (n=6) of the
LN crude cell fraction (A) and 12.7%±4.3 (n=3) of the ASCF (B) as seen
in cells positively emitting PE fluorescence in the UL quadrants.
3.4.5 CD172
CD172, also known as SIRPα (signaling regulatory protein α) or macrophage
fusion receptor, binds CD47 and is a transmembrane regulatory protein expressed by
myeloid cells (macrophages, monocytes, dendritic cells) and is essential for multi-
nucleate giant cell formation and leukocyte trafficking (Waters et al., 2009).
Mesenteric LN cells (n=6) stained with a primary mAb against CD172 and
corresponding FITC conjugated secondary antibody contained 6.4%±0.9 (mean±SEM)
CD172+ macrophages/dendritic cells/monocytes (Figure 20, A). Mesenteric ASCF
cells (n=3) stained with a primary mAb against CD172 and corresponding FITC
conjugated secondary antibody contained 14.8%±8.7 CD172 macrophages/dendritic
cells/monocytes (Figure 20, B).
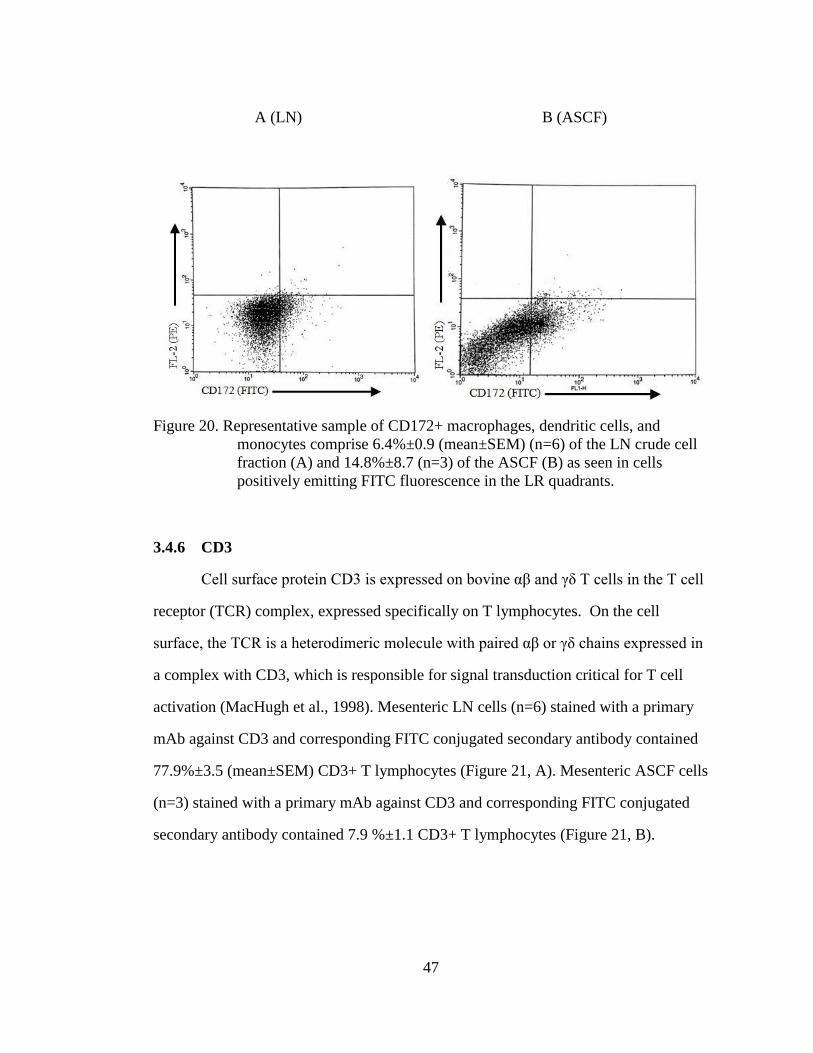
47
A (LN) B (ASCF)
Figure 20. Representative sample of CD172+ macrophages, dendritic cells, and
monocytes comprise 6.4%±0.9 (mean±SEM) (n=6) of the LN crude cell
fraction (A) and 14.8%±8.7 (n=3) of the ASCF (B) as seen in cells
positively emitting FITC fluorescence in the LR quadrants.
3.4.6 CD3
Cell surface protein CD3 is expressed on bovine αβ and γδ T cells in the T cell
receptor (TCR) complex, expressed specifically on T lymphocytes. On the cell
surface, the TCR is a heterodimeric molecule with paired αβ or γδ chains expressed in
a complex with CD3, which is responsible for signal transduction critical for T cell
activation (MacHugh et al., 1998). Mesenteric LN cells (n=6) stained with a primary
mAb against CD3 and corresponding FITC conjugated secondary antibody contained
77.9%±3.5 (mean±SEM) CD3+ T lymphocytes (Figure 21, A). Mesenteric ASCF cells
(n=3) stained with a primary mAb against CD3 and corresponding FITC conjugated
secondary antibody contained 7.9 %±1.1 CD3+ T lymphocytes (Figure 21, B).
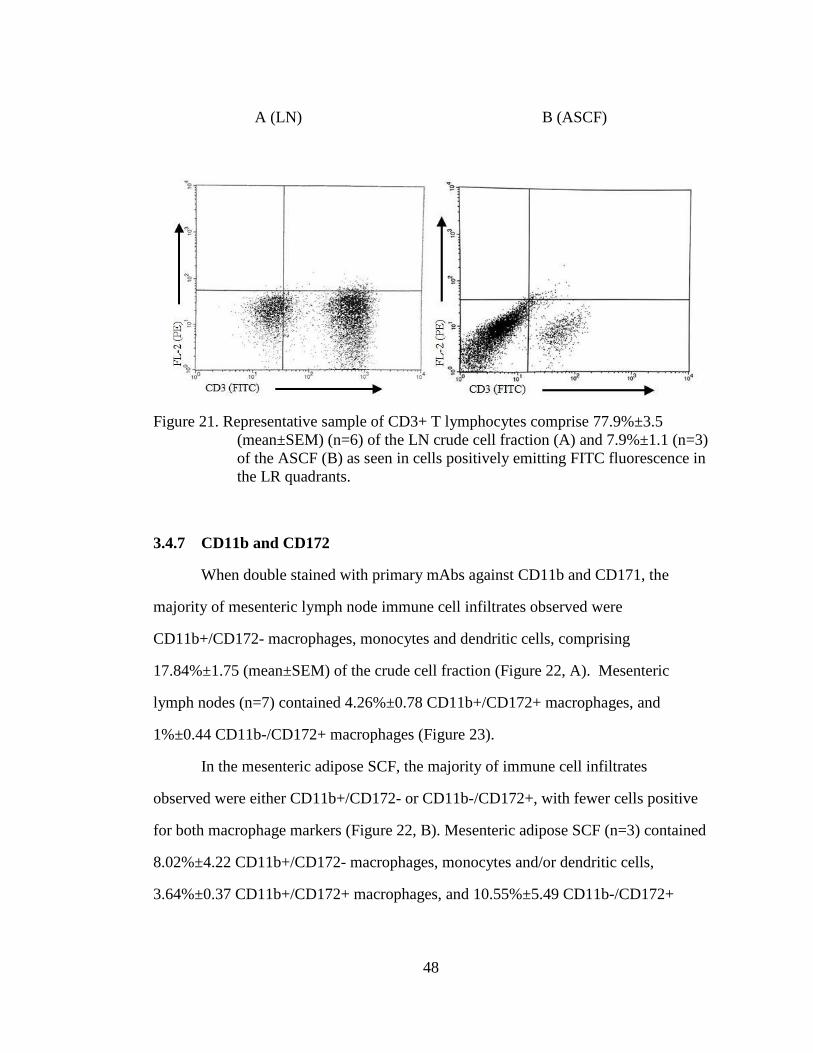
48
A (LN) B (ASCF)
Figure 21. Representative sample of CD3+ T lymphocytes comprise 77.9%±3.5
(mean±SEM) (n=6) of the LN crude cell fraction (A) and 7.9%±1.1 (n=3)
of the ASCF (B) as seen in cells positively emitting FITC fluorescence in
the LR quadrants.
3.4.7 CD11b and CD172
When double stained with primary mAbs against CD11b and CD171, the
majority of mesenteric lymph node immune cell infiltrates observed were
CD11b+/CD172- macrophages, monocytes and dendritic cells, comprising
17.84%±1.75 (mean±SEM) of the crude cell fraction (Figure 22, A). Mesenteric
lymph nodes (n=7) contained 4.26%±0.78 CD11b+/CD172+ macrophages, and
1%±0.44 CD11b-/CD172+ macrophages (Figure 23).
In the mesenteric adipose SCF, the majority of immune cell infiltrates
observed were either CD11b+/CD172- or CD11b-/CD172+, with fewer cells positive
for both macrophage markers (Figure 22, B). Mesenteric adipose SCF (n=3) contained
8.02%±4.22 CD11b+/CD172- macrophages, monocytes and/or dendritic cells,
3.64%±0.37 CD11b+/CD172+ macrophages, and 10.55%±5.49 CD11b-/CD172+

49
macrophages (Figure 23). Note these early results showed the single positive CD172
macrophage fractions in the SCF may be higher in mesenteric adipose depots
compared to the mesenteric lymph nodes.
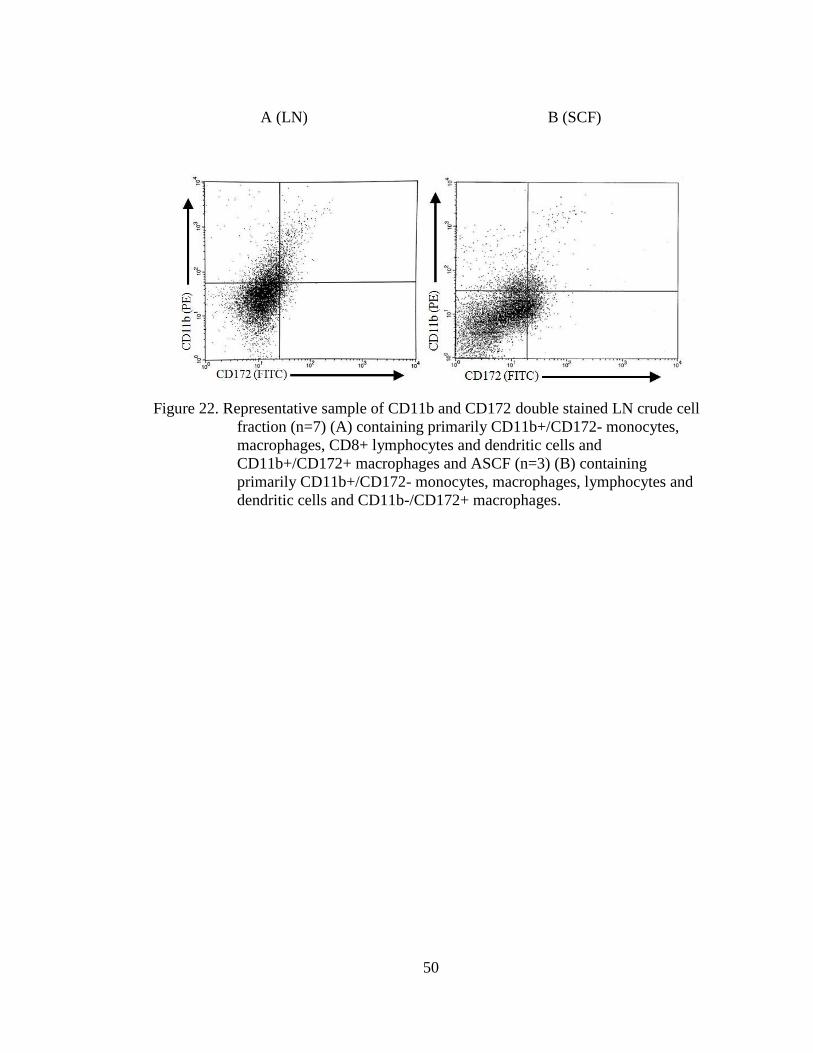
50
A (LN) B (SCF)
Figure 22. Representative sample of CD11b and CD172 double stained LN crude cell
fraction (n=7) (A) containing primarily CD11b+/CD172- monocytes,
macrophages, CD8+ lymphocytes and dendritic cells and
CD11b+/CD172+ macrophages and ASCF (n=3) (B) containing
primarily CD11b+/CD172- monocytes, macrophages, lymphocytes and
dendritic cells and CD11b-/CD172+ macrophages.
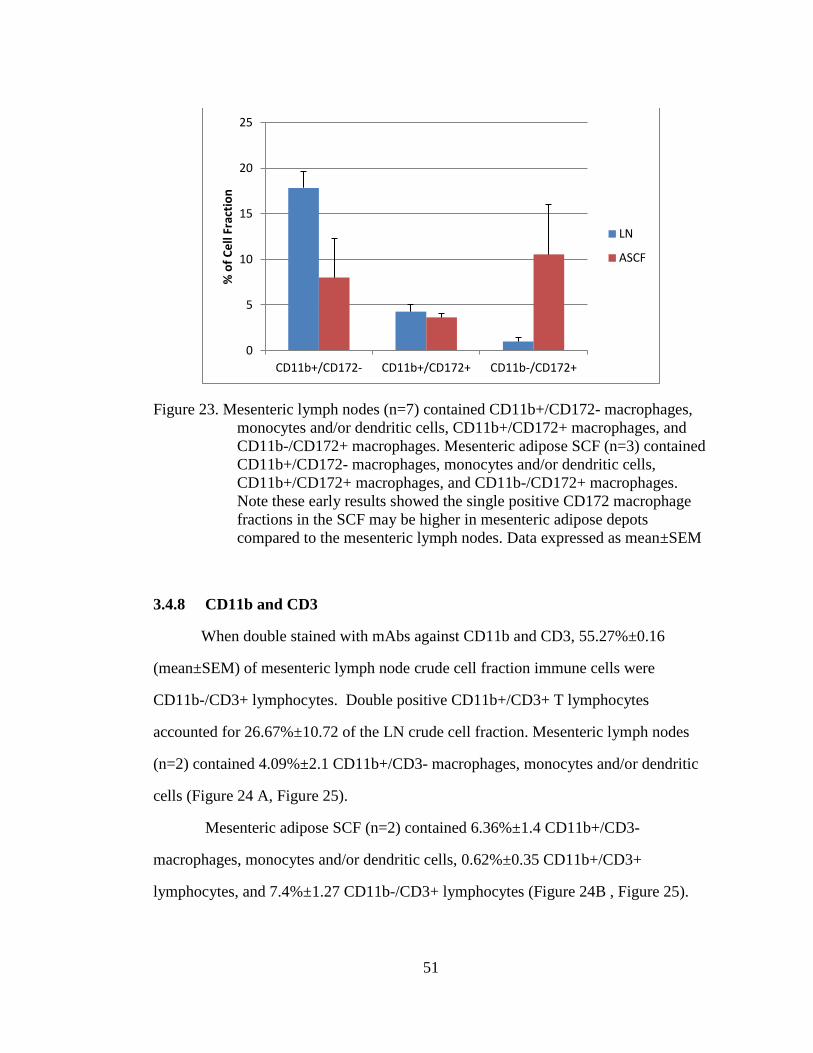
51
Figure 23. Mesenteric lymph nodes (n=7) contained CD11b+/CD172- macrophages,
monocytes and/or dendritic cells, CD11b+/CD172+ macrophages, and
CD11b-/CD172+ macrophages. Mesenteric adipose SCF (n=3) contained
CD11b+/CD172- macrophages, monocytes and/or dendritic cells,
CD11b+/CD172+ macrophages, and CD11b-/CD172+ macrophages.
Note these early results showed the single positive CD172 macrophage
fractions in the SCF may be higher in mesenteric adipose depots
compared to the mesenteric lymph nodes. Data expressed as mean±SEM
3.4.8 CD11b and CD3
When double stained with mAbs against CD11b and CD3, 55.27%±0.16
(mean±SEM) of mesenteric lymph node crude cell fraction immune cells were
CD11b-/CD3+ lymphocytes. Double positive CD11b+/CD3+ T lymphocytes
accounted for 26.67%±10.72 of the LN crude cell fraction. Mesenteric lymph nodes
(n=2) contained 4.09%±2.1 CD11b+/CD3- macrophages, monocytes and/or dendritic
cells (Figure 24 A, Figure 25).
Mesenteric adipose SCF (n=2) contained 6.36%±1.4 CD11b+/CD3-
macrophages, monocytes and/or dendritic cells, 0.62%±0.35 CD11b+/CD3+
lymphocytes, and 7.4%±1.27 CD11b-/CD3+ lymphocytes (Figure 24B , Figure 25).
0
5
10
15
20
25
CD11b+/CD172- CD11b+/CD172+ CD11b-/CD172+
% o
f C
ell
Frac
tio
n
LN
ASCF
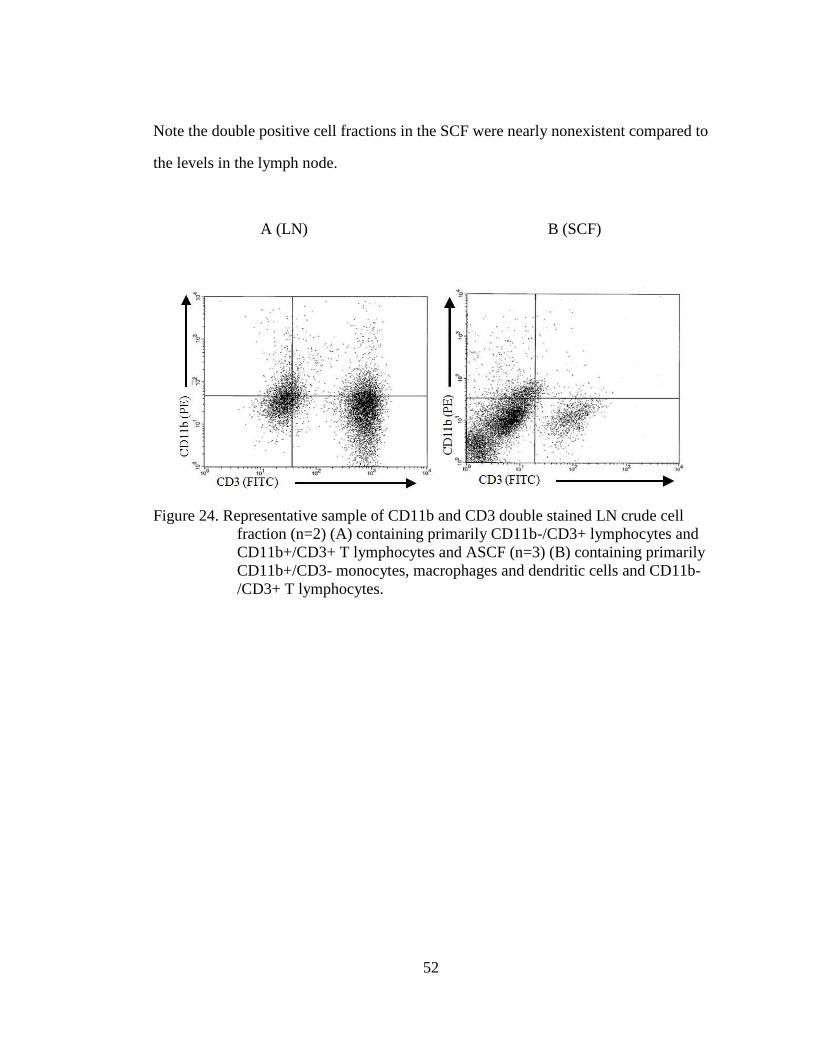
52
Note the double positive cell fractions in the SCF were nearly nonexistent compared to
the levels in the lymph node.
A (LN) B (SCF)
Figure 24. Representative sample of CD11b and CD3 double stained LN crude cell
fraction (n=2) (A) containing primarily CD11b-/CD3+ lymphocytes and
CD11b+/CD3+ T lymphocytes and ASCF (n=3) (B) containing primarily
CD11b+/CD3- monocytes, macrophages and dendritic cells and CD11b-
/CD3+ T lymphocytes.
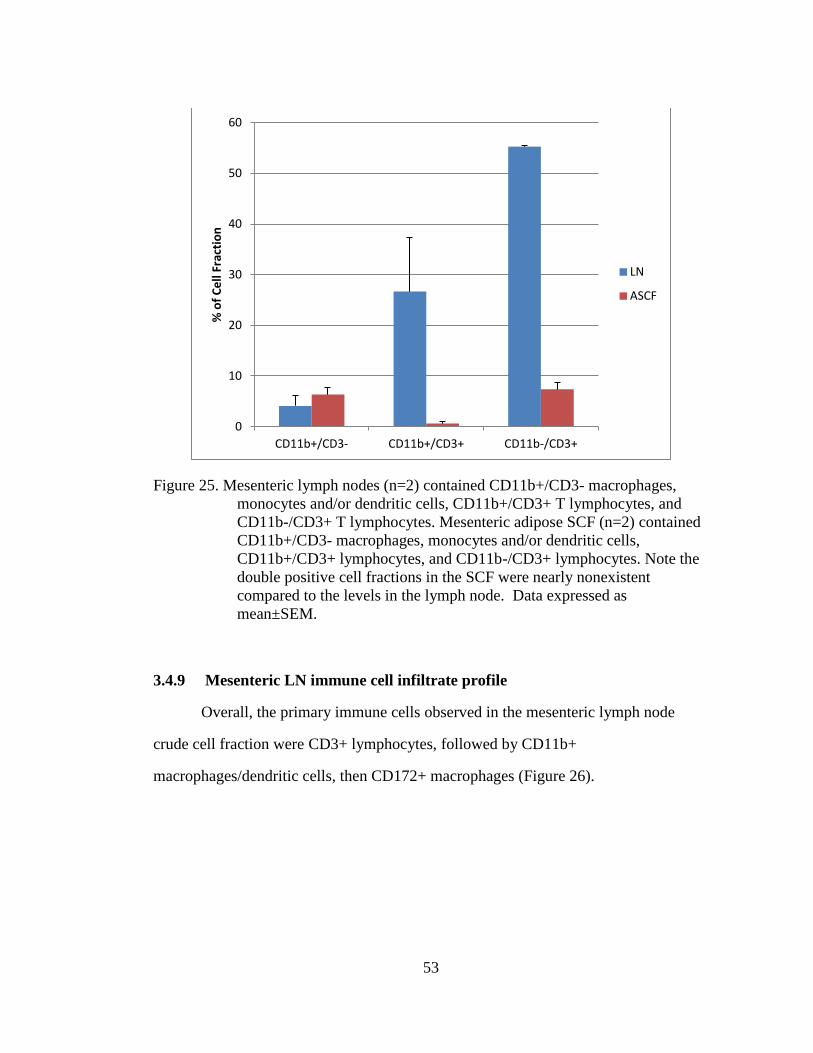
53
Figure 25. Mesenteric lymph nodes (n=2) contained CD11b+/CD3- macrophages,
monocytes and/or dendritic cells, CD11b+/CD3+ T lymphocytes, and
CD11b-/CD3+ T lymphocytes. Mesenteric adipose SCF (n=2) contained
CD11b+/CD3- macrophages, monocytes and/or dendritic cells,
CD11b+/CD3+ lymphocytes, and CD11b-/CD3+ lymphocytes. Note the
double positive cell fractions in the SCF were nearly nonexistent
compared to the levels in the lymph node. Data expressed as
mean±SEM.
3.4.9 Mesenteric LN immune cell infiltrate profile
Overall, the primary immune cells observed in the mesenteric lymph node
crude cell fraction were CD3+ lymphocytes, followed by CD11b+
macrophages/dendritic cells, then CD172+ macrophages (Figure 26).
0
10
20
30
40
50
60
CD11b+/CD3- CD11b+/CD3+ CD11b-/CD3+
% o
f C
ell
Frac
tio
n
LN
ASCF
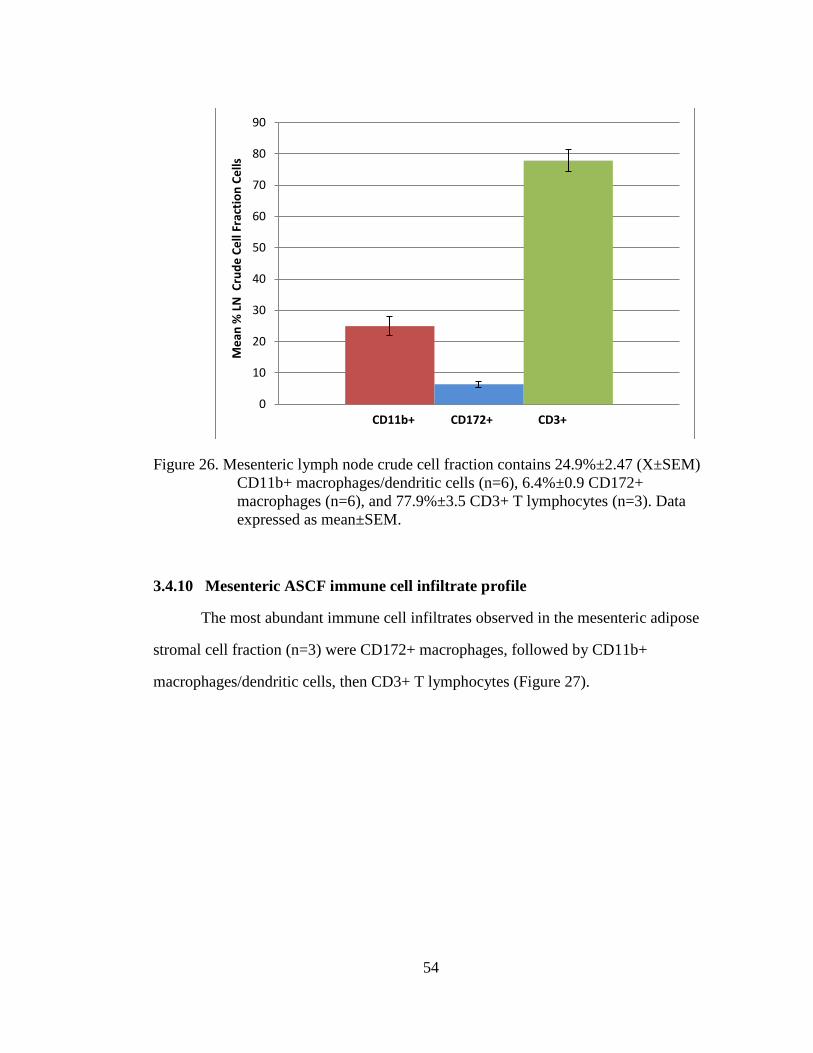
54
Figure 26. Mesenteric lymph node crude cell fraction contains 24.9%±2.47 (X±SEM)
CD11b+ macrophages/dendritic cells (n=6), 6.4%±0.9 CD172+
macrophages (n=6), and 77.9%±3.5 CD3+ T lymphocytes (n=3). Data
expressed as mean±SEM.
3.4.10 Mesenteric ASCF immune cell infiltrate profile
The most abundant immune cell infiltrates observed in the mesenteric adipose
stromal cell fraction (n=3) were CD172+ macrophages, followed by CD11b+
macrophages/dendritic cells, then CD3+ T lymphocytes (Figure 27).
0
10
20
30
40
50
60
70
80
90
Me
an %
LN
Cru
de
Ce
ll Fr
acti
on
Ce
lls
CD11b+ CD172+ CD3+
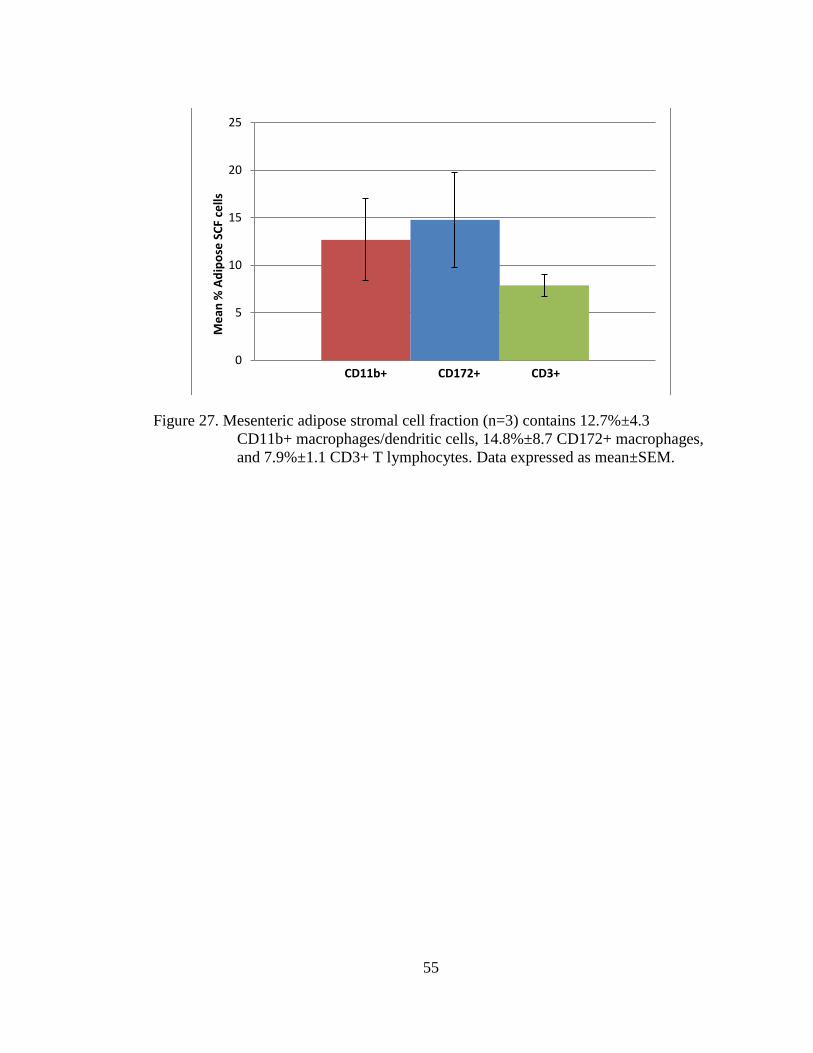
55
Figure 27. Mesenteric adipose stromal cell fraction (n=3) contains 12.7%±4.3
CD11b+ macrophages/dendritic cells, 14.8%±8.7 CD172+ macrophages,
and 7.9%±1.1 CD3+ T lymphocytes. Data expressed as mean±SEM.
0
5
10
15
20
25
Me
an %
Ad
ipo
se S
CF
cells
CD11b+ CD172+ CD3+
56
Chapter 4
DISCUSSION
Adipocyte area and frequency distribution of adipocyte size increases with increasing
body condition
4.1 Adipocyte area and BCS
In models of obesity, adipocyte hypertrophy has been shown to be a seminal
event preceding adipose tissue inflammation and the onset of metabolic syndrome. To
address this issue in dairy cattle we examined the relationship of body condition score
to adipocyte cross-sectional area in mesenteric, omental and subcutaneous adipose
tissue depots. Increased body condition was directly proportional to increases in
mesenteric and omental adipocyte size, which showed that increased adiposity was
associated with adipocyte hypertrophy in dairy cows. The results suggest these cows
may have employed mechansims of hypertrophic adipocyte responses to accommodate
excess nutrient intake. Since adipocyte hypertrophic responses are the pivotal event
triggering metabolic inflammation, the result opened the possibility bovine adipose
depots could be at risk for an inflammatory reaction.
Akter et al., (2011) reported no reduction in average wet weight of mesenteric,
omental, and subcutaneous adipose depots occurred within the first 114 DIM even
though there was systemic evidence of fat mobilization associated with 100lbs weight
loss. Only the retroperitoneal depots (perirenal fat) showed reductions in the wet
weight. No reductions in adipocyte size were noted across these adipose depots other
57
than the perirenal depot. Changes in the perirenal adipocyte size (1300-1400um2) by
114 DIM were only 13-15% of the starting size on the first day post partum.
(7,950um2.). Akter et al. (2011) also reported adipocyte size was weakly correlated
with adipose depot wet weight only for the perirenal fat (r=0.69). The data implied
adipose weight and adipocyte size may be relatively insensitive indicators of fat
mobilization responses during lactation. Results from the current investigation
indicated adipocyte size was highly correlated with body condition across a much
wider range of adiposity than reported by Akter et al. (2011). Moreover, data reported
herein indicated reductions in adipocyte size occurred in a highly correlated fashion
between depots across all levels of body condition.
Differences between these investigations could be attributed to a number of
explanations. Conflicting results between studies could have been a product of their
methodology used to measure adiposity. Their report (Akter et al., 2011) presented
the absolute wet weight of each adipose tissue depot, without normalization for total
body weight, which could have dramatically affected both variability and outcomes of
the analysis. Use of body condition score in the current study is susceptible to greater
levels of error due to the subjective nature of the methodology. A more objective
method might incorporate measurement of body mass index, over BCS, to more
accurately assess body condition. Alternatively, the range in weight loss (100lbs)
reported by Akter et al. (2011) was considerably less than that observed in the current
investigation (BCS ranging from 1.5 -5.0 or approximately 400lbs). The wider spread
in body weight employed in the current study could be expected to present a more
robust measure of adipocyte size assuming adipocytes respond to weight loss in a
linear fashion across all levels of weight. Lastly, reductions in adipose tissue mass
58
could be attributed to inequalities in energy balance in the lactation study (Akter et al,
2011) whereas the cause of weight loss in the current study was unknown but unlikely
to be related to heavy lactational stress given the nature of the cull cow population.
Differences in causality of fat mobilization secondary to disease problems in cull cows
(e.g. mastitis, metritis, lameness in cull dairy cows; reviewed in LeBlanc et al., 2014)
compared to primary causes stemming from negative energy balance could contribute
to the differences between results in the current report and those of Akter et al.,
(2011). However, further research in a more controlled study would be needed to
determine the effects of heavy lactational stress on bovine adipose tissue physiology.
The correlation between adipocyte size and body condition score in the
subcutaneous adipose tissue depot was considerably lower than those observed in the
mesenteric and omental depots. The explanation appeared to lie with the variability in
adipocyte size observed at the BCS 2.0-2.5. These differences suggest adipocytes
within the subcutaneous depots may vary considerably between hyperplastic vs.
hypertrophic responses in the process of triglyceride storage. This altered and highly
variable regulation of adipocyte hypertrophy or hyperplasia in the SAT could explain
why ruminant studies examining subcutaneous adipose physiology have not found
data strongly correlated to the murine and human models of metabolic syndrome.
From our data, based on the relatively high variability which bovine SAT exhibited in
comparison to visceral adipose tissue depots, SAT may be a poor reflection of AT
inflammation and the physiology of bovine adipose tissue.
Prior bovine studies which investigated subcutaneous adipose tissue for
lipogenic and lipolytic adipose gene networks (Khan et al., 2013), protein
phosphorylation of protein kinase B (AKT) (Zachut et al., 2013), and coordination and
59
phosphorylation of lipolytic proteins (Koltes et al., 2011) all resulted in highly
variable data which made drawing conclusions difficult and proved insubstantial to
relate bovine adipose tissue to murine or human models of AT inflammation. Even in
lean and fat sheep (Daniel et al., 2003), TNFα production that was recognized in the
SAT was in an inactive, pro-TNFα form and again was highly variable. This
suggested that while the tissue may be capable of producing pro-inflammatory
cytokines, they were not activated and could not have caused adipose tissue
inflammation, whereas mesenteric adipose tissue may have demonstrated different
effects due to its clinical relevance in human and murine models (Zhao et al., 2013;
Yang et al., 2010; Weisberg et al., 2003; Westcott et al., 2009).
Another explanation for the tremendous variability in the subcutaneous data
would be that mean subcutaneous adipocyte areas could not be determined for two of
the heavy (BCS 4.5 and 5.0) cows due to difficulties in tissue fixation/mounting
issues. The majority of subcutaneous adipose tissue samples proved difficult to find
100 intact adipocytes, which hinted that there may have been some mechanical issues
with tissue collection and preservation. Possibly the procedure of tissue fixation and
section preparation could generate a number of artifactual shifts in adipocyte size.
While absence of those two data points could have altered the correlation, the current
plot of subcutaneous adipocyte size by BCS showed much more variability from the
trendline than the mesenteric and omental adipose tissue depots displayed. Omitting
the two higher body condition data points from the mesenteric and omental adipocyte
size by BCS graphs shifted their correlations to r=0.68 for both depots, a much higher
correlation than seen in the subcutaneous depot (r=0.59). The explanations underlying
the variability are unclear, and more data points are required to support or refute the
60
contention that subcutaneous adipose tissue stores triglycerides differently than
omental or mesenteric AT.
4.2 Adipocyte area by tissue depot
Adipocyte area in all three adipose tissue depots increased in direct proportion
with one another, displaying that when cows employed hypertrophic responses to store
triglycerides, the response was consistent across mesenteric, omental, and
subcutaneous adipose tissue depots. Previous studies (Akter et al., 2011) reported that
there were no significant differences between adipocyte areas in subcutaneous and
visceral adipose tissue depots, which supported our data stating adipocyte sizes were
consistent among subcutaneous and visceral adipose tissue. These universal increases
in adipocyte area demonstrated that adipocyte hypertrophy is likely a systemic event
in adipose tissue across mesenteric, omental and subcutaneous adipose tissue. The
caveat is the variability seen in the subcutaneous depots. The uniform nature of the
hypertrophic responses across all depots possesses the compelling question about the
presence of adipose tissue inflammation in a both visceral and subcutaneous AT
depots in the peripartal dairy cow.
Endogenous populations of T lymphocytes and macrophages/dendritic cells exist in
the mesenteric adipose.
4.3 Characterizing immune cell infiltrates
4.3.1 Mesenteric lymph node
As expected, the majority of immune cells in the mesenteric lymph node were
lymphocytes, followed by macrophages and dendritic cells; consistent with data from
61
other species (Willard-Mack, 2006). In the current study, mesenteric lymph nodes
were incorporated into the analysis solely as a positive control for lymphocyte and
macrophage markers. This approach provided an adequate control for marker
detection in the FACS, A compelling question that falls out of the current data set is
the immune/inflammatory cell population in the adipose tissue a response restricted to
exclusively to the adipose tissues in obesity. The hypothesis that adipocyte derived
cytokines drive immune/inflammatory cell infiltrates into the adipose predicts the
response will be restricted exclusively to the adipose tissue and will not be observed
across peripheral immune tissues. A body of data however, exists to show the
gastrointestinal microbiome and gastrointestinal immune responses impact adipose
immune/inflammatory cell infiltrates. These gastrointestinal events would also be
expected to disturb immune/inflammatory events in the mesenteric lymph node tissues
(Han et al., 2014). This could be expected to render these nodes unsuitable controls
for the presence or absence of systemic inflammatory/immune response in adiposity.
To compare the immune cell composition of local adipose tissue inflammation with
systemic immune cell phenotypes, the spleen or peripheral lymph node tissues would
be unbiased and more appropriate controls for the presence of absence of systemic
immune/inflammatory responses in adiposity.
4.3.2 Adipose stromal cell fraction
In the mesenteric adipose SCF, the majority of immune cell infiltrates
observed were CD11b+/CD3- monocytes, macrophages and/or dendritic cells or
CD11b-/CD3+ T lymphocytes, with barely any CD11b+/CD3+ cells positive for both
markers. The lack of CD11b+/CD3+ staining effector T lymphocytes in the
mesenteric adipose tissue contrasted greatly with the CD11b+/CD3+ T cell population
62
in the mesenteric lymph node, which comprised nearly a quarter of the LN crude cell
fraction. Since these are likely to be CD8 effector T lymphocytes, these early results
suggest CD8 effector cell responses are underway in the mesenteric lymph node but
not present in the adipose tissue. In murine models, Nishimura et al. (2009) reported
both diet induced and ob/ob leptin knockout obese mice showed significantly
increased CD8+ effector T cell levels in visceral adipose tissue compared to mice fed
normal diets. The study also demonstrated that CD8+ T cells caused secondary
macrophage infiltration and were necessary for AT inflammation. Likewise, CD8+
depletion in visceral adipose tissue ameliorated adipose tissue inflammation and
macrophage infiltration in obese mice. The absence of CD11b+/CD3+ presumed CD8
effector T cells seen in preliminary data could suggest that the bovines with lower
body condition scores (BCS <3.5) which were analyzed in this study lacked adipose
tissue inflammation. The data could also suggest that bovines are somehow protected
from CD8+ effector T cell infiltration and its secondary initiation of adipose tissue
inflammation; however, more data is needed to validate the presence or absence of
CD11b+/CD3+ immune cells in cows across a wider variety of body condition scores.
Early results also showed the single positive CD11b-/CD172+ macrophage
fractions in the ASCF may be higher in mesenteric adipose tissues than in the
mesenteric lymph node. While these results must be regarded with caution because of
variability and low cow numbers, these early data imply macrophage numbers in the
stromal cell fraction could have differed from mesenteric lymph node populations.
The CD172+/CD11b- cells in the ASCF could have been monocytes and macrophages
with low CD11b expression, or dendritic cells. Since there is no pan-macrophage
marker in bovines, determining whether these cells were macrophages versus dendritic
63
cells was not feasible in the current study. In addition to CD172, and CD11b, the
current study attempted stains against the pan-macrophage/monocyte restricted
transmembrane scavenger receptor (CD68) with murine anti-bovine CD68.
Preliminary results indicated < 0.1-0.5% of lymph node or stromal cell fractions were
positive for this receptor thereby rendering this glycoprotein unhelpful for the needs of
the current investigation. The presence of macrophages (CD172+) in the adipose
tissue not expressing CD11b could indicate the presence of M2 macrophages in the
adipose tissue. If so, the data collected in this study from lean dairy cows (BCS <2.5)
would be consistent with murine models, which stated that roughly 15% of the SCF
were M2 macrophages lean animals (Weisberg et al., 2003). Cells marking
CD172+/CD11b- preferentially in adipose tissue could also be dendritic cells (DCs),
used for antigen presentation. Adipose tissue DCs were shown to be present at low
numbers in lean animals and increased with obesity in mice (Chen et al., 2014). These
dendritic cells underpinned a Th17 pro-inflammatory response in visceral adipose
depots. Data from this investigation could suggest that resident dendritic cell
populations were present in lean bovine adipose tissue. More data from cows with
higher body condition, in conjunction with additional dendritic cell markers, would
need to be examined to better characterize these relatively unknown cell sets in bovine
adipose tissue.
Akter et al. (2012) reported that few to no immune cell infiltrates were present
in the stromal cell fraction of bovine adipose tissue in cows under lactational stress
during the first 105 DIM. Only 9 animals of 15 showed positive immunostaining for
macrophages in the study in visceral adipose depots with the portion of CD68+
(macrophage marker) cells present in only 6.6% of samples, and the portion of
64
CD11b+ cells present in only 13% of samples. No positive staining for macrophages
was found in subcutaneous adipose tissue depots. The study (Akter et al., 2012)
implied that there was little to no appreciable infiltration of macrophages into bovine
adipose tissues. Data from Akter et al. (2012) directly contradicted the results from the
current investigation, which showed CD11b+ and CD 172+ cells existed in all ASCF
samples. Together, these markers clearly indicated macrophage immune cells exist as
endogenous populations in the ASCF of dairy cows.
Akter et al. (2012) also analyzed a very selective sample subset defined by
expression of positive macrophage markers (10 out of 150 samples). They reported a
correlation between empty body weight (EBW) and immune cell infiltration as well as
adipocyte size and immune cell infiltration. While this data may have indicated that
increased EBW led to increased macrophage infiltration in the ASCF, the data may
not be representative of adiposity and immune cell infiltration due to the bias inherent
in the methods for sample subset selection. Indeed the subset only accounted for <7%
of total population of cows employed in the study (Akter et al., 2012).
A number of possibilities could explain differences in the inflammatory cell
infiltrates reported between these investigations. Conflicting results between studies
could have arisen from marked differences in the methodology used to examine
immune cell infiltrates. Akter et al., (2011) examined macrophage infiltration by
employing immunohistochemical analyses of macrophage markers that were designed
for flow cytometry. The process of tissue fixation, dehydration and mounting is
expected to erode epitope integrity. Additionally, tissue components in the mounted
sections are expected to erode epitope visibility. Together, these technical issues
reduce the sensitivity in immunohistochemical techniques. The current study
65
employed fluorescence activated cell sorting (FACS) analysis to examine immune cell
populations. The absence of fixatives, the reduced presence of extraneous tissue
components and the use of antibodies specifically designed for FACS methodologies
likely increased epitope detection and the quantitative sensitivity of the FACS
procedure employed in the current investigation. The lowered sensitivity and increased
possibility for error when utilizing immunohistochemistry could have dramatically
affected both variability and outcomes of the analysis compared to the FACS
technique.
Secondly, differences between the study populations may underpin differences
in the adipose inflammatory disease. The putative mechanism driving adipose
inflammation in bovine obesity was proposed to be adipocyte hypertrophy and the
associated adipokine responses and apoptosis (Akter et al., 2012). Data in that report
appeared not to support the hypothesis. In the current report, the pathogenesis of
adipose inflammation could have been an underling and earlier obesity as proposed by
Akter et al., (2012). We cannot rule out however, the possibility that the cull cow
population in slaughterhouse populations suffered from other primary inflammatory
diseases that contributed to the adipose inflammatory responses (Graugnard et al.,
2013). Clearly, differences between these two investigations raise compelling issues
about the causality of adipose inflammatory/immune reactions in lactating dairy cows.
4.4 Conclusions
The main findings of the present study were that increased mean adipocyte
area and shifted frequency distribution of adipocyte size indicate dairy cows respond
to nutrient burdens with adipocyte hypertrophy. Likewise, the study found that
endogenous populations of T lymphocytes and macrophages/dendritic cells exist in the
66
mesenteric adipose. Collectively, the data suggests immune functions may impact
metabolic homeostasis in bovine mesenteric adipose depots.
4.5 Future areas of research
Future research will continue to examine adipocyte size in visceral and
subcutaneous adipose depots, however, relate that to body mass index rather than body
condition score; a much more objective method of analyzing adiposity. Likewise,
further examination and verification of the immune cell populations which the current
study presented in the ASCF will be needed to define endogenous immune cell
populations in adipose tissue. Utilization of PCR primers for the F4/80 pan-
macrophage marker will be used to verify macrophage populations in the ASCF.
Determination of M1 versus M2 macrophage profiles through specific M1/M2
macrophage markers should also be employed to determine if they serve to be pro- or
anti-inflammatory in nature. For lymphocyte verification and categorization, CD3+ T
lymphocytes will be sorted, then examined for CD4+, CD8+ and FOXP3+ lymphocyte
markers to determine the subsets of the lymphocytes in the ASCF.
Examination of ASCF immune cell populations in heavy (BCS>4.0) dairy
cows will be performed to analyze if there is an association between increased
adiposity on immune cell populations in relation to lean ASCF immune cell
populations and to characterize those changes. Future studies may also examine the
effects of deliberately increasing adiposity in a more controlled setting on adipocyte
size, body mass index, and immune cell infiltration to account for confounding
variables ever-present in abattoir-based studies which may affect results. Another
area of future studies could examine the effects of increasing gut wall permeability
(via switching diets, starch infusion, etc) on adipose tissue immune cell presence in

67
lean and obese dairy cows. This study would help to determine if gut microbiome
shifts are primary or secondary in causation of adipose tissue inflammation and the
effect of gut microbiome alterations, such as peripartal diet shifts, on adipose tissue
inflammation.
68
REFERENCES
If you want to number your bibliographic entries, change the style of the items to Bib
Entry - numbered.
Adewuyi, A.A. et al. (2005). Non esterified fatty acids (NEFA) in dairy cattle. A
review. Veterinary Quarterly. 27(3), 117-126.
Arita, Y. et al. (1999). Paradoxical decrease of an adipose-specific protein,
adiponectin, in obesity. Biomedical and Biophysical Research
Communications. 257(1), 79-83.
Akter, S.H., Haussler, S., Danicke, S., Muller, U., von Soosten, D., Rehage, J.
Sauerwein, H. (2011). Physiolgical and conjugated linoleic acid-induced
changes of adipocyte size in different fat depots of dairy cows during early
lactation. J. Dairy Sci. 94(6), 2871-2882.
Akter, S.H., Haussler, S., Germeroth, D., von Soosten, D., Danicke, S., Sudekum,
K.H. and Sauerwein, H. (2012). Immunohistochemical characterization of
phagocytic immune cell infiltration into different adipose tissue depots of dairy
cows during early lactation. J. Dairy Sci. 95, 3032-3044.
Bernabucci, U. et al. (2004). Abundance of mRNA of apolipoprotein b100,
apolipoprotein e, and microsomal triglyceride transfer protein in liver from
periparturient dairy cows. J. Dairy Sci. 87(9), 2881-2888.
Bobe, G., Young, J.W., and Beitz, D.C. (2004). Invited review: pathology, etiology,
prevention and treatment of fatty liver in dairy cows. J. Dairy Sci. 87(10),
3105-3124.
Buckley, F., O’Sullivan, K., Mee, J.F., Evans, R.D. and Dillon, P. (2003).
Relationships among milk yield, body condition, cow weight, and reproduction
in spring-calved Holstein-Friesians. J. Dairy Sci. 86(7), 2308-2319.
Chawla, A., Nguyen, K.D. and Sharon Goh, Y.P. (2012). Macrophage-mediated
inflammation in metabolic disease. Nat Rev Immunol. 11(11) 738-749.
Compensation How To. (2003). Salk Institute for Biological Studies. Retrieved April
21, 2014, from http://flowcyt.salk.edu/howto/compensation/compensation-
howto.html
69
Daniel, J.A., Elsasser, T.A., Morrison, C.D., Keisler, D.H., Whitlock, B.K., Steele, B.,
Pugh, D. and Sartin, J.L. (2003). Leptin, tumor necrosis factor-α (TNF), and
CD14 in ovine adipose tissue and changes in circulating TNF in lean and fat
sheep. J. Anim. Sci. 81, 2590-2599.
Dann, H.M., Litherland, N.B., Underwood, J.P., Bionaz, M., D’Angelo, A.,
McFadden, J.W., Drackley, J.K. (2006). Diets during far-off and close-up dry
periods affect periparturient metabolism and lactation in multiparous cows. J.
Dairy Sci. 89(9); 3563-3577.
Drackley, J.K. (1999). Biology of dairy cows during the transition period: the final
frontier? J. Dairy Sci. 82(11), 2259-2273.
Drackley, J.K., Overton, T.R., and Douglas, G.N. (2001). Adaptations of glucose and
long-chain fatty acid metabolism in liver of dairy cows during the
periparturient period. J. Dairy Sci. 84(supplement), E100-E112.
Flow cytometry and cell sorting. (2012). University of Dundee College of Life
Sciences. Retrieved April 21, 2014, from
http://www.lifesci.dundee.ac.uk/cast/flow-cytometry-core-facility/techniques-4
Fiorentini et al. (2001). CD11b expression identifies CD8+CD28+ T lymphocytes
with phenotype and function of both naïve/memory and effector cells. J.
Immunology. 166(2), 900-907.
Graugnard, D.E., Moves, K.M., Khan, M.J., Darckley, J.K., Bertoni, G., and J.J. Loor.
2013. Liverlipid and inflammaometaboloic indices in peripartal dairy cows are
altered in response to prepartal energy intake and postpartal intramammary
inflammatory challenge. J. Dairy Sci. 96:918-935.
Grum, D.E. et al. (1996). Nutrition during the dry period and hepatic lipid metabolism
of periparturient dairy cows. J. Dairy Sci. 79, 1850-1864.
Grummer, R.R. (1995). Impact of changes in organic nutrient metabolism on feeding
the transition dairy cow. J. Dairy Sci. 73; 2820-2833.
Han, J.M., Patterson, S.J., Speck, M., Ehses, J.A., and Levings, M.K. (2014). Insulin
inhibits IL-10-mediated regulatory T cell function: Implications for obesity. J.
Immunology. 192(2), 623-629.
Heinrichs, A.J. and Ishler, V.A. (1989). Body-condition scoring as a tool for dairy
herd management. (Extension Circular 363). The Pennsylvania State
University College of Agricultural Sciences. 17 Mar 2014.
http://pubs.cas.psu.edu/FreePubs/pdfs/ec363.pdf
70
Ingvartsen, K.L. & Anderson, J.B. (2000). Integration of metabolism and intake
regulation: a review focusing on periparturient animals. J. Dairy Sci. 83, 1573-
1597.
Ingvartsen, K.L. (2006). Feeding- and management-related diseases in the transition
cow: Physiological adaptations around calving and strategies to reduce
feeding-related diseases. Feed and Animal Health. 126(3-4), 175-213.
Jager, J., Gremeaux, T., Gonzalez, T., Bonnafous, S., Debard, C., Laville, M., Vidal.,
H., Tran, A., Gual, P. Le Marchand-Brustel, Y., Cormont, M. and Tanti, J.F.
(2010). Tpl2 Kinase Is Upregulated in Adipose Tissue in Obesity and May
Mediate Interleukin-1β and Tumor Necrosis Factor-α Effects on Extracellular
Signal–Regulated Kinase Activation and Lipolysis. Diabetes. 59; 61-70.
Jo, J., Gavrilova, O., Pack, S., Jou, W., Mullen, S., Summer, A.E., Cushman, S.W. &
Periwal, V. (2009). Hypertrophy and/or hyperplasia: dynamics of adipose
tissue growth. PLoS Computational Biology. 5(3), 1-11.
Jorritsma, R. et al. (2000). Relationships between fatty liver and fertility and some
periparturient diseases in commercial Dutch dairy herds. Theriogenology. 54,
1065-1074.
Jorritsma, R. et al. (2001). Prevalence and indicators of post partum fatty infiltration of
the liver in nine commercial dairy herds in the Netherlands. Livestock
Production Science. 68, 53-60.
Khan et al. (2013). Change in subcutaneous adipose tissue metabolism and gene
network expression during the transition period in dairy cows, including
differences due to sire genetic merit. J. Dairy Sci. 96, 2171-2182.
Koltes, D.A. and Spurlock, D.M. (2011). Coordination of lipid droplet-associated
proteins during the transition period of Holstein dairy cows. J. Dairy Sci. 94,
1839-1848.
Lumeng, C.N., Bodzin, J.L., and Saltiel, A.R. (2007). Obesity induces a phenotypic
switch in adipose tissue macrophage polarization. J Clin Invest. 117(1), 175-
184.
LeBlanc, S.J. 2014. Reproductive tract inflammatory disease in post partum dairy
cows. Animal 8: S154-63.
MacHugh, N.D. et al. (1998). Characterisation of a monoclonal antibody recognising
the CD3ε chain of the bovine T cell receptor complex. Veterinary Immunology
and Immunopathology. 61(1), 25-35.
71
Marti, A., Martinez-Gonzalez, M.A., and Martinez, J.A. (2008). Interaction between
genes and lifestyle factors on obesity. The Proceedings of the Nutrition
Society. 67(1), 1-8.
Mulligan, F.J., O’Grady, L., Rice, D.A., and Doherty, M.L. (2006). A herd health
approach to dairy cow nutrition and production diseases of the transition cow.
Animal Reproduction Science. 96(1-2), 331-353.
Roche et al. (2009). Invited review: Body condition score and its association with
dairy cow productivity, health, and welfare. J. Dairy Sci. 92(12), 5769-5801.
Rosenbaum, M. and Leibel, R.L. (1999). The role of leptin in human physiology. N.
Engl J. Med. 341, 913-915.
Shaul, M.E., Bennett, G., Strissel, K.J., Greenberg, A.S. and Obin, M.S. (2010).
Dynamic, M2-like remodeling phenotypes of CD11c+ adipose tissue
macrophages during high-fat diet-induced obesity in mice. Diabetes. 59, 1171-
1181.
Suganami, T., Tanaka, M., and Ogawa, Y. (2012). Adipose tissue inflammation and
ectopic lipid accumulation. Endocrine Journal. 59(10), 849-857.
Sumner-Thomson, J.M., Vierck, J.L., and McNamara, J.P. (2011). Differential
expression of genes in adipose tissue of first-lactation dairy cattle. J. Dairy Sci.
94(1), 361-369.
Technical bulletin: An introduction to compensation for multicolor assays on digital
flow cytometers. (2009). BD Biosciences. Retrieved on April 22, 2014 from
http://www.bdbiosciences.com/documents/Compensation_Multicolor_TechBul
letin.pdf
Vandanmagsar, B. et al. (2011). The NLRP3 inflammasome instigates obesity-induced
inflammation and insulin resistance. Nature Medicine. 17, 179-188.
Vallerie, S.N., Furuhashi, M., Fucho, R. and Hotamisligil, G.S. (2008). A predominant
role for parenchymal c-Jun amino terminal kinase (JNK) in the regulation of
systemic insulin sensitivity. PLoS One. 3(9) e3151.
doi:10.1371/journal.pone.0003151
Waters, W.R. et al. (2009). Signal regulatory protein α (SIRPα) cells in adaptive
response to ESAT-6/CFP-10 protein of tuberculosis mycobacteria. PLoS One.
4(7), e6414.

72
Wescott, D.J., DelProposto, J.B., Geletka, L.M., Wang, T., Singer, K., Saltiel, A.R.,
and Lumeng, C.N. (2009). MGL1 promotes adipose tissue inflammation and
insulin resistance by regulating 7/4hi monocytes in obesity. J. Exp. Med.
206(13), 3143-3156.
Willard-Mack, C.L. (2006). Normal structure, function, and histology of lymph nodes.
Toxicol Pathol. 34(5), 409-424.
Weisberg et al. (2003). Obesity is associated with macrophage infiltration in adipose
tissue. J. Clin. Invest. 112, 1796-1808.
Weisberg et al. (2006). CCR2 modulates inflammatory and metabolic effects of high-
fat feeding. J. Clin. Invest. 116, 115-124.
Yamauchi, T. et al. (2001). The fat-derived hormone adiponectin reverses insulin
resistance associated with both lipoatrophy and obesity. Nature Medicine. 7,
941-946.
Yang, H. et al. (2010). Obesity increases the production of proinflammatory mediators
from adipose tissue T cells and compromises TCR repertoire diversity:
Implications for systemic inflammation and insulin resistance. J. Immunol.
185, 1836-1845.
Zachut, M., et al. (2012). Periparturient dairy cows do not exhibit hepatic insulin
resistance, yet adipose-specific insulin resistance occurs in cows prone to high
weight loss.
Zhang, X., Xu, A., Chung, S.K., Cresser, J.H.B., Sweeney, G., Wong, R.L.C., Lin, A.,
and Lam, K.S.L. (2011). Selective inactivation of c-Jun NH2-Terminal Kinase
in Adipose Tissue Protects Against Diet-Induced Obesity and Improves Insulin
Sensitivity in Both Liver and Skeletal Muscle in Mice. Diabetes. 60(2); 486-
495.
Zhao, J., and Lawless, M.W. (2013). Stop feeding cancer: pro-inflammatory role of
visceral adiposity in liver cancer. Cytokine.
http://dx.doi.org/10.1016/j.cyto.2013.09.009