Embed Size (px)
Citation preview

Copyright 2001 by William F. Pratt. Published by Society for the Advancement of Material and Process Engineering with permission.
1
CHARACTERIZATION & FINITE ELEMENT MODEL CORRELATION OF WAVY COMPOSITES
Dr. William F. Pratt [email protected]
Matthew S. Allen
Patterned Fiber Composites, Inc. 923 West 500 North Lindon, UT 84042
(801) 785-6520
ABSTRACT
Wavy composite is a new form of constrained layer damping that uses continuous fiber composite with fibers laid in sinusoidal waveforms and viscoelastic materials to provide both high damping and stiffness.
A finite element code was developed by Patterned Fiber Composites Inc. that predicts material stiffness and damping of carbon-fiber composite lay-ups with sinusoidally varying properties. The objective of this research was to test the performance of the finite element code. Finite element analyses are performed at a number of frequencies to create a material nomogram where performance as a function of frequency and temperature is displayed. These FEA predictions are compared to test results and show that the finite element code accurately models changes in wave period, wave angle and layer thickness with less than 5% error in stiffness and damping. Key design principles are revealed through these comparisons. Correlations show material damping 50 times higher than conventional composites with equivalent stiffness. Comparisons of FEA predictions to test data for more complex lay-ups also show excellent agreement. KEY WORDS: Advanced Composites, Carbon Fiber, Composite Materials, Constrained Layer Damping, Finite Element Analysis, Passive Vibration Control, Testing/Evaluation, Vibration Damping, Viscoelasticity
1. INTRODUCTION
The purpose of this paper is to characterize highly damped wavy composite materials through comparisons with Finite Element models. To do this, the stiffness and damping test results for

Copyright 2001 by William F. Pratt. Published by Society for the Advancement of Material and Process Engineering with permission.
2
various tubes (generated by Patterned Fiber Composites Inc., and discussed in an accompanying article) will be compared to the FEA predicted master curves. First, all pertinent material constants had to be determined. Some of the material constants for the composite were obtained by testing a number of unidirectional tubes to determine the in-plane material constants Other constants were estimated and determined by using a rule-of-mixtures analysis. The viscoelastic properties were determined from data sent by the viscoelastic manufacturer (Avery-Dennison) and through independent in-house testing. This evaluation focuses on testing the ability of the FEA code to predict axial material properties of simple wavy composite—viscoelastic—wavy composite lay-ups. The variables tested and correlated to the FEA predictions were wavy composite wavelength, maximum angle, and composite and viscoelastic thickness.
Since the viscoelastic properties, and hence the composite properties, are frequency dependent, to adequately test the FEA code it was necessary to compare test data to FEA predictions at a number of frequencies. Typically, thirteen predictions were performed at uniformly logarithmically spaced frequencies between 1 Hz and 10,000 Hz.
The analysis shows that the FEA model is typically accurate to within 5% when predicting stiffness and within 2% or better when predicting damping. The FEA model retained high correlation even when wavelength, max angle, and layer thickness were varied.
2. MATERIAL PROPERTIES
In order to obtain accurate correlations, the properties of the composite and the viscoelastic had to be determined. The FEA code requires the following properties for the composite: E11, E22, G12, G23, ν12 ,ν23 ,D11 ,D22 ,D12 , and D23. Where E, G, ν, and D represent the Young’s modulus, shear modulus, Poisson’s ratio, and loss factor respectively. The subscripts indicate the directions with the 11-direction indicating the longitudinal or strong fiber direction. Many of these properties could be determined by testing sample tubes on the axial test stand used to test the damped specimens (Pratt, et al. 2001, Pratt, et al. 2001, Pratt and Allen 2001). A number of unidirectional tubes were made with the fibers laid in the 08 direction (along the length of the tube) and others with fibers laid in the 908 direction (around the tube) to determine E11, E22, D11 and D22. Table 1 shows that there was little variation in the measured properties.
Table 1: Test Results for Unidirectional Tubes Layup Tested for: Modulus
(Gpa) Modulus
(Msi) Damping
8 layers 08 E11, D11 132 19.14 0.25% 15 layers 08 E11, D11 135 19.58 0.25% 9 layers 908 E22, D22 10.4 1.51 1.00%
14 layers 908 E22, D22 9.8 1.42 0.80%
Values for the other constants were chosen by experience using a rule of mixtures analysis, since no reliable method for testing these properties directly was available at the time of this testing. The properties of the carbon fibers and the resin matrix were known, so the rule of mixture analysis was modified until it resulted in the measured values for E11 and E22. The resulting rule of mixtures solution for G12, G23, ν12, ν23 was then assumed to be correct. Experience dictates that a typical ±458 tube has between 1-2% damping, so an average value was taken as the D12 and D23 damping (Pratt 1999).

Copyright 2001 by William F. Pratt. Published by Society for the Advancement of Material and Process Engineering with permission.
3
Table 2: Values used in analysis and correlation Property Value
G12 5.2 GPa (0.75 Msi) G23 5.0 GPa (0.72 Msi) ν12 0.312 ν23 0.463 D12 1.5% D23 1.5%
The FEA code is highly sensitive to the properties of the viscoelastic. Avery-Dennison FT-1190 series viscoelastics were used exclusively in these tests and Avery-Dennison supplied curve fit equations for the stiffness and loss factor of the viscoelastic. Before this data was available, in house testing was performed on samples of viscoelastic to determine it’s damping and shear modulus (Pratt, et al. 2001).
Figure 1: VEM Test Data vs. Avery-Dennison and WLF Curve Fits
Figure 1 shows the results of the in-house testing of the viscoelastic properties and the curve fits supplied by Avery-Dennison. Also shown are curve fits for another set of curve fit equations referred to as WLF curve fits since their original users used the WLF equation extensively. It is readily apparent that the damping test data doesn’t agree strongly with Avery-Dennison’s curve
Damping
Modulus

Copyright 2001 by William F. Pratt. Published by Society for the Advancement of Material and Process Engineering with permission.
4
fit. Also, our damping test data does not show an elbow in the damping curve as seen in the Avery-Dennison curve fit equation (Pratt, et al. 2001).
When used in the FEA program, the Avery-Dennison curve fit equation gave reasonable overall quantitative correlation with the test data, though the FEA code would predict a damping peak that was too high. Furthermore, when the Avery-Dennison curve fit was used, FEA code predicted an elbow in the damping curve which was never observed in the test data.
Avery-Dennison’s equations were fit to very nosy damping data. If the high peak and elbow are taken to be anomalies of their testing, then it seems reasonable that the actual damping performance is much closer to our test data shown above. The damping test results are independent of sample thickness, and thus relatively insensitive to error in the input parameters. Unfortunately, we are less confident in our ablilty to determine the modulus of the viscoelastic, because it depends on the thickness of the viscoelastic sample, which is hard to measure accurately using our test setup. Thus a compromise was struck between the two. The WLF viscoelastic curve fit equation for the modulus was fit to Avery-Dennison’s modulus data, though the damping curve fit equation was modified to reflect in-house test results. With these modified WLF curve fit equations used to model the viscoelastic, the FEA code predicted the actual performance of the tubes very precisely. The WLF and Avery-Dennison curve fit equations are shown below. Table 3 shows the constants used in these curve fit equations (Pratt, et al. 2001, Pratt, et al. 2001).
WLF curve fit equation for shear modulus:
slope
ffqrom
mlmrom
mlG
+
+=
1
log*2)(log)(log 1010 Equation 1
WLF curve fit equation for damping:
−
+−−+
−
+
+=
210101010
1010
)(log)(log11)(
)(log)(log)(
2
)(log)(log
cfrolf
shslc
frolfshslc
etafrolη
Equation 2
Avery Dennision curve fit equation for shear modulus:
)(f)*K1b (1
Gmin) -(Gmax -Gmax )(f)*K1a (1
Gmin) - (Gmid - Gmid G nbna ++
+= Equation 3
Avery Dennision curve fit equation for damping:
mbPb
1)-(Pb
maPa
1)-(Pa
)(f)*K3b (1(f)*K2b
)(f)*K3a (1(f)*K2a
++
+=η Equation 4

Copyright 2001 by William F. Pratt. Published by Society for the Advancement of Material and Process Engineering with permission.
5
Table 3: Avery-Dennison and WLF curve fit equation constants AVERY-DENNISON CURVE FIT CONSTANTS
Gmid 3.44E+09 Pa K2a 0.0371 Gmin 1.08E+04 Pa K2b 0.965 Gmax 2.57E+08 Pa K3a 0.000038 K1a 0.00002 K3b 0.00072 K1b 0.00007 Pa 1.369 na 0.053 Pb 1.34 nb 1.026 ma 0.453
mb 1.72
WLF CURVE FIT CONSTANTS WLF Model Damping Constants
ML 6.00E+04 Pa ETFROL 2.2 MROM 4.00E+06 Pa C 0.5 FQROM 200 SL 0.4 SLOPE 0.5 SH -0.45
FROL 70
3. TEST AND EVALUATION OF WAVY COMPOSITE TUBES
Once an accurate model for the viscoelastic properties had been obtained, the FEA code was tested by comparing master curves created from test data to master curves produced by the FEA code. The FEA predictons were performed using a shell model of a 0.875-in diameter tube with twenty-four elements. (Six elements around the circumference and four elements along the length). The model was scaled in the lengthwise direction to include a complete half wavelength for each material analyzed. Tubes were used because the analysis determines material properties directly without consideration of edge effects (Pratt, et al. 2001, Pratt, et al. 2001). Each analysis took between 45-90 seconds on a Pentium 450 MHz machine, for a total of about 15 minutes to create the entire master curve (ie. analysis at 13 frequencies). The finite element code outputs complex displacements, from which the damping was calculated from the ratio of the imaginary part of the displacement over the real part of the displacement. The smeared axial modulus was found by dividing the stress (1000 psi for these analyses) by the strain. Thus the smeared stiffness is the stiffness of an equivalent homogeneous material.
The test data was taken to reflect the smeared stiffness of carbon fiber layers only. This was convenient because, the FEA code welds the viscoelastic layers together at the end, effectively applying pressure only on the carbon fiber layers. This replicates the actual fabrication practices were tubes are always made with welds on the ends to encapsulate the viscoelastic. Stiffness that reflects the smeared stiffness of the carbon fiber layers only will be called “Carbon Only” stiffness. To convert from carbon only stiffness to a stiffness that accounts for the entire tube cross section including viscoelastic layers, simply multiply the carbon only stiffness by the ratio of the area of the carbon fiber layers over the entire area of the tube, (including viscoelastic layers).
A wave with a 7.5 cm (3.0 in.) wavelength, 0.38 mm (0.015 in.) thick composite layers and 0.28 mm (0.011 in.) thick viscoelastic was taken as a baseline. This layup is called a +3/11m/-3 for brevity where “+3” represents three plies (0.127 mm (0.005 in.) each) of wavy composite with

Copyright 2001 by William F. Pratt. Published by Society for the Advancement of Material and Process Engineering with permission.
6
the wave starting in the positive direction and “-3” represents three plies of wavy composite with the wave starting in the negative direction, or 1808 out of phase with the positive layers. “11m” represents the thickness of the viscoelastic layer in thousandths of an inch.
Figure 2: Basic Tube Design
A fairly simple experiment was designed to test the effect of varying the wavelength, max angle, composite thickness, and VEM thickness in a minimum number of tubes. This allowed evaluation of the performance of the FEA code for all of the basic design parameters. All of the tubes consisted of a viscoelastic layer sandwiched between two composite layers with opposing wave patterns, as seen in Figure 2. All of these tubes were constructed using Avery-Dennison FT1190 series viscoelastics. A number of 5.0 cm (2.0 in.), 10 cm (4.0 in.) and 12.5 cm (5.0 in.) (wavelength) tubes were also constructed. The results for these tubes will not be discussed here, though agreement was exceptional for these tubes as well (Pratt, et al. 2001).
Table 4: Properties Varied and Levels Property Levels Tested
Wavelength 3.8 cm, 7.5 cm, 15 cm. (1.5, 3.0, 6.0 in.) Max Angle 228 , 308
Composite Thickness 0.38 mm, 0.76 mm (0.015, 0.030 in.) VEM Thickness 0.15 mm, 0.28 mm, 0.56 mm (0.006, 0.011, 0.022 in.)
Table 4 shows the properties and values used to build sample tubes in a design of experiments conducted to evaluate and correlate test results to the FEA program. Table 5 shows the properties of the various tubes and the specific factors used in each tube. Thickness in either table refers to the individual layer thickness and not to the overall thickness of total composite used in the construction of the tube. The thickness of the pre-preg used in their construction was approximately .12 mm (.005 inches), thus a .38 mm thick layer of composite was fabricated by using a single sheet of pre-preg that resulted in a three ply thickness. The construction of the tube consisted of two constraining layers of wavy composite of the thickness shown, and a single viscoelastic damping layer (Figure 2).
Table 5: Tubes Properties and Names

Copyright 2001 by William F. Pratt. Published by Society for the Advancement of Material and Process Engineering with permission.
7
Max Angle Wavelength VEM Thickness Composite Thickness
Tube Names
308 3.8 cm (1.5 in.) 0.28 mm (0.011 in.) 0.38 mm (0.015 in.) TR6, TR8 308 7.5 cm (3.0 in.) 0.28 mm (0.011 in.) 0.38 mm (0.015 in.) TR1, TR16 308 15 cm (6.0 in.) 0.28 mm (0.011 in.) 0.38 mm (0.015 in.) TR2,TR3 308 3.8 cm (1.5 in.) 0.15 mm (0.006 in.) 0.38 mm (0.015 in.) TR28, TR29 308 3.8 cm (1.5 in.) 0.56 mm (0.022 in.) 0.38 mm (0.015 in.) TR13, TR27 308 3.8 cm (1.5 in.) 0.28 mm (0.011 in.) 0.76 mm (0.030 in.) TR14, TR30 228 3.8 cm (1.5 in.) 0.28 mm (0.011 in.) 0.38 mm (0.015 in.) TR10, TR19 228 7.5 cm (3.0 in.) 0.28 mm (0.011 in.) 0.38 mm (0.015 in.) TR12, TR15
The FEA code predicted the damping performance of the tubes very accurately. The model predictions for the 3.8, 7.6 and 15.2 cm 308 tubes with 0.38 mm (0.015 in.) and 0.28 mm (0.011 in.) composite and VEM layers follow. In the figures the FEA predictions are shown by astrices connected by a dotted line. The actual test data appears as a solid thin line. Note that in all of these figures, Avery-Dennison’s shift constant (q = 5555.56) was used for the viscoelastic.
Figure 3: FEA prediction vs. test results for 3.75 cm (1.5 in.) 308 tubes
The FEA program can also perform tests at a single frequency, at a number of temperatures, thus replicating the procedures used in testing. Thus test data and FEA data will always agree no

Copyright 2001 by William F. Pratt. Published by Society for the Advancement of Material and Process Engineering with permission.
8
matter what shift constant is used, so long as the same shift constant is used for the test data and the viscoelastic (Pratt, et al. 2001).
Figure 3 shows the stiffness and damping master curve for two +3/11m/-3 tubes made with 3.8 cm (1.5 in.) 308 wavy layers, overlaid on the FEA prediction. The stiffness asymptotes are 40 and 80 GPa. The damping prediction shows no noticeable error, though there is 5-10% difference in the stiffness data for the two tubes. Peak damping is 23% at about 230 Hz and 25 8C.
Figure 4: FEA prediction vs. test data for 7.5 cm (3.0 in.) 308 tubes.
Figure 4 shows the test data vs. the FEA prediction for two +3/11m/-3 tubes with 7.6 cm (3.0 in.) 308 wavy layers. The stiffness asymptotes are about 38 and 78GPa. The damping prediction shows no noticeable error, though the test data seems to diverge at very low frequencies for one sample but not for the other. There is a difference of approximately 10% in stiffness between the two samples. Peak damping was 24% at 75 Hz referenced to 258 Celsius.
Figure 5 shows the results for two +3/11m/-3 tubes with 15.2 cm (6.0 in.) 308 wavy layers. The stiffness asymptotes are 42 and 82 GPa. The FEA code has over predicted the peak damping slightly, though the error is less than 10%. This 15.2 cm (6.0 in.) 308 tube shows peak damping of 20% at about 21 Hz at 258C. This material would be well suited to high temperature or low frequency applications.

Copyright 2001 by William F. Pratt. Published by Society for the Advancement of Material and Process Engineering with permission.
9
Figure 5: FEA prediction vs. test data for 15 cm (6.0 in.) 308 tubes.
In Figure 5 the actual performance deviates from the model prediction at very high frequencies (low temperatures). In the viscoelastic model the damping is approximated as a simple hump where the damping drops off logarithmically as the frequency increases or decreases from the peak damping frequency. The test performance shows that at very low temperatures the damping may begin to fall off more slowly, asymptotically approaching some minimum value.
Note that for all of the 308 waveforms the lower and upper assymptotes on stiffness are approximately 40 and 80 GPa respectively. Thus the wavelength has no significant effect on the stiffness assymptotes though it did affect the frequency at which the stiffness of the composite began to increase. It is interesting that these 308 tubes are significantly stiffer than conventional ±308 unidirectional composite. ±308 tubes tested had stiffness ranging between 35-45 GPa. At very low frequency the wavy composite tubes will have about this stiffness, but at higher frequencies they are twice as stiff.
The magnitude of the damping peak didn’t change significantly either, though increasing the wavelength did decrease the frequency at which the damping peak occurred. This is the first principle of design with wavy composites (Pratt, et al. 2001). Finally, notice that the 7.6 cm (3.0 in.) tube had the highest damping peak (24% at 70-80Hz), this is because the peak damping for the viscoelastic material and the 7.6 cm tube both occur at 70 Hz (see Figure 1).

Copyright 2001 by William F. Pratt. Published by Society for the Advancement of Material and Process Engineering with permission.
10
There was as much as a 10% difference in the stiffness between like tubes. The average wall thickness of these tubes was about 1.0 mm (0.040 in.) The tube diameter was measured using digital calipers at eight different places along the length of the tube while still on the mandrels so that the nominal inside diameter was 22.225 mm (0.8750 in.) The calipers read to a precision of ± 0.01 mm (0.0005 in.), though in practice they are only accurate to about ± 0.025 mm (0.001 in.) because of differences in pressure from one measurement to the next. Even though all the tubes were made with the same thickness and width of material, the standard deviation of the wall thickness was 0.036 mm (0.0014 in.), thus statistical analysis would expect a 5-10% error with a 95% confidence level which is consistent with observed testing. The results for the thicker walled tubes with less scatter in the test data (2-5%) showed that the FEA code retained high accuracy (Pratt, et al. 2001).
Figure 6: FEA prediction vs. test data for 5.0 cm (2.0 in.) 228 tubes.
Figure 2 through Figure 5 validate that the code adequately models changes in wavelength with constant layer thickness. Agreement was also excellent for the 5.0 cm (2.0 in.), 10.0 cm (4.0 in.) and (12.5 cm (5.0 in.) tubes (Pratt, et al. 2001).

Copyright 2001 by William F. Pratt. Published by Society for the Advancement of Material and Process Engineering with permission.
11
Figure 6 shows the stiffness and damping results for two +3/11m/-3 tubes made with 5.0 cm (2.0 in.) 228 wavy material. The damping prediction is highly accurate, while once again there is some difference in stiffness between the two tubes. This material has a damping peak of 20% at about 130 Hz. Note that by decreasing the max angle the stiffness asymptotes increase from 40 and 80 GPa for the 308 angle to 55 and 100 GPa for the 228 angle tubes. The stiffness has increased by 25-40%, though the damping is still exceptional. (The 5.0 cm (2.0 in.) 308 tubes tested had 24% peak damping, thus the damping has decreased by 20%, though it is still exceptional). These results conclude that the FEA code accurately models changes in max angle.
Another important design parameter is the layer thickness. A number of 3.75 cm (1.5 in.) 308 tubes were constructed using various layer thickness combinations. The following figures show the result when the layer thickness is varied.
Figure 7: FEA prediction vs. test data for double-thick composite tubes.
Figure 7 shows the results when the thickness of the composite layers is increased. Two 3.75 cm (1.5 in.) 308 tubes were tested with 0.76 mm (0.030 in.) thick face sheets and the same 0.28 mm (0.011 in.) viscoelastic thickness used in the tubes seen previously. Peak damping is about 17% at 450 Hz. The lower stiffness asymptote is unchanged. The test data does not show the upper asymptote, though it appears that it will be 70-80 GPa. There is no noticeable error in the stiffness prediction, though the damping prediction is off by a few percent at low frequencies. Doubling the composite layer thickness has almost doubled the frequency at which the damping peak occurs and the magnitude of the damping peak has decreased from 23 % to 17%.
Note that for this double thick tube there was very little difference in the stiffness results between tubes and that the FEA code predicts the stiffness very accurately. For this tube the measurement

Copyright 2001 by William F. Pratt. Published by Society for the Advancement of Material and Process Engineering with permission.
12
error using calipers to determine wall thickness is approximately 2-5%, which is consistent with the results shown in Figure 7. This suggests that the FEA code may actually be more accurate than indicated by test data when predicting stiffness.
Figure 8 and Figure 9 show the performance of the FEA code when the viscoelastic layer thickness is doubled, while the composite layer thickness is held constant at 0.38 mm (0.015 inches).
Figure 8: FEA prediction vs. test data with 0.56 mm (0.022 in.) thick viscoelastic layer.
Figure 8 shows the results for two +3/22m/-3 tubes constructed with 3.8 cm (1.5 in.) 308 wavy composite. Once again the stiffness asymptotes are 40 and 80 GPa. The magnitude of the damping peak has decreased from 24% to 20%. The frequency of the damping peak has increased from 230 Hz to 450 Hz. It is interesting to note that increasing the thickness of the viscoelastic layer has the same effect as increasing the thickness of the composite layer and confirms the 4th design principle which states that a change in thickness of either composite or viscoelastic is equivalent (Pratt, et al. 2001, Pratt, et al. 2001). Both Figure 7 and Figure 8 show that the FEA model performs very well when the thickness of the composite or the viscoelastic is doubled primarily because there is less opportunity for measurement error in the test samples.
Copyright 2001 by William F. Pratt. Published by Society for the Advancement of Material and Process Engineering with permission.
13
Figure 9: FEA prediction vs. test data for 0.15 mm (0.006 in.) thick viscoelastic layer.
Tubes were also constructed with a viscoelastic layer that was approximately half as thick (0.15 mm or 0.006 in.). Figure 9 shows the FEA prediction overlaid on the test data for these tubes. The FEA code predicts slightly higher than observed damping for the +3/6m/-3, 3.75 cm (1.5 in.) 308 tube with a damping peak of 21% at 230 Hz, while the FEA model predicts 23% damping at 130 Hz. The stiffness prediction is still accurate to within 10% with stiffness asymptotes of 40 and 80 GPa though the FEA model predicts the transition at a lower frequency. There are a number of possible explanations for these minor discrepancies.
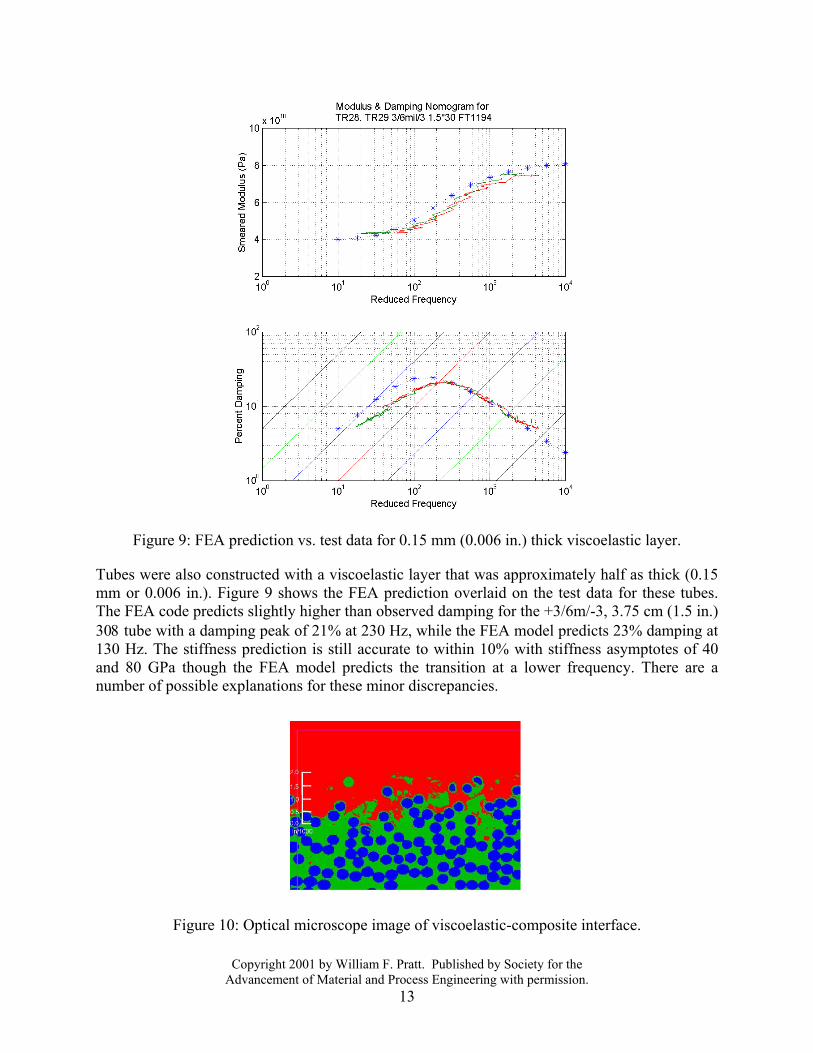
Figure 10: Optical microscope image of viscoelastic-composite interface.

Copyright 2001 by William F. Pratt. Published by Society for the Advancement of Material and Process Engineering with permission.
14
First, the interface between the viscoelastic and the composite is somewhat rough, with the composite mixing as much as 0.05 mm (0.002 in.) on each side with the viscoelastic. For reference, the diameter of the individual carbon-fiber strands is about 7 micron (0.0003 in.) In Figure 10 we see that the interface between the composite and the viscoelastic occupies about 4-5 diameters or about 28-35 micron (0.0011 in. - 0.0014 in.) The discrepancies seen in Figure 9 are probably due in part to increased stiffness in the viscoelastic layer due to this rough interface. In the other tubes, the interface thickness represents a smaller percentage of the total viscoelastic thickness, and the effect of the interface is diminished.
Second, a 0.15 mm (0.006 in.) viscoelastic was not available when these tubes were built, so they were constructed with three layers of 0.05 mm (0.002 in.) material. The 0.05 mm thick material was very difficult to work with, resulting in wrinkling and bubbling of the viscoelastic. This also contributes to the deviation from ideal performance. The FEA code has predicted the performance of tubes with 0.20 mm (0.008 in.) viscoelastic very accurately (Pratt, et al. 2001).
Figure 6 through Figure 8 show that the FEA model accurately predicts changes in the thickness of the composite or viscoelastic layers, as long as the viscoelastic is sufficiently thick.
Figure 11: Stiffness and Damping results for +3/+80/11m/-80/-3 tubes.
A number tubes have been built and tested using more complicated lay-ups. As an example, a tube similar to those described previously was constructed where an extra layer of unidirectional material was added to the laminate of each face sheet on either side of the viscoelastic with an

Copyright 2001 by William F. Pratt. Published by Society for the Advancement of Material and Process Engineering with permission.
15
angle (relative to the longitudinal axis of the tube) of about 808. We call this a +3/+80/11m/-80/-3 where the “+80” and “-80” represent the single extra unidirectional layer.
Figure 11 shows the results for three such tubes (D2a, D2c, D2d) made with 3.75 cm (1.5 in.) 268 composite. The addition of two 808 unidirectional layers has decreased the damping by only a few percent, and the FEA model prediction is within about 5% on both stiffness and damping.
4. SUMMARY
This chapter has shown that the finite element code developed by Patterned Fiber Composites, Inc. accurately models changes in waveform, max angle, and layer thickness. Though the test data shows some difference between identical tubes, the FEA code has been shown to be accurate with less than 5% error in predicting stiffness in tubes tested in the axial mode. The damping results are even more reliable, typically accurate to within 2%, except when the viscoelastic thickness is less than 0.20 mm (0.008 in.)
5. REFERENCES
W. F. Pratt, S. Sommerfeldt and M. Allen, Science of Advanced Materials and Process Engineering Series, 45, Book 1, 216-228 (2001).
W. F. Pratt, M. S. Allen and T. J. Skousen, "Highly Damped Lightweight Wavy Composites," AFRL-VS-TR-2001-tbd, Phillips Air Force Research Laboratory, Kirkland AFB, NM, (2001).
W. F. Pratt and M. S. Allen, "Testing and Characterization of Highly Damped Structural Materials," 33rd International SAMPE Technical Conference, Seattle, WA, (2001).
W. F. Pratt, Patterned Fiber Composites, Process, Characterization, and Damping Performance, Doctoral Dissertation, Brigham Young University, Provo, Utah, (1999).
W. F. Pratt, M. Allen and C. G. Jensen, Science of Advanced Materials and Process Engineering Series, 45, Book 1, 203-215 (2001).