Embed Size (px)
Citation preview

U.S. DEPARTMENT OF EDUCATIONNCES 2009-320
Characteristics of Public School Districts in the United States:Results From the 2007–08 Schools and Staffi ng Survey
First Look


NCES 2009-320U.S. DEPARTMENT OF EDUCATION
Characteristics of Public School Districts in the United States:Results From the 2007–08 Schools and Staffing Survey
First Look
JUNE 2009
Paola AritomiEducation Statistics Services InstituteAmerican Institutes for Research
Jared CoopersmithEducation Statistics Services InstituteQuality Information Partners
Kerry GruberProject OfficerNational Center for Education Statistics
U.S. Department of Education Arne Duncan Secretary
Institute of Education Sciences John Q. Easton Director
National Center for Education Statistics Stuart Kerachsky Acting Commissioner
The National Center for Education Statistics (NCES) is the primary federal entity for collecting, analyzing, and reporting data related to education in the United States and other nations. It fulfills a congressional mandate to collect, collate, analyze, and report full and complete statistics on the condition of education in the United States; conduct and publish reports and specialized analyses of the meaning and significance of such statistics; assist state and local education agencies in improving their statistical systems; and review and report on education activities in foreign countries.
NCES activities are designed to address high-priority education data needs; provide consistent, reliable, complete, and accurate indicators of education status and trends; and report timely, useful, and high-quality data to the U.S. Department of Education, the Congress, the states, other education policymakers, practitioners, data users, and the general public. Unless specifically noted, all information contained herein is in the public domain.
We strive to make our products available in a variety of formats and in language that is appropriate to a variety of audiences. You, as our customer, are the best judge of our success in communicating information effectively. If you have any comments or suggestions about this or any other NCES product or report, we would like to hear from you. Please direct your comments to
National Center for Education Statistics Institute of Education Sciences U.S. Department of Education 1990 K Street NW Washington, DC 20006-5651
June 2009
The NCES World Wide Web Home Page address is http://nces.ed.gov. The NCES World Wide Web Electronic Catalog address is http://nces.ed.gov/pubsearch.
This publication is only available online. To download, view, and print the report as a PDF file, go to the NCES World Wide Web Electronic Catalog address shown above.
Suggested Citation Aritomi, P., and Coopersmith, J. (2009). Characteristics of Public School Districts in the United States: Results From the 2007-08 Schools and Staffing Survey (NCES 2009-320). National Center for Education Statistics, Institute of Education Sciences, U.S. Department of Education. Washington, DC.
Content Contact Kerry Gruber (202) 502-7349 [email protected]
Contents
Page
List of Tables ............................................................................................................. iv
Introduction................................................................................................................. 1
Selected Findings ........................................................................................................ 3
References ................................................................................................................... 5
Estimate Tables ........................................................................................................... 6
Appendix A: Standard Error Tables............................................................................ A-1
Appendix B: Methodology and Technical Notes........................................................ B-1
Appendix C: Description of Data Files….…………………………..………..……… C-1
Appendix D: Description of Variables……………………..………..……………… D-1
iii

List of Tables
Table Page
1. Number of public school districts, by selected public school district
characteristics: 2007-08.…………..……………………………............... 7
2. Percentage of public school districts that had salary schedules for teachers and among those that had salary schedules, the average yearly teacher base salary, by various levels of degrees and experience and selected public school district characteristics: 2007-08.…………………. 8
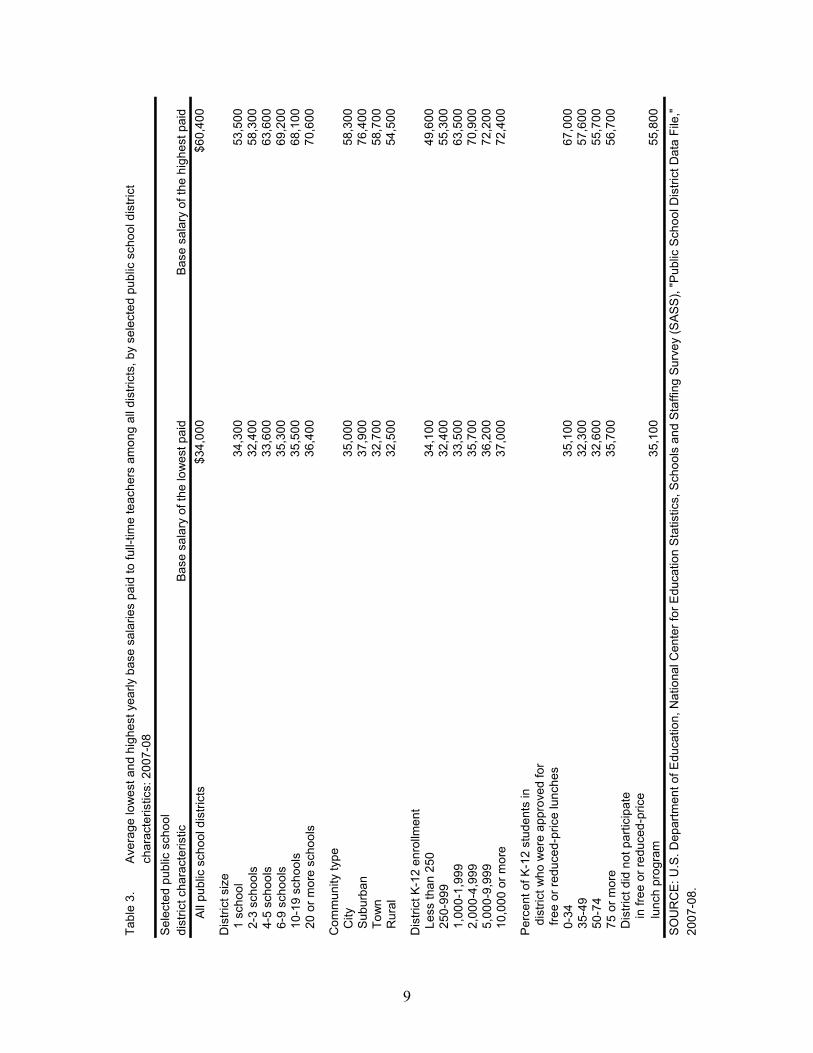
3. Average lowest and highest yearly base salaries paid to full-time
teachers among all districts, by selected public school district characteristics: 2007-08.…………............................................................. 9
4. Percentage of public school districts that offered various benefits to
teachers, by selected public school district characteristics: 2007-08.…..… 10
5. Percentage of public school districts that used pay incentives for various reasons, by selected public school district characteristics: 2007-08.……... 11
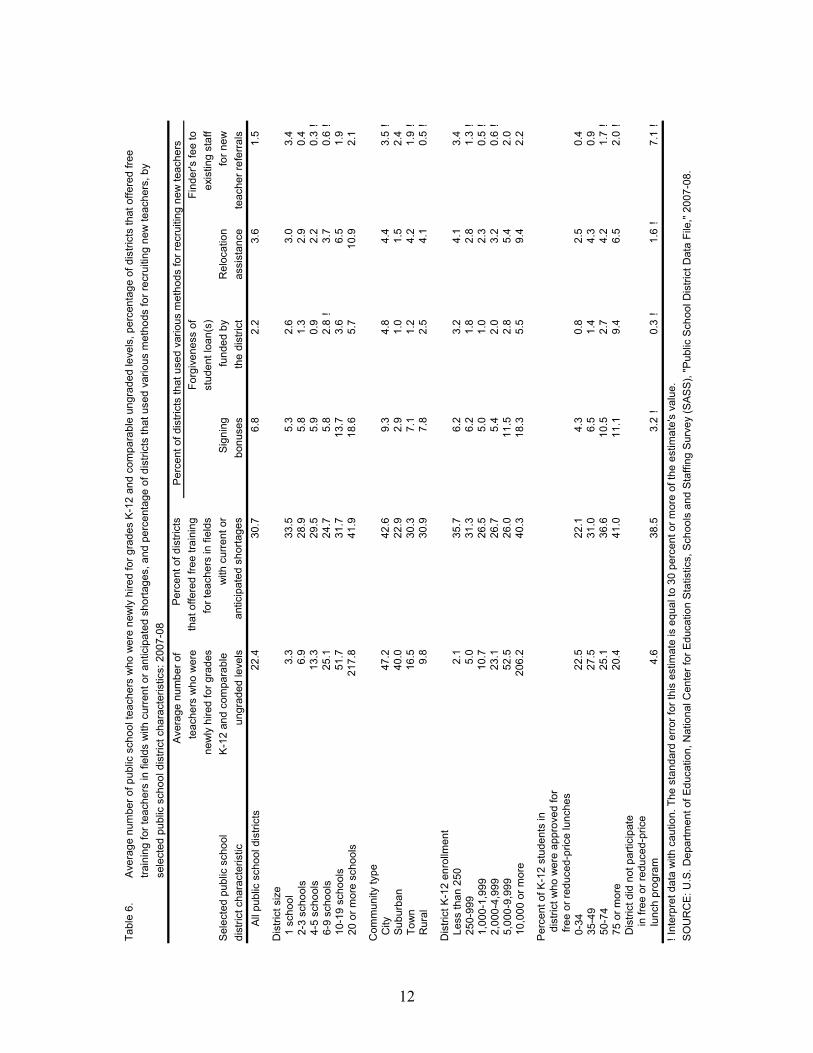
6. Average number of public school teachers who were newly hired for
grades K-12 and comparable ungraded levels, percentage of districts that offered free training for teachers in fields with current or anticipated shortages, and percentage of districts that used various methods for recruiting new teachers, by selected public school district characteristics: 2007-08.……………………………………………................................. 12
7. Percentage distribution of public school districts, by specific agreements
with teachers' associations or unions and selected public school district characteristics: 2007-08.…...……………………………………………... 13
8. Average number of public school teachers and average number of public
school teachers who were dismissed in the previous year or did not have their contracts renewed based on poor performance, by tenure status of teachers and selected public school district characteristics: 2007-08.….... 14
9. Percentage of public school districts that granted high school diplomas,
and among those that granted diplomas, graduation requirements for standard diplomas, by selected public school district characteristics: 2007-08.……………………….……………............................................. 15
iv

Table Page
10. Among districts with more than one school, percentage of public school districts that had salary schedules for principals and average lowest and highest yearly base salaries paid to all full-time principals, by selected public school district characteristics: 2007-08.………………………….. 16
11. Among districts with more than one school, percentage distribution of
public school districts, by specific agreements with principals' associations or unions and selected public school district characteristics: 2007-08.………………………………………………………………….. 17
12. Among districts with more than one school, percentage of principals
who were newly hired, average number of days in the normal contract year for principals, percentage of districts that had a tenure system for principals, and percentage of districts that had a training program for aspiring school administrators, by selected public school district characteristics: 2007-08.…………………………………………………. 18
Appendix A: Standard Error Tables
A-1. Standard errors for Table 1: Number of public school districts, by
selected public school district characteristics: 2007-08.……..…………... A-2
A-2. Standard errors for Table 2: Percentage of public school districts that had salary schedules for teachers and among those that had salary schedules, the average yearly teacher base salary, by various levels of degrees and experience and selected public school district characteristics: 2007-08.…………………………………………………. A-3
A-3. Standard errors for Table 3: Average lowest and highest yearly base
salaries paid to full-time teachers among all districts, by selected public school district characteristics: 2007-08..……………………….……….... A-4
A-4. Standard errors for Table 4: Percentage of public school districts that
offered various benefits to teachers, by selected public school district characteristics: 2007-08.…………………………………………………. A-5
A-5. Standard errors for Table 5: Percentage of public school districts that
used pay incentives for various reasons, by selected public school district characteristics: 2007-08.………………………………………................. A-6
v

Table Page
A-6. Standard errors for Table 6: Average number of public school teachers who were newly hired for grades K-12 and comparable ungraded levels, percentage of districts that offered free training for teachers in fields with current or anticipated shortages, and percentage of districts that used various methods for recruiting new teachers, by selected public school district characteristics: 2007-08.…………………………………. A-7
A-7. Standard errors for Table 7: Percentage distribution of public school
districts, by specific agreements with teachers' associations or unions and selected public school district characteristics: 2007-08..…………… A-8
A-8. Standard errors for Table 8: Average number of public school teachers
and average number of public school teachers who were dismissed in the previous year or did not have their contracts renewed based on poor performance, by tenure status of teachers and selected public school district characteristics: 2007-08.………………………………………… A-9
A-9. Standard errors for Table 9: Percentage of public school districts that
granted high school diplomas, and among those that granted diplomas, graduation requirements for standard diplomas, by selected public school district characteristics: 2007-08.……………………………..….. A-10
A-10. Standard errors for Table 10: Among districts with more than one
school, percentage of public school districts that had salary schedules for principals and average lowest and highest yearly base salaries paid to all full-time principals, by selected public school district characteristics: 2007-08.……………………………………………….. A-11
A-11. Standard errors for Table 11: Among districts with more than one
school, percentage distribution of public school districts, by specific agreements with principals' associations or unions and selected public school district characteristics: 2007-08.…………………………………. A-12
A-12. Standard errors for Table 12: Among districts with more than one
school, percentage of principals who were newly hired, average number of days in the normal contract year for principals, percentage of districts that had a tenure system for principals, and percentage of districts that had a training program for aspiring school administrators, by selected public school district characteristics: 2007-08.………………………….. A-13
vi

Table Page
Appendix B: Methodology and Technical Notes
B-1. Base-weighted unit and overall response rates, by survey: 2007-08……... B-8 B-2. Comparisons between frame distribution and base-weighted and final-
weighted respondent distributions for public school districts with an indication of potential sources of bias: 2007-08.......................................... B-9
B-3. Summary of base-weighted item response rates, by survey: 2007-08.…… B-10
Appendix C: Description of Data Files
C-1. Names of data files and the questionnaires from which the data were
drawn: 2007-08…………………………………………………………… C-2 C-2. The number of cases in the School District data file, by respondent and
source of data: 2007-08……...……………………………………………. C-3
Appendix D: Description of Variables
D-1. Variables used in the Characteristics of Public School Districts in the
United States: Results From the 2007-08 Schools and Staffing Survey report: 2007-08……………………………………………………………. D-2
vii

Introduction
This report presents selected findings from the public school district data file of the 2007-08 Schools and Staffing Survey (SASS). SASS is a nationally representative sample survey of public,1 private, and Bureau of Indian Education-funded (BIE) K-12 schools, principals, and teachers in the 50 states and the District of Columbia. School districts associated with public schools and library media centers in public and BIE schools are also part of SASS. Developed by the National Center for Education Statistics (NCES) of the Institute of Education Sciences within the U.S. Department of Education and conducted by the U.S. Census Bureau, SASS was first conducted in school year 1987-88. Since then, SASS has been conducted five times: in school years 1990-91, 1993-94, 1999-2000, 2003-04, and, most recently, 2007-08.
The purpose of SASS is to collect information that can provide a detailed picture of U.S. elementary and secondary schools and their staff. This information is collected through the following surveys: district, school, principal, teacher, and library media center. Information from all the surveys can be linked. For more information about surveys and data files see appendix C. The SASS questionnaires can be found at http://nces.ed.gov/surveys/sass/question0708.asp.
The 2007-08 SASS sample is a school-based stratified probability-proportionate-to-size (PPS) sample. The 2005-06 Common Core of Data (CCD) served as a starting point for the public school sampling frame, and the 2005-06 Private School Universe Survey (PSS) served as a starting point for the private school sampling frame. The public school sample was designed so that national-, regional-, and state-level elementary, secondary, and combined2 public school estimates can be made. The private school sample was designed so that national-, regional-, and affiliation-level estimates can be produced. BIE schools on the 2005-06 CCD were sampled with certainty, and thus national estimates for BIE schools can be produced. Because SASS is a school-based sample, districts, principals, and library media centers associated with public schools were included, as were principals and library media centers associated with BIE schools and principals associated with private schools. Teachers associated with selected schools were sampled from a teacher list provided by each school. The selected samples include about 9,800 public schools, 180 BIE schools, and 2,940 private schools; 5,250 public school districts; 9,800 public school principals, 180 BIE school principals, and 2,940 private school principals; 47,440 public school teachers, 750 BIE teachers, and 8,180 private school teachers; and 9,800 public school library media centers and 180 BIE school library media centers.
1 Public schools include traditional public and charter schools. 2 A combined school or combined grade school has one or more of grades K-6 and one or more of grades 9-12; for example, schools with grades K-12, 6-12, 6-9, or 1-12 were classified as having combined grades. Schools in which all students are ungraded (i.e., not classified by standard grade levels) are also classified as combined.
1
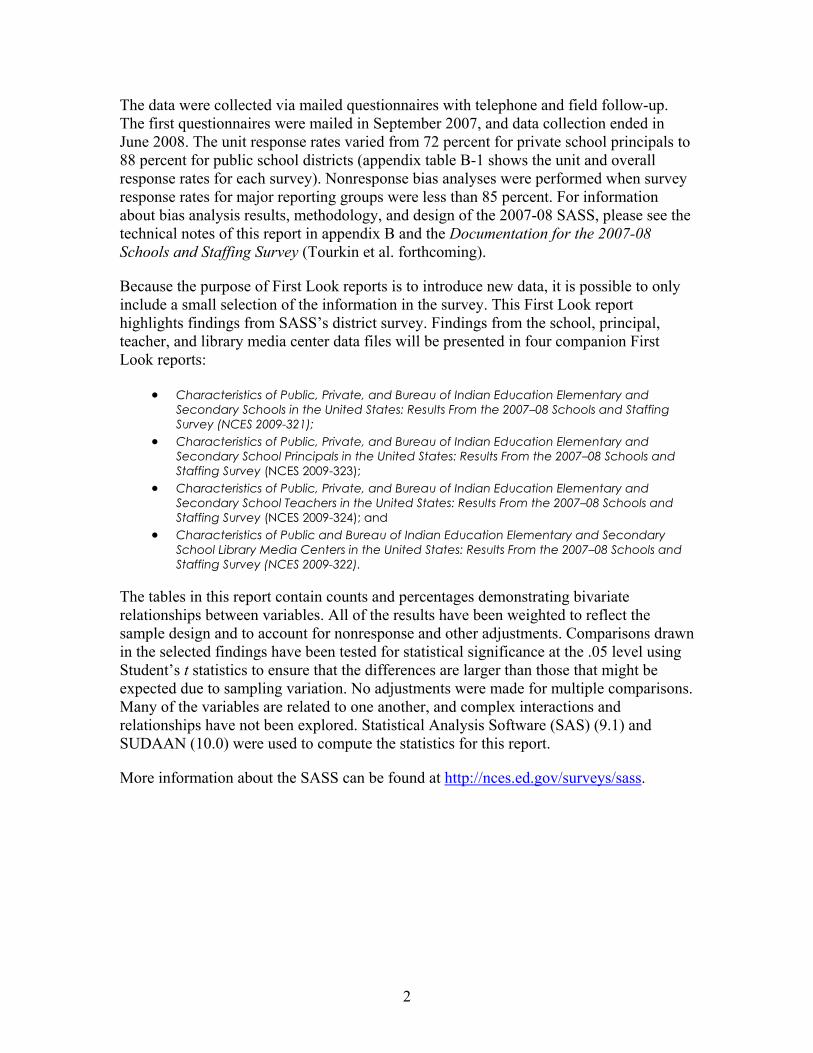
The data were collected via mailed questionnaires with telephone and field follow-up. The first questionnaires were mailed in September 2007, and data collection ended in June 2008. The unit response rates varied from 72 percent for private school principals to 88 percent for public school districts (appendix table B-1 shows the unit and overall response rates for each survey). Nonresponse bias analyses were performed when survey response rates for major reporting groups were less than 85 percent. For information about bias analysis results, methodology, and design of the 2007-08 SASS, please see the technical notes of this report in appendix B and the Documentation for the 2007-08 Schools and Staffing Survey (Tourkin et al. forthcoming).
Because the purpose of First Look reports is to introduce new data, it is possible to only include a small selection of the information in the survey. This First Look report highlights findings from SASS’s district survey. Findings from the school, principal, teacher, and library media center data files will be presented in four companion First Look reports:
• Characteristics of Public, Private, and Bureau of Indian Education Elementary and Secondary Schools in the United States: Results From the 2007–08 Schools and Staffing Survey (NCES 2009-321);
• Characteristics of Public, Private, and Bureau of Indian Education Elementary and Secondary School Principals in the United States: Results From the 2007–08 Schools and Staffing Survey (NCES 2009-323);
• Characteristics of Public, Private, and Bureau of Indian Education Elementary and Secondary School Teachers in the United States: Results From the 2007–08 Schools and Staffing Survey (NCES 2009-324); and
• Characteristics of Public and Bureau of Indian Education Elementary and Secondary School Library Media Centers in the United States: Results From the 2007–08 Schools and Staffing Survey (NCES 2009-322).
The tables in this report contain counts and percentages demonstrating bivariate relationships between variables. All of the results have been weighted to reflect the sample design and to account for nonresponse and other adjustments. Comparisons drawn in the selected findings have been tested for statistical significance at the .05 level using Student’s t statistics to ensure that the differences are larger than those that might be expected due to sampling variation. No adjustments were made for multiple comparisons. Many of the variables are related to one another, and complex interactions and relationships have not been explored. Statistical Analysis Software (SAS) (9.1) and SUDAAN (10.0) were used to compute the statistics for this report.
More information about the SASS can be found at http://nces.ed.gov/surveys/sass.
2

Selected Findings
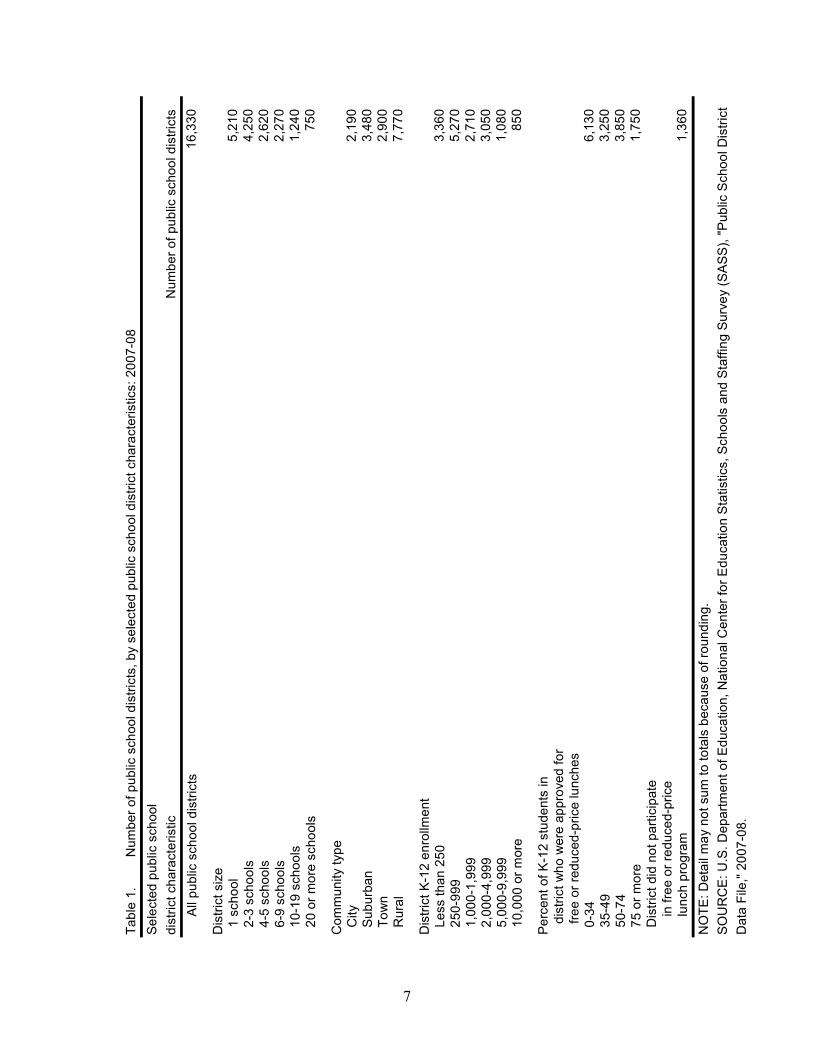
• Of the estimated 16,330 public school districts in operation, 48 percent (7,770)
were located in rural communities, 21 percent (3,480) in suburban areas, 18 percent (2,900) in towns, and 13 percent (2,190) in cities (table 1).
• In districts’ salary schedules, the average yearly base salary for teachers with a bachelor’s degree and no teaching experience was $33,600, while teachers with the same degree but 10 years of teaching experience had a yearly base salary of $43,000 (table 2).
• The average lowest yearly base salary paid to full-time teachers was $34,000 and the highest was $60,400 in 2007-08 among all districts (table 3).
• About 98 percent of school districts offered general medical insurance benefits to teachers, 85 percent offered dental insurance, and 80 percent offered group life insurance (table 4).
• Overall, 24 percent of public school districts offered pay incentives to teachers if they attained certification from the National Board for Professional Teaching Standards, 15 percent offered pay incentives to recruit or retain teachers to teach in fields of shortage, 10 percent to reward excellence in teaching, and 6 percent to recruit or retain teachers to teach in a less desirable location (table 5).
• On average, there were 22.4 newly hired teachers per district in the 2007-08 school year, ranging from an average of 2.1 new hires in districts with less than 250 students to an average of 206.2 new hires in districts with 10,000 or more students (table 6).
• While 54 percent of school districts had a collective bargaining agreement with teachers’ associations or unions, 11 percent of districts had meet-and-confer agreements with these groups (table 7).
• Overall, 4.4 teachers out of an average 211.4 teachers per district did not have their contracts renewed or were dismissed as a result of poor performance (table 8).
• Among the districts that granted high school diplomas, students were required to take on average 3.9 years of instruction in English or language arts, 3.0 years in mathematics, 1.0 years in computer science, 3.3 years in social sciences and social studies, 2.7 years in physical or biological sciences, and 1.6 years in foreign languages (table 9).
3

• Among public school districts with more than one school, the average lowest yearly base salary paid to full-time principals was $73,300 in 2007-08, while the highest was $88,600 (table 10).
• Collective bargaining agreements with principals’ associations or unions were reported by 16 percent of public school districts with more than one school, and meet-and-confer agreements were reported by 10 percent (table 11).
• Among districts with more than one school, 24 percent of the districts had a training program for aspiring school administrators and 9 percent of principals were newly hired by a district in the 2007-08 school year (table 12).
4

References
Cochran, W.G. (1977). Sampling Techniques. New York: John Wiley & Sons. Tourkin, S., Thomas, T., Swaim, N., Cox, S., Parmer, R., Jackson, B., Cole, C., and
Zhang, B. (forthcoming). Documentation for the 2007-08 Schools and Staffing Survey (NCES 2009-318). National Center for Education Statistics, Institute of Education Sciences, U.S. Department of Education. Washington, DC.
U.S. Department of Education, National Center for Education Statistics. (2003). NCES Statistical Standards (NCES 2003-601). Washington, DC: U.S. Government Printing Office.
5

Estimate Tables
6
Tabl
e 1.
Sele
cted
pub
lic s
choo
ldi
stric
t cha
ract
eris
ticN
umbe
r of p
ublic
sch
ool d
istri
cts
A
ll pu
blic
sch
ool d
istri
cts
16,3
30
Dis
trict
siz
e 1
sch
ool
5,21
0 2
-3 s
choo
ls4,
250
4-5
sch
ools
2,62
0 6
-9 s
choo
ls2,
270
10-
19 s
choo
ls1,
240
20
or m
ore
scho
ols
750
Com
mun
ity ty
pe C
ity2,
190
Sub
urba
n3,
480
Tow
n2,
900
Rur
al7,
770
Dis
trict
K-1
2 en
rollm
ent
Les
s th
an 2
503,
360
250
-999
5,27
0 1
,000
-1,9
992,
710
2,0
00-4
,999
3,
050
5,0
00-9
,999
1,08
0 1
0,00
0 or
mor
e 85
0
0-3
46,
130
35-
493,
250
50-
743,
850
1,75
0
1,36
0
75
or m
ore
Dis
trict
did
not
par
ticip
ate
Num
ber o
f pub
lic s
choo
l dis
trict
s, b
y se
lect
ed p
ublic
sch
ool d
istri
ct c
hara
cter
istic
s: 2
007-
08
NO
TE: D
etai
l may
not
sum
to to
tals
bec
ause
of r
ound
ing.
SO
UR
CE
: U.S
. Dep
artm
ent o
f Edu
catio
n, N
atio
nal C
ente
r for
Edu
catio
n S
tatis
tics,
Sch
ools
and
Sta
ffing
Sur
vey
(SA
SS
), "P
ublic
Sch
ool D
istri
ctD
ata
File
," 20
07-0
8.
i
n fre
e or
redu
ced-
pric
e
lun
ch p
rogr
am
Perc
ent o
f K-1
2 st
uden
ts in
di
stric
t who
wer
e ap
prov
ed fo
r
free
or re
duce
d-pr
ice
lunc
hes
7

Tabl
e 2.
Tabl
e 2.
Bach
elor
's d
egre
e M
aste
r's d
egre
e P
erce
nt w
ithB
ache
lor's
deg
ree
and
10 y
ears
of
Mas
ter's
deg
ree
and
10 y
ears
of
Hig
hest
pos
sibl
esa
lary
sch
edul
esan
d no
teac
hing
teac
hing
and
no te
achi
ngte
achi
ngst
ep o
n th
efo
r tea
cher
sex
perie
nce
expe
rienc
eex
perie
nce
expe
rienc
esa
lary
sch
edul
e
All
publ
ic s
choo
l dis
trict
s92
.4$3
3,60
0$4
3,00
0$3
6,70
0$4
7,50
0$6
2,20
0
Dis
trict
siz
e 1
sch
ool
79.1
32,9
0041
,700
36,1
0045
,800
58,4
00 2
-3 s
choo
ls98
.532
,200
40,9
0035
,200
45,1
0058
,800
4-5
sch
ools
98.1
33,5
0043
,300
36,4
0047
,700
62,9
00 6
-9 s
choo
ls99
.035
,400
46,2
0038
,700
51,4
0068
,900
10-
19 s
choo
ls98
.735
,700
45,6
0039
,100
51,0
0068
,300
20
or m
ore
scho
ols
99.6
36,8
0046
,300
40,0
0051
,700
70,2
00
Com
mun
ity ty
pe C
ity73
.536
,300
46,9
0039
,800
51,7
0068
,000
Sub
urba
n95
.438
,000
50,5
0041
,900
56,2
0077
,200
Tow
n94
.932
,500
41,5
0035
,600
45,7
0059
,300
Rur
al95
.431
,400
39,3
0034
,200
43,3
0055
,400
Dis
trict
K-1
2 en
rollm
ent
Les
s th
an 2
5078
.131
,400
39,7
0034
,400
43,8
0054
,000
250
-999
92
.232
,100
40,6
0035
,100
44,5
0057
,300
1,0
00-1
,999
98
.833
,600
43,3
0036
,800
47,7
0063
,500
2,0
00-4
,999
98
.235
,700
46,7
0039
,100
52,0
0070
,000
5,0
00-9
,999
99.5
36,3
0046
,900
39,9
0052
,300
72,1
00 1
0,00
0 or
mor
e 99
.637
,400
47,4
0040
,600
52,9
0072
,100
Per
cent
of K
-12
stud
ents
in
dist
rict w
ho w
ere
appr
oved
for
fre
e or
redu
ced-
pric
e lu
nche
s 0
-34
96.5
34,9
0045
,400
38,3
0050
,400
67,7
00 3
5-49
95.8
32,0
0040
,600
34,9
0044
,700
58,1
00 5
0-74
91.9
32,2
0040
,800
35,1
0044
,600
57,1
00 7
5 or
mor
e85
.033
,500
42,3
0036
,600
46,8
0058
,800
Dis
trict
did
not
par
ticip
ate
i
n fre
e or
redu
ced-
pric
e
lun
ch p
rogr
am7 6
.535
,100
44,9
0039
,100
50,1
0065
,900
Sel
ecte
d pu
blic
sch
ool
dist
rict c
hara
cter
istic
SO
UR
CE
: U.S
. Dep
artm
ent o
f Edu
catio
n, N
atio
nal C
ente
r for
Edu
catio
n St
atis
tics,
Sch
ools
and
Sta
ffing
Sur
vey
(SAS
S),
"Pub
lic S
choo
l Dis
trict
Dat
a Fi
le,"
2007
-08.
Per
cent
age
of p
ublic
sch
ool d
istri
cts
that
had
sal
ary
sche
dule
s fo
r tea
cher
s an
d am
ong
thos
e th
at h
ad s
alar
y sc
hedu
les,
the
aver
age
year
ly te
ache
r bas
e sa
lary
, by
vario
us le
vels
of d
egre
es a
nd e
xper
ienc
e an
d se
lect
ed p
ublic
sch
ool d
istri
ct c
hara
cter
istic
s: 2
007-
08A
mon
g di
stric
ts th
at h
ad s
alar
y sc
hedu
les,
ave
rage
yea
rly te
ache
r bas
e sa
lary
8
Tabl
e 3.
Tabl
e 3.
Base
sal
ary
of th
e lo
wes
t pai
dBa
se s
alar
y of
the
high
est p
aid
A
ll pu
blic
sch
ool d
istri
cts
$34,
000
$60,
400
Dis
trict
siz
e 1
sch
ool
34
,300
53,5
00
2-3
sch
ools
32
,400
58,3
00
4-5
sch
ools
33
,600
63,6
00
6-9
sch
ools
35
,300
69,2
00
10-
19 s
choo
ls
35,5
00
68
,100
2
0 or
mor
e sc
hool
s
36,4
00
70
,600
Com
mun
ity ty
pe C
ity
35,0
00
58
,300
S
ubur
ban
37
,900
76,4
00
Tow
n
32,7
00
58
,700
R
ural
32
,500
54,5
00
Dis
trict
K-1
2 en
rollm
ent
Les
s th
an 2
50
34,1
00
49
,600
2
50-9
99
32
,400
55,3
00
1,0
00-1
,999
33,5
00
63
,500
2
,000
-4,9
99
35
,700
70,9
00
5,0
00-9
,999
36
,200
72,2
00
10,
000
or m
ore
37
,000
72,4
00
Per
cent
of K
-12
stud
ents
in
dist
rict w
ho w
ere
appr
oved
for
fre
e or
redu
ced-
pric
e lu
nche
s 0
-34
35
,100
67,0
00
35-
49
32,3
00
57
,600
5
0-74
32
,600
55,7
00
75
or m
ore
35
,700
56,7
00
Dis
trict
did
not
par
ticip
ate
i
n fre
e or
redu
ced-
pric
e
lun
ch p
rogr
am
35,1
00
55
,800
2007
-08.
SO
UR
CE
: U.S
. Dep
artm
ent o
f Edu
catio
n, N
atio
nal C
ente
r for
Edu
catio
n S
tatis
tics,
Sch
ools
and
Sta
ffing
Sur
vey
(SAS
S),
"Pub
lic S
choo
l Dis
trict
Dat
a Fi
le,"
Ave
rage
low
est a
nd h
ighe
st y
early
bas
e sa
larie
s pa
id to
full-
time
teac
hers
am
ong
all d
istri
cts,
by
sele
cted
pub
lic s
choo
l dis
trict
ch
arac
teris
tics:
200
7-08
dist
rict c
hara
cter
istic
Sel
ecte
d pu
blic
sch
ool
9

Tabl
e 4.
Hou
sing
,ho
usin
gG
ener
alsu
bsid
ies,
med
ical
Den
tal
Gro
up li
feD
efin
ed-
Def
ined
-Tu
ition
or re
ntS
ubsi
dize
dS
ubsi
dize
din
sura
nce
insu
ranc
ein
sura
nce
bene
fitco
ntrib
utio
nre
imbu
rsem
ent
assi
stan
cem
eals
trans
porta
tion
A
ll pu
blic
sch
ool d
istri
cts
98.0
85.2
80.0
83.0
65.9
44.6
3.4
3.8
2.9
Dis
trict
siz
e 1
sch
ool
96.6
80.2
70.2
78.4
65.5
45.2
5.9
6.6
2.8
2-3
sch
ools
97.6
81.0
79.1
81.3
62.4
45.9
2.9
3.3
2.6
4-5
sch
ools
99.4
88.3
83.5
86.0
66.4
44.5
2.4
3.6
3.7
6-9
sch
ools
99.0
92.3
88.9
86.1
69.2
44.4
0.8
1.2
!2.
4 1
0-19
sch
ools
99.5
94.0
90.3
90.3
69.2
41.3
2.0
1.6
3.4
20
or m
ore
scho
ols
99.7
96.9
96.1
93.7
72.2
40.6
2.6
0.7
2.7
Com
mun
ity ty
pe C
ity99
.990
.781
.282
.568
.845
.20.
6!
4.3
3.4
Sub
urba
n99
.295
.284
.883
.266
.353
.10.
30.
7!
1.4
Tow
n99
.588
.085
.883
.468
.939
.81.
8!
4.8
3.5
Rur
al96
.478
.175
.383
.063
.942
.56.
24.
73.
2
Dis
trict
K-1
2 en
rollm
ent
Les
s th
an 2
5093
.675
.564
.778
.861
.042
.910
.19.
13.
3 2
50-9
99
98.6
80.5
77.9
78.6
64.4
43.8
2.4
3.5
2.9
1,0
00-1
,999
99
.589
.284
.586
.167
.647
.31.
02.
82.
1 2
,000
-4,9
99
99.5
93.3
88.1
88.0
70.0
48.0
1.2
1.5
3.7
5,0
00-9
,999
99.8
96.0
91.7
89.1
68.5
41.9
0.4
1.1
!1.
8 1
0,00
0 or
mor
e 99
.796
.994
.191
.972
.039
.52.
10.
62.
4
Per
cent
of K
-12
stud
ents
in
dist
rict w
ho w
ere
appr
oved
for
fre
e or
redu
ced-
pric
e lu
nche
s 0
-34
98.8
88.0
83.8
82.9
67.5
50.5
1.0
2.1
2.3
35-
4998
.983
.680
.283
.764
.942
.62.
54.
13.
7 5
0-74
98.2
82.8
81.7
84.3
65.9
37.2
5.4
4.7
3.6
75
or m
ore
98.2
88.9
75.5
85.1
62.5
40.7
4.9
7.7
2.7
Dis
trict
did
not
par
ticip
ate
i
n fre
e or
redu
ced-
pric
e
lun
ch p
rogr
am91
.578
.463
.575
.966
.049
.38.
4!
3.5
!1.
8!
! Int
erpr
et d
ata
with
cau
tion.
The
sta
ndar
d er
ror f
or th
is e
stim
ate
is e
qual
to 3
0 pe
rcen
t or m
ore
of th
e es
timat
e's
valu
e.
on th
e na
ture
of t
he in
vest
men
t and
retu
rns.
403
(b) p
lans
are
def
ined
-con
tribu
tion.
S
OU
RC
E: U
.S. D
epar
tmen
t of E
duca
tion,
Nat
iona
l Cen
ter f
or E
duca
tion
Sta
tistic
s, S
choo
ls a
nd S
taffi
ng S
urve
y (S
AS
S),
"Pub
lic S
choo
l Dis
trict
Dat
a Fi
le,"
2007
-08.
1 Dis
trict
s ca
n of
fer b
oth
defin
ed-b
enef
it an
d de
fined
-con
tribu
tion
retir
emen
t pla
ns. A
def
ined
-ben
efit
retir
emen
t pla
n is
a p
lan
in w
hich
ben
efits
are
inve
sted
in a
gro
up tr
ust f
und
defin
ed-b
enef
it. A
def
ined
-con
tribu
tion
retir
emen
t pla
n is
a p
lan
whe
re c
ontri
butio
ns a
re p
aid
into
an
indi
vidu
ally
-con
trolle
d re
tirem
ent a
ccou
nt. F
unds
ava
ilabl
e at
retir
emen
t dep
end
Per
cent
age
of p
ublic
sch
ool d
istri
cts
that
offe
red
vario
us b
enef
its to
teac
hers
, by
sele
cted
pub
lic s
choo
l dis
trict
cha
ract
eris
tics:
200
7-08
whi
ch e
mpl
oyee
s do
not
con
trol.
Ben
efits
are
bas
ed o
n a
form
ula
that
take
s in
to a
ccou
nt e
mpl
oyee
's le
ngth
of e
mpl
oym
ent a
nd e
arni
ngs.
Mos
t sta
te re
tirem
ent p
lans
are
Ret
irem
ent p
lan1
Sel
ecte
d pu
blic
sch
ool
dist
rict c
hara
cter
istic
10

Ta
ble
5.To
rew
ard
teac
hers
who
hav
eat
tain
ed N
atio
nal B
oard
for
To re
crui
t or r
etai
nTo
recr
uit o
r ret
ain
Pro
fess
iona
l Tea
chin
gTo
rew
ard
exce
llenc
ete
ache
rs to
teac
h in
ate
ache
rs to
teac
h in
Stan
dard
s ce
rtific
atio
nin
teac
hing
less
des
irabl
e lo
catio
nfie
lds
of s
horta
ge
All
publ
ic s
choo
l dis
trict
s24
.510
.25.
715
.4
Dis
trict
siz
e 1
sch
ool
17.9
20.8
6.4
11.2
2-3
sch
ools
18.2
4.4
3.7
12.3
4-5
sch
ools
21.8
3.9
3.8
15.2
6-9
sch
ools
32.2
3.8
3.8
17.7
10-
19 s
choo
ls45
.38.
29.
026
.7 2
0 or
mor
e sc
hool
s58
.215
.018
.238
.3
Com
mun
ity ty
pe C
ity35
.435
.313
.023
.3 S
ubur
ban
26.5
6.9
2.4
11.8
Tow
n27
.07.
55.
919
.3 R
ural
19.6
5.7
4.9
13.4
Dis
trict
K-1
2 en
rollm
ent
Les
s th
an 2
5016
.318
.38.
511
.7 2
50-9
99
16.6
11.9
4.0
12.4
1,0
00-1
,999
22
.84.
94.
413
.8 2
,000
-4,9
99
33.3
3.4
3.0
16.6
5,0
00-9
,999
42.0
7.0
6.9
25.6
10,
000
or m
ore
57.3
14.3
16.5
36.4
Per
cent
of K
-12
stud
ents
in
dist
rict w
ho w
ere
appr
oved
for
fre
e or
redu
ced-
pric
e lu
nche
s 0
-34
22.2
6.5
2.2
12.2
35-
4924
.86.
94.
015
.2 5
0-74
26.2
11.7
9.6
19.8
75
or m
ore
34.1
17.8
11.3
21.6
Dis
trict
did
not
par
ticip
ate
i
n fre
e or
redu
ced-
pric
e
lun
ch p
rogr
am17
.221
.26.
8!
10.4
2007
-08.
Per
cent
age
of p
ublic
sch
ool d
istri
cts
that
use
d pa
y in
cent
ives
for v
ario
us re
ason
s, b
y se
lect
ed p
ublic
sch
ool d
istri
ct c
hara
cter
istic
s: 2
007-
08
Sele
cted
pub
lic s
choo
l
SO
UR
CE
: U.S
. Dep
artm
ent o
f Edu
catio
n, N
atio
nal C
ente
r for
Edu
catio
n S
tatis
tics,
Sch
ools
and
Sta
ffing
Sur
vey
(SA
SS),
"Pub
lic S
choo
l Dis
trict
Dat
a Fi
le,"
dist
rict c
hara
cter
istic
! Int
erpr
et d
ata
with
cau
tion.
The
sta
ndar
d er
ror f
or th
is e
stim
ate
is e
qual
to 3
0 pe
rcen
t or m
ore
of th
e es
timat
e's
valu
e.
11
Ta
ble
6.Ta
ble
6.Ta
ble
6.A
vera
ge n
umbe
r of
Perc
ent o
f dis
trict
ste
ache
rs w
ho w
ere
that
offe
red
free
train
ing
Forg
iven
ess
ofFi
nder
's fe
e to
new
ly h
ired
for g
rade
sfo
r tea
cher
s in
fiel
dsst
uden
t loa
n(s)
exis
ting
staf
fK-
12 a
nd c
ompa
rabl
e w
ith c
urre
nt o
r Si
gnin
gfu
nded
by
Rel
ocat
ion
for n
ewun
grad
ed le
vels
antic
ipat
ed s
horta
ges
bonu
ses
the
dist
rict
assi
stan
cete
ache
r ref
erra
ls
All
publ
ic s
choo
l dis
trict
s22
.430
.76.
82.
23.
61.
5
Dis
trict
siz
e 1
sch
ool
3.3
33.5
5.3
2.6
3.0
3.4
2-3
sch
ools
6.9
28.9
5.8
1.3
2.9
0.4
4-5
sch
ools
13.3
29.5
5.9
0.9
2.2
0.3
! 6
-9 s
choo
ls25
.124
.75.
82.
8!
3.7
0.6
! 1
0-19
sch
ools
51.7
31.7
13.7
3.6
6.5
1.9
20
or m
ore
scho
ols
217.
841
.918
.65.
710
.92.
1
Com
mun
ity ty
pe C
ity47
.242
.69.
34.
84.
43.
5!
Sub
urba
n40
.022
.92.
91.
01.
52.
4 T
own
16.5
30.3
7.1
1.2
4.2
1.9
! R
ural
9.8
30.9
7.8
2.5
4.1
0.5
!
Dis
trict
K-1
2 en
rollm
ent
Les
s th
an 2
502.
135
.76.
23.
24.
13.
4 2
50-9
99
5.0
31.3
6.2
1.8
2.8
1.3
! 1
,000
-1,9
99
10.7
26.5
5.0
1.0
2.3
0.5
! 2
,000
-4,9
99
23.1
26.7
5.4
2.0
3.2
0.6
! 5
,000
-9,9
9952
.526
.011
.52.
85.
42.
0 1
0,00
0 or
mor
e 20
6.2
40.3
18.3
5.5
9.4
2.2
Per
cent
of K
-12
stud
ents
in
dist
rict w
ho w
ere
appr
oved
for
fre
e or
redu
ced-
pric
e lu
nche
s 0
-34
22.5
22.1
4.3
0.8
2.5
0.4
35-
4927
.531
.06.
51.
44.
30.
9 5
0-74
25.1
36.6
10.5
2.7
4.2
1.7
! 7
5 or
mor
e20
.441
.011
.19.
46.
52.
0!
Dis
trict
did
not
par
ticip
ate
i
n fre
e or
redu
ced-
pric
e
lun
ch p
rogr
am4.
638
.53.
2!
0.3
!1.
6!
7.1
!
SO
UR
CE
: U.S
. Dep
artm
ent o
f Edu
catio
n, N
atio
nal C
ente
r for
Edu
catio
n St
atis
tics,
Sch
ools
and
Sta
ffing
Sur
vey
(SAS
S), "
Publ
ic S
choo
l Dis
trict
Dat
a Fi
le,"
2007
-08.
Sel
ecte
d pu
blic
sch
ool
dist
rict c
hara
cter
istic
Ave
rage
num
ber o
f pub
lic s
choo
l tea
cher
s w
ho w
ere
new
ly h
ired
for g
rade
s K
-12
and
com
para
ble
ungr
aded
leve
ls, p
erce
ntag
e of
dis
trict
s th
at o
ffere
d fre
e
Perc
ent o
f dis
trict
s th
at u
sed
vario
us m
etho
ds fo
r rec
ruiti
ng n
ew te
ache
rsse
lect
ed p
ublic
sch
ool d
istri
ct c
hara
cter
istic
s: 2
007-
08tra
inin
g fo
r tea
cher
s in
fiel
ds w
ith c
urre
nt o
r ant
icip
ated
sho
rtage
s, a
nd p
erce
ntag
e of
dis
trict
s th
at u
sed
vario
us m
etho
ds fo
r rec
ruiti
ng n
ew te
ache
rs, b
y
! Int
erpr
et d
ata
with
cau
tion.
The
sta
ndar
d er
ror f
or th
is e
stim
ate
is e
qual
to 3
0 pe
rcen
t or m
ore
of th
e es
timat
e's
valu
e.
12

1M
eet-a
nd-c
onfe
r2N
o sp
ecifi
c ag
gai
nin
g
Tabl
e 7.
char
acte
ristic
s: 2
007-
08
Col
lect
ive
bar
reem
ent3
A
ll pu
blic
sch
ool d
istri
cts
53.5
10.9
35.6
Dis
trict
siz
e 1
sch
ool
33.3
9.0
57.7
2-3
sch
ools
63.6
12.0
24.4
4-5
sch
ools
63.5
11.5
25.0
6-9
sch
ools
66.0
10.8
23.1
10-
19 s
choo
ls58
.312
.629
.0 2
0 or
mor
e sc
hool
s56
.712
.431
.0
Com
mun
ity ty
pe C
ity30
.48.
660
.9 S
ubur
ban
73.9
10.2
15.8
Tow
n55
.911
.732
.3 R
ural
50.0
11.5
38.5
Dis
trict
K-1
2 en
rollm
ent
Les
s th
an 2
5029
.59.
261
.3 2
50-9
99
51.1
11.4
37.5
1,0
00-1
,999
67
.211
.021
.9 2
,000
-4,9
99
66.8
10.9
22.3
5,0
00-9
,999
63.9
11.6
24.5
10,
000
or m
ore
59.7
12.9
27.4
Per
cent
of K
-12
stud
ents
in
dist
rict w
ho w
ere
appr
oved
for
fre
e or
redu
ced-
pric
e lu
nche
s 0
-34
74.5
11.4
14.1
35-
4957
.212
.230
.6 5
0-74
36.7
11.5
51.9
75
or m
ore
29.4
7.2
63.4
Dis
trict
did
not
par
ticip
ate
i
n fre
e or
redu
ced-
pric
e
lun
ch p
rogr
am29
.18.
5!
62.4
Per
cent
age
dist
ribut
ion
of p
ublic
sch
ool d
istri
cts,
by
spec
ific
agre
emen
ts w
ith te
ache
rs' a
ssoc
iatio
ns o
r uni
ons
and
sele
cted
pub
lic s
choo
l dis
trict
Sel
ecte
d pu
blic
sch
ool
dist
rict c
hara
cter
istic
2 Mee
t-and
-con
fer d
iscu
ssio
ns a
re fo
r the
pur
pose
of r
each
ing
non-
lega
lly-b
indi
ng a
gree
men
ts.
1 Col
lect
ive
barg
aini
ng a
gree
men
ts a
re le
gally
-bin
ding
agr
eem
ents
.
3 Thi
s ca
tego
ry in
clud
es b
oth
no a
gree
men
ts a
nd o
ther
agr
eem
ents
that
do
not m
eet t
he p
reci
se le
gal d
efin
ition
s of
col
lect
ive
barg
aini
ng a
nd m
eet-a
nd-c
onfe
rag
reem
ents
.N
OTE
: Det
ail m
ay n
ot s
um to
tota
ls b
ecau
se o
f rou
ndin
g.
! Int
erpr
et d
ata
with
cau
tion.
The
sta
ndar
d er
ror f
or th
is e
stim
ate
is e
qual
to 3
0 pe
rcen
t or m
ore
of th
e es
timat
e's
valu
e.
Per
cent
age
dist
ribut
ion
of d
istri
cts
that
had
a s
peci
fic a
gree
men
t with
a te
ache
rs' a
ssoc
iatio
n or
uni
on
SO
UR
CE
: U.S
. Dep
artm
ent o
f Edu
catio
n, N
atio
nal C
ente
r for
Edu
catio
n S
tatis
tics,
Sch
ools
and
Sta
ffing
Sur
vey
(SA
SS
), "P
ublic
Sch
ool D
istri
ct D
ata
File
," 20
07-0
8.
13

Tabl
e 8.
Tabl
e 8.
Aver
age
num
ber o
f tea
cher
s i
n pu
blic
sch
ool d
istri
cts
who
Ave
rage
num
ber
wer
e di
smis
sed
or d
id n
ot
of te
ache
rsha
ve th
eir c
ontra
cts
rene
wed
Teac
hers
with
out t
enur
e1Te
ache
rs w
ith te
nure
2
A
ll pu
blic
sch
ool d
istri
cts
211.
44.
41.
43.
0
Dis
trict
siz
e 1
sch
ool
25.4
0.8
0.4
0.5
2-3
sch
ools
68.7
1.9
0.4
1.5
4-5
sch
ools
133.
13.
10.
82.
3 6
-9 s
choo
ls24
3.3
7.1
1.9
5.3
10-
19 s
choo
ls47
0.1
11.9
2.8
9.0
20
or m
ore
scho
ols
2061
.027
.513
.114
.4
Com
mun
ity ty
pe C
ity46
3.4
7.9
3.1
4.8
Sub
urba
n37
8.3
7.5
2.8
4.7
Tow
n15
2.7
3.9
0.7
3.2
Rur
al87
.82.
20.
61.
6
Dis
trict
K-1
2 en
rollm
ent
Les
s th
an 2
5014
.10.
80.
30.
6 2
50-9
99
44.8
1.3
0.4
0.9
1,0
00-1
,999
10
7.1
3.1
0.7
2.3
2,0
00-4
,999
23
1.0
6.1
1.5
4.6
5,0
00-9
,999
477.
89.
13.
25.
9 1
0,00
0 or
mor
e 19
39.2
30.1
12.2
17.9
Per
cent
of K
-12
stud
ents
in
dist
rict w
ho w
ere
appr
oved
for
fre
e or
redu
ced-
pric
e lu
nche
s 0
-34
224.
54.
91.
23.
6 3
5-49
260.
23.
71.
32.
4 5
0-74
229.
44.
71.
63.
1 7
5 or
mor
e17
0.4
6.1
2.7
3.4
Dis
trict
did
not
par
ticip
ate
i
n fre
e or
redu
ced-
pric
e
lun
ch p
rogr
am38
.41.
00.
40.
6!
dist
rict c
hara
cter
istic
! Int
erpr
et d
ata
with
cau
tion.
The
sta
ndar
d er
ror f
or th
is e
stim
ate
is e
qual
to 3
0 pe
rcen
t or m
ore
of th
e es
timat
e's
valu
e.
Ave
rage
num
ber o
f pub
lic s
choo
l tea
cher
s an
d av
erag
e nu
mbe
r of p
ublic
sch
ool t
each
ers
who
wer
e di
smis
sed
in th
e pr
evio
us y
ear o
r did
not
hav
e th
eir
cont
ract
s re
new
ed b
ased
on
poor
per
form
ance
, by
tenu
re s
tatu
s of
teac
hers
and
sel
ecte
d pu
blic
sch
ool d
istri
ct c
hara
cter
istic
s: 2
007-
08
SO
UR
CE:
U.S
. Dep
artm
ent o
f Edu
catio
n, N
atio
nal C
ente
r for
Edu
catio
n St
atis
tics,
Sch
ools
and
Sta
ffing
Sur
vey
(SAS
S), "
Pub
lic S
choo
l Dis
trict
Dat
a Fi
le,"
2007
-08.
Ave
rage
num
ber o
f te
ache
rs in
pub
lic s
choo
ls w
ho w
ere
1 Tea
cher
s w
ho a
re o
ften
rela
tivel
y in
expe
rienc
ed o
r nov
ices
. Thi
s in
clud
es te
ache
rs in
thei
r ini
tial i
nduc
tion
year
, tea
cher
s w
ho a
re o
n ye
ar-to
-yea
r con
tract
s, a
nd
thos
e te
ache
rs w
ho h
ave
not e
nter
ed a
mor
e pe
rman
ent s
tatu
s, tr
aditi
onal
ly re
ferr
ed to
as
tenu
re.
dism
isse
d or
did
not
hav
e th
eir c
ontra
cts
rene
wed
, by
tenu
re s
tatu
s
2 Tea
cher
s w
ho h
ave
satis
fact
orily
com
plet
ed a
pro
batio
nary
per
iod
and
wer
e gi
ven
a co
ntra
ct a
s a
care
er o
r per
man
ent e
mpl
oyee
.
Sel
ecte
d pu
blic
sch
ool
14

Tabl
e 9.
Tabl
e 9.
Soci
al s
cien
ces,
soci
al s
tudi
esP
erce
nt o
f dis
trict
s(e
.g.,
hist
ory,
Phys
ical
or
Sel
ecte
d pu
blic
sch
ool
that
gra
nt h
igh
Engl
ish
orC
ompu
ter
geog
raph
y,bi
olog
ical
Fore
ign
dist
rict c
hara
cter
istic
scho
ol d
iplo
mas
lang
uage
arts
Mat
hem
atic
ssc
ienc
eec
onom
ics)
sci
ence
sla
ngua
ge
All
publ
ic s
choo
l dis
trict
s75
.93.
93.
01.
03.
32.
71.
6
Dis
trict
siz
e 1
sch
ool
46.9
3.9
3.0
1.1
3.2
2.6
1.8
2-3
sch
ools
86.2
4.0
3.0
1.0
3.2
2.7
1.6
4-5
sch
ools
90.8
3.9
3.0
1.0
3.3
2.7
1.6
6-9
sch
ools
90.7
4.0
3.0
0.9
3.2
2.8
1.6
10-
19 s
choo
ls91
.83.
93.
01.
03.
32.
71.
6 2
0 or
mor
e sc
hool
s94
.73.
93.
01.
03.
22.
71.
8
Com
mun
ity ty
pe C
ity53
.44.
03.
01.
13.
32.
72.
0 S
ubur
ban
70.1
4.0
3.0
1.0
3.3
2.7
1.6
Tow
n85
.93.
93.
01.
03.
22.
71.
5 R
ural
81.0
3.9
3.0
1.0
3.3
2.7
1.6
Dis
trict
K-1
2 en
rollm
ent
Les
s th
an 2
5048
.53.
93.
01.
23.
32.
61.
7 2
50-9
99
71.2
3.9
3.0
1.1
3.3
2.7
1.7
1,0
00-1
,999
90
.14.
03.
01.
03.
22.
71.
6 2
,000
-4,9
99
90.3
4.0
3.0
0.9
3.3
2.8
1.6
5,0
00-9
,999
91
.54.
03.
01.
03.
32.
71.
6 1
0,00
0 or
mor
e 95
.13.
93.
01.
03.
22.
71.
7
Per
cent
of K
-12
stud
ents
in
dist
rict w
ho w
ere
appr
oved
for
fre
e or
redu
ced-
pric
e lu
nche
s 0
-34
80.8
4.0
2.9
1.0
3.2
2.7
1.5
35-
4987
.53.
93.
01.
03.
32.
71.
7 5
0-74
80.3
3.9
3.1
1.1
3.3
2.8
1.7
75
or m
ore
57.9
4.0
3.1
1.1
3.2
2.7
1.6
Dis
trict
did
not
par
ticip
ate
i
n fre
e or
redu
ced-
pric
e
lun
ch p
rogr
am36
.13.
93.
11.
03.
32.
72.
0
SO
UR
CE
: U.S
. Dep
artm
ent o
f Edu
catio
n, N
atio
nal C
ente
r for
Edu
catio
n St
atis
tics,
Sch
ools
and
Sta
ffing
Sur
vey
(SA
SS)
, "P
ublic
Sch
ool D
istri
ct D
ata
File
," 20
07-0
8.
1 Dis
trict
s th
at d
o no
t hav
e a
grad
uatio
n re
quire
men
t for
a p
artic
ular
sub
ject
are
a ar
e ex
clud
ed fr
om th
e co
mpu
tatio
n of
the
aver
age
for t
hat p
artic
ular
sub
ject
are
a.
Perc
enta
ge o
f pub
lic s
choo
l dis
trict
s th
at g
rant
ed h
igh
scho
ol d
iplo
mas
, and
am
ong
thos
e th
at g
rant
ed d
iplo
mas
, gra
duat
ion
requ
irem
ents
for s
tand
ard
dipl
omas
, by
sele
cted
pub
lic s
choo
l dis
trict
cha
ract
eris
tics:
200
7-08
Amon
g di
stric
ts th
at g
rant
ed h
igh
scho
ol d
iplo
mas
, the
ave
rage
num
ber o
f yea
rs o
f ins
truct
ion
in v
ario
us s
ubje
ct a
reas
nee
ded
for a
sta
ndar
d di
plom
a1
15

Tabl
e 10
.Ta
ble
10.
Sel
ecte
d pu
blic
sch
ool
Per
cent
with
sal
ary
sche
dule
s di
stric
t cha
ract
eris
ticfo
r prin
cipa
lsB
ase
sala
ry o
f the
low
est p
aid
Bas
e sa
lary
of t
he h
ighe
st p
aid
A
ll di
stric
ts w
ith m
ore
than
one
sch
ool
50.9
$73,
300
$88,
600
Dis
trict
siz
e 2
-3 s
choo
ls32
.370
,100
79,2
00 4
-5 s
choo
ls41
.773
,100
87,3
00 6
-9 s
choo
ls65
.777
,600
96,5
00 1
0-19
sch
ools
82.4
75,8
0098
,300
20
or m
ore
scho
ols
90.8
75,3
0010
5,80
0
Com
mun
ity ty
pe C
ity87
.879
,800
104,
200
Sub
urba
n60
.888
,600
109,
800
Tow
n53
.368
,800
83,7
00 R
ural
38.2
66,0
0076
,600
Dis
trict
K-1
2 en
rollm
ent
Les
s th
an 2
5024
.564
,600
68,0
00 2
50-9
99
28.7
65,7
0073
,800
1,0
00-1
,999
42
.872
,500
86,5
00 2
,000
-4,9
99
63.4
79,4
0097
,400
5,0
00-9
,999
77
.379
,900
104,
200
10,
000
or m
ore
91.4
78,2
0010
8,30
0
Per
cent
of K
-12
stud
ents
in
dist
rict w
ho w
ere
appr
oved
for
fre
e or
redu
ced-
pric
e lu
nche
s 0
-34
46.1
79,3
0096
,300
35-
4948
.769
,500
84,0
00 5
0-74
58.8
66,0
0079
,700
75
or m
ore
58.5
66,3
0079
,900
Dis
trict
did
not
par
ticip
ate
i
n fre
e or
redu
ced-
pric
e
lun
ch p
rogr
am50
.999
,100
108,
500
train
ing
prog
ram
s fo
r asp
iring
sch
ool a
dmin
istra
tors
. Est
imat
es in
this
tabl
e ar
e ba
sed
on 6
8 pe
rcen
t of a
ll di
stric
ts.
SO
UR
CE
: U.S
. Dep
artm
ent o
f Edu
catio
n, N
atio
nal C
ente
r for
Edu
catio
n S
tatis
tics,
Sch
ools
and
Sta
ffing
Sur
vey
(SA
SS
), "P
ublic
Sch
ool D
istri
ct D
ata
File
," 20
07-0
8.
Am
ong
dist
ricts
with
mor
e th
an o
ne s
choo
l, pe
rcen
tage
of p
ublic
sch
ool d
istri
cts
that
had
sal
ary
sche
dule
s fo
r prin
cipa
ls a
nd a
vera
ge lo
wes
t and
hig
hest
year
ly b
ase
sala
ries
paid
to a
ll fu
ll-tim
e pr
inci
pals
, by
sele
cted
pub
lic s
choo
l dis
trict
cha
ract
eris
tics:
200
7-08
NO
TE: D
istri
cts
with
onl
y on
e sc
hool
, inc
ludi
ng s
ingl
e tra
ditio
nal p
ublic
sch
ools
and
pub
lic c
harte
r sch
ools
that
ope
rate
inde
pend
ently
of a
regu
lar s
choo
l dis
trict
, wer
eno
t ask
ed a
bout
prin
cipa
l sal
ary
sche
dule
s, s
peci
fic a
gree
men
ts w
ith p
rinci
pal u
nion
s, p
rinci
pal h
iring
, num
ber o
f con
tract
day
s fo
r prin
cipa
ls, p
rinci
pal t
enur
e, o
r
Ave
rage
low
est a
nd h
ighe
st y
early
bas
e sa
larie
s of
full-
time
prin
cipa
ls
16

gr2
No
spec
ific
a1
Mee
t-and
-con
feg
Tabl
e 11
.Ta
ble
11.
Sel
ecte
d pu
blic
sch
ool
dist
rict c
hara
cter
istic
Col
lect
ive
barg
aini
nre
emen
t3
A
ll di
stric
ts w
ith m
ore
than
one
sch
ool
15.5
10.4
74.1
Dis
trict
siz
e 2
-3 s
choo
ls11
.66.
881
.6 4
-5 s
choo
ls15
.210
.174
.7 6
-9 s
choo
ls21
.511
.367
.2 1
0-19
sch
ools
17.3
14.6
68.1
20
or m
ore
scho
ols
17.7
21.9
60.5
Com
mun
ity ty
pe C
ity18
.322
.059
.8 S
ubur
ban
28.8
14.8
56.4
Tow
n11
.89.
378
.9 R
ural
9.5
6.5
84.0
Dis
trict
K-1
2 en
rollm
ent
Les
s th
an 2
503.
31.
795
.0 2
50-9
99
7.2
4.8
88.1
1,0
00-1
,999
16
.810
.872
.4 2
,000
-4,9
99
21.9
12.4
65.7
5,0
00-9
,999
22
.415
.562
.1 1
0,00
0 or
mor
e 17
.620
.062
.4
Per
cent
of K
-12
stud
ents
in
dist
rict w
ho w
ere
appr
oved
for
fre
e or
redu
ced-
pric
e lu
nche
s 0
-34
22.1
11.3
66.6
35-
4914
.911
.473
.7 5
0-74
8.0
8.3
83.7
75
or m
ore
5.3
8.4
86.4
Dis
trict
did
not
par
ticip
ate
i
n fre
e or
redu
ced-
pric
e
lun
ch p
rogr
am9.
3!
10.6
!80
.0
Am
ong
dist
ricts
with
mor
e th
an o
ne s
choo
l, pe
rcen
tage
dis
tribu
tion
of p
ublic
sch
ool d
istri
cts,
by
spec
ific
agre
emen
ts w
ith p
rinci
pals
' ass
ocia
tions
or u
nion
san
d se
lect
ed p
ublic
sch
ool d
istri
ct c
hara
cter
istic
s: 2
007-
08P
erce
ntag
e di
strib
utio
n of
dis
trict
s th
at h
ad a
spe
cific
agr
eem
ent w
ith a
prin
cipa
ls' a
ssoc
iatio
n or
uni
on
1 Col
lect
ive
barg
aini
ng a
gree
men
ts a
re le
gally
-bin
ding
agr
eem
ents
.! I
nter
pret
dat
a w
ith c
autio
n. T
he s
tand
ard
erro
r for
this
est
imat
e is
equ
al to
30
perc
ent o
r mor
e of
the
estim
ate'
s va
lue.
SO
UR
CE
: U.S
. Dep
artm
ent o
f Edu
catio
n, N
atio
nal C
ente
r for
Edu
catio
n S
tatis
tics,
Sch
ools
and
Sta
ffing
Sur
vey
(SA
SS
), "P
ublic
Sch
ool D
istri
ct D
ata
File
," 20
07-0
8.
aske
d ab
out p
rinci
pal s
alar
y sc
hedu
les,
spe
cific
agr
eem
ents
with
prin
cipa
l uni
ons,
prin
cipa
l hiri
ng, n
umbe
r of c
ontra
ct d
ays
for p
rinci
pals
, prin
cipa
l ten
ure,
or t
rain
ing
2 Mee
t-and
-con
fer d
iscu
ssio
ns a
re fo
r the
pur
pose
of r
each
ing
non-
lega
lly-b
indi
ng a
gree
men
ts.
3 Thi
s ca
tego
ry in
clud
es b
oth
no a
gree
men
ts a
nd o
ther
agr
eem
ents
that
do
not m
eet t
he p
reci
se le
gal d
efin
ition
s of
col
lect
ive
barg
aini
ng a
nd m
eet-a
nd-c
onfe
r agr
eem
ents
.N
OTE
: Dis
trict
s w
ith o
nly
one
scho
ol, i
nclu
ding
sin
gle
tradi
tiona
l pub
lic s
choo
ls a
nd p
ublic
cha
rter s
choo
ls th
at o
pera
te in
depe
nden
tly o
f a re
gula
r sch
ool d
istri
ct, w
ere
not
prog
ram
s fo
r asp
iring
sch
ool a
dmin
istra
tors
. Est
imat
es in
this
tabl
e ar
e ba
sed
on 6
8 pe
rcen
t of a
ll di
stric
ts. D
etai
l may
not
sum
to to
tals
bec
ause
of r
ound
ing.
17

18
Tabl
e 12
.Ta
ble
12.
Tabl
e 12
.A
vera
ge n
umbe
r of d
ays
inP
erce
nt o
f dis
trict
s th
atP
erce
nt o
f dis
trict
s th
at h
ad a
Sel
ecte
d pu
blic
sch
ool
Per
cent
of p
rinci
pals
the
norm
al c
ontra
ct y
ear
had
a te
nure
sys
tem
train
ing
prog
ram
for a
spiri
ngdi
stric
t cha
ract
eris
ticw
ho w
ere
new
ly h
ired
for p
rinci
pals
1 fo
r prin
cipa
lssc
hool
adm
inis
trato
rs
All
dist
ricts
with
mor
e th
an o
ne s
choo
l9.
322
725
.423
.8
Dis
trict
siz
e 2
-3 s
choo
ls14
.022
625
.214
.2 4
-5 s
choo
ls11
.322
824
.118
.9 6
-9 s
choo
ls11
.222
827
.023
.2 1
0-19
sch
ools
10.0
227
26.6
42.1
20
or m
ore
scho
ols
6.1
228
24.2
66.8
Com
mun
ity ty
pe C
ity6.
822
727
.951
.6 S
ubur
ban
8.3
232
36.1
30.0
Tow
n11
.922
522
.321
.4 R
ural
11.7
226
20.5
17.1
Dis
trict
K-1
2 en
rollm
ent
Les
s th
an 2
5011
.3!
217
15.3
11.8
250
-999
14
.722
318
.412
.9 1
,000
-1,9
99
12.4
230
29.5
18.0
2,0
00-4
,999
10
.823
029
.424
.2 5
,000
-9,9
99
9.7
229
29.7
38.8
10,
000
or m
ore
6.3
228
24.2
66.6
Per
cent
of K
-12
stud
ents
in
dist
rict w
ho w
ere
appr
oved
for
fre
e or
redu
ced-
pric
e lu
nche
s 0
-34
9.4
229
31.5
20.9
35-
498.
622
524
.926
.0 5
0-74
9.6
226
18.2
25.8
75
or m
ore
8.9
227
17.7
29.7
Dis
trict
did
not
par
ticip
ate
i
n fre
e or
redu
ced-
pric
e
lun
ch p
rogr
am10
.823
915
.9!
17.7
!
SO
UR
CE
: U.S
. Dep
artm
ent o
f Edu
catio
n, N
atio
nal C
ente
r for
Edu
catio
n S
tatis
tics,
Sch
ools
and
Sta
ffing
Sur
vey
(SA
SS
), "P
ublic
Sch
ool D
istri
ct D
ata
File
," 20
07-0
8.
1 Incl
udes
pro
fess
iona
l dev
elop
men
t, st
uden
t con
tract
day
s, a
nd o
ther
day
s co
vere
d in
a ty
pica
l con
tract
.
Am
ong
dist
ricts
with
mor
e th
an o
ne s
choo
l, pe
rcen
tage
of p
rinci
pals
who
wer
e ne
wly
hire
d, a
vera
ge n
umbe
r of d
ays
in th
e no
rmal
con
tract
yea
r for
prin
cipa
ls,
publ
ic s
choo
l dis
trict
cha
ract
eris
tics:
200
7-08
perc
enta
ge o
f dis
trict
s th
at h
ad a
tenu
re s
yste
m fo
r prin
cipa
ls, a
nd p
erce
ntag
e of
dis
trict
s th
at h
ad a
trai
ning
pro
gram
for a
spiri
ng s
choo
l adm
inis
trato
rs, b
y se
lect
ed
NO
TE: D
istri
cts
with
onl
y on
e sc
hool
, inc
ludi
ng s
ingl
e tra
ditio
nal p
ublic
sch
ools
and
pub
lic c
harte
r sch
ools
that
ope
rate
inde
pend
ently
of a
regu
lar s
choo
l dis
trict
, wer
e no
t ask
ed
scho
ol a
dmin
istra
tors
. Est
imat
es in
this
tabl
e ar
e ba
sed
on 6
8 pe
rcen
t of a
ll di
stric
ts.
abou
t prin
cipa
l sal
ary
sche
dule
s, s
peci
fic a
gree
men
ts w
ith p
rinci
pal u
nion
s, p
rinci
pal h
iring
, num
ber o
f con
tract
day
s fo
r prin
cipa
ls, p
rinci
pal t
enur
e, o
r tra
inin
g pr
ogra
ms
for a
spiri
ng
! Int
erpr
et d
ata
with
cau
tion.
The
sta
ndar
d er
ror f
or th
is e
stim
ate
is e
qual
to 3
0 pe
rcen
t or m
ore
of th
e es
timat
e's
valu
e.

Appendix A: Standard Error Tables
A-1
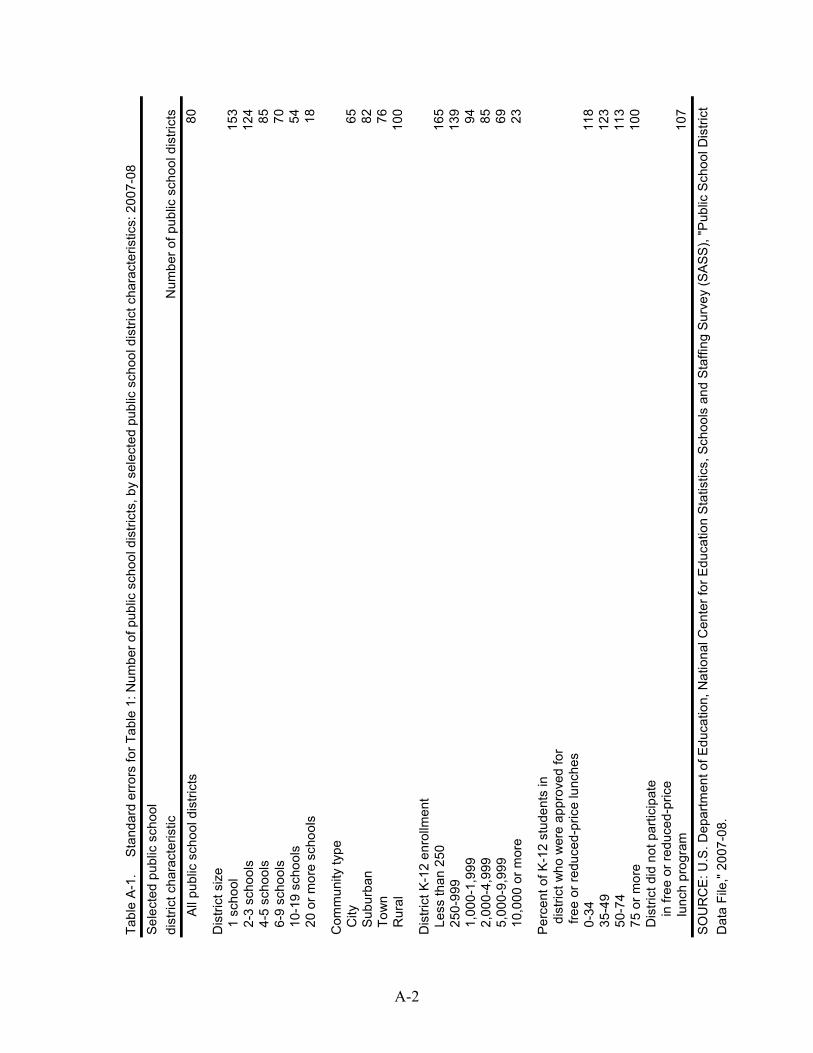
Tabl
e A
-1.
Sele
cted
pub
lic s
choo
ldi
stric
t cha
ract
eris
ticN
umbe
r of p
ublic
sch
ool d
istri
cts
A
ll pu
blic
sch
ool d
istri
cts
80
Dis
trict
siz
e 1
sch
ool
153
2-3
sch
ools
124
4-5
sch
ools
85 6
-9 s
choo
ls70
10-
19 s
choo
ls54
20
or m
ore
scho
ols
18
Com
mun
ity ty
pe C
ity65
Sub
urba
n82
Tow
n76
Rur
al10
0
Dis
trict
K-1
2 en
rollm
ent
Les
s th
an 2
5016
5 2
50-9
9913
9 1
,000
-1,9
9994
2,0
00-4
,999
85
5,0
00-9
,999
69 1
0,00
0 or
mor
e 23
0-3
411
8 3
5-49
123
50-
7411
310
0
107
Dis
trict
did
not
par
ticip
ate
i
n fre
e or
redu
ced-
pric
e
Dat
a Fi
le,"
2007
-08.
SO
UR
CE
: U.S
. Dep
artm
ent o
f Edu
catio
n, N
atio
nal C
ente
r for
Edu
catio
n S
tatis
tics,
Sch
ools
and
Sta
ffing
Sur
vey
(SA
SS
), "P
ublic
Sch
ool D
istri
ct
Sta
ndar
d er
rors
for T
able
1: N
umbe
r of p
ublic
sch
ool d
istri
cts,
by
sele
cted
pub
lic s
choo
l dis
trict
cha
ract
eris
tics:
200
7-08
l
unch
pro
gram
Perc
ent o
f K-1
2 st
uden
ts in
di
stric
t who
wer
e ap
prov
ed fo
r
free
or re
duce
d-pr
ice
lunc
hes
75
or m
ore
A-2
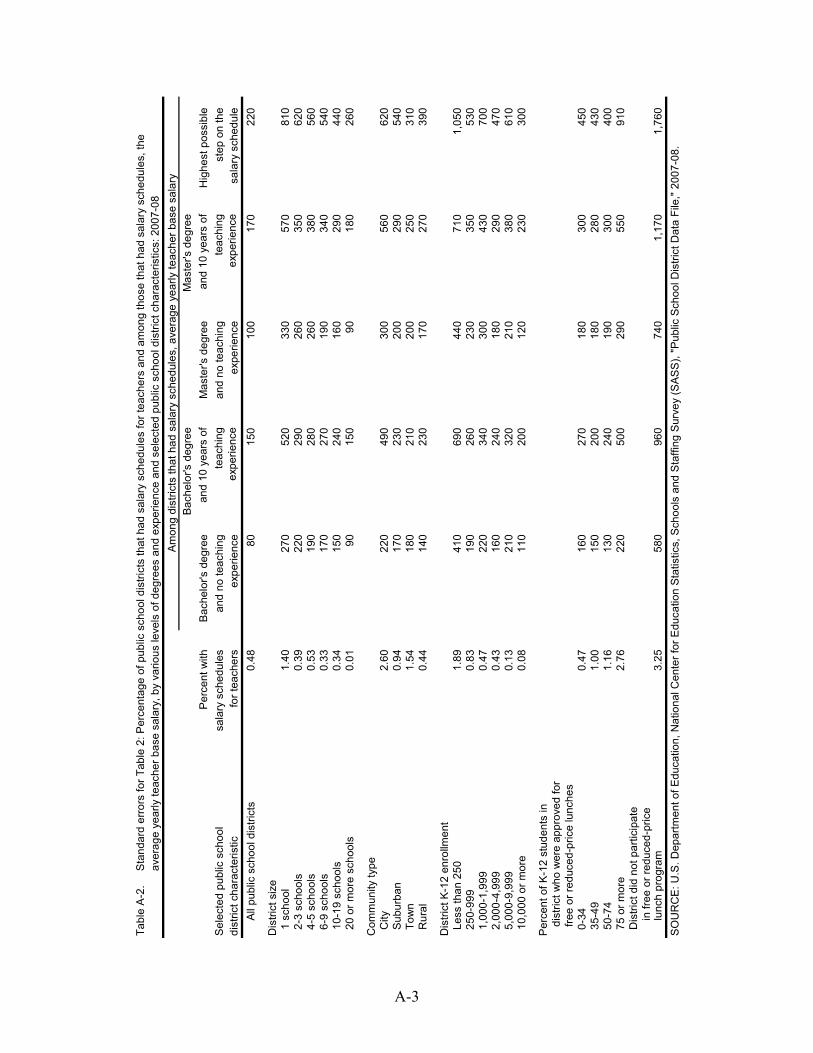
Tabl
e A
-2.
Tabl
e A
-2.
Bach
elor
's d
egre
e M
aste
r's d
egre
e P
erce
nt w
ithB
ache
lor's
deg
ree
and
10 y
ears
of
Mas
ter's
deg
ree
and
10 y
ears
of
Hig
hest
pos
sibl
esa
lary
sch
edul
esan
d no
teac
hing
teac
hing
and
no te
achi
ngte
achi
ngst
ep o
n th
efo
r tea
cher
sex
perie
nce
expe
rienc
eex
perie
nce
expe
rienc
esa
lary
sch
edul
e
All
publ
ic s
choo
l dis
trict
s0.
4880
150
100
170
220
Dis
trict
siz
e 1
sch
ool
1.40
270
520
330
570
810
2-3
sch
ools
0.39
220
290
260
350
620
4-5
sch
ools
0.53
190
280
260
380
560
6-9
sch
ools
0.33
170
270
190
340
540
10-
19 s
choo
ls0.
3415
024
016
029
044
0 2
0 or
mor
e sc
hool
s0.
0190
150
9018
026
0
Com
mun
ity ty
pe C
ity2.
6022
049
030
056
062
0 S
ubur
ban
0.94
170
230
200
290
540
Tow
n1.
5418
021
020
025
031
0 R
ural
0.44
140
230
170
270
390
Dis
trict
K-1
2 en
rollm
ent
Les
s th
an 2
501.
8941
069
044
071
01,
050
250
-999
0.
8319
026
023
035
053
0 1
,000
-1,9
99
0.47
220
340
300
430
700
2,0
00-4
,999
0.
4316
024
018
029
047
0 5
,000
-9,9
990.
1321
032
021
038
061
0 1
0,00
0 or
mor
e 0.
0811
020
012
023
030
0
Per
cent
of K
-12
stud
ents
in
dist
rict w
ho w
ere
appr
oved
for
fre
e or
redu
ced-
pric
e lu
nche
s 0
-34
0.47
160
270
180
300
450
35-
491.
0015
020
018
028
043
0 5
0-74
1.16
130
240
190
300
400
75
or m
ore
2.76
220
500
290
550
910
Dis
trict
did
not
par
ticip
ate
i
n fre
e or
redu
ced-
pric
e
lun
ch p
rogr
am3.
2558
096
074
01,
170
1,76
0
Sta
ndar
d er
rors
for T
able
2: P
erce
ntag
e of
pub
lic s
choo
l dis
trict
s th
at h
ad s
alar
y sc
hedu
les
for t
each
ers
and
amon
g th
ose
that
had
sal
ary
sche
dule
s, th
eav
erag
e ye
arly
teac
her b
ase
sala
ry, b
y va
rious
leve
ls o
f deg
rees
and
exp
erie
nce
and
sele
cted
pub
lic s
choo
l dis
trict
cha
ract
eris
tics:
200
7-08
Am
ong
dist
ricts
that
had
sal
ary
sche
dule
s, a
vera
ge y
early
teac
her b
ase
sala
ry
SO
UR
CE
: U.S
. Dep
artm
ent o
f Edu
catio
n, N
atio
nal C
ente
r for
Edu
catio
n St
atis
tics,
Sch
ools
and
Sta
ffing
Sur
vey
(SAS
S),
"Pub
lic S
choo
l Dis
trict
Dat
a Fi
le,"
2007
-08.
Sel
ecte
d pu
blic
sch
ool
dist
rict c
hara
cter
istic
A-3

Tabl
e A
-3.
Tabl
e A
-3.
scho
ol d
istri
ct c
hara
cter
istic
s: 2
007-
08
Base
sal
ary
of th
e lo
wes
t pai
dBa
se s
alar
y of
the
high
est p
aid
A
ll pu
blic
sch
ool d
istri
cts
180
180
Dis
trict
siz
e 1
sch
ool
600
650
2-3
sch
ools
220
610
4-5
sch
ools
220
620
6-9
sch
ools
180
570
10-
19 s
choo
ls16
043
0 2
0 or
mor
e sc
hool
s90
260
Com
mun
ity ty
pe C
ity27
060
0 S
ubur
ban
190
590
Tow
n22
050
0 R
ural
390
280
Dis
trict
K-1
2 en
rollm
ent
Les
s th
an 2
5094
092
0 2
50-9
99
200
490
1,0
00-1
,999
23
065
0 2
,000
-4,9
99
180
520
5,0
00-9
,999
220
690
10,
000
or m
ore
110
320
Per
cent
of K
-12
stud
ents
in
dist
rict w
ho w
ere
appr
oved
for
fre
e or
redu
ced-
pric
e lu
nche
s 0
-34
280
400
35-
4916
043
0 5
0-74
180
430
75
or m
ore
1,56
01,
240
Dis
trict
did
not
par
ticip
ate
i
n fre
e or
redu
ced-
pric
e
lun
ch p
rogr
am59
01,
580
2007
-08.
Sta
ndar
d er
rors
for T
able
3: A
vera
ge lo
wes
t and
hig
hest
yea
rly b
ase
sala
ries
paid
to fu
ll-tim
e te
ache
rs a
mon
g al
l dis
trict
s, b
y se
lect
ed p
ublic
SO
UR
CE
: U.S
. Dep
artm
ent o
f Edu
catio
n, N
atio
nal C
ente
r for
Edu
catio
n S
tatis
tics,
Sch
ools
and
Sta
ffing
Sur
vey
(SAS
S),
"Pub
lic S
choo
l Dis
trict
Dat
a Fi
le,"
dist
rict c
hara
cter
istic
Sel
ecte
d pu
blic
sch
ool
A-4
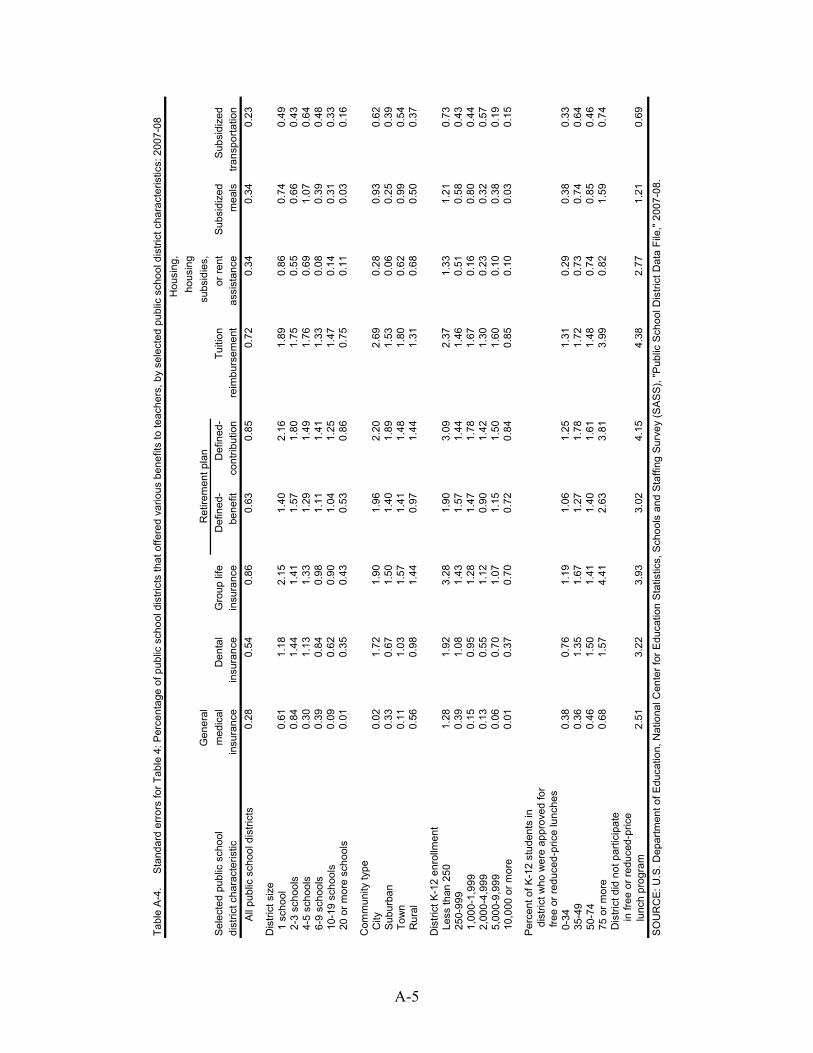
Tabl
e A
-4.
Hou
sing
,ho
usin
gG
ener
alsu
bsid
ies,
med
ical
Den
tal
Gro
up li
feD
efin
ed-
Def
ined
-Tu
ition
or re
ntS
ubsi
dize
dS
ubsi
dize
din
sura
nce
insu
ranc
ein
sura
nce
bene
fitco
ntrib
utio
nre
imbu
rsem
ent
assi
stan
cem
eals
trans
porta
tion
A
ll pu
blic
sch
ool d
istri
cts
0.28
0.54
0.86
0.63
0.85
0.72
0.34
0.34
0.23
Dis
trict
siz
e 1
sch
ool
0.61
1.18
2.15
1.40
2.16
1.89
0.86
0.74
0.49
2-3
sch
ools
0.84
1.44
1.41
1.57
1.80
1.75
0.55
0.66
0.43
4-5
sch
ools
0.30
1.13
1.33
1.29
1.49
1.76
0.69
1.07
0.64
6-9
sch
ools
0.39
0.84
0.98
1.11
1.41
1.33
0.08
0.39
0.48
10-
19 s
choo
ls0.
090.
620.
901.
041.
251.
470.
140.
310.
33 2
0 or
mor
e sc
hool
s0.
010.
350.
430.
530.
860.
750.
110.
030.
16
Com
mun
ity ty
pe C
ity0.
021.
721.
901.
962.
202.
690.
280.
930.
62 S
ubur
ban
0.33
0.67
1.50
1.40
1.89
1.53
0.06
0.25
0.39
Tow
n0.
111.
031.
571.
411.
481.
800.
620.
990.
54 R
ural
0.56
0.98
1.44
0.97
1.44
1.31
0.68
0.50
0.37
Dis
trict
K-1
2 en
rollm
ent
Les
s th
an 2
501.
281.
923.
281.
903.
092.
371.
331.
210.
73 2
50-9
99
0.39
1.08
1.43
1.57
1.44
1.46
0.51
0.58
0.43
1,0
00-1
,999
0.
150.
951.
281.
471.
781.
670.
160.
800.
44 2
,000
-4,9
99
0.13
0.55
1.12
0.90
1.42
1.30
0.23
0.32
0.57
5,0
00-9
,999
0.06
0.70
1.07
1.15
1.50
1.60
0.10
0.38
0.19
10,
000
or m
ore
0.01
0.37
0.70
0.72
0.84
0.85
0.10
0.03
0.15
Per
cent
of K
-12
stud
ents
in
dist
rict w
ho w
ere
appr
oved
for
fre
e or
redu
ced-
pric
e lu
nche
s 0
-34
0.38
0.76
1.19
1.06
1.25
1.31
0.29
0.38
0.33
35-
490.
361.
351.
671.
271.
781.
720.
730.
740.
64 5
0-74
0.46
1.50
1.41
1.40
1.61
1.48
0.74
0.85
0.46
75
or m
ore
0.68
1.57
4.41
2.63
3.81
3.99
0.82
1.59
0.74
Dis
trict
did
not
par
ticip
ate
i
n fre
e or
redu
ced-
pric
e
lun
ch p
rogr
am2.
513.
223.
933.
024.
154.
382.
771.
210.
69
SO
UR
CE
: U.S
. Dep
artm
ent o
f Edu
catio
n, N
atio
nal C
ente
r for
Edu
catio
n S
tatis
tics,
Sch
ools
and
Sta
ffing
Sur
vey
(SA
SS
), "P
ublic
Sch
ool D
istri
ct D
ata
File
," 20
07-0
8.
Sta
ndar
d er
rors
for T
able
4: P
erce
ntag
e of
pub
lic s
choo
l dis
trict
s th
at o
ffere
d va
rious
ben
efits
to te
ache
rs, b
y se
lect
ed p
ublic
sch
ool d
istri
ct c
hara
cter
istic
s: 2
007-
08
Ret
irem
ent p
lan
Sel
ecte
d pu
blic
sch
ool
dist
rict c
hara
cter
istic
A-5
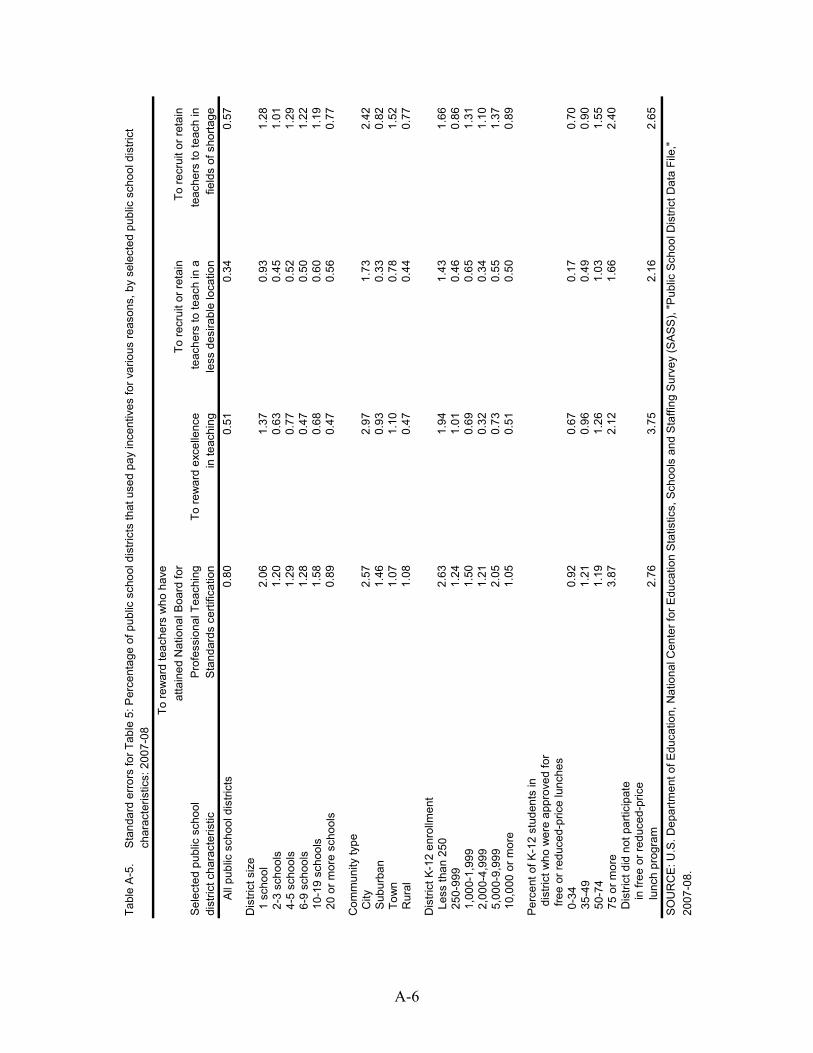
Tabl
e A
-5.
Tabl
e A
-5.
To re
war
d te
ache
rs w
ho h
ave
atta
ined
Nat
iona
l Boa
rd fo
rTo
recr
uit o
r ret
ain
To re
crui
t or r
etai
nP
rofe
ssio
nal T
each
ing
To re
war
d ex
celle
nce
teac
hers
to te
ach
in a
teac
hers
to te
ach
inSt
anda
rds
certi
ficat
ion
in te
achi
ngle
ss d
esira
ble
loca
tion
field
s of
sho
rtage
A
ll pu
blic
sch
ool d
istri
cts
0.80
0.51
0.34
0.57
Dis
trict
siz
e 1
sch
ool
2.06
1.37
0.93
1.28
2-3
sch
ools
1.20
0.63
0.45
1.01
4-5
sch
ools
1.29
0.77
0.52
1.29
6-9
sch
ools
1.28
0.47
0.50
1.22
10-
19 s
choo
ls1.
580.
680.
601.
19 2
0 or
mor
e sc
hool
s0.
890.
470.
560.
77
Com
mun
ity ty
pe C
ity2.
572.
971.
732.
42 S
ubur
ban
1.46
0.93
0.33
0.82
Tow
n1.
071.
100.
781.
52 R
ural
1.08
0.47
0.44
0.77
Dis
trict
K-1
2 en
rollm
ent
Les
s th
an 2
502.
631.
941.
431.
66 2
50-9
99
1.24
1.01
0.46
0.86
1,0
00-1
,999
1.
500.
690.
651.
31 2
,000
-4,9
99
1.21
0.32
0.34
1.10
5,0
00-9
,999
2.05
0.73
0.55
1.37
10,
000
or m
ore
1.05
0.51
0.50
0.89
Per
cent
of K
-12
stud
ents
in
dist
rict w
ho w
ere
appr
oved
for
fre
e or
redu
ced-
pric
e lu
nche
s 0
-34
0.92
0.67
0.17
0.70
35-
491.
210.
960.
490.
90 5
0-74
1.19
1.26
1.03
1.55
75
or m
ore
3.87
2.12
1.66
2.40
Dis
trict
did
not
par
ticip
ate
i
n fre
e or
redu
ced-
pric
e
lun
ch p
rogr
am2.
763.
752.
162.
65
2007
-08.
SO
UR
CE
: U.S
. Dep
artm
ent o
f Edu
catio
n, N
atio
nal C
ente
r for
Edu
catio
n S
tatis
tics,
Sch
ools
and
Sta
ffing
Sur
vey
(SA
SS),
"Pub
lic S
choo
l Dis
trict
Dat
a Fi
le,"
Sta
ndar
d er
rors
for T
able
5: P
erce
ntag
e of
pub
lic s
choo
l dis
trict
s th
at u
sed
pay
ince
ntiv
es fo
r var
ious
reas
ons,
by
sele
cted
pub
lic s
choo
l dis
trict
Sele
cted
pub
lic s
choo
l
char
acte
ristic
s: 2
007-
08
dist
rict c
hara
cter
istic
A-6

Tabl
e A
-6.
Tabl
e A
-6.
Tabl
e A
-6.
Ave
rage
num
ber o
f P
erce
nt o
f dis
trict
ste
ache
rs w
ho w
ere
that
offe
red
free
train
ing
Forg
iven
ess
ofFi
nder
's fe
e to
new
ly h
ired
for g
rade
sfo
r tea
cher
s in
fiel
dsst
uden
t loa
n(s)
exis
ting
staf
fK
-12
and
com
para
ble
with
cur
rent
or
Sig
ning
fund
ed b
yR
eloc
atio
nfo
r new
ungr
aded
leve
lsan
ticip
ated
sho
rtage
sbo
nuse
sth
e di
stric
tas
sist
ance
teac
her r
efer
rals
A
ll pu
blic
sch
ool d
istri
cts
0.37
0.72
0.36
0.24
0.23
0.21
Dis
trict
siz
e 1
sch
ool
0.11
1.82
0.74
0.55
0.61
0.60
2-3
sch
ools
0.21
1.47
0.50
0.22
0.40
0.11
4-5
sch
ools
0.38
1.96
0.85
0.19
0.26
0.16
6-9
sch
ools
0.64
1.20
0.67
0.93
0.38
0.25
10-
19 s
choo
ls0.
981.
210.
850.
430.
520.
27 2
0 or
mor
e sc
hool
s3.
000.
800.
710.
250.
400.
15
Com
mun
ity ty
pe C
ity1.
802.
561.
041.
040.
861.
08 S
ubur
ban
1.20
1.64
0.34
0.20
0.15
0.66
Tow
n0.
741.
660.
740.
160.
360.
66 R
ural
0.19
1.19
0.54
0.41
0.43
0.16
Dis
trict
K-1
2 en
rollm
ent
Les
s th
an 2
500.
112.
301.
010.
740.
770.
68 2
50-9
99
0.13
1.44
0.63
0.48
0.39
0.39
1,0
00-1
,999
0.
261.
640.
520.
190.
360.
21 2
,000
-4,9
99
0.37
1.35
0.44
0.30
0.38
0.22
5,0
00-9
,999
1.11
1.32
1.26
0.45
0.50
0.36
10,
000
or m
ore
3.01
0.93
0.78
0.38
0.36
0.13
Per
cent
of K
-12
stud
ents
in
dist
rict w
ho w
ere
appr
oved
for
fre
e or
redu
ced-
pric
e lu
nche
s 0
-34
0.52
0.97
0.29
0.11
0.28
0.09
35-
490.
891.
750.
540.
220.
640.
21 5
0-74
0.80
1.61
0.98
0.32
0.45
0.58
75
or m
ore
1.41
2.70
1.53
2.05
0.90
0.96
Dis
trict
did
not
par
ticip
ate
i
n fre
e or
redu
ced-
pric
e
lun
ch p
rogr
am0.
473.
891.
280.
311.
122.
18
SO
UR
CE
: U.S
. Dep
artm
ent o
f Edu
catio
n, N
atio
nal C
ente
r for
Edu
catio
n S
tatis
tics,
Sch
ools
and
Sta
ffing
Sur
vey
(SA
SS
), "P
ublic
Sch
ool D
istri
ct D
ata
File
," 20
07-0
8.
Sta
ndar
d er
rors
for T
able
6: A
vera
ge n
umbe
r of p
ublic
sch
ool t
each
ers
who
wer
e ne
wly
hire
d fo
r gra
des
K-1
2 an
d co
mpa
rabl
e un
grad
ed le
vels
, per
cent
age
of
new
teac
hers
, by
sele
cted
pub
lic s
choo
l dis
trict
cha
ract
eris
tics:
200
7-08
Per
cent
of d
istri
cts
that
use
d va
rious
met
hods
for r
ecru
iting
new
teac
hers
Sel
ecte
d pu
blic
sch
ool
dist
rict c
hara
cter
istic
dist
ricts
that
offe
red
free
train
ing
for t
each
ers
in fi
elds
with
cur
rent
or a
ntic
ipat
ed s
horta
ges,
and
per
cent
age
of d
istri
cts
that
use
d va
rious
met
hods
for r
ecru
iting
A-7
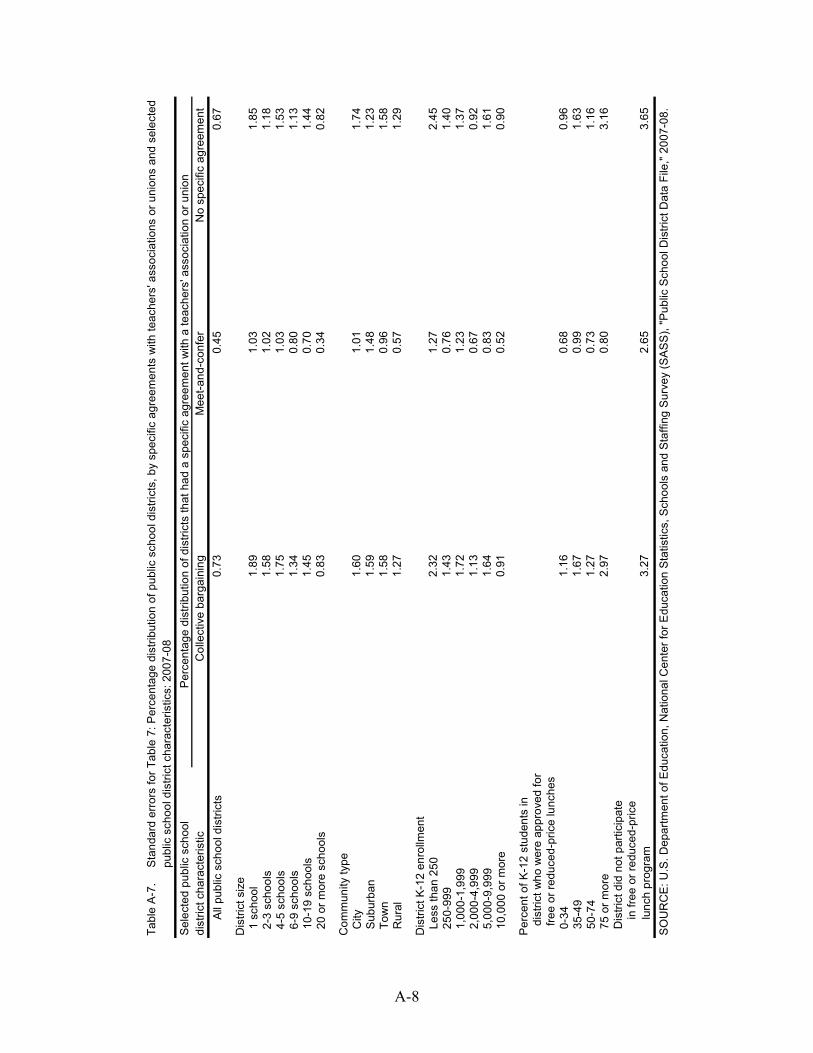
Tabl
e A
-7.
Tabl
e A
-6.
publ
ic s
choo
l dis
trict
cha
ract
eris
tics:
200
7-08
Col
lect
ive
barg
aini
ngM
eet-a
nd-c
onfe
rN
o sp
ecifi
c ag
reem
ent
A
ll pu
blic
sch
ool d
istri
cts
0.73
0.45
0.67
Dis
trict
siz
e 1
sch
ool
1.89
1.03
1.85
2-3
sch
ools
1.58
1.02
1.18
4-5
sch
ools
1.75
1.03
1.53
6-9
sch
ools
1.34
0.80
1.13
10-
19 s
choo
ls1.
450.
701.
44 2
0 or
mor
e sc
hool
s0.
830.
340.
82
Com
mun
ity ty
pe C
ity1.
601.
011.
74 S
ubur
ban
1.59
1.48
1.23
Tow
n1.
580.
961.
58 R
ural
1.27
0.57
1.29
Dis
trict
K-1
2 en
rollm
ent
Les
s th
an 2
502.
321.
272.
45 2
50-9
99
1.43
0.76
1.40
1,0
00-1
,999
1.
721.
231.
37 2
,000
-4,9
99
1.13
0.67
0.92
5,0
00-9
,999
1.64
0.83
1.61
10,
000
or m
ore
0.91
0.52
0.90
Per
cent
of K
-12
stud
ents
in
dist
rict w
ho w
ere
appr
oved
for
fre
e or
redu
ced-
pric
e lu
nche
s 0
-34
1.16
0.68
0.96
35-
491.
670.
991.
63 5
0-74
1.27
0.73
1.16
75
or m
ore
2.97
0.80
3.16
Dis
trict
did
not
par
ticip
ate
i
n fre
e or
redu
ced-
pric
e
lun
ch p
rogr
am3.
272.
653.
65
dist
rict c
hara
cter
istic
Sta
ndar
d er
rors
for T
able
7: P
erce
ntag
e di
strib
utio
n of
pub
lic s
choo
l dis
trict
s, b
y sp
ecifi
c ag
reem
ents
with
teac
hers
' ass
ocia
tions
or u
nion
s an
d se
lect
ed
Sel
ecte
d pu
blic
sch
ool
Per
cent
age
dist
ribut
ion
of d
istri
cts
that
had
a s
peci
fic a
gree
men
t with
a te
ache
rs' a
ssoc
iatio
n or
uni
on
SO
UR
CE
: U.S
. Dep
artm
ent o
f Edu
catio
n, N
atio
nal C
ente
r for
Edu
catio
n S
tatis
tics,
Sch
ools
and
Sta
ffing
Sur
vey
(SA
SS
), "P
ublic
Sch
ool D
istri
ct D
ata
File
," 20
07-0
8.
A-8

Tabl
e A
-8.
Tabl
e A
-8.
Tabl
e A
-8.
Aver
age
num
ber o
f tea
cher
s i
n pu
blic
sch
ool d
istri
cts
who
Ave
rage
num
ber
wer
e di
smis
sed
or d
id n
ot
of te
ache
rsha
ve th
eir c
ontra
cts
rene
wed
Teac
hers
with
out t
enur
eTe
ache
rs w
ith te
nure
A
ll pu
blic
sch
ool d
istri
cts
3.23
0.15
0.03
0.14
Dis
trict
siz
e 1
sch
ool
0.78
0.09
0.03
0.08
2-3
sch
ools
1.44
0.19
0.03
0.19
4-5
sch
ools
2.68
0.28
0.06
0.28
6-9
sch
ools
4.10
0.71
0.18
0.62
10-
19 s
choo
ls5.
981.
290.
151.
30 2
0 or
mor
e sc
hool
s26
.53
1.16
0.41
1.02
Com
mun
ity ty
pe C
ity17
.16
0.67
0.11
0.60
Sub
urba
n10
.36
0.52
0.17
0.44
Tow
n6.
060.
330.
040.
32 R
ural
1.39
0.14
0.04
0.13
Dis
trict
K-1
2 en
rollm
ent
Les
s th
an 2
500.
480.
110.
040.
09 2
50-9
99
0.73
0.13
0.02
0.12
1,0
00-1
,999
1.
160.
330.
100.
27 2
,000
-4,9
99
2.27
0.45
0.08
0.44
5,0
00-9
,999
4.48
0.94
0.35
0.87
10,
000
or m
ore
27.5
81.
610.
401.
52
Per
cent
of K
-12
stud
ents
in
dist
rict w
ho w
ere
appr
oved
for
fre
e or
redu
ced-
pric
e lu
nche
s 0
-34
4.53
0.29
0.05
0.28
35-
497.
810.
230.
060.
21 5
0-74
6.78
0.34
0.07
0.32
75
or m
ore
12.3
70.
680.
300.
48 D
istri
ct d
id n
ot p
artic
ipat
e
in
free
or re
duce
d-pr
ice
l
unch
pro
gram
4.04
0.25
0.08
0.23
Stan
dard
erro
rs fo
r Tab
le 8
: Ave
rage
num
ber o
f pub
lic s
choo
l tea
cher
s an
d av
erag
e nu
mbe
r of p
ublic
sch
ool t
each
ers
who
wer
e di
smis
sed
in th
e pr
evio
us y
ear o
r did
not
hav
e th
eir c
ontra
cts
rene
wed
bas
ed o
n po
or p
erfo
rman
ce, b
y te
nure
sta
tus
of te
ache
rs a
nd s
elec
ted
publ
ic s
choo
l dis
trict
Ave
rage
num
ber o
f te
ache
rs in
pub
lic s
choo
ls w
ho w
ere
SO
UR
CE:
U.S
. Dep
artm
ent o
f Edu
catio
n, N
atio
nal C
ente
r for
Edu
catio
n St
atis
tics,
Sch
ools
and
Sta
ffing
Sur
vey
(SAS
S), "
Pub
lic S
choo
l Dis
trict
Dat
a Fi
le,"
2007
-08.
char
acte
ristic
s: 2
007-
08
Sel
ecte
d pu
blic
sch
ool
dist
rict c
hara
cter
istic
dism
isse
d or
did
not
hav
e th
eir c
ontra
cts
rene
wed
, by
tenu
re s
tatu
s
A-9
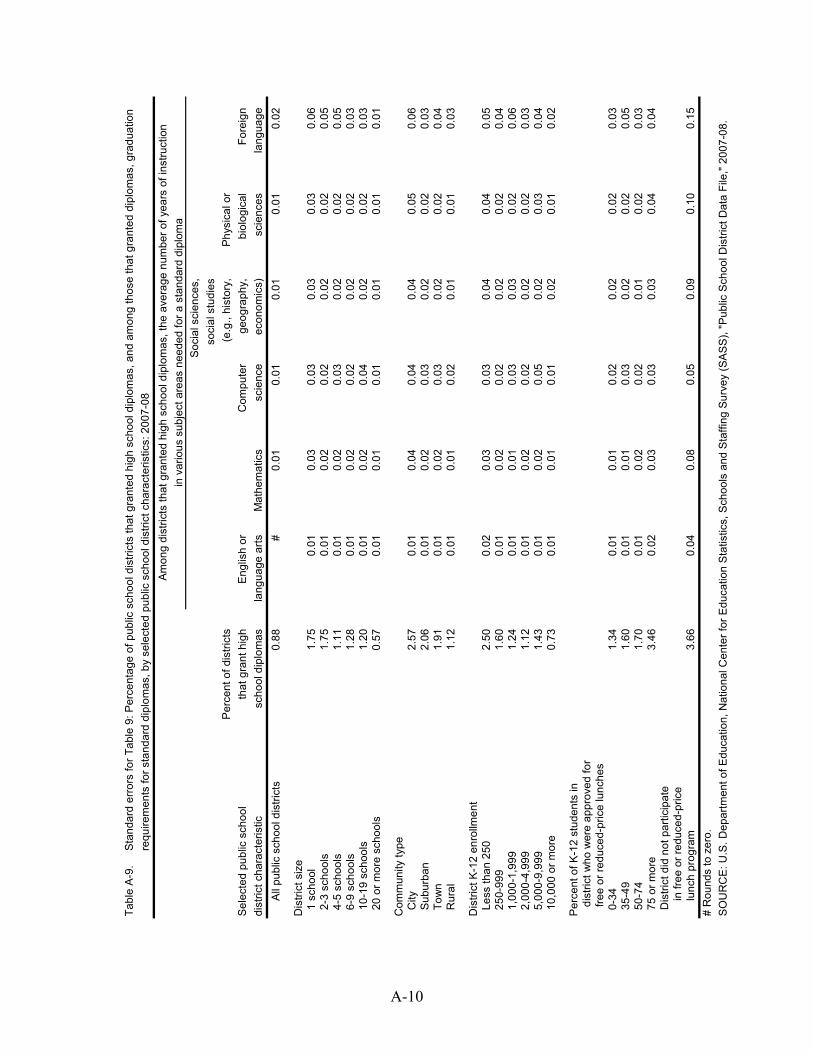
Tabl
e A-
9.Ta
ble
A-9.
Soci
al s
cien
ces,
soci
al s
tudi
esP
erce
nt o
f dis
trict
s(e
.g.,
hist
ory,
Phys
ical
or
Sel
ecte
d pu
blic
sch
ool
that
gra
nt h
igh
Engl
ish
orC
ompu
ter
geog
raph
y,bi
olog
ical
Fore
ign
dist
rict c
hara
cter
istic
scho
ol d
iplo
mas
lang
uage
arts
Mat
hem
atic
ssc
ienc
eec
onom
ics)
sci
ence
sla
ngua
ge
All
publ
ic s
choo
l dis
trict
s0.
88#
0.01
0.01
0.01
0.01
0.02
Dis
trict
siz
e 1
sch
ool
1.75
0.01
0.03
0.03
0.03
0.03
0.06
2-3
sch
ools
1.75
0.01
0.02
0.02
0.02
0.02
0.05
4-5
sch
ools
1.11
0.01
0.02
0.03
0.02
0.02
0.05
6-9
sch
ools
1.28
0.01
0.02
0.02
0.02
0.02
0.03
10-
19 s
choo
ls1.
200.
010.
020.
040.
020.
020.
03 2
0 or
mor
e sc
hool
s0.
570.
010.
010.
010.
010.
010.
01
Com
mun
ity ty
pe C
ity2.
570.
010.
040.
040.
040.
050.
06 S
ubur
ban
2.06
0.01
0.02
0.03
0.02
0.02
0.03
Tow
n1.
910.
010.
020.
030.
020.
020.
04 R
ural
1.12
0.01
0.01
0.02
0.01
0.01
0.03
Dis
trict
K-1
2 en
rollm
ent
Les
s th
an 2
502.
500.
020.
030.
030.
040.
040.
05 2
50-9
99
1.60
0.01
0.02
0.02
0.02
0.02
0.04
1,0
00-1
,999
1.
240.
010.
010.
030.
030.
020.
06 2
,000
-4,9
99
1.12
0.01
0.02
0.02
0.02
0.02
0.03
5,0
00-9
,999
1.
430.
010.
020.
050.
020.
030.
04 1
0,00
0 or
mor
e 0.
730.
010.
010.
010.
020.
010.
02
Per
cent
of K
-12
stud
ents
in
dist
rict w
ho w
ere
appr
oved
for
fre
e or
redu
ced-
pric
e lu
nche
s 0
-34
1.34
0.01
0.01
0.02
0.02
0.02
0.03
35-
491.
600.
010.
010.
030.
020.
020.
05 5
0-74
1.70
0.01
0.02
0.02
0.01
0.02
0.03
75
or m
ore
3.46
0.02
0.03
0.03
0.03
0.04
0.04
Dis
trict
did
not
par
ticip
ate
i
n fre
e or
redu
ced-
pric
e
lun
ch p
rogr
am3.
660.
040.
080.
050.
090.
100.
15#
Rou
nds
to z
ero.
SO
UR
CE
: U.S
. Dep
artm
ent o
f Edu
catio
n, N
atio
nal C
ente
r for
Edu
catio
n St
atis
tics,
Sch
ools
and
Sta
ffing
Sur
vey
(SA
SS)
, "P
ublic
Sch
ool D
istri
ct D
ata
File
," 20
07-0
8.
Stan
dard
erro
rs fo
r Tab
le 9
: Per
cent
age
of p
ublic
sch
ool d
istri
cts
that
gra
nted
hig
h sc
hool
dip
lom
as, a
nd a
mon
g th
ose
that
gra
nted
dip
lom
as, g
radu
atio
n re
quire
men
ts fo
r sta
ndar
d di
plom
as, b
y se
lect
ed p
ublic
sch
ool d
istri
ct c
hara
cter
istic
s: 2
007-
08Am
ong
dist
ricts
that
gra
nted
hig
h sc
hool
dip
lom
as, t
he a
vera
ge n
umbe
r of y
ears
of i
nstru
ctio
nin
var
ious
sub
ject
are
as n
eede
d fo
r a s
tand
ard
dipl
oma
A-10

Tabl
e A
-10.
Tabl
e A
-10.
Sel
ecte
d pu
blic
sch
ool
Per
cent
with
sal
ary
sche
dule
s di
stric
t cha
ract
eris
ticfo
r prin
cipa
lsB
ase
sala
ry o
f the
low
est p
aid
Bas
e sa
lary
of t
he h
ighe
st p
aid
A
ll di
stric
ts w
ith m
ore
than
one
sch
ool
0.73
350
360
Dis
trict
siz
e 2
-3 s
choo
ls1.
5285
093
0 4
-5 s
choo
ls1.
7966
083
0 6
-9 s
choo
ls1.
5661
072
0 1
0-19
sch
ools
1.27
490
570
20
or m
ore
scho
ols
0.54
220
260
Com
mun
ity ty
pe C
ity1.
2468
056
0 S
ubur
ban
1.44
790
800
Tow
n1.
5839
049
0 R
ural
1.12
520
560
Dis
trict
K-1
2 en
rollm
ent
Les
s th
an 2
505.
423,
780
3,72
0 2
50-9
99
1.74
760
920
1,0
00-1
,999
1.
9073
079
0 2
,000
-4,9
99
1.33
630
660
5,0
00-9
,999
1.
6460
065
0 1
0,00
0 or
mor
e 0.
6933
036
0
Per
cent
of K
-12
stud
ents
in
dist
rict w
ho w
ere
appr
oved
for
fre
e or
redu
ced-
pric
e lu
nche
s 0
-34
1.21
570
660
35-
491.
5339
052
0 5
0-74
1.78
540
680
75
or m
ore
3.31
1,35
01,
680
Dis
trict
did
not
par
ticip
ate
i
n fre
e or
redu
ced-
pric
e
lun
ch p
rogr
am9.
494,
850
4,20
0
Sta
ndar
d er
rors
for T
able
10:
Am
ong
dist
ricts
with
mor
e th
an o
ne s
choo
l, pe
rcen
tage
of p
ublic
sch
ool d
istri
cts
that
had
sal
ary
sche
dule
s fo
r prin
cipa
lsan
d av
erag
e lo
wes
t and
hig
hest
yea
rly b
ase
sala
ries
paid
to a
ll fu
ll-tim
e pr
inci
pals
, by
sele
cted
pub
lic s
choo
l dis
trict
cha
ract
eris
tics:
200
7-08
SO
UR
CE
: U.S
. Dep
artm
ent o
f Edu
catio
n, N
atio
nal C
ente
r for
Edu
catio
n S
tatis
tics,
Sch
ools
and
Sta
ffing
Sur
vey
(SA
SS
), "P
ublic
Sch
ool D
istri
ct D
ata
File
," 20
07-0
8.
Ave
rage
low
est a
nd h
ighe
st y
early
bas
e sa
larie
s of
full-
time
prin
cipa
ls
A-11

Tabl
e A
-11.
Tabl
e A
-11.
Sel
ecte
d pu
blic
sch
ool
dist
rict c
hara
cter
istic
Col
lect
ive
barg
aini
ngM
eet-a
nd-c
onfe
rN
o sp
ecifi
c ag
reem
ent
A
ll di
stric
ts w
ith m
ore
than
one
sch
ool
0.47
0.37
0.54
Dis
trict
siz
e 2
-3 s
choo
ls1.
070.
701.
21 4
-5 s
choo
ls1.
220.
941.
53 6
-9 s
choo
ls1.
150.
941.
27 1
0-19
sch
ools
1.06
0.91
1.39
20
or m
ore
scho
ols
0.55
0.59
0.75
Com
mun
ity ty
pe C
ity1.
431.
301.
59 S
ubur
ban
1.33
0.92
1.54
Tow
n0.
940.
741.
24 R
ural
0.77
0.53
0.84
Dis
trict
K-1
2 en
rollm
ent
Les
s th
an 2
500.
920.
491.
04 2
50-9
99
1.11
0.76
1.31
1,0
00-1
,999
1.
351.
201.
70 2
,000
-4,9
99
1.26
0.85
1.23
5,0
00-9
,999
1.
421.
211.
95 1
0,00
0 or
mor
e 0.
670.
710.
86
Per
cent
of K
-12
stud
ents
in
dist
rict w
ho w
ere
appr
oved
for
fre
e or
redu
ced-
pric
e lu
nche
s 0
-34
0.87
0.64
0.93
35-
491.
081.
001.
35 5
0-74
1.06
0.69
1.22
75
or m
ore
0.78
1.20
1.48
Dis
trict
did
not
par
ticip
ate
i
n fre
e or
redu
ced-
pric
e
lun
ch p
rogr
am2.
884.
775.
82
Sta
ndar
d er
rors
for T
able
11:
Am
ong
dist
ricts
with
mor
e th
an o
ne s
choo
l, pe
rcen
tage
dis
tribu
tion
of p
ublic
sch
ool d
istri
cts,
by
spec
ific
agre
emen
ts w
ith
prin
cipa
ls' a
ssoc
iatio
ns o
r uni
ons
and
sele
cted
pub
lic s
choo
l dis
trict
cha
ract
eris
tics:
200
7-08
Per
cent
age
dist
ribut
ion
of d
istri
cts
that
had
a s
peci
fic a
gree
men
t with
a p
rinci
pals
' ass
ocia
tion
or u
nion
SO
UR
CE
: U.S
. Dep
artm
ent o
f Edu
catio
n, N
atio
nal C
ente
r for
Edu
catio
n S
tatis
tics,
Sch
ools
and
Sta
ffing
Sur
vey
(SA
SS
), "P
ublic
Sch
ool D
istri
ct D
ata
File
," 20
07-0
8.
A-12

Tabl
e A
-12.
Tabl
e A
-12.
Tabl
e A
-12.
Ave
rage
num
ber o
f day
s in
Per
cent
of d
istri
cts
that
Per
cent
of d
istri
cts
that
had
aS
elec
ted
publ
ic s
choo
l P
erce
nt o
f prin
cipa
lsth
e no
rmal
con
tract
yea
r h
ad a
tenu
re s
yste
mtra
inin
g pr
ogra
m fo
r asp
iring
dist
rict c
hara
cter
istic
who
wer
e ne
wly
hire
dfo
r prin
cipa
ls fo
r prin
cipa
lssc
hool
adm
inis
trato
rs
All
dist
ricts
with
mor
e th
an o
ne s
choo
l0.
170.
40.
640.
69
Dis
trict
siz
e 2
-3 s
choo
ls0.
760.
81.
381.
22 4
-5 s
choo
ls0.
600.
71.
531.
38 6
-9 s
choo
ls0.
380.
61.
151.
01 1
0-19
sch
ools
0.27
0.5
1.24
1.31
20
or m
ore
scho
ols
0.06
0.4
0.73
0.92
Com
mun
ity ty
pe C
ity0.
150.
82.
051.
89 S
ubur
ban
0.25
0.8
1.75
1.61
Tow
n0.
410.
81.
131.
39 R
ural
0.45
0.6
0.83
1.06
Dis
trict
K-1
2 en
rollm
ent
Les
s th
an 2
503.
563.
22.
502.
48 2
50-9
99
0.98
0.9
1.41
1.52
1,0
00-1
,999
0.
730.
81.
681.
58 2
,000
-4,9
99
0.32
0.6
1.29
1.07
5,0
00-9
,999
0.
310.
81.
581.
52 1
0,00
0 or
mor
e 0.
080.
40.
860.
98
Per
cent
of K
-12
stud
ents
in
dist
rict w
ho w
ere
appr
oved
for
fre
e or
redu
ced-
pric
e lu
nche
s 0
-34
0.23
0.6
1.10
0.96
35-
490.
270.
71.
461.
33 5
0-74
0.32
0.6
1.11
1.21
75
or m
ore
0.42
0.9
1.94
3.05
Dis
trict
did
not
par
ticip
ate
i
n fre
e or
redu
ced-
pric
e
lun
ch p
rogr
am1.
864.
64.
915.
73
adm
inis
trato
rs, b
y se
lect
ed p
ublic
sch
ool d
istri
ct c
hara
cter
istic
s: 2
007-
08
Sta
ndar
d er
rors
for T
able
12:
Am
ong
dist
ricts
with
mor
e th
an o
ne s
choo
l, pe
rcen
tage
of p
rinci
pals
who
wer
e ne
wly
hire
d, a
vera
ge n
umbe
r of d
ays
in th
e no
rmal
co
ntra
ct y
ear f
or p
rinci
pals
, per
cent
age
of d
istri
cts
that
had
a te
nure
sys
tem
for p
rinci
pals
, and
per
cent
age
of d
istri
cts
that
had
a tr
aini
ng p
rogr
am fo
r asp
iring
sch
ool
SO
UR
CE
: U.S
. Dep
artm
ent o
f Edu
catio
n, N
atio
nal C
ente
r for
Edu
catio
n S
tatis
tics,
Sch
ools
and
Sta
ffing
Sur
vey
(SA
SS
), "P
ublic
Sch
ool D
istri
ct D
ata
File
," 20
07-0
8.
A-13

Appendix B: Methodology and Technical Notes
B-1

Overview of the Schools and Staffing Survey
The Schools and Staffing Survey (SASS) is sponsored by the National Center for Education Statistics (NCES) of the Institute of Education Sciences within the U.S. Department of Education and is conducted by the U.S. Census Bureau. SASS is a nationally representative sample survey of public,1 private, and Bureau of Indian Education-funded (BIE) K-12 schools, principals, and teachers in the 50 states and the District of Columbia. School districts associated with public schools and library media centers in public and BIE schools are also part of SASS. SASS has been conducted six times: in school years 1987-88, 1990-91, 1993-94, 1999-2000, 2003-04, and 2007-08.
The 2007-08 SASS consisted of questionnaires for five types of respondents: school districts (public), schools (public, private, and BIE), principals (public, private, and BIE), teachers (public, private, and BIE), and school library media centers (public and BIE). Modified versions of the public principal, public school, and public teacher questionnaires that incorporated wording and questions appropriate for private school settings were sent to private schools. BIE and charter schools and schools in single-school districts received a modified public school questionnaire that included both district and school items. BIE principals, teachers, and library media centers received the same questionnaires as public principals, public teachers, and public school library media centers. The Private School Questionnaire also incorporated the Private School Universe Survey (PSS) items that were collected at the same time as SASS in 2007-08.2 Information from all the surveys can be linked. For the content of the questionnaires, please see http://nces.ed.gov/surveys/sass/question0708.asp. Appendix C of this report provides information about how the SASS data files used to produce this report were created.
SASS was designed to produce national, regional, and state estimates for public elementary and secondary schools, teachers, principals, school districts, and school library media centers; national and regional estimates for public charter and BIE schools, teachers, principals, and school library media centers; and national, regional, and affiliation estimates for private schools, teachers, and principals. Comparisons between public and private schools and their principals and teachers are possible only at the regional and national levels, because private schools were selected for sampling by affiliation strata and region rather than by state.
The teacher survey was designed to support comparisons between new and experienced teachers (3 years or less of experience vs. more than 3 years of experience) at the state level for public school teachers and at the regional or affiliation level for private school teachers.
1 Public schools include traditional public and charter schools. 2 The 2007-08 school year was a survey year for both SASS and PSS. The PSS is administered by NCES every 2 years to all private K-12 schools in the United States. The SASS Private School Questionnaire includes all of the PSS questions so that private schools selected for SASS would not be asked to complete two separate questionnaires.
B-2

This appendix includes information on all components of SASS. For additional information on the specific SASS-related topics discussed in this appendix, consult the Documentation for the 2007-08 Schools and Staffing Survey (Tourkin et al. forthcoming). To access additional general information on SASS or for electronic copies of the questionnaires, go to the SASS home page (http://nces.ed.gov/surveys/sass).
Sampling Frames and Sample Selection
Public and BIE schools. The starting point for the 2007-08 SASS public school and BIE school sampling frame was the preliminary 2005-06 Common Core of Data (CCD) Nonfiscal School Universe data file. The CCD includes regular and nonregular schools (special education, alternative, vocational, or technical), public charter schools, and BIE schools. The sampling frame was adjusted from the CCD in order to fit the definition of a school eligible for SASS. To be eligible for SASS, a school was defined as an institution or part of an institution that provides classroom instruction to students; has one or more teachers to provide instruction; serves students in one or more of grades 1-12 or the ungraded equivalent; and is located in one or more buildings apart from a private home. It was possible for two or more schools to share the same building; in this case, they were treated as different schools if they had different administrators (i.e., principal or school head).
The SASS definition of a school is generally similar to the CCD definition, with some exceptions. SASS is confined to the 50 states plus the District of Columbia and excludes the other jurisdictions and Department of Defense overseas schools. The CCD includes some schools that do not offer teacher-provided classroom instruction in grades 1-12 or the ungraded equivalent. In some instances, schools in the CCD are essentially administrative units that may oversee entities that provide classroom instruction or they may only provide funding and oversight. The CCD schools with the same location, address, and phone number were collapsed during the SASS frame building on the assumption that the respondent would consider them to be one school. Because SASS allows schools to define themselves, Census Bureau staff observed that schools generally report as one entity in situations where the administration of two or more schools on the CCD is the same. A set of rules was applied in certain states to determine in which instances school records should be collapsed together. When school records were collapsed together, the student and teacher counts, grade ranges, and names as reported to the CCD were all modified to reflect the change.
Finally, additional school records were added to the sampling frame. Most of these records were for Career Technical Centers or alternative, special education, or juvenile justice facilities in California, Pennsylvania, New York, and other states. For a detailed list of frame modifications, see the Documentation for the 2007-08 Schools and Staffing Survey (Tourkin et al. forthcoming). After adding, deleting, and collapsing school records, the SASS public school sampling frame consisted of 90,410 traditional public schools, 3,850 public charter schools, and 180 BIE schools.
B-3

The SASS sample is a stratified probability-proportionate-to-size (PPS) sample. With the exception of BIE schools, all schools underwent multiple levels of stratification.3 The sample was allocated so that national-, regional-, and state-level elementary, secondary, and combined public school estimates could be made. The sample was allocated to each state by grade range (elementary, secondary, and combined) and school type (traditional public, public charter, BIE-funded, and schools with high American Indian enrollment). For a full description of the allocation procedure, see the Documentation for the 2007-08 Schools and Staffing Survey (Tourkin et al. forthcoming). Within each stratum, all non-BIE schools were systematically selected using a PPS algorithm. The measure of size used for the schools was the square root of the number of full-time-equivalent teachers reported or imputed for each school during the sampling frame creation. Any school with a measure of size greater than the sampling interval (the inverse of the rate at which the sample is selected) was included in the sample with certainty and thus automatically excluded from the probability sampling operation. (For a more detailed explanation of PPS sampling, consult Sampling Techniques [Cochran 1977].) These sampling procedures resulted in a total public school sample of about 9,800 public schools (including both traditional public and public charter schools) and 180 BIE schools in the 2007-08 SASS.
Private schools. The 2007-08 SASS private school frame was based on the 2005-06 Private School Universe Survey (PSS).4 The PSS is designed to generate biennial data on the total number of private schools, students, and teachers and to build a universe of private schools in the 50 states and the District of Columbia to serve as a sampling frame of private schools for NCES sample surveys, such as SASS. Prior to each PSS collection, NCES updates the list of schools to be included in the PSS by collecting membership lists from private school associations and religious denominations, as well as private school lists from state education departments. This list-frame update is intended to improve coverage of new private schools and private schools previously not included in the PSS. Since the list-frame update for the 2007-08 PSS preceded the SASS frame building, the SASS private school sample frame was augmented with the private schools discovered during the PSS list-frame update. The SASS private school frame also includes schools in the 2005-06 PSS area frame. This area frame includes schools that were overlooked in the list-building operation. In a sample of 124 geographical areas (out of 2,062), local field staff used such resources as local telephone directories, local resource guides, etc., to identify schools. The resultant lists of schools were matched to the PSS list frame, and any school that was not part of the list frame was added as an area frame school.
During the creation of the SASS private school sampling frame, schools with kindergarten as the highest grade level were deleted from the frame. Also, private school records that were missing information necessary for the SASS school sample selection were amended. For example, the school grade range was needed to stratify SASS schools during the private school sampling process. If the data on school grade range were missing, values were assigned in one of four ways: taking information from earlier PSS data, using information from the school’s name (e.g., middle school) to assign a grade 3 BIE schools that fit the SASS definition of a school were included in the 2007-08 SASS public school sample with certainty. 4 For more information about the PSS, see http://nces.ed.gov/surveys/pss.
B-4

range, calling the school to assign a specific grade range, or, as a last resort, assigning a grade level of combined (both elementary and secondary levels). Missing information on school affiliation and student and teacher counts were assigned in a similar manner. After these changes, the private school sampling frame consisted of 28,490 private schools.
Private schools were stratified by affiliation, grade level (elementary, secondary, and combined), and census region (Northeast, Midwest, South, and West). The number of private school affiliation strata was reduced from 17 in 2003-04 to 11 in 2007-08. The current affiliation strata include
Catholic – parochial; Catholic – diocesan; Catholic – private; Baptist; Jewish; Lutheran; Seventh-Day Adventist; Other religious; Nonsectarian – regular; Nonsectarian – special emphasis; and Nonsectarian – special education.
Within each stratum, private schools in the list frame were systematically selected using a PPS algorithm. The measure of size used was the square root of the number of full-time-equivalent teachers. Any school with a measure of size larger than the sampling interval was excluded from the probability sampling process and included in the sample with certainty. About 2,940 private schools were sampled, 2,760 from the list frame and 180 from the 2005-06 PSS area frame.
School districts. Since the SASS sample design calls for schools to be selected first, the school district sample consists of the districts that were associated with the schools in the public school sample. This provides the linkage between the district and the school. However, in Delaware, Florida, Maryland, Nevada, and West Virginia, a different sampling method was used because an earlier simulation study revealed that in these states standard errors were high relative to the sampling rate. To improve the reliability of SASS school district estimates, all districts in these states were included in the sample. Placing all districts in each of these five states in the sample reduced the overall state standard error to zero, if all districts responded. About 5,250 public school districts were pulled into the sample by being associated with sampled public schools.
Teachers. Teachers are defined as staff who teach regularly scheduled classes to students in any of grades K-12. Teacher rosters (i.e., Teacher Listing Forms) were collected from sampled schools, primarily by mail, and compiled at the Census Bureau. This compilation was done on an ongoing basis throughout the roster collection period. Along with the names of teachers, sampled schools were asked to provide information about each teacher’s teaching experience (1-3 years, 4-19 years, and 20 or more years), teaching status (full- or part-time), and subject matter taught (special education, general
B-5

elementary, math, science, English/language arts, social studies, vocational/technical, or other), as well as whether the school felt the teacher would likely be teaching at the same school the following year.
Sampling was also done on an ongoing basis throughout the roster collection period. The Census Bureau first stratified teachers into five teacher types: (1) new teachers expected to be teaching at the same school the next school year, (2) experienced teachers expected to be teaching at the same school the next school year, (3) new teachers expected to leave the next school year, (4) mid-career teachers expected to leave the next school year, and (5) highly experienced teachers expected to leave the next school year. Before teachers were allocated to these strata, schools were first allocated an overall number of teachers to be selected within each school stratum. Sampling rates for teachers varied between the strata listed above. Private school teachers in above category 2 and all teachers in above categories 3-5 were oversampled at different rates. So that a school would not be overburdened by sampling too large a proportion of its teachers, the maximum number of teachers per school was set at 20. About 14 percent of the eligible public schools, 15 percent of the eligible private schools, and 13 percent of eligible BIE schools did not provide teacher lists. For these schools, no teachers were selected. Within each teacher stratum in each school, teachers were selected systematically with equal probability. About 56,360 teachers were sampled, 47,440 from public schools, 750 from BIE schools, and 8,180 from private schools (detail may not sum to totals because of rounding).
Principals. The principal of each sampled school was selected. About 12,910 school principals were sampled (9,800 public, 180 BIE, and 2,940 private) (detail may not sum to totals because of rounding).
Library media centers. A library media center in each sampled public and BIE school was also selected. Private schools were not included in the library media center survey because of NCES budget constraints. About 9,800 public school and 180 BIE school library media centers were sampled.
Data Collection Procedures
Before the administration of the 2007-08 SASS, several changes were made in the survey sample design, questionnaire content, procedures, and methodology. For details on these changes, see the Documentation for the 2007-08 Schools and Staffing Survey (Tourkin et al. forthcoming).
In 2007-08, SASS employed a mail-based survey approach, with subsequent telephone and field follow-up. In preparation for data collection, advance letters were mailed to the sampled schools in September 2007 to verify their addresses. School packages were
B-6

mailed at the beginning of the school year.5 Next, schools were telephoned using a computer-assisted telephone-interviewing (CATI) instrument to verify school information, establish a survey coordinator (who became the main contact person at the school for subsequent communication), and follow up on the Teacher Listing Form. Teacher questionnaires were mailed to schools on a flow basis as teachers were sampled on an ongoing basis from the data provided on the Teacher Listing Form. The field follow-up period was preceded by phone calls from the telephone centers to remind the survey coordinator to have staff complete and return all forms. Individual survey respondents (principal, librarian, and teachers) were also called from the telephone centers and asked to complete the questionnaire by phone. Data collection ended in June 2008.
Data Processing and Imputation
The Census Bureau used both central processing and headquarters staff to check returned questionnaires, capture data, and implement quality control procedures. Questionnaires that had a preliminary classification of a complete interview were submitted to a series of computer edits consisting of a range check, a consistency edit, and a blanking edit.6 After these edits were run and reviewed by analysts, the records were put through another edit to make a final determination as to whether the case was eligible for the survey and whether sufficient data had been collected for the case to be classified as a complete interview.
After the final edits were run, cases with “not-answered” values for items remained. Values were imputed using a two stage process. In the first stage, items were imputed with a valid response using data either from the sample frame, other items in the same SASS questionnaire, or another questionnaire associated with the same school or school district. In addition, data were ratio adjusted in some circumstances so that items were consistent with one another. In the second stage, donor-respondent methods, such as hot-deck imputation, were used. If no suitable donor case could be matched, the few remaining items were imputed with a mean or mode from groups of similar cases. After each stage of imputation, computer edits were run again to verify that the imputed data were consistent with the existing questionnaire data. If that was not the case, an imputed value was blanked out by one of these computer edits due to inconsistency with other data within the same questionnaire or because it was out of the range of acceptable values. In these situations, Census Bureau analysts looked at the items and tried to determine an appropriate value. Imputation flags, indicating which imputation method
5 The SASS school package contained a cover letter to the principal, a cover letter to the survey coordinator, the Teacher Listing Form, the Public School Principal Questionnaire/Private School Principal Questionnaire, the Public School Questionnaire/Public School Questionnaire (With District Items)/Private School Questionnaire, the School Library Media Center Questionnaire (for public and BIE-funded schools only), postage-paid return envelopes, an NCES pamphlet detailing general information about SASS, an NCES brochure detailing some of the findings from the 2003-04 SASS, and the Statistical Abstract of the United States: 2007 CD. 6 Blanking edits delete answers to questions that should not have been filled in (e.g., if a respondent followed a wrong skip pattern).
B-7
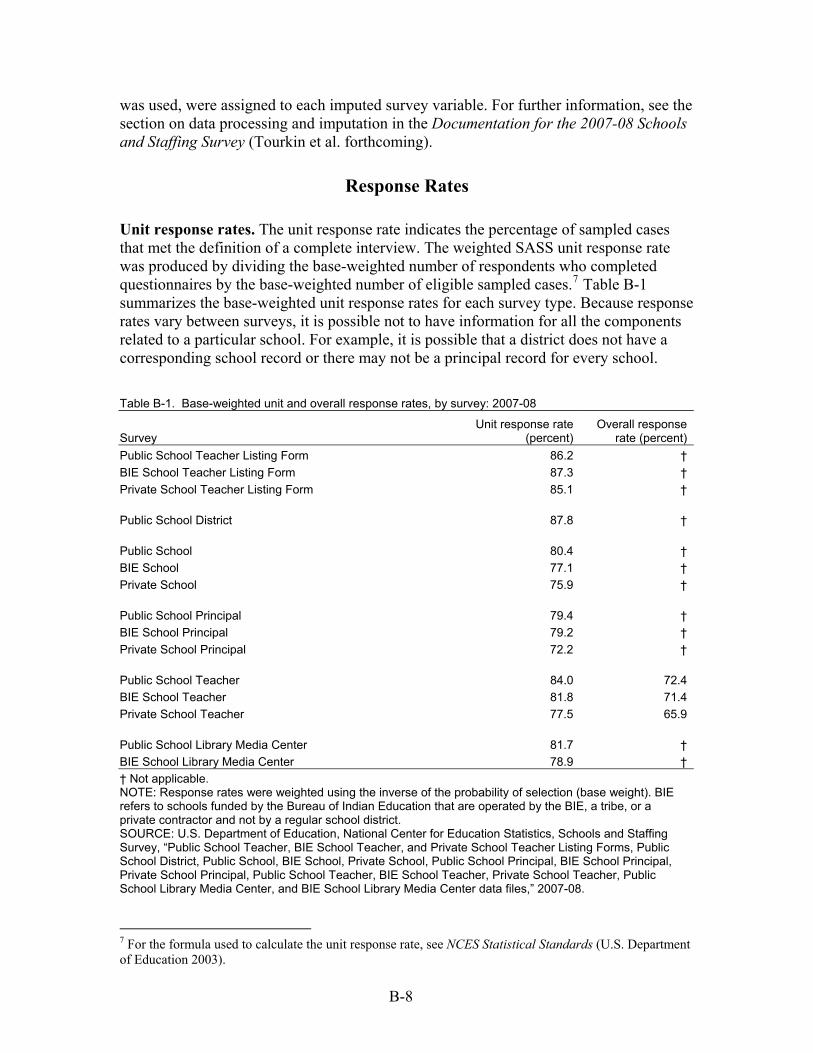
was used, were assigned to each imputed survey variable. For further information, see the section on data processing and imputation in the Documentation for the 2007-08 Schools and Staffing Survey (Tourkin et al. forthcoming).
Response Rates
Unit response rates. The unit response rate indicates the percentage of sampled cases that met the definition of a complete interview. The weighted SASS unit response rate was produced by dividing the base-weighted number of respondents who completed questionnaires by the base-weighted number of eligible sampled cases.7 Table B-1 summarizes the base-weighted unit response rates for each survey type. Because response rates vary between surveys, it is possible not to have information for all the components related to a particular school. For example, it is possible that a district does not have a corresponding school record or there may not be a principal record for every school.
Table B-1. Base-weighted unit and overall response rates, by survey: 2007-08
Survey Unit response rate
(percent) Overall response
rate (percent) Public School Teacher Listing Form 86.2 † BIE School Teacher Listing Form 87.3 † Private School Teacher Listing Form 85.1 † Public School District 87.8 † Public School 80.4 † BIE School 77.1 † Private School 75.9 † Public School Principal 79.4 † BIE School Principal 79.2 † Private School Principal 72.2 † Public School Teacher 84.0 72.4 BIE School Teacher 81.8 71.4 Private School Teacher 77.5 65.9 Public School Library Media Center 81.7 † BIE School Library Media Center 78.9 † † Not applicable. NOTE: Response rates were weighted using the inverse of the probability of selection (base weight). BIE refers to schools funded by the Bureau of Indian Education that are operated by the BIE, a tribe, or a private contractor and not by a regular school district. SOURCE: U.S. Department of Education, National Center for Education Statistics, Schools and Staffing Survey, “Public School Teacher, BIE School Teacher, and Private School Teacher Listing Forms, Public School District, Public School, BIE School, Private School, Public School Principal, BIE School Principal, Private School Principal, Public School Teacher, BIE School Teacher, Private School Teacher, Public School Library Media Center, and BIE School Library Media Center data files,” 2007-08.
7 For the formula used to calculate the unit response rate, see NCES Statistical Standards (U.S. Department of Education 2003).
B-8
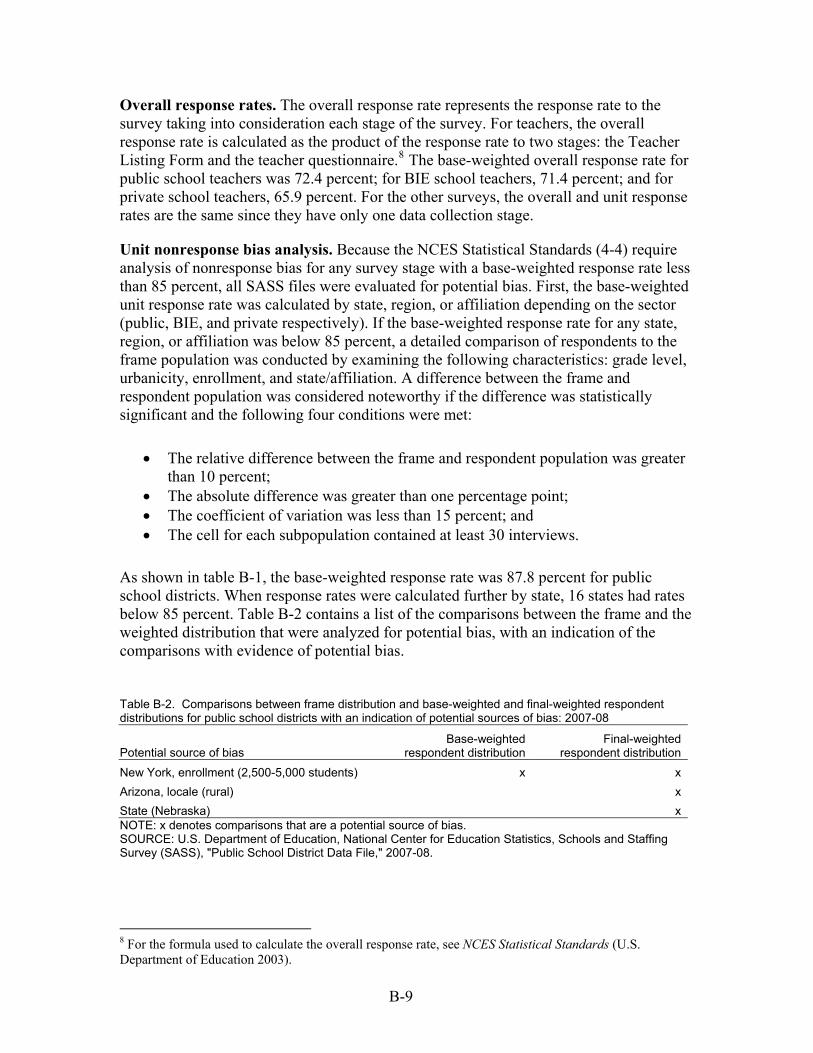
Overall response rates. The overall response rate represents the response rate to the survey taking into consideration each stage of the survey. For teachers, the overall response rate is calculated as the product of the response rate to two stages: the Teacher Listing Form and the teacher questionnaire.8 The base-weighted overall response rate for public school teachers was 72.4 percent; for BIE school teachers, 71.4 percent; and for private school teachers, 65.9 percent. For the other surveys, the overall and unit response rates are the same since they have only one data collection stage.
Unit nonresponse bias analysis. Because the NCES Statistical Standards (4-4) require analysis of nonresponse bias for any survey stage with a base-weighted response rate less than 85 percent, all SASS files were evaluated for potential bias. First, the base-weighted unit response rate was calculated by state, region, or affiliation depending on the sector (public, BIE, and private respectively). If the base-weighted response rate for any state, region, or affiliation was below 85 percent, a detailed comparison of respondents to the frame population was conducted by examining the following characteristics: grade level, urbanicity, enrollment, and state/affiliation. A difference between the frame and respondent population was considered noteworthy if the difference was statistically significant and the following four conditions were met:
• The relative difference between the frame and respondent population was greater than 10 percent;
• The absolute difference was greater than one percentage point; • The coefficient of variation was less than 15 percent; and • The cell for each subpopulation contained at least 30 interviews.
As shown in table B-1, the base-weighted response rate was 87.8 percent for public school districts. When response rates were calculated further by state, 16 states had rates below 85 percent. Table B-2 contains a list of the comparisons between the frame and the weighted distribution that were analyzed for potential bias, with an indication of the comparisons with evidence of potential bias.
Table B-2. Comparisons between frame distribution and base-weighted and final-weighted respondent distributions for public school districts with an indication of potential sources of bias: 2007-08
Potential source of bias Base-weighted
respondent distribution Final-weighted
respondent distribution New York, enrollment (2,500-5,000 students) x x Arizona, locale (rural) x State (Nebraska) x NOTE: x denotes comparisons that are a potential source of bias. SOURCE: U.S. Department of Education, National Center for Education Statistics, Schools and Staffing Survey (SASS), "Public School District Data File," 2007-08.
8 For the formula used to calculate the overall response rate, see NCES Statistical Standards (U.S. Department of Education 2003).
B-9
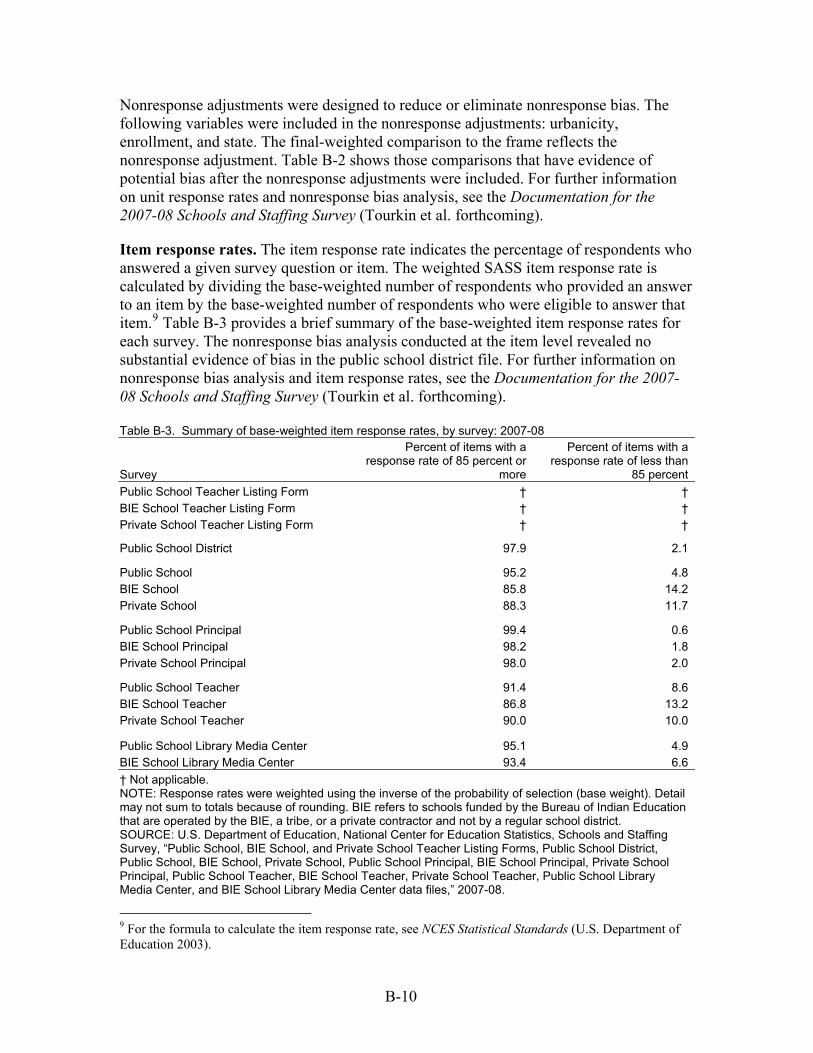
Nonresponse adjustments were designed to reduce or eliminate nonresponse bias. The following variables were included in the nonresponse adjustments: urbanicity, enrollment, and state. The final-weighted comparison to the frame reflects the nonresponse adjustment. Table B-2 shows those comparisons that have evidence of potential bias after the nonresponse adjustments were included. For further information on unit response rates and nonresponse bias analysis, see the Documentation for the 2007-08 Schools and Staffing Survey (Tourkin et al. forthcoming).
Item response rates. The item response rate indicates the percentage of respondents who answered a given survey question or item. The weighted SASS item response rate is calculated by dividing the base-weighted number of respondents who provided an answer to an item by the base-weighted number of respondents who were eligible to answer that item.9 Table B-3 provides a brief summary of the base-weighted item response rates for each survey. The nonresponse bias analysis conducted at the item level revealed no substantial evidence of bias in the public school district file. For further information on nonresponse bias analysis and item response rates, see the Documentation for the 2007-08 Schools and Staffing Survey (Tourkin et al. forthcoming).
Table B-3. Summary of base-weighted item response rates, by survey: 2007-08
Survey
Percent of items with a response rate of 85 percent or
more
Percent of items with a response rate of less than
85 percent Public School Teacher Listing Form † † BIE School Teacher Listing Form † † Private School Teacher Listing Form † †
Public School District 97.9 2.1
Public School 95.2 4.8 BIE School 85.8 14.2 Private School 88.3 11.7
Public School Principal 99.4 0.6 BIE School Principal 98.2 1.8 Private School Principal 98.0 2.0
Public School Teacher 91.4 8.6 BIE School Teacher 86.8 13.2 Private School Teacher 90.0 10.0
Public School Library Media Center 95.1 4.9 BIE School Library Media Center 93.4 6.6 † Not applicable. NOTE: Response rates were weighted using the inverse of the probability of selection (base weight). Detail may not sum to totals because of rounding. BIE refers to schools funded by the Bureau of Indian Education that are operated by the BIE, a tribe, or a private contractor and not by a regular school district. SOURCE: U.S. Department of Education, National Center for Education Statistics, Schools and Staffing Survey, “Public School, BIE School, and Private School Teacher Listing Forms, Public School District, Public School, BIE School, Private School, Public School Principal, BIE School Principal, Private School Principal, Public School Teacher, BIE School Teacher, Private School Teacher, Public School Library Media Center, and BIE School Library Media Center data files,” 2007-08.
9 For the formula to calculate the item response rate, see NCES Statistical Standards (U.S. Department of Education 2003).
B-10

Weighting
The general purpose of weighting is to scale up the sample estimates to represent the target survey population. For SASS, a base weight (e.g., the inverse of the sampled teacher’s probability of selection) is used as the starting point. Next, a series of nonresponse adjustment factors are calculated and applied using information from the 2003-04 SASS nonresponse bias analysis and information about the respondents known from the sampling frame data. Finally, for some files, a ratio adjustment factor is calculated and applied to the sample to adjust the sample totals to the frame totals. The product of these factors is the final weight for each SASS respondent, which appears as DFNLWT on the SASS Public School District data file, AFNLWGT on all SASS Principal data files, SFNLWGT on all SASS School data files, TFNLWGT on all SASS Teacher data files, and MFNLWGT on all SASS Library Media Center data files.
The counts in table 1 do not necessarily match the frame counts because some cases in the frame were found to be ineligible (i.e., out-of-scope) and because not all data files (e.g., principal or library media center) are post-stratified to match the frame counts.
Variance Estimation
In surveys with complex sample designs, such as SASS, direct estimates of sampling errors that assume a simple random sample typically underestimate the variability in the estimates. The SASS sample design and estimation include procedures that deviate from the assumption of simple random sampling, such as stratifying the school sample, oversampling new teachers, and sampling with differential probabilities.
One method of calculating sampling errors of complex sample designs is replication. Replication methods involve constructing a number of subsamples (i.e., replicates) from the full sample and computing the statistic of interest for each replicate. The mean square error of the replicate estimates around the full sample estimate provides an estimate of the variance of the statistic. Each SASS data file includes a set of 88 replicate weights designed to produce variance estimates. The set of replicate weights for each file should be applied to the respondents in that file. The replicate weights for SASS respondents are DREPWT1-DREPWT88 for districts, AREPWT1-AREPWT88 for principals, SREPWT1-SREPWT88 for schools, TREPWT1-TREPWT88 for teachers, and MREPWT1-MREPWT88 for library media centers.
B-11

Reliability of Data
SASS estimates are based on samples. The sample estimates may differ somewhat from the values that would be obtained from the universe of respondents using the same questionnaire, instructions, and field representatives. The difference occurs because a sample survey estimate is subject to two types of errors: nonsampling and sampling. Estimates of the magnitude of sampling error for SASS data can be derived or calculated. Nonsampling errors are attributed to many sources, including definitional difficulties, the inability or unwillingness of respondents to provide correct information, differences in the interpretation of questions, an inability to recall information, errors made in collection (e.g., in recording or coding the data), errors made in processing the data, and errors made in estimating values for missing data. Quality control and edit procedures were used to reduce errors made by respondents, coders, and interviewers.
Caution Concerning Changes in Estimates
Care must be taken in estimating change over time in a SASS data element, because some of the measured change may not be attributable to a change in the education system. Some of the change may be due to changes in the sampling frame, changes in questionnaire item wording, or other changes. For example, the definition of locale codes has undergone major changes since the 2000 Decennial Census. The first major change was an improvement in geocoding technology, which improved the assignment of specific addresses to physical locations. In 2005, a new locale code for CCD was implemented based on the new urban-centric method of classifying locale. Changes in how areas and, thus, schools are categorized may account for at least some changes that are noted from previous administrations.
To facilitate the transition from the older locale codes to the new ones, locale codes based on geographic concepts from both the 2000 Decennial Census and the new urban-centric method are included in the 2007-08 SASS data files. (SLOCP8, URBANS8, DLOCP8, and URBAND8 use the 2000 Census metropolitan areas, and SLOCP12, URBANS12, DLOCP12, and URBAND12 use the new urban-centric method.) The specific categories reported by the 2000 Census locale codes are based upon the 2000 Census definitions for central city, urban fringe of a large or medium-sized central city, large or small town, and rural areas either inside a metropolitan area or outside a metropolitan area. The new urban-centric locale codes are based on the more immediate proximity of a physical location to an urbanized area than are the older, county-based locale codes. This report uses the new urban-centric locale codes.
B-12
Appendix C: Description of Data Files
C-1

Description of Data Files
The 2007-08 Schools and Staffing Survey (SASS) data are being released in 12 data files. Those data files were created from nine survey questionnaires: the School District Questionnaire, School Questionnaire (public), Private School Questionnaire, Public School Questionnaire (With District Items),1 Principal Questionnaire, Private School Principal Questionnaire, Teacher Questionnaire, Private School Teacher Questionnaire, and Library Media Center Questionnaire. Table C-1 identifies each data file and the questionnaire data used to build the file.
Table C-1. Names of data files and the questionnaires from which the data were drawn: 2007-08
Data file Questionnaire source School district School District Questionnaire, Public School Questionnaire (With District
Items) Public school School Questionnaire, Public School Questionnaire (With District Items) Private school Private School Questionnaire BIE school Public School Questionnaire (With District Items) Public school principal Principal Questionnaire Private school principal Private School Principal Questionnaire BIE school principal Principal Questionnaire Public school teacher Teacher Questionnaire Private school teacher Private School Teacher Questionnaire BIE school teacher Teacher Questionnaire Public school library media center Library Media Center Questionnaire BIE school library media center Library Media Center Questionnaire NOTE: BIE refers to schools funded by the Bureau of Indian Education that are operated by the BIE, a tribe, or a private contractor and not by a regular school district. SOURCE: U.S. Department of Education, National Center for Education Statistics, Schools and Staffing Survey (SASS), 2007-08. For the most part, there is a separate data file for each type of respondent (district, school, principal, teacher, and library media center) for each school type or sector (public,2 private, and BIE-funded [BIE]). There are two exceptions: 1) there are no School District files for private and BIE schools as these sectors do not have districts, per se, and 2) there is no Library Media Center data file for private schools because library media centers in private schools were not included in the 2007-08 SASS (for budget reasons). The School District data file includes responses from school districts to the School District Questionnaire along with the “district items” taken from the Public School Questionnaire (With District Items) completed by the subset of public schools that were not associated with “traditional” school districts. These schools include state-run schools,
1 The School Questionnaire (With District Items) is an expanded version of the Public School Questionnaire that includes items from the School District Questionnaire. 2 Public includes traditional public and public charter.
C-2

traditional public schools in single-school districts, and independent charter schools. Rather than ask these public schools to complete two questionnaires, School and School District, NCES created the Public School Questionnaire (With District Items) to capture district data from these schools. Table C-2 shows the different respondents and questionnaires used to create the School District data file. Table C-2. The number of cases in the School District data file, by respondent and source of data: 2007-08
Respondent Source of data in the district file Number of cases
Total 4,600 Regular districts School District Questionnaire 3,950 State run schools1 Public School Questionnaire (With District Items) 40 Schools in single-school districts Public School Questionnaire (With District Items) 470
Independent charter schools Public School Questionnaire (With District Items) 140 1 These include schools for the blind, career and technical centers, and schools in detention centers run by a state. NOTE: Detail may not sum to totals because of rounding. SOURCE: U.S. Department of Education, National Center for Education Statistics, Schools and Staffing Survey (SASS), "Public School District and Public School Data Files," 2007-08.
The “district items” gathered from the Public School Questionnaire (With District Items) were not placed on the Public School data file, but they were kept with the school items on the BIE School data file.
C-3

Appendix D: Description of Variables
D-1
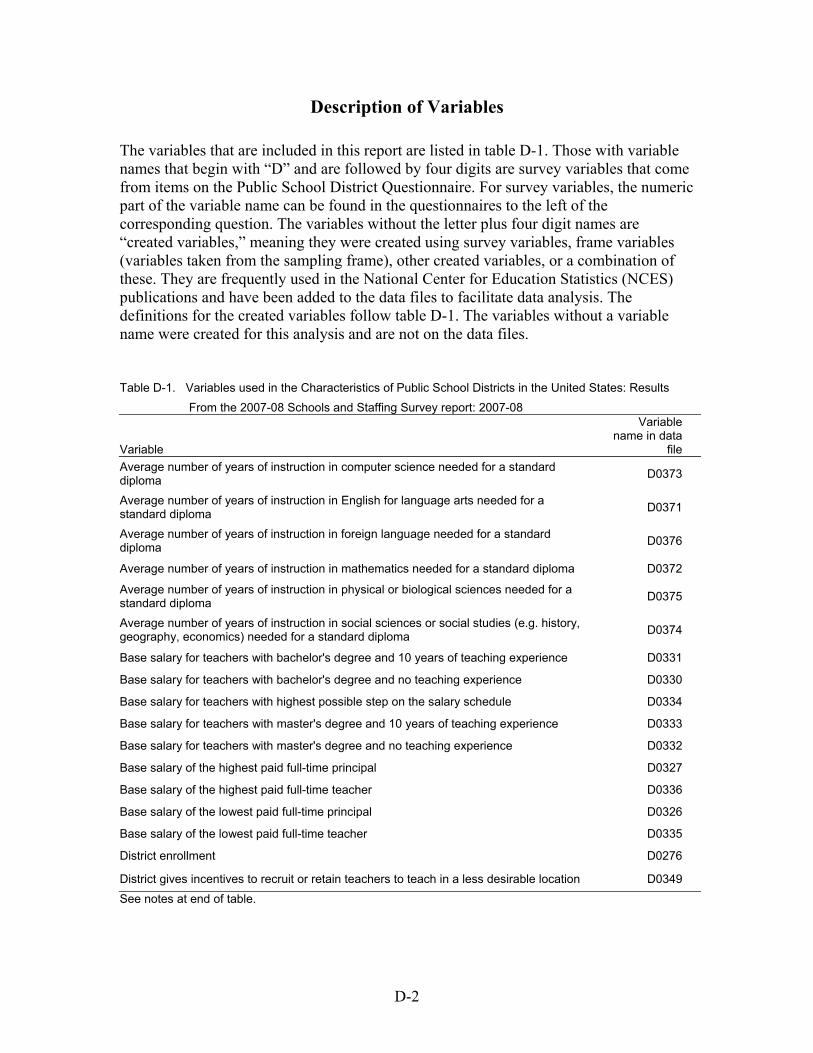
Description of Variables
The variables that are included in this report are listed in table D-1. Those with variable names that begin with “D” and are followed by four digits are survey variables that come from items on the Public School District Questionnaire. For survey variables, the numeric part of the variable name can be found in the questionnaires to the left of the corresponding question. The variables without the letter plus four digit names are “created variables,” meaning they were created using survey variables, frame variables (variables taken from the sampling frame), other created variables, or a combination of these. They are frequently used in the National Center for Education Statistics (NCES) publications and have been added to the data files to facilitate data analysis. The definitions for the created variables follow table D-1. The variables without a variable name were created for this analysis and are not on the data files.
Table D-1. Variables used in the Characteristics of Public School Districts in the United States: Results Table D-1 From the 2007-08 Schools and Staffing Survey report: 2007-08
Variable name in data
file Variable Average number of years of instruction in computer science needed for a standard diploma D0373
Average number of years of instruction in English for language arts needed for a standard diploma D0371
Average number of years of instruction in foreign language needed for a standard diploma D0376
Average number of years of instruction in mathematics needed for a standard diploma D0372
Average number of years of instruction in physical or biological sciences needed for a standard diploma D0375
Average number of years of instruction in social sciences or social studies (e.g. history, geography, economics) needed for a standard diploma D0374
Base salary for teachers with bachelor's degree and 10 years of teaching experience D0331
Base salary for teachers with bachelor's degree and no teaching experience D0330
Base salary for teachers with highest possible step on the salary schedule D0334
Base salary for teachers with master's degree and 10 years of teaching experience D0333
Base salary for teachers with master's degree and no teaching experience D0332
Base salary of the highest paid full-time principal D0327
Base salary of the highest paid full-time teacher D0336
Base salary of the lowest paid full-time principal D0326
Base salary of the lowest paid full-time teacher D0335
District enrollment D0276
District gives incentives to recruit or retain teachers to teach in a less desirable location D0349 See notes at end of table.
D-2

Table D-1. Variables used in the Characteristics of Public School Districts in the United States: Results Table D-1 From the 2007-08 Schools and Staffing Survey report: 2007-08—Continued
Variable
Variable name in data
file District gives incentives to recruit or retain teachers to teach in fields of shortage D0350
District grants high school diplomas D0370
District has meet-and-confer agreement with a principals' association or union D0299
District has meet-and-confer agreement with a teachers' association or union D0296
District has no specific agreement with a principals' association or union D0299
District has no specific agreement with a teachers' association or union D0296
District has salary schedules for principals D0325
District has salary schedules for teachers D0328
District has tenure system for principals D0301
District offers defined-benefit retirement plan D0340
District offers defined-contribution retirement plan D0341
District offers dental insurance D0338
District offers free training in fields with current or anticipated shortages D0315
District offers general medical insurance D0337
District offers group life insurance D0339
District offers housing, housing subsidies, or rent assistance D0344
District offers subsidized meals D0345
District offers subsidized transportation D0346
District offers tuition reimbursement D0343
District rewards excellence in teaching D0348
District rewards teachers who have attained National Board for Professional Teaching Standards certification D0347
District that has collective bargaining agreement with a principals' association or union D0299
District that has collective bargaining agreement with a teachers' association or union D0296
District uses finder's fee to existing staff for new teacher referrals to recruit new teachers D0314
District uses forgiveness of student loan(s) funded by the district to recruit new teachers D0312
District uses relocation assistance to recruit new teachers D0313
District uses signing bonuses to recruit new teachers D0311
Districts has a training program for aspiring school administrators D0317
Number of days in the normal contract year for principals D0300
Number of newly-hired principals D0316 See notes at end of table.
D-3
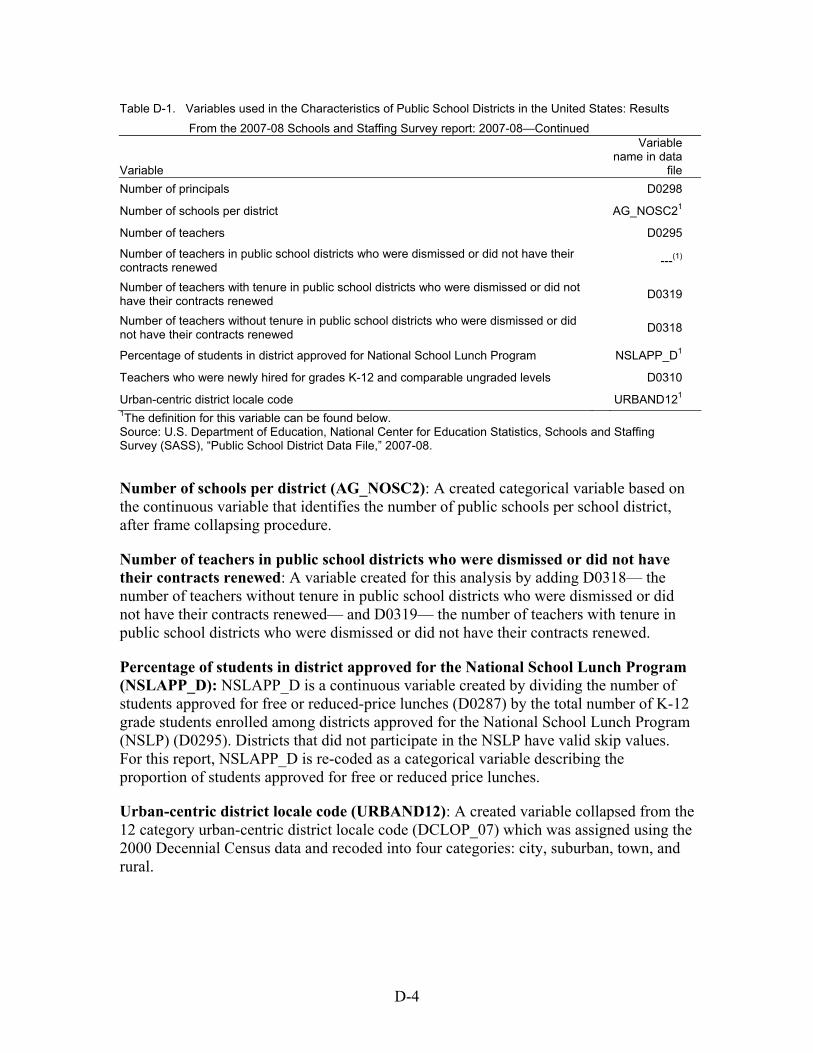
Table D-1. Variables used in the Characteristics of Public School Districts in the United States: Results Table D-1 From the 2007-08 Schools and Staffing Survey report: 2007-08—Continued
Variable
Variable name in data
file Number of principals D0298
AG_NOSC21Number of schools per district
Number of teachers D0295
Number of teachers in public school districts who were dismissed or did not have their contracts renewed ---(1)
Number of teachers with tenure in public school districts who were dismissed or did not have their contracts renewed D0319
Number of teachers without tenure in public school districts who were dismissed or did not have their contracts renewed D0318
NSLAPP_D1Percentage of students in district approved for National School Lunch Program
Teachers who were newly hired for grades K-12 and comparable ungraded levels D0310
URBAND121Urban-centric district locale code 1The definition for this variable can be found below. Source: U.S. Department of Education, National Center for Education Statistics, Schools and Staffing Survey (SASS), “Public School District Data File,” 2007-08.
Number of schools per district (AG_NOSC2): A created categorical variable based on the continuous variable that identifies the number of public schools per school district, after frame collapsing procedure.
Number of teachers in public school districts who were dismissed or did not have their contracts renewed: A variable created for this analysis by adding D0318— the number of teachers without tenure in public school districts who were dismissed or did not have their contracts renewed— and D0319— the number of teachers with tenure in public school districts who were dismissed or did not have their contracts renewed.
Percentage of students in district approved for the National School Lunch Program (NSLAPP_D): NSLAPP_D is a continuous variable created by dividing the number of students approved for free or reduced-price lunches (D0287) by the total number of K-12 grade students enrolled among districts approved for the National School Lunch Program (NSLP) (D0295). Districts that did not participate in the NSLP have valid skip values. For this report, NSLAPP_D is re-coded as a categorical variable describing the proportion of students approved for free or reduced price lunches.
Urban-centric district locale code (URBAND12): A created variable collapsed from the 12 category urban-centric district locale code (DCLOP_07) which was assigned using the 2000 Decennial Census data and recoded into four categories: city, suburban, town, and rural.
D-4


![Community Based Survey Methodology for Maternal Healthcare … · 2016. 11. 22. · Table 1. aDemographic characteristics of MATIND study districts [25]. Indicators Dahod Sabarkantha](https://img.dokumen.tips/doc/110x75/6136e8070ad5d206764851c8/community-based-survey-methodology-for-maternal-healthcare-2016-11-22-table.jpg)