Embed Size (px)
Citation preview
NATIONAL CENTER FOR EDUCATION STATISTICS
Statistical Analysis Report May 1997
Characteristics of Small and Rural School Districts
U.S. Department of EducationOffice of Educational Research and Improvement NCES 97-529
NATIONAL CENTER FOR EDUCATION STATISTICS
Statistical Analysis Report May 1997
Characteristics of Small andRural School Districts
Donald H. McLaughlinMette B. HubermanEvelyn K. Hawkins
American Institutes for Research
Lee M. Hoffman, Project OfficerNational Center for Education Statistics
U.S. Department of EducationOffice of Educational Research and Improvement NCES 97-529
U.S. Department of EducationRichard W. RileySecretary
Office of Educational Research and ImprovementMarshall S. SmithActing Assistant Secretary
National Center for Education StatisticsPascal D. Forgione, Jr.Commissioner
The National Center for Education Statistics (NCES) is the primary federal entity for collecting, analyzing,and reporting data related to education in the United States and other nations. It fulfills a congressionalmandate to collect, collate, analyze, and report full and complete statistics on the condition of education inthe United States; conduct and publish reports and specialized analyses of the meaning and significance ofsuch statistics; assist state and local education agencies in improving their statistical systems; and reviewand report on education activities in foreign countries.
NCES activities are designed to address high priority education data needs; provide consistent, reliable,complete, and accurate indicators of education status and trends; and report timely, useful, and high qualitydata to the U.S. Department of Education, the Congress, the states, other education policymakers,practitioners, data users, and the general public.
We strive to make our products available in a variety of formats and in language that is appropriate to avariety of audiences. You, as our customer, are the best judge of our success in communicating informationeffectively. If you have any comments or suggestions about this or any other NCES product or report, wewould like to hear from you. Please direct your comments to:
National Center for Education StatisticsOffice of Educational Research and ImprovementU.S. Department of Education555 New Jersey Avenue, NWWashington, DC 20208-5574
May 1997
Contact:Lee M. Hoffman(202) 219-1621

i
Table of Contents
List of Figures . . . . . . . . . . . . . . . . . . . . . . . . . . . . . . . . . . . . . . . . . . . . . . . . . . . . . . . . . . . . . . . iiiList of Tables . . . . . . . . . . . . . . . . . . . . . . . . . . . . . . . . . . . . . . . . . . . . . . . . . . . . . . . . . . . . . . viiAcknowledgments . . . . . . . . . . . . . . . . . . . . . . . . . . . . . . . . . . . . . . . . . . . . . . . . . . . . . . . . . . xii
Executive Summary . . . . . . . . . . . . . . . . . . . . . . . . . . . . . . . . . . . . . . . . . . . . . . . . . . . . . . . . . xiii
1 Introduction . . . . . . . . . . . . . . . . . . . . . . . . . . . . . . . . . . . . . . . . . . . . . . . . . . . . . . . . . . . 1
Data Sources . . . . . . . . . . . . . . . . . . . . . . . . . . . . . . . . . . . . . . . . . . . . . . . . . . . . . . . . . . . 2Definitions of Terms . . . . . . . . . . . . . . . . . . . . . . . . . . . . . . . . . . . . . . . . . . . . . . . . . . . . . 2
2 Small Public School Districts in America's Rural Locales . . . . . . . . . . . . . . . . . . . . . . 7
Background . . . . . . . . . . . . . . . . . . . . . . . . . . . . . . . . . . . . . . . . . . . . . . . . . . . . . . . . . . . . 9Small Rural Districts in 1993-94. . . . . . . . . . . . . . . . . . . . . . . . . . . . . . . . . . . . . . . . . . . . 9Trends in Small Rural Districts from 1986-87 to 1993-94. . . . . . . . . . . . . . . . . . . . . . . 14Summary . . . . . . . . . . . . . . . . . . . . . . . . . . . . . . . . . . . . . . . . . . . . . . . . . . . . . . . . . . . . . 19
3 Characteristics of Schools in Small Rural School Districts . . . . . . . . . . . . . . . . . . . . 21
Background . . . . . . . . . . . . . . . . . . . . . . . . . . . . . . . . . . . . . . . . . . . . . . . . . . . . . . . . . . . 23Schools in Small Rural Districts in 1993-94. . . . . . . . . . . . . . . . . . . . . . . . . . . . . . . . . . 23Trends in Schools in Small Rural Districts from 1986-87 to 1993-94. . . . . . . . . . . . . . 31Summary . . . . . . . . . . . . . . . . . . . . . . . . . . . . . . . . . . . . . . . . . . . . . . . . . . . . . . . . . . . . . 37
4 Characteristics of Students in Small Rural School Districts . . . . . . . . . . . . . . . . . . . 39
Background . . . . . . . . . . . . . . . . . . . . . . . . . . . . . . . . . . . . . . . . . . . . . . . . . . . . . . . . . . . 41Students in Small Rural Districts in 1993-94. . . . . . . . . . . . . . . . . . . . . . . . . . . . . . . . . 41Trends in Student Populations in Small Rural Districts from 1986-87 to 1993-94. . . . . 50Summary . . . . . . . . . . . . . . . . . . . . . . . . . . . . . . . . . . . . . . . . . . . . . . . . . . . . . . . . . . . . . 54
5 Revenues, Expenditures, and Student/Teacher Ratios in Small Rural SchoolDistricts . . . . . . . . . . . . . . . . . . . . . . . . . . . . . . . . . . . . . . . . . . . . . . . . . . . . . . . . . . . . . . 55
Background . . . . . . . . . . . . . . . . . . . . . . . . . . . . . . . . . . . . . . . . . . . . . . . . . . . . . . . . . . . 57Revenues, Expenditures, and Student/Teacher Ratios in Small Rural School Districts in 1992-93. . . . . . . . . . . . . . . . . . . . . . . . . . . . . . . . . . . . . . . . . . . . . . . . . . . . 58Trends in Revenues, Expenditures, and Student/Teacher Ratios in Small Rural School Districts between 1989-90 and 1992-93. . . . . . . . . . . . . . . . . . . . . . . . . . . . . . 66

ii
Summary . . . . . . . . . . . . . . . . . . . . . . . . . . . . . . . . . . . . . . . . . . . . . . . . . . . . . . . . . . . . . 69
References. . . . . . . . . . . . . . . . . . . . . . . . . . . . . . . . . . . . . . . . . . . . . . . . . . . . . . . . . . . . . . . . . . 71
Appendix A: Tables Section . . . . . . . . . . . . . . . . . . . . . . . . . . . . . . . . . . . . . . . . . . . . . . . . . . . 75Appendix B: Technical Notes . . . . . . . . . . . . . . . . . . . . . . . . . . . . . . . . . . . . . . . . . . . . . . . . . 123
iii
List of Figures
Figure 2.1— Total numbers of small and large public school districts in rural and nonrural areas in 1993-94. . . . . . . . . . . . . . . . . . . . . . . . . . . . . . . . . . . . . . . . . . . . . . . . . . 10
Figure 2.2— Percentages of districts that were both small and in rural locations, by state, in 1993-94 . . . . . . . . . . . . . . . . . . . . . . . . . . . . . . . . . . . . . . . . . . . . . . . . . . . . . . . . 10
Figure 2.3— Average enrollment size of school districts in rural and nonrural locations in 1993-94 . . . . . . . . . . . . . . . . . . . . . . . . . . . . . . . . . . . . . . . . . . . . . . . . . . . . . . . . 11
Figure 2.4— Percentages of elementary, secondary, and unified districts that were in rural locations in 1993-94. . . . . . . . . . . . . . . . . . . . . . . . . . . . . . . . . . . . . . . . . . . . . . . 12
Figure 2.5— Total numbers of students in elementary, secondary, and unified districts in rural and nonrural areas in 1993-94. . . . . . . . . . . . . . . . . . . . . . . . . . . . . . . . . . . 13
Figure 2.6— Percentages of elementary, secondary, and unified districts in rural and nonrural areas that were small in 1993-94. . . . . . . . . . . . . . . . . . . . . . . . . . . . . . 13
Figure 2.7— Cumulative numbers of small and large school district closures between 1986-87 and 1993-94 in rural and nonrural areas. . . . . . . . . . . . . . . . . . . . . . . . 15
Figure 2.8— Cumulative net losses in numbers of small and large school districts between 1986-87 and 1993-94 in rural and nonrural areas. . . . . . . . . . . . . . . . . . . . . . . . 15
Figure 2.9— Cumulative net losses in numbers of small rural school districts between 1986-87 and 1993-94, by region. . . . . . . . . . . . . . . . . . . . . . . . . . . . . . . . . . . . . 16
Figure 2.10— Cumulative net gains in numbers of students enrolled in small and large school districts in rural and nonrural locations, between 1986-87 and 1993-94 . . . . . . . . . . . . . . . . . . . . . . . . . . . . . . . . . . . . . . . . . . . . . . . . . . . . . . . . 17
Figure 2.11— Cumulative net losses in numbers of elementary, secondary, and unified small rural school districts, between 1986-87 and 1993-94. . . . . . . . . . . . . . . . . . . . . 18
Figure 2.12— Increases in average enrollment sizes of small and large elementary school districts in rural and nonrural locations, between 1986-87 and 1993-94. . . . . . . 18
Figure 3.1— Total numbers of schools in small and large districts in rural and nonrural areas in 1993-94. . . . . . . . . . . . . . . . . . . . . . . . . . . . . . . . . . . . . . . . . . . . . . . . . . 24

iv
Figure 3.2— Percentages of schools in elementary, secondary, and unified districts that are in small and large districts in rural and nonrural areas in 1993-94. . . . . . . . . . . 24
Figure 3.3— Average number of schools in elementary, secondary, and unified districts that are in small and large districts in rural and nonrural areas in 1993-94. . . . . 25
Figure 3.4— Percentages of schools that were small or very small, in small and large districts in rural and nonrural areas in 1993-94. . . . . . . . . . . . . . . . . . . . . . . . . . 26
Figure 3.5— Percentages of schools that were small or very small, in elementary, secondary, and unified small, rural districts in 1993-94. . . . . . . . . . . . . . . . . . . 27
Figure 3.6— Percentages of schools that were small and rural, in small and large districts in rural and nonrural areas in 1993-94. . . . . . . . . . . . . . . . . . . . . . . . . . . . . . . . . . . 28
Figure 3.7— Percentages of schools that offered various grade levels, in small and large districts in rural and nonrural areas in 1993-94. . . . . . . . . . . . . . . . . . . . . . . . . . 29
Figure 3.8— Percentages of elementary and combined schools that offered kindergarten, and the percentage of these that offered prekindergarten, in small and large districts in rural and nonrural areas in 1993-94. . . . . . . . . . . . . . . . . . . . . . . . . . 30
Figure 3.9— Percentages of nonregular schools and schools offering ungraded instruction, in small and large districts in rural and nonrural areas in 1993-94. . . . . . . . . . . 31
Figure 3.10— Cumulative net gains and losses of schools in small and large districts in rural and nonrural areas between 1986-87 and 1993-94. . . . . . . . . . . . . . . . . . . . . . . 32
Figure 3.11— Cumulative net gains and losses of schools in elementary, secondary, and unified small rural and other districts between 1986-87 and 1993-94. . . . . . . . . 32
Figure 3.12— Cumulative net gains or losses of very small schools, in elementary, secondary, and unified small rural and other districts from 1986-87 to 1993-94 . . . . . . . . . . . . . . . . . . . . . . . . . . . . . . . . . . . . . . . . . . . . . . . . . . . . . . 33
Figure 3.13— Net percentage gains and losses of schools that offered various grade levels, in small and large districts in rural and nonrural areas between 1986-87 and 1993-94 . . . . . . . . . . . . . . . . . . . . . . . . . . . . . . . . . . . . . . . . . . . . . . . . . . . . . . . . 34
Figure 3.14— Cumulative percentage gains of schools enrolling prekindergarten students in small and large districts in rural and nonrural areas between 1986-87 and 1993-94 . . . . . . . . . . . . . . . . . . . . . . . . . . . . . . . . . . . . . . . . . . . . . . . . . . . . . . . . 35
v
Figure 3.15— Trends in percentages of schools offering ungraded instruction, in small and large districts in rural and nonrural areas in 1993-94. . . . . . . . . . . . . . . . . . . . . 36
Figure 3.16— Trends in percentages of nonregular schools, in small and large districts in rural and nonrural areas in 1993-94. . . . . . . . . . . . . . . . . . . . . . . . . . . . . . . . . . . 36
Figure 4.1— Percentages of minority students in small rural and other school districts in 1993-94 . . . . . . . . . . . . . . . . . . . . . . . . . . . . . . . . . . . . . . . . . . . . . . . . . . . . . . . . 42
Figure 4.2— Numbers of small rural and other school districts in which a majority of students were members of minorities, in 1993-94. . . . . . . . . . . . . . . . . . . . . . . . 42
Figure 4.3— Percentages of minority students who were in districts in which a majority of students were members of minorities, in small rural and other school districts in 1993-94. . . . . . . . . . . . . . . . . . . . . . . . . . . . . . . . . . . . . . . . . . . . . . . 43
Figure 4.4— Percentages of Native American, Hispanic, Asian, and African Americanstudents in small rural and other school districts in 1993-94. . . . . . . . . . . . . . . . 44
Figure 4.5— Percentages of school-aged children with limited English proficiency in small rural and other school districts in 1990-91. . . . . . . . . . . . . . . . . . . . . . . . . . . . . 45
Figure 4.6— Percentages of school-aged children with limited English proficiency insmall rural and other school districts in 1990-91, by region. . . . . . . . . . . . . . . . 46
Figure 4.7— Percentages of students with Individualized Education Programs in small rural and other school districts in 1993-94. . . . . . . . . . . . . . . . . . . . . . . . . . . . . . . . . . 47
Figure 4.8— Estimated percentages of students in poverty in small rural and other school districts in 1993-94, by region. . . . . . . . . . . . . . . . . . . . . . . . . . . . . . . . . . . . . . . 49
Figure 4.9— Percentages of students in small rural and other districts who are in the highest and lowest quarters of districts, ranked on poverty percentage, in 1993-94 . . . . . . . . . . . . . . . . . . . . . . . . . . . . . . . . . . . . . . . . . . . . . . . . . . . . . . . . 49
Figure 4.10— Percentage of minority students in small rural and other school districts, 1987-88 to 1993-94. . . . . . . . . . . . . . . . . . . . . . . . . . . . . . . . . . . . . . . . . . . . . . . 51
Figure 4.11— Percentage of minority students in small rural and other school districts, 1987-88 and 1993-94, by racial-ethnic group. . . . . . . . . . . . . . . . . . . . . . . . . . . 52
Figure 4.12— Percentage of students with Individualized Education Programs in small rural and other school districts, 1987-88 to 1993-94. . . . . . . . . . . . . . . . . . . . . . . . . . 53
vi
Figure 5.1— Average per-pupil revenues in small rural and other school districts, in 1992-93 . . . . . . . . . . . . . . . . . . . . . . . . . . . . . . . . . . . . . . . . . . . . . . . . . . . . . . . . 58
Figure 5.2— Average per-pupil expenditures in small rural and other school districts, in 1992-93 . . . . . . . . . . . . . . . . . . . . . . . . . . . . . . . . . . . . . . . . . . . . . . . . . . . . . . . . 59
Figure 5.3— Percentages of students in small rural and other school districts with low, medium, and high per-pupil revenues in 1992-93. . . . . . . . . . . . . . . . . . . . . . . . 60
Figure 5.4— Percentages of students in small rural and other school districts with low, medium, and high per-pupil expenditures in 1992-93. . . . . . . . . . . . . . . . . . . . . 60
Figure 5.5— Percentages of revenues in small rural and other school districts from local, state, and federal sources in 1992-93. . . . . . . . . . . . . . . . . . . . . . . . . . . . . . . . . . 63
Figure 5.6— Percentages of expenditures in small rural and other school districts for core instruction, administrative support, and capital outlays, in 1992-93. . . . . . . . . . 63
Figure 5.7— Average student/teacher ratios in small rural and other school districts in 1992-93 . . . . . . . . . . . . . . . . . . . . . . . . . . . . . . . . . . . . . . . . . . . . . . . . . . . . . . . . 64
Figure 5.8— Average student/teacher ratios in small rural and other school districts with low, medium, and high per-pupil revenues in 1992-93. . . . . . . . . . . . . . . . . . . . 65
Figure 5.9— Average student/teacher ratios in small rural and other school districts with low, medium, and high per-pupil expenditures in 1992-93. . . . . . . . . . . . . . . . . 65
Figure 5.10— Trends in per-pupil revenues in small rural and other school districts between 1989-1990 and 1992-93 (in constant 1992-93 dollars). . . . . . . . . . . . . . . . . . . . 66
Figure 5.11— Trends in per-pupil expenditures in small rural and other school districts between 1989-90 and 1992-93 (in constant 1992-93 dollars). . . . . . . . . . . . . . . 67
Figure 5.12— Trends in student/teacher ratios in small rural and other school districts between 1986-87 and 1993-94. . . . . . . . . . . . . . . . . . . . . . . . . . . . . . . . . . . . . . . 68
Figure B1— Schema for classification of schools by grades served. . . . . . . . . . . . . . . . . . . 129

vii
List of Tables
Table 3.1— Percentages of rural and nonrural districts, by enrollment per grade inlargest high school, in 1993-94. . . . . . . . . . . . . . . . . . . . . . . . . . . . . . . . . . . . . 28
Table 4.1— Percentages of racial-ethnic groups enrolled in small rural districts, compared to other districts, in 1993-94. . . . . . . . . . . . . . . . . . . . . . . . . . . . . . 44
Table 4.2— Percentages of students enrolled in small rural districts, by region and racial-ethnic group in 1993-94. . . . . . . . . . . . . . . . . . . . . . . . . . . . . . . . . . . . . 45
Table 5.1— Per-pupil revenues and expenditures in small rural districts, compared to all other districts, by region, in 1992-93. . . . . . . . . . . . . . . . . . . . . . . . . . . . . . . . 61
Table 5.2— Per-pupil revenues and expenditures in small rural districts, compared to all other districts, by grade level served, in 1992-93. . . . . . . . . . . . . . . . . . . . 62
Table 5.3— Per-pupil expenditure gains in small rural districts, compared to all other districts, by region, from 1989-90 to 1992-93 (in constant 1992-93 dollars) . . 67

viii
List of Appendix Tables and Figures
Table A2.1— Number of rural, small, and other school districts, by level and year. . . . . . . . 77
Table A2.2— Number of students (in thousands) enrolled in rural, small, and other school districts, by level and year . . . . . . . . . . . . . . . . . . . . . . . . . . . . . . . . . . . . . . . . . 78
Table A2.3a— Number of rural, small, and other school districts, by region and year. . . . . . 79
Table A2.3b— Counts of small rural and other districts at each grade level. . . . . . . . . . . . . . 80
Table A2.4a— Number of rural, small, and other school districts in 1993-94, by state. . . . . . 81
Table A2.4b— Percentage of rural, small, and other school districts in 1993-94, by state. . . . 82
Table A2.4c— Percent change in rural, small, and other school districts between 1986 and 1993, by state . . . . . . . . . . . . . . . . . . . . . . . . . . . . . . . . . . . . . . . . . . . . . . . . . . 83
Table A2.5— Number of rural, small, and other school district consolidations, by region and year . . . . . . . . . . . . . . . . . . . . . . . . . . . . . . . . . . . . . . . . . . . . . . . . . . . . . . . 84
Table A2.6— Number of rural, small, and other school district consolidations between 1986 and 1993, by state . . . . . . . . . . . . . . . . . . . . . . . . . . . . . . . . . . . . . . . . . . . . . . . 85
Table A3.1— Number of schools in rural, small, and other school districts, by level and year . . . . . . . . . . . . . . . . . . . . . . . . . . . . . . . . . . . . . . . . . . . . . . . . . . . . . . . . . . 86
Table A3.2— Number of small schools in rural, small, and other school districts, by level and year . . . . . . . . . . . . . . . . . . . . . . . . . . . . . . . . . . . . . . . . . . . . . . . . . . . . . . . 87
Table A3.3— Number of small rural schools in rural, small, and other school districts, by level and year . . . . . . . . . . . . . . . . . . . . . . . . . . . . . . . . . . . . . . . . . . . . . . . . . . 88
Table A3.4— Number of regular and non-regular schools in rural, small, and other school districts, by year . . . . . . . . . . . . . . . . . . . . . . . . . . . . . . . . . . . . . . . . . . . . . . . . 89
Table A3.5— Number of combined (K-12), elementary, intermediate, secondary, and ungraded/other schools in rural, small, and other school districts in 1986-87 and 1993-94 . . . . . . . . . . . . . . . . . . . . . . . . . . . . . . . . . . . . . . . . . . . . . . . . . . . 90
Table A3.6— Number of schools with kindergarten and ungraded classes in rural, small, and other school districts, by year. . . . . . . . . . . . . . . . . . . . . . . . . . . . . . . . . . . . . . 91
ix
Table A3.7— Number of small schools with fewer than one teacher per grade, by level. . . . 92
Table A3.8— Patterns of school levels in small rural districts, by year. . . . . . . . . . . . . . . . . 93
Table A3.9— Counts of year-to-year school level changes in small rural districts. . . . . . . . . 94
Table A3.10— Counts of year-to-year school level changes in small rural districts with increasing or declining enrollment. . . . . . . . . . . . . . . . . . . . . . . . . . . . . . . . . . 95
Table A4.1a— Number of minority and white students in rural, small, and other school districts, by year . . . . . . . . . . . . . . . . . . . . . . . . . . . . . . . . . . . . . . . . . . . . . . . . 96
Table A4.1b— Percentage of minority and white students in rural, small, and other school districts, by year . . . . . . . . . . . . . . . . . . . . . . . . . . . . . . . . . . . . . . . . . . . . . . . . 97
Table A4.1c— Number of black, Hispanic, Asian, and Native American students (in thousands) in rural, small, and other school districts, by year. . . . . . . . . . . . . 98
Table A4.1d— Percentage of black, Hispanic, Asian, and Native American students in rural, small, and other school districts, by year. . . . . . . . . . . . . . . . . . . . . . . . . 99
Table A4.1e— Number of low, medium, or high minority rural, small, and other districts, by year . . . . . . . . . . . . . . . . . . . . . . . . . . . . . . . . . . . . . . . . . . . . . . . . . . . . . . . 100
Table A4.1f— Minority enrollment in low, medium, or high minority rural, small, and other school districts, by year. . . . . . . . . . . . . . . . . . . . . . . . . . . . . . . . . . . . . 101
Table A4.1g— Percent minority enrollment by region in rural, small, and other school districts, by year . . . . . . . . . . . . . . . . . . . . . . . . . . . . . . . . . . . . . . . . . . . . . . . 102
Table A4.2a— Number of students (in thousands) with IEPs in rural, small, and other school districts, by level and year. . . . . . . . . . . . . . . . . . . . . . . . . . . . . . . . . . 103
Table A4.2b— Percentage of students with IEPs in rural, small, and other school districts, by level and year . . . . . . . . . . . . . . . . . . . . . . . . . . . . . . . . . . . . . . . . . . . . . . . 104
Table A4.3— Percentage of LEP students in rural, small, and other school districts in 1990, by region. . . . . . . . . . . . . . . . . . . . . . . . . . . . . . . . . . . . . . . . . . . . . . . . 105
Table A4.4— Percentage of children in poverty in rural, small, and other school districts, by region and year . . . . . . . . . . . . . . . . . . . . . . . . . . . . . . . . . . . . . . . . . . . . . 106

x
Table A4.5a— Student enrollment in high, medium, and low poverty rural, small, and other school districts, by year. . . . . . . . . . . . . . . . . . . . . . . . . . . . . . . . . . . . . 107
Table A4.5b— Percentage distributions of student enrollment in high, medium, and low poverty rural, small, and other school districts, by year. . . . . . . . . . . . . . . . . 108
Table A5.1— Student/teacher ratios in rural, small, and other school districts, by level and year . . . . . . . . . . . . . . . . . . . . . . . . . . . . . . . . . . . . . . . . . . . . . . . . . . . . . . 109
Table A5.2— Per-pupil revenues in rural, small, and other school districts, by level and year . . . . . . . . . . . . . . . . . . . . . . . . . . . . . . . . . . . . . . . . . . . . . . . . . . . . . . . . . 110
Table A5.3a— Per-pupil revenues in rural, small, and other school districts, by region. . . . 111
Table A5.3b— Per-pupil revenues in rural, small, and other school districts, by state in 1992 . . . . . . . . . . . . . . . . . . . . . . . . . . . . . . . . . . . . . . . . . . . . . . . . . . . . . . . . . 112
Table A5.4— Percentage of local, state, and federal revenues in rural, small, and other school districts by year. . . . . . . . . . . . . . . . . . . . . . . . . . . . . . . . . . . . . . . . . . 113
Table A5.5— Percentage of students enrolled in low, medium, and high per-pupil revenue districts in rural, small, and other school districts, by year. . . . . . . . 114
Table A5.6— Student/teacher ratios in low, medium, and high per-pupil revenue districts in rural, small, and other school districts, by year. . . . . . . . . . . . . . . . . . . . . . 115
Table A5.7— Per-pupil expenditures in rural, small, and other school districts, by level and year . . . . . . . . . . . . . . . . . . . . . . . . . . . . . . . . . . . . . . . . . . . . . . . . . . . . . . 116
Table A5.8a— Per-pupil expenditures in rural, small, and other school districts, by region . . . . . . . . . . . . . . . . . . . . . . . . . . . . . . . . . . . . . . . . . . . . . . . . . . . . . . . 117
Table A5.8b— Per-pupil expenditures by state in rural, small, and other school districts, by state in 1992. . . . . . . . . . . . . . . . . . . . . . . . . . . . . . . . . . . . . . . . . . . . . . . . 118
Table A5.9— Percentage of expenditures for core instruction, administrative support, and capital outlay in rural, small, and other school districts. . . . . . . . . . . . . . 119
Table A5.10— Percentage of students in low, medium, and high per-pupil expenditure districts, by year . . . . . . . . . . . . . . . . . . . . . . . . . . . . . . . . . . . . . . . . . . . . . . . 120
Table A5.11— Student/teacher ratios in low, medium, and high per-pupil expenditure districts . . . . . . . . . . . . . . . . . . . . . . . . . . . . . . . . . . . . . . . . . . . . . . . . . . . . . . 121
xi
Table B1— Number of small rural districts and large rural districts with a majority of small schools in 1993-94, by state. . . . . . . . . . . . . . . . . . . . . . . . . . . . . . . . . 127
Table B2— Percentages of values imputed on the district files used in the small rural district report . . . . . . . . . . . . . . . . . . . . . . . . . . . . . . . . . . . . . . . . . . . . . . . . . . 135
xii
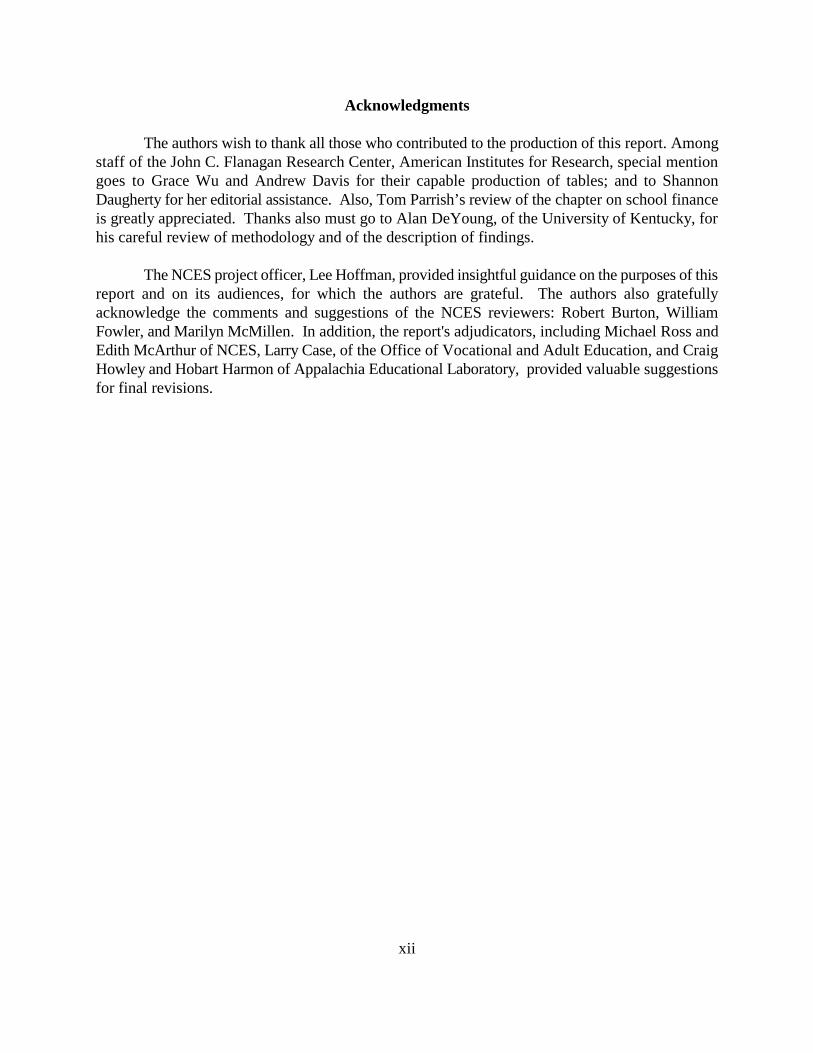
Acknowledgments
The authors wish to thank all those who contributed to the production of this report. Amongstaff of the John C. Flanagan Research Center, American Institutes for Research, special mentiongoes to Grace Wu and Andrew Davis for their capable production of tables; and to ShannonDaugherty for her editorial assistance. Also, Tom Parrish’s review of the chapter on school financeis greatly appreciated. Thanks also must go to Alan DeYoung, of the University of Kentucky, forhis careful review of methodology and of the description of findings.
The NCES project officer, Lee Hoffman, provided insightful guidance on the purposes of thisreport and on its audiences, for which the authors are grateful. The authors also gratefullyacknowledge the comments and suggestions of the NCES reviewers: Robert Burton, WilliamFowler, and Marilyn McMillen. In addition, the report's adjudicators, including Michael Ross andEdith McArthur of NCES, Larry Case, of the Office of Vocational and Adult Education, and CraigHowley and Hobart Harmon of Appalachia Educational Laboratory, provided valuable suggestionsfor final revisions.
xiii
Characteristics of Small and Rural School Districts
Executive Summary
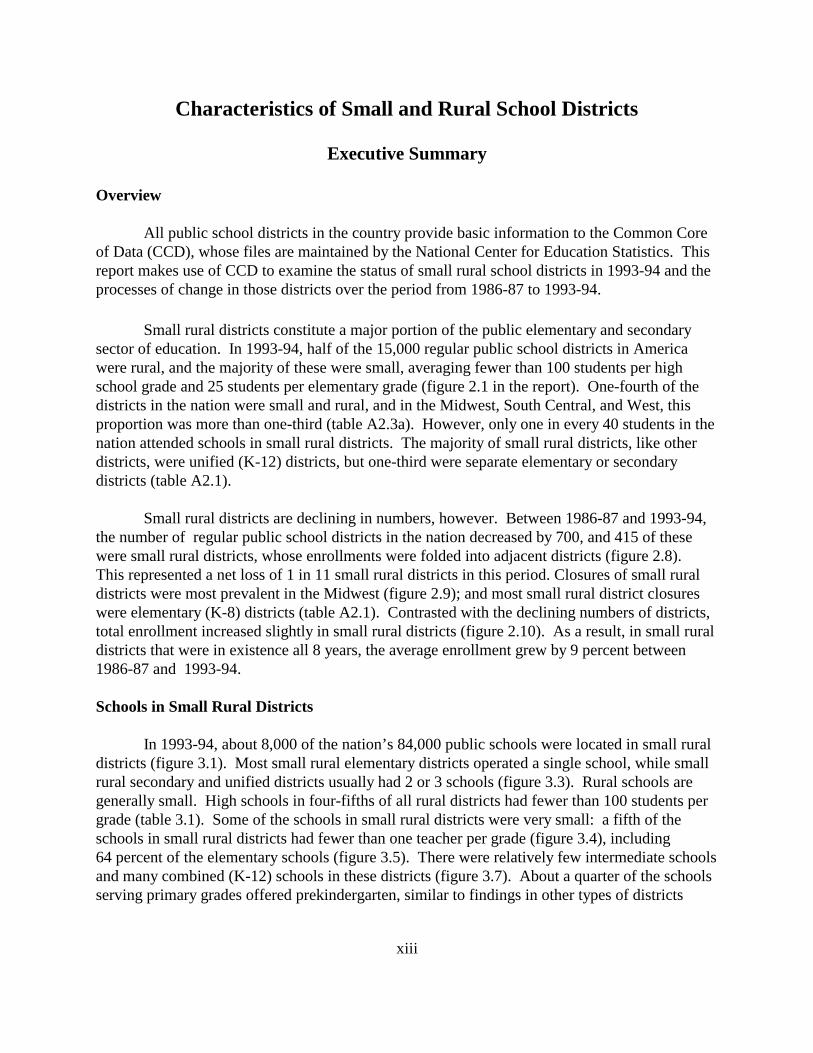
Overview
All public school districts in the country provide basic information to the Common Coreof Data (CCD), whose files are maintained by the National Center for Education Statistics. Thisreport makes use of CCD to examine the status of small rural school districts in 1993-94 and theprocesses of change in those districts over the period from 1986-87 to 1993-94.
Small rural districts constitute a major portion of the public elementary and secondarysector of education. In 1993-94, half of the 15,000 regular public school districts in Americawere rural, and the majority of these were small, averaging fewer than 100 students per highschool grade and 25 students per elementary grade (figure 2.1 in the report). One-fourth of thedistricts in the nation were small and rural, and in the Midwest, South Central, and West, thisproportion was more than one-third (table A2.3a). However, only one in every 40 students in thenation attended schools in small rural districts. The majority of small rural districts, like otherdistricts, were unified (K-12) districts, but one-third were separate elementary or secondarydistricts (table A2.1).
Small rural districts are declining in numbers, however. Between 1986-87 and 1993-94,the number of regular public school districts in the nation decreased by 700, and 415 of thesewere small rural districts, whose enrollments were folded into adjacent districts (figure 2.8). This represented a net loss of 1 in 11 small rural districts in this period. Closures of small ruraldistricts were most prevalent in the Midwest (figure 2.9); and most small rural district closureswere elementary (K-8) districts (table A2.1). Contrasted with the declining numbers of districts,total enrollment increased slightly in small rural districts (figure 2.10). As a result, in small ruraldistricts that were in existence all 8 years, the average enrollment grew by 9 percent between1986-87 and 1993-94.
Schools in Small Rural Districts
In 1993-94, about 8,000 of the nation’s 84,000 public schools were located in small ruraldistricts (figure 3.1). Most small rural elementary districts operated a single school, while smallrural secondary and unified districts usually had 2 or 3 schools (figure 3.3). Rural schools aregenerally small. High schools in four-fifths of all rural districts had fewer than 100 students pergrade (table 3.1). Some of the schools in small rural districts were very small: a fifth of theschools in small rural districts had fewer than one teacher per grade (figure 3.4), including64 percent of the elementary schools (figure 3.5). There were relatively few intermediate schoolsand many combined (K-12) schools in these districts (figure 3.7). About a quarter of the schoolsserving primary grades offered prekindergarten, similar to findings in other types of districts

xiv
(figure 3.8). Finally, relatively few small rural districts either offered ungraded instruction oroperated alternative, vocational, or special education schools (figure 3.9).
Between 1986-87 and 1993-94, about 415 schools closed their doors as the small ruraldistricts in which they operated closed, and 315 more were assimilated into consolidateddistricts. Even in small rural districts that continued to operate, there was a net closure of 92schools. There was a tendency for small rural districts to add intermediate schools, but there wasa net loss of separate elementary and high schools in these districts (figure 3.13). The number ofschools in small rural districts enrolling prekindergarten students more than doubled during thisperiod (figure 3.14), while the number offering ungraded instruction declined (figure 3.15).
Students in Small Rural Districts
In 1993-94, about 1,100,000 of the nation’s 43,200,000 public school students wereenrolled in small rural districts. More of the students in small rural districts were either white orNative American than elsewhere, while fewer were Asian or African American (table 4.1). Fewschool-aged children in small or rural districts (1.3 percent) were reported as having limitedEnglish proficiency (figure 4.6); however, slightly more of the students in small rural districtsthan elsewhere were reported to have Individualized Education Programs (IEPs) to addressspecial educational needs (11.5 percent) (figure 4.7). In the South and West, but not in otherregions, relatively more of the children in small rural districts were living in poverty (table 4.8).
During the latter part of the period from 1986-87 to 1993-94, enrollments increased insmall rural districts, although not as fast as elsewhere. Although percentages of minorityenrollment increased by 10 percent overall (from 31 percent to 34 percent of all public schoolstudents), they remained virtually constant in small rural districts, at about 12 percent (tableA4.1b). While the percentage of Native Americans in small rural districts grew, the percentagesof Asians and African Americans in these districts declined (figure 4.11). Finally, from 1987-88to 1993-94, there was a gradual increase in the proportion of students with IndividualizedEducation Programs (IEPs) in small rural districts, as well as in other types of districts (figure4.12).
Revenue and Expenditures in Small Rural Districts
In the nation as a whole, there were no substantial discrepancies in per-pupil revenues andexpenditures between small rural districts and other districts; however, revenues andexpenditures were substantially lower in large rural districts. In 1992-93, revenue per pupil insmall rural districts was about $6,200, and expenditures per pupil were about $6,000. This wasabout $200 to $400 more than in large nonrural districts (figures 5.1, 5.2). However, per-pupilrevenue and expenditures were only about $5,200 in large rural districts. Per-pupil spendingvaried substantially between regions: most notably in the West, where small rural districts spentnearly $2,000 more per pupil more than other districts did (table 5.1).
xv
Nearly half the revenue in small rural districts came, each, from local and state sources,with about 7 percent from the federal government (figure 5.5). In large rural districts, bycomparison, a much smaller share came from local sources. About two-thirds of the currentexpenditures in small rural districts were for core instruction, slightly less than elsewhere (figure5.6). Nevertheless, ratios of students to teachers were lowest in small rural districts, rangingfrom 12 in top quartile spending districts to 15 in bottom quartile spending districts (figure 5.9).
Adjusted for inflation, finance trends between 1989-90 and 1992-93 were minor,although there were a few patterns. The slightly greater spending in small rural districts,compared to other districts in 1992-93, was more noticeable than it was 3 years earlier (figure5.11). In the South Central region, per-pupil revenues in small rural districts rose, but in theNortheast, per-pupil expenditures declined somewhat (table 5.3). In the nation as a whole,however, no substantial trends in per-pupil revenue or expenditures or in student/teacher ratioscharacterized small rural districts.

The standard NCES definition of “rural,” based on Census-defined locales of schools in a district, was1
used; and “small” districts were those with enrollment averaging fewer than 25 students per elementary grade andfewer than 100 students per secondary grade served, in 1987-88 or the first year of operation if that was later than1987-88.
There were additional school districts on the CCD file, not included in this report. However, they were2
either non-regular school districts or districts with no students. In 1993-94, for example, 1,717 districts wereexcluded for this report. Of these, 5 were in outlying territories (enrolling an aggregate 707,507 students); and theremainder either enrolled no students (330), were nonregular (409), or both (956), or had undefined grade spans(17). Although there are no definitive data on which nonregular districts were rural, of 409 nonregular districts, suchas regional units or administrative components of supervisory unions, enrolling 165,322 students, 201, enrolling37,724 students, were not in Metropolitan Statistical Areas.
1
1. Introduction
While most of the population of the United States lives in urban settings, millions of citizenslive in vast rural areas. This diversity has important implications for public schooling, not only interms of goals of schools and characteristics of the community but also in terms of logistics. Schooldistricts must serve a sufficiently large population to obtain funding to enable purchasing ofresources, hiring teachers, and offering a range of courses and services. However, when thepopulation is widely dispersed, districts face problems with keeping the community involved,transporting students over great distance, and maintaining small schools.
Using accepted, common sense definitions of “small enrollment” and “rural setting,” more1
than 1 in 4 of the 14,648 regular public elementary and secondary school districts in the UnitedStates were small districts in rural settings in the 1993-94 school year, although only 1 in 40 of the2
nation’s 43 million public school students attended schools in these districts. In order to provideinformation on the characteristics of this substantial segment of American education, the NationalCenter for Education Statistics (NCES) has developed this summary report, based on informationabout small rural districts contained in the Common Core of Data. This report focuses on the 4,000small rural districts operating since 1986-87, their status in 1993-94, and how they changed each yearfrom 1986-87 to 1993-94, drawing comparisons where appropriate to larger districts and districtsin nonrural (urban and suburban) settings.
Four sections summarize information concerning, respectively, (1) the geographicdistribution of small rural districts, (2) the characteristics of schools in these districts, (3) thecharacteristics of students in these districts, and (4) revenues and expenditures in these districts. Thefirst section focuses on the district as a unit and presents information on such matters as the totalnumbers of small rural districts, where they are located, how many students are enrolled, and theirrate of closure and consolidation.
The second section focuses on schools in small rural districts, how many schools are in eachdistrict, how small they are, what grade levels they serve, and how many of them were closedbetween 1986-87 and 1993-94.
Regular public school districts divide the nation into about 14,000 generally nonoverlapping areas. In3
some cases, however, separate elementary and secondary districts serve the same community.
2
The third section looks at the students attending schools in small rural districts. The focusin this section is on racial and ethnic distributions, percentages of Limited English Proficient (LEP)children and students with Individualized Education Programs (IEPs) under the Individuals withDisabilities Education Act (IDEA), and percentages of children in poverty.
Finally, in the fourth section the focus is on revenues and expenditures: their sources, howthey are used, and their translation into student/teacher ratios.
Full tabulations of means and percentages are shown in 45 tables in appendix A. The tablesare numbered according to the chapter in the report in which their contents are discussed.
Data Sources
The primary sources of data for these analyses are the NCES Common Core of Data (CCD)School and Education Agency Surveys for the years 1986-87 to 1993-94. These data were mergedwith the decennial 1990 U.S. Census information mapped to school district boundaries (the SchoolDistrict Data Book) and the Bureau of Census F-33 Survey of Local Governments for the years1989-90 to 1992-93. CCD data were edited to create a consistent longitudinal file for this report,and missing data in these files were imputed. For districts whose CCD records were missing oneor more fields in a year or had unreasonable values based on comparisons to other years or otherfields, values were imputed statistically. In most cases, these imputations were based on thedistricts’ responses in other years. Details of this process are described in Appendix B.
Definitions of Terms
A common definitional framework is needed for discussions about schools in rural areas.Past studies have used several alternative units of analysis to discuss public education in rural areas,most commonly schools, school districts, or counties. Although schools are the final delivery pointfor education and counties are a relatively stable government whose boundaries do not overlap, theschool district is the primary unit of concern in most educational policy matters (Stephens 1988).School districts are local, relatively stable over time, and the agencies most directly responsible to3
the citizens of the community for educating its children. They are the basic unit selected forattention in this report.
It is important to note that focusing on small rural districts is not the same as looking at smallschools in rural settings. In this report, a district’s “ruralness” depends on the proportion of itsschools that are in rural locales. Thus, a small school located in a rural section of a large district withsome urban areas would not be included in this report. For example, in 1993-94, there wereapproximately 9,500 small rural schools in the United States, but only about 6,000 of these schoolswere in small rural districts. Rural districts are also different from rural counties: although there are
3
many countywide districts in the nation, only about 100 of the 4,000 small rural districts arecountywide districts.
Definition of Rural School Districts. The meaningfulness of the findings in this reportdepends on where the line is drawn between "rural" and "nonrural" school districts. If "rural" isdefined too broadly, then it becomes a diffuse concept including all but the districts in metropolitanareas. If defined too narrowly, it may omit districts which a consensus would agree are rural. Acategorization is needed which will bring the differences between rural and nonrural districts intosharp focus.
Before 1900, when the United States was mainly an agrarian society, “rural” simply meanta farming community. At that time, most of the population attended rural schools. But by 1918, theurban population had exceeded that of the population in rural areas, and it became important toattend to the educational problems facing rural communities. However, it also became clear thatthere was no single “rural” school district type (Stern 1994). In its decennial survey, the CensusBureau has defined “rural” as a residual category of places “outside urbanized areas in open country,or in communities with less than 2,500 inhabitants,” or where the population density is “less than1,000 inhabitants per square mile.” The data used for the CCD categorization of school locales arebased on the 1980 Census.
NCES has applied this concept of a rural setting to individual schools, based on the addressesof the schools. In this report, a school district is defined as rural based on the locale codes (seeAppendix B) assigned to the schools operated by the district. Essentially, according to NCES'sstandard definition, a school district is called rural if that is the most common school locale; that is,if more schools in the district were located in rural locales than in any of the other six categories oflocale (small and large towns, mid-size and large central cities, and fringes of mid-size and largecities). By this definition, in 1993-94, 45 percent of the nation's regular public school districts wererural. If districts with small town locales had been added to the set, 73 percent of all districts wouldhave been included. To avoid diffusion of the concept of rural districts, small town districts werenot considered rural in this report.
Definition of Small School Districts. The meaningfulness of the findings in this report alsodepends on where the line is drawn between "small" districts and districts that are not to beconsidered small. Although the size of the geographic area served by a school district imposesconstraints on the services to that must be provided, the single measure of size that is most relevantto district operation is enrollment, or membership. In 1993-94, the median enrollment in regularpublic school districts was 1,000 students, and one quarter of the districts had fewer than 350students. Because the purpose of this report is to focus on small rural districts, not all rural districts,a criterion threshold for enrollment that distinguishes districts whose smallness creates constraintson operation is needed.
Total enrollment does not provide the best indicator of being small because some districtsserve only elementary or only secondary grades. A K-6 district that serves 350 students might notbe considered small, because it has 50 students at each grade level and even as few as 20 or 30 aresufficient to make maximal use of an elementary school teacher. However, a K-12 district with 500

4
students might be considered small because it would have only about 40 students in each high schoolgrade, too few to offer a sufficiently broad range of course choices. Conant (1959) developed awidely accepted criterion that the size of the graduating class in a high school should be at least 100to support a quality educational program.
In this report, a small district is defined as one having fewer students in membership than thesum of (a) 25 students per grade in the elementary grades it offers (usually K-8) and (b) 100 studentsper grade in the secondary grades it offers (usually 9-12). Therefore, a district’s classification as“small” depends upon both the total number of students it serves and the grade levels it offers. Manycomparisons in this report are made between districts that are small and ones that are not small. Inthose cases, the term “large” is sometimes used. However, it should be made clear that when theterm “large” is applied to school districts in this report, it is an abbreviation for “not small.”
In 1993-94, as shown by the counts in table A2.1 in appendix A, 54 percent of the 3,334elementary districts in the nation were small by this definition of "small," compared to 41 percentof the 631 secondary districts and 28 percent of the 10,638 unified districts. Among rural districts,60 percent were small.
This definition of “small” is meaningful in terms of staffing constraints faced by districts, butit is somewhat skewed for unified districts because, although the threshold is different for elementaryand secondary grades, actual enrollments within a district tend to be similar for all grades. Unified(usually K-12) districts are defined as small, as are other districts, by the comparison of their totalenrollment to the sum of 25 per elementary grade and 100 per secondary grade; this creates athreshold for definition of a K-12 district as “small” of 625 in total enrollment, or about 50 studentsper grade. A unified district with 780 students, which would be expected to have about 60 studentsper grade, would not be defined as small, although its high school enrollment, taken separately,might well be fewer than 100 per grade. For purposes that would focus on the secondary gradecriterion for "smallness," a parallel set of analyses were also carried out with an expanded definitionof "small" that included all unified districts with fewer than 100 students per secondary grade (9-12).In 1993-94, 50 percent of the nation's unified districts were small by this definition; and among allrural districts, 80 percent were small. The results are summarized in Appendix B.
In addition, in several states, especially in the southeastern region of the country, all of thesmall rural schools have been consolidated into large, in many cases countywide, districts. Usingthe primary definitions for rural and small, although more than a quarter of the districts in Alabama,Delaware, Louisiana, Maryland, North Carolina, and West Virginia are rural, there are no small ruralschool districts in these states. These small schools in large rural districts are, by definition, notincluded in the picture of small rural districts, although they face many of the same challenges thatschools in small rural districts do. To broaden the picture of small rural public education inAmerica, analyses of small rural districts for this report were repeated including “large rural districtswith a majority of small schools” along with small rural districts. Although this resulted in virtuallyno qualitative changes in the statements in the report, footnotes indicating differences appear at theend of each chapter.
5
Regions. For the purposes of this report, some results are presented for separate regions ofthe United States. The standard four-region breakdown used by the National Center for EducationStatistics has been altered to reflect unusual state-by-state diversity in the southern region: threestates, Texas, Arkansas, and Oklahoma, are presented as a separate “south central” region. In 1993-94, these three states had 815 small rural districts, compared to a total of 16 in the thirteen otherstates in the standard southern region. Because it would be misleading to label results based almostentirely on those three states as referring to the entire southern region, a five-region categorizationis used. The state-by-state regional categorization is specified in Appendix B.
Longitudinal Measurement. There was attrition of roughly 1 percent of the regular publicschool districts each year between 1986-87 and 1993-94, so that in any year about 99 percent of thepublic school districts were the same ones that existed in the preceding year. Therefore, the CCDuniverse file can be used for longitudinal studies of the ways in which individual districts changedfrom year to year. However, the possibility of ambiguity arises when housing developments moveinto formerly rural areas and enrollments rise above the threshold for defining “small,” or when anexodus of families seeking new jobs causes a district to become small. A choice must be madewhether (a) to report the progress of districts once called small and rural or (b) to report on thecharacteristics of districts that are small and rural each year.
Viewing the progress of districts defined once as small and rural leads to differentconclusions from those that follow from a cross-sectional view. For example, if we wish todetermine whether enrollment increased or decreased in small rural districts over time, the trendwould be hidden if those districts that crossed the threshold from “small” to “not small” when theygained students were, as a result, not counted in the enrollments in small districts after that. Trendsin school closures, in revenues and expenditures per student, and in student/teacher ratios would besimilarly distorted if districts that were counted as small and rural in one year were counted asnonrural or nonsmall in another year.
Although cross-sectional counts are also valuable, many questions about change cannot beaddressed without a constant classification of the units of analysis. In order to provide anunambiguous definition for the examination of changes in small rural school districts over time, eachdistrict in the data set was defined once as small and rural, using locale in 1990 and enrollment andgrade span in 1987-88 (or in a few cases, in the first year of its existence). In this way, trends insmall rural district characteristics are descriptive of events occurring in those districts. For example,the finding (see chapter 2) that the net loss of small rural districts during this period was greatest inthe Midwest is a meaningful description of district closures because none of this net loss can beattributed to the growth of districts out of the small category in the Midwest.
There were many consolidations of small rural districts during the period; and as a result,there was a net loss of 415 small rural districts between 1986-87 and 1993-94. Therefore, thespecific districts included in tables in this report differ over the years. As described in appendix B,an attempt was made to link closing districts to the districts with which they merged, based ongeographic location and enrollment changes. Although this attempt was only partially successful,it was clear that nearly all regular districts added to the CCD file between 1986-87 and 1993-94 werecreated from the consolidations of other districts; that is, they were not really “new” districts. Only

6
a handful of “new” districts were created through splitting of previously existing districts. As aresult, virtually the only discrepancies from a fully longitudinal study of a single sample of smallrural districts are the few cases in which two small rural districts might merge into a single, newdistrict that is not small.

7
2. Small Public School Districts in America’s Rural Locales
In 1993-94, half of the regular public school districts inAmerica were rural, and the majority of these were small,with a total enrollment of fewer than 100 students per highschool grade and 25 students per elementary grade (figure2.1). One-fourth of the districts in the nation were smalland rural, and in the Midwest, South Central, and West,more than one-third were (table A2.3a). However, only onestudent in forty in the nation attended schools in small ruraldistricts. The majority of small rural districts, like otherdistricts, were unified (K-12) districts, but one-third wereseparate elementary or secondary districts (table A2.1).
Between 1986-87 and 1993-94, the number of regularpublic school districts in the nation declined by 700, andmost closures were small rural districts (figure 2.7).Among small rural districts, 1 in 9 closed during thisperiod. However, due to the creation of some new districtsout of consolidations, the net loss was 415 districts, or 1 in11 (figure 2.8). Closures of small rural districts were mostprevalent in the Midwest (figure 2.9); and most small ruraldistrict closures were elementary (K-8) districts(table A2.1). Contrasted with the declining numbers ofdistricts, total enrollment increased slightly in small ruraldistricts (figure 2.10). As a result, focusing only on districtsthat were in existence all 8 years, the average survivingsmall rural district had 9 percent more students in 1993-94than it had in 1986-87.

8
The analyses include regular public school districts only. Thirty-three districts that did not specify their4
grade ranges in any year are excluded from analyses.
For a discussion of how size and location of schools districts are defined, see chapter 1. Briefly, rural5
status is based on the modal Common Core of Data and U.S. Census classifications of locales of schools in district;and smallness is based on a total enrollment of fewer than 25 students per elementary grade and 100 students persecondary grade.
Counts of small rural and other districts by region are shown in table A2.3. This and other supporting6
tables can be found in appendix A.
9
Background
While the majority of public elementary and secondary schools experienced decliningenrollments during the 1970s and early 1980s, rural schools, already serving small numbers ofpupils, experienced the greatest percentage reduction of enrollment (Salmon 1990). In manydistricts, the decline in enrollment was sufficient to require closure or consolidation. In the last halfof the 1980s, rural schools and the districts in which they were located continued to decline innumbers, as well as in enrollment. In this chapter, a picture of the status of small rural districts inAmerica in 1993-94 is presented, including geographic information and the age categories ofstudents served (elementary, serving children roughly from 4 to 13, secondary, serving childrenroughly from 13 to 18, or combined). Following the status picture, a description of trends over the7 years leading up to 1993-94 is presented.
Small Rural Districts in 1993-94
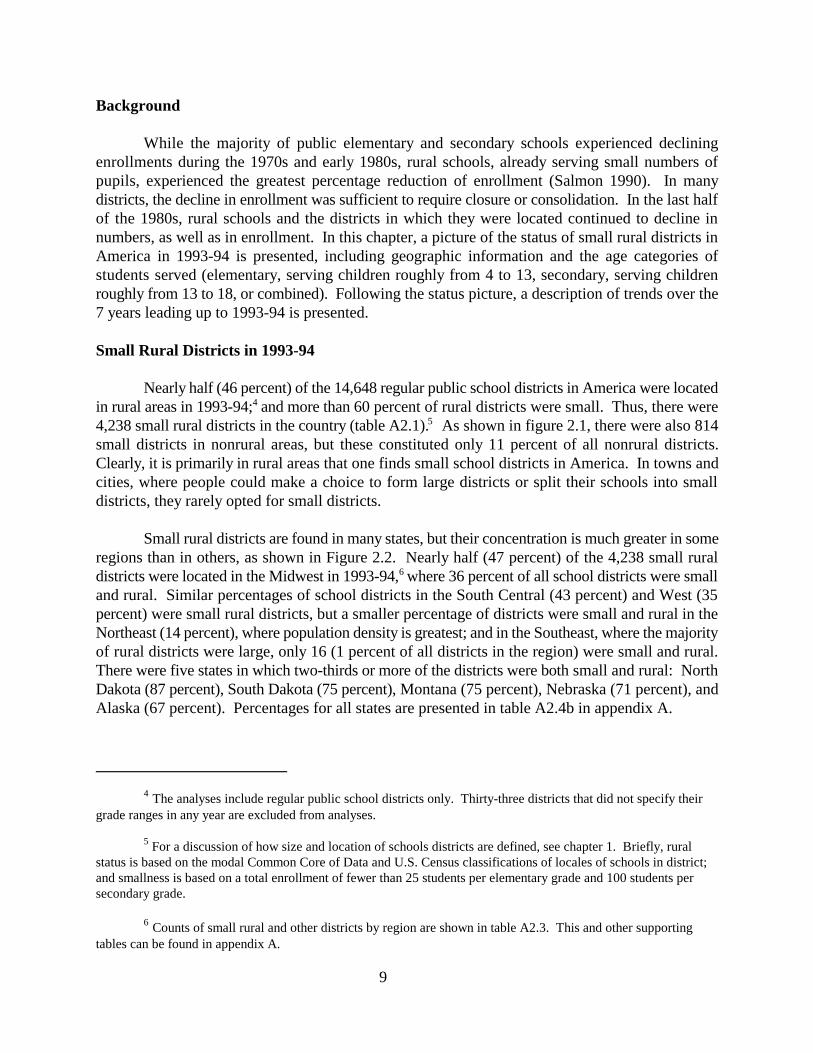
Nearly half (46 percent) of the 14,648 regular public school districts in America were locatedin rural areas in 1993-94; and more than 60 percent of rural districts were small. Thus, there were4
4,238 small rural districts in the country (table A2.1). As shown in figure 2.1, there were also 8145
small districts in nonrural areas, but these constituted only 11 percent of all nonrural districts.Clearly, it is primarily in rural areas that one finds small school districts in America. In towns andcities, where people could make a choice to form large districts or split their schools into smalldistricts, they rarely opted for small districts.
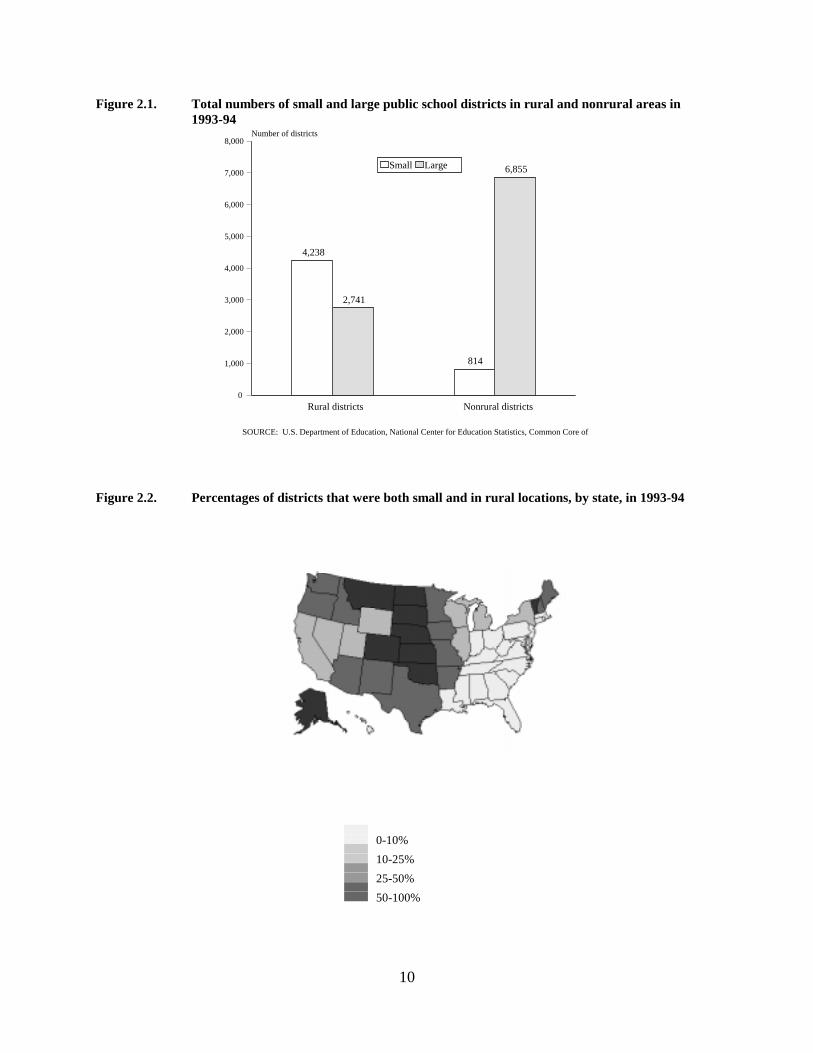
Small rural districts are found in many states, but their concentration is much greater in someregions than in others, as shown in Figure 2.2. Nearly half (47 percent) of the 4,238 small ruraldistricts were located in the Midwest in 1993-94, where 36 percent of all school districts were small6
and rural. Similar percentages of school districts in the South Central (43 percent) and West (35percent) were small rural districts, but a smaller percentage of districts were small and rural in theNortheast (14 percent), where population density is greatest; and in the Southeast, where the majorityof rural districts were large, only 16 (1 percent of all districts in the region) were small and rural.There were five states in which two-thirds or more of the districts were both small and rural: NorthDakota (87 percent), South Dakota (75 percent), Montana (75 percent), Nebraska (71 percent), andAlaska (67 percent). Percentages for all states are presented in table A2.4b in appendix A.
SOURCE: U.S. Department of Education, National Center for Education Statistics, Common Core of D
4,238
814
2,741
6,855
Rural districts Nonrural districts0
1,000
2,000
3,000
4,000
5,000
6,000
7,000
8,000Number of districts
Small Large
10
Figure 2.1. Total numbers of small and large public school districts in rural and nonrural areas in 1993-94
Figure 2.2. Percentages of districts that were both small and in rural locations, by state, in 1993-94
0-10%
10-25%
25-50%
50-100%
SOURCE: U.S. Department of Education, National Center for Education Statistics, Common Core of Data
818
4,888
Rural districts Nonrural districts0
1,000
2,000
3,000
4,000
5,000
6,000Average district enrollment
Corresponding median enrollments were 434 and 2,039, respectively.7
11
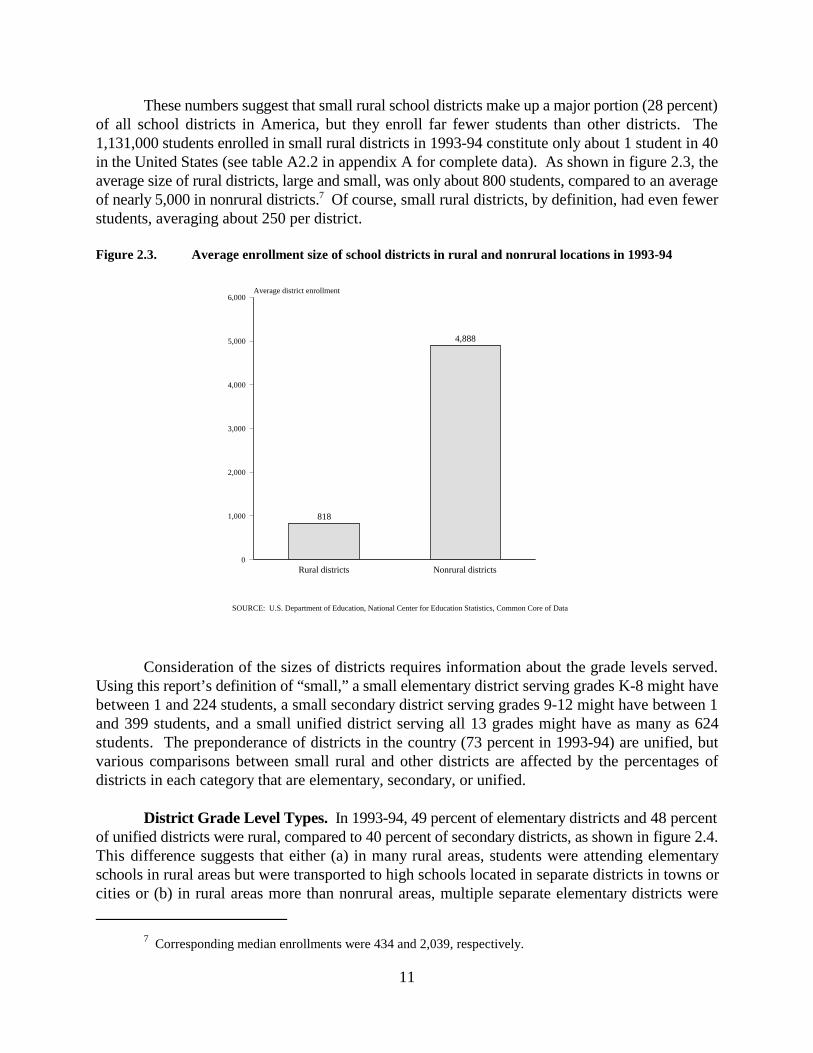
These numbers suggest that small rural school districts make up a major portion (28 percent)of all school districts in America, but they enroll far fewer students than other districts. The1,131,000 students enrolled in small rural districts in 1993-94 constitute only about 1 student in 40in the United States (see table A2.2 in appendix A for complete data). As shown in figure 2.3, theaverage size of rural districts, large and small, was only about 800 students, compared to an averageof nearly 5,000 in nonrural districts. Of course, small rural districts, by definition, had even fewer7
students, averaging about 250 per district.
Figure 2.3. Average enrollment size of school districts in rural and nonrural locations in 1993-94
Consideration of the sizes of districts requires information about the grade levels served.Using this report’s definition of “small,” a small elementary district serving grades K-8 might havebetween 1 and 224 students, a small secondary district serving grades 9-12 might have between 1and 399 students, and a small unified district serving all 13 grades might have as many as 624students. The preponderance of districts in the country (73 percent in 1993-94) are unified, butvarious comparisons between small rural and other districts are affected by the percentages ofdistricts in each category that are elementary, secondary, or unified.
District Grade Level Types. In 1993-94, 49 percent of elementary districts and 48 percentof unified districts were rural, compared to 40 percent of secondary districts, as shown in figure 2.4.This difference suggests that either (a) in many rural areas, students were attending elementaryschools in rural areas but were transported to high schools located in separate districts in towns orcities or (b) in rural areas more than nonrural areas, multiple separate elementary districts were

SOURCE: U.S. Department of Education, National Center for Education Statistics, Common Core of Data
49.3 47.6
39.5
Elementary districts Unified districts Secondary districts0
20
40
60
80
100Percentage
The difference between secondary and unified districts is due primarily to the definition of “small:” a8
secondary district with 50 to 90 students in every grade would be considered small but a unified district would not.
12
"feeders" into other rural secondary (or unified) districts for secondary education. Aggregateenrollments in elementary and secondary (i.e., nonunified) districts in rural and nonrural areas canshed light on these possibilities. As shown in figure 2.5, there were 294,000 students in elementarydistricts in rural areas and 70,000 students in secondary districts, compared to 2,268,000 inelementary and 964,000 in secondary districts in nonrural areas.
The preponderance of elementary districts that are K-8 and of secondary districts that are 9-12 suggests that there are a total of 33,000 students in each grade in elementary rural districts andonly 17,000 students in each grade in secondary rural districts. In nonrural districts, there were about252,000 students in each grade in elementary districts and 241,000 students per grade in secondarydistricts. The apparent attrition in rural districts, from 33,000 in elementary grades to 17,000 insecondary grades, exceeds that in nonrural districts by so much that it cannot be explained in termssuch as increasing birth cohorts. Apparently, a large proportion of students enrolled in elementaryrural districts did not go on to high school education in secondary rural districts. They eithertransferred to rural unified districts or to nonrural districts.
Figure 2.4. Percentages of elementary, secondary, and unified districts that were in rural locations in 1993-94
In rural areas, 78 percent of the elementary districts and 84 percent of the secondary districtswere small in 1993-94, but only 54 percent of unified districts were small, as shown in figure 2.6.There were large percentages small districts among all three types in rural areas, although thesmallest districts were elementary. In contrast, in nonrural areas, it was only among elementary8

SOURCE: U.S. Department of Education, National Center for Education Statistics, Common Core of Data
2942,268
5,346
34,254
70964
Rural districts Nonrural districts0
5,000
10,000
15,000
20,000
25,000
30,000
35,000
40,000Number of students in thousands
Elementary Unified Secondary
SOURCE: U.S. Department of Education, National Center for Education Statistics, Common Core of Data
78.4
30.7
53.9
4.4
83.5
12.8
Rural districts Nonrural districts0
20
40
60
80
100Percentage
Elementary Unified Secondary
13
Figure 2.5. Total numbers of students in elementary, secondary, and unified districts in rural and nonruralareas in 1993-94
Figure 2.6. Percentages of elementary, secondary, and unified districts in rural and nonrural areas thatwere small in 1993-94
14
districts that a substantial percentage of small districts could be found (31 percent). Only 13 percentof secondary and 4 percent of unified nonrural districts were small. Although cities and towns mightbreak up their elementary schools into separate, small districts, local education agencies servingsecondary grades rarely did so: the value of a larger size is more important in later grades, wherestudents with different interests and aptitudes expect more curricular choices.
Trends in Small Rural Districts from 1986-87 to 1993-94
The snapshot of small rural districts in 1993-94 is one slice from a longitudinal trend, andfindings of reliable trends over the preceding 8 years may provide the basis for guesses as to whatthe snapshot will show in the remainder of the 20th century. The Common Core of Data containsinformation about virtually all public school districts in the country, and information about changesin individual districts can be followed over the years.
This section, like similar sections in later chapters, examines trends in small ruraldistricts—do they close, do they gain or lose students, how do they change? To support this purpose,each school district is classified as small and rural once for the entire period, even though itsenrollment may grow past a threshold or a town may sprout up around it during the period. Theclassification is based on the earliest year of the period in which the district was in operation—exceptthat the size determination (small or not small) was based on 1987-88 enrollment, rather than 1986-87 enrollment, due to the substantially greater amount of missing data requiring imputation in 1986-87, the first year of the most recent Common Core of Data series. Also, 1990 Census data playeda major role in the determination of whether a district was located in a rural locale.
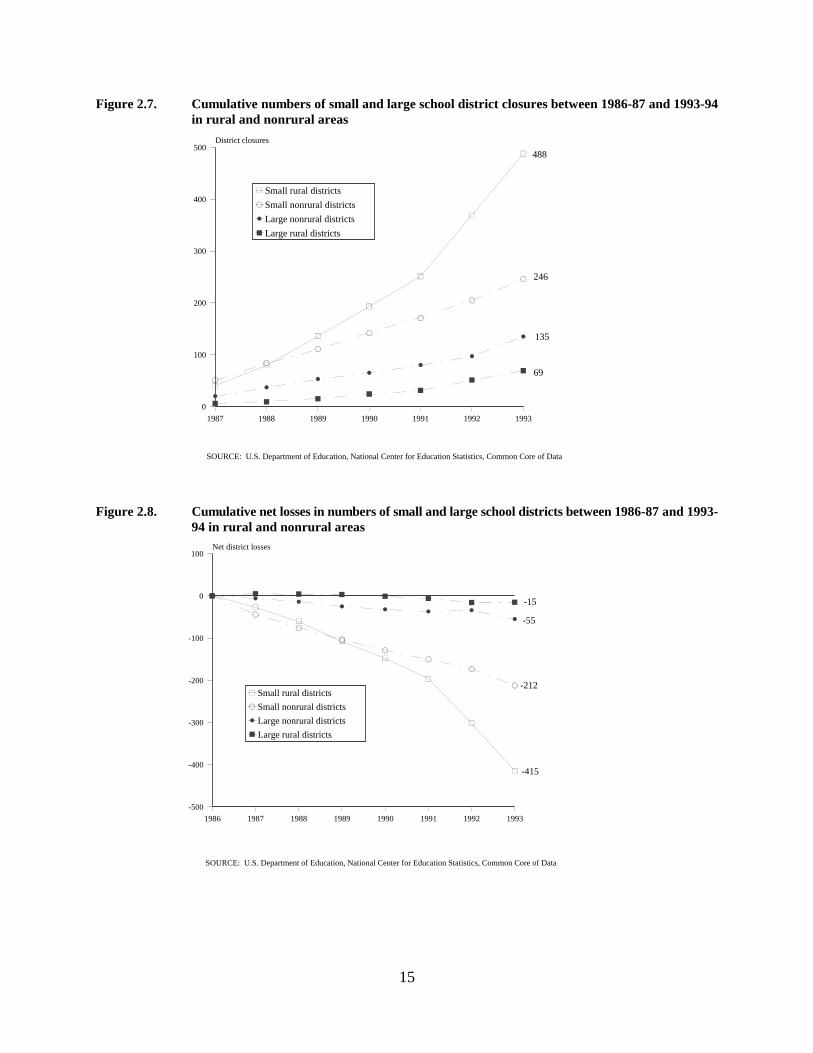
The most critical event that can happen to a school district is closure, with studentsassimilated into a nearby district or schools consolidated with a nearby district to form a “new”district. As shown in figure 2.7, about as many closures of small rural districts occurred between1986-87 and 1993-94 as in all other categories of districts combined. Generally, districts that closedwere small districts, whether they were rural or nonrural: only 2 to 3 percent of large districts closed.Finally, closures of small rural districts were not uniform over this period: almost half (237 out of488) occurred, in fact, between 1991-92 and 1993-94.
Some district consolidations resulted in the creation of a “new” district, and in a handful ofcases, a district split into two districts, also creating “new” districts. Therefore, net losses of smallrural and other districts were less than the total numbers of closures. As shown in figure 2.8, netlosses amounted to 9 percent in small rural districts. By contrast, there was less than 1 percent netloss of large school districts over this period. Finally, it should be noted that over half of the net lossin small rural districts (219 of 415) occurred between 1991-92 and 1993-94.
1987 1988 1989 1990 1991 1992 1993
0
100
200
300
400
500District closures
Small rural districts
Small nonrural districts
Large nonrural districts
Large rural districts
488
246
135
69
SOURCE: U.S. Department of Education, National Center for Education Statistics, Common Core of Data
1986 1987 1988 1989 1990 1991 1992 1993
0
100
-100
-200
-300
-400
-500
Net district losses
Small rural districts
Small nonrural districts
Large nonrural districts
Large rural districts
-415
-212
-55
-15
SOURCE: U.S. Department of Education, National Center for Education Statistics, Common Core of Data
15
Figure 2.7. Cumulative numbers of small and large school district closures between 1986-87 and 1993-94in rural and nonrural areas
Figure 2.8. Cumulative net losses in numbers of small and large school districts between 1986-87 and 1993-94 in rural and nonrural areas
1986 1987 1988 1989 1990 1991 1992 1993
0
50
-50
-100
-150
-200
-250
-300
Net district losses
Midwest
South Central
West
Northeast
-272
-64 (South Central)
-65 (West)
-11
SOURCE: U.S. Department of Education, National Center for Education Statistics, Common Core of Data
16
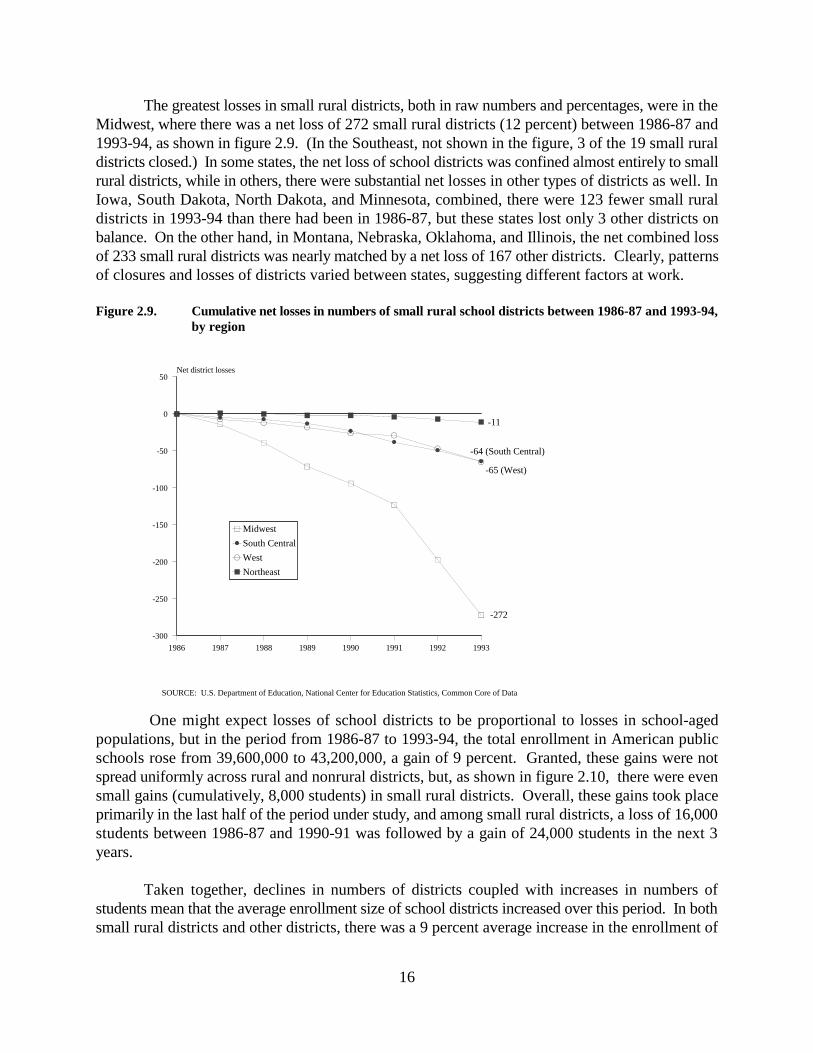
The greatest losses in small rural districts, both in raw numbers and percentages, were in theMidwest, where there was a net loss of 272 small rural districts (12 percent) between 1986-87 and1993-94, as shown in figure 2.9. (In the Southeast, not shown in the figure, 3 of the 19 small ruraldistricts closed.) In some states, the net loss of school districts was confined almost entirely to smallrural districts, while in others, there were substantial net losses in other types of districts as well. InIowa, South Dakota, North Dakota, and Minnesota, combined, there were 123 fewer small ruraldistricts in 1993-94 than there had been in 1986-87, but these states lost only 3 other districts onbalance. On the other hand, in Montana, Nebraska, Oklahoma, and Illinois, the net combined lossof 233 small rural districts was nearly matched by a net loss of 167 other districts. Clearly, patternsof closures and losses of districts varied between states, suggesting different factors at work.
Figure 2.9. Cumulative net losses in numbers of small rural school districts between 1986-87 and 1993-94,by region
One might expect losses of school districts to be proportional to losses in school-agedpopulations, but in the period from 1986-87 to 1993-94, the total enrollment in American publicschools rose from 39,600,000 to 43,200,000, a gain of 9 percent. Granted, these gains were notspread uniformly across rural and nonrural districts, but, as shown in figure 2.10, there were evensmall gains (cumulatively, 8,000 students) in small rural districts. Overall, these gains took placeprimarily in the last half of the period under study, and among small rural districts, a loss of 16,000students between 1986-87 and 1990-91 was followed by a gain of 24,000 students in the next 3years.
Taken together, declines in numbers of districts coupled with increases in numbers ofstudents mean that the average enrollment size of school districts increased over this period. In bothsmall rural districts and other districts, there was a 9 percent average increase in the enrollment of

1987 1988 1989 1990 1991 1992 1993
0
500
1,000
1,500
2,000
2,500
3,000
3,500
-500
Net enrollment gains in thousands
Small rural districts
Small nonrural districts
Large nonrural districts
Large rural districts
3,273
302
+25 (small, nonrural)
+8 (small, rural)
SOURCE: U.S. Department of Education, National Center for Education Statistics, Common Core of Data
When the comparison is based on the same set of districts in 1986-87 and 1993-94, the average increase in9
a small rural district is from 9 to 10 students per grade, compared to an increase from 171 to 212 students per gradein large, nonrural districts.
17
school districts (if they did not close). To the extent that rural schools might feel pressures due totheir minimal numbers of students, this is good news. The average size of rural school districts rosefrom 730 to 820, while the average size of nonrural school districts rose from 4,300 to 4,900. Thesechanges gave district administrators both the opportunity and need to take actions to deal withincreased enrollments, which are discussed in later chapters.
Figure 2.10. Cumulative net gains in numbers of students enrolled in small and large school districts in ruraland nonrural locations, between 1986-87 and 1993-94
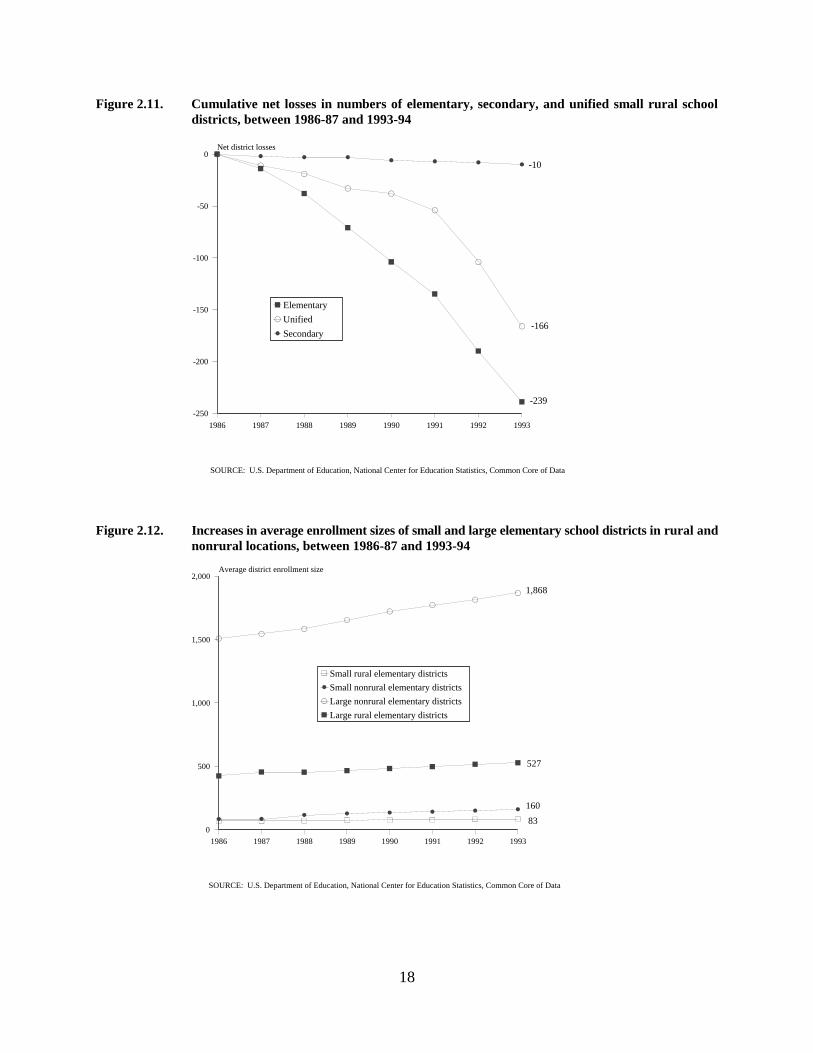
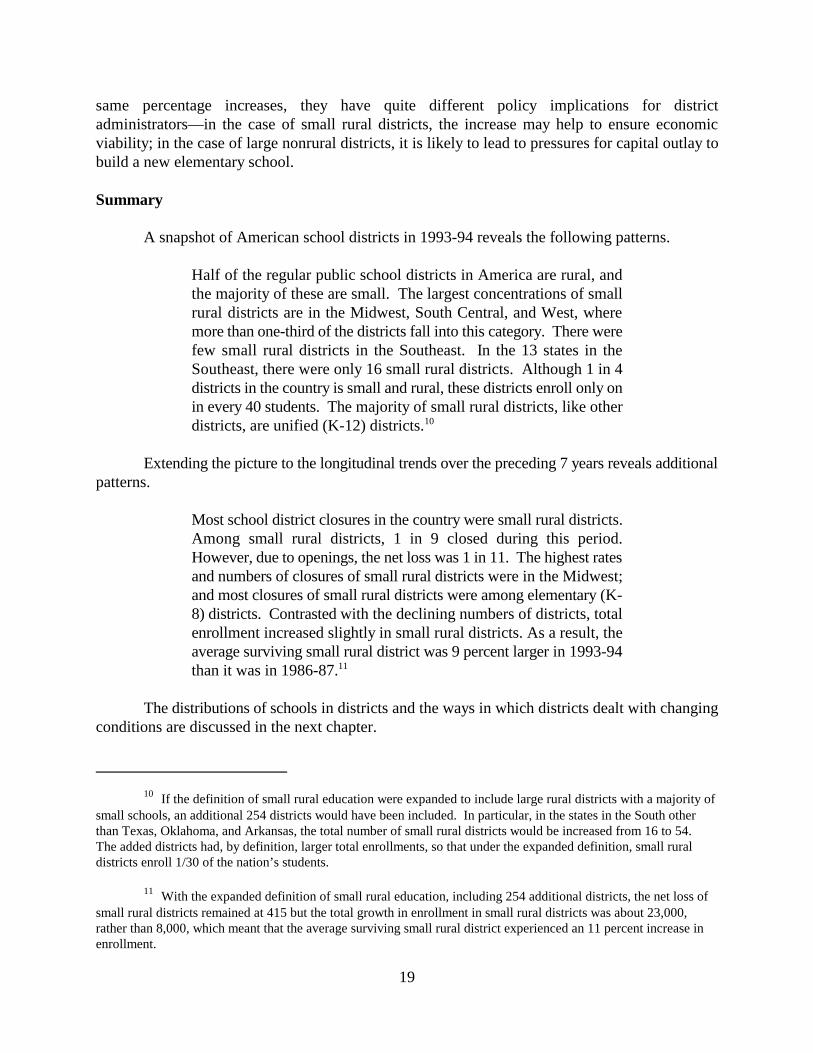
Net Loss by District Grade Level Types. Net losses of small rural districts were greatestamong elementary districts: as shown in figure 2.11, there were 16 percent fewer small ruralelementary districts in 1993-94 than there were in 1986-87, and this loss accelerated over the periodof observation. Extrapolating to the future in a straight line, one would expect the number of smallrural elementary districts to be only half their 1993-94 numbers by 2013-14.
At the same time that small rural elementary districts were declining in numbers, the totalnumber of students in these districts remained roughly constant. Therefore, the average enrollmentsin these districts increased, as shown in figure 2.12. An average surviving small rural elementarydistrict had 7.8 students per grade in 1986-87, and this average increased to 9.2 in 1993-94. To putthis in context, the average surviving large nonrural elementary district had 168 students per gradein 1986-87, and this average increased to 208 in 1993-94. Although these represent roughly the9
1986 1987 1988 1989 1990 1991 1992 1993
0
-50
-100
-150
-200
-250
Net district losses
Elementary
Unified
Secondary
-239
-166
-10
SOURCE: U.S. Department of Education, National Center for Education Statistics, Common Core of Data
1986 1987 1988 1989 1990 1991 1992 1993
0
500
1,000
1,500
2,000Average district enrollment size
Small rural elementary districts
Small nonrural elementary districts
Large nonrural elementary districts
Large rural elementary districts
1,868
527
160
83
SOURCE: U.S. Department of Education, National Center for Education Statistics, Common Core of Data
18
Figure 2.11. Cumulative net losses in numbers of elementary, secondary, and unified small rural schooldistricts, between 1986-87 and 1993-94
Figure 2.12. Increases in average enrollment sizes of small and large elementary school districts in rural andnonrural locations, between 1986-87 and 1993-94
If the definition of small rural education were expanded to include large rural districts with a majority of10
small schools, an additional 254 districts would have been included. In particular, in the states in the South otherthan Texas, Oklahoma, and Arkansas, the total number of small rural districts would be increased from 16 to 54. The added districts had, by definition, larger total enrollments, so that under the expanded definition, small ruraldistricts enroll 1/30 of the nation’s students.
With the expanded definition of small rural education, including 254 additional districts, the net loss of11
small rural districts remained at 415 but the total growth in enrollment in small rural districts was about 23,000,rather than 8,000, which meant that the average surviving small rural district experienced an 11 percent increase inenrollment.
19
same percentage increases, they have quite different policy implications for districtadministrators—in the case of small rural districts, the increase may help to ensure economicviability; in the case of large nonrural districts, it is likely to lead to pressures for capital outlay tobuild a new elementary school.
Summary
A snapshot of American school districts in 1993-94 reveals the following patterns.
Half of the regular public school districts in America are rural, andthe majority of these are small. The largest concentrations of smallrural districts are in the Midwest, South Central, and West, wheremore than one-third of the districts fall into this category. There werefew small rural districts in the Southeast. In the 13 states in theSoutheast, there were only 16 small rural districts. Although 1 in 4districts in the country is small and rural, these districts enroll only onin every 40 students. The majority of small rural districts, like otherdistricts, are unified (K-12) districts.10
Extending the picture to the longitudinal trends over the preceding 7 years reveals additionalpatterns.
Most school district closures in the country were small rural districts.Among small rural districts, 1 in 9 closed during this period.However, due to openings, the net loss was 1 in 11. The highest ratesand numbers of closures of small rural districts were in the Midwest;and most closures of small rural districts were among elementary (K-8) districts. Contrasted with the declining numbers of districts, totalenrollment increased slightly in small rural districts. As a result, theaverage surviving small rural district was 9 percent larger in 1993-94than it was in 1986-87.11
The distributions of schools in districts and the ways in which districts dealt with changingconditions are discussed in the next chapter.

20
21
3. Characteristics of Schools in Small Rural School Districts
In 1993-94, about 8,000 of the nation’s 84,000 publicschools were located in small rural districts (figure 3.1).Most small rural elementary districts operated a singleschool, while small rural secondary and unified districtsusually had 2 or 3 schools (figure 3.3). High schools infour-fifths of all rural districts had fewer than 100 studentsper grade (table 3.1). Some of the schools in small ruraldistricts were very small: a fifth of the schools in smallrural districts had fewer than one teacher per grade (figure3.4), including 64 percent of the elementary schools (figure3.5). There were relatively few intermediate schools andmany combined (K-12) schools in these districts (figure3.7). About a quarter of the schools serving primary gradesoffered prekindergarten, similar to findings in other typesof districts (figure 3.8). Finally, relatively few small ruraldistricts either offered ungraded instruction or operatedalternative, vocational, or special education schools (figure3.9).
Between 1986-87 and 1993-94, about 415 schools closedtheir doors as the small rural districts in which theyoperated closed, and 315 more were assimilated intoconsolidated districts. Even in small rural districts thatcontinued to operate, there was a net closure of 92 schools.There was a tendency for small rural districts to addintermediate schools, but there was a net loss of separateelementary and high schools in these districts (figure 3.13).The number of schools in small rural districts enrollingprekindergarten students more than doubled during thisperiod (figure 3.14), while the number offering ungradedinstruction declined (figure 3.15).

22
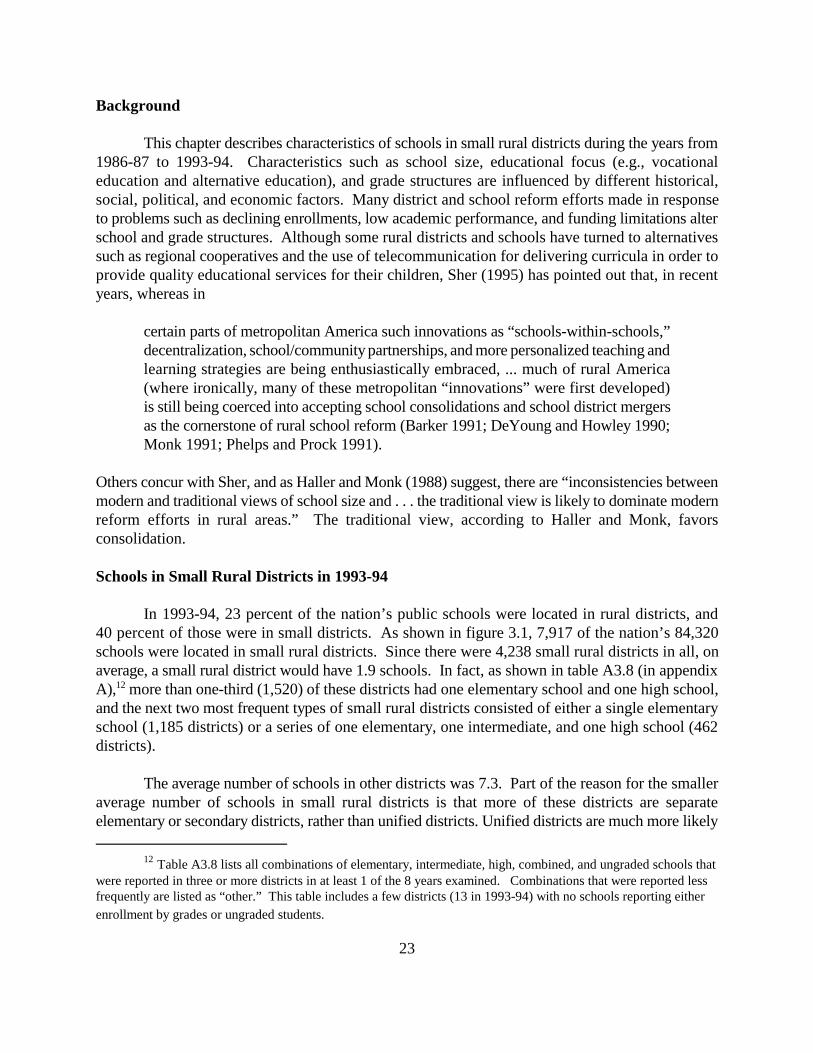
Table A3.8 lists all combinations of elementary, intermediate, high, combined, and ungraded schools that12
were reported in three or more districts in at least 1 of the 8 years examined. Combinations that were reported lessfrequently are listed as “other.” This table includes a few districts (13 in 1993-94) with no schools reporting eitherenrollment by grades or ungraded students.
23
Background
This chapter describes characteristics of schools in small rural districts during the years from1986-87 to 1993-94. Characteristics such as school size, educational focus (e.g., vocationaleducation and alternative education), and grade structures are influenced by different historical,social, political, and economic factors. Many district and school reform efforts made in responseto problems such as declining enrollments, low academic performance, and funding limitations alterschool and grade structures. Although some rural districts and schools have turned to alternativessuch as regional cooperatives and the use of telecommunication for delivering curricula in order toprovide quality educational services for their children, Sher (1995) has pointed out that, in recentyears, whereas in
certain parts of metropolitan America such innovations as “schools-within-schools,”decentralization, school/community partnerships, and more personalized teaching andlearning strategies are being enthusiastically embraced, ... much of rural America(where ironically, many of these metropolitan “innovations” were first developed)is still being coerced into accepting school consolidations and school district mergersas the cornerstone of rural school reform (Barker 1991; DeYoung and Howley 1990;Monk 1991; Phelps and Prock 1991).
Others concur with Sher, and as Haller and Monk (1988) suggest, there are “inconsistencies betweenmodern and traditional views of school size and . . . the traditional view is likely to dominate modernreform efforts in rural areas.” The traditional view, according to Haller and Monk, favorsconsolidation.
Schools in Small Rural Districts in 1993-94
In 1993-94, 23 percent of the nation’s public schools were located in rural districts, and40 percent of those were in small districts. As shown in figure 3.1, 7,917 of the nation’s 84,320schools were located in small rural districts. Since there were 4,238 small rural districts in all, onaverage, a small rural district would have 1.9 schools. In fact, as shown in table A3.8 (in appendixA), more than one-third (1,520) of these districts had one elementary school and one high school,12
and the next two most frequent types of small rural districts consisted of either a single elementaryschool (1,185 districts) or a series of one elementary, one intermediate, and one high school (462districts).
The average number of schools in other districts was 7.3. Part of the reason for the smalleraverage number of schools in small rural districts is that more of these districts are separateelementary or secondary districts, rather than unified districts. Unified districts are much more likely
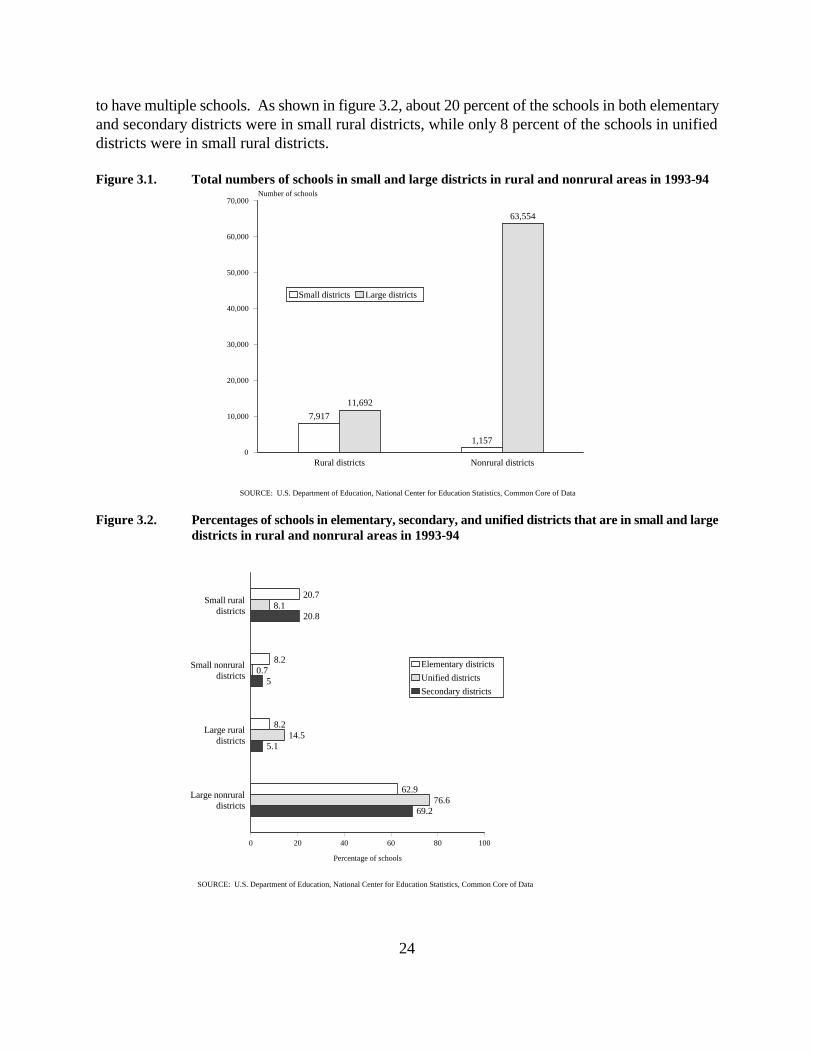
SOURCE: U.S. Department of Education, National Center for Education Statistics, Common Core of Data
7,917
1,157
11,692
63,554
Rural districts Nonrural districts0
10,000
20,000
30,000
40,000
50,000
60,000
70,000Number of schools
Small districts Large districts
SOURCE: U.S. Department of Education, National Center for Education Statistics, Common Core of Data
20.7
8.2
8.2
62.9
8.1
0.7
14.5
76.6
20.8
5
5.1
69.2
Small ruraldistricts
Small nonruraldistricts
Large ruraldistricts
Large nonruraldistricts
0 20 40 60 80 100
Percentage of schools
Elementary districts
Unified districts
Secondary districts
24
to have multiple schools. As shown in figure 3.2, about 20 percent of the schools in both elementaryand secondary districts were in small rural districts, while only 8 percent of the schools in unifieddistricts were in small rural districts.
Figure 3.1. Total numbers of schools in small and large districts in rural and nonrural areas in 1993-94
Figure 3.2. Percentages of schools in elementary, secondary, and unified districts that are in small and largedistricts in rural and nonrural areas in 1993-94
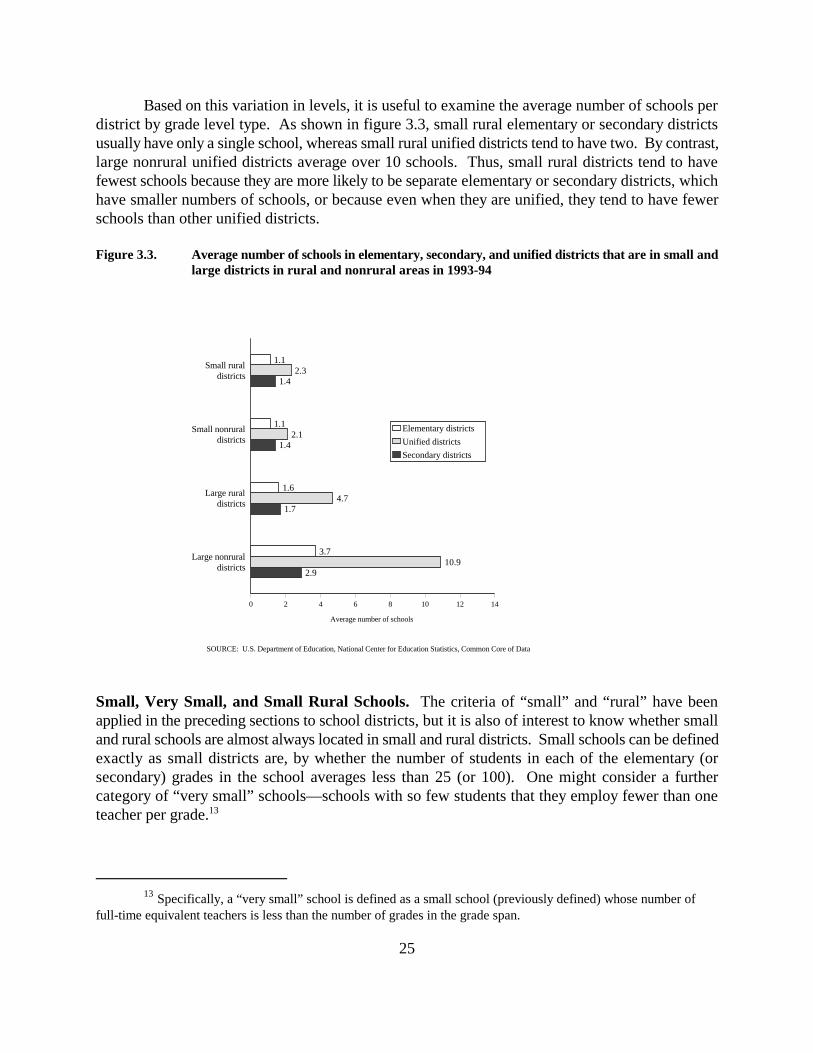
SOURCE: U.S. Department of Education, National Center for Education Statistics, Common Core of Data
1.1
1.1
1.6
3.7
2.3
2.1
4.7
10.9
1.4
1.4
1.7
2.9
Small ruraldistricts
Small nonruraldistricts
Large ruraldistricts
Large nonruraldistricts
0 2 4 6 8 10 12 14
Average number of schools
Elementary districts
Unified districts
Secondary districts
Specifically, a “very small” school is defined as a small school (previously defined) whose number of13
full-time equivalent teachers is less than the number of grades in the grade span.
25
Based on this variation in levels, it is useful to examine the average number of schools perdistrict by grade level type. As shown in figure 3.3, small rural elementary or secondary districtsusually have only a single school, whereas small rural unified districts tend to have two. By contrast,large nonrural unified districts average over 10 schools. Thus, small rural districts tend to havefewest schools because they are more likely to be separate elementary or secondary districts, whichhave smaller numbers of schools, or because even when they are unified, they tend to have fewerschools than other unified districts.
Figure 3.3. Average number of schools in elementary, secondary, and unified districts that are in small andlarge districts in rural and nonrural areas in 1993-94
Small, Very Small, and Small Rural Schools. The criteria of “small” and “rural” have beenapplied in the preceding sections to school districts, but it is also of interest to know whether smalland rural schools are almost always located in small and rural districts. Small schools can be definedexactly as small districts are, by whether the number of students in each of the elementary (orsecondary) grades in the school averages less than 25 (or 100). One might consider a furthercategory of “very small” schools—schools with so few students that they employ fewer than oneteacher per grade. 13

SOURCE: U.S. Department of Education, National Center for Education Statistics, Common Core of Data
Small ruraldistricts
Small nonruraldistricts
Large ruraldistricts
Large nonruraldistricts
0
20
40
60
80Percentage
(72.9)(76.2)
(21.2)(32.8)
(24.6)
(5)
(8.2)
(2.4)
Small Schools
Very small schools
26
While most schools in small districts were small in 1993-94, as shown in figure 3.4, therewere small schools, and even some very small schools, in large nonrural districts. These aretypically special-purpose schools, such as special education schools or continuation schools forstudents who would otherwise drop out. Small and very small schools in small or rural districts, onthe other hand, are generally the result of population sparseness, because they are typically the onlyschool in the district serving a particular grade level. Very small schools, fitting the size stereotypeof country schools of the late 19th century, still constitute 20 percent of the schools in small ruraldistricts. (Although they are even more common in small nonrural districts, there are relatively fewsuch districts. Very small schools are likely to be found in small rural settings.)
Figure 3.4. Percentages of schools that were small or very small, in small and large districts in rural andnonrural areas in 1993-94
Because schools have been categorized as “small” using the same students-per-gradethreshold used in categorizing districts as “small,” it may seem paradoxical that the percentages ofschools in small districts that are small are not close to 100 percent. The explanation for thisparadox is that many small unified districts have a single “small” high school (with fewer than 100students per grade) and a single “large” elementary school (with more than 25 students per grade):K-12 districts with a single elementary school and a single high school and about 30 to 45 studentsper grade would be counted as small districts, but their elementary schools would not be counted assmall. As seen in figure 3.5, only about 70 percent of schools in unified small rural districts weresmall, but about 90 percent of schools in separate elementary and secondary small rural districts weresmall.
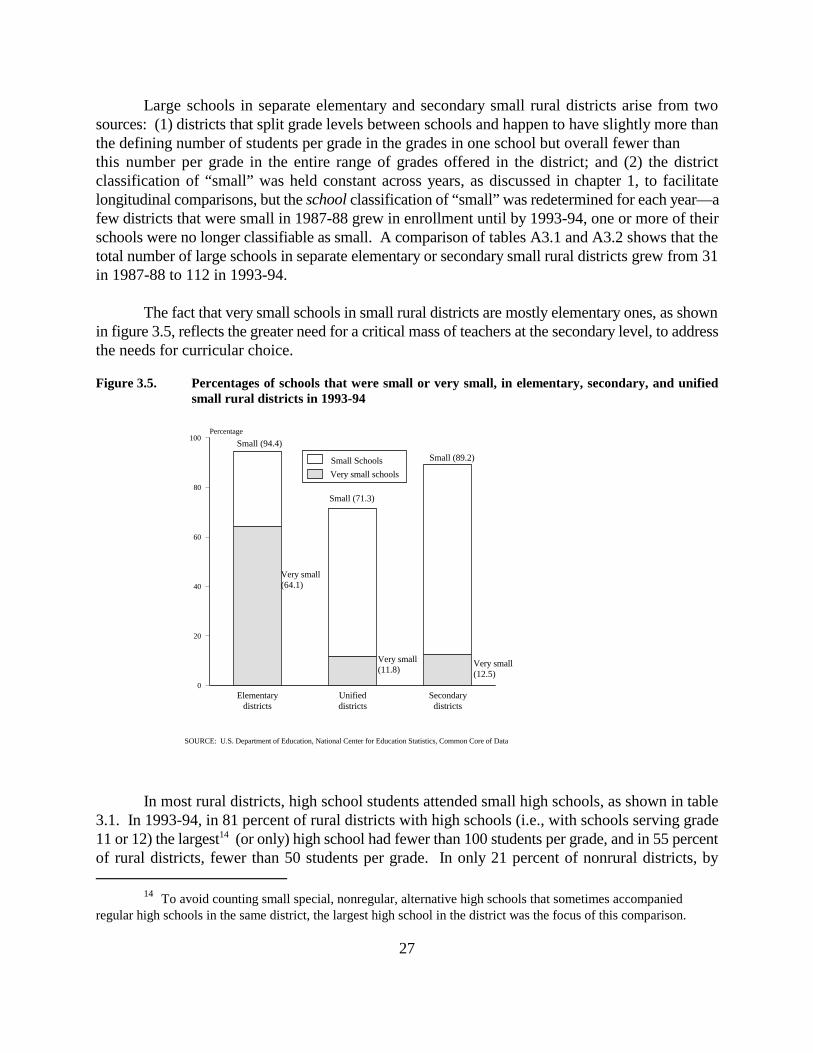
SOURCE: U.S. Department of Education, National Center for Education Statistics, Common Core of Data
Elementarydistricts
Unifieddistricts
Secondarydistricts
0
20
40
60
80
100Percentage
Small (94.4)
Very small(64.1)
Small (71.3)
Very small(11.8)
Small (89.2)
Very small(12.5)
Small Schools
Very small schools
To avoid counting small special, nonregular, alternative high schools that sometimes accompanied14
regular high schools in the same district, the largest high school in the district was the focus of this comparison.
27
Large schools in separate elementary and secondary small rural districts arise from twosources: (1) districts that split grade levels between schools and happen to have slightly more thanthe defining number of students per grade in the grades in one school but overall fewer than this number per grade in the entire range of grades offered in the district; and (2) the districtclassification of “small” was held constant across years, as discussed in chapter 1, to facilitatelongitudinal comparisons, but the school classification of “small” was redetermined for each year—afew districts that were small in 1987-88 grew in enrollment until by 1993-94, one or more of theirschools were no longer classifiable as small. A comparison of tables A3.1 and A3.2 shows that thetotal number of large schools in separate elementary or secondary small rural districts grew from 31in 1987-88 to 112 in 1993-94.
The fact that very small schools in small rural districts are mostly elementary ones, as shownin figure 3.5, reflects the greater need for a critical mass of teachers at the secondary level, to addressthe needs for curricular choice.
Figure 3.5. Percentages of schools that were small or very small, in elementary, secondary, and unifiedsmall rural districts in 1993-94
In most rural districts, high school students attended small high schools, as shown in table3.1. In 1993-94, in 81 percent of rural districts with high schools (i.e., with schools serving grade11 or 12) the largest (or only) high school had fewer than 100 students per grade, and in 55 percent14
of rural districts, fewer than 50 students per grade. In only 21 percent of nonrural districts, by

SOURCE: U.S. Department of Education, National Center for Education Statistics, Common Core of Data
Small ruraldistricts
Small nonruraldistricts
Large ruraldistricts
Large nonruraldistricts
0
20
40
60
80Percentage
Small (76.2)Small (72.9)
Small (24.6)
Small (8.2)
Small, rural (75.1)
Small, rural(1.6)
Small, rural(23.0)
Small, rural (1.3)
Small rural schools
Small schools
28
contrast, did all high schools have fewer than 100 students per grade, only 5 percent had fewer than50 students per grade.
Table 3.1. Percentages of rural and nonrural districts, by enrollment per grade in largest high school, in1993-94
Enrollment per Grade Rural Districts Nonrural Districts
Fewer than 50 54.9 4.850-99 26.1 16.5100-199 14.2 31.9200 or More 4.8 46.8
Total 100.0 100.0
Source: U.S. Department of Education, National Center for Education Statistics, Common Core of Data.
Note: Enrollments are for grades 9-12, in the largest school in a district that enrolled 11th or 12th grades.
The paradoxical comparisons concerning sizes of schools within districts do not appear tobe matched by similar conflicts in the definition of rural locale, although it would be definitionallypossible for many of the schools in rural districts to be, themselves, nonrural. As seen in figure 3.6,when the percentage of small rural schools is subtracted from the total percentage of small schools,only about 1 to 2 percent of the schools in rural districts were small but not rural. These arisebecause some multischool districts have a combination of rural and small town schools. They arecalled “rural districts” if more of their schools are rural than any of the other six locale categories,ranging from small town to large central city.
Figure 3.6. Percentages of schools that were small and rural, in small and large districts in rural andn areas in1
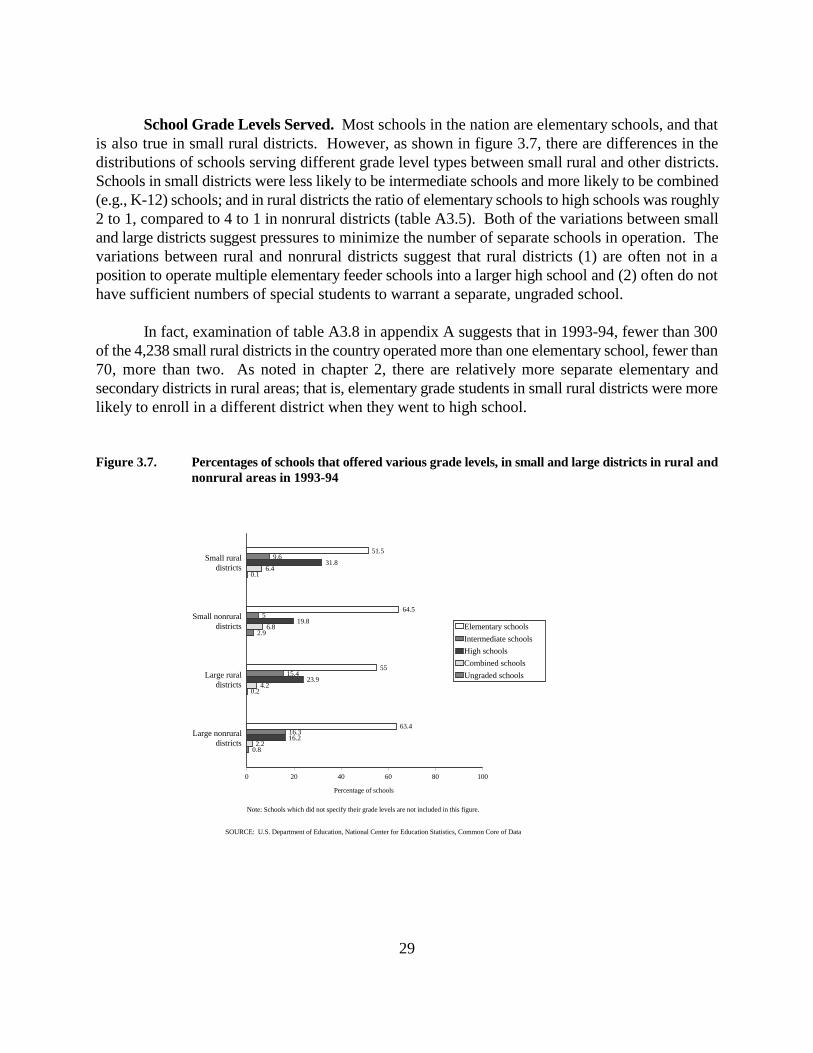
Note: Schools which did not specify their grade levels are not included in this figure.
51.5
64.5
55
63.4
9.6
5
15.4
16.3
31.8
19.8
23.9
16.2
6.4
6.8
4.2
2.2
0.1
2.9
0.2
0.8
Small ruraldistricts
Small nonruraldistricts
Large ruraldistricts
Large nonruraldistricts
0 20 40 60 80 100
Percentage of schools
Elementary schools
Intermediate schools
High schools
Combined schools
Ungraded schools
SOURCE: U.S. Department of Education, National Center for Education Statistics, Common Core of Data
29
School Grade Levels Served. Most schools in the nation are elementary schools, and thatis also true in small rural districts. However, as shown in figure 3.7, there are differences in thedistributions of schools serving different grade level types between small rural and other districts.Schools in small districts were less likely to be intermediate schools and more likely to be combined(e.g., K-12) schools; and in rural districts the ratio of elementary schools to high schools was roughly2 to 1, compared to 4 to 1 in nonrural districts (table A3.5). Both of the variations between smalland large districts suggest pressures to minimize the number of separate schools in operation. Thevariations between rural and nonrural districts suggest that rural districts (1) are often not in aposition to operate multiple elementary feeder schools into a larger high school and (2) often do nothave sufficient numbers of special students to warrant a separate, ungraded school.
In fact, examination of table A3.8 in appendix A suggests that in 1993-94, fewer than 300of the 4,238 small rural districts in the country operated more than one elementary school, fewer than70, more than two. As noted in chapter 2, there are relatively more separate elementary andsecondary districts in rural areas; that is, elementary grade students in small rural districts were morelikely to enroll in a different district when they went to high school.
Figure 3.7. Percentages of schools that offered various grade levels, in small and large districts in rural andnonrural areas in 1993-94
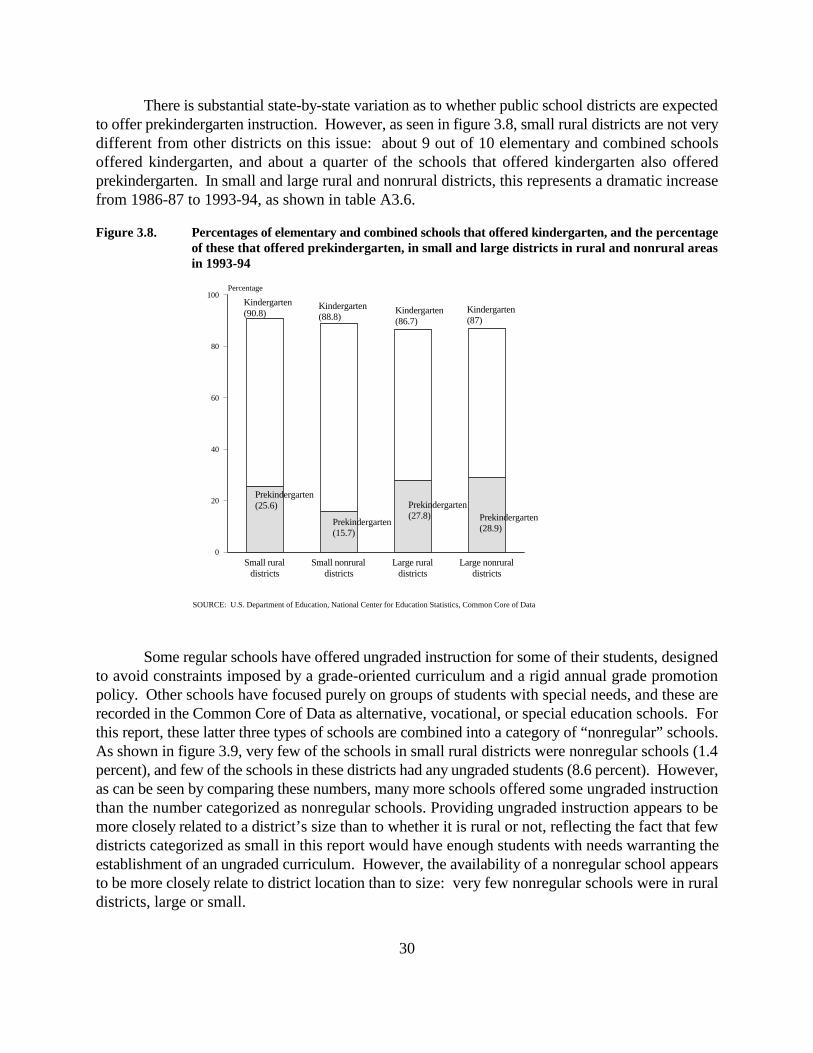
SOURCE: U.S. Department of Education, National Center for Education Statistics, Common Core of Data
Small ruraldistricts
Small nonruraldistricts
Large ruraldistricts
Large nonruraldistricts
0
20
40
60
80
100Percentage
Kindergarten (90.8)
Kindergarten (88.8)
Kindergarten (86.7)
Kindergarten (87)
Prekindergarten (25.6)
Prekindergarten (15.7)
Prekindergarten (27.8) Prekindergarten
(28.9)
30
There is substantial state-by-state variation as to whether public school districts are expectedto offer prekindergarten instruction. However, as seen in figure 3.8, small rural districts are not verydifferent from other districts on this issue: about 9 out of 10 elementary and combined schoolsoffered kindergarten, and about a quarter of the schools that offered kindergarten also offeredprekindergarten. In small and large rural and nonrural districts, this represents a dramatic increasefrom 1986-87 to 1993-94, as shown in table A3.6.
Figure 3.8. Percentages of elementary and combined schools that offered kindergarten, and the percentageof these that offered prekindergarten, in small and large districts in rural and nonrural areasin 1993-94
Some regular schools have offered ungraded instruction for some of their students, designedto avoid constraints imposed by a grade-oriented curriculum and a rigid annual grade promotionpolicy. Other schools have focused purely on groups of students with special needs, and these arerecorded in the Common Core of Data as alternative, vocational, or special education schools. Forthis report, these latter three types of schools are combined into a category of “nonregular” schools.As shown in figure 3.9, very few of the schools in small rural districts were nonregular schools (1.4percent), and few of the schools in these districts had any ungraded students (8.6 percent). However,as can be seen by comparing these numbers, many more schools offered some ungraded instructionthan the number categorized as nonregular schools. Providing ungraded instruction appears to bemore closely related to a district’s size than to whether it is rural or not, reflecting the fact that fewdistricts categorized as small in this report would have enough students with needs warranting theestablishment of an ungraded curriculum. However, the availability of a nonregular school appearsto be more closely relate to district location than to size: very few nonregular schools were in ruraldistricts, large or small.

SOURCE: U.S. Department of Education, National Center for Education Statistics, Common Core of Data
1.4
9.8
36.3
8.6
14.3
22.1
30.3
Small ruraldistricts
Small nonruraldistricts
Large ruraldistricts
Large nonruraldistricts
0
20
40
60
80
100Percentage
Nonregular schools Schools with ungraded students
31
Figure 3.9. Percentages of nonregular schools and schools offering ungraded instruction, in small and largedistricts in rural and nonrural areas in 1993-94
Trends in Schools in Small Rural Districts from 1986-87 to 1993-94
The major change that a local education agency can make in response to changingpopulations and changing funding is to open new schools or close old ones. They can also changethe span of grades offered in each school. Over the period from 1986-87 to 1993-94, as shown infigure 3.10, a substantial number of schools in small districts were closed, while a substantialnumber of schools were opened in large nonrural districts. The net loss of 507 schools in small ruraldistricts represents only a global summary of the processes occurring. A closer examination of thedata reveals that most school closures in small rural districts were in effect district closures, as noschools remained open in the district.
In some cases, as a district consolidated with another district, a school might remain open;however, in CCD such a school would be identified as a new school in the other district. In fact, asan automatic result of the 488 small rural district closures, 730 nominal school closures wererecorded, but because there were 315 “new” schools in adjacent districts that added enrollment whena district closed, the actual loss of schools through small rural district closure appears to be 415,which is, coincidentally, exactly the same as the net loss of small rural districts (see table 2.8). Inaddition, in continuing small rural districts not involved in a consolidation, there was a net loss of92 schools during this period. A tabulation of the frequencies of specific year-to-year transitions(e.g., from one elementary and one high school to one elementary, one intermediate, and one highschool) is shown in table A3.9 in appendix A.
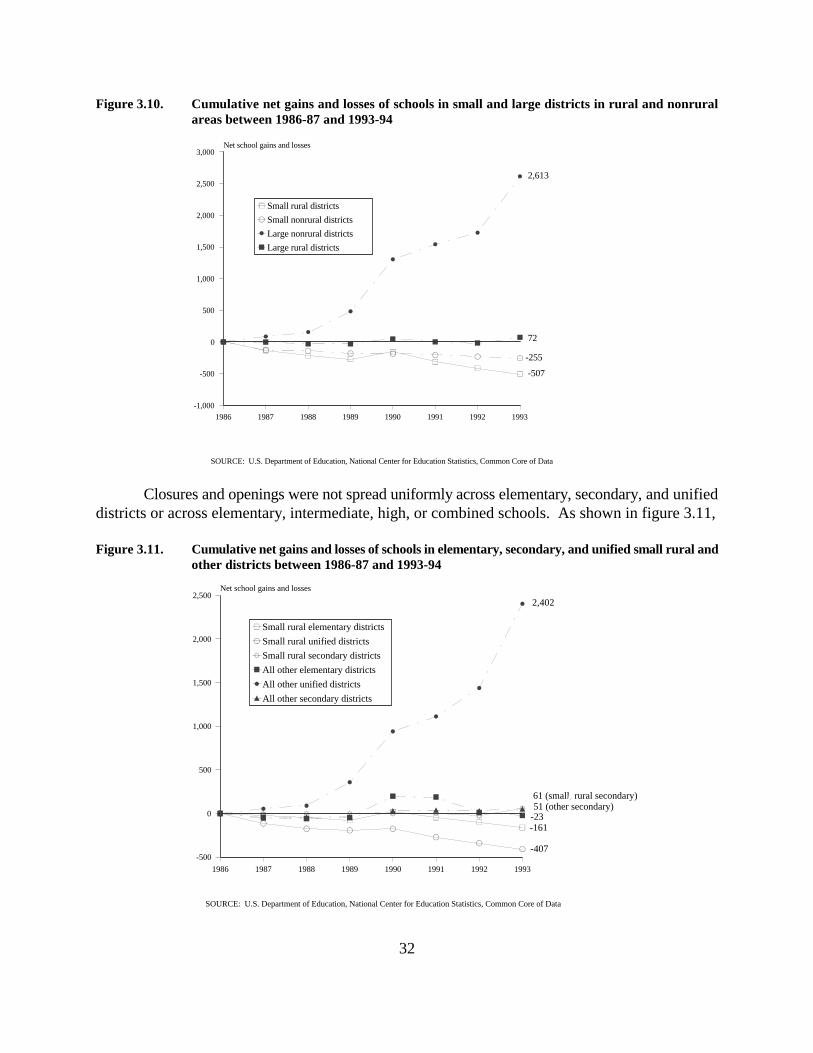
1986 1987 1988 1989 1990 1991 1992 1993
0
500
1,000
1,500
2,000
2,500
3,000
-500
-1,000
Net school gains and losses
Small rural districts
Small nonrural districts
Large nonrural districts
Large rural districts
-507
-255
72
2,613
SOURCE: U.S. Department of Education, National Center for Education Statistics, Common Core of Data
1986 1987 1988 1989 1990 1991 1992 1993
0
500
1,000
1,500
2,000
2,500
-500
Net school gains and losses
Small rural elementary districts
Small rural unified districts
Small rural secondary districts
All other elementary districts
All other unified districts
All other secondary districts
-407
-161
51 (other secondary)
2,402
SOURCE: U.S. Department of Education, National Center for Education Statistics, Common Core of Data
61 (small, rural secondary)
-23
32
Figure 3.10. Cumulative net gains and losses of schools in small and large districts in rural and nonruralareas between 1986-87 and 1993-94
Closures and openings were not spread uniformly across elementary, secondary, and unifieddistricts or across elementary, intermediate, high, or combined schools. As shown in figure 3.11,
Figure 3.11. Cumulative net gains and losses of schools in elementary, secondary, and unified small rural andother districts between 1986-87 and 1993-94
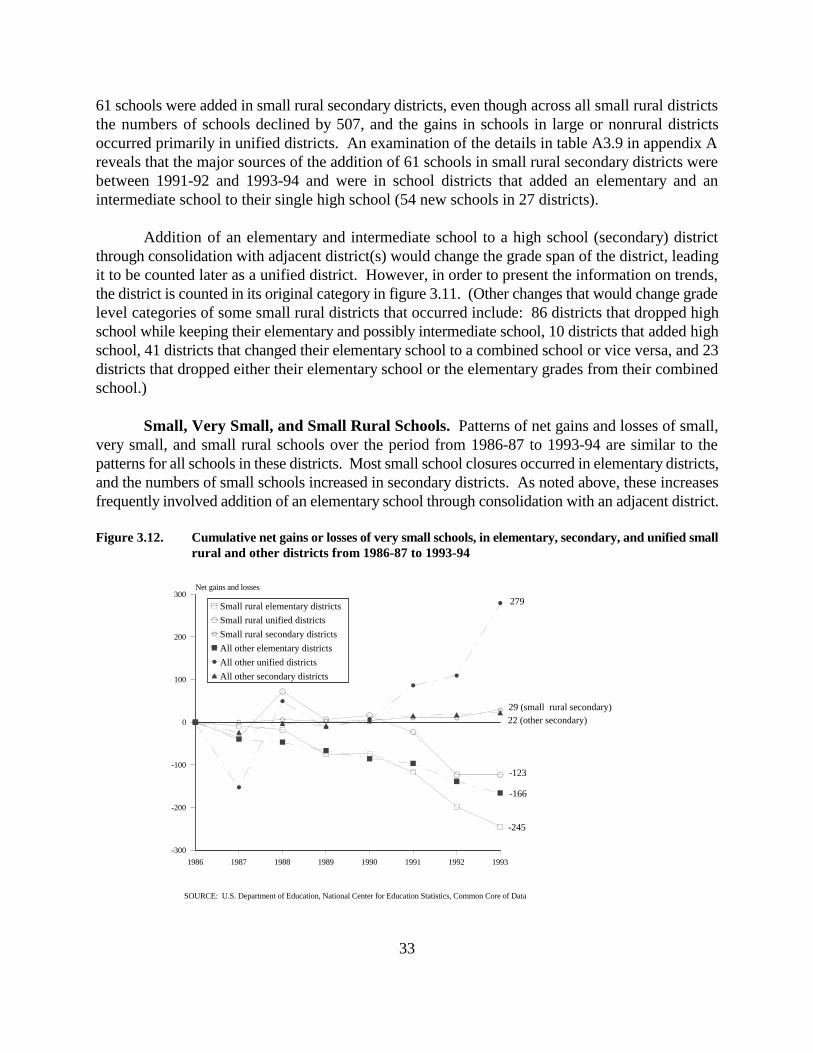
1986 1987 1988 1989 1990 1991 1992 1993
0
100
200
300
-100
-200
-300
Net gains and losses
Small rural elementary districts
Small rural unified districts
Small rural secondary districts
All other elementary districts
All other unified districts
All other secondary districts
-245
-166
22 (other secondary)
279
SOURCE: U.S. Department of Education, National Center for Education Statistics, Common Core of Data
29 (small, rural secondary)
-123
33
61 schools were added in small rural secondary districts, even though across all small rural districtsthe numbers of schools declined by 507, and the gains in schools in large or nonrural districtsoccurred primarily in unified districts. An examination of the details in table A3.9 in appendix Areveals that the major sources of the addition of 61 schools in small rural secondary districts werebetween 1991-92 and 1993-94 and were in school districts that added an elementary and anintermediate school to their single high school (54 new schools in 27 districts).
Addition of an elementary and intermediate school to a high school (secondary) districtthrough consolidation with adjacent district(s) would change the grade span of the district, leadingit to be counted later as a unified district. However, in order to present the information on trends,the district is counted in its original category in figure 3.11. (Other changes that would change gradelevel categories of some small rural districts that occurred include: 86 districts that dropped highschool while keeping their elementary and possibly intermediate school, 10 districts that added highschool, 41 districts that changed their elementary school to a combined school or vice versa, and 23districts that dropped either their elementary school or the elementary grades from their combinedschool.)
Small, Very Small, and Small Rural Schools. Patterns of net gains and losses of small,very small, and small rural schools over the period from 1986-87 to 1993-94 are similar to thepatterns for all schools in these districts. Most small school closures occurred in elementary districts,and the numbers of small schools increased in secondary districts. As noted above, these increasesfrequently involved addition of an elementary school through consolidation with an adjacent district.
Figure 3.12. Cumulative net gains or losses of very small schools, in elementary, secondary, and unified smallrural and other districts from 1986-87 to 1993-94

Note: Schools which did not specify their grade levels are not included in this figure.
-11.8
-20.8
-2.7
4.8
59
28.9
13.4
5.2
-12.6
-22.9
0.5
5.4
42.8
46.3
10
50.7
0
34.6
-50
-37
Small ruraldistricts
Small nonruraldistricts
Large ruraldistricts
Large nonruraldistricts
0 20 40 60 80-20-40-60
Percentage of schools
Elementary schools
Intermediate schools
High schools
Combined schools
Ungraded schools
SOURCE: U.S. Department of Education, National Center for Education Statistics, Common Core of Data
34
At the beginning of the period under examination, there were twice as many very smallschools in small rural districts as in large nonrural districts. However, because the net loss of 339very small schools in small rural districts, shown in figure 3.12, was “matched” by a net increase of428 very small schools in large nonrural districts, by 1993-94 there were roughly the same numberof very small schools (small schools with fewer than one teacher per grade) in both types of districts.
School Grade Levels Served. Substantial trends in changing grade spans of schoolscharacterized small rural districts between 1986-87 and 1993-94, as shown in figure 3.13. Inparticular, there was a 59 percent increase in total intermediate schools, from 480 to 763, in thesedistricts, and a 43 percent increase in total combined (e.g., K-12) schools, from 355 to 507. Manyseparate elementary and secondary districts were not only merging into unified districts, but theywere also merging their separate elementary and secondary schools into combined (K-12) schools.At the same time, there were also substantial increases in combined schools in large and nonruraldistricts, suggesting that the attraction of combining all grades in a single school is not limited tosmall rural districts.
Figure 3.13. Net percentage gains and losses of schools that offered various grade levels, in small and largedistricts in rural and nonrural areas between 1986-87 and 1993-94
One might expect that particular changes in the configurations of schools in a district wouldbe closely related to whether enrollment increased or decreased. However, some of the sametransitions occurred in small rural districts with both decreasing and increasing enrollment. Inparticular, frequent changes in small rural districts with one elementary school and one high school

1986 1987 1988 1989 1990 1991 1992 1993
0
50
100
150
200
250Net percentage gains
Small rural districts
Small nonrural districts
Large nonrural districts
Large rural districts
130.6%136.9%
155.6%
231%
SOURCE: U.S. Department of Education, National Center for Education Statistics, Common Core of Data
35
involved the opening or closing of an intermediate school. Among those with decreasing enrollmentin a year, 83 added an intermediate school while 45 dropped their intermediate school; and amongthose with increasing enrollment, 98 added an intermediate school while 44 dropped theirintermediate school. This can be attributed to the attractiveness of intermediate schools, but it mayalso suggest a lag of a year or two in district responses to changing enrollments. Further study ofthese changes is needed. A separate tabulation of changes in schools in districts with increasing anddeclining enrollment is presented in table A3.10 in appendix A.
A dramatic trend occurred during this time period in the enrollment of prekindergartenstudents, and it was felt as much in small rural districts as in other districts. As shown in figure 3.14,the number of districts enrolling prekindergarten students increased steadily and more than doubledin an 7-year period.
Figure 3.14. Cumulative percentage gains of schools enrolling prekindergarten students in small and largedistricts in rural and nonrural areas between 1986-87 and 1993-94
Finally, as noted above, by 1993-94, schools in small rural districts were less likely thanschools in other districts to offer ungraded instruction for some students, and schools in thesedistricts were less likely to be nonregular schools. However, the trends for these two attributes werein opposite directions. As shown in figure 3.15, there was a decline in percentage of schools in smallrural districts that offered ungraded instruction, and it was a more rapid decline than in other typesof districts.
In 1993-94, small rural districts were also less likely to operate separate alternative,vocational, or special education schools. However, in this case there was a substantial trend towardmore nonregular schools in small rural districts, as well as in other districts, as shown in figure 3.16.

1986 1987 1988 1989 1990 1991 1992 1993
0
10
-10
-20
-30
-40
Net percentage losses
Small rural districts
Small nonrural districts
Large nonrural districts
Large rural districts
-37%
-18.1%
-15.3%
-8.2%
SOURCE: U.S. Department of Education, National Center for Education Statistics, Common Core of Data
1986 1987 1988 1989 1990 1991 1992 1993
0
20
40
60
80
100
120
-20
-40
-60
Net percentage gains
Small rural districts
Small nonrural districts
Large nonrural districts
Large rural districts
10.7%
42.9% (small, rural)45.5% (large, rural)51.7%
SOURCE: U.S. Department of Education, National Center for Education Statistics, Common Core of Data
36
This increase was most pronounced during the period from 1989-90 to 1993-94, in which the numberof nonregular schools in small districts doubled, after declining during the preceding 3 years.
Figure 3.15. Trends in percentages of schools offering ungraded instruction, in small and large districts inrural and nonrural areas in 1993-94
Figure 3.16. Trends in percentages of nonregular schools, in small and large districts in rural and nonruralareas in 1993-94
If the definition of small rural education were expanded to include “large rural districts with a majority of15
small schools,” the picture would be similar. In the additional 254 small rural districts, there were an additional1,401 schools, or about 5 to 6 schools per district. As in the other small rural districts, many of the schools werevery small.
Although none of the additional 254 large rural districts with a majority of small schools in the expanded16
definition of small rural districts closed during this period, a net total of 76 schools in these districts were closed.
37
Summary
Focusing the snapshot of small rural school districts in 1993-94 on the schools in thosedistricts reveals the following patterns.
About 8,000 of the nation’s 84,000 public schools were in small ruraldistricts. Most small rural elementary districts consisted of a single15
school. Secondary and unified districts were somewhat more likelyto have two or three schools. A fifth of the schools in small ruraldistricts had fewer than one teacher per grade, and this included64 percent of the elementary schools. In four-fifths of all ruraldistricts, high schools had fewer than 100 students per grade. Therewere relatively few intermediate schools and many combined schoolsin these districts, and few small rural districts had multiple feederelementary schools for a high school.
About a quarter of the schools with kindergarten also offeredprekindergarten, similar to findings in other types of districts.Finally, relatively few of the schools in these districts offeredungraded instruction or were alternative, vocational, or specialeducation schools.
Extending this picture to longitudinal trends over the preceding 7 years reveals additionalpatterns.
During this period, about 415 schools closed as the small ruraldistricts in which they operated closed, and 315 more wereassimilated into consolidated districts. In addition, there was a netclosure of 92 schools in small rural districts that continued tooperate. There was a tendency to add intermediate schools and16
combined schools, while there was a loss of separate elementary andhigh schools in these districts. The number of schools enrollingprekindergarten students more than doubled during this period, whilethe number of schools, both regular and nonregular, offeringungraded instruction declined.

38

39
4. Characteristics of Students in Small Rural School Districts
In 1993-94, about 1,100,000 of the nation’s 43,200,000public school students were enrolled in small rural districts.More of the students in small rural districts were eitherwhite or Native American than elsewhere, while fewer wereAsian or African American (table 4.1). Few school-agedchildren in small or rural districts (1.3 percent) werereported as having limited English proficiency (table 4.6);however, slightly more of the students in small ruraldistricts than elsewhere had Individualized EducationPrograms (IEPs) to address special educational needs(11.5 percent) (figure 4.7). In the South and West, but notin other regions, relatively more of the children in smallrural districts were living in poverty (figure 4.8).
During the latter part of the period from 1986-87 to 1993-94, enrollments increased in small rural districts, althoughnot as fast as elsewhere. Although percentages of minorityenrollment increased by 10 percent overall (from 31 percentto 34 percent of all public school students), they remainedvirtually constant in small rural districts, at about12 percent (table A4.1b). While the percentage of NativeAmericans in small rural districts grew, the percentages ofAsians and African Americans in these districts declined(figure 4.11). Finally, from 1987-88 to 1993-94, there wasa gradual increase in the proportion of students withIndividualized Education Programs (IEPs) in small ruraldistricts, as well as in other types of districts (figure 4.12).

40
In this report, the racial/ethnic term "white" is used to refer to white, non-Hispanic students; and the term17
"African American" is used to refer to black, non-Hispanic students. The five categories for CCD reporting areBlack non-Hispanic, White non-Hispanic, Hispanic, American Indian/Alaskan Native, and Asian or Pacific Islander.
41
Background
Small rural school districts serve 2 to 3 percent of America’s public school students. Are thestudents in these districts different from other students? Previous research (Stern 1994; Phelps andProck 1991; Herzog and Pittman 1995) has found that students in rural areas are financially not aswell off as their urban counterparts; they are geographically, economically, and culturally isolated;their parents have lower educational levels and lower educational expectations for their children;they are at greater risk of dropping out and have lower aspirations for higher education. On the otherhand, they have more positive attitudes toward their schools and communities, and a higherpercentage participate in extracurricular activities.
The CCD provides basic information on student characteristics. Information on racialcomposition of the student body and the number of students with Individualized Education Programs(IEPs) to address special needs is available for each year from 1987-88 to 1993-94. The decennialCensus also provides information on school-aged children living in the area served by each schooldistrict, including the percentages of children with limited English proficiency (LEP) and living inpoverty in 1990. While the Census information gathered in 1990 cannot be considered current for1993-94, demographic changes are sufficiently gradual that they can be used to compare studentsenrolled in small rural districts with other students.
Students in Small Rural Districts in 1993-94
Minority Students. Recent projections suggest that by the year 2035, whites will no longer17
comprise the majority of the nation’s school-age population (Population Research Bureau 1993).Well before this time, Hispanics are expected to become the nation’s largest minority group. Theseprojections imply an increasing number of LEP students and an increasing demand for instructionalprograms for speakers of other languages. How are these changes affecting small rural districts?
In the 1993-94 school year, 135,000 African American, Hispanic, Asian, and NativeAmerican students were enrolled in small rural districts: about 1 percent of all minority students inthe country. As shown in figure 4.1, they constituted about 12 percent of the students in small ruraldistricts, a smaller percentage than in large districts and in nonrural districts. In large nonruraldistricts, where 85 percent of the nation’s students attend school, the percentage of minority studentswas 37 percent.
The lower percentages of minority students in small rural districts do not necessarily meanthat all small rural districts enroll few minority students. In fact, as shown in figure 4.2, in 1993-94there were 286 small rural school districts in which a majority of students were members of racialor ethnic minorities (i.e., African American, Hispanic, Asian, or Native American students). In small
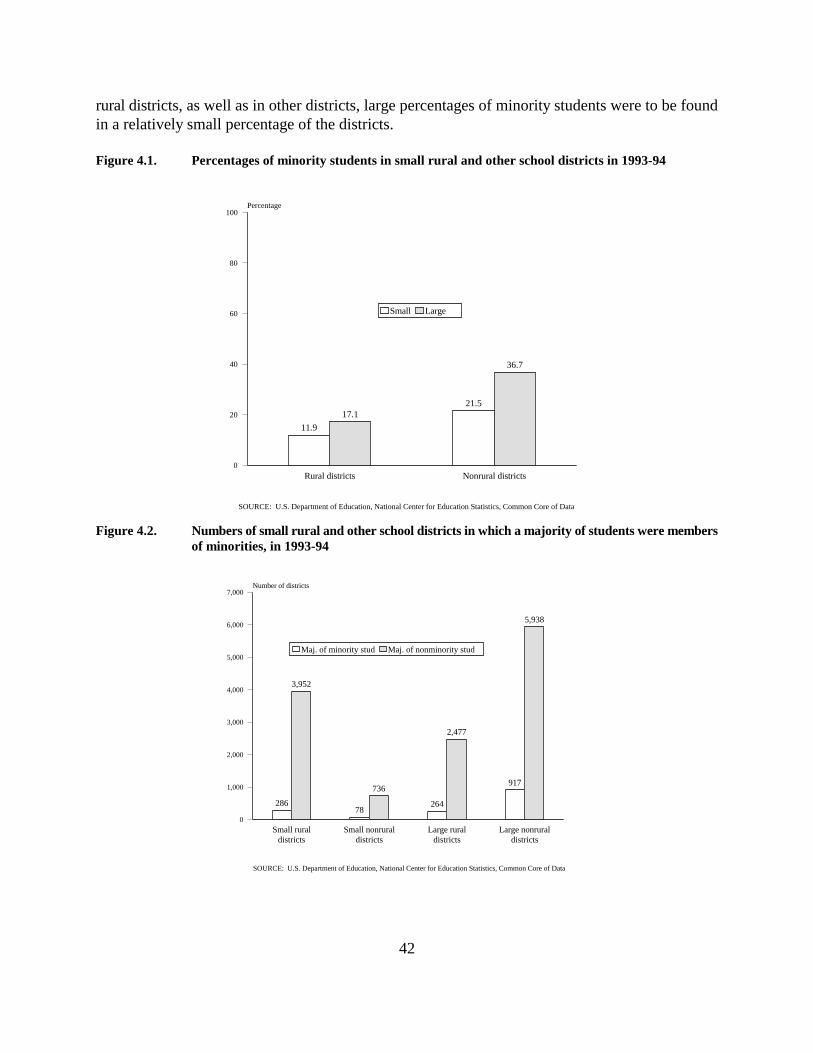
SOURCE: U.S. Department of Education, National Center for Education Statistics, Common Core of Data
11.9
21.517.1
36.7
Rural districts Nonrural districts0
20
40
60
80
100Percentage
Small Large
SOURCE: U.S. Department of Education, National Center for Education Statistics, Common Core of Data
28678
264
917
3,952
736
2,477
5,938
Small ruraldistricts
Small nonruraldistricts
Large ruraldistricts
Large nonruraldistricts
0
1,000
2,000
3,000
4,000
5,000
6,000
7,000Number of districts
Maj. of minority stud Maj. of nonminority stud
42
rural districts, as well as in other districts, large percentages of minority students were to be foundin a relatively small percentage of the districts.
Figure 4.1. Percentages of minority students in small rural and other school districts in 1993-94
Figure 4.2. Numbers of small rural and other school districts in which a majority of students were membersof minorities, in 1993-94

SOURCE: U.S. Department of Education, National Center for Education Statistics, Common Core of Data
41.4
54.6
47.3
64.9
Rural districts Nonrural districts0
20
40
60
80
100Percentage
Small Large
43
There has long been concern that many minority students may be relatively racially isolatedin districts with predominantly minority enrollment. Does the lower percentage of minority studentsin small rural districts mean that in these districts relatively fewer minority students are in districtswith greater than 50 percent minority enrollment? Although the percentages in figure 4.3 indicatethat a smaller percentage of minority students are enrolled in districts with a “majority of minorities”enrollment, in small rural districts, that percentage is still high: 41 percent of minority students insmall rural districts are in the 286 majority-minority districts. Although that constitutes lessisolation, numerically, than the enrollment of 65 percent of minority students in 917 large nonruralmajority-minority districts does, it may well represent racial and ethnic segregation across greaterdistances. Figure 4.3. Percentages of minority students who were in districts in which a majority of students were
members of minorities, in small rural and other school districts in 1993-94
Not all minorities are equally under-represented in small rural districts. Native Americansare, in fact, over-represented, as shown in figure 4.4. As shown in table 4.1, 10.5 percent of allNative American students were enrolled in small rural districts in 1993-94. On the other hand, Asianand African American students were least likely to be enrolled in small rural districts. For a completetable of counts of different racial and ethnic groups, see table A4.1c in appendix A. As a briefsummary of the pattern of enrollment of racial and ethnic minorities compared to other students:Native American students, and to a lesser extent white and Hispanic students, were relatively morelikely to be enrolled in small or rural districts. African American students were more frequentlyenrolled in large districts, and almost all Asian students were enrolled in large nonrural districts.Note that although the greatest numbers of all groups are enrolled in large nonrural districts, theproportion of all Native American students who are enrolled in small rural districts is almost threetimes as great as the proportion of white students who are in these districts.
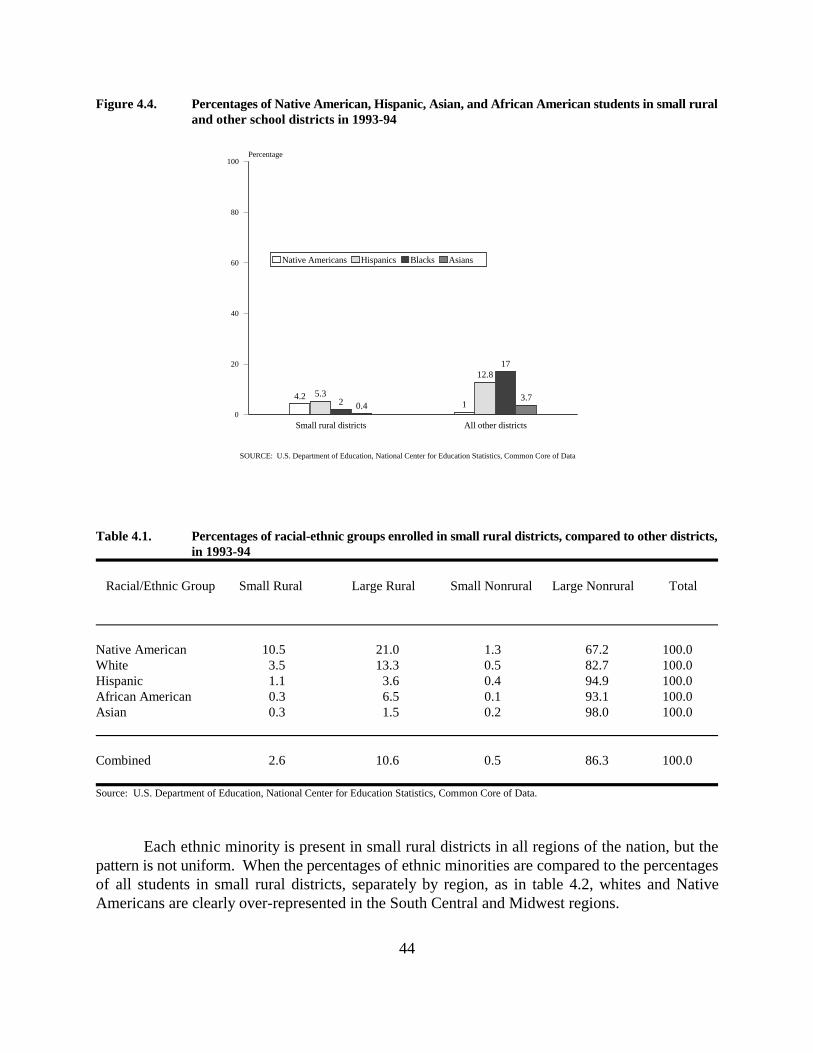
SOURCE: U.S. Department of Education, National Center for Education Statistics, Common Core of Data
4.21
5.3
12.8
2
17
0.43.7
Small rural districts All other districts0
20
40
60
80
100Percentage
Native Americans Hispanics Blacks Asians
44
Figure 4.4. Percentages of Native American, Hispanic, Asian, and African American students in small ruraland other school districts in 1993-94
Table 4.1. Percentages of racial-ethnic groups enrolled in small rural districts, compared to other districts,in 1993-94
Racial/Ethnic Group Small Rural Large Rural Small Nonrural Large Nonrural Total
Native American 10.5 21.0 1.3 67.2 100.0White 3.5 13.3 0.5 82.7 100.0Hispanic 1.1 3.6 0.4 94.9 100.0African American 0.3 6.5 0.1 93.1 100.0Asian 0.3 1.5 0.2 98.0 100.0
Combined 2.6 10.6 0.5 86.3 100.0
Source: U.S. Department of Education, National Center for Education Statistics, Common Core of Data.
Each ethnic minority is present in small rural districts in all regions of the nation, but thepattern is not uniform. When the percentages of ethnic minorities are compared to the percentagesof all students in small rural districts, separately by region, as in table 4.2, whites and NativeAmericans are clearly over-represented in the South Central and Midwest regions.

SOURCE: U.S. Department of Education, National Center for Education Statistics, Common Core of Data
1.3 1.61.6
4.2
Rural districts Nonrural districts0
5
10
15
20
25Percentage
Small Large
45
Table 4.2. Percentage of students enrolled in small rural districts, by region and racial-ethnic group in1993-94
All Students Native American White Hispanic African American Asian
Northeast 1.2 1.2 1.7 0.1 0.1 0.1Southeast 0.1 >0.05 0.1 >0.05 0.1 >0.05South Central 5.7 21.2 8.0 2.3 2.5 0.5Midwest 5.6 12.8 6.7 1.1 0.2 1.1West 2.0 7.9 2.7 0.9 0.2 0.2
All regions 2.6 10.5 3.5 1.1 0.3 0.3
Source: U.S. Department of Education, National Center for Education Statistics, Common Core of Data.
Students with Limited English Proficiency (LEP). Students whose native language is notEnglish are evaluated by schools to determine whether they need special instruction, such asbilingual instruction or instruction in English as a second language. Recent immigrants, includingboth Hispanic and Asian students, are more likely to be determined to have limited Englishproficiency, and it is of interest to know how many of the students in small rural districts areclassified as LEP. Although this information is not available directly in CCD, it is available fromthe school district mapping of the 1990 decennial Census data. Although, as will be discussed later,there were as much as 10 percent increases in Hispanic and Asian enrollments between 1990-91 and1993-94, the 1990 Census data provide an indication of the relative incidence of LEP students insmall rural districts at the mid-point of the time span covered in this report. These estimates arecompared to percentages in other districts in figure 4.5.
Figure 4.5. Percentages of school-aged children with limited English proficiency in small rural and otherschool districts in 1990-91
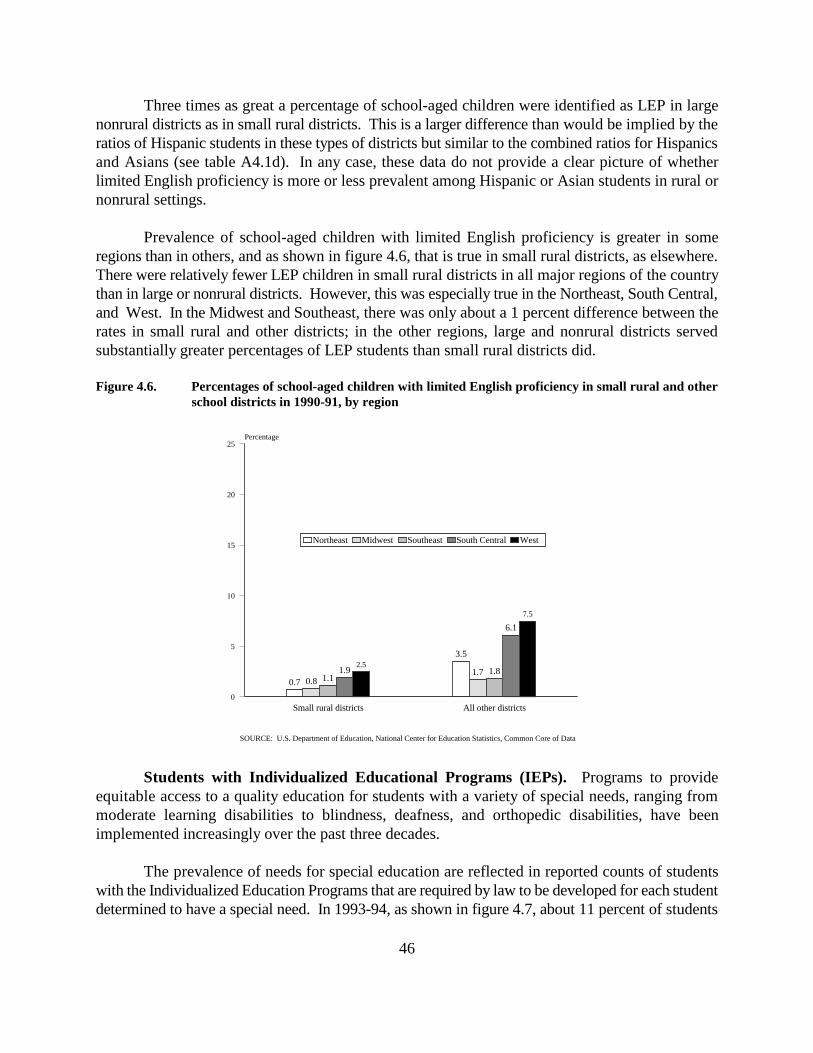
SOURCE: U.S. Department of Education, National Center for Education Statistics, Common Core of Data
0.7
3.5
0.81.7
1.11.81.9
6.1
2.5
7.5
Small rural districts All other districts0
5
10
15
20
25Percentage
Northeast Midwest Southeast South Central West
46
Three times as great a percentage of school-aged children were identified as LEP in largenonrural districts as in small rural districts. This is a larger difference than would be implied by theratios of Hispanic students in these types of districts but similar to the combined ratios for Hispanicsand Asians (see table A4.1d). In any case, these data do not provide a clear picture of whetherlimited English proficiency is more or less prevalent among Hispanic or Asian students in rural ornonrural settings.
Prevalence of school-aged children with limited English proficiency is greater in someregions than in others, and as shown in figure 4.6, that is true in small rural districts, as elsewhere.There were relatively fewer LEP children in small rural districts in all major regions of the countrythan in large or nonrural districts. However, this was especially true in the Northeast, South Central,and West. In the Midwest and Southeast, there was only about a 1 percent difference between therates in small rural and other districts; in the other regions, large and nonrural districts servedsubstantially greater percentages of LEP students than small rural districts did. Figure 4.6. Percentages of school-aged children with limited English proficiency in small rural and other
school districts in 1990-91, by region
Students with Individualized Educational Programs (IEPs). Programs to provideequitable access to a quality education for students with a variety of special needs, ranging frommoderate learning disabilities to blindness, deafness, and orthopedic disabilities, have beenimplemented increasingly over the past three decades.
The prevalence of needs for special education are reflected in reported counts of studentswith the Individualized Education Programs that are required by law to be developed for each studentdetermined to have a special need. In 1993-94, as shown in figure 4.7, about 11 percent of students
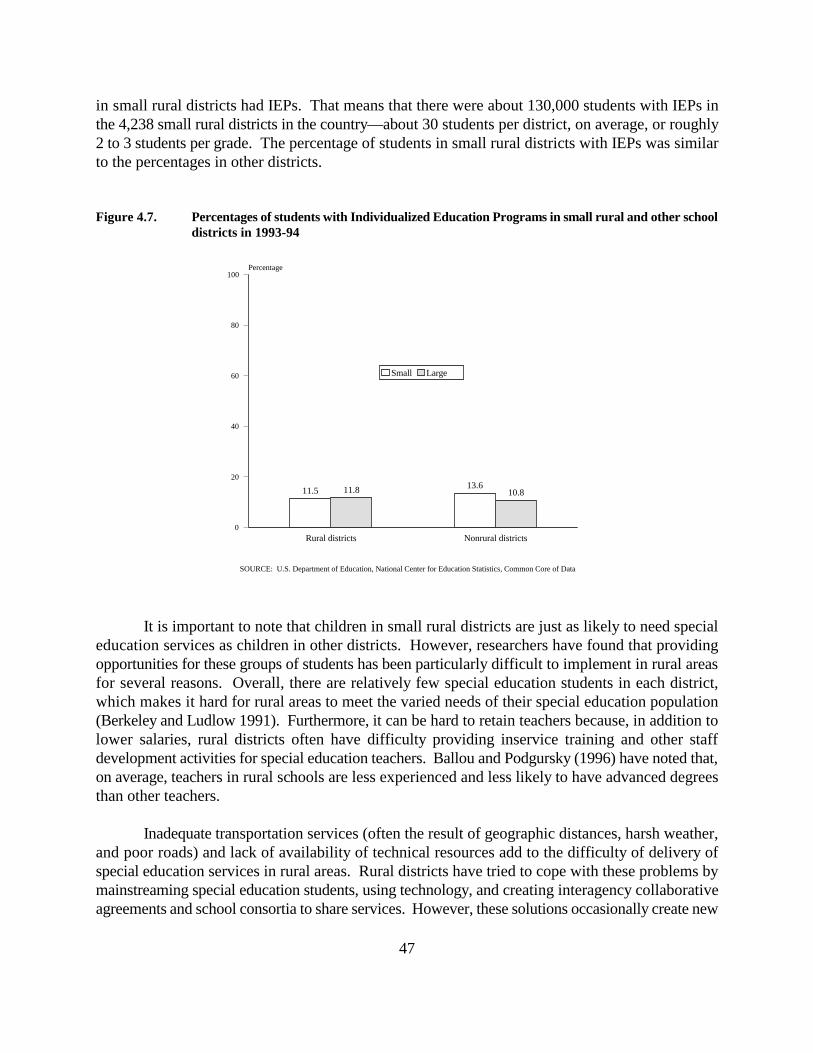
SOURCE: U.S. Department of Education, National Center for Education Statistics, Common Core of Data
11.513.611.8 10.8
Rural districts Nonrural districts0
20
40
60
80
100Percentage
Small Large
47
in small rural districts had IEPs. That means that there were about 130,000 students with IEPs inthe 4,238 small rural districts in the country—about 30 students per district, on average, or roughly2 to 3 students per grade. The percentage of students in small rural districts with IEPs was similarto the percentages in other districts.
Figure 4.7. Percentages of students with Individualized Education Programs in small rural and other schooldistricts in 1993-94
It is important to note that children in small rural districts are just as likely to need specialeducation services as children in other districts. However, researchers have found that providingopportunities for these groups of students has been particularly difficult to implement in rural areasfor several reasons. Overall, there are relatively few special education students in each district,which makes it hard for rural areas to meet the varied needs of their special education population(Berkeley and Ludlow 1991). Furthermore, it can be hard to retain teachers because, in addition tolower salaries, rural districts often have difficulty providing inservice training and other staffdevelopment activities for special education teachers. Ballou and Podgursky (1996) have noted that,on average, teachers in rural schools are less experienced and less likely to have advanced degreesthan other teachers.
Inadequate transportation services (often the result of geographic distances, harsh weather,and poor roads) and lack of availability of technical resources add to the difficulty of delivery ofspecial education services in rural areas. Rural districts have tried to cope with these problems bymainstreaming special education students, using technology, and creating interagency collaborativeagreements and school consortia to share services. However, these solutions occasionally create new
Note that the percentages of students in the high poverty quartile districts are higher than 25 percent for18
all four categories, small and large rural and nonrural, districts. The reason for this is that the quartiles are notweighted by enrollment. The percentages of students in high poverty districts are greater than 25 percent becausehigh poverty districts enroll more students on average than an equal number of low or medium poverty districts.
48
problems. For instance, school consortia can result in increased travel distances for students and lossof local control (Phelps and Prock 1991; Berkeley and Ludlow 1991).
Students in Poverty. As mentioned earlier, poverty is higher in rural areas than nonruralareas. Since the mid-1960s, federal policies in education have recognized the need to providesupplementary funding to school districts in high poverty areas to ensure equal access to educationfor disadvantaged students. The 1990 decennial Census estimated the percentage of school-agedchildren in each school district who are living in households whose incomes are below the poverty-line, and this information can help to describe students in small rural districts.
Although, like other Census measures (including percentages of children with limited Englishproficiency), the poverty percentage is based on students aged 5 to 17, whether or not they areenrolled in public schools, use of this measure to compare small rural and other public schooldistricts should involve relatively small error because roughly 90 percent of school-aged children areenrolled in public schools. Finally, for the purpose of this report, this 1990 percentage has been usedas an approximation for the entire period from 1986-87 to 1993-94. Although populations ofdistricts change, the income distribution changes are relatively slow, so the approximations shouldbe reasonably close for the 3 to 4 years on either side of 1990.
As shown in figure 4.8, between 15 and 25 percent of students in small rural districts areestimated to be living in households with incomes below the poverty line. In the Northeast andMidwest, the percentages in small rural districts are nearly the same as in other districts, but in theSouth and West, somewhat more of the students in small rural districts are in poverty than in otherdistricts.
The effects of poverty on educational opportunity are not limited to a student’s immediatehousehold (e.g., availability of reading material, a place to study, and parental modeling ofachievement). Schools in communities with a high level of poverty have more difficulty providingquality education for all of their students. Thus, it is of interest to look at poverty in terms of thepercentages of students enrolled in high, medium, and low poverty districts. Figure 4.9 shows thepercentages of students enrolled in the highest and lowest quarters of districts, ranked on percentageof children in poverty. 18
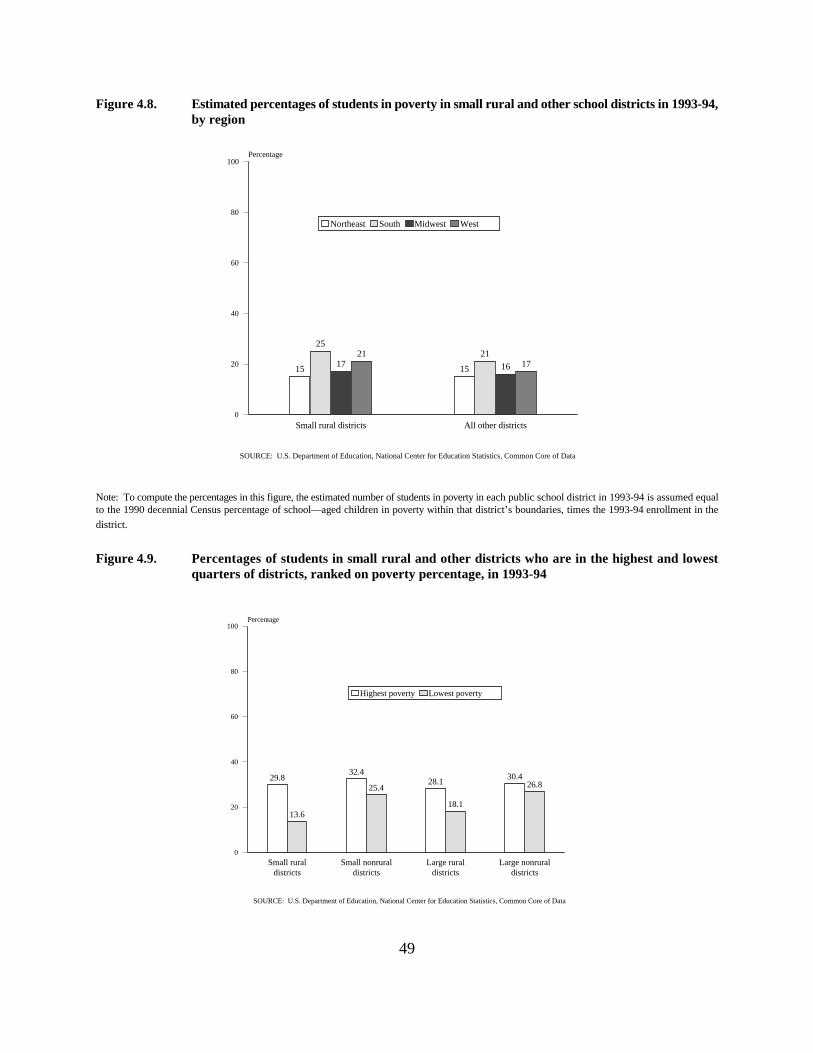
SOURCE: U.S. Department of Education, National Center for Education Statistics, Common Core of Data
15 15
2521
17 16
2117
Small rural districts All other districts0
20
40
60
80
100Percentage
Northeast South Midwest West
SOURCE: U.S. Department of Education, National Center for Education Statistics, Common Core of Data
29.832.4
28.130.4
13.6
25.4
18.1
26.8
Small ruraldistricts
Small nonruraldistricts
Large ruraldistricts
Large nonruraldistricts
0
20
40
60
80
100Percentage
Highest poverty Lowest poverty
49
Figure 4.8. Estimated percentages of students in poverty in small rural and other school districts in 1993-94,by region
Note: To compute the percentages in this figure, the estimated number of students in poverty in each public school district in 1993-94 is assumed equalto the 1990 decennial Census percentage of school—aged children in poverty within that district’s boundaries, times the 1993-94 enrollment in the
district.
Figure 4.9. Percentages of students in small rural and other districts who are in the highest and lowestquarters of districts, ranked on poverty percentage, in 1993-94
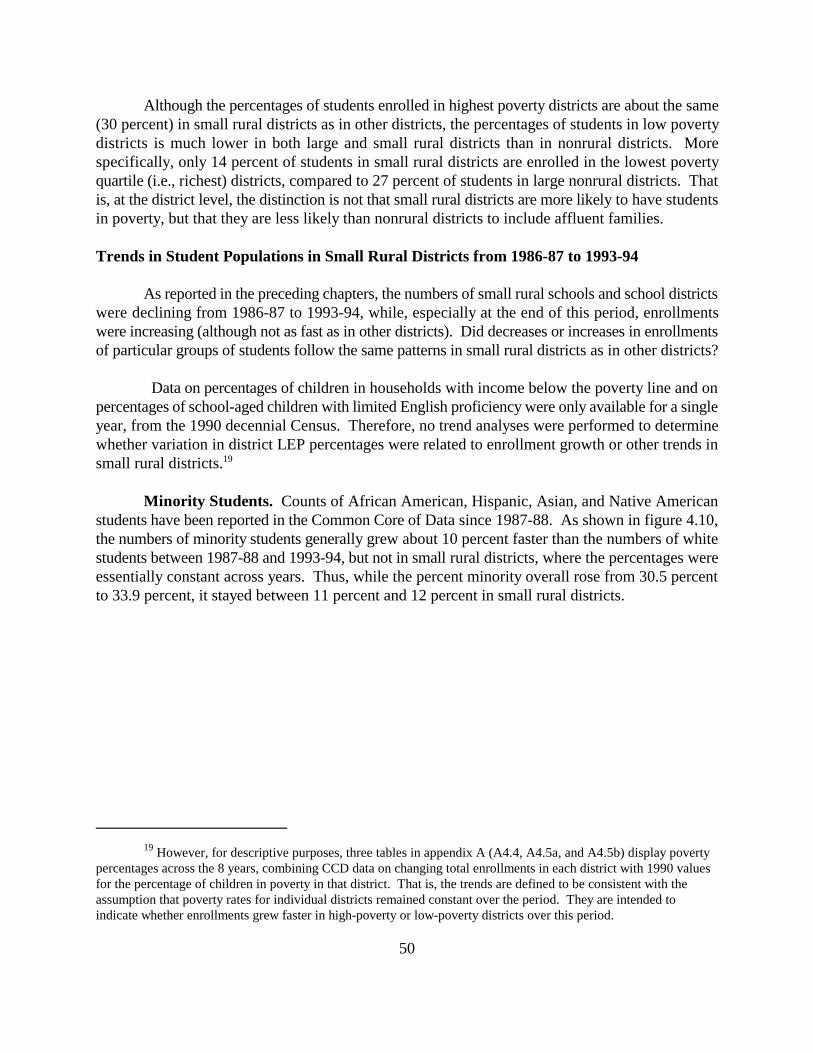
However, for descriptive purposes, three tables in appendix A (A4.4, A4.5a, and A4.5b) display poverty19
percentages across the 8 years, combining CCD data on changing total enrollments in each district with 1990 valuesfor the percentage of children in poverty in that district. That is, the trends are defined to be consistent with theassumption that poverty rates for individual districts remained constant over the period. They are intended toindicate whether enrollments grew faster in high-poverty or low-poverty districts over this period.
50
Although the percentages of students enrolled in highest poverty districts are about the same(30 percent) in small rural districts as in other districts, the percentages of students in low povertydistricts is much lower in both large and small rural districts than in nonrural districts. Morespecifically, only 14 percent of students in small rural districts are enrolled in the lowest povertyquartile (i.e., richest) districts, compared to 27 percent of students in large nonrural districts. Thatis, at the district level, the distinction is not that small rural districts are more likely to have studentsin poverty, but that they are less likely than nonrural districts to include affluent families.
Trends in Student Populations in Small Rural Districts from 1986-87 to 1993-94
As reported in the preceding chapters, the numbers of small rural schools and school districtswere declining from 1986-87 to 1993-94, while, especially at the end of this period, enrollmentswere increasing (although not as fast as in other districts). Did decreases or increases in enrollmentsof particular groups of students follow the same patterns in small rural districts as in other districts?
Data on percentages of children in households with income below the poverty line and onpercentages of school-aged children with limited English proficiency were only available for a singleyear, from the 1990 decennial Census. Therefore, no trend analyses were performed to determinewhether variation in district LEP percentages were related to enrollment growth or other trends insmall rural districts. 19
Minority Students. Counts of African American, Hispanic, Asian, and Native Americanstudents have been reported in the Common Core of Data since 1987-88. As shown in figure 4.10,the numbers of minority students generally grew about 10 percent faster than the numbers of whitestudents between 1987-88 and 1993-94, but not in small rural districts, where the percentages wereessentially constant across years. Thus, while the percent minority overall rose from 30.5 percentto 33.9 percent, it stayed between 11 percent and 12 percent in small rural districts.
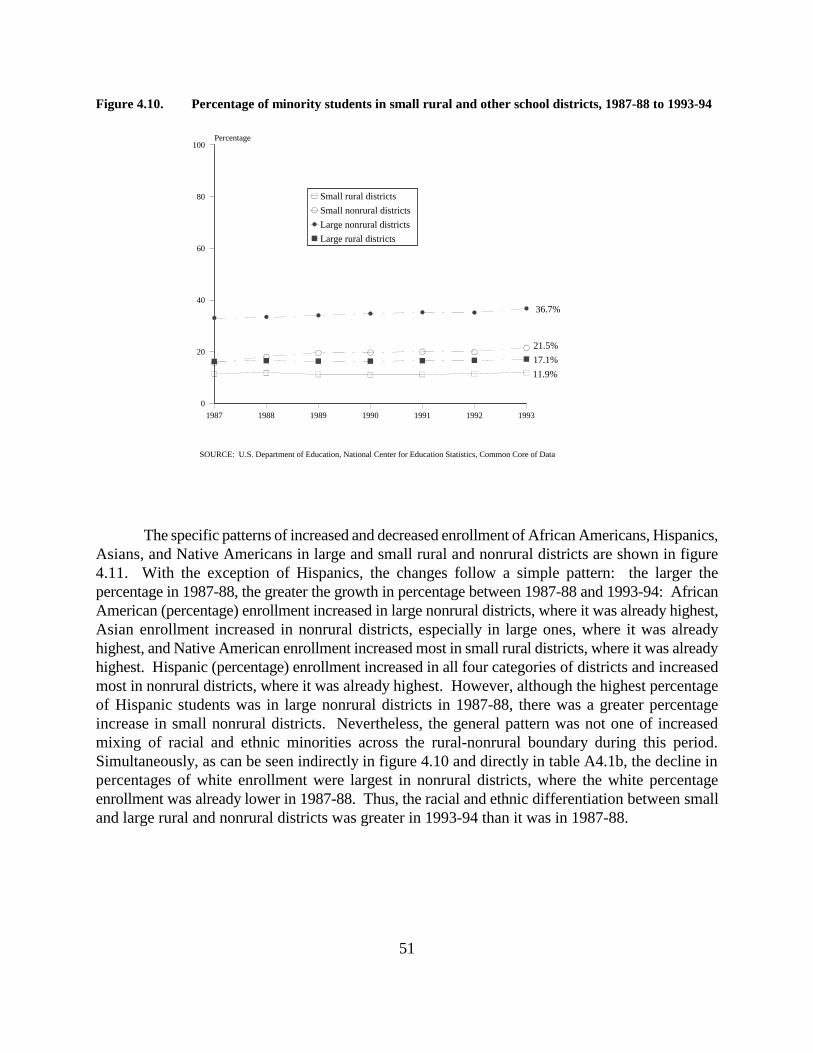
1987 1988 1989 1990 1991 1992 1993
0
20
40
60
80
100Percentage
Small rural districts
Small nonrural districts
Large nonrural districts
Large rural districts
11.9%
17.1%
21.5%
36.7%
SOURCE: U.S. Department of Education, National Center for Education Statistics, Common Core of Data
51
Figure 4.10. Percentage of minority students in small rural and other school districts, 1987-88 to 1993-94
The specific patterns of increased and decreased enrollment of African Americans, Hispanics,Asians, and Native Americans in large and small rural and nonrural districts are shown in figure4.11. With the exception of Hispanics, the changes follow a simple pattern: the larger thepercentage in 1987-88, the greater the growth in percentage between 1987-88 and 1993-94: AfricanAmerican (percentage) enrollment increased in large nonrural districts, where it was already highest,Asian enrollment increased in nonrural districts, especially in large ones, where it was alreadyhighest, and Native American enrollment increased most in small rural districts, where it was alreadyhighest. Hispanic (percentage) enrollment increased in all four categories of districts and increasedmost in nonrural districts, where it was already highest. However, although the highest percentageof Hispanic students was in large nonrural districts in 1987-88, there was a greater percentageincrease in small nonrural districts. Nevertheless, the general pattern was not one of increasedmixing of racial and ethnic minorities across the rural-nonrural boundary during this period.Simultaneously, as can be seen indirectly in figure 4.10 and directly in table A4.1b, the decline inpercentages of white enrollment were largest in nonrural districts, where the white percentageenrollment was already lower in 1987-88. Thus, the racial and ethnic differentiation between smalland large rural and nonrural districts was greater in 1993-94 than it was in 1987-88.
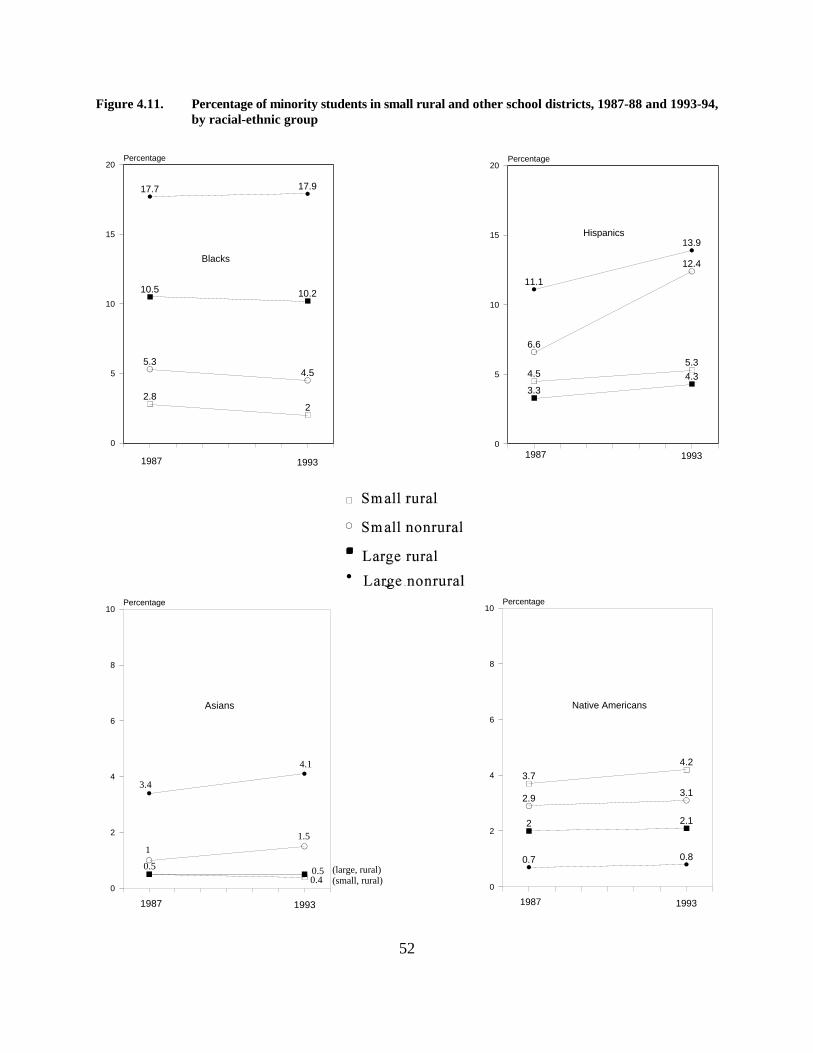
17.7 17.9
10.5 10.2
5.34.5
2.82
0
5
10
15
20Percentage
1987 1993
Blacks
11.1
13.9
3.3
4.3
6.6
12.4
4.55.3
0
5
10
15
20Percentage
1987 1993
Hispanics
0.7 0.8
2 2.1
2.93.1
3.7
4.2
0
2
4
6
8
10Percentage
1987 1993
Native Americans
0
2
4
6
8
10Percentage
1987 1993
Asians
3.4
4.1
1
1.5
0.5 0.50.4
(large, rural)(small, rural)
52
Figure 4.11. Percentage of minority students in small rural and other school districts, 1987-88 and 1993-94,by racial-ethnic group
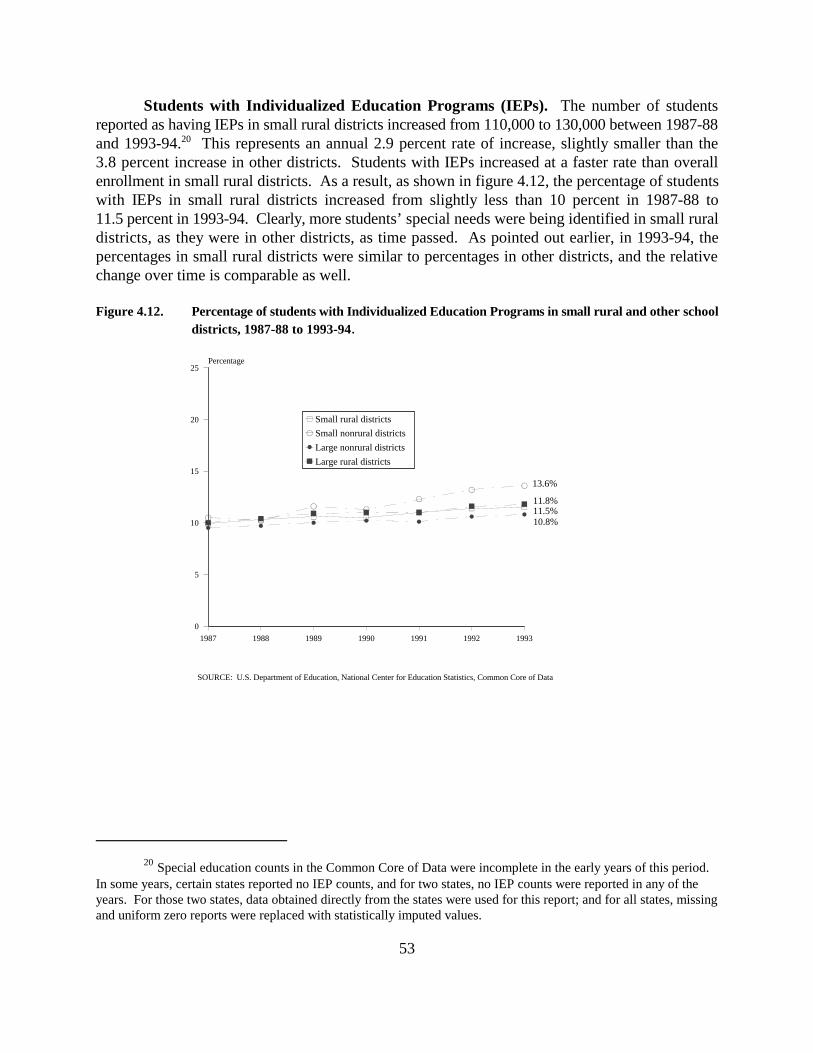
1987 1988 1989 1990 1991 1992 1993
0
5
10
15
20
25Percentage
Small rural districts
Small nonrural districts
Large nonrural districts
Large rural districts
11.5%11.8%
13.6%
SOURCE: U.S. Department of Education, National Center for Education Statistics, Common Core of Data
10.8%
Special education counts in the Common Core of Data were incomplete in the early years of this period. 20
In some years, certain states reported no IEP counts, and for two states, no IEP counts were reported in any of theyears. For those two states, data obtained directly from the states were used for this report; and for all states, missingand uniform zero reports were replaced with statistically imputed values.
53
Students with Individualized Education Programs (IEPs). The number of studentsreported as having IEPs in small rural districts increased from 110,000 to 130,000 between 1987-88and 1993-94. This represents an annual 2.9 percent rate of increase, slightly smaller than the20
3.8 percent increase in other districts. Students with IEPs increased at a faster rate than overallenrollment in small rural districts. As a result, as shown in figure 4.12, the percentage of studentswith IEPs in small rural districts increased from slightly less than 10 percent in 1987-88 to11.5 percent in 1993-94. Clearly, more students’ special needs were being identified in small ruraldistricts, as they were in other districts, as time passed. As pointed out earlier, in 1993-94, thepercentages in small rural districts were similar to percentages in other districts, and the relativechange over time is comparable as well.
Figure 4.12. Percentage of students with Individualized Education Programs in small rural and other schooldistricts, 1987-88 to 1993-94.

If the definition of small rural education were expanded to include large rural districts with a majority of21
small schools, the total number of students in small rural districts would be increased by 30 percent, but there wouldbe few differences in the findings. Under the expanded definition, the percentage of minority students would be 13percent rather than 12 percent; the percentage of African American students in these districts would be 3 percentinstead of 2 percent.
With the inclusion of large districts with a majority of small schools, the trends would essentially be the22
same, although the annual increases in the percentage of students with IEPs would have been more like other districtsat 3.1 percent rather than 2.9 percent.
54
Summary
Focusing the snapshot of small rural school districts in 1993-94 on the students in schoolsin those districts reveals the following patterns.
About 1,100,000 of the nation’s 43,200,000 public school studentswere enrolled in small rural districts. More of the students in smallrural districts were either white or Native American than elsewhere,while fewer were Asian or African American; and although more than50,000 Hispanic students were enrolled in small rural districts,relatively more were enrolled in urban districts. Fewer of the school-aged children in small or rural districts were reported as having limitedEnglish proficiency; however, slightly more of the students in smallrural districts were reported to have Individualized Education Programsto address special educational needs. As a national average, relativelymore children in small rural districts were living in poverty, but thispattern only occurred in the South Central, Southeast, and West.Overall, it was not the case that more of the students in small ruraldistricts were attending schools in the highest poverty districts; rather,fewer were in the most affluent districts (14 percent, compared to27 percent in large nonrural districts). 21
Extending this picture to trends over the preceding 7 years reveals additional patterns.
During the latter part of this period, enrollments increased in small ruraldistricts, although not as fast as elsewhere. Although the percentage ofminority enrollment increased by 10 percent overall (from 31 percentto 34 percent), it remained constant in small rural districts, at about12 percent. While the percentage of Native Americans in small ruraldistricts grew, the percentages of Asians and blacks in these districtsdeclined. Finally, between 1987-88 and 1993-94, there were gradualincreases in the proportion of students with Individualized EducationPrograms (IEPs) in small rural districts, as elsewhere.22
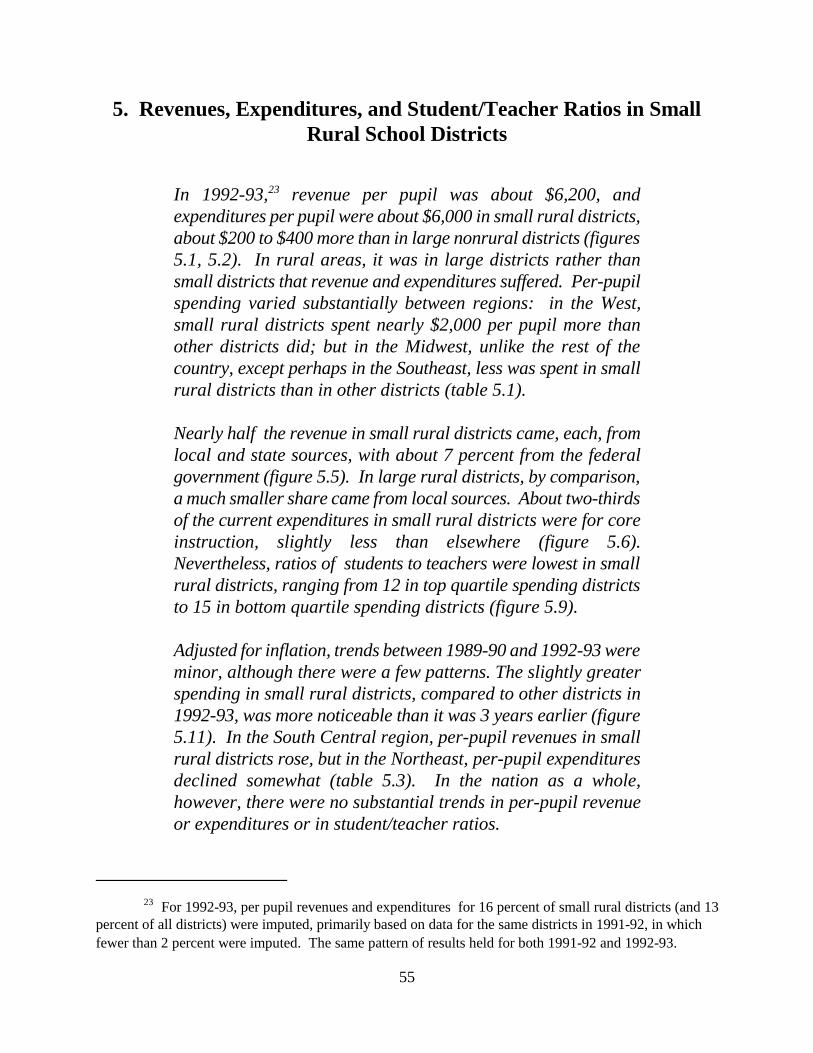
For 1992-93, per pupil revenues and expenditures for 16 percent of small rural districts (and 1323
percent of all districts) were imputed, primarily based on data for the same districts in 1991-92, in whichfewer than 2 percent were imputed. The same pattern of results held for both 1991-92 and 1992-93.
55
5. Revenues, Expenditures, and Student/Teacher Ratios in SmallRural School Districts
In 1992-93, revenue per pupil was about $6,200, and23
expenditures per pupil were about $6,000 in small rural districts,about $200 to $400 more than in large nonrural districts (figures5.1, 5.2). In rural areas, it was in large districts rather thansmall districts that revenue and expenditures suffered. Per-pupilspending varied substantially between regions: in the West,small rural districts spent nearly $2,000 per pupil more thanother districts did; but in the Midwest, unlike the rest of thecountry, except perhaps in the Southeast, less was spent in smallrural districts than in other districts (table 5.1).
Nearly half the revenue in small rural districts came, each, fromlocal and state sources, with about 7 percent from the federalgovernment (figure 5.5). In large rural districts, by comparison,a much smaller share came from local sources. About two-thirdsof the current expenditures in small rural districts were for coreinstruction, slightly less than elsewhere (figure 5.6).Nevertheless, ratios of students to teachers were lowest in smallrural districts, ranging from 12 in top quartile spending districtsto 15 in bottom quartile spending districts (figure 5.9).
Adjusted for inflation, trends between 1989-90 and 1992-93 wereminor, although there were a few patterns. The slightly greaterspending in small rural districts, compared to other districts in1992-93, was more noticeable than it was 3 years earlier (figure5.11). In the South Central region, per-pupil revenues in smallrural districts rose, but in the Northeast, per-pupil expendituresdeclined somewhat (table 5.3). In the nation as a whole,however, there were no substantial trends in per-pupil revenueor expenditures or in student/teacher ratios.

56

57
Background
During most of this century, powerful economic and social changes have taken place in ruralAmerica. As the economy has changed so that agriculture no longer is a major source ofemployment and income, rural areas have experienced an outmigration (DeYoung 1994; Stern 1994).Over the last 30 years, the proportion of the population that is of working age (i.e., 18 to 64) hascontinued to be higher in metropolitan areas than in rural ones, and the older segment of thepopulation has increased more in rural than in metropolitan areas (Herzog and Pittman 1995).Overall poverty rates in rural areas have historically exceeded those of urban areas of the country;however, in the previous chapter we saw that in the 1990s this rural disadvantage, as felt by smalldistricts, was primarily in the South and West.
Because of these factors, rural districts typically serve poorer populations with greater needs;they exist in areas with lower property values and therefore have a much smaller tax base for localeducational funding; and they often do not have the requisite funding to provide more than the mostbasic educational program for their students. As a result, they have been continually encouraged toconsolidate as a response to funding limitations and inadequate educational services (Bass 1990;Thompson 1990; DeYoung 1994; Verstegen 1990). In fact, school and district consolidations havebeen the single policy option used throughout the 20th century to try to achieve cost savings andimprove education in rural districts (Stephens 1988). On the other hand, many small rural districtsand schools offer environments that educational reformers have recently touted as effective forfostering positive student outcomes. These aspects include strong school and communitypartnerships, decentralized governance structures, low student/teacher ratios, and culturescharacterized as adaptive, flexible, and innovative in providing educational services with limitedresources (Haas and Lambert 1995; Stern 1995).
According to Stern (1994), rural residents pay a greater than average share of their incomefor schooling, even though poverty is high in rural areas (one-quarter of rural children lived inpoverty in 1986). Furthermore, previous research has shown a systematic effect of rural location onpublic school spending (Parrish, Matsumoto, and Fowler 1995) even after adjusting for varying costsand needs across school districts. As for sources of funding, Parrish, Matsumoto, and Fowler (1995)also documented discrepancies in expenditures across districts.
In this chapter, questions are addressed concerning whether size and characteristics of smallrural districts are translated into lower per-pupil revenues and expenditures and higherstudent/teacher ratios. By setting a higher local funding priority on education and by using extrastate and federal funds targeted to help rural areas, is it possible for small rural districts to achievethe same levels of resources as other districts? To what extent do they obtain revenues from stateand federal governments; and to what extent do their expenditures focus on core instructional costs?

SOURCE: U.S. Department of Education, National Center for Education Statistics, Common Core of Data; Bureau of the Census, F-33 Survey of Local Governments
$6220$6548
$5223
$5846
Small rural Small nonrural Large rural Large nonrural$0
$1000
$2000
$3000
$4000
$5000
$6000
$7000Revenue $ / Pupil
These comparisons do not take into account either different prices paid for educational resources (e.g.,24
teacher salaries) or different resource needs (e.g., transportation costs). However, an auxiliary analysis was carriedout adjusting revenues and expenditures for the district Teacher Cost Index developed by Chambers (1995). Theresults of those analyses indicated that salaries for comparably qualified teachers were lower in small rural districtsthan elsewhere.
58
Revenues, Expenditures and Student/Teacher Ratios in Small Rural School Districts in 1992-93
Per-Pupil Revenues and Expenditures. School districts annually report both revenues andexpenditures to NCES as part of the F-33 Census of Governments. Although revenues andexpenditures, in aggregate, should conform to very similar patterns across school districts as thesedistricts respond to budget balancing pressures, they are analyzed differently—revenues in terms ofsources (local, state, and federal) and expenditures in terms of school processes (instruction, support,and capital outlays). These data can be used to portray the financial status of small rural schooldistricts and how they differ from other districts.
As can be seen in figures 5.1 and 5.2, both revenues and expenditures per pupil were greaterin small districts than in large districts but less in rural districts than in nonrural districts. As a resultof the offsetting combination of these two factors, average revenues and expenditures per pupil werehigher in small rural districts than in large nonrural districts (revenues by $374/pupil andexpenditures by $207/pupil). Thus, even though the percentages of students living in poverty weregreater in small rural districts in some regions of the nation, public school finances in the smalldistricts in rural areas were not significantly depressed. In rural areas, it is the large districts that24
lag substantially in revenues and expenditures per pupil. Figure 5.1. Average per-pupil revenues in small rural and other school districts in 1992-93
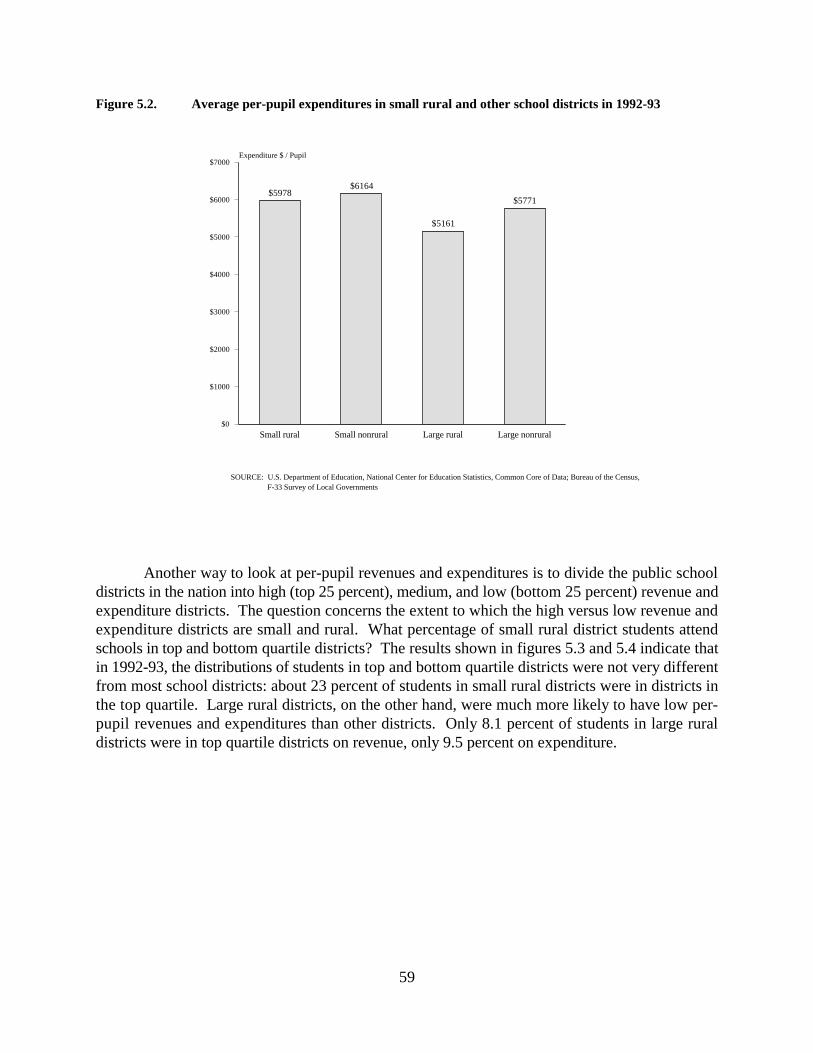
SOURCE: U.S. Department of Education, National Center for Education Statistics, Common Core of Data; Bureau of the Census, F-33 Survey of Local Governments
$5978$6164
$5161
$5771
Small rural Small nonrural Large rural Large nonrural$0
$1000
$2000
$3000
$4000
$5000
$6000
$7000Expenditure $ / Pupil
59
Figure 5.2. Average per-pupil expenditures in small rural and other school districts in 1992-93
Another way to look at per-pupil revenues and expenditures is to divide the public schooldistricts in the nation into high (top 25 percent), medium, and low (bottom 25 percent) revenue andexpenditure districts. The question concerns the extent to which the high versus low revenue andexpenditure districts are small and rural. What percentage of small rural district students attendschools in top and bottom quartile districts? The results shown in figures 5.3 and 5.4 indicate thatin 1992-93, the distributions of students in top and bottom quartile districts were not very differentfrom most school districts: about 23 percent of students in small rural districts were in districts inthe top quartile. Large rural districts, on the other hand, were much more likely to have low per-pupil revenues and expenditures than other districts. Only 8.1 percent of students in large ruraldistricts were in top quartile districts on revenue, only 9.5 percent on expenditure.
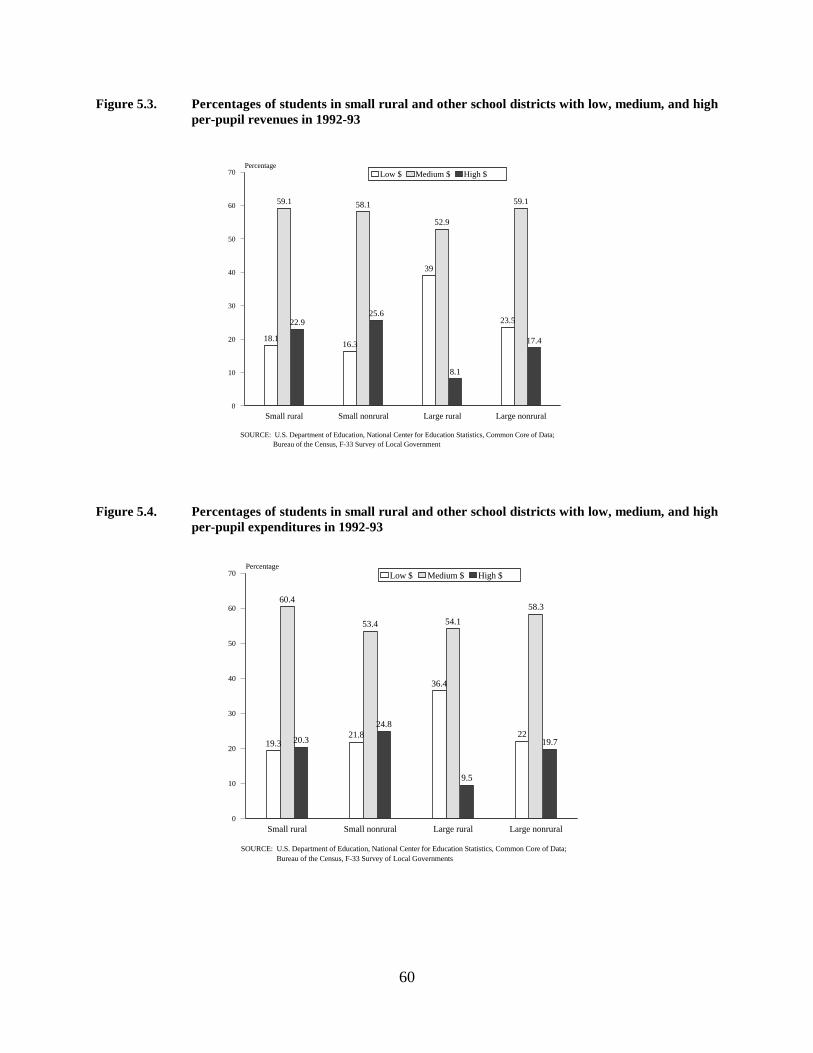
SOURCE: U.S. Department of Education, National Center for Education Statistics, Common Core of Data; Bureau of the Census, F-33 Survey of Local Government
18.116.3
39
23.5
59.1 58.1
52.9
59.1
22.925.6
8.1
17.4
Small rural Small nonrural Large rural Large nonrural0
10
20
30
40
50
60
70Percentage
Low $ Medium $ High $
SOURCE: U.S. Department of Education, National Center for Education Statistics, Common Core of Data; Bureau of the Census, F-33 Survey of Local Governments
19.321.8
36.4
22
60.4
53.4 54.1
58.3
20.3
24.8
9.5
19.7
Small rural Small nonrural Large rural Large nonrural0
10
20
30
40
50
60
70Percentage
Low $ Medium $ High $
60
Figure 5.3. Percentages of students in small rural and other school districts with low, medium, and highper-pupil revenues in 1992-93
Figure 5.4. Percentages of students in small rural and other school districts with low, medium, and highper-pupil expenditures in 1992-93
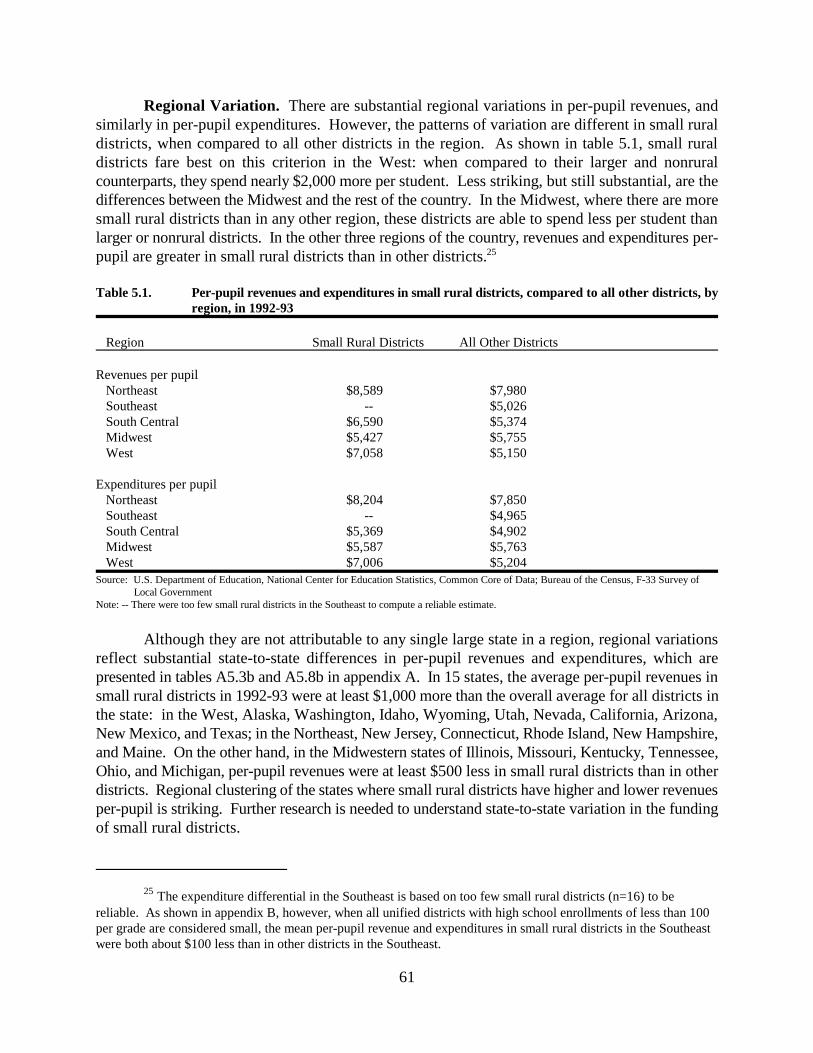
The expenditure differential in the Southeast is based on too few small rural districts (n=16) to be25
reliable. As shown in appendix B, however, when all unified districts with high school enrollments of less than 100per grade are considered small, the mean per-pupil revenue and expenditures in small rural districts in the Southeastwere both about $100 less than in other districts in the Southeast.
61
Regional Variation. There are substantial regional variations in per-pupil revenues, andsimilarly in per-pupil expenditures. However, the patterns of variation are different in small ruraldistricts, when compared to all other districts in the region. As shown in table 5.1, small ruraldistricts fare best on this criterion in the West: when compared to their larger and nonruralcounterparts, they spend nearly $2,000 more per student. Less striking, but still substantial, are thedifferences between the Midwest and the rest of the country. In the Midwest, where there are moresmall rural districts than in any other region, these districts are able to spend less per student thanlarger or nonrural districts. In the other three regions of the country, revenues and expenditures per-pupil are greater in small rural districts than in other districts. 25
Table 5.1. Per-pupil revenues and expenditures in small rural districts, compared to all other districts, byregion, in 1992-93
Region Small Rural Districts All Other Districts
Revenues per pupil Northeast $8,589 $7,980 Southeast -- $5,026 South Central $6,590 $5,374 Midwest $5,427 $5,755 West $7,058 $5,150
Expenditures per pupil Northeast $8,204 $7,850 Southeast -- $4,965 South Central $5,369 $4,902 Midwest $5,587 $5,763 West $7,006 $5,204Source: U.S. Department of Education, National Center for Education Statistics, Common Core of Data; Bureau of the Census, F-33 Survey of Local GovernmentNote: -- There were too few small rural districts in the Southeast to compute a reliable estimate.
Although they are not attributable to any single large state in a region, regional variationsreflect substantial state-to-state differences in per-pupil revenues and expenditures, which arepresented in tables A5.3b and A5.8b in appendix A. In 15 states, the average per-pupil revenues insmall rural districts in 1992-93 were at least $1,000 more than the overall average for all districts inthe state: in the West, Alaska, Washington, Idaho, Wyoming, Utah, Nevada, California, Arizona,New Mexico, and Texas; in the Northeast, New Jersey, Connecticut, Rhode Island, New Hampshire,and Maine. On the other hand, in the Midwestern states of Illinois, Missouri, Kentucky, Tennessee,Ohio, and Michigan, per-pupil revenues were at least $500 less in small rural districts than in otherdistricts. Regional clustering of the states where small rural districts have higher and lower revenuesper-pupil is striking. Further research is needed to understand state-to-state variation in the fundingof small rural districts.

There is an apparent paradox in table 5.2, that small rural unified districts, which combine elementary26
and secondary education, have lower per-pupil revenues and expenditures than elementary districts. This reflects thecombined effects of regional variation in the prevalence of elementary districts (see table A2.3b in appendix A) andin average spending. There were relatively larger percentages of elementary districts, compared to unified districts,among small rural districts in regions with relatively higher spending: the Northeast and West.
62
Grade Level Variations. Greater per-pupil expenditures are generally thought to be requiredfor a quality high school education than for elementary school, and information on the relative sizeof the differential in small rural districts as compared to other districts can shed light on the waysresources are allocated in rural areas. However, because the Common Core of Data financialinformation is only available at the district level, the comparison of costs at elementary andsecondary levels can only be based on the relatively small number of separate elementary andsecondary districts. Based on this subset of districts, small rural secondary districts have per-pupilrevenues of $556 and per-pupil expenditures of $1,199 more than small rural elementary districts,as shown in table 5.2. Generally, small rural elementary districts outspend other elementary districtsby roughly $1,000 per-pupil; while secondary and unified small rural districts only outspend theirlarger, nonrural counterparts by $100 to $300 per pupil on average. 26
Table 5.2. Per-pupil revenues and expenditures in small rural districts, compared to all other districts, bygrade level served, in 1992-93
Region Small rural Districts All Other Districts
Revenues per pupil Elementary $6,917 $5,608 Unified $6,104 $5,753 Secondary $7,473 $7,369 Expenditures per pupil Elementary $6,369 $5,470 Unified $5,876 $5,683 Secondary $7,568 $7,286Source: U.S. Department of Education, National Center for Education Statistics, Common Core of Data; Bureau of the Census, F-33 Survey of Local Governments.
Revenue Sources. Revenues for public schools come essentially from three sources: localgovernment, state government, and the federal government. As shown in figure 5.5, the share ofrevenues in small rural districts from state and local sources were each between 40 and 50 percentin 1992-93, with a 6 to 7 percent share from federal programs. These percentages are about the sameas percentages in other districts. In rural areas, it is the large districts, which have greater povertyand lower overall revenues, that rely on state and federal sources for a larger share of their revenue.
Expenditure Allocations. Just as there were small but noticeable differences in revenuesources between small and large rural and nonrural districts, there were also small but noticeabledifferences in the allocation of expenditures for different purposes. On the Bureau of Census F-33form, which provides school district financial data for the Common Core of Data, total expenditureswere reported, as were the subset of those expenditures that were current expenditures and the subset
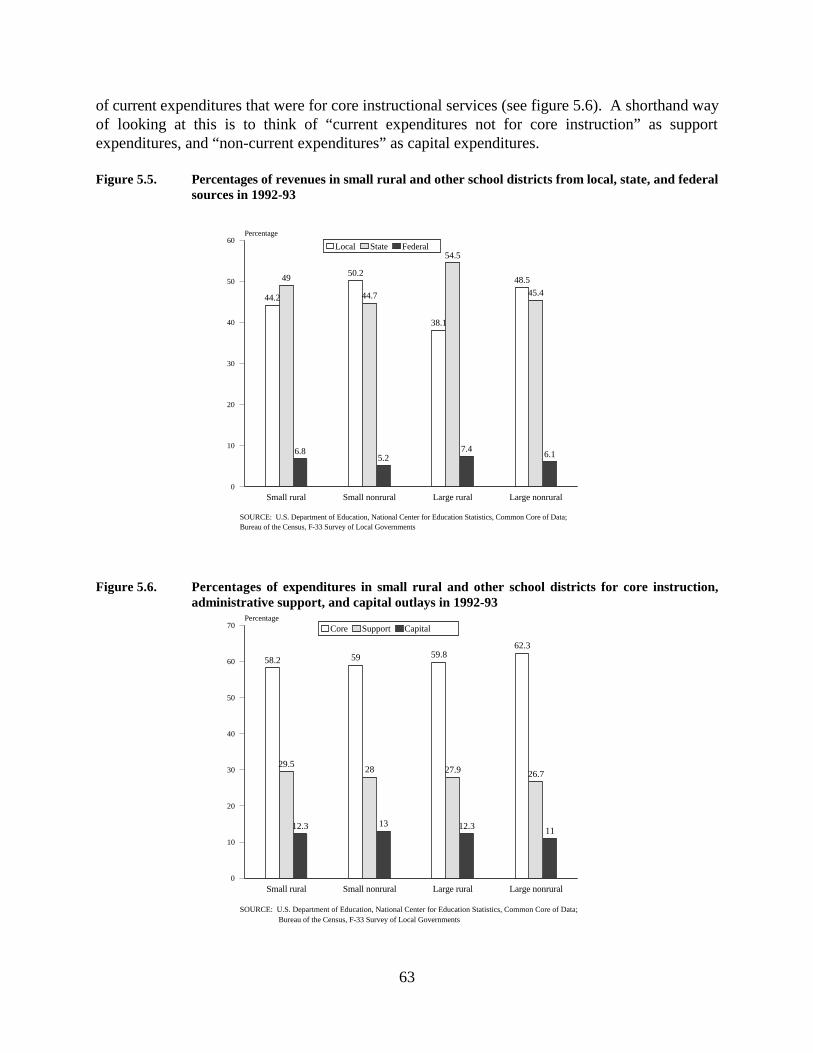
SOURCE: U.S. Department of Education, National Center for Education Statistics, Common Core of Data; Bureau of the Census, F-33 Survey of Local Governments
44.2
50.2
38.1
48.549
44.7
54.5
45.4
6.85.2
7.46.1
Small rural Small nonrural Large rural Large nonrural0
10
20
30
40
50
60Percentage
Local State Federal
SOURCE: U.S. Department of Education, National Center for Education Statistics, Common Core of Data; Bureau of the Census, F-33 Survey of Local Governments
58.2 59 59.862.3
29.528 27.9 26.7
12.3 13 12.3 11
Small rural Small nonrural Large rural Large nonrural0
10
20
30
40
50
60
70Percentage
Core Support Capital
63
of current expenditures that were for core instructional services (see figure 5.6). A shorthand wayof looking at this is to think of “current expenditures not for core instruction” as supportexpenditures, and “non-current expenditures” as capital expenditures.
Figure 5.5. Percentages of revenues in small rural and other school districts from local, state, and federalsources in 1992-93
Figure 5.6. Percentages of expenditures in small rural and other school districts for core instruction,administrative support, and capital outlays in 1992-93
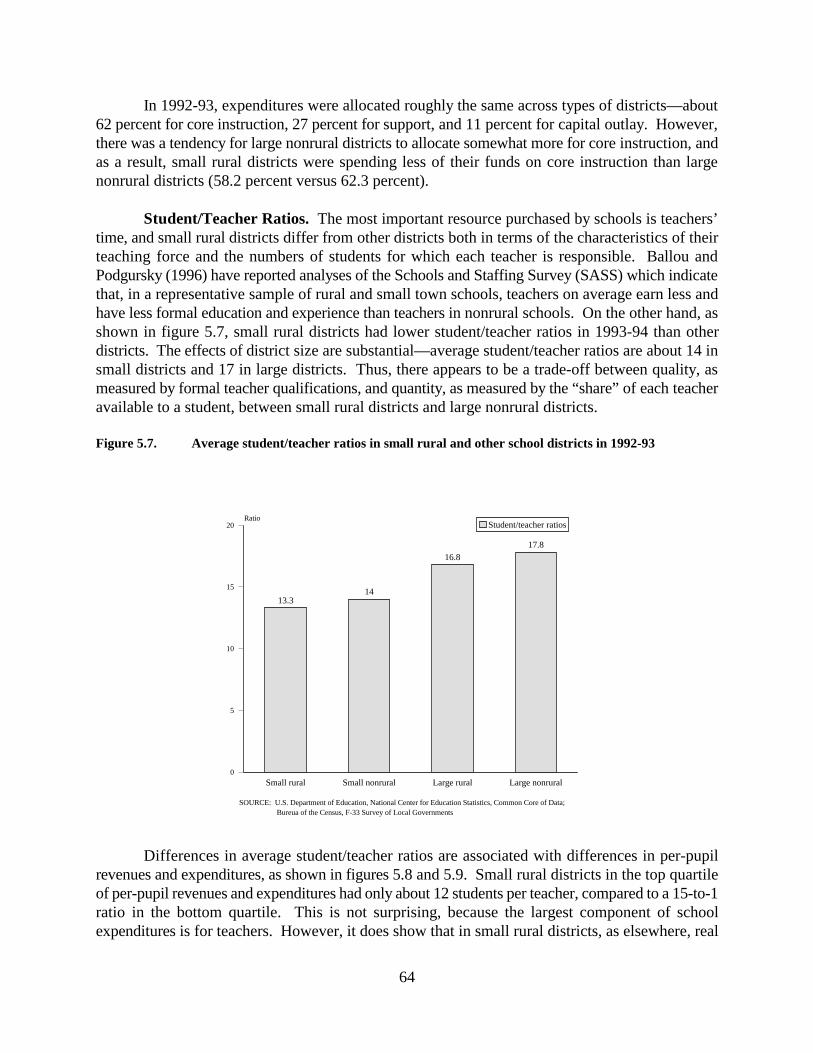
SOURCE: U.S. Department of Education, National Center for Education Statistics, Common Core of Data; Bureua of the Census, F-33 Survey of Local Governments
13.314
16.817.8
Small rural Small nonrural Large rural Large nonrural0
5
10
15
20Ratio
Student/teacher ratios
64
In 1992-93, expenditures were allocated roughly the same across types of districts—about62 percent for core instruction, 27 percent for support, and 11 percent for capital outlay. However,there was a tendency for large nonrural districts to allocate somewhat more for core instruction, andas a result, small rural districts were spending less of their funds on core instruction than largenonrural districts (58.2 percent versus 62.3 percent).
Student/Teacher Ratios. The most important resource purchased by schools is teachers’time, and small rural districts differ from other districts both in terms of the characteristics of theirteaching force and the numbers of students for which each teacher is responsible. Ballou andPodgursky (1996) have reported analyses of the Schools and Staffing Survey (SASS) which indicatethat, in a representative sample of rural and small town schools, teachers on average earn less andhave less formal education and experience than teachers in nonrural schools. On the other hand, asshown in figure 5.7, small rural districts had lower student/teacher ratios in 1993-94 than otherdistricts. The effects of district size are substantial—average student/teacher ratios are about 14 insmall districts and 17 in large districts. Thus, there appears to be a trade-off between quality, asmeasured by formal teacher qualifications, and quantity, as measured by the “share” of each teacheravailable to a student, between small rural districts and large nonrural districts.
Figure 5.7. Average student/teacher ratios in small rural and other school districts in 1992-93
Differences in average student/teacher ratios are associated with differences in per-pupilrevenues and expenditures, as shown in figures 5.8 and 5.9. Small rural districts in the top quartileof per-pupil revenues and expenditures had only about 12 students per teacher, compared to a 15-to-1ratio in the bottom quartile. This is not surprising, because the largest component of schoolexpenditures is for teachers. However, it does show that in small rural districts, as elsewhere, real
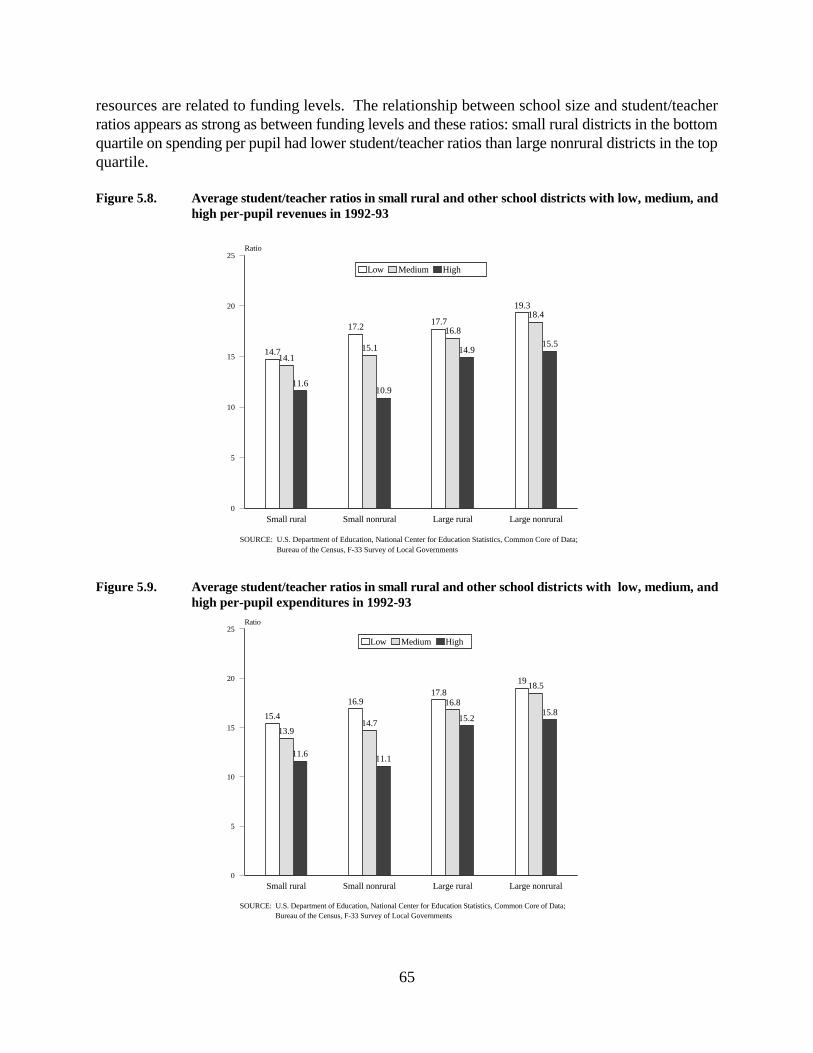
SOURCE: U.S. Department of Education, National Center for Education Statistics, Common Core of Data; Bureau of the Census, F-33 Survey of Local Governments
14.7
17.217.7
19.3
14.115.1
16.8
18.4
11.610.9
14.915.5
Small rural Small nonrural Large rural Large nonrural0
5
10
15
20
25Ratio
Low Medium High
SOURCE: U.S. Department of Education, National Center for Education Statistics, Common Core of Data; Bureau of the Census, F-33 Survey of Local Governments
15.4
16.917.8
19
13.914.7
16.8
18.5
11.6 11.1
15.215.8
Small rural Small nonrural Large rural Large nonrural0
5
10
15
20
25Ratio
Low Medium High
65
resources are related to funding levels. The relationship between school size and student/teacherratios appears as strong as between funding levels and these ratios: small rural districts in the bottomquartile on spending per pupil had lower student/teacher ratios than large nonrural districts in the topquartile.
Figure 5.8. Average student/teacher ratios in small rural and other school districts with low, medium, andhigh per-pupil revenues in 1992-93
Figure 5.9. Average student/teacher ratios in small rural and other school districts with low, medium, andhigh per-pupil expenditures in 1992-93

1989 1990 1991 1992
$0
$1,000
$2,000
$3,000
$4,000
$5,000
$6,000
$7,000
Small rural districts
Small nonrural districts
Large rural districts
Large nonrural districts
SOURCE: U.S. Department of Education, National Center for Education Statistics, Common Core of Data; Bureau of the Census, F-33 Survey of Local Government
$6,220$6,548
$5,223
$5,846
The annual inflation ratios used were 1.054 for 1989-90 to 1990-91, 1.042 for 1990-91 to 1991-92, and27
1.030 for 1991-92 to 1992-93.
66
Trends in Revenues, Expenditures, and Student/Teacher Ratios in Small Rural SchoolDistricts between 1989-90 and 1992-93
Per-pupil revenue and expenditure in current dollars tend to increase with the inflation rate,and a correction has been applied to these data so that all years are measured in constant dollars, setto the value in 1992-93. Once corrected for inflation, per-pupil revenues and expenditures27
exhibited very little change in small rural districts between 1989-90 and 1992-93. As can be seenin figure 5.10, in all 4 years, revenues per student in small rural districts were slightly greater thanin large nonrural districts, substantially greater than those of large rural districts, and somewhat lessthan in small nonrural districts.
Figure 5.10. Trends in per-pupil revenues in small rural and other school districts between 1989-1990 and1992-93 (in constant 1992-93 dollars)
The average per-pupil expenditure in small rural schools, adjusted for inflation, varied onlybetween $5,950 and $6,120 during these four years. Trends in average per-pupil expenditures insmall rural districts are compared with trends in other districts in figure 5.11. (The complete dataare shown in table A5.7 in the appendix.) The difference favoring small rural districts over largenonrural districts increased from $13 in 1989-90 to $207 in 1992-93 (see table A5.7), as muchbecause spending in large nonrural districts did not keep up with inflation as that spending increasedin small rural districts.
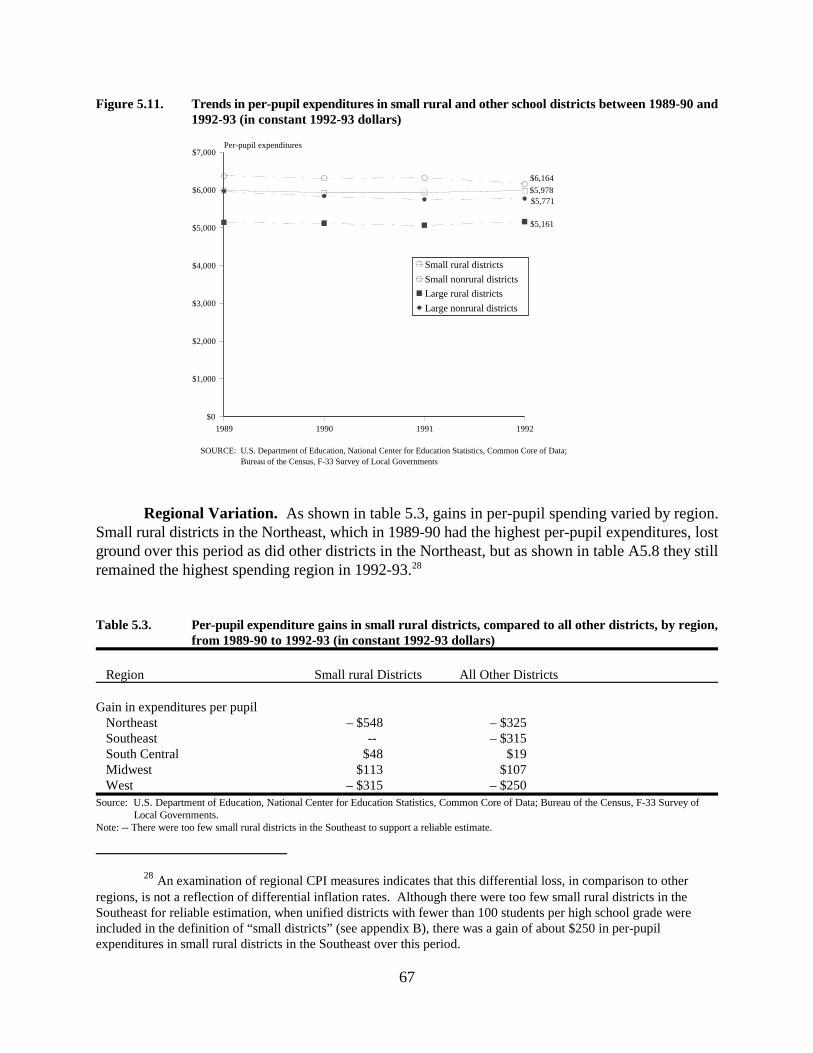
1989 1990 1991 1992
$0
$1,000
$2,000
$3,000
$4,000
$5,000
$6,000
$7,000Per-pupil expenditures
Small rural districts
Small nonrural districts
Large rural districts
Large nonrural districts
SOURCE: U.S. Department of Education, National Center for Education Statistics, Common Core of Data; Bureau of the Census, F-33 Survey of Local Governments
$5,978
$6,164
$5,161
$5,771
An examination of regional CPI measures indicates that this differential loss, in comparison to other28
regions, is not a reflection of differential inflation rates. Although there were too few small rural districts in theSoutheast for reliable estimation, when unified districts with fewer than 100 students per high school grade wereincluded in the definition of “small districts” (see appendix B), there was a gain of about $250 in per-pupilexpenditures in small rural districts in the Southeast over this period.
67
Figure 5.11. Trends in per-pupil expenditures in small rural and other school districts between 1989-90 and1992-93 (in constant 1992-93 dollars)
Regional Variation. As shown in table 5.3, gains in per-pupil spending varied by region.Small rural districts in the Northeast, which in 1989-90 had the highest per-pupil expenditures, lostground over this period as did other districts in the Northeast, but as shown in table A5.8 they stillremained the highest spending region in 1992-93.28
Table 5.3. Per-pupil expenditure gains in small rural districts, compared to all other districts, by region,from 1989-90 to 1992-93 (in constant 1992-93 dollars)
Region Small rural Districts All Other Districts
Gain in expenditures per pupil Northeast – $548 – $325 Southeast -- – $315 South Central $48 $19 Midwest $113 $107 West – $315 – $250Source: U.S. Department of Education, National Center for Education Statistics, Common Core of Data; Bureau of the Census, F-33 Survey of Local Governments.Note: -- There were too few small rural districts in the Southeast to support a reliable estimate.

1987 1988 1989 1990 1991 1992 1993
0
5
10
15
20
25Student/teacher ratios
Small rural districts
Small nonrural districts
Large nonrural districts
Large rural districts
SOURCE: U.S. Department of Education, National Center for Education Statistics, Common Core of Data; Bureau of the Census, F-33 Survey of Local Governments
13.3
14.0
16.817.8
68
Student/Teacher Ratios. On a nationwide basis, changes in per-pupil revenues andexpenditures in small rural districts over this time period were relatively minor, and that is reflectedin the lack of changes in student/teacher ratios, shown in figure 5.12. Average student/teacher ratiosin small rural districts remained at about 13 throughout the period from 1986-87 to 1993-94, while,for example, the average ratios in large nonrural districts remained at about 18.
Figure 5.12. Trends in student/teacher ratios in small rural and other school districts between 1986-87 and1993-94

Including large rural districts with a majority of small schools in the small rural category had little effect29
on the results. Average spending in the expanded set of small rural districts was about $100 to $150 less per-pupilbut still slightly higher than in other districts. Generally, summary figures for small rural districts were, as expected,slightly closer to figures for large rural districts.
Trends were not substantially affected by the inclusion of large rural districts with a majority of small30
schools. For example, over the three-year period there was a negligible average loss of $50 in per-pupilexpenditures in the expanded set of small rural districts, compared to $200 in large nonrural districts. Thecorresponding loss for the originally defined small rural districts was negligible ($6).
69
Summary
Focusing the snapshot of small rural school districts in 1992-93 on revenue, expenditures,and student/teacher ratios in those districts reveals the following patterns.
Revenue per pupil was about $6,200, and expenditures per pupil wereabout $6,000 in small rural districts, about $200 to $400 more than inlarge nonrural districts. In rural areas, it was in large districts ratherthan small districts that revenue and expenditures suffered, relativeto nonrural districts. Per-pupil spending varied substantially betweenregions: in the West, small rural districts spent nearly $2,000 perpupil more than other districts did; but in the Midwest, unlike the restof the country, less was spent in small rural districts than elsewhere.
Nationally, 93 percent of the revenue in small rural districts camealmost equally from local sources (44 percent) and state sources(49 percent), with about 7 percent from the federal government. Inlarge rural districts, by comparison, a much smaller share came fromlocal sources. About two-thirds of the current expenditures in smallrural districts were for core instruction, slightly less than elsewhere.Nevertheless, ratios of students to teachers were lowest in small ruraldistricts, ranging from 12 in top spending districts to 15 in bottomspending districts.29
Extending this picture to longitudinal trends over the preceding 3 years does not reveal agreat deal of additional information. Adjusted for inflation, trends are minor, although there werea few patterns.
The slightly greater spending in small rural districts, compared toother districts in 1992-93, grew from essentially no difference 3 yearsearlier. In the South Central region, per-pupil revenues in small ruraldistricts increased, but in the Northeast, per-pupil expendituresdeclined somewhat. As a national average, however, there were nosubstantial changes in per-pupil revenue or expenditures or instudent/teacher ratios.30

70
71
References
Ballou, D. and Podgursky, M. (1996). “Rural schools—fewer highly trained teachers and specialprograms, but better learning environment.” Rural Development Perspectives, 10: 6-16.
Barker, B. (1991). “Technological delivery systems and applications for K-12 instruction in ruralschools.” In Rural Education: Issues and Practice. Ed. A.J. DeYoung. New York:Garland. 203-38.
Bass, G.R. (1990). “Isolation/sparsity.” Journal of Education Finance, 16: 180-91.
Berkeley, T.R. and Ludlow, B.L. (1991). “Meeting the needs of special student populations inrural locales.” In Rural Education: Issues and Practice. Ed. A. DeYoung. New York:Garland. 239-67.
Chambers, J.G. (1995). Public School Teacher Cost Differences Across the United States. Washington, D.C.: U.S. Department of Education, National Center for Education Statistics(NCES 95-758).
Conant, J. (1959). The American High School Today. New York: McGraw-Hill.
DeYoung, A.J. (ed). (1991). Rural Education: Issues and Practice. New York: Garland.
DeYoung, A.J. (1994). “Children at risk in America’s rural schools: Economic and culturaldimensions.” In Reforms in Process: From the School to the System. 229-51.
DeYoung, A.J. and Howley, C.B. (1990). “The political economy of rural school consolidation.” Peabody Journal of Education.
Fuguitt, G.V. & Brown, D.L. (1990). “Residential preferences and population redistribution:1972-1988.” Demography, 27: 589-900.
Haas, T. and Lambert, R. (1995). “To establish the bonds of common purpose and mutualenjoyment.” Phi Delta Kappan, 77(2): 136-42.
Haller, E.J. and Monk, D.H. (1988). “New reforms, old reforms, and the consolidation of smallrural schools.” Educational Administration Quarterly, 24(4): 470-83.
Herzog, M.J. and Pittman, R.B. (1995). “Home, family, and community: Ingredients in the ruraleducation equation.” Phi Delta Kappan, 77(2): 113-18.
Levine, R. (1996). Changes in America’s High Schools, 1980-1993: The National Longitudinal Study of Schools. Palo Alto, CA: American Institutes for Research.
72
Monk, D.H. (1991). “The organization and reorganization of small rural schools.” In RuralEducation: Issues and Practice. Ed. A. DeYoung. New York: Garland. 177-201.
National Education Goals Panel. (1993). Building a Nation of Learners, Volume One: TheNational Report. Washington, D.C.: U.S. Government Printing Office.
O’Hare, W.P. (1988). The Rise of Poverty in Rural America. Washington, D.C.: PopulationReference Bureau.
Parrish, T.B., Matsumoto, C.S., and Fowler, W.J. (1995). Disparities in Public School DistrictSpending 1989-90. Washington, D.C.: U.S. Department of Education, National Center forEducation Statistics (NCES 95-300).
Phelps, M.S. and Prock, G.A. (1991). “Equality of educational opportunity in rural America.” InRural Education: Issues and Practice. Ed. A. DeYoung. New York: Garland. 269-312.
Population Research Bureau. (1993). Cited in “Census pinpoints locales where minorities aremajority.” Report on Education Research, 25(13): 5.
Salmon, R.G. (1990). “State school finance programs and their influence on rural schools andschool districts.” Journal of Education Finance, 16(2): 130-47.
Sher, J.P. (1995). “The battle for the soul of rural school reform.” Phi Delta Kappan, 77(2):143-48.
Stern, J.D. (1995). “Reflections of a recently retired federal analyst in rural education.” Supplement to the Rural Education Newsletter, Spring 1995.
Stern, J.D. (ed.). (1994). The Condition of Education in Rural Schools. Washington, D.C.: U.S.
Department of Education.
Stephens, E.R. (1988). The Changing Context of Education in a Rural Setting. Occasional Paper No. 26. Charleston, WV: Appalachia Educational Laboratory.
Thompson, D.C. (1990). “Consolidation of rural schools: Reform or relapse?” Journal ofEducation Finance, 16: 192-212.
Timar, T. and Kirp, D.L. (1989). “Education Reform in the 1980s: Lessons from the States.” PhiDelta Kappan: 511.
U.S. Department of Health, Education, and Welfare. (1996). Digest of Educational Statistics,1996. Washington, D.C.: U.S. Government Printing Office.
U.S. Department of Health, Education, and Welfare. (1971). Statistics of Public Elementary and Secondary Day Schools. Washington, D.C.: U.S. Government Printing Office.

73
Verstegen, D.A. (1990). “Efficiency and economics-of-scale revisited: Implications for financingrural school districts.” Journal of Education Finance, 16: 159-79.

74

75
Appendix A. Tables Section

76

77
Table A2.1. Number of rural, small, and other school districts, by level and year
Total Rural Nonrural
Total Elem Unified Second Total Elem Unified Second Total Elem Unified Second
Total
1986-87 15,345 3,824 10,879 642 7,409 1,919 5,229 261 7,936 1,905 5,650 381
1987-88 15,273 3,772 10,861 640 7,387 1,905 5,223 259 7,886 1,867 5,638 381
1988-89 15,199 3,716 10,846 637 7,353 1,880 5,215 258 7,846 1,836 5,631 379
1989-90 15,113 3,652 10,825 636 7,305 1,843 5,204 258 7,808 1,809 5,621 378
1990-91 15,035 3,599 10,806 630 7,260 1,809 5,198 253 7,775 1,790 5,608 377
1991-92 14,956 3,537 10,789 630 7,207 1,773 5,183 251 7,749 1,764 5,606 379
1992-93 14,820 3,436 10,748 636 7,091 1,704 5,136 251 7,729 1,732 5,612 385
1993-94 14,648 3,334 10,683 631 6,979 1,645 5,085 249 7,669 1,689 5,598 382
Small
1986-87 5,679 2,217 3,192 270 4,653 1,529 2,906 218 1,026 688 286 52
1987-88 5,608 2,171 3,170 267 4,626 1,515 2,895 216 982 656 275 51
1988-89 5,543 2,125 3,155 263 4,593 1,491 2,887 215 950 634 268 48
1989-90 5,469 2,073 3,133 263 4,546 1,458 2,873 215 923 615 260 48
1990-91 5,402 2,023 3,120 259 4,505 1,425 2,868 212 897 598 252 47
1991-92 5,333 1,970 3,106 257 4,457 1,394 2,852 211 876 576 254 46
1992-93 5,204 1,888 3,057 259 4,351 1,339 2,802 210 853 549 255 49
1993-94 5,052 1,809 2,986 257 4,238 1,290 2,740 208 814 519 246 49
Large
1986-87 9,666 1,607 7,687 372 2,756 390 2,323 43 6,910 1,217 5,364 329
1987-88 9,665 1,601 7,691 373 2,761 390 2,328 43 6,904 1,211 5,363 330
1988-89 9,656 1,591 7,691 374 2,760 389 2,328 43 6,896 1,202 5,363 331
1989-90 9,644 1,579 7,692 373 2,759 385 2,331 43 6,885 1,194 5,361 330
1990-91 9,633 1,576 7,686 371 2,755 384 2,330 41 6,878 1,192 5,356 330
1991-92 9,623 1,567 7,683 373 2,750 379 2,331 40 6,873 1,188 5,352 333
1992-93 9,616 1,548 7,691 377 2,740 365 2,334 41 6,876 1,183 5,357 336
1993-94 9,596 1,525 7,697 374 2,741 355 2,345 41 6,855 1,170 5,352 333

78
Table A2.2. Number of students (in thousands) enrolled in rural, small, and other school districts, by leveland year
Total Rural Nonrural
Total Elem Unified Second Total Elem Unified Second Total Elem Unified Second
Total
1986-87 39,588 2,165 36,404 1,019 5,400 272 5,064 64 34,188 1,893 31,340 955
1987-88 39,751 2,207 36,555 989 5,398 281 5,054 63 34,353 1,926 31,501 926
1988-89 39,941 2,260 36,724 957 5,410 282 5,067 61 34,531 1,978 31,657 896
1989-90 40,311 2,339 37,026 946 5,423 286 5,077 60 34,888 2,053 31,949 886
1990-91 40,971 2,426 37,590 955 5,454 293 5,103 58 35,517 2,133 32,487 897
1991-92 41,811 2,484 38,342 985 5,534 297 5,177 60 36,277 2,187 33,165 925
1992-93 42,571 2,526 39,028 1,017 5,629 297 5,267 65 36,942 2,229 33,761 952
1993-94 43,196 2,562 39,600 1,034 5,710 294 5,346 70 37,486 2,268 34,254 964
Small
1986-87 1,294 164 1,087 43 1,123 107 987 29 171 57 100 14
1987-88 1,276 159 1,076 41 1,113 104 981 28 163 55 95 13
1988-89 1,291 179 1,071 41 1,109 106 976 27 182 73 95 14
1989-90 1,293 185 1,068 40 1,109 107 975 27 184 78 93 13
1990-91 1,293 188 1,066 39 1,107 108 973 26 186 80 93 13
1991-82 1,309 190 1,078 41 1,119 109 982 28 190 81 96 13
1992-93 1,325 191 1,088 46 1,131 109 990 32 194 82 98 14
1993-94 1,327 190 1,087 50 1,131 107 988 36 196 83 99 14
Large
1986-87 38,294 2,001 35,317 976 4,277 165 4,077 35 34,017 1,836 31,240 941
1987-88 38,475 2,048 35,479 948 4,285 177 4,073 35 34,190 1,871 31,406 913
1988-89 38,650 2,081 35,653 916 4,301 176 4,091 34 34,349 1,905 31,562 882
1989-90 39,018 2,154 35,958 906 4,314 179 4,102 33 34,704 1,975 31,856 873
1990-91 39,678 2,238 36,524 916 4,347 185 4,130 32 35,331 2,053 32,394 884
1991-92 40,502 2,294 37,264 944 4,415 188 4,195 32 36,087 2,106 33,069 912
1992-93 41,246 2,335 37,940 971 4,498 188 4,277 33 36,748 2,147 33,663 938
1993-94 41,869 2,372 38,513 984 4,579 187 4,358 34 37,290 2,185 34,155 950
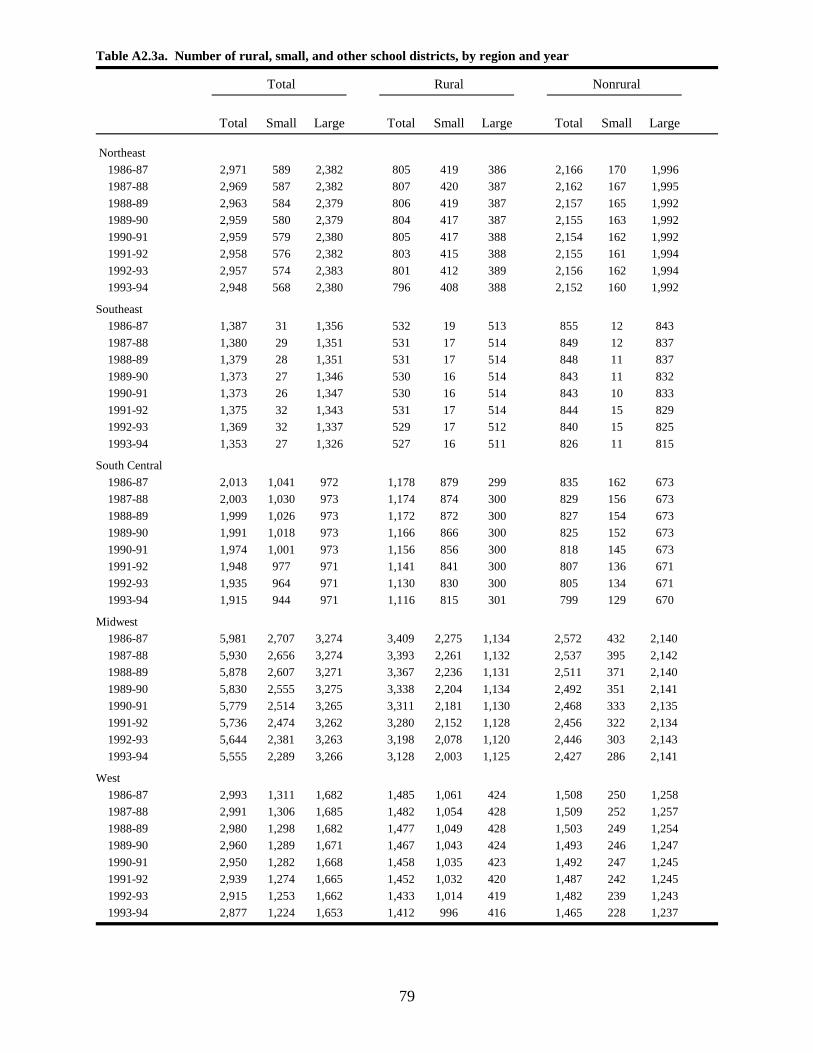
79
Table A2.3a. Number of rural, small, and other school districts, by region and year
Total Rural Nonrural
Total Small Large Total Small Large Total Small Large
Northeast
1986-87 2,971 589 2,382 805 419 386 2,166 170 1,996
1987-88 2,969 587 2,382 807 420 387 2,162 167 1,995
1988-89 2,963 584 2,379 806 419 387 2,157 165 1,992
1989-90 2,959 580 2,379 804 417 387 2,155 163 1,992
1990-91 2,959 579 2,380 805 417 388 2,154 162 1,992
1991-92 2,958 576 2,382 803 415 388 2,155 161 1,994
1992-93 2,957 574 2,383 801 412 389 2,156 162 1,994
1993-94 2,948 568 2,380 796 408 388 2,152 160 1,992
Southeast
1986-87 1,387 31 1,356 532 19 513 855 12 843
1987-88 1,380 29 1,351 531 17 514 849 12 837
1988-89 1,379 28 1,351 531 17 514 848 11 837
1989-90 1,373 27 1,346 530 16 514 843 11 832
1990-91 1,373 26 1,347 530 16 514 843 10 833
1991-92 1,375 32 1,343 531 17 514 844 15 829
1992-93 1,369 32 1,337 529 17 512 840 15 825
1993-94 1,353 27 1,326 527 16 511 826 11 815
South Central
1986-87 2,013 1,041 972 1,178 879 299 835 162 673
1987-88 2,003 1,030 973 1,174 874 300 829 156 673
1988-89 1,999 1,026 973 1,172 872 300 827 154 673
1989-90 1,991 1,018 973 1,166 866 300 825 152 673
1990-91 1,974 1,001 973 1,156 856 300 818 145 673
1991-92 1,948 977 971 1,141 841 300 807 136 671
1992-93 1,935 964 971 1,130 830 300 805 134 671
1993-94 1,915 944 971 1,116 815 301 799 129 670
Midwest
1986-87 5,981 2,707 3,274 3,409 2,275 1,134 2,572 432 2,140
1987-88 5,930 2,656 3,274 3,393 2,261 1,132 2,537 395 2,142
1988-89 5,878 2,607 3,271 3,367 2,236 1,131 2,511 371 2,140
1989-90 5,830 2,555 3,275 3,338 2,204 1,134 2,492 351 2,141
1990-91 5,779 2,514 3,265 3,311 2,181 1,130 2,468 333 2,135
1991-92 5,736 2,474 3,262 3,280 2,152 1,128 2,456 322 2,134
1992-93 5,644 2,381 3,263 3,198 2,078 1,120 2,446 303 2,143
1993-94 5,555 2,289 3,266 3,128 2,003 1,125 2,427 286 2,141
West
1986-87 2,993 1,311 1,682 1,485 1,061 424 1,508 250 1,258
1987-88 2,991 1,306 1,685 1,482 1,054 428 1,509 252 1,257
1988-89 2,980 1,298 1,682 1,477 1,049 428 1,503 249 1,254
1989-90 2,960 1,289 1,671 1,467 1,043 424 1,493 246 1,247
1990-91 2,950 1,282 1,668 1,458 1,035 423 1,492 247 1,245
1991-92 2,939 1,274 1,665 1,452 1,032 420 1,487 242 1,245
1992-93 2,915 1,253 1,662 1,433 1,014 419 1,482 239 1,243
1993-94 2,877 1,224 1,653 1,412 996 416 1,465 228 1,237

80
Table A2.3b. Counts of small rural and other districts at each grade level
Total Small Rural Other
Tot Elem Unified Sec Tot Elem Unified Sec Tot Elem Unified Sec
United States1986-87 15,345 3,824 10,879 642 4,653 1,529 2,906 218 10,692 2,295 7,973 4241987-88 15,273 3,772 10,861 640 4,626 1,515 2,895 216 10,647 2,257 7,966 4241988-89 15,199 3,716 10,846 637 4,593 1,491 2,887 215 10,606 2,225 7,959 4221989-90 15,113 3,652 10,825 636 4,546 1,458 2,873 215 10,567 2,194 7,952 4211990-91 15,035 3,599 10,806 630 4,505 1,425 2,868 212 10,530 2,174 7,938 4181991-92 14,956 3,537 10,789 630 4,457 1,394 2,852 211 10,499 2,143 7,937 4191992-93 14,820 3,436 10,748 636 4,351 1,339 2,802 210 10,469 2,097 7,946 4261993-94 14,648 3,334 10,683 631 4,238 1,290 2,740 208 10,410 2,044 7,943 423
Northeast1986-87 2,971 884 1,948 139 419 261 149 9 2,552 623 1,799 1301987-88 2,969 882 1,946 141 420 264 147 9 2,549 618 1,799 1321988-89 2,963 878 1,942 143 419 264 146 9 2,544 614 1,796 1341989-90 2,959 875 1,941 143 417 262 146 9 2,542 613 1,795 1341990-91 2,959 876 1,940 143 417 262 146 9 2,542 614 1,794 1341991-92 2,958 870 1,941 147 415 260 145 10 2,543 610 1,796 1371992-93 2,957 864 1,939 154 412 257 144 11 2,545 607 1,795 1431993-94 2,948 860 1,935 153 408 255 142 11 2,540 605 1,793 142
Southeast1986-87 1,387 30 1,353 4 19 1 18 0 1,368 29 1,335 41987-88 1,380 30 1,346 4 17 1 16 0 1,363 29 1,330 41988-89 1,379 30 1,346 3 17 1 16 0 1,362 29 1,330 31989-90 1,373 30 1,340 3 16 1 15 0 1,357 29 1,325 31990-91 1,373 32 1,337 4 16 1 15 0 1,357 31 1,322 41991-92 1,375 32 1,339 4 17 1 16 0 1,358 31 1,323 41992-93 1,369 31 1,334 4 17 1 16 0 1,352 30 1,318 41993-94 1,353 31 1,318 4 16 1 15 0 1,337 30 1,303 4
South Central1986-87 2,013 241 1,772 0 879 134 745 0 1,134 107 1,027 01987-88 2,003 237 1,766 0 874 132 742 0 1,129 105 1,024 01988-89 1,999 234 1,765 0 872 130 742 0 1,127 104 1,023 01989-90 1,991 232 1,759 0 866 128 738 0 1,125 104 1,021 01990-91 1,974 223 1,751 0 856 121 735 0 1,118 102 1,016 01991-92 1,948 212 1,736 0 841 115 726 0 1,107 97 1,010 01992-93 1,935 206 1,729 0 830 112 718 0 1,105 94 1,011 01993-94 1,915 192 1,723 0 815 104 711 0 1,100 88 1,012 0
Midwest1986-87 5,981 1,322 4,488 171 2,275 606 1,616 53 3,706 716 2,872 1181987-88 5,930 1,286 4,478 166 2,261 599 1,611 51 3,669 687 2,867 1151988-89 5,878 1,248 4,467 163 2,236 582 1,604 50 3,642 666 2,863 1131989-90 5,830 1,210 4,459 161 2,204 560 1,595 49 3,626 650 2,864 1121990-91 5,779 1,170 4,452 157 2,181 541 1,593 47 3,598 629 2,859 1101991-92 5,736 1,137 4,445 154 2,152 520 1,587 45 3,584 617 2,858 1091992-93 5,644 1,076 4,414 154 2,078 489 1,546 43 3,566 587 2,868 1111993-94 5,555 1,035 4,368 152 2,003 468 1,494 41 3,552 567 2,874 111
West1986-87 2,993 1,347 1,318 328 1,061 527 378 156 1,932 820 940 1721987-88 2,991 1,337 1,325 329 1,054 519 379 156 1,937 818 946 1731988-89 2,980 1,326 1,326 328 1,049 514 379 156 1,931 812 947 1721989-90 2,960 1,305 1,326 329 1,043 507 379 157 1,917 798 947 1721990-91 2,950 1,298 1,326 326 1,035 500 379 156 1,915 798 947 1701991-92 2,939 1,286 1,328 325 1,032 498 378 156 1,907 788 950 1691992-93 2,915 1,259 1,332 324 1,014 480 378 156 1,901 779 954 1681993-94 2,877 1,216 1,339 322 996 462 378 156 1,881 754 961 166

81
Table A2.4a. Number of rural, small, and other school districts in 1993-94, by state
Total Rural Nonrural
Total Small Large Total Small Large Total Small Large
50 States and D.C. 14,648 5,052 9,596 6,979 4,238 2,741 7,669 814 6,855
Alabama 127 0 127 38 0 38 89 0 89Alaska 55 37 18 48 37 11 7 0 7Arizona 216 77 139 89 55 34 127 22 105Arkansas 313 142 171 199 132 67 114 10 104California 1,055 271 784 282 147 135 773 124 649
Colorado 176 93 83 116 89 27 60 4 56Connecticut 166 14 152 25 10 15 141 4 137Delaware 19 0 19 6 0 6 13 0 13District of Columbia 1 0 1 0 0 0 1 0 1Florida 68 1 67 14 0 14 54 1 53
Georgia 181 3 178 66 3 63 115 0 115Hawaii 1 0 1 0 0 0 1 0 1Idaho 113 46 67 77 44 33 36 2 34Illinois 922 261 661 336 203 133 586 58 528Indiana 292 7 285 111 6 105 181 1 180
Iowa 398 205 193 272 196 76 126 9 117Kansas 304 168 136 241 161 80 63 7 56Kentucky 176 13 163 72 6 66 104 7 97Louisiana 66 0 66 17 0 17 49 0 49Maine 226 97 129 124 82 42 102 15 87
Maryland 24 0 24 11 0 11 13 0 13Massachusetts 320 28 292 26 6 20 294 22 272Michigan 558 102 456 213 80 133 345 22 323Minnesota 399 166 233 256 156 100 143 10 133Mississippi 149 2 147 73 2 71 76 0 76
Missouri 537 274 263 360 253 107 177 21 156Montana 492 387 105 416 369 47 76 18 58Nebraska 684 621 63 502 484 18 182 137 45Nevada 17 3 14 9 3 6 8 0 8New Hampshire 165 57 108 77 45 32 88 12 76
New Jersey 571 70 501 65 21 44 506 49 457New Mexico 88 37 51 54 37 17 34 0 34New York 714 142 572 197 97 100 517 45 472North Carolina 121 0 121 51 0 51 70 0 70North Dakota 249 217 32 232 217 15 17 0 17
Ohio 611 27 584 228 23 205 383 4 379Oklahoma 554 357 197 351 294 57 203 63 140Oregon 278 135 143 104 91 13 174 44 130Pennsylvania 500 8 492 113 5 108 387 3 384Rhode Island 36 1 35 3 1 2 33 0 33
South Carolina 95 2 93 33 2 31 62 0 62South Dakota 174 131 43 149 130 19 25 1 24Tennessee 138 2 136 45 1 44 93 1 92Texas 1,048 445 603 566 389 177 482 56 426Utah 40 5 35 17 5 12 23 0 23
Vermont 250 151 99 166 141 25 84 10 74Virginia 133 4 129 69 2 67 64 2 62Washington 297 119 178 175 107 68 122 12 110West Virginia 55 0 55 32 0 32 23 0 23Wisconsin 427 110 317 228 94 134 199 16 183Wyoming 49 14 35 25 12 13 24 2 22
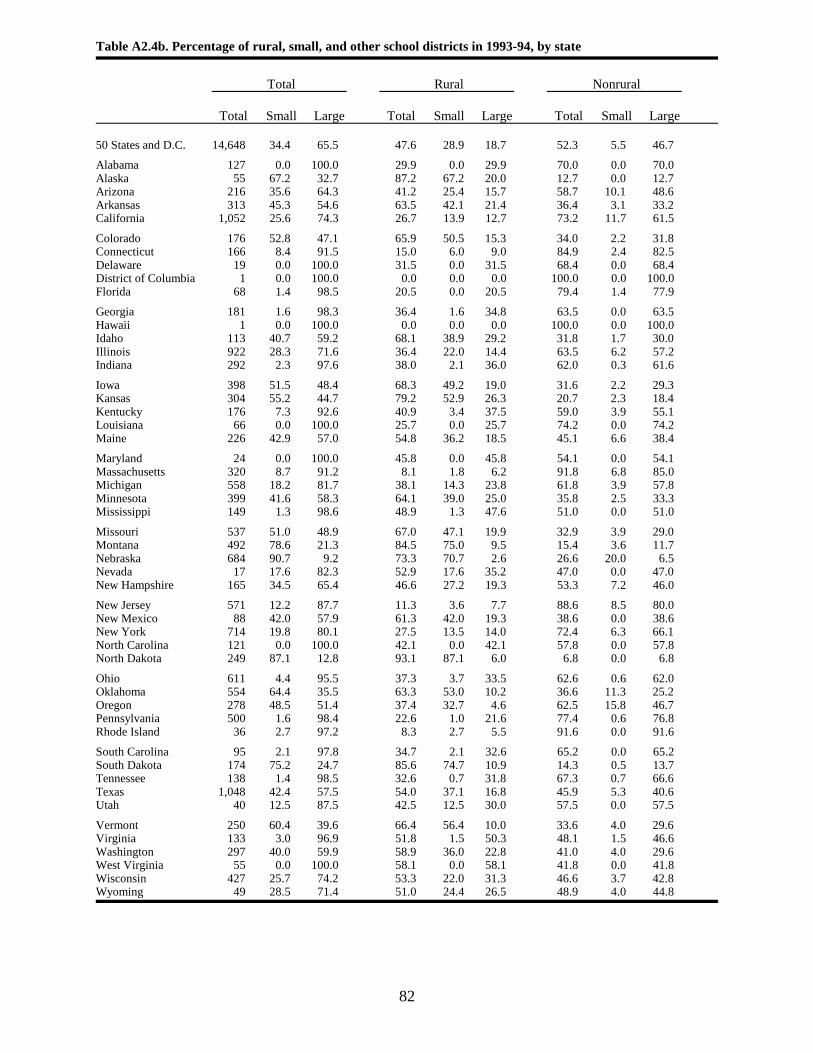
82
Table A2.4b. Percentage of rural, small, and other school districts in 1993-94, by state
Total Rural Nonrural
Total Small Large Total Small Large Total Small Large
50 States and D.C. 14,648 34.4 65.5 47.6 28.9 18.7 52.3 5.5 46.7
Alabama 127 0.0 100.0 29.9 0.0 29.9 70.0 0.0 70.0Alaska 55 67.2 32.7 87.2 67.2 20.0 12.7 0.0 12.7Arizona 216 35.6 64.3 41.2 25.4 15.7 58.7 10.1 48.6Arkansas 313 45.3 54.6 63.5 42.1 21.4 36.4 3.1 33.2California 1,052 25.6 74.3 26.7 13.9 12.7 73.2 11.7 61.5
Colorado 176 52.8 47.1 65.9 50.5 15.3 34.0 2.2 31.8Connecticut 166 8.4 91.5 15.0 6.0 9.0 84.9 2.4 82.5Delaware 19 0.0 100.0 31.5 0.0 31.5 68.4 0.0 68.4District of Columbia 1 0.0 100.0 0.0 0.0 0.0 100.0 0.0 100.0Florida 68 1.4 98.5 20.5 0.0 20.5 79.4 1.4 77.9
Georgia 181 1.6 98.3 36.4 1.6 34.8 63.5 0.0 63.5Hawaii 1 0.0 100.0 0.0 0.0 0.0 100.0 0.0 100.0Idaho 113 40.7 59.2 68.1 38.9 29.2 31.8 1.7 30.0Illinois 922 28.3 71.6 36.4 22.0 14.4 63.5 6.2 57.2Indiana 292 2.3 97.6 38.0 2.1 36.0 62.0 0.3 61.6
Iowa 398 51.5 48.4 68.3 49.2 19.0 31.6 2.2 29.3Kansas 304 55.2 44.7 79.2 52.9 26.3 20.7 2.3 18.4Kentucky 176 7.3 92.6 40.9 3.4 37.5 59.0 3.9 55.1Louisiana 66 0.0 100.0 25.7 0.0 25.7 74.2 0.0 74.2Maine 226 42.9 57.0 54.8 36.2 18.5 45.1 6.6 38.4
Maryland 24 0.0 100.0 45.8 0.0 45.8 54.1 0.0 54.1Massachusetts 320 8.7 91.2 8.1 1.8 6.2 91.8 6.8 85.0Michigan 558 18.2 81.7 38.1 14.3 23.8 61.8 3.9 57.8Minnesota 399 41.6 58.3 64.1 39.0 25.0 35.8 2.5 33.3Mississippi 149 1.3 98.6 48.9 1.3 47.6 51.0 0.0 51.0
Missouri 537 51.0 48.9 67.0 47.1 19.9 32.9 3.9 29.0Montana 492 78.6 21.3 84.5 75.0 9.5 15.4 3.6 11.7Nebraska 684 90.7 9.2 73.3 70.7 2.6 26.6 20.0 6.5Nevada 17 17.6 82.3 52.9 17.6 35.2 47.0 0.0 47.0New Hampshire 165 34.5 65.4 46.6 27.2 19.3 53.3 7.2 46.0
New Jersey 571 12.2 87.7 11.3 3.6 7.7 88.6 8.5 80.0New Mexico 88 42.0 57.9 61.3 42.0 19.3 38.6 0.0 38.6New York 714 19.8 80.1 27.5 13.5 14.0 72.4 6.3 66.1North Carolina 121 0.0 100.0 42.1 0.0 42.1 57.8 0.0 57.8North Dakota 249 87.1 12.8 93.1 87.1 6.0 6.8 0.0 6.8
Ohio 611 4.4 95.5 37.3 3.7 33.5 62.6 0.6 62.0Oklahoma 554 64.4 35.5 63.3 53.0 10.2 36.6 11.3 25.2Oregon 278 48.5 51.4 37.4 32.7 4.6 62.5 15.8 46.7Pennsylvania 500 1.6 98.4 22.6 1.0 21.6 77.4 0.6 76.8Rhode Island 36 2.7 97.2 8.3 2.7 5.5 91.6 0.0 91.6
South Carolina 95 2.1 97.8 34.7 2.1 32.6 65.2 0.0 65.2South Dakota 174 75.2 24.7 85.6 74.7 10.9 14.3 0.5 13.7Tennessee 138 1.4 98.5 32.6 0.7 31.8 67.3 0.7 66.6Texas 1,048 42.4 57.5 54.0 37.1 16.8 45.9 5.3 40.6Utah 40 12.5 87.5 42.5 12.5 30.0 57.5 0.0 57.5
Vermont 250 60.4 39.6 66.4 56.4 10.0 33.6 4.0 29.6Virginia 133 3.0 96.9 51.8 1.5 50.3 48.1 1.5 46.6Washington 297 40.0 59.9 58.9 36.0 22.8 41.0 4.0 29.6West Virginia 55 0.0 100.0 58.1 0.0 58.1 41.8 0.0 41.8Wisconsin 427 25.7 74.2 53.3 22.0 31.3 46.6 3.7 42.8Wyoming 49 28.5 71.4 51.0 24.4 26.5 48.9 4.0 44.8

83
Table A2.4c. Percent change in rural, small, and other school districts between 1986 and 1993, by state
Total Rural Nonrural
Total Small Large Total Small Large Total Small Large
50 States and D.C. -4.6 -11.1 -0.8 -5.9 -9.0 -0.6 -3.4 -20.7 -0.8
Alabama -2.4 -100.0 -1.6 -5.0 n/a -5.0 -1.2 -100.0 0.0Alaska 1.8 0.0 5.8 2.1 0.0 10.0 0.0 n/a 0.0Arizona -0.5 -8.4 4.5 -4.4 -9.9 6.2 2.4 -4.4 3.9Arkansas -6.1 -11.3 -1.2 -3.9 -6.4 1.5 -9.6 -47.4 -2.9California -2.5 -2.9 -2.4 -1.1 -1.4 -0.8 -3.1 -4.7 -2.7
Colorado -0.6 -1.1 0.0 -0.9 -1.2 0.0 0.0 0.0 0.0Connecticut 0.6 0.0 0.6 0.0 0.0 0.0 0.7 0.0 0.7Delaware 0.0 n/a 0.0 0.0 n/a 0.0 0.0 n/a 0.0District of Columbia 0.0 n/a 0.0 n/a n/a n/a 0.0 n/a 0.0Florida 1.4 n/a 0.0 0.0 n/a 0.0 1.8 n/a 0.0
Georgia -2.7 0.0 -2.8 0.0 0.0 0.0 -4.2 n/a -4.2Hawaii 0.0 n/a 0.0 n/a n/a n/a 0.0 n/a 0.0Idaho -1.8 -4.2 0.0 -3.8 -6.4 0.0 2.8 100.0 0.0Illinois -7.0 -20.2 -0.5 -11.4 -17.5 0.0 -4.3 -28.4 -0.6Indiana -3.7 -50.0 -1.4 0.9 0.0 0.9 -6.3 -87.5 -2.8
Iowa -9.0 -16.0 0.0 -11.7 -15.9 1.3 -2.4 -18.2 -0.9Kansas 0.0 0.0 0.0 0.0 0.0 0.0 0.0 0.0 0.0Kentucky -1.2 0.0 -1.3 0.0 0.0 0.0 -1.9 0.0 -2.1Louisiana 0.0 n/a 0.0 0.0 n/a 0.0 0.0 n/a 0.0Maine -1.4 -1.1 -1.6 -1.6 -1.3 -2.4 -1.0 0.0 -1.2
Maryland 0.0 n/a 0.0 0.0 n/a 0.0 0.0 n/a 0.0Massachusetts -4.8 -24.4 -2.4 -16.2 -40.0 -4.8 -3.7 -18.6 -2.2Michigan -1.3 -6.5 0.0 -1.4 -3.7 0.0 -1.2 -15.4 0.0Minnesota -7.9 -16.2 -0.9 -15.8 -18.8 -10.8 10.8 66.6 8.1Mississippi -3.3 -33.4 -2.7 -1.4 0.0 -1.4 -5.0 -100.0 -3.8
Missouri -1.5 -2.9 0.0 -1.4 -2.0 0.0 -1.7 -12.5 0.0Montana -10.8 -10.9 -10.3 -11.4 -10.7 -16.1 -7.4 -14.3 -5.0Nebraska -23.3 -24.9 -3.1 -17.2 -17.6 -5.3 -36.2 -42.7 -2.2Nevada 0.0 0.0 0.0 0.0 0.0 0.0 0.0 n/a 0.0New Hampshire 3.7 1.7 4.8 2.6 2.2 3.2 4.7 0.0 5.5
New Jersey -0.2 -1.5 0.0 0.0 0.0 0.0 -0.2 -2.0 0.0New Mexico 0.0 0.0 0.0 0.0 0.0 0.0 0.0 n/a 0.0New York -1.3 -7.2 0.3 -2.5 -7.7 3.0 -0.8 -6.3 -0.3North Carolina -13.6 -100.0 -13.0 -2.0 -100.0 0.0 -20.5 n/a -20.5North Dakota -11.1 -12.5 0.0 -11.5 -12.2 0.0 -5.6 -100.0 0.0
Ohio -0.7 -13.0 0.0 -0.5 -4.2 0.0 -0.8 -42.9 0.0Oklahoma -9.7 -14.0 -0.6 -10.7 -12.8 1.7 -7.8 -19.3 -1.5Oregon -8.3 -13.0 -3.4 -7.2 -7.2 -7.2 -9.0 -22.9 -3.0Pennsylvania 0.0 0.0 0.0 0.0 0.0 0.0 0.0 0.0 0.0Rhode Island -10.0 0.0 -10.3 0.0 0.0 0.0 -10.9 n/a -10.9
South Carolina 3.2 0.0 3.3 3.1 0.0 3.3 3.3 n/a 3.3South Dakota -6.5 -9.1 2.3 -5.7 -7.2 5.5 -10.8 -75.0 0.0Tennessee -1.5 0.0 -1.5 0.0 0.0 0.0 -2.2 0.0 -2.2Texas -1.8 -4.6 0.3 -2.1 -3.0 0.0 -1.5 -13.9 0.4Utah 0.0 0.0 0.0 0.0 0.0 0.0 0.0 n/a 0.0
Vermont 1.2 0.0 3.1 0.6 0.7 0.0 2.4 -9.1 4.2Virginia -1.5 -33.4 0.0 -2.9 -50.0 0.0 0.0 0.0 0.0Washington -0.4 -0.9 0.0 -0.6 -1.0 0.0 0.0 0.0 0.0West Virginia 0.0 n/a 0.0 0.0 n/a 0.0 0.0 n/a 0.0Wisconsin -1.0 -5.2 0.6 -1.3 -4.1 0.7 -0.5 -11.2 0.5Wyoming -2.0 -6.7 0.0 -3.9 -7.7 0.0 0.0 0.0 0.0
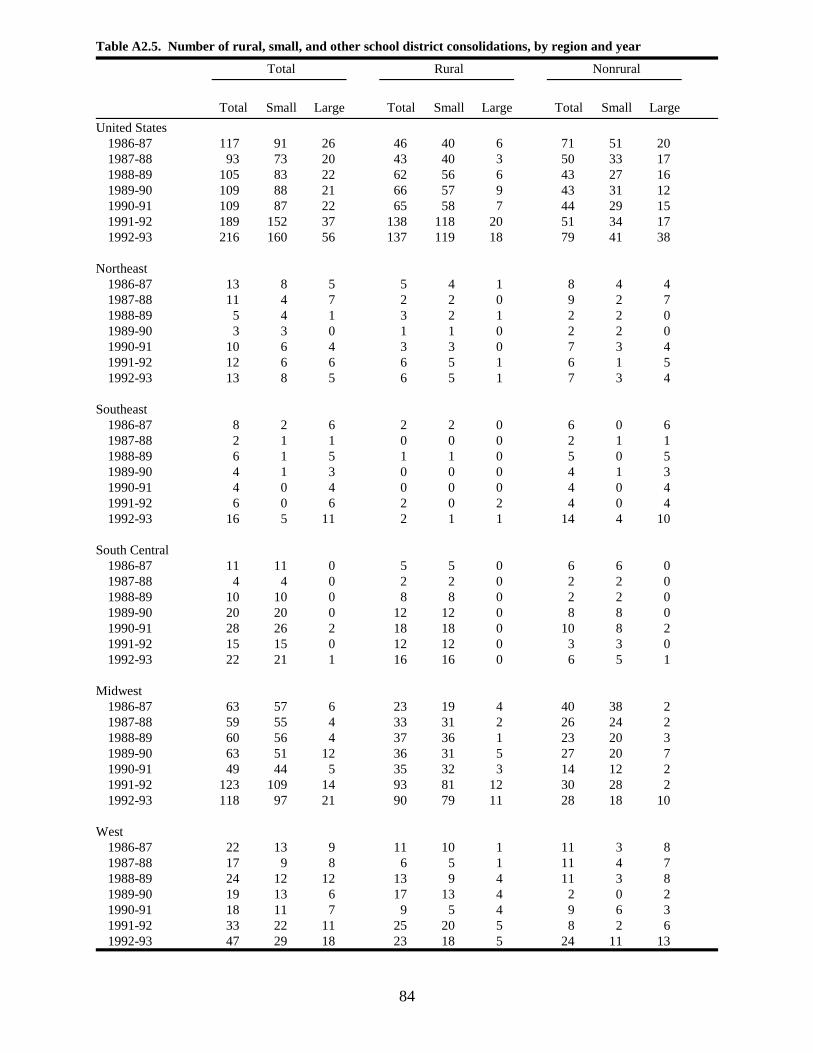
84
Table A2.5. Number of rural, small, and other school district consolidations, by region and year
Total Rural Nonrural
Total Small Large Total Small Large Total Small Large
United States1986-87 117 91 26 46 40 6 71 51 201987-88 93 73 20 43 40 3 50 33 171988-89 105 83 22 62 56 6 43 27 161989-90 109 88 21 66 57 9 43 31 121990-91 109 87 22 65 58 7 44 29 151991-92 189 152 37 138 118 20 51 34 171992-93 216 160 56 137 119 18 79 41 38
Northeast1986-87 13 8 5 5 4 1 8 4 41987-88 11 4 7 2 2 0 9 2 71988-89 5 4 1 3 2 1 2 2 01989-90 3 3 0 1 1 0 2 2 01990-91 10 6 4 3 3 0 7 3 41991-92 12 6 6 6 5 1 6 1 51992-93 13 8 5 6 5 1 7 3 4
Southeast1986-87 8 2 6 2 2 0 6 0 61987-88 2 1 1 0 0 0 2 1 11988-89 6 1 5 1 1 0 5 0 51989-90 4 1 3 0 0 0 4 1 31990-91 4 0 4 0 0 0 4 0 41991-92 6 0 6 2 0 2 4 0 41992-93 16 5 11 2 1 1 14 4 10
South Central1986-87 11 11 0 5 5 0 6 6 01987-88 4 4 0 2 2 0 2 2 01988-89 10 10 0 8 8 0 2 2 01989-90 20 20 0 12 12 0 8 8 01990-91 28 26 2 18 18 0 10 8 21991-92 15 15 0 12 12 0 3 3 01992-93 22 21 1 16 16 0 6 5 1
Midwest1986-87 63 57 6 23 19 4 40 38 21987-88 59 55 4 33 31 2 26 24 21988-89 60 56 4 37 36 1 23 20 31989-90 63 51 12 36 31 5 27 20 71990-91 49 44 5 35 32 3 14 12 21991-92 123 109 14 93 81 12 30 28 21992-93 118 97 21 90 79 11 28 18 10
West1986-87 22 13 9 11 10 1 11 3 81987-88 17 9 8 6 5 1 11 4 71988-89 24 12 12 13 9 4 11 3 81989-90 19 13 6 17 13 4 2 0 21990-91 18 11 7 9 5 4 9 6 31991-92 33 22 11 25 20 5 8 2 61992-93 47 29 18 23 18 5 24 11 13

85
Table A2.6. Number of rural, small, and other school district consolidations between 1986 and 1993, by state
Total Rural Nonrural
Total Small Large Total Small Large Total Small Large
50 States and D.C. 938 734 204 557 488 69 381 246 135
Alabama 4 1 3 2 0 2 2 1 1Alaska 2 2 0 2 2 0 0 0 0Arizona 14 13 1 7 7 0 7 6 1Arkansas 19 18 1 9 9 0 10 9 1California 60 13 47 17 6 11 43 7 36
Colorado 3 3 0 3 3 0 0 0 0Connecticut 0 0 0 0 0 0 0 0 0Delaware 0 0 0 0 0 0 0 0 0District o f Columbia 0 0 0 0 0 0 0 0 0Florida 0 0 0 0 0 0 0 0 0
Georgia 5 0 5 0 0 0 5 0 5Hawaii 0 0 0 0 0 0 0 0 0Idaho 5 4 1 5 4 1 0 0 0Illinois 96 76 20 57 50 7 39 26 13Indiana 12 7 5 0 0 0 12 7 5
Iowa 51 42 9 48 40 8 3 2 1Kansas 0 0 0 0 0 0 0 0 0Kentucky 2 0 2 0 0 0 2 0 2Louisiana 0 0 0 0 0 0 0 0 0Maine 10 8 2 8 7 1 2 1 1
Maryland 0 0 0 0 0 0 0 0 0Massachusetts 19 9 10 6 4 2 13 5 8Michigan 8 8 0 4 4 0 4 4 0Minnesota 78 50 28 65 45 20 13 5 8Mississippi 5 1 4 1 0 1 4 1 3
Missouri 7 7 0 5 5 0 2 2 0Montana 65 53 12 59 50 9 6 3 3Nebraska 215 213 2 109 108 1 106 105 1Nevada 0 0 0 0 0 0 0 0 0New Hampshire 1 1 0 0 0 0 1 1 0
New Jersey 4 2 2 0 0 0 4 2 2New Mexico 0 0 0 0 0 0 0 0 0New York 20 13 7 9 9 0 11 4 7North Carolina 19 1 18 1 1 0 18 0 18North Dakota 36 35 1 35 34 1 1 1 0
Ohio 4 4 0 1 1 0 3 3 0Oklahoma 70 68 2 52 52 0 18 16 2Oregon 28 20 8 9 7 2 19 13 6Pennsylvania 1 1 0 0 0 0 1 1 0Rhode Island 5 0 5 0 0 0 5 0 5
South Carolina 2 0 2 0 0 0 2 0 2South Dakota 22 21 1 19 18 1 3 3 0Tennessee 2 0 2 0 0 0 2 0 2Texas 21 21 0 12 12 0 9 9 0Utah 0 0 0 0 0 0 0 0 0
Vermont 7 5 2 3 2 1 4 3 1Virginia 7 7 0 3 3 0 4 4 0Washington 2 1 1 1 1 0 1 0 1West Virginia 0 0 0 0 0 0 0 0 0Wisconsin 6 6 0 4 4 0 2 2 0Wyoming 0 0 0 0 0 0 0 0 0
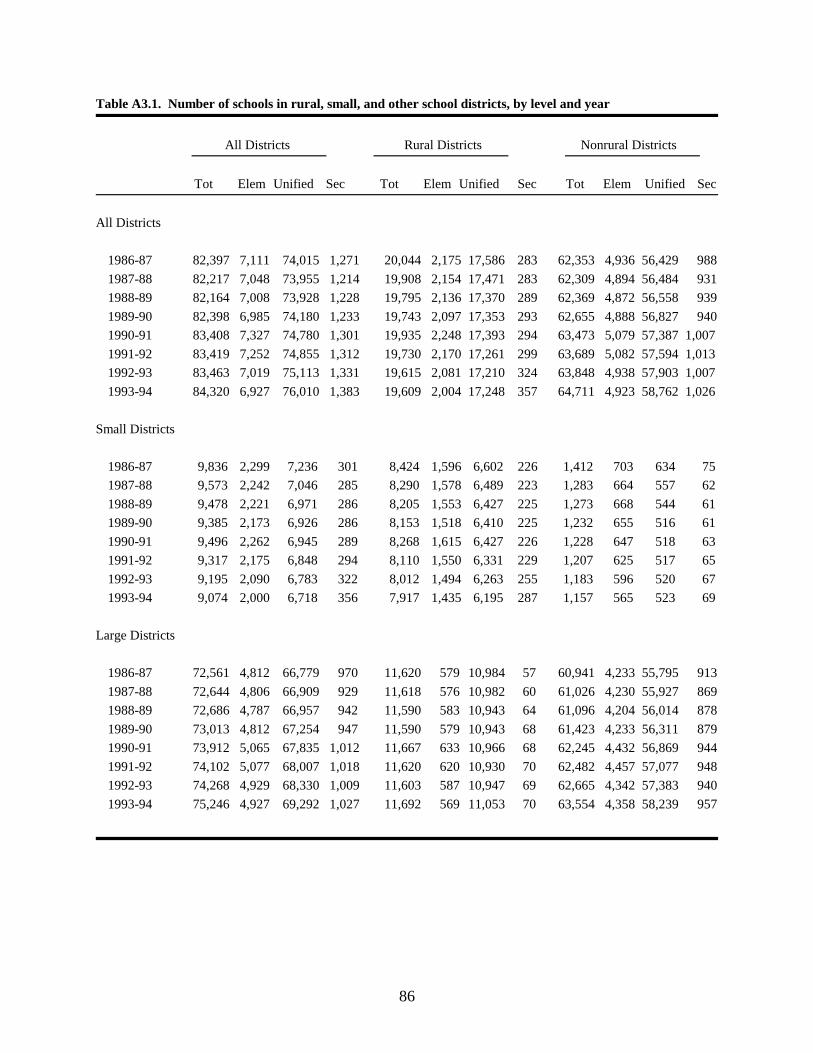
86
Table A3.1. Number of schools in rural, small, and other school districts, by level and year
All Districts Rural Districts Nonrural Districts
Tot Elem Unified Sec Tot Elem Unified Sec Tot Elem Unified Sec
All Districts
1986-87 82,397 7,111 74,015 1,271 20,044 2,175 17,586 283 62,353 4,936 56,429 988
1987-88 82,217 7,048 73,955 1,214 19,908 2,154 17,471 283 62,309 4,894 56,484 931
1988-89 82,164 7,008 73,928 1,228 19,795 2,136 17,370 289 62,369 4,872 56,558 939
1989-90 82,398 6,985 74,180 1,233 19,743 2,097 17,353 293 62,655 4,888 56,827 940
1990-91 83,408 7,327 74,780 1,301 19,935 2,248 17,393 294 63,473 5,079 57,387 1,007
1991-92 83,419 7,252 74,855 1,312 19,730 2,170 17,261 299 63,689 5,082 57,594 1,013
1992-93 83,463 7,019 75,113 1,331 19,615 2,081 17,210 324 63,848 4,938 57,903 1,007
1993-94 84,320 6,927 76,010 1,383 19,609 2,004 17,248 357 64,711 4,923 58,762 1,026
Small Districts
1986-87 9,836 2,299 7,236 301 8,424 1,596 6,602 226 1,412 703 634 75
1987-88 9,573 2,242 7,046 285 8,290 1,578 6,489 223 1,283 664 557 62
1988-89 9,478 2,221 6,971 286 8,205 1,553 6,427 225 1,273 668 544 61
1989-90 9,385 2,173 6,926 286 8,153 1,518 6,410 225 1,232 655 516 61
1990-91 9,496 2,262 6,945 289 8,268 1,615 6,427 226 1,228 647 518 63
1991-92 9,317 2,175 6,848 294 8,110 1,550 6,331 229 1,207 625 517 65
1992-93 9,195 2,090 6,783 322 8,012 1,494 6,263 255 1,183 596 520 67
1993-94 9,074 2,000 6,718 356 7,917 1,435 6,195 287 1,157 565 523 69
Large Districts
1986-87 72,561 4,812 66,779 970 11,620 579 10,984 57 60,941 4,233 55,795 913
1987-88 72,644 4,806 66,909 929 11,618 576 10,982 60 61,026 4,230 55,927 869
1988-89 72,686 4,787 66,957 942 11,590 583 10,943 64 61,096 4,204 56,014 878
1989-90 73,013 4,812 67,254 947 11,590 579 10,943 68 61,423 4,233 56,311 879
1990-91 73,912 5,065 67,835 1,012 11,667 633 10,966 68 62,245 4,432 56,869 944
1991-92 74,102 5,077 68,007 1,018 11,620 620 10,930 70 62,482 4,457 57,077 948
1992-93 74,268 4,929 68,330 1,009 11,603 587 10,947 69 62,665 4,342 57,383 940
1993-94 75,246 4,927 69,292 1,027 11,692 569 11,053 70 63,554 4,358 58,239 957

87
Table A3.2. Number of small schools in rural, small, and other school districts, by level and year
All Districts Rural Districts Nonrural Districts
Tot Elem Unified Sec Tot Elem Unified Sec Tot Elem Unified Sec
All Districts
1986-87 15,651 2,478 12,732 441 9,844 1,665 7,942 237 5,807 813 4,790 204
1987-88 15,233 2,350 12,479 404 9,605 1,598 7,773 234 5,628 752 4,706 170
1988-89 15,132 2,281 12,429 422 9,468 1,569 7,661 238 5,664 712 4,768 184
1989-90 15,146 2,213 12,503 430 9,463 1,532 7,688 243 5,683 681 4,815 187
1990-91 15,353 2,263 12,639 451 9,511 1,600 7,662 249 5,842 663 4,977 202
1991-92 15,186 2,183 12,535 468 9,313 1,554 7,511 248 5,873 629 5,024 220
1992-93 14,943 2,074 12,380 489 9,059 1,489 7,312 258 5,884 585 5,068 231
1993-94 14,959 1,968 12,488 503 8,903 1,423 7,199 281 6,056 545 5,289 222
Small Districts
1986-87 7,866 2,252 5,336 278 6,690 1,570 4,896 224 1,176 682 440 54
1987-88 7,659 2,206 5,186 267 6,567 1,550 4,797 220 1,092 656 389 47
1988-89 7,479 2,132 5,084 263 6,449 1,513 4,715 221 1,030 619 369 42
1989-90 7,375 2,054 5,057 264 6,388 1,468 4,700 220 987 586 357 44
1990-91 7,375 2,081 5,028 266 6,425 1,517 4,687 221 950 564 341 45
1991-92 7,174 2,006 4,904 264 6,270 1,478 4,573 219 904 528 331 45
1992-93 7,019 1,917 4,823 279 6,140 1,418 4,490 232 879 499 333 47
1993-94 6,873 1,814 4,758 301 6,030 1,354 4,420 256 843 460 338 45
Large Districts
1986-87 7,785 226 7,396 163 3,154 95 3,046 13 4,631 131 4,350 150
1987-88 7,574 144 7,293 137 3,038 48 2,976 14 4,536 96 4,317 123
1988-89 7,653 149 7,345 159 3,019 56 2,946 17 4,634 93 4,399 142
1989-90 7,771 159 7,446 166 3,075 64 2,988 23 4,696 95 4,458 143
1990-91 7,978 182 7,611 185 3,086 83 2,975 28 4,892 99 4,636 157
1991-92 8,012 177 7,631 204 3,043 76 2,938 29 4,969 101 4,693 175
1992-93 7,924 157 7,557 210 2,919 71 2,822 26 5,005 86 4,735 184
1993-94 8,086 154 7,730 202 2,873 69 2,779 25 5,213 85 4,951 177
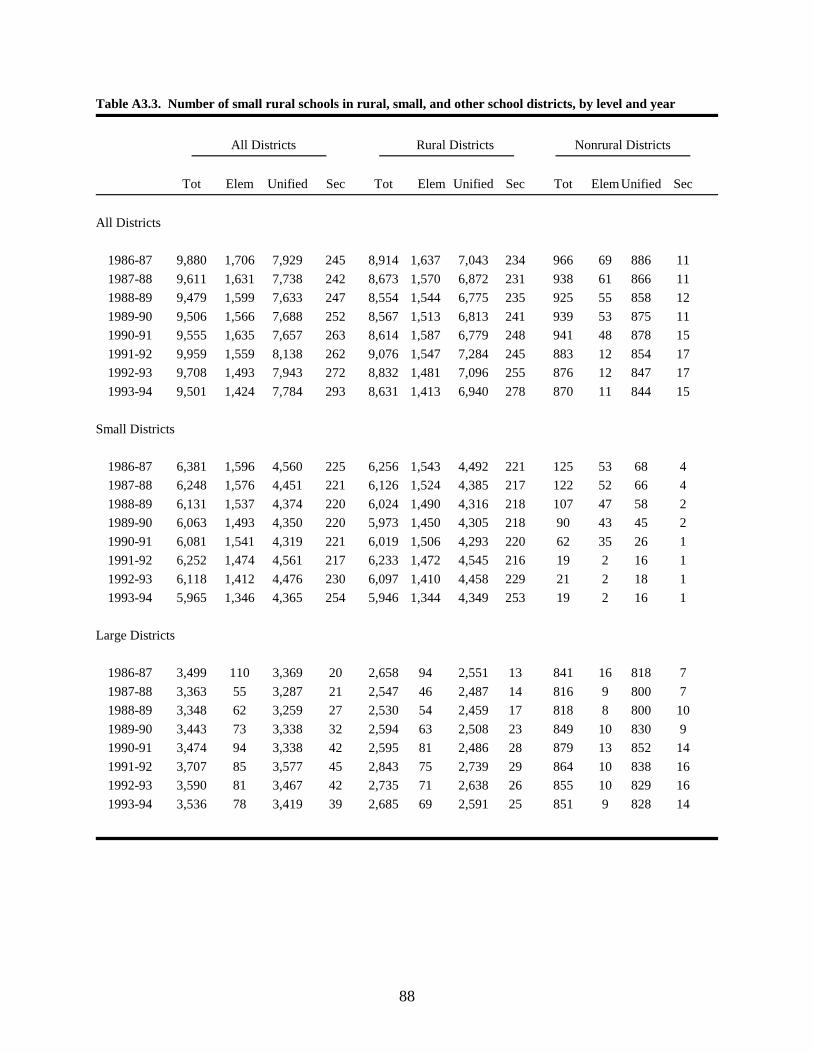
88
Table A3.3. Number of small rural schools in rural, small, and other school districts, by level and year
All Districts Rural Districts Nonrural Districts
Tot Elem Unified Sec Tot Elem Unified Sec Tot ElemUnified Sec
All Districts
1986-87 9,880 1,706 7,929 245 8,914 1,637 7,043 234 966 69 886 11
1987-88 9,611 1,631 7,738 242 8,673 1,570 6,872 231 938 61 866 11
1988-89 9,479 1,599 7,633 247 8,554 1,544 6,775 235 925 55 858 12
1989-90 9,506 1,566 7,688 252 8,567 1,513 6,813 241 939 53 875 11
1990-91 9,555 1,635 7,657 263 8,614 1,587 6,779 248 941 48 878 15
1991-92 9,959 1,559 8,138 262 9,076 1,547 7,284 245 883 12 854 17
1992-93 9,708 1,493 7,943 272 8,832 1,481 7,096 255 876 12 847 17
1993-94 9,501 1,424 7,784 293 8,631 1,413 6,940 278 870 11 844 15
Small Districts
1986-87 6,381 1,596 4,560 225 6,256 1,543 4,492 221 125 53 68 4
1987-88 6,248 1,576 4,451 221 6,126 1,524 4,385 217 122 52 66 4
1988-89 6,131 1,537 4,374 220 6,024 1,490 4,316 218 107 47 58 2
1989-90 6,063 1,493 4,350 220 5,973 1,450 4,305 218 90 43 45 2
1990-91 6,081 1,541 4,319 221 6,019 1,506 4,293 220 62 35 26 1
1991-92 6,252 1,474 4,561 217 6,233 1,472 4,545 216 19 2 16 1
1992-93 6,118 1,412 4,476 230 6,097 1,410 4,458 229 21 2 18 1
1993-94 5,965 1,346 4,365 254 5,946 1,344 4,349 253 19 2 16 1
Large Districts
1986-87 3,499 110 3,369 20 2,658 94 2,551 13 841 16 818 7
1987-88 3,363 55 3,287 21 2,547 46 2,487 14 816 9 800 7
1988-89 3,348 62 3,259 27 2,530 54 2,459 17 818 8 800 10
1989-90 3,443 73 3,338 32 2,594 63 2,508 23 849 10 830 9
1990-91 3,474 94 3,338 42 2,595 81 2,486 28 879 13 852 14
1991-92 3,707 85 3,577 45 2,843 75 2,739 29 864 10 838 16
1992-93 3,590 81 3,467 42 2,735 71 2,638 26 855 10 829 16
1993-94 3,536 78 3,419 39 2,685 69 2,591 25 851 9 828 14

89
Table A3.4. Number of regular and non-regular schools in rural, small, and other school districts, by year
Schools in Schools in Schools in
All Districts Rural Districts Nonrural Districts
Regular Nonregular Regular Nonregular Regular Nonregular
All Districts
1986-87 79,043 3,052 19,664 321 59,379 2,731
1987-88 78,610 2,999 19,414 309 59,196 2,690
1988-89 78,753 2,789 19,314 281 59,439 2,508
1989-90 78,968 3,192 19,401 297 59,567 2,895
1990-91 79,983 3,213 19,558 341 60,425 2,872
1991-92 79,647 3,791 19,352 386 60,295 3,405
1992-93 79,362 4,101 19,128 487 60,234 3,614
1993-94 79,757 4,565 19,146 465 60,611 4,100
Small Districts
1986-87 9,606 180 8,307 77 1,299 103
1987-88 9,386 125 8,166 66 1,220 59
1988-89 9,315 101 8,104 55 1,211 46
1989-90 9,261 110 8,088 56 1,173 54
1990-91 9,329 165 8,165 103 1,164 62
1991-92 9,124 200 8,022 94 1,102 106
1992-93 8,933 262 7,858 154 1,075 108
1993-94 8,850 224 7,807 110 1,043 114
Large Districts
1986-87 69,437 2,872 11,357 244 58,080 2,628
1987-88 69,224 2,874 11,248 243 57,976 2,631
1988-89 69,438 2,688 11,210 226 58,228 2,462
1989-90 69,707 3,082 11,313 241 58,394 2,841
1990-91 70,654 3,048 11,393 238 59,261 2,810
1991-92 70,523 3,591 11,330 292 59,193 3,299
1992-93 70,429 3,839 11,270 333 59,159 3,506
1993-94 70,907 4,341 11,339 355 59,568 3,986

90
Table A3.5. Number of combined (K-12), elementary, intermediate, secondary, and ungraded/other schoolsin rural, small, and other school districts in 1986-87 and 1993-94
All Districts Rural Districts Nonrural Districts
Total Small Large Total Small Large Total Small Large
Elementary Schools
1986-87 50,591 5,563 45,028 11,225 4,621 6,604 39,366 942 38,424
1993-94 51,513 4,823 46,690 10,503 4,077 6,426 41,010 746 40,264
Intermediate Schools
1986-87 11,938 525 11,413 2,064 480 1,584 9,874 45 9,829
1993-94 12,954 821 12,133 2,560 763 1,797 10,394 58 10,336
High Schools
1986-87 15,714 3,180 12,534 5,664 2,883 2,781 10,050 297 9,753
1993-94 15,826 2,750 13,076 5,315 2,521 2,794 10,511 229 10,282
Combined Schools
1986-87 1,775 409 1,366 805 355 450 970 54 916
1993-94 2,461 586 1,875 1,002 507 495 1,459 79 1,380
Ungraded Schools
1986-87 966 63 903 55 11 44 911 52 859
1993-94 608 45 563 33 11 22 575 34 541

91
Table A3.6. Number of schools with kindergarten and ungraded classes in rural, small, and other schooldistricts, by year
Schools in Schools in Schools in
All Districts Rural Districts Nonrural Districts
Kinder- Prekin- Kinder- Prekin- Kinder- Prekin-
garten dergarten Ungraded garten dergarten Ungraded garten dergarten Ungraded
All Districts
1986-87 44,791 5,539 25,435 10,282 953 4,238 34,509 4,586 21,197
1987-88 46,364 6,467 23,434 10,463 1,197 3,812 35,901 5,270 19,622
1988-89 46,525 6,885 25,140 10,453 1,248 4,123 36,072 5,637 21,017
1989-90 46,803 8,178 25,919 10,497 1,490 4,018 36,306 6,688 21,901
1990-91 46,963 9,416 23,908 10,465 1,828 3,569 36,498 7,588 20,339
1991-92 46,940 11,591 24,000 10,330 2,417 3,670 36,610 9,174 20,330
1992-93 47,092 12,358 23,908 10,237 2,502 3,679 36,855 9,856 20,229
1993-94 47,126 13,316 22,713 10,162 2,731 3,266 36,964 10,585 19,447
Small Districts
1986-87 5,116 495 1,283 4,278 450 1,087 838 45 196
1987-88 5,199 637 1,240 4,362 562 1,078 837 75 162
1988-89 5,214 626 1,273 4,373 568 1,085 841 58 188
1989-90 5,207 719 1,081 4,378 655 923 829 64 158
1990-91 5,159 893 1,004 4,349 812 845 810 81 159
1991-92 5,070 1,001 1,008 4,286 902 852 784 99 156
1992-93 4,982 1,084 1,000 4,213 984 838 769 100 162
1993-94 4,895 1,181 851 4,162 1,066 685 733 115 166
Large Districts
1986-87 39,675 5,044 24,152 6,004 503 3,151 33,671 4,541 21,001
1987-88 41,165 5,830 22,194 6,101 635 2,734 35,064 5,195 19,460
1988-89 41,311 6,259 23,867 6,080 680 3,038 35,231 5,579 20,829
1989-90 41,596 7,459 24,838 6,119 835 3,095 35,477 6,624 21,743
1990-91 41,804 8,523 22,904 6,116 1,016 2,724 35,688 7,507 20,180
1991-92 41,870 10,590 22,992 6,044 1,515 2,818 35,826 9,075 20,174
1992-93 42,110 11,274 22,908 6,024 1,518 2,841 36,086 9,756 20,067
1993-94 42,231 12,135 21,862 6,000 1,665 2,581 36,231 10,470 19,281
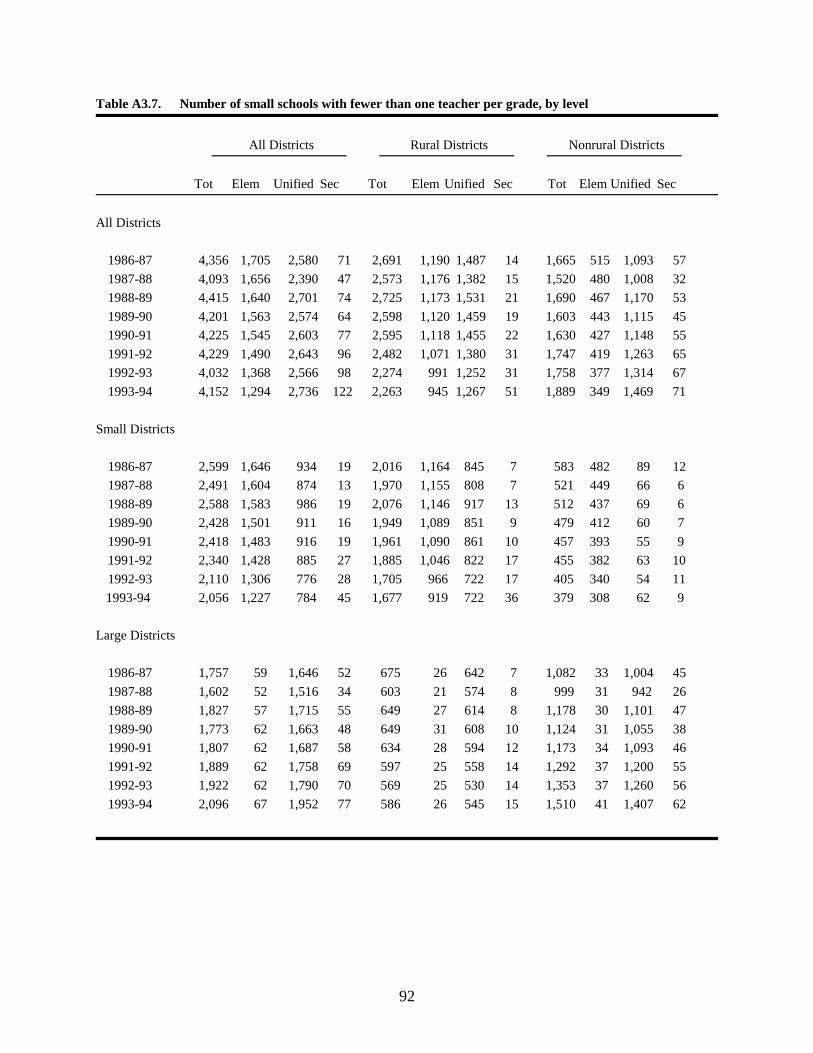
92
Table A3.7. Number of small schools with fewer than one teacher per grade, by level
All Districts Rural Districts Nonrural Districts
Tot Elem Unified Sec Tot Elem Unified Sec Tot Elem Unified Sec
All Districts
1986-87 4,356 1,705 2,580 71 2,691 1,190 1,487 14 1,665 515 1,093 57
1987-88 4,093 1,656 2,390 47 2,573 1,176 1,382 15 1,520 480 1,008 32
1988-89 4,415 1,640 2,701 74 2,725 1,173 1,531 21 1,690 467 1,170 53
1989-90 4,201 1,563 2,574 64 2,598 1,120 1,459 19 1,603 443 1,115 45
1990-91 4,225 1,545 2,603 77 2,595 1,118 1,455 22 1,630 427 1,148 55
1991-92 4,229 1,490 2,643 96 2,482 1,071 1,380 31 1,747 419 1,263 65
1992-93 4,032 1,368 2,566 98 2,274 991 1,252 31 1,758 377 1,314 67
1993-94 4,152 1,294 2,736 122 2,263 945 1,267 51 1,889 349 1,469 71
Small Districts
1986-87 2,599 1,646 934 19 2,016 1,164 845 7 583 482 89 12
1987-88 2,491 1,604 874 13 1,970 1,155 808 7 521 449 66 6
1988-89 2,588 1,583 986 19 2,076 1,146 917 13 512 437 69 6
1989-90 2,428 1,501 911 16 1,949 1,089 851 9 479 412 60 7
1990-91 2,418 1,483 916 19 1,961 1,090 861 10 457 393 55 9
1991-92 2,340 1,428 885 27 1,885 1,046 822 17 455 382 63 10
1992-93 2,110 1,306 776 28 1,705 966 722 17 405 340 54 11
1993-94 2,056 1,227 784 45 1,677 919 722 36 379 308 62 9
Large Districts
1986-87 1,757 59 1,646 52 675 26 642 7 1,082 33 1,004 45
1987-88 1,602 52 1,516 34 603 21 574 8 999 31 942 26
1988-89 1,827 57 1,715 55 649 27 614 8 1,178 30 1,101 47
1989-90 1,773 62 1,663 48 649 31 608 10 1,124 31 1,055 38
1990-91 1,807 62 1,687 58 634 28 594 12 1,173 34 1,093 46
1991-92 1,889 62 1,758 69 597 25 558 14 1,292 37 1,200 55
1992-93 1,922 62 1,790 70 569 25 530 14 1,353 37 1,260 56
1993-94 2,096 67 1,952 77 586 26 545 15 1,510 41 1,407 62
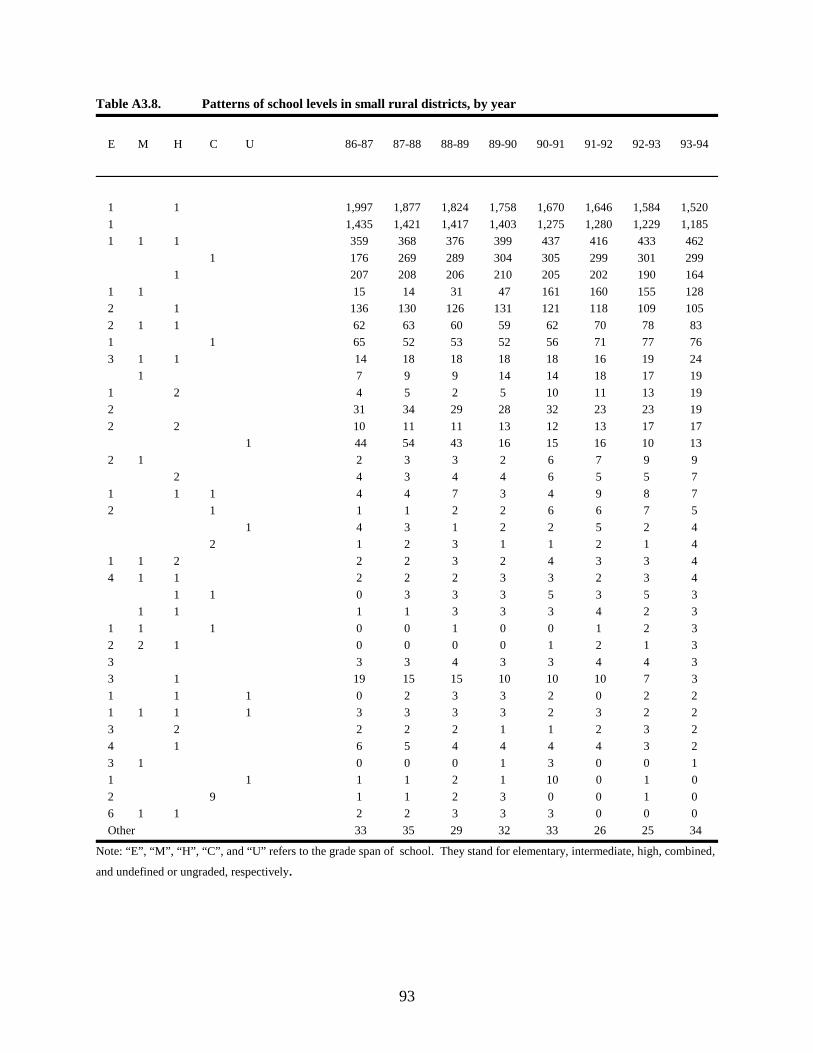
93
Table A3.8. Patterns of school levels in small rural districts, by year
E M H C U 86-87 87-88 88-89 89-90 90-91 91-92 92-93 93-94
1 1 1,997 1,877 1,824 1,758 1,670 1,646 1,584 1,520
1 1,435 1,421 1,417 1,403 1,275 1,280 1,229 1,185
1 1 1 359 368 376 399 437 416 433 462
1 176 269 289 304 305 299 301 299
1 207 208 206 210 205 202 190 164
1 1 15 14 31 47 161 160 155 128
2 1 136 130 126 131 121 118 109 105
2 1 1 62 63 60 59 62 70 78 83
1 1 65 52 53 52 56 71 77 76
3 1 1 14 18 18 18 18 16 19 24
1 7 9 9 14 14 18 17 19
1 2 4 5 2 5 10 11 13 19
2 31 34 29 28 32 23 23 19
2 2 10 11 11 13 12 13 17 17
1 44 54 43 16 15 16 10 13
2 1 2 3 3 2 6 7 9 9
2 4 3 4 4 6 5 5 7
1 1 1 4 4 7 3 4 9 8 7
2 1 1 1 2 2 6 6 7 5
1 4 3 1 2 2 5 2 4
2 1 2 3 1 1 2 1 4
1 1 2 2 2 3 2 4 3 3 4
4 1 1 2 2 2 3 3 2 3 4
1 1 0 3 3 3 5 3 5 3
1 1 1 1 3 3 3 4 2 3
1 1 1 0 0 1 0 0 1 2 3
2 2 1 0 0 0 0 1 2 1 3
3 3 3 4 3 3 4 4 3
3 1 19 15 15 10 10 10 7 3
1 1 1 0 2 3 3 2 0 2 2
1 1 1 1 3 3 3 3 2 3 2 2
3 2 2 2 2 1 1 2 3 2
4 1 6 5 4 4 4 4 3 2
3 1 0 0 0 1 3 0 0 1
1 1 1 1 2 1 10 0 1 0
2 9 1 1 2 3 0 0 1 0
6 1 1 2 2 3 3 3 0 0 0
Other 33 35 29 32 33 26 25 34
Note: “E”, “M”, “H”, “C”, and “U” refers to the grade span of school. They stand for elementary, intermediate, high, combined,
and undefined or ungraded, respectively.
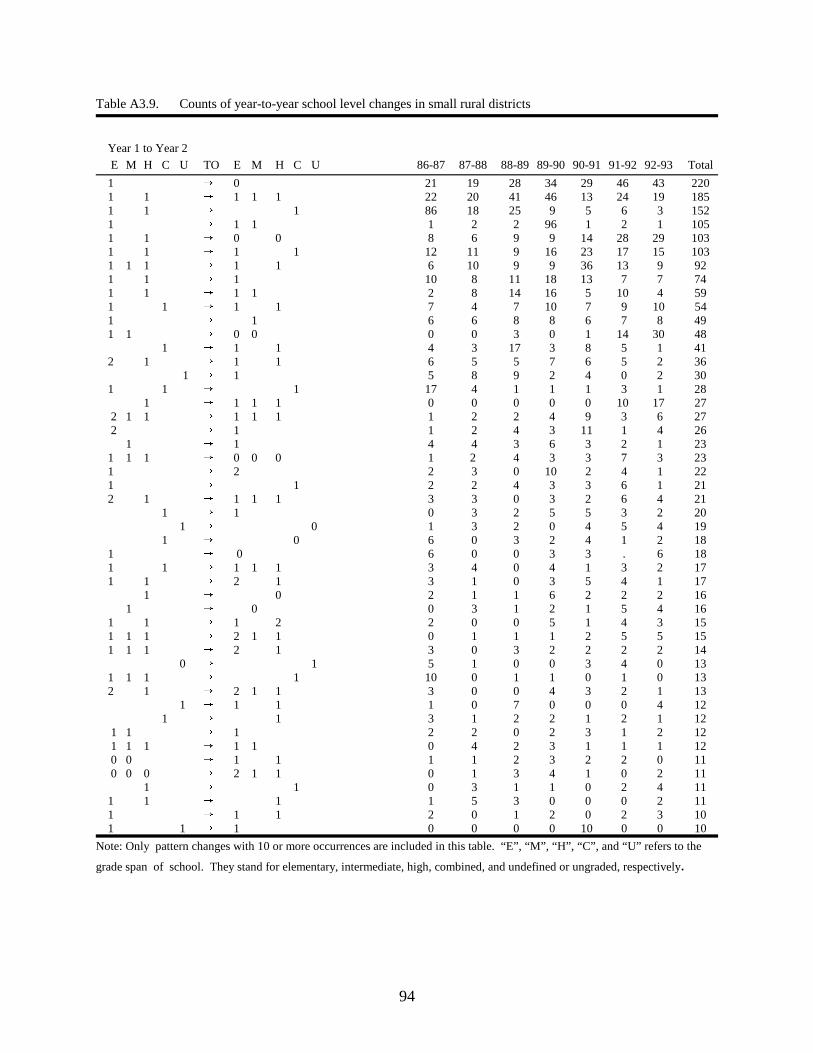
94
Table A3.9. Counts of year-to-year school level changes in small rural districts
Year 1 to Year 2
E M H C U TO E M H C U 86-87 87-88 88-89 89-90 90-91 91-92 92-93 Total
1 Ú 0 21 19 28 34 29 46 43 2201 1 Ú 1 1 1 22 20 41 46 13 24 19 1851 1 Ú 1 86 18 25 9 5 6 3 1521 Ú 1 1 1 2 2 96 1 2 1 1051 1 Ú 0 0 8 6 9 9 14 28 29 1031 1 Ú 1 1 12 11 9 16 23 17 15 1031 1 1 Ú 1 1 6 10 9 9 36 13 9 921 1 Ú 1 10 8 11 18 13 7 7 741 1 Ú 1 1 2 8 14 16 5 10 4 59
1 1 Ú 1 1 7 4 7 10 7 9 10 541 Ú 1 6 6 8 8 6 7 8 491 1 Ú 0 0 0 0 3 0 1 14 30 48 1 Ú 1 1 4 3 17 3 8 5 1 412 1 Ú 1 1 6 5 5 7 6 5 2 36
1 Ú 1 5 8 9 2 4 0 2 301 1 Ú 1 17 4 1 1 1 3 1 28 1 Ú 1 1 1 0 0 0 0 0 10 17 27 2 1 1 Ú 1 1 1 1 2 2 4 9 3 6 27 2 Ú 1 1 2 4 3 11 1 4 26 1 Ú 1 4 4 3 6 3 2 1 231 1 1 Ú 0 0 0 1 2 4 3 3 7 3 231 Ú 2 2 3 0 10 2 4 1 221 Ú 1 2 2 4 3 3 6 1 212 1 Ú 1 1 1 3 3 0 3 2 6 4 21
1 Ú 1 0 3 2 5 5 3 2 20 1 Ú 0 1 3 2 0 4 5 4 19 1 Ú 0 6 0 3 2 4 1 2 181 Ú 0 6 0 0 3 3 . 6 181 1 Ú 1 1 1 3 4 0 4 1 3 2 171 1 Ú 2 1 3 1 0 3 5 4 1 17
1 Ú 0 2 1 1 6 2 2 2 161 Ú 0 0 3 1 2 1 5 4 16
1 1 Ú 1 2 2 0 0 5 1 4 3 151 1 1 Ú 2 1 1 0 1 1 1 2 5 5 151 1 1 Ú 2 1 3 0 3 2 2 2 2 14 0 Ú 1 5 1 0 0 3 4 0 131 1 1 Ú 1 10 0 1 1 0 1 0 132 1 Ú 2 1 1 3 0 0 4 3 2 1 13
1 Ú 1 1 1 0 7 0 0 0 4 12 1 Ú 1 3 1 2 2 1 2 1 12 1 1 Ú 1 2 2 0 2 3 1 2 12 1 1 1 Ú 1 1 0 4 2 3 1 1 1 12 0 0 Ú 1 1 1 1 2 3 2 2 0 11 0 0 0 Ú 2 1 1 0 1 3 4 1 0 2 11 1 Ú 1 0 3 1 1 0 2 4 11
1 1 Ú 1 1 5 3 0 0 0 2 111 Ú 1 1 2 0 1 2 0 2 3 101 1 Ú 1 0 0 0 0 10 0 0 10
Note: Only pattern changes with 10 or more occurrences are included in this table. “E”, “M”, “H”, “C”, and “U” refers to the
grade span of school. They stand for elementary, intermediate, high, combined, and undefined or ungraded, respectively.

95
Table A3.10. Counts of year-to-year school level changes in small rural districts with increasing or decliningenrollment
Year 1 to Year 2 86-87 87-88 88-89 89-90 90-91 91-92
E M H C U TO E M H C U to 87-88 to 88-89 to 89-90 to 90-91 to 91-92 to 92-93 Total
Decreased Enrollment1 Ú 0 41 47 62 62 73 88 3731 1 Ú 0 0 14 16 19 26 44 57 1761 1 Ú 1 1 1 13 22 32 12 3 8 901 1 Ú 1 14 6 20 23 15 9 871 1 Ú 0 0 0 0 3 1 16 42 621 1 Ú 1 33 8 5 5 4 3 581 1 1 Ú 1 1 11 9 4 11 14 3 521 1 1 Ú 0 0 0 3 7 7 6 12 9 441 Ú 1 1 0 0 20 17 2 0 391 1 Ú 1 1 2 7 11 8 6 2 361 1 Ú 1 1 4 3 6 7 7 4 31
1 Ú 0 3 2 7 8 4 4 281 Ú 0 7 2 5 4 6 3 27
1 Ú 0 2 4 2 3 6 9 261 Ú 0 2 6 2 1 4 9 24
1 1 Ú 1 1 2 4 10 2 1 3 221 1 Ú 1 5 8 3 0 1 2 192 1 Ú 1 1 5 4 1 1 5 2 18
1 Ú 1 1 0 7 5 2 1 2 172 1 Ú 0 0 2 4 2 1 3 4 162 Ú 0 1 4 1 0 3 4 131 1 Ú 1 9 0 1 0 0 2 12
1 Ú 1 1 1 3 2 3 1 112 1 1 Ú 1 1 1 1 1 3 3 1 2 11Increased Enrollment1 1 Ú 1 1 1 18 15 26 17 25 26 1271 1 Ú 1 35 14 9 4 5 2 691 1 Ú 1 1 7 3 8 13 18 12 611 1 Ú 1 1 7 12 15 11 6 8 591 Ú 1 1 2 2 21 27 0 0 521 1 1 Ú 1 1 2 4 5 10 15 13 49
1 Ú 1 1 1 0 0 0 0 10 28 381 Ú 1 1 2 4 7 6 11 5 35
0 0 Ú 1 1 3 3 5 6 4 6 271 1 Ú 1 1 1 2 3 5 9 4 241 1 Ú 1 3 7 5 4 3 2 241 1 1 Ú 2 1 1 1 2 2 3 6 6 202 1 Ú 1 1 2 4 6 0 6 2 200 0 0 Ú 2 1 1 1 4 7 3 2 2 191 1 Ú 2 1 1 1 2 7 5 3 192 1 Ú 1 1 1 1 2 1 2 3 6 151 Ú 2 4 2 4 1 1 2 141 1 Ú 2 1 1 0 1 1 2 4 6 142 1 1 Ú 1 1 1 0 1 2 4 4 3 14
1 Ú 1 1 4 5 2 1 0 130 Ú 1 2 1 0 3 6 0 12
0 Ú 1 0 1 3 4 3 1 121 Ú 1 0 1 3 2 3 2 111 1 1 Ú 2 1 1 1 3 1 4 1 110 Ú 1 6 0 0 0 1 3 100 0 0 Ú 1 1 1 0 1 3 5 0 1 10
Note: Only pattern changes with 10 or more occurrences are included in this table. “E”, “M”, “H”, “C”, and “U” refers to the
grade span of school. They stand for elementary, intermediate, high, combined, and undefined or ungraded, respectively.
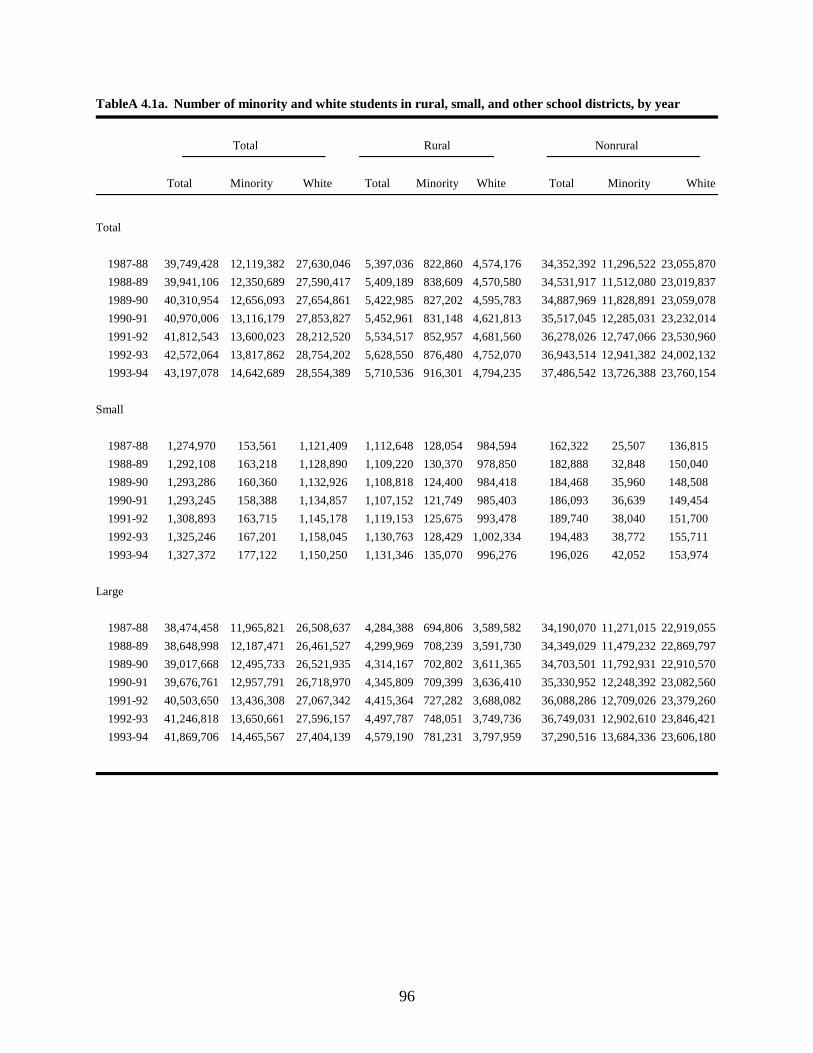
96
TableA 4.1a. Number of minority and white students in rural, small, and other school districts, by year
Total Rural Nonrural
Total Minority White Total Minority White Total Minority White
Total
1987-88 39,749,428 12,119,382 27,630,046 5,397,036 822,860 4,574,176 34,352,392 11,296,522 23,055,870
1988-89 39,941,106 12,350,689 27,590,417 5,409,189 838,609 4,570,580 34,531,917 11,512,080 23,019,837
1989-90 40,310,954 12,656,093 27,654,861 5,422,985 827,202 4,595,783 34,887,969 11,828,891 23,059,078
1990-91 40,970,006 13,116,179 27,853,827 5,452,961 831,148 4,621,813 35,517,045 12,285,031 23,232,014
1991-92 41,812,543 13,600,023 28,212,520 5,534,517 852,957 4,681,560 36,278,026 12,747,066 23,530,960
1992-93 42,572,064 13,817,862 28,754,202 5,628,550 876,480 4,752,070 36,943,514 12,941,382 24,002,132
1993-94 43,197,078 14,642,689 28,554,389 5,710,536 916,301 4,794,235 37,486,542 13,726,388 23,760,154
Small
1987-88 1,274,970 153,561 1,121,409 1,112,648 128,054 984,594 162,322 25,507 136,815
1988-89 1,292,108 163,218 1,128,890 1,109,220 130,370 978,850 182,888 32,848 150,040
1989-90 1,293,286 160,360 1,132,926 1,108,818 124,400 984,418 184,468 35,960 148,508
1990-91 1,293,245 158,388 1,134,857 1,107,152 121,749 985,403 186,093 36,639 149,454
1991-92 1,308,893 163,715 1,145,178 1,119,153 125,675 993,478 189,740 38,040 151,700
1992-93 1,325,246 167,201 1,158,045 1,130,763 128,429 1,002,334 194,483 38,772 155,711
1993-94 1,327,372 177,122 1,150,250 1,131,346 135,070 996,276 196,026 42,052 153,974
Large
1987-88 38,474,458 11,965,821 26,508,637 4,284,388 694,806 3,589,582 34,190,070 11,271,015 22,919,055
1988-89 38,648,998 12,187,471 26,461,527 4,299,969 708,239 3,591,730 34,349,029 11,479,232 22,869,797
1989-90 39,017,668 12,495,733 26,521,935 4,314,167 702,802 3,611,365 34,703,501 11,792,931 22,910,570
1990-91 39,676,761 12,957,791 26,718,970 4,345,809 709,399 3,636,410 35,330,952 12,248,392 23,082,560
1991-92 40,503,650 13,436,308 27,067,342 4,415,364 727,282 3,688,082 36,088,286 12,709,026 23,379,260
1992-93 41,246,818 13,650,661 27,596,157 4,497,787 748,051 3,749,736 36,749,031 12,902,610 23,846,421
1993-94 41,869,706 14,465,567 27,404,139 4,579,190 781,231 3,797,959 37,290,516 13,684,336 23,606,180

97
Table A4.1b. Percentage of minority and white students in rural, small, and other school districts, by year
Total Rural Nonrural
Minority White Minority White Minority White
Total
1987-88 30.5 69.5 15.2 84.8 32.9 67.1
1988-89 30.9 69.1 15.5 84.5 33.3 66.7
1989-90 31.4 68.6 15.3 84.7 33.9 66.1
1990-91 32.0 68.0 15.2 84.8 34.6 65.4
1991-92 32.5 67.5 15.4 84.6 35.1 64.9
1992-93 32.5 67.5 15.6 84.4 35.0 65.0
1993-94 33.9 66.1 16.0 84.0 36.6 63.4
Small
1987-88 12.0 88.0 11.5 88.5 15.7 84.3
1988-89 12.6 87.4 11.8 88.2 18.0 82.0
1989-90 12.4 87.6 11.2 88.8 19.5 80.5
1990-91 12.2 87.8 11.0 89.0 19.7 80.3
1991-92 12.5 87.5 11.2 88.8 20.0 80.0
1992-93 12.6 87.4 11.4 88.6 19.9 80.1
1993-94 13.3 86.7 11.9 88.1 21.5 78.5
Large
1987-88 31.1 68.9 16.2 83.8 33.0 67.0
1988-89 31.5 68.5 16.5 83.5 33.4 66.6
1989-90 32.0 68.0 16.3 83.7 34.0 66.0
1990-91 32.7 67.3 16.3 83.7 34.7 65.3
1991-92 33.2 66.8 16.5 83.5 35.2 64.8
1992-93 33.1 66.9 16.6 83.4 35.1 64.9
1993-94 34.5 65.5 17.1 82.9 36.7 63.3
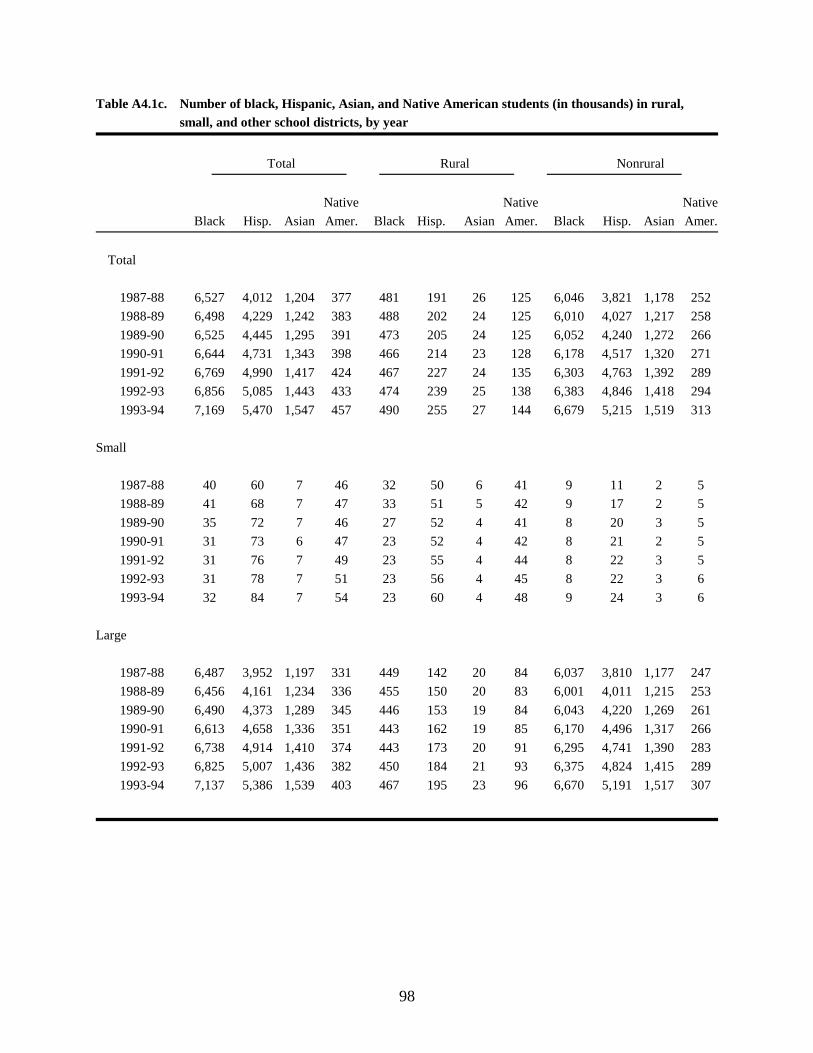
98
Table A4.1c. Number of black, Hispanic, Asian, and Native American students (in thousands) in rural,small, and other school districts, by year
Total Rural Nonrural
Native Native Native
Black Hisp. Asian Amer. Black Hisp. Asian Amer. Black Hisp. Asian Amer.
Total
1987-88 6,527 4,012 1,204 377 481 191 26 125 6,046 3,821 1,178 252
1988-89 6,498 4,229 1,242 383 488 202 24 125 6,010 4,027 1,217 258
1989-90 6,525 4,445 1,295 391 473 205 24 125 6,052 4,240 1,272 266
1990-91 6,644 4,731 1,343 398 466 214 23 128 6,178 4,517 1,320 271
1991-92 6,769 4,990 1,417 424 467 227 24 135 6,303 4,763 1,392 289
1992-93 6,856 5,085 1,443 433 474 239 25 138 6,383 4,846 1,418 294
1993-94 7,169 5,470 1,547 457 490 255 27 144 6,679 5,215 1,519 313
Small
1987-88 40 60 7 46 32 50 6 41 9 11 2 5
1988-89 41 68 7 47 33 51 5 42 9 17 2 5
1989-90 35 72 7 46 27 52 4 41 8 20 3 5
1990-91 31 73 6 47 23 52 4 42 8 21 2 5
1991-92 31 76 7 49 23 55 4 44 8 22 3 5
1992-93 31 78 7 51 23 56 4 45 8 22 3 6
1993-94 32 84 7 54 23 60 4 48 9 24 3 6
Large
1987-88 6,487 3,952 1,197 331 449 142 20 84 6,037 3,810 1,177 247
1988-89 6,456 4,161 1,234 336 455 150 20 83 6,001 4,011 1,215 253
1989-90 6,490 4,373 1,289 345 446 153 19 84 6,043 4,220 1,269 261
1990-91 6,613 4,658 1,336 351 443 162 19 85 6,170 4,496 1,317 266
1991-92 6,738 4,914 1,410 374 443 173 20 91 6,295 4,741 1,390 283
1992-93 6,825 5,007 1,436 382 450 184 21 93 6,375 4,824 1,415 289
1993-94 7,137 5,386 1,539 403 467 195 23 96 6,670 5,191 1,517 307
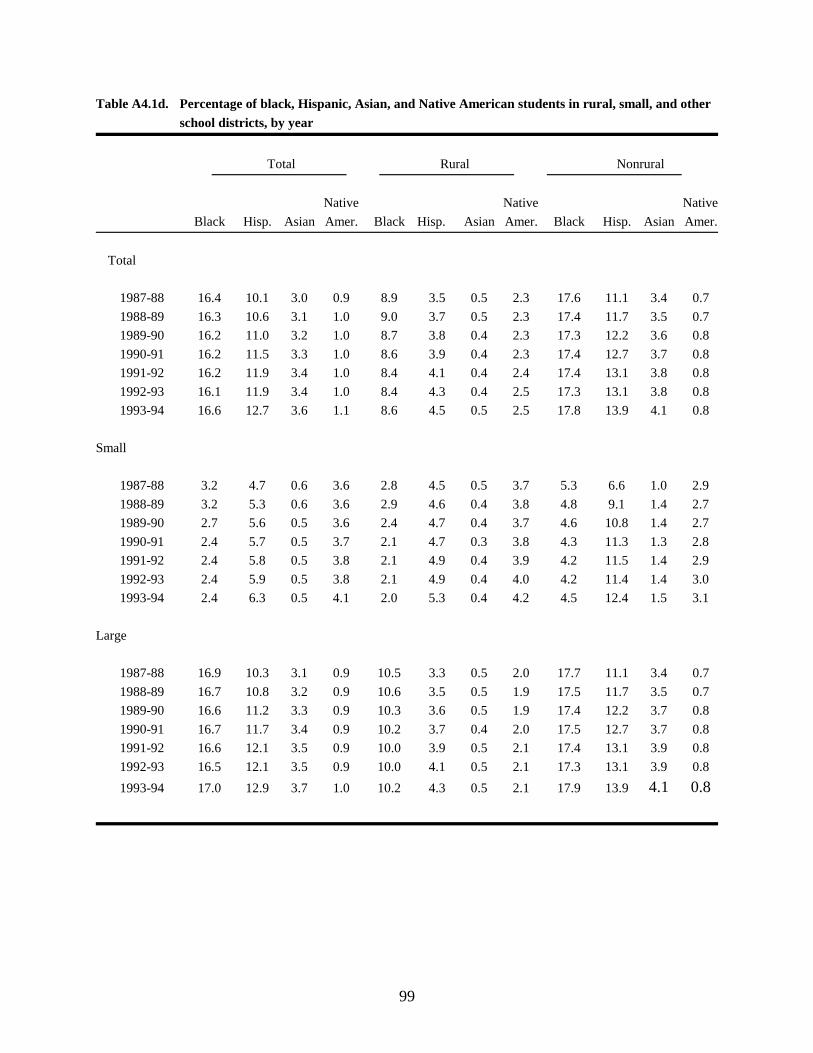
99
Table A4.1d. Percentage of black, Hispanic, Asian, and Native American students in rural, small, and otherschool districts, by year
Total Rural Nonrural
Native Native Native
Black Hisp. Asian Amer. Black Hisp. Asian Amer. Black Hisp. Asian Amer.
Total
1987-88 16.4 10.1 3.0 0.9 8.9 3.5 0.5 2.3 17.6 11.1 3.4 0.7
1988-89 16.3 10.6 3.1 1.0 9.0 3.7 0.5 2.3 17.4 11.7 3.5 0.7
1989-90 16.2 11.0 3.2 1.0 8.7 3.8 0.4 2.3 17.3 12.2 3.6 0.8
1990-91 16.2 11.5 3.3 1.0 8.6 3.9 0.4 2.3 17.4 12.7 3.7 0.8
1991-92 16.2 11.9 3.4 1.0 8.4 4.1 0.4 2.4 17.4 13.1 3.8 0.8
1992-93 16.1 11.9 3.4 1.0 8.4 4.3 0.4 2.5 17.3 13.1 3.8 0.8
1993-94 16.6 12.7 3.6 1.1 8.6 4.5 0.5 2.5 17.8 13.9 4.1 0.8
Small
1987-88 3.2 4.7 0.6 3.6 2.8 4.5 0.5 3.7 5.3 6.6 1.0 2.9
1988-89 3.2 5.3 0.6 3.6 2.9 4.6 0.4 3.8 4.8 9.1 1.4 2.7
1989-90 2.7 5.6 0.5 3.6 2.4 4.7 0.4 3.7 4.6 10.8 1.4 2.7
1990-91 2.4 5.7 0.5 3.7 2.1 4.7 0.3 3.8 4.3 11.3 1.3 2.8
1991-92 2.4 5.8 0.5 3.8 2.1 4.9 0.4 3.9 4.2 11.5 1.4 2.9
1992-93 2.4 5.9 0.5 3.8 2.1 4.9 0.4 4.0 4.2 11.4 1.4 3.0
1993-94 2.4 6.3 0.5 4.1 2.0 5.3 0.4 4.2 4.5 12.4 1.5 3.1
Large
1987-88 16.9 10.3 3.1 0.9 10.5 3.3 0.5 2.0 17.7 11.1 3.4 0.7
1988-89 16.7 10.8 3.2 0.9 10.6 3.5 0.5 1.9 17.5 11.7 3.5 0.7
1989-90 16.6 11.2 3.3 0.9 10.3 3.6 0.5 1.9 17.4 12.2 3.7 0.8
1990-91 16.7 11.7 3.4 0.9 10.2 3.7 0.4 2.0 17.5 12.7 3.7 0.8
1991-92 16.6 12.1 3.5 0.9 10.0 3.9 0.5 2.1 17.4 13.1 3.9 0.8
1992-93 16.5 12.1 3.5 0.9 10.0 4.1 0.5 2.1 17.3 13.1 3.9 0.8
1993-94 17.0 12.9 3.7 1.0 10.2 4.3 0.5 2.1 17.9 13.94.1 0.8
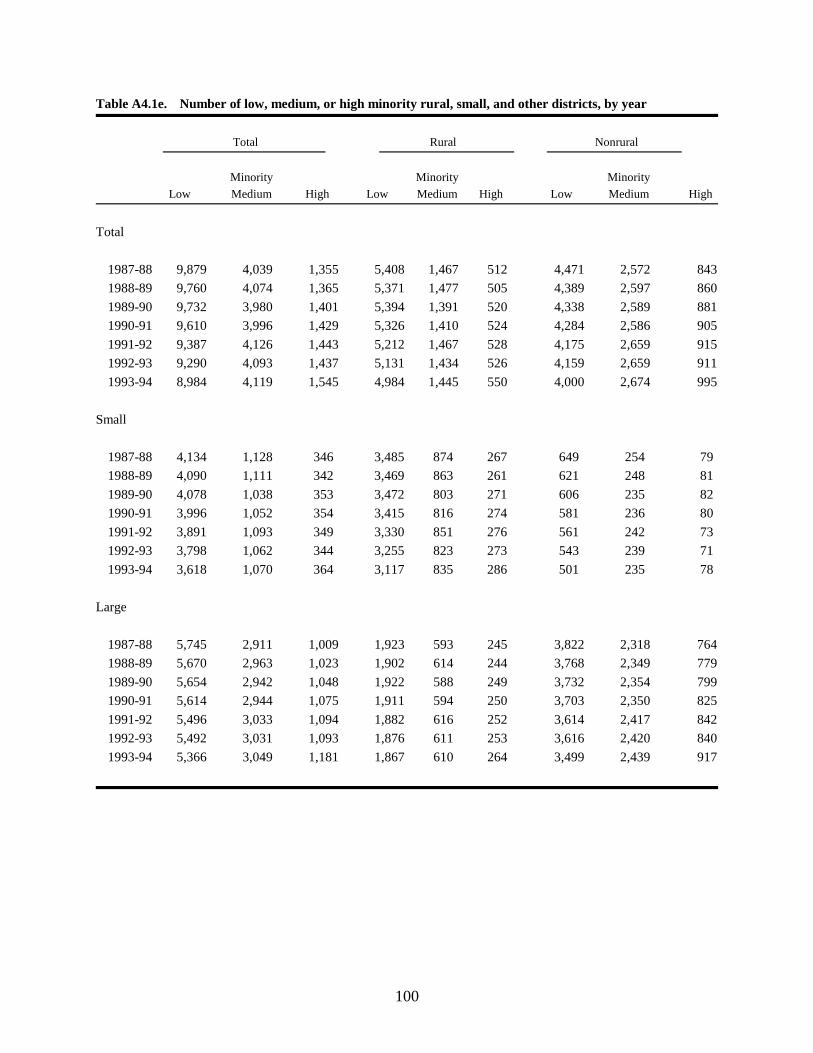
100
Table A4.1e. Number of low, medium, or high minority rural, small, and other districts, by year
Total Rural Nonrural
Minority Minority Minority
Low Medium High Low Medium High Low Medium High
Total
1987-88 9,879 4,039 1,355 5,408 1,467 512 4,471 2,572 843
1988-89 9,760 4,074 1,365 5,371 1,477 505 4,389 2,597 860
1989-90 9,732 3,980 1,401 5,394 1,391 520 4,338 2,589 881
1990-91 9,610 3,996 1,429 5,326 1,410 524 4,284 2,586 905
1991-92 9,387 4,126 1,443 5,212 1,467 528 4,175 2,659 915
1992-93 9,290 4,093 1,437 5,131 1,434 526 4,159 2,659 911
1993-94 8,984 4,119 1,545 4,984 1,445 550 4,000 2,674 995
Small
1987-88 4,134 1,128 346 3,485 874 267 649 254 79
1988-89 4,090 1,111 342 3,469 863 261 621 248 81
1989-90 4,078 1,038 353 3,472 803 271 606 235 82
1990-91 3,996 1,052 354 3,415 816 274 581 236 80
1991-92 3,891 1,093 349 3,330 851 276 561 242 73
1992-93 3,798 1,062 344 3,255 823 273 543 239 71
1993-94 3,618 1,070 364 3,117 835 286 501 235 78
Large
1987-88 5,745 2,911 1,009 1,923 593 245 3,822 2,318 764
1988-89 5,670 2,963 1,023 1,902 614 244 3,768 2,349 779
1989-90 5,654 2,942 1,048 1,922 588 249 3,732 2,354 799
1990-91 5,614 2,944 1,075 1,911 594 250 3,703 2,350 825
1991-92 5,496 3,033 1,094 1,882 616 252 3,614 2,417 842
1992-93 5,492 3,031 1,093 1,876 611 253 3,616 2,420 840
1993-94 5,366 3,049 1,181 1,867 610 264 3,499 2,439 917

101
Table A4.1f. Minority enrollment in low, medium, or high minority rural, small, and other schooldistricts, by year
Total Rural Nonrural
Minority Minority Minority
Low Medium High Low Medium High Low Medium High
Total
1987-88 4.8 33.6 61.6 12.8 42.9 44.3 4.2 32.9 62.8
1988-89 4.8 33.6 61.6 12.9 43.8 43.2 4.2 32.9 62.9
1989-90 4.5 33.7 61.7 12.6 43.2 44.2 4.0 33.1 62.9
1990-91 4.2 33.3 62.5 11.2 43.8 45.0 3.7 32.6 63.6
1991-92 4.0 33.6 62.4 10.5 45.0 44.5 3.6 32.9 63.6
1992-93 4.0 33.9 62.1 10.4 45.0 44.7 3.6 33.1 63.3
1993-94 3.6 32.6 63.7 10.3 43.3 46.4 3.2 31.9 64.9
Small
1987-88 16.8 43.6 39.6 17.4 43.3 39.2 13.4 45.2 41.4
1988-89 16.6 43.6 39.9 17.9 44.6 37.5 11.0 39.7 49.3
1989-90 16.0 41.1 42.9 17.7 42.4 39.9 9.9 36.6 53.5
1990-91 12.6 42.2 45.3 13.9 44.0 42.1 8.2 36.1 55.7
1991-92 12.1 43.7 44.2 13.4 45.3 41.2 7.7 38.4 53.9
1992-93 12.0 44.1 43.9 13.3 45.7 41.0 7.8 38.6 53.6
1993-94 12.2 43.3 44.6 13.6 45.0 41.4 7.5 37.9 54.6
Large
1987-88 4.7 33.5 61.9 12.0 42.8 45.2 4.2 32.9 62.9
1988-89 4.6 33.5 61.9 12.0 43.7 44.3 4.2 32.9 63.0
1989-90 4.4 33.6 62.0 11.6 43.4 45.0 4.0 33.1 63.0
1990-91 4.1 33.2 62.7 10.7 43.8 45.5 3.7 32.6 63.7
1991-92 3.9 33.5 62.6 10.0 44.9 45.1 3.5 32.8 63.6
1992-93 3.9 33.8 62.4 9.9 44.8 45.3 3.5 33.1 63.3
1993-94 3.5 32.5 64.0 9.7 43.0 47.3 3.2 31.9 64.9
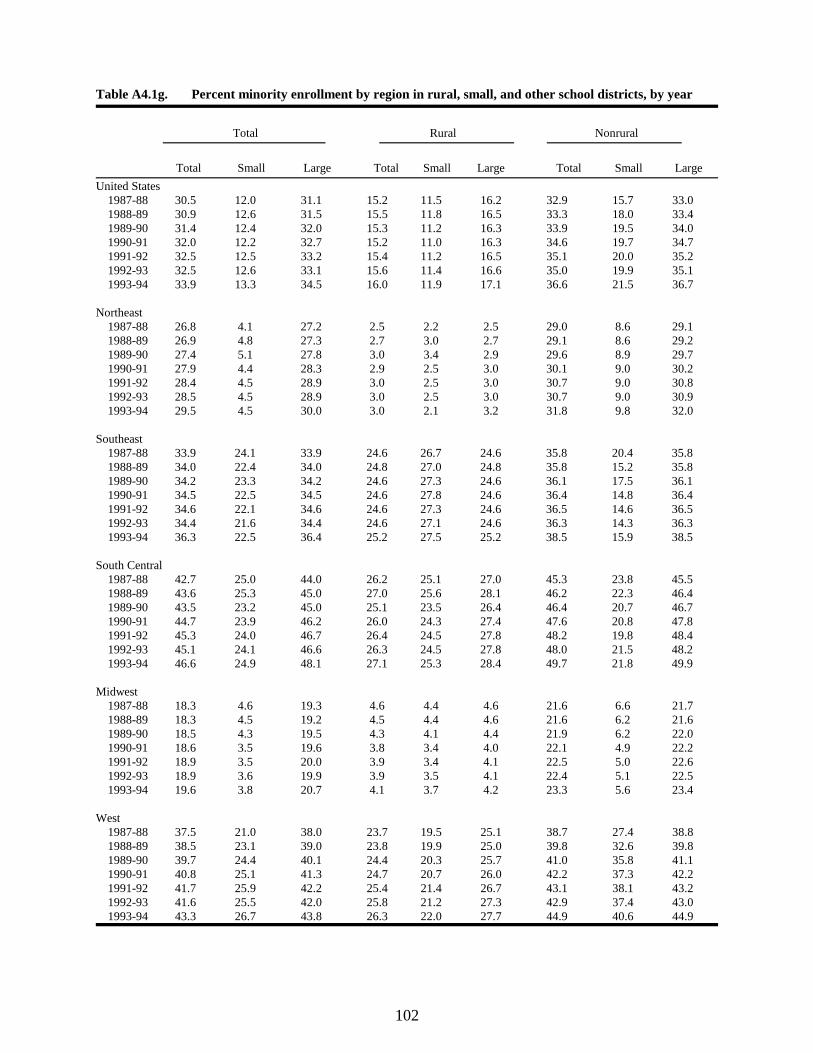
102
Table A4.1g. Percent minority enrollment by region in rural, small, and other school districts, by year
Total Rural Nonrural
Total Small Large Total Small Large Total Small Large
United States1987-88 30.5 12.0 31.1 15.2 11.5 16.2 32.9 15.7 33.01988-89 30.9 12.6 31.5 15.5 11.8 16.5 33.3 18.0 33.41989-90 31.4 12.4 32.0 15.3 11.2 16.3 33.9 19.5 34.01990-91 32.0 12.2 32.7 15.2 11.0 16.3 34.6 19.7 34.71991-92 32.5 12.5 33.2 15.4 11.2 16.5 35.1 20.0 35.21992-93 32.5 12.6 33.1 15.6 11.4 16.6 35.0 19.9 35.11993-94 33.9 13.3 34.5 16.0 11.9 17.1 36.6 21.5 36.7
Northeast1987-88 26.8 4.1 27.2 2.5 2.2 2.5 29.0 8.6 29.11988-89 26.9 4.8 27.3 2.7 3.0 2.7 29.1 8.6 29.21989-90 27.4 5.1 27.8 3.0 3.4 2.9 29.6 8.9 29.71990-91 27.9 4.4 28.3 2.9 2.5 3.0 30.1 9.0 30.21991-92 28.4 4.5 28.9 3.0 2.5 3.0 30.7 9.0 30.81992-93 28.5 4.5 28.9 3.0 2.5 3.0 30.7 9.0 30.91993-94 29.5 4.5 30.0 3.0 2.1 3.2 31.8 9.8 32.0
Southeast1987-88 33.9 24.1 33.9 24.6 26.7 24.6 35.8 20.4 35.81988-89 34.0 22.4 34.0 24.8 27.0 24.8 35.8 15.2 35.81989-90 34.2 23.3 34.2 24.6 27.3 24.6 36.1 17.5 36.11990-91 34.5 22.5 34.5 24.6 27.8 24.6 36.4 14.8 36.41991-92 34.6 22.1 34.6 24.6 27.3 24.6 36.5 14.6 36.51992-93 34.4 21.6 34.4 24.6 27.1 24.6 36.3 14.3 36.31993-94 36.3 22.5 36.4 25.2 27.5 25.2 38.5 15.9 38.5
South Central1987-88 42.7 25.0 44.0 26.2 25.1 27.0 45.3 23.8 45.51988-89 43.6 25.3 45.0 27.0 25.6 28.1 46.2 22.3 46.41989-90 43.5 23.2 45.0 25.1 23.5 26.4 46.4 20.7 46.71990-91 44.7 23.9 46.2 26.0 24.3 27.4 47.6 20.8 47.81991-92 45.3 24.0 46.7 26.4 24.5 27.8 48.2 19.8 48.41992-93 45.1 24.1 46.6 26.3 24.5 27.8 48.0 21.5 48.21993-94 46.6 24.9 48.1 27.1 25.3 28.4 49.7 21.8 49.9
Midwest1987-88 18.3 4.6 19.3 4.6 4.4 4.6 21.6 6.6 21.71988-89 18.3 4.5 19.2 4.5 4.4 4.6 21.6 6.2 21.61989-90 18.5 4.3 19.5 4.3 4.1 4.4 21.9 6.2 22.01990-91 18.6 3.5 19.6 3.8 3.4 4.0 22.1 4.9 22.21991-92 18.9 3.5 20.0 3.9 3.4 4.1 22.5 5.0 22.61992-93 18.9 3.6 19.9 3.9 3.5 4.1 22.4 5.1 22.51993-94 19.6 3.8 20.7 4.1 3.7 4.2 23.3 5.6 23.4
West1987-88 37.5 21.0 38.0 23.7 19.5 25.1 38.7 27.4 38.81988-89 38.5 23.1 39.0 23.8 19.9 25.0 39.8 32.6 39.81989-90 39.7 24.4 40.1 24.4 20.3 25.7 41.0 35.8 41.11990-91 40.8 25.1 41.3 24.7 20.7 26.0 42.2 37.3 42.21991-92 41.7 25.9 42.2 25.4 21.4 26.7 43.1 38.1 43.21992-93 41.6 25.5 42.0 25.8 21.2 27.3 42.9 37.4 43.01993-94 43.3 26.7 43.8 26.3 22.0 27.7 44.9 40.6 44.9

103
Table A4.2a. Number of students (in thousands) with IEPs in rural, small, and other school districts, by leveland year
Total Rural Nonrural
Total Elem Unified Second Total ElemUnified Second Total Elem Unified Second
Total
1987-88 3,689 179 3,439 70 516 25 486 5 3,173 154 2,953 65
1988-89 3,878 190 3,618 70 556 26 525 5 3,321 164 3,093 65
1989-90 4,070 194 3,806 70 584 28 551 5 3,485 166 3,255 65
1990-91 4,183 207 3,901 75 590 28 557 5 3,593 179 3,343 70
1991-92 4,274 210 3,988 76 607 29 573 5 3,667 181 3,415 71
1992-93 4,558 211 4,260 87 652 31 615 6 3,906 180 3,645 81
1993-94 4,736 223 4,424 89 670 31 633 6 4,066 193 3,791 82
Small
1987-88 126 15 107 4 109 11 96 2 17 5 11 1
1988-89 133 17 112 4 114 11 101 2 19 5 11 2
1989-90 139 18 117 4 118 12 103 2 22 6 14 2
1990-91 138 18 116 4 117 12 103 2 21 6 13 2
1991-92 146 18 123 5 123 12 108 3 23 6 15 2
1992-93 155 19 129 6 129 12 113 4 26 7 16 3
1993-94 157 19 132 6 130 12 115 3 27 7 17 3
Large
1987-88 3,563 164 3,332 67 407 14 390 3 3,156 150 2,942 64
1988-89 3,745 173 3,506 66 442 15 425 3 3,303 158 3,082 63
1989-90 3,931 176 3,689 66 467 16 448 3 3,464 160 3,241 63
1990-91 4,045 190 3,784 71 473 16 454 3 3,571 173 3,330 68
1991-92 4,128 192 3,864 72 484 17 464 3 3,644 175 3,400 69
1992-93 4,404 192 4,131 81 523 18 502 3 3,880 174 3,628 78
1993-94 4,579 204 4,293 82 540 19 519 3 4,040 186 3,774 79
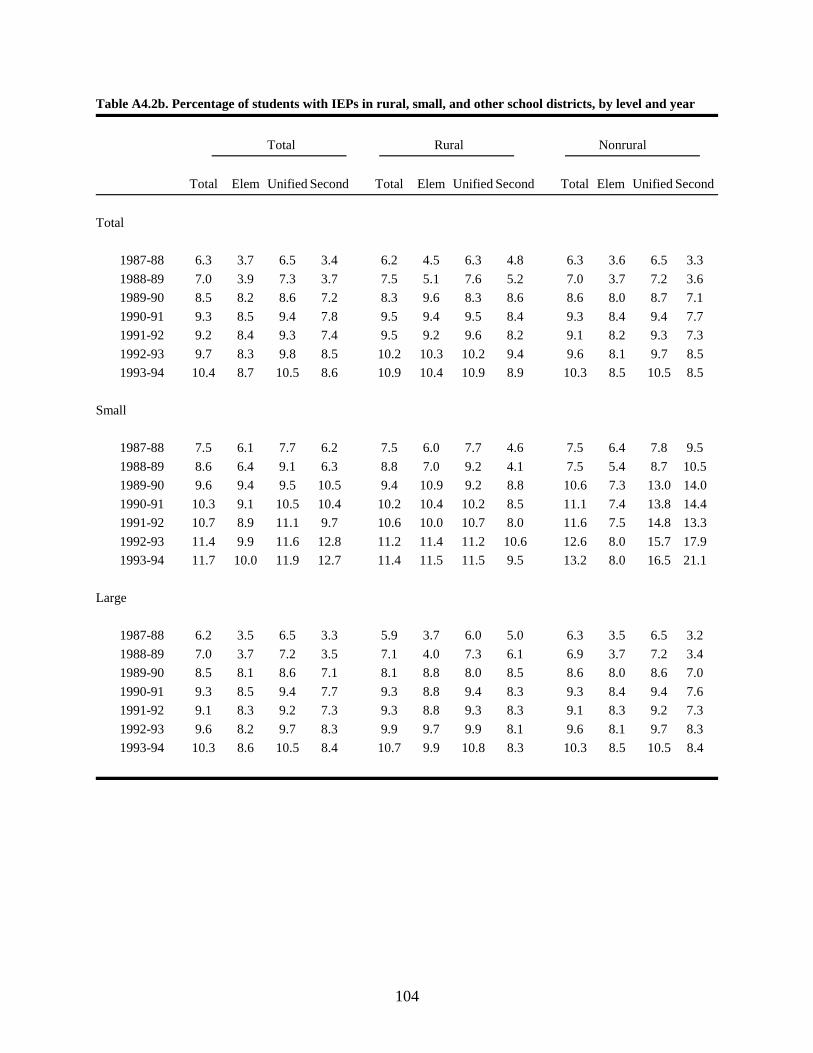
104
Table A4.2b. Percentage of students with IEPs in rural, small, and other school districts, by level and year
Total Rural Nonrural
Total Elem Unified Second Total Elem Unified Second Total Elem Unified Second
Total
1987-88 6.3 3.7 6.5 3.4 6.2 4.5 6.3 4.8 6.3 3.6 6.5 3.3
1988-89 7.0 3.9 7.3 3.7 7.5 5.1 7.6 5.2 7.0 3.7 7.2 3.6
1989-90 8.5 8.2 8.6 7.2 8.3 9.6 8.3 8.6 8.6 8.0 8.7 7.1
1990-91 9.3 8.5 9.4 7.8 9.5 9.4 9.5 8.4 9.3 8.4 9.4 7.7
1991-92 9.2 8.4 9.3 7.4 9.5 9.2 9.6 8.2 9.1 8.2 9.3 7.3
1992-93 9.7 8.3 9.8 8.5 10.2 10.3 10.2 9.4 9.6 8.1 9.7 8.5
1993-94 10.4 8.7 10.5 8.6 10.9 10.4 10.9 8.9 10.3 8.5 10.5 8.5
Small
1987-88 7.5 6.1 7.7 6.2 7.5 6.0 7.7 4.6 7.5 6.4 7.8 9.5
1988-89 8.6 6.4 9.1 6.3 8.8 7.0 9.2 4.1 7.5 5.4 8.7 10.5
1989-90 9.6 9.4 9.5 10.5 9.4 10.9 9.2 8.8 10.6 7.3 13.0 14.0
1990-91 10.3 9.1 10.5 10.4 10.2 10.4 10.2 8.5 11.1 7.4 13.8 14.4
1991-92 10.7 8.9 11.1 9.7 10.6 10.0 10.7 8.0 11.6 7.5 14.8 13.3
1992-93 11.4 9.9 11.6 12.8 11.2 11.4 11.2 10.6 12.6 8.0 15.7 17.9
1993-94 11.7 10.0 11.9 12.7 11.4 11.5 11.5 9.5 13.2 8.0 16.5 21.1
Large
1987-88 6.2 3.5 6.5 3.3 5.9 3.7 6.0 5.0 6.3 3.5 6.5 3.2
1988-89 7.0 3.7 7.2 3.5 7.1 4.0 7.3 6.1 6.9 3.7 7.2 3.4
1989-90 8.5 8.1 8.6 7.1 8.1 8.8 8.0 8.5 8.6 8.0 8.6 7.0
1990-91 9.3 8.5 9.4 7.7 9.3 8.8 9.4 8.3 9.3 8.4 9.4 7.6
1991-92 9.1 8.3 9.2 7.3 9.3 8.8 9.3 8.3 9.1 8.3 9.2 7.3
1992-93 9.6 8.2 9.7 8.3 9.9 9.7 9.9 8.1 9.6 8.1 9.7 8.3
1993-94 10.3 8.6 10.5 8.4 10.7 9.9 10.8 8.3 10.3 8.5 10.5 8.4
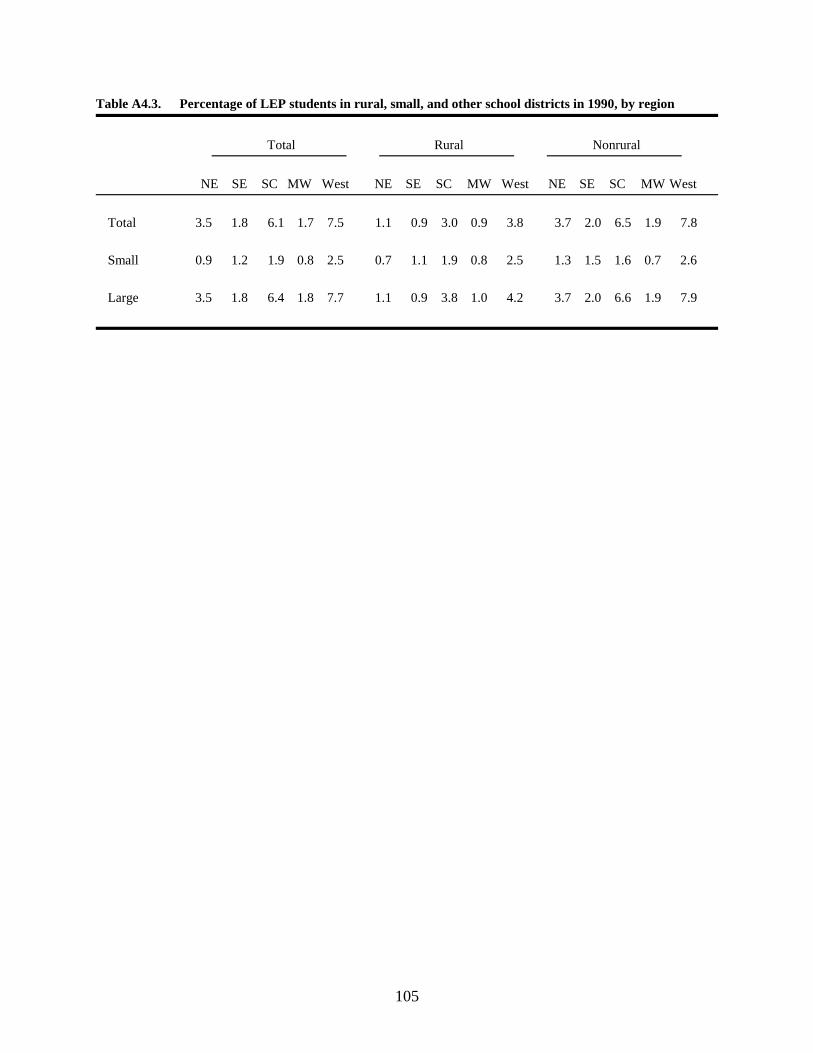
105
Table A4.3. Percentage of LEP students in rural, small, and other school districts in 1990, by region
Total Rural Nonrural
NE SE SC MW West NE SE SC MW West NE SE SC MW West
Total 3.5 1.8 6.1 1.7 7.5 1.1 0.9 3.0 0.9 3.8 3.7 2.0 6.5 1.9 7.8
Small 0.9 1.2 1.9 0.8 2.5 0.7 1.1 1.9 0.8 2.5 1.3 1.5 1.6 0.7 2.6
Large 3.5 1.8 6.4 1.8 7.7 1.1 0.9 3.8 1.0 4.2 3.7 2.0 6.6 1.9 7.9
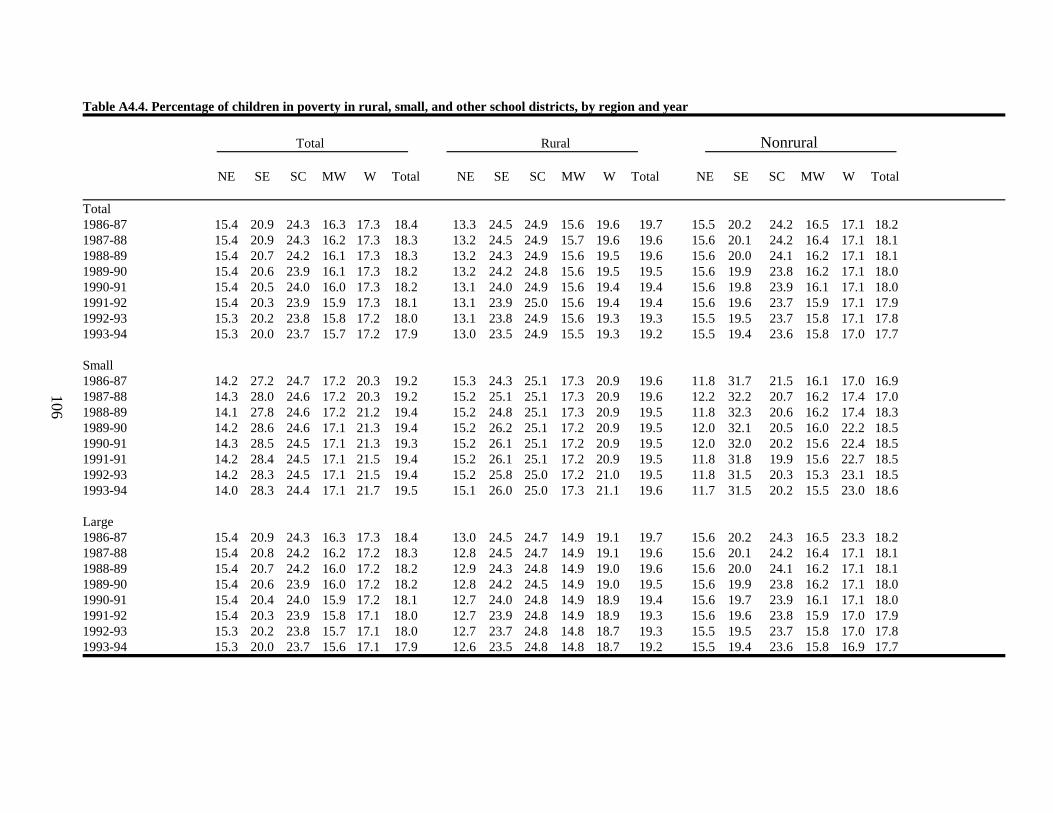
106
Table A4.4. Percentage of children in poverty in rural, small, and other school districts, by region and year
Total Rural Nonrural
NE SE SC MW W Total NE SE SC MW W Total NE SE SC MW W Total
Total1986-87 15.4 20.9 24.3 16.3 17.3 18.4 13.3 24.5 24.9 15.6 19.6 19.7 15.5 20.2 24.2 16.5 17.1 18.21987-88 15.4 20.9 24.3 16.2 17.3 18.3 13.2 24.5 24.9 15.7 19.6 19.6 15.6 20.1 24.2 16.4 17.1 18.11988-89 15.4 20.7 24.2 16.1 17.3 18.3 13.2 24.3 24.9 15.6 19.5 19.6 15.6 20.0 24.1 16.2 17.1 18.11989-90 15.4 20.6 23.9 16.1 17.3 18.2 13.2 24.2 24.8 15.6 19.5 19.5 15.6 19.9 23.8 16.2 17.1 18.01990-91 15.4 20.5 24.0 16.0 17.3 18.2 13.1 24.0 24.9 15.6 19.4 19.4 15.6 19.8 23.9 16.1 17.1 18.01991-92 15.4 20.3 23.9 15.9 17.3 18.1 13.1 23.9 25.0 15.6 19.4 19.4 15.6 19.6 23.7 15.9 17.1 17.91992-93 15.3 20.2 23.8 15.8 17.2 18.0 13.1 23.8 24.9 15.6 19.3 19.3 15.5 19.5 23.7 15.8 17.1 17.81993-94 15.3 20.0 23.7 15.7 17.2 17.9 13.0 23.5 24.9 15.5 19.3 19.2 15.5 19.4 23.6 15.8 17.0 17.7
Small1986-87 14.2 27.2 24.7 17.2 20.3 19.2 15.3 24.3 25.1 17.3 20.9 19.6 11.8 31.7 21.5 16.1 17.0 16.91987-88 14.3 28.0 24.6 17.2 20.3 19.2 15.2 25.1 25.1 17.3 20.9 19.6 12.2 32.2 20.7 16.2 17.4 17.01988-89 14.1 27.8 24.6 17.2 21.2 19.4 15.2 24.8 25.1 17.3 20.9 19.5 11.8 32.3 20.6 16.2 17.4 18.31989-90 14.2 28.6 24.6 17.1 21.3 19.4 15.2 26.2 25.1 17.2 20.9 19.5 12.0 32.1 20.5 16.0 22.2 18.51990-91 14.3 28.5 24.5 17.1 21.3 19.3 15.2 26.1 25.1 17.2 20.9 19.5 12.0 32.0 20.2 15.6 22.4 18.51991-91 14.2 28.4 24.5 17.1 21.5 19.4 15.2 26.1 25.1 17.2 20.9 19.5 11.8 31.8 19.9 15.6 22.7 18.51992-93 14.2 28.3 24.5 17.1 21.5 19.4 15.2 25.8 25.0 17.2 21.0 19.5 11.8 31.5 20.3 15.3 23.1 18.51993-94 14.0 28.3 24.4 17.1 21.7 19.5 15.1 26.0 25.0 17.3 21.1 19.6 11.7 31.5 20.2 15.5 23.0 18.6
Large1986-87 15.4 20.9 24.3 16.3 17.3 18.4 13.0 24.5 24.7 14.9 19.1 19.7 15.6 20.2 24.3 16.5 23.3 18.21987-88 15.4 20.8 24.2 16.2 17.2 18.3 12.8 24.5 24.7 14.9 19.1 19.6 15.6 20.1 24.2 16.4 17.1 18.11988-89 15.4 20.7 24.2 16.0 17.2 18.2 12.9 24.3 24.8 14.9 19.0 19.6 15.6 20.0 24.1 16.2 17.1 18.11989-90 15.4 20.6 23.9 16.0 17.2 18.2 12.8 24.2 24.5 14.9 19.0 19.5 15.6 19.9 23.8 16.2 17.1 18.01990-91 15.4 20.4 24.0 15.9 17.2 18.1 12.7 24.0 24.8 14.9 18.9 19.4 15.6 19.7 23.9 16.1 17.1 18.01991-92 15.4 20.3 23.9 15.8 17.1 18.0 12.7 23.9 24.8 14.9 18.9 19.3 15.6 19.6 23.8 15.9 17.0 17.91992-93 15.3 20.2 23.8 15.7 17.1 18.0 12.7 23.7 24.8 14.8 18.7 19.3 15.5 19.5 23.7 15.8 17.0 17.81993-94 15.3 20.0 23.7 15.6 17.1 17.9 12.6 23.5 24.8 14.8 18.7 19.2 15.5 19.4 23.6 15.8 16.9 17.7

107
Table A4.5a. Student enrollment in high, medium, and low poverty rural, small, and other school districts,by year
Total Rural Nonrural
Poverty Poverty Poverty
High Medium Low High Medium Low High Medium Low
Total
1986-87 12,593,236 17,309,769 9,685,279 1,619,806 2,914,113 866,353 10,973,430 14,395,656 8,818,926
1987-88 12,558,629 17,456,088 9,734,711 1,606,756 2,911,173 879,107 10,951,873 14,544,915 8,855,604
1988-89 12,540,223 17,527,931 9,872,952 1,601,188 2,915,329 892,672 10,939,035 14,612,602 8,980,280
1989-90 12,541,276 17,748,180 10,021,498 1,587,883 2,931,732 903,370 10,953,393 14,816,448 9,118,128
1990-91 12,688,569 18,053,212 10,228,225 1,586,578 2,952,024 914,359 11,101,991 15,101,188 9,313,866
1991-92 12,816,565 18,484,830 10,511,148 1,598,386 3,001,486 934,645 11,218,179 15,483,344 9,576,503
1992-93 12,933,062 18,829,196 10,809,806 1,611,480 3,053,887 963,183 11,321,582 15,775,309 9,846,623
1993-94 13,015,028 19,166,280 11,015,770 1,623,582 3,104,956 981,998 11,391,446 16,061,324 10,033,772
Small
1986-87 372,288 725,822 195,519 331,737 640,148 150,762 40,551 85,674 44,757
1987-88 369,920 711,550 193,500 330,464 631,568 150,616 39,456 79,982 42,884
1988-89 384,070 710,847 197,191 328,245 629,457 151,518 55,825 81,390 45,673
1989-90 385,312 710,556 197,418 326,965 629,909 151,944 58,347 80,647 45,474
1990-91 383,877 709,659 199,709 324,641 630,810 151,701 59,236 78,849 48,008
1991-92 389,610 717,922 201,361 328,790 637,584 152,779 60,820 80,338 48,582
1992-93 396,926 722,650 205,670 334,329 641,933 154,501 62,597 80,717 51,169
1993-94 400,300 723,278 203,794 336,710 640,586 154,050 63,590 82,692 49,744
Large
1986-87 12,220,948 16,583,947 9,489,760 1,288,069 2,273,965 715,591 10,932,879 14,309,982 8,774,169
1987-88 12,188,709 16,744,538 9,541,211 1,276,292 2,279,605 728,491 10,912,417 14,464,933 8,812,720
1988-89 12,156,153 16,817,084 9,675,761 1,272,943 2,285,872 741,154 10,883,210 14,531,212 8,934,607
1989-90 12,155,964 17,037,624 9,824,080 1,260,918 2,301,823 751,426 10,895,046 14,735,801 9,072,654
1990-91 12,304,692 17,343,553 10,028,516 1,261,937 2,321,214 762,658 11,042,755 15,022,339 9,265,858
1991-92 12,426,955 17,766,908 10,309,787 1,269,596 2,363,902 781,866 11,157,359 15,403,006 9,527,921
1992-93 12,536,136 18,106,546 10,604,136 1,277,151 2,411,954 808,682 11,258,985 15,694,592 9,795,454
1993-94 12,614,728 18,443,002 10,811,976 1,286,872 2,464,370 827,948 11,327,856 15,978,632 9,984,028

108
Table A4.5b. Percentage distributions of student enrollment in high, medium, and low poverty rural,small, and other school districts, by year
Total Rural Nonrural
Poverty Poverty Poverty
High Medium Low High Medium Low High Medium Low
Total
1986-87 31.8 43.7 24.5 30.0 54.0 16.0 32.1 42.1 25.8
1987-88 31.6 43.9 24.5 29.8 53.9 16.3 31.9 42.3 25.8
1988-89 31.4 43.9 24.7 29.6 53.9 16.5 31.7 42.3 26.0
1989-90 31.1 44.0 24.9 29.3 54.1 16.7 31.4 42.5 26.1
1990-91 31.0 44.1 25.0 29.1 54.1 16.8 31.3 42.5 26.2
1991-92 30.7 44.2 25.1 28.9 54.2 16.9 30.9 42.7 26.4
1992-93 30.4 44.2 25.4 28.6 54.3 17.1 30.6 42.7 26.7
1993-94 30.1 44.4 25.5 28.4 54.4 17.2 30.4 42.8 26.8
Small
1986-87 28.8 56.1 15.1 29.5 57.0 13.4 23.7 50.1 26.2
1987-88 29.0 55.8 15.2 29.7 56.8 13.5 24.3 49.3 26.4
1988-89 29.7 55.0 15.3 29.6 56.7 13.7 30.5 44.5 25.0
1989-90 29.8 54.9 15.3 29.5 56.8 13.7 31.6 43.7 24.7
1990-91 29.7 54.9 15.4 29.3 57.0 13.7 31.8 42.4 25.8
1991-92 29.8 54.8 15.4 29.4 57.0 13.7 32.1 42.3 25.6
1992-93 30.0 54.5 15.5 29.6 56.8 13.7 32.2 41.5 26.3
1993-94 30.2 54.5 15.4 29.8 56.6 13.6 32.4 42.2 25.4
Large
1986-87 31.9 43.3 24.8 30.1 53.2 16.7 32.1 42.1 25.8
1987-88 31.7 43.5 24.8 29.8 53.2 17.0 31.9 42.3 25.8
1988-89 31.5 43.5 25.0 29.6 53.2 17.2 31.7 42.3 26.0
1989-90 31.2 43.7 25.2 29.2 53.4 17.4 31.4 42.5 26.1
1990-91 31.0 43.7 25.3 29.0 53.4 17.5 31.3 42.5 26.2
1991-92 30.7 43.9 25.5 28.8 53.5 17.7 30.9 42.7 26.4
1992-93 30.4 43.9 25.7 28.4 53.6 18.0 30.6 42.7 26.7
1993-94 30.1 44.0 25.8 28.1 53.8 18.1 30.4 42.8 26.8
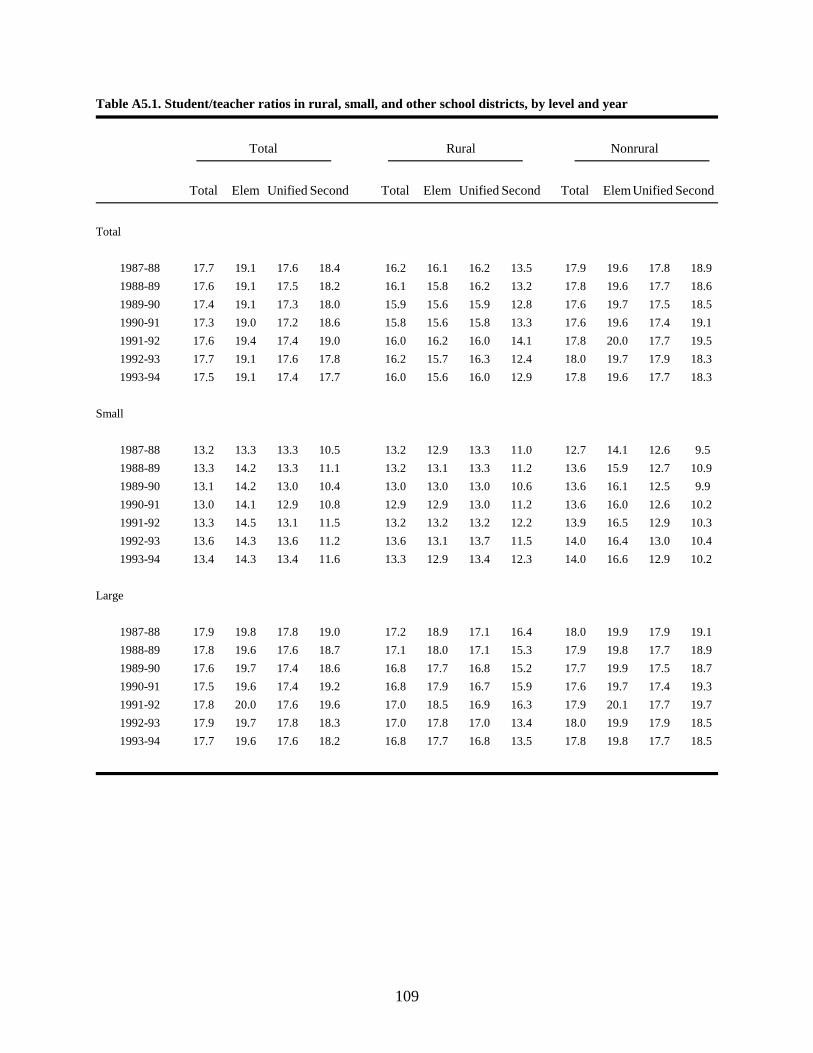
109
Table A5.1. Student/teacher ratios in rural, small, and other school districts, by level and year
Total Rural Nonrural
Total Elem Unified Second Total Elem Unified Second Total ElemUnified Second
Total
1987-88 17.7 19.1 17.6 18.4 16.2 16.1 16.2 13.5 17.9 19.6 17.8 18.9
1988-89 17.6 19.1 17.5 18.2 16.1 15.8 16.2 13.2 17.8 19.6 17.7 18.6
1989-90 17.4 19.1 17.3 18.0 15.9 15.6 15.9 12.8 17.6 19.7 17.5 18.5
1990-91 17.3 19.0 17.2 18.6 15.8 15.6 15.8 13.3 17.6 19.6 17.4 19.1
1991-92 17.6 19.4 17.4 19.0 16.0 16.2 16.0 14.1 17.8 20.0 17.7 19.5
1992-93 17.7 19.1 17.6 17.8 16.2 15.7 16.3 12.4 18.0 19.7 17.9 18.3
1993-94 17.5 19.1 17.4 17.7 16.0 15.6 16.0 12.9 17.8 19.6 17.7 18.3
Small
1987-88 13.2 13.3 13.3 10.5 13.2 12.9 13.3 11.0 12.7 14.1 12.6 9.5
1988-89 13.3 14.2 13.3 11.1 13.2 13.1 13.3 11.2 13.6 15.9 12.7 10.9
1989-90 13.1 14.2 13.0 10.4 13.0 13.0 13.0 10.6 13.6 16.1 12.5 9.9
1990-91 13.0 14.1 12.9 10.8 12.9 12.9 13.0 11.2 13.6 16.0 12.6 10.2
1991-92 13.3 14.5 13.1 11.5 13.2 13.2 13.2 12.2 13.9 16.5 12.9 10.3
1992-93 13.6 14.3 13.6 11.2 13.6 13.1 13.7 11.5 14.0 16.4 13.0 10.4
1993-94 13.4 14.3 13.4 11.6 13.3 12.9 13.4 12.3 14.0 16.6 12.9 10.2
Large
1987-88 17.9 19.8 17.8 19.0 17.2 18.9 17.1 16.4 18.0 19.9 17.9 19.1
1988-89 17.8 19.6 17.6 18.7 17.1 18.0 17.1 15.3 17.9 19.8 17.7 18.9
1989-90 17.6 19.7 17.4 18.6 16.8 17.7 16.8 15.2 17.7 19.9 17.5 18.7
1990-91 17.5 19.6 17.4 19.2 16.8 17.9 16.7 15.9 17.6 19.7 17.4 19.3
1991-92 17.8 20.0 17.6 19.6 17.0 18.5 16.9 16.3 17.9 20.1 17.7 19.7
1992-93 17.9 19.7 17.8 18.3 17.0 17.8 17.0 13.4 18.0 19.9 17.9 18.5
1993-94 17.7 19.6 17.6 18.2 16.8 17.7 16.8 13.5 17.8 19.8 17.7 18.5

110
Table A5.2. Per-pupil revenues in rural, small, and other school districts, by level and year
Total Rural Nonrural
Total Elem Unified Second Total Elem Unified Second Total Elem Unified Second
Total
1989-90 $5,793 $5,801 $5,746 $7,664 $5,268 $6,480 $5,157 $8,718 $5,874 $5,707 $5,839 $7,588
1990-91 $5,739 $5,578 $5,703 $7,619 $5,306 $6,344 $5,207 $8,691 $5,805 $5,476 $5,781 $7,546
1991-92 $5,589 $5,570 $5,546 $7,388 $5,173 $6,253 $5,070 $8,758 $5,653 $5,478 $5,621 $7,296
1992-93 $5,793 $5,657 $5,762 $7,372 $5,422 $6,367 $5,332 $8,408 $5,849 $5,563 $5,829 $7,299
Small
1989-90 $6,003 $6,696 $5,790 $8,412 $5,932 $6,836 $5,758 $8,541 $6,434 $6,514 $6,138 $8,114
1990-91 $6,028 $6,633 $5,832 $8,413 $5,975 $6,920 $5,795 $8,652 $6,354 $6,265 $6,248 $7,840
1991-92 $5,940 $6,521 $5,750 $8,328 $5,885 $6,762 $5,718 $8,445 $6,279 $6,211 $6,101 $8,067
1992-92 $6,266 $6,715 $6,136 $7,527 $6,220 $6,917 $6,104 $7,473 $6,548 $6,448 $6,492 $7,672
Large
1989-90 $5,786 $5,723 $5,745 $7,631 $5,098 $6,266 $5,016 $8,857 $5,871 $5,674 $5,838 $7,581
1990-91 $5,730 $5,490 $5,700 $7,585 $5,136 $6,011 $5,069 $8,726 $5,802 $5,445 $5,780 $7,543
1991-92 $5,578 $5,491 $5,540 $7,347 $4,992 $5,962 $4,918 $9,019 $5,650 $5,450 $5,619 $7,285
1992-93 $5,778 $5,572 $5,752 $7,365 $5,223 $6,054 $5,155 $9,322 $5,846 $5,530 $5,828 $7,295

111
Table A5.3a. Per-pupil revenues in rural, small, and other school districts, by region
Total Rural Nonrural
Total Small Large Total Small Large Total Small Large
United States
1989-90 $5,793 $6,003 $5,786 $5,268 $5,932 $5,098 $5,874 $6,434 $5,871
1990-91 $5,739 $6,028 $5,730 $5,306 $5,975 $5,136 $5,805 $6,354 $5,802
1991-92 $5,589 $5,940 $5,578 $5,173 $5,885 $4,992 $5,653 $6,279 $5,650
1992-93 $5,793 $6,266 $5,778 $5,422 $6,220 $5,223 $5,849 $6,548 $5,846
Northeast
1989-90 $8,110 $8,752 $8,098 $7,102 $8,433 $6,859 $8,199 $9,491 $8,192
1990-91 $7,982 $9,058 $7,962 $7,261 $8,770 $6,989 $8,046 $9,730 $8,036
1991-92 $7,859 $8,850 $7,840 $7,186 $8,512 $6,943 $7,918 $9,630 $7,908
1992-93 $7,986 $8,899 $7,969 $7,302 $8,589 $7,068 $8,046 $9,619 $8,037
Southeast
1989-90 $5,185 $4,434 $5,186 $4,498 $4,537 $4,497 $5,320 $4,292 $5,321
1990-91 $5,169 $4,453 $5,170 $4,585 $4,441 $4,586 $5,282 $4,470 $5,282
1991-92 $5,008 $4,337 $5,009 $4,394 $4,321 $4,394 $5,126 $4,359 $5,126
1992-93 $5,026 $5,193 $5,026 $4,575 $5,198 $4,572 $5,112 $5,185 $5,112
South Central
1989-90 $4,595 $5,070 $4,561 $4,815 $5,077 $4,609 $4,561 $5,015 $4,557
1990-91 $4,667 $5,276 $4,625 $5,008 $5,304 $4,780 $4,615 $5,059 $4,611
1991-92 $4,630 $5,332 $4,582 $5,028 $5,365 $4,772 $4,570 $5,071 $4,566
1992-93 $5,442 $6,529 $5,368 $6,018 $6,590 $5,590 $5,355 $6,049 $5,349
Midwest
1989-90 $5,621 $5,502 $5,629 $5,128 $5,505 $4,960 $5,737 $5,464 $5,739
1990-91 $5,602 $5,437 $5,613 $5,102 $5,439 $4,953 $5,719 $5,415 $5,721
1991-92 $5,427 $5,338 $5,433 $4,942 $5,343 $4,766 $5,541 $5,281 $5,543
1992-93 $5,736 $5,431 $5,756 $5,147 $5,427 $5,026 $5,874 $5,474 $5,876
West
1989-90 $5,422 $7,093 $5,378 $6,374 $7,415 $6,033 $5,342 $6,171 $5,336
1990-91 $5,292 $6,979 $5,248 $6,199 $7,382 $5,816 $5,216 $5,809 $5,212
1991-92 $5,111 $6,751 $5,069 $6,064 $7,129 $5,724 $5,031 $5,643 $5,027
1992-93 $5,186 $6,731 $5,146 $6,066 $7,058 $5,756 $5,110 $5,706 $5,106
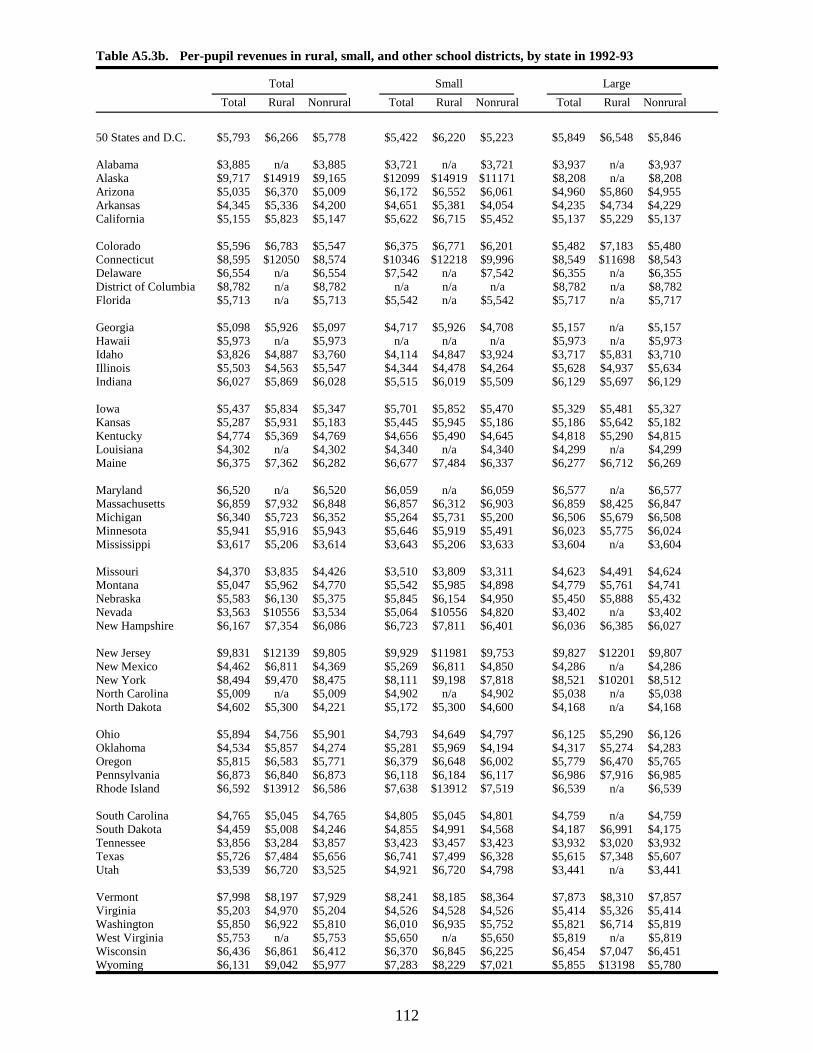
112
Table A5.3b. Per-pupil revenues in rural, small, and other school districts, by state in 1992-93
Total Small Large
Total Rural Nonrural Total Rural Nonrural Total Rural Nonrural
50 States and D.C. $5,793 $6,266 $5,778 $5,422 $6,220 $5,223 $5,849 $6,548 $5,846
Alabama $3,885 n/a $3,885 $3,721 n/a $3,721 $3,937 n/a $3,937Alaska $9,717 $14919 $9,165 $12099 $14919 $11171 $8,208 n/a $8,208Arizona $5,035 $6,370 $5,009 $6,172 $6,552 $6,061 $4,960 $5,860 $4,955Arkansas $4,345 $5,336 $4,200 $4,651 $5,381 $4,054 $4,235 $4,734 $4,229California $5,155 $5,823 $5,147 $5,622 $6,715 $5,452 $5,137 $5,229 $5,137
Colorado $5,596 $6,783 $5,547 $6,375 $6,771 $6,201 $5,482 $7,183 $5,480Connecticut $8,595 $12050 $8,574 $10346 $12218 $9,996 $8,549 $11698 $8,543Delaware $6,554 n/a $6,554 $7,542 n/a $7,542 $6,355 n/a $6,355District of Columbia $8,782 n/a $8,782 n/a n/a n/a $8,782 n/a $8,782Florida $5,713 n/a $5,713 $5,542 n/a $5,542 $5,717 n/a $5,717
Georgia $5,098 $5,926 $5,097 $4,717 $5,926 $4,708 $5,157 n/a $5,157Hawaii $5,973 n/a $5,973 n/a n/a n/a $5,973 n/a $5,973Idaho $3,826 $4,887 $3,760 $4,114 $4,847 $3,924 $3,717 $5,831 $3,710Illinois $5,503 $4,563 $5,547 $4,344 $4,478 $4,264 $5,628 $4,937 $5,634Indiana $6,027 $5,869 $6,028 $5,515 $6,019 $5,509 $6,129 $5,697 $6,129
Iowa $5,437 $5,834 $5,347 $5,701 $5,852 $5,470 $5,329 $5,481 $5,327Kansas $5,287 $5,931 $5,183 $5,445 $5,945 $5,186 $5,186 $5,642 $5,182Kentucky $4,774 $5,369 $4,769 $4,656 $5,490 $4,645 $4,818 $5,290 $4,815Louisiana $4,302 n/a $4,302 $4,340 n/a $4,340 $4,299 n/a $4,299Maine $6,375 $7,362 $6,282 $6,677 $7,484 $6,337 $6,277 $6,712 $6,269
Maryland $6,520 n/a $6,520 $6,059 n/a $6,059 $6,577 n/a $6,577Massachusetts $6,859 $7,932 $6,848 $6,857 $6,312 $6,903 $6,859 $8,425 $6,847Michigan $6,340 $5,723 $6,352 $5,264 $5,731 $5,200 $6,506 $5,679 $6,508Minnesota $5,941 $5,916 $5,943 $5,646 $5,919 $5,491 $6,023 $5,775 $6,024Mississippi $3,617 $5,206 $3,614 $3,643 $5,206 $3,633 $3,604 n/a $3,604
Missouri $4,370 $3,835 $4,426 $3,510 $3,809 $3,311 $4,623 $4,491 $4,624Montana $5,047 $5,962 $4,770 $5,542 $5,985 $4,898 $4,779 $5,761 $4,741Nebraska $5,583 $6,130 $5,375 $5,845 $6,154 $4,950 $5,450 $5,888 $5,432Nevada $3,563 $10556 $3,534 $5,064 $10556 $4,820 $3,402 n/a $3,402New Hampshire $6,167 $7,354 $6,086 $6,723 $7,811 $6,401 $6,036 $6,385 $6,027
New Jersey $9,831 $12139 $9,805 $9,929 $11981 $9,753 $9,827 $12201 $9,807New Mexico $4,462 $6,811 $4,369 $5,269 $6,811 $4,850 $4,286 n/a $4,286New York $8,494 $9,470 $8,475 $8,111 $9,198 $7,818 $8,521 $10201 $8,512North Carolina $5,009 n/a $5,009 $4,902 n/a $4,902 $5,038 n/a $5,038North Dakota $4,602 $5,300 $4,221 $5,172 $5,300 $4,600 $4,168 n/a $4,168
Ohio $5,894 $4,756 $5,901 $4,793 $4,649 $4,797 $6,125 $5,290 $6,126Oklahoma $4,534 $5,857 $4,274 $5,281 $5,969 $4,194 $4,317 $5,274 $4,283Oregon $5,815 $6,583 $5,771 $6,379 $6,648 $6,002 $5,779 $6,470 $5,765Pennsylvania $6,873 $6,840 $6,873 $6,118 $6,184 $6,117 $6,986 $7,916 $6,985Rhode Island $6,592 $13912 $6,586 $7,638 $13912 $7,519 $6,539 n/a $6,539
South Carolina $4,765 $5,045 $4,765 $4,805 $5,045 $4,801 $4,759 n/a $4,759South Dakota $4,459 $5,008 $4,246 $4,855 $4,991 $4,568 $4,187 $6,991 $4,175Tennessee $3,856 $3,284 $3,857 $3,423 $3,457 $3,423 $3,932 $3,020 $3,932Texas $5,726 $7,484 $5,656 $6,741 $7,499 $6,328 $5,615 $7,348 $5,607Utah $3,539 $6,720 $3,525 $4,921 $6,720 $4,798 $3,441 n/a $3,441
Vermont $7,998 $8,197 $7,929 $8,241 $8,185 $8,364 $7,873 $8,310 $7,857Virginia $5,203 $4,970 $5,204 $4,526 $4,528 $4,526 $5,414 $5,326 $5,414Washington $5,850 $6,922 $5,810 $6,010 $6,935 $5,752 $5,821 $6,714 $5,819West Virginia $5,753 n/a $5,753 $5,650 n/a $5,650 $5,819 n/a $5,819Wisconsin $6,436 $6,861 $6,412 $6,370 $6,845 $6,225 $6,454 $7,047 $6,451Wyoming $6,131 $9,042 $5,977 $7,283 $8,229 $7,021 $5,855 $13198 $5,780

113
Table A5.4. Percentage of local, state, and federal revenues in rural, small, and other school districts byyear
Total Rural Nonrural
Local State Federal Local State Federal Local State Federal
Total
1989-90 47.2 47.1 5.7 40.6 52.6 6.8 48.1 46.3 5.51990-91 47.3 46.9 5.8 40.1 53.1 6.9 48.3 46.0 5.71991-92 48.0 45.6 6.4 40.8 51.8 7.4 49.0 44.8 6.21992-93 47.4 46.4 6.2 39.5 53.3 7.3 48.5 45.4 6.1
Small
1989-90 47.7 45.9 6.1 47.4 46.2 6.4 49.6 44.2 4.81990-91 46.5 47.3 6.2 45.8 47.8 6.4 50.7 44.4 5.01991-92 47.3 46.1 6.6 46.5 46.6 6.9 51.6 43.3 5.11992-93 45.0 48.4 6.6 44.2 49.0 6.8 50.2 44.7 5.2
Large
1989-90 47.2 47.1 5.7 38.6 54.5 6.9 48.1 46.3 5.51990-91 47.3 46.9 5.8 38.4 54.6 7.0 48.3 46.0 5.71991-92 48.0 45.6 6.4 39.1 53.4 7.6 49.0 44.8 6.21992-93 47.5 46.3 6.2 38.1 54.5 7.4 48.5 45.4 6.1

114
Table A5.5. Percentage of students enrolled in low, medium, and high per-pupil revenue districts in rural, small, and other school districts, by year
Total Rural Nonrural
Low Medium High Low Medium High Low Medium High
Total
1989-90 22.0 58.1 20.0 33.5 55.7 10.8 20.2 58.4 21.41990-91 22.1 58.9 19.0 31.8 57.4 10.7 20.6 59.1 20.31991-92 22.7 58.9 18.4 34.9 54.0 11.1 20.8 59.7 19.51992-93 25.0 58.4 16.6 34.8 54.1 11.1 23.5 59.1 17.4
Small
1989-90 21.8 57.0 21.2 21.9 57.8 20.3 21.0 52.0 27.01990-91 22.1 56.3 21.6 22.2 57.1 20.7 20.9 52.1 27.01991-92 22.1 56.1 21.9 22.3 56.5 21.2 20.9 53.2 25.91992-93 17.8 58.9 23.3 18.1 59.1 22.9 16.3 58.1 25.6
Large
1989-90 22.0 58.1 19.9 36.5 55.2 8.4 20.2 58.5 21.41990-91 22.1 59.0 18.9 34.3 57.5 8.2 20.6 59.1 20.21991-92 22.7 59.0 18.3 38.1 53.3 8.6 20.8 59.7 19.51992-93 25.2 58.4 16.4 39.0 52.9 8.1 23.5 59.1 17.4
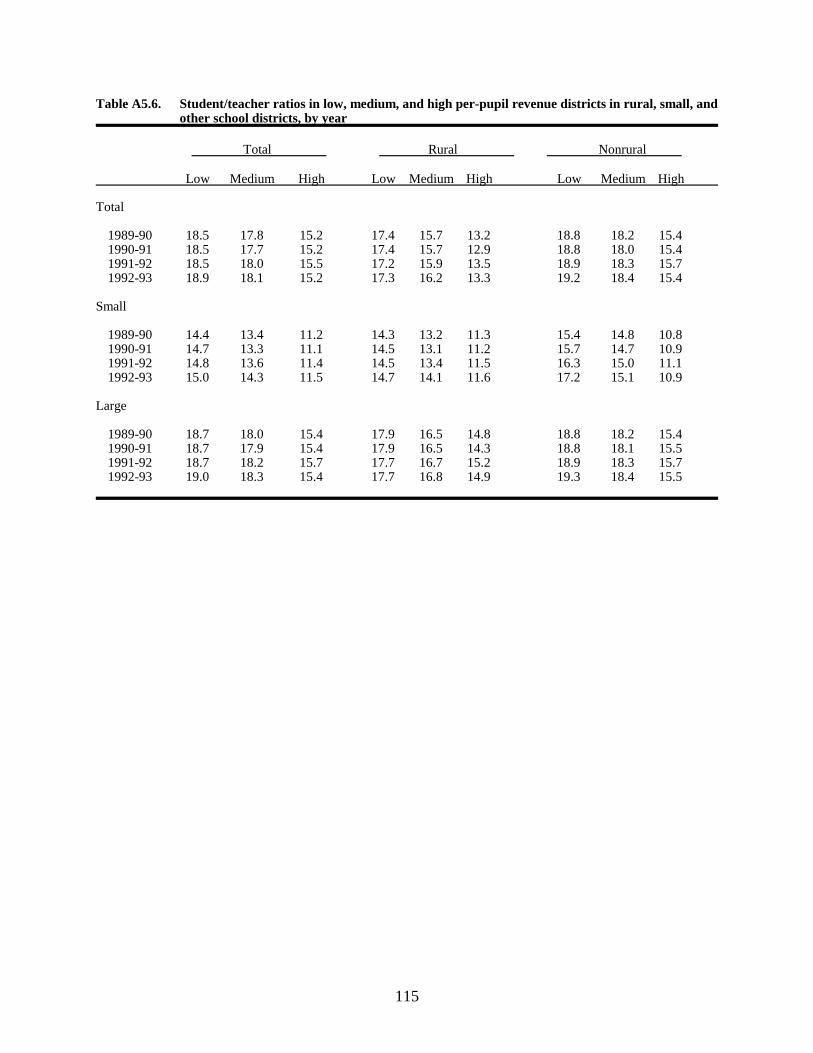
115
Table A5.6. Student/teacher ratios in low, medium, and high per-pupil revenue districts in rural, small, andother school districts, by year
Total Rural Nonrural
Low Medium High Low Medium High Low Medium High
Total
1989-90 18.5 17.8 15.2 17.4 15.7 13.2 18.8 18.2 15.41990-91 18.5 17.7 15.2 17.4 15.7 12.9 18.8 18.0 15.41991-92 18.5 18.0 15.5 17.2 15.9 13.5 18.9 18.3 15.71992-93 18.9 18.1 15.2 17.3 16.2 13.3 19.2 18.4 15.4
Small
1989-90 14.4 13.4 11.2 14.3 13.2 11.3 15.4 14.8 10.81990-91 14.7 13.3 11.1 14.5 13.1 11.2 15.7 14.7 10.91991-92 14.8 13.6 11.4 14.5 13.4 11.5 16.3 15.0 11.11992-93 15.0 14.3 11.5 14.7 14.1 11.6 17.2 15.1 10.9
Large
1989-90 18.7 18.0 15.4 17.9 16.5 14.8 18.8 18.2 15.41990-91 18.7 17.9 15.4 17.9 16.5 14.3 18.8 18.1 15.51991-92 18.7 18.2 15.7 17.7 16.7 15.2 18.9 18.3 15.71992-93 19.0 18.3 15.4 17.7 16.8 14.9 19.3 18.4 15.5
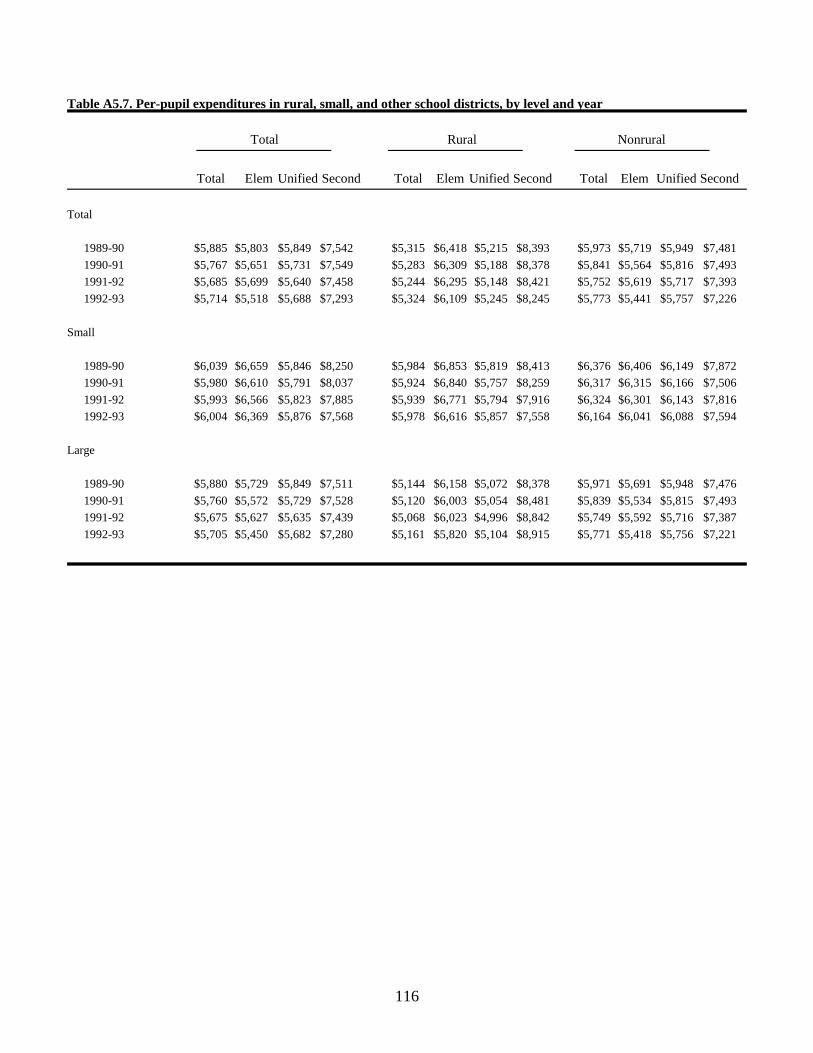
116
Table A5.7. Per-pupil expenditures in rural, small, and other school districts, by level and year
Total Rural Nonrural
Total Elem Unified Second Total Elem Unified Second Total Elem Unified Second
Total
1989-90 $5,885 $5,803 $5,849 $7,542 $5,315 $6,418 $5,215 $8,393 $5,973 $5,719 $5,949 $7,481
1990-91 $5,767 $5,651 $5,731 $7,549 $5,283 $6,309 $5,188 $8,378 $5,841 $5,564 $5,816 $7,493
1991-92 $5,685 $5,699 $5,640 $7,458 $5,244 $6,295 $5,148 $8,421 $5,752 $5,619 $5,717 $7,393
1992-93 $5,714 $5,518 $5,688 $7,293 $5,324 $6,109 $5,245 $8,245 $5,773 $5,441 $5,757 $7,226
Small
1989-90 $6,039 $6,659 $5,846 $8,250 $5,984 $6,853 $5,819 $8,413 $6,376 $6,406 $6,149 $7,872
1990-91 $5,980 $6,610 $5,791 $8,037 $5,924 $6,840 $5,757 $8,259 $6,317 $6,315 $6,166 $7,506
1991-92 $5,993 $6,566 $5,823 $7,885 $5,939 $6,771 $5,794 $7,916 $6,324 $6,301 $6,143 $7,816
1992-93 $6,004 $6,369 $5,876 $7,568 $5,978 $6,616 $5,857 $7,558 $6,164 $6,041 $6,088 $7,594
Large
1989-90 $5,880 $5,729 $5,849 $7,511 $5,144 $6,158 $5,072 $8,378 $5,971 $5,691 $5,948 $7,476
1990-91 $5,760 $5,572 $5,729 $7,528 $5,120 $6,003 $5,054 $8,481 $5,839 $5,534 $5,815 $7,493
1991-92 $5,675 $5,627 $5,635 $7,439 $5,068 $6,023 $4,996 $8,842 $5,749 $5,592 $5,716 $7,387
1992-93 $5,705 $5,450 $5,682 $7,280 $5,161 $5,820 $5,104 $8,915 $5,771 $5,418 $5,756 $7,221

117
Table A5.8a. Per-pupil expenditures in rural, small, and other school districts, by region
Total Rural Nonrural
Total Small Large Total Small Large Total Small Large
United States
1989-90 $5,885 $6,039 $5,880 $5,315 $5,984 $5,144 $5,973 $6,376 $5,9711990-91 $5,767 $5,980 $5,760 $5,283 $5,924 $5,120 $5,841 $6,317 $5,8391991-92 $5,685 $5,993 $5,675 $5,244 $5,939 $5,068 $5,752 $6,324 $5,7491992-93 $5,714 $6,004 $5,705 $5,324 $5,978 $5,161 $5,773 $6,164 $5,771
Northeast
1989-90 $8,182 $8,947 $8,168 $7,334 $8,752 $7,075 $8,257 $9,400 $8,2501990-91 $7,970 $8,954 $7,952 $7,416 $8,770 $7,172 $8,019 $9,382 $8,0111991-92 $7,885 $8,664 $7,871 $7,216 $8,353 $7,008 $7,944 $9,382 $7,9361992-93 $7,854 $8,462 $7,843 $7,187 $8,204 $7,003 $7,912 $9,059 $7,906
Southeast
1989-90 $5,276 $4,480 $5,277 $4,547 $4,588 $4,547 $5,419 $4,331 $5,4201990-91 $5,211 $4,295 $5,212 $4,563 $4,373 $4,564 $5,336 $4,183 $5,3371991-92 $5,019 $4,238 $5,020 $4,481 $4,304 $4,482 $5,122 $4,143 $5,1221992-93 $4,962 $4,405 $4,962 $4,573 $4,477 $4,573 $5,035 $4,302 $5,036
South Central
1989-90 $4,908 $5,319 $4,879 $5,038 $5,322 $4,816 $4,888 $5,303 $4,8851990-91 $4,581 $5,123 $4,544 $4,823 $5,147 $4,573 $4,545 $4,938 $4,5411991-92 $4,729 $5,245 $4,694 $4,982 $5,260 $4,769 $4,691 $5,120 $4,6881992-93 $4,929 $5,327 $4,902 $5,151 $5,369 $4,987 $4,895 $4,992 $4,894
Midwest
1989-90 $5,652 $5,465 $5,664 $5,107 $5,474 $4,943 $5,781 $5,356 $5,7831990-91 $5,574 $5,460 $5,582 $5,059 $5,461 $4,880 $5,695 $5,453 $5,6971991-92 $5,606 $5,537 $5,611 $5,083 $5,548 $4,878 $5,729 $5,406 $5,7311992-93 $5,753 $5,581 $5,764 $5,229 $5,587 $5,075 $5,875 $5,498 $5,878
West
1989-90 $5,489 $6,973 $5,450 $6,295 $7,321 $5,960 $5,421 $5,976 $5,4171990-91 $5,451 $6,900 $5,413 $6,211 $7,217 $5,885 $5,388 $5,977 $5,3831991-92 $5,265 $6,724 $5,227 $6,044 $7,027 $5,731 $5,199 $5,837 $5,1951992-93 $5,238 $6,650 $5,202 $5,921 $7,006 $5,582 $5,179 $5,534 $5,177
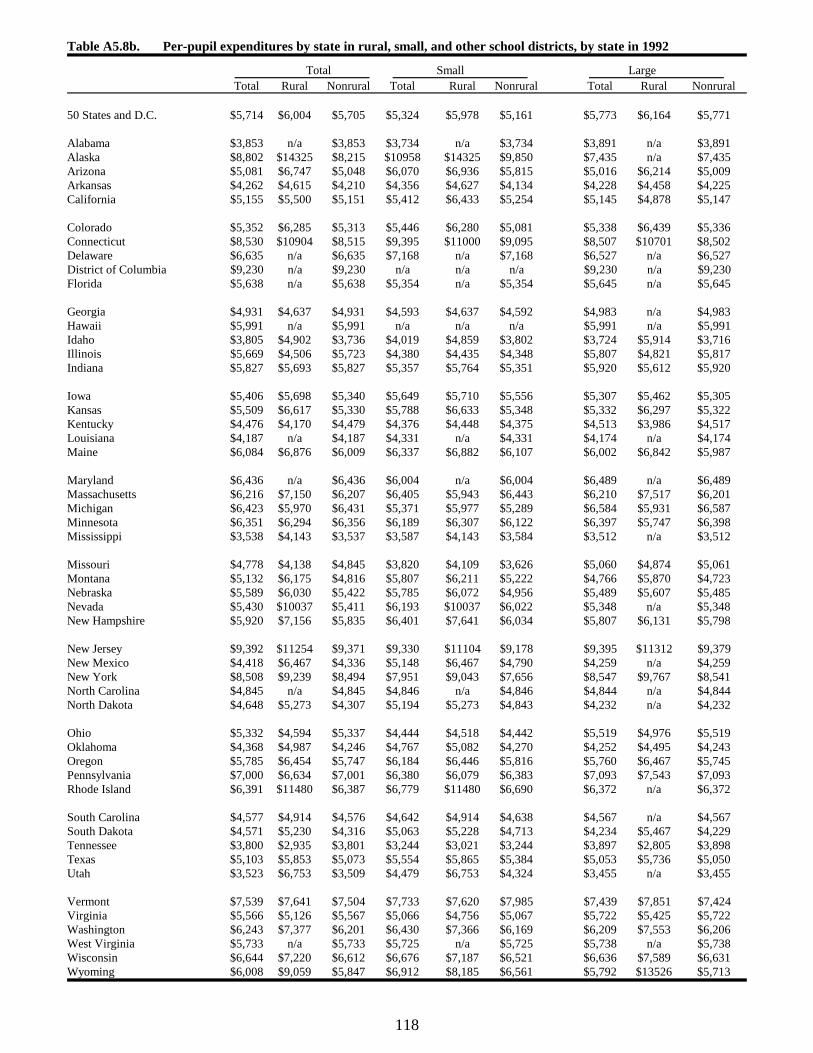
118
Table A5.8b. Per-pupil expenditures by state in rural, small, and other school districts, by state in 1992
Total Small LargeTotal Rural Nonrural Total Rural Nonrural Total Rural Nonrural
50 States and D.C. $5,714 $6,004 $5,705 $5,324 $5,978 $5,161 $5,773 $6,164 $5,771
Alabama $3,853 n/a $3,853 $3,734 n/a $3,734 $3,891 n/a $3,891Alaska $8,802 $14325 $8,215 $10958 $14325 $9,850 $7,435 n/a $7,435Arizona $5,081 $6,747 $5,048 $6,070 $6,936 $5,815 $5,016 $6,214 $5,009Arkansas $4,262 $4,615 $4,210 $4,356 $4,627 $4,134 $4,228 $4,458 $4,225California $5,155 $5,500 $5,151 $5,412 $6,433 $5,254 $5,145 $4,878 $5,147
Colorado $5,352 $6,285 $5,313 $5,446 $6,280 $5,081 $5,338 $6,439 $5,336Connecticut $8,530 $10904 $8,515 $9,395 $11000 $9,095 $8,507 $10701 $8,502Delaware $6,635 n/a $6,635 $7,168 n/a $7,168 $6,527 n/a $6,527District of Columbia $9,230 n/a $9,230 n/a n/a n/a $9,230 n/a $9,230Florida $5,638 n/a $5,638 $5,354 n/a $5,354 $5,645 n/a $5,645
Georgia $4,931 $4,637 $4,931 $4,593 $4,637 $4,592 $4,983 n/a $4,983Hawaii $5,991 n/a $5,991 n/a n/a n/a $5,991 n/a $5,991Idaho $3,805 $4,902 $3,736 $4,019 $4,859 $3,802 $3,724 $5,914 $3,716Illinois $5,669 $4,506 $5,723 $4,380 $4,435 $4,348 $5,807 $4,821 $5,817Indiana $5,827 $5,693 $5,827 $5,357 $5,764 $5,351 $5,920 $5,612 $5,920
Iowa $5,406 $5,698 $5,340 $5,649 $5,710 $5,556 $5,307 $5,462 $5,305Kansas $5,509 $6,617 $5,330 $5,788 $6,633 $5,348 $5,332 $6,297 $5,322Kentucky $4,476 $4,170 $4,479 $4,376 $4,448 $4,375 $4,513 $3,986 $4,517Louisiana $4,187 n/a $4,187 $4,331 n/a $4,331 $4,174 n/a $4,174Maine $6,084 $6,876 $6,009 $6,337 $6,882 $6,107 $6,002 $6,842 $5,987
Maryland $6,436 n/a $6,436 $6,004 n/a $6,004 $6,489 n/a $6,489Massachusetts $6,216 $7,150 $6,207 $6,405 $5,943 $6,443 $6,210 $7,517 $6,201Michigan $6,423 $5,970 $6,431 $5,371 $5,977 $5,289 $6,584 $5,931 $6,587Minnesota $6,351 $6,294 $6,356 $6,189 $6,307 $6,122 $6,397 $5,747 $6,398Mississippi $3,538 $4,143 $3,537 $3,587 $4,143 $3,584 $3,512 n/a $3,512
Missouri $4,778 $4,138 $4,845 $3,820 $4,109 $3,626 $5,060 $4,874 $5,061Montana $5,132 $6,175 $4,816 $5,807 $6,211 $5,222 $4,766 $5,870 $4,723Nebraska $5,589 $6,030 $5,422 $5,785 $6,072 $4,956 $5,489 $5,607 $5,485Nevada $5,430 $10037 $5,411 $6,193 $10037 $6,022 $5,348 n/a $5,348New Hampshire $5,920 $7,156 $5,835 $6,401 $7,641 $6,034 $5,807 $6,131 $5,798
New Jersey $9,392 $11254 $9,371 $9,330 $11104 $9,178 $9,395 $11312 $9,379New Mexico $4,418 $6,467 $4,336 $5,148 $6,467 $4,790 $4,259 n/a $4,259New York $8,508 $9,239 $8,494 $7,951 $9,043 $7,656 $8,547 $9,767 $8,541North Carolina $4,845 n/a $4,845 $4,846 n/a $4,846 $4,844 n/a $4,844North Dakota $4,648 $5,273 $4,307 $5,194 $5,273 $4,843 $4,232 n/a $4,232
Ohio $5,332 $4,594 $5,337 $4,444 $4,518 $4,442 $5,519 $4,976 $5,519Oklahoma $4,368 $4,987 $4,246 $4,767 $5,082 $4,270 $4,252 $4,495 $4,243Oregon $5,785 $6,454 $5,747 $6,184 $6,446 $5,816 $5,760 $6,467 $5,745Pennsylvania $7,000 $6,634 $7,001 $6,380 $6,079 $6,383 $7,093 $7,543 $7,093Rhode Island $6,391 $11480 $6,387 $6,779 $11480 $6,690 $6,372 n/a $6,372
South Carolina $4,577 $4,914 $4,576 $4,642 $4,914 $4,638 $4,567 n/a $4,567South Dakota $4,571 $5,230 $4,316 $5,063 $5,228 $4,713 $4,234 $5,467 $4,229Tennessee $3,800 $2,935 $3,801 $3,244 $3,021 $3,244 $3,897 $2,805 $3,898Texas $5,103 $5,853 $5,073 $5,554 $5,865 $5,384 $5,053 $5,736 $5,050Utah $3,523 $6,753 $3,509 $4,479 $6,753 $4,324 $3,455 n/a $3,455
Vermont $7,539 $7,641 $7,504 $7,733 $7,620 $7,985 $7,439 $7,851 $7,424Virginia $5,566 $5,126 $5,567 $5,066 $4,756 $5,067 $5,722 $5,425 $5,722Washington $6,243 $7,377 $6,201 $6,430 $7,366 $6,169 $6,209 $7,553 $6,206West Virginia $5,733 n/a $5,733 $5,725 n/a $5,725 $5,738 n/a $5,738Wisconsin $6,644 $7,220 $6,612 $6,676 $7,187 $6,521 $6,636 $7,589 $6,631Wyoming $6,008 $9,059 $5,847 $6,912 $8,185 $6,561 $5,792 $13526 $5,713

119
Table A5.9. Percentage of expenditures for core instruction, administrative support, and capital outlay in rural,small, and other school districts
Total Rural Nonrural
General General GeneralCore Admin and Capital Core Admin and Capital Core Admin and Capital
Instruction Support Outlay Instruction Support Outlay Instruction Support Outlay
Total
1989-90 61.2 25.6 13.2 58.7 28.0 13.3 61.5 25.2 13.21990-91 62.7 25.6 11.7 60.9 26.8 12.3 63.0 25.5 11.61991-92 62.8 25.8 11.4 60.8 26.7 12.4 63.1 25.7 11.21992-93 61.9 26.9 11.1 59.4 28.3 12.3 62.3 26.7 11.0
Small
1989-90 56.9 28.8 14.3 56.8 29.1 14.1 57.5 27.1 15.41990-91 58.7 28.6 12.7 58.9 28.8 12.2 57.5 27.2 15.21991-92 59.0 28.7 12.3 59.1 28.9 12.0 58.3 27.7 14.01992-93 58.3 29.3 12.4 58.2 29.5 12.3 59.0 28.0 13.0
Large
1989-90 61.3 25.5 13.2 59.2 27.6 13.1 61.6 25.2 13.21990-91 62.8 25.5 11.6 61.5 26.3 12.3 63.0 25.5 11.61991-92 62.9 25.7 11.4 61.4 26.1 12.5 63.1 25.7 11.21992-93 62.1 26.8 11.1 59.8 27.9 12.3 62.3 26.7 11.0
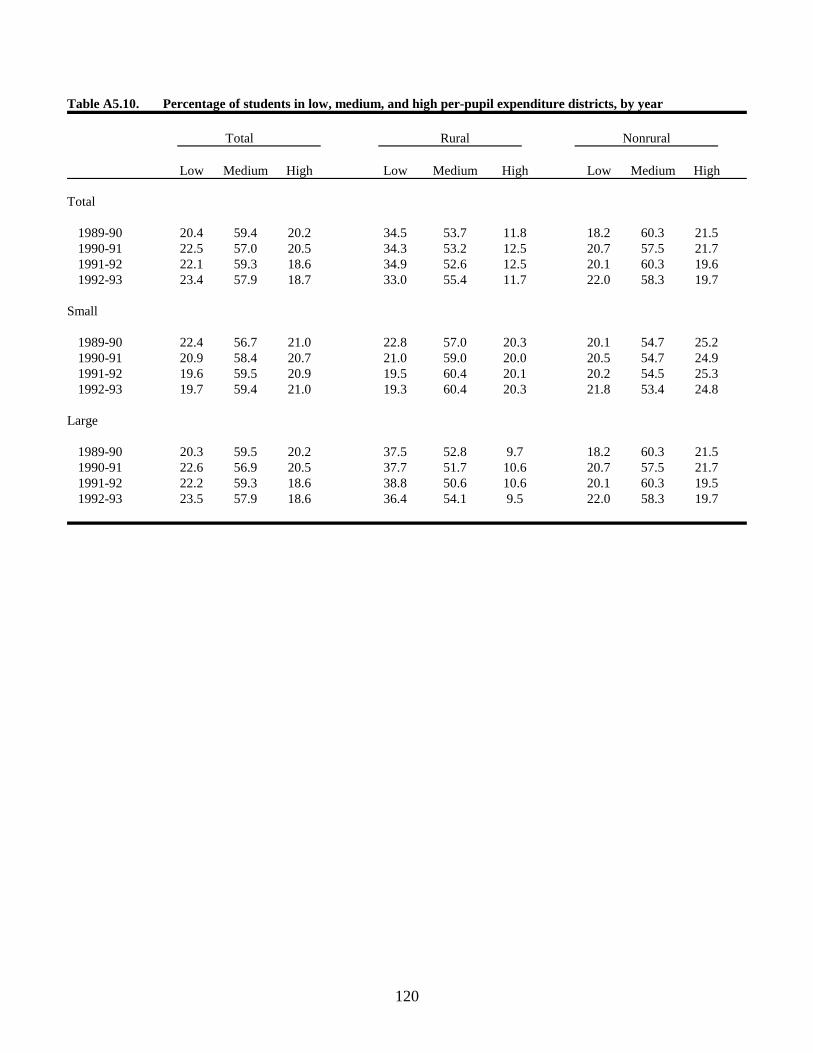
120
Table A5.10. Percentage of students in low, medium, and high per-pupil expenditure districts, by year
Total Rural Nonrural
Low Medium High Low Medium High Low Medium High
Total
1989-90 20.4 59.4 20.2 34.5 53.7 11.8 18.2 60.3 21.51990-91 22.5 57.0 20.5 34.3 53.2 12.5 20.7 57.5 21.71991-92 22.1 59.3 18.6 34.9 52.6 12.5 20.1 60.3 19.61992-93 23.4 57.9 18.7 33.0 55.4 11.7 22.0 58.3 19.7
Small
1989-90 22.4 56.7 21.0 22.8 57.0 20.3 20.1 54.7 25.21990-91 20.9 58.4 20.7 21.0 59.0 20.0 20.5 54.7 24.91991-92 19.6 59.5 20.9 19.5 60.4 20.1 20.2 54.5 25.31992-93 19.7 59.4 21.0 19.3 60.4 20.3 21.8 53.4 24.8
Large
1989-90 20.3 59.5 20.2 37.5 52.8 9.7 18.2 60.3 21.51990-91 22.6 56.9 20.5 37.7 51.7 10.6 20.7 57.5 21.71991-92 22.2 59.3 18.6 38.8 50.6 10.6 20.1 60.3 19.51992-93 23.5 57.9 18.6 36.4 54.1 9.5 22.0 58.3 19.7
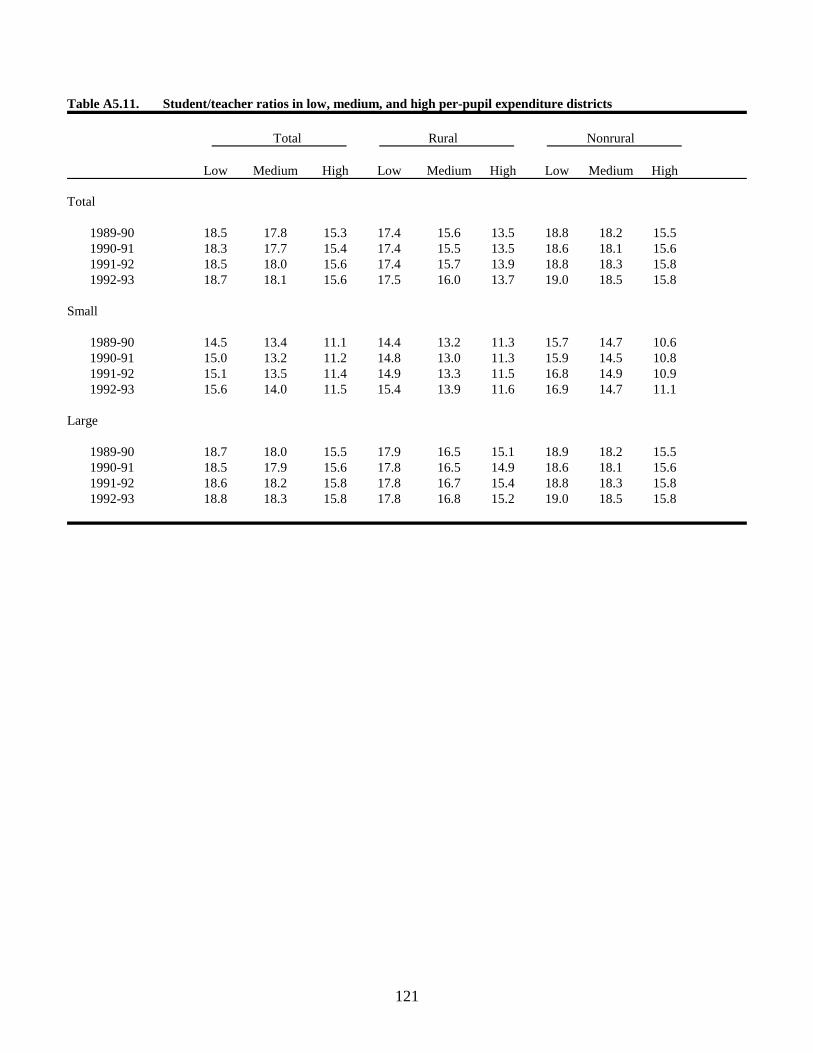
121
Table A5.11. Student/teacher ratios in low, medium, and high per-pupil expenditure districts
Total Rural Nonrural
Low Medium High Low Medium High Low Medium High
Total
1989-90 18.5 17.8 15.3 17.4 15.6 13.5 18.8 18.2 15.51990-91 18.3 17.7 15.4 17.4 15.5 13.5 18.6 18.1 15.61991-92 18.5 18.0 15.6 17.4 15.7 13.9 18.8 18.3 15.81992-93 18.7 18.1 15.6 17.5 16.0 13.7 19.0 18.5 15.8
Small
1989-90 14.5 13.4 11.1 14.4 13.2 11.3 15.7 14.7 10.61990-91 15.0 13.2 11.2 14.8 13.0 11.3 15.9 14.5 10.81991-92 15.1 13.5 11.4 14.9 13.3 11.5 16.8 14.9 10.91992-93 15.6 14.0 11.5 15.4 13.9 11.6 16.9 14.7 11.1
Large
1989-90 18.7 18.0 15.5 17.9 16.5 15.1 18.9 18.2 15.51990-91 18.5 17.9 15.6 17.8 16.5 14.9 18.6 18.1 15.61991-92 18.6 18.2 15.8 17.8 16.7 15.4 18.8 18.3 15.81992-93 18.8 18.3 15.8 17.8 16.8 15.2 19.0 18.5 15.8

122
123
Appendix B. Technical Notes
Common Core of Data Analysis File Development
Source Files. The Common Core of Data (CCD) Local Education Agency (Nonfiscal) Filehas one record for each of about 16,000 “districts” each year. The basic data source for this reportwas the set of CCD files for the 8 years from 1986-87 to 1993-94.
Because there are a noticeable number (somewhat fewer than 2,000) records on the file thatdo not correspond to regular school districts, but rather to administrative entities (e.g., regionalresource districts) concerned indirectly with elementary and secondary education, an extract of the“regular school districts” was made. This extract was based on a reported “district type,” and twotypes out of seven were included in the extract. These were (1) “regular school districts” and (2)educational components of “supervisory union districts,” which, where they exist in some states, aresimilar to regular school districts. Examination of the file led to the conclusion that in a few statesand years, some districts were mistyped. In those cases, the type was made consistent over years tosupport more accurate analysis.
After deletion of 33 records for which there was no gradespan information in any year, therewere 15,584 school districts on the analysis file; however, not all of these districts were operatingin every year between 1986-87 and 1993-94.
Districts Added or Deleted Between Years. On the analysis file, 15,345 districts had dataindicating that they were in operation in 1986-87, while only 14,648 were in operation in 1993-94.The vast majority of the districts on this file were in operation in every one of the 8 years studied.However, two facts are clear: (1) 239 districts were not present in 1986-87 but were for some lateryear, and (2) there were 697 fewer districts in 1993-94 than there had been in 1986-87. This reflectsthe dynamic nature of the local governance structure for public education. Declining populationsin some areas led to pressures to consolidate (combine) districts to reduce administrative overhead,and rising populations in other areas led to pressures to split large districts and create newadministrative units.
Between one year and the next, the most frequent school district change was theconsolidation of two (or more) districts into a single district. Sometimes, these consolidationscombined elementary and secondary districts into unified districts; more frequently they consistedof the closure of a small district and transfer of its students to another nearby district. In some cases,a district simply absorbed the enrollment of an adjacent district but continued its existing identity;in others both component districts were replaced with the creation of a new consolidated district witha new identity. Because the linkage of each district to its predecessors was not explicitly recordedin the Common Core of Data, it is difficult from these data to differentiate between new districtscreated from consolidations and new districts created from the splitting of a large district.
“New” Districts Resulting from Consolidations or Splits. In order to understand thedynamics of districts, it is important to distinguish between “new” districts that are combinations ofprevious districts and “new” districts that are spin-offs from existing districts that have grown.
124
Therefore, an attempt was made to pair each district that newly appeared on the file in a particularyear with a district in the same county that closed after the preceding year. To do this, for everydistrict that closed in a year, a district was sought that either newly appeared the next year orotherwise added an appropriate number of students. Because CCD does not uniformly deletedistricts from the file in the first year after they close, districts were considered to have closed forthe purpose of this study if they dropped from an enrollment of 25 or more to an enrollment of 0 anddid not add enrollment in a later year.
Of course, enrollments change from year to year, but large discontinuities of enrollment canbe matched. For example, if a district with 83 students in 1988-89 closed and the enrollment inanother district in the same county increased from 255 to 326 between 1988-89 and 1989-90, itwould be reasonable to conclude that the latter district inherited the students of the former district.Through trial implementations of this procedure, it was determined that transfer of enrollments offewer than 25 students could not be reliably detected in this manner, because the addition of fewerthan 25 students would not be so unusual as to be noticeable as a discontinuity.
Most consolidations involving transfer of 25 or more students from a closing district wereidentified. From the identifications made, we know that most new districts were created out ofconsolidations during this period: overall, 128 “new” districts were created when 237 districtsconsolidated; 286 districts were folded into other districts, but only 6 districts were identified asresulting from the splits of 3 districts. Thus, it is reasonable to conjecture that most “new” districtsin this time period were created through consolidations. However, the identification process wasincomplete. Across the 7 years, a total of 106 “new” districts could not be unambiguously pairedbased on enrollment discontinuities. Moreover, it was impossible to identify where students fromdistricts with fewer than 25 enrollment moved when their districts closed.
Because the matching of “new” districts to predecessors was incomplete, it was impossibleto produce separate reliable counts of “new” districts created from consolidations and from splits. Therefore, for this report, districts referred to as “new” or “opening” include both types, althoughnearly all are probably created from the consolidations of other districts. Very few districts, perhapsonly a handful, split to form new districts during this 7-year interval.
Definition of Variables
District Locale (“Rural”). Because information was not available from the 1990 Censuswhen this report was being prepared, information from the 1980 U.S. Census was used to classifythe locales of addresses of schools for CCD during the 1980s (and for this report) as rural, small orlarge town, or fringes or central areas of mid-size or large cities. The CCD school locale codes areused in this report to define districts as “rural.” Specifically, according to the standard CCDdefinition, the district locale code is set to the modal school locale code for schools in the district.A rural school district is defined as a district in which the most frequent school locale code is “7”(i.e., rural). All other districts are defined as “not rural.”
Examination of the results of this categorization led to a finding that the locale codesrecorded in CCD for schools in two states were inconsistent. Therefore, in these two states, the
125
Common Core of Data (CCD) definition of rural districts was checked against other data sources.These data sources included the locale code of a district based on Census population counts byschool district from the School District Data Book (SDDB) and the locale code of a county basedon the location classification from U.S. Department of Agriculture’s Economic Research Statistics(ERS) data. A set of rules were developed to determine whether a district in these two states wasrural or nonrural. Since these sources used data from 1990, the rules were applied to the districts inthe 1990-91 school year of the CCD. Based on these data checks, CCD rural classifications of 491out of 15,035 districts were changed for this report: 314 districts originally called nonrural wererelabeled rural, and 179 were changed from a rural to a nonrural label.
District Size (“Small”). A small district (as well as a small school) is defined as a districtthat had a total enrollment of fewer than 25 students per grade for grades 8 and lower that it served,and fewer than 100 students per grade for grades 9 and above. The enrollment that was used for thisclassification was for 1987-88 or for its first year on the CCD file if it was not on the file for 1987-88. Thus, for example, characteristics of small rural districts in 1993-94 are the characteristics in1993-94 of districts that were categorized as small in 1987-88.
Of course, these are essentially the same districts that had small enrollments in 1993-94. Of4,238 small rural districts counted in 1993-94 (based on the 1987-88 definition), 4,003 were stillsmall in 1993-94, and only 17 (0.4 percent) had 1993-94 enrollments more than 50 percent over thethreshold. Only one “outlier,” a district that merged with a large nonrural district in 1988-89 butretained its identity on the file, had a 1993-94 enrollment more than 3 times the threshold: a K-8district with 1,281 students in 1993-94. To balance these districts, 91 of the 9,596 districts notcategorized as small based on 1987-88 enrollments had small enrollments in 1993-94, but only 7 ofthese had enrollments less than 70 percent of the threshold, and 5 of the 7 had enrollments of zero,indicating that they would probably be verified as closures in 1994-95. These few exceptions couldonly have slight effects on population summary statistics.
Because any particular definition of “small rural districts” might not accurately reflect thegeneral intuition about what education in small rural areas in America might be, two alternativedefinitions were considered, and parallel sets of analyses were conducted to determine the sensitivityof the findings in this report to the definition of “small.” The numbers of additional "small rural"districts added to the original count in each state by these expansions of the definition of small areshown in table B1.
Including all large rural districts with a majority of small schools. First, the finding thatthere were no small rural districts in Alabama, Louisiana, and West Virginia led to an examinationof the CCD characteristics of (large) rural districts in these states. Several of the large rural districtsin these and other states operated mostly small schools (i.e., schools with fewer than 25 students perelementary grade and 100 students per secondary grade), and in a sense, these “large rural districtswith a majority of small schools” also represent small rural education in America. Therefore, inaddition to the main analyses, parallel analyses were carried out for an expanded definition of smallrural district, including these districts.
The results from the first set of parallel analyses, including the 254 large rural districts with

126
a majority of small schools in the set of small rural districts, are mentioned in footnotes at the endof each chapter. Generally, because these districts constituted only a small fraction of the small ruraldistricts, nationally, there were only small differences in the findings.
Including all unified districts with fewer than 100 students per high school grade. Second,one can argue that unified (K-12) districts with enough students to qualify as large at the elementarylevel (i.e., more than 25 students per elementary grade) but not enough to qualify as large at thesecondary level (i.e., fewer than 100 students per secondary grade) should be considered small.Therefore, a second set of parallel analyses was also carried out, including unified districts withfewer than 100 students per secondary grade in the definition of small districts.
Counting unified districts with fewer than 100 students per secondary grade as small had asubstantial impact on results. The number of small rural districts in 1993-94 increased from 4,238to 5,595; with this criterion, 80 percent of the regular public school districts in rural locales wouldbe categorized as small. Moreover, because the additional "small" rural districts had greaterenrollments than those originally counted as small, the average enrollment in small rural districts bythe expanded definition was about 440, rather than 260. There were 12,000 schools and 2,460,000students in small rural districts in 1993-94 by the expanded definition. Between 1986-87 and 1993-94, the overall gain in enrollment in small rural districts became 110,000 students, rather than 8,000.
The region of the country in which the percentage change in districts counted as small ruralwas greatest was the Southeast, where instead of 16 small rural districts, 110 small rural districtswere counted. Across the country, more minorities were enrolled in small rural districts by theexpanded definition. For example, 4 percent of students in small rural districts were AfricanAmerican, rather than 2 percent; and 18 percent of Native American students, rather than 10 percent,were enrolled in small rural districts.
As a general pattern, this expansion of the definition of "small" changed findings for smallrural districts by averaging characteristics of large rural districts with them. For example, small ruraldistricts became more like other districts in the relative frequency of unified (K-12) districts (73percent, rather than 65 percent, compared to 76 percent in other districts). As another example, thepercentage of small rural districts' revenues from local sources shifted from 44 percent to 42 percent,closer to the original 38 percent for large rural districts. Finally, the average student/teacher ratioin small rural districts was shifted from 13:1 to 15:1, closer to the average of 17:1 for large ruraldistricts.
A noticeable shift in patterns of per-pupil revenue and expenditures resulted from theexpanded definition of small rural districts: rather than spending on average $200 more than largenonrural districts, the larger set of small rural districts were found to spend $100 less. Althoughthese are not large differences, compared to the overall average of about $6,000 per pupil, the shiftis significant. Although regional variations in revenues and expenditures followed similar patterns,the increased number of small rural districts in the Southeast provided greater assurance that theaverages are reliable. In the Southeast, per-pupil revenue and expenditures in the expanded set of110 small rural districts averaged about $100 less than in other districts in the region, but between1989-90 and 1992-93 there was a gain of $246 in per-pupil expenditures in small rural districts inthe Southeast.

127
Table B1. Number of small rural districts, large rural districts with a majority of small schools, andlarge rural districts with small secondary enrollments in 1993-94, by state
Small rural Large rural with a majority of small schools Large Rural but Small 9-12
50 States and D.C. 4,238 254 1,357
Alabama 0 5 0Alaska 37 7 7Arizona 55 4 10Arkansas 132 3 61California 147 16 15
Colorado 89 1 21Connecticut 10 2 4Delaware 0 2 0District of Columbia 0 0 2Florida 0 3 2
Georgia 3 1 18Hawaii 0 0 0Idaho 44 5 22Illinois 203 22 83Indiana 6 2 52
Iowa 196 5 73Kansas 161 21 55Kentucky 6 2 15Louisana 0 5 0Maine 82 0 18
Maryland 0 0 0Massachusetts 6 1 1Michigan 80 3 79Minnesota 156 8 72Mississippi 2 12 18
Missouri 253 9 86Montana 369 1 0Nebraska 484 3 9Nevada 3 5 2New Hampshire 45 2 8
New Jersey 21 1 2New Mexico 37 1 10New York 97 2 70North Carolina 0 1 6North Dakota 217 2 12
Ohio 23 9 97Oklahoma 294 3 42Oregon 91 2 6Pennsylvania 5 2 33Rhode Island 1 0 0
South Carolina 2 0 9South Dakota 130 9 18Tennessee 1 12 10Texas 389 5 136Utah 5 4 5
Vermont 141 0 3Virginia 2 5 11Washington 107 3 43West Virginia 0 6 3Wisconsin 94 30 99Wyoming 12 7 9
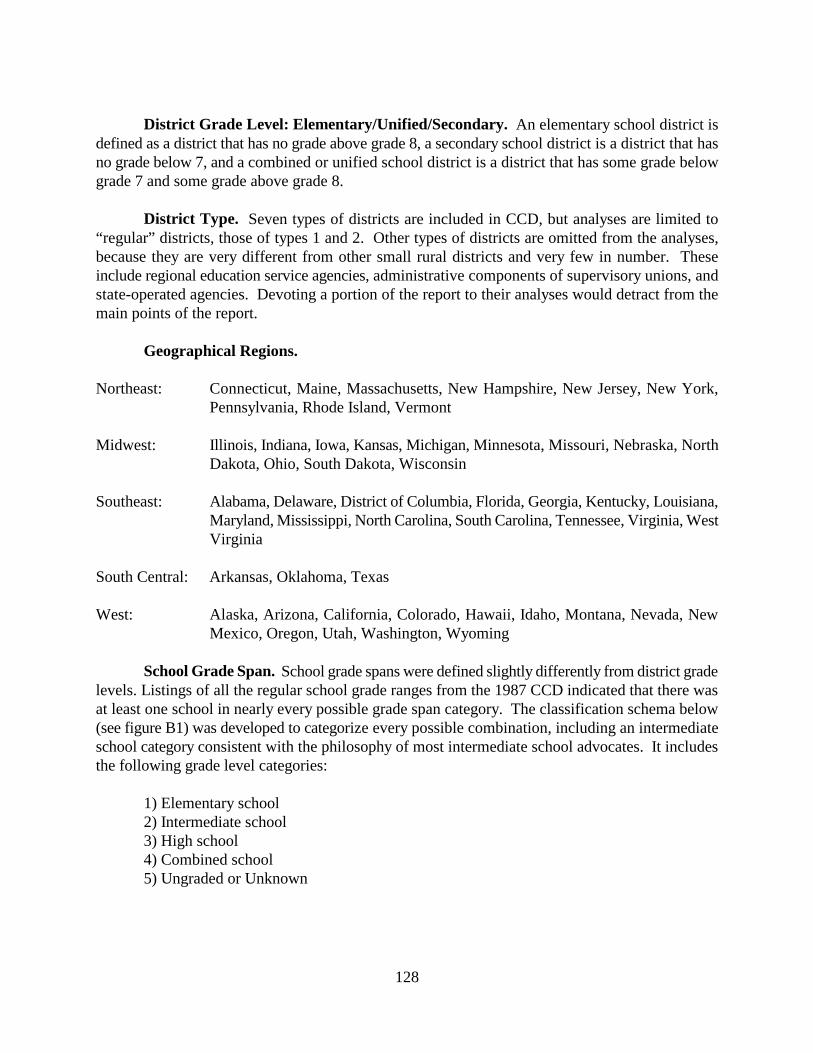
128
District Grade Level: Elementary/Unified/Secondary. An elementary school district isdefined as a district that has no grade above grade 8, a secondary school district is a district that hasno grade below 7, and a combined or unified school district is a district that has some grade belowgrade 7 and some grade above grade 8.
District Type. Seven types of districts are included in CCD, but analyses are limited to“regular” districts, those of types 1 and 2. Other types of districts are omitted from the analyses,because they are very different from other small rural districts and very few in number. Theseinclude regional education service agencies, administrative components of supervisory unions, andstate-operated agencies. Devoting a portion of the report to their analyses would detract from themain points of the report.
Geographical Regions.
Northeast: Connecticut, Maine, Massachusetts, New Hampshire, New Jersey, New York,Pennsylvania, Rhode Island, Vermont
Midwest: Illinois, Indiana, Iowa, Kansas, Michigan, Minnesota, Missouri, Nebraska, NorthDakota, Ohio, South Dakota, Wisconsin
Southeast: Alabama, Delaware, District of Columbia, Florida, Georgia, Kentucky, Louisiana,Maryland, Mississippi, North Carolina, South Carolina, Tennessee, Virginia, WestVirginia
South Central: Arkansas, Oklahoma, Texas
West: Alaska, Arizona, California, Colorado, Hawaii, Idaho, Montana, Nevada, NewMexico, Oregon, Utah, Washington, Wyoming
School Grade Span. School grade spans were defined slightly differently from district gradelevels. Listings of all the regular school grade ranges from the 1987 CCD indicated that there wasat least one school in nearly every possible grade span category. The classification schema below(see figure B1) was developed to categorize every possible combination, including an intermediateschool category consistent with the philosophy of most intermediate school advocates. It includesthe following grade level categories:
1) Elementary school2) Intermediate school3) High school4) Combined school5) Ungraded or Unknown

129
Figure B1. Schema for classification of schools by grades served
PK K 1 2 3 4 5 6 7 8 9 10 11 12
PK E E E E E E E E E E C C C C
K E E E E E E E E E C C C C
1 E E E E E E E E C C C C
2 E E E E E E E C C C C
3 E E E E E E C C C C
4 E E E I I I C C C
5 E E I I I C C C
6 E I I I H H H
7 I I I H H H
8 I I H H H
9 I H H H
10 H H H
11 H H
12 H
NOTE: E=Elementary; I=Intermediate; H=High; C=Combined. Low grades are on the diagonal; high grades are listed on top.
That is, an elementary school has a high grade of 6 or lower or a combination of a low gradeless than 4 and a high grade of 8 or lower; an intermediate school has a low grade of 4 or higher anda high grade of 7, 8, or 9; a high school has a low grade of 6 or higher and a high grade of at least10; a combined school has a low grade of 5 or lower and a high grade of at least 10, or a low gradeof 3 or lower and a high grade of 9. Other schools are classified as unknown or ungraded.
School Size. Schools were classified as “small” according to the same threshold as districts.Small schools were schools with total enrollment less than 25 per elementary (K-8) grade served and100 per secondary (9-12) grade served.

130
School Type. The CCD type codes are used for this purpose. They are:
1) Regular school2) Special education school3) Vocational education school4) Alternative education school
District Per-Pupil Revenues. Data from F-33 on revenues from local, state, and federalsources are used. Percentages are extracted from the CCD CD-ROM or equivalent files. For CCD,revenue is an increase in the net current assets of a government fund type from other thanexpenditure refunds and residual equity transfers. Revenues are reported from local, intermediate,state, and federal sources. Per-pupil revenues are weighted by enrollment in computing nationalaverages.
District Per-Pupil Expenditures. Data from F-33 on expenditures for instruction and forother operations are used. Percentages are extracted from the CCD CD-ROM or equivalent files.For CCD, current expenditures include the categories of instruction, support services, and non-instructional services that include fixed charges (employee benefits, rent, interest). They do notinclude debt service and capital outlay. Instructional expenditures include those for activities dealingwith the interaction between students and teachers (salaries, including sabbatical leave, employeebenefits, and purchased instructional services). Per-pupil expenditures are weighted by enrollmentin computing national averages.
Very Small Schools. For this report, small schools with fewer than one teacher per gradewere called very small schools.
Longitudinal Editing and Imputation of CCD Data
The Common Core of Data relies on state-level aggregation of district information andtransmission to NCES. In that process, there are occasions for errors in interpretation by respondentsand errors of data entry. It is impossible to identify many errors because the resulting figures, bythemselves, appear to be reasonable. However, when data from 8 years are merged, it is possible tomake much more precise identification of errors. For example, a district whose reported enrollmentpattern over 8 years is (375, 390, 365, 40, 415, 420, 410, 430) can be assumed to have a data entryerror in the fourth year—an enrollment of about 400 would be a reasonable estimate for that year.In preparing this CCD longitudinal report on small rural school districts, extensive editing andimputation were undertaken. The specific steps are described in this section. Chronologically, the1986-87 through 1991-92 data were edited and imputed simultaneously, and the 1992-93 and 1993-94 data were subsequently imputed using the values from the preceding years. The editing andimputation was performed in the following 15 steps.
Step 1. Specify the records to be included. Identify school districts that change type fromregular to nonregular and back, and set the type to be constant. Reported types of some districts inMaine, Massachusetts, California, Ohio, Virginia, and Vermont were changed in some years. (Forone LEA on the Mississippi River whose state did not match its identification code, the variable

131
STATE was changed.) Also, if any district has no students, no teachers, and no schools, and doesnot merge with any schools on the school file, in any year, delete it from the file. This stepdetermines the number of district records on each year’s file.
Step 2. YEARS. Create YEARS, a string with one character for each year: “Y” if thedistrict is on the district file and merges with at least one school on the school file in the year, “N”if the district is on the district file but merges with no schools on the school file in the year, and “M”if the district is not on the district file in the year.
Step 3. Number of schools. If the number of schools is missing for a district for a year, usethe number from a preceding year with data. If the number is not available for any year, use thenumber of records on the school file for the district. (If none, set the number of schools to zero.)
Step 4. Grade span. If high grade and low grade are missing for a year, use the previousor closest year if some year has data. Otherwise, impute from school file. If the school file gradespan is indeterminate, but there is a school, impute KG-to-12. Otherwise (if there is no school),impute as missing. Edit gradespans to remove cases in which low grade is higher than highgrade—set them equal to whichever is not imputed, or if neither is, to the lower of the two.
Step 5. Number of teachers. Set spurious zeros for numbers of teachers (in Massachusettsand Michigan in 2 years) to missing. If number of teachers is missing in a district for a year, use thesum from the school file if there is a match. Otherwise, use a prior year’s count, or if no teachercounts are available for any year, impute a value equal to the product of the number of schools timesthe number of grades in the gradespan (i.e., one teacher per school per grade). If the gradespan isindeterminate, impute one teacher per school.
Step 6. Edit number of students. Replace zero or missing values for enrollment in adistrict, or values that differ from an adjacent year by both 40 and 40 percent, with positive valuesfrom the school file whenever available. Note that when single years were added to the file later(i.e., 1992-93 and 1993-94), this step was repeated.
Step 7. Edit student/teacher ratio. Remove large or inconsistent student/teacher ratios(S/T). If for some year, a district’s S/T is greater than 50 or S/T is “inconsistent” with both of the2 adjacent years (by a factor of 2 or more), and the adjacent years are consistent with each other, theneither set S to missing (to be imputed) or impute T directly. If S is consistent with adjacent yearsbut T is not (each by a 40 percent factor), impute T as the average of the two years it is adjacent to.Otherwise set S to missing. One district, new in 1991-92, has number of teachers imputed from1992-93, because its number of teachers in 1991-1992 created a student teacher ratio greater than700.
Step 8. Impute number of students. Run PROC IMPUTE to impute total students in the6 years. The imputation is BY two categories of number of schools (districts with fewer than 4schools and districts with 4 to 19 schools). No districts with more than 20 schools were missing totalenrollment. The average number of schools and average number of teachers were used in PROCIMPUTE.
132
Step 9. Racial-ethnic percentages. This step imputes ethnic distributions. First, the SDDB(1990 decennial Census, mapped onto school district boundaries) is used to obtain percentages ofeach district’s child population in different ethnic groups. For 27 districts for which no ethnic dataare available for any year on the CCD or for the SDDB, impute the average for districts in the samecity, or if not available, from the same county. For districts with data in some years but not others,perform the edit check described below, then use PROC IMPUTE. (However, no ethnic data wereavailable for 1986-87, and none were imputed. Ethnic distributions for that year are not includedin the report.)
Set inconsistent values to missing. These are values for districts that have values for at least3 different years, and at least one of the percents differs from the average of all years by both (a) atleast 25 percentage points and (b) at least 5 standard deviations. Also, for convenience, set thepercentages for districts with zero students to the national averages: 1.1, 6.1, 5.4, 2.2, 85.2, forAsian, black non-Hispanic, Hispanic, Native American, and white non-Hispanic, respectively. RunPROC IMPUTE with the 20 variables (four ethnic groups (excluding white non-Hispanics) for eachyear from 1987-88 through 1991-92). An additional run using all years’ data, but only imputing thelast 2 years, was made to impute missing values for 1992-93 and 1993-94.
If the resulting sum of the minority percents is greater than 100 for any district, they arenormalized to 100. The white non-Hispanic percentage is set to 100 minus the sum of the otherpercentages in all districts.
Step 10. Locale code. For districts with schools with locale codes, the NCES standardprocedure for deriving district locale codes from school locale codes was used. That procedureassigns the most frequent school locale code in the district, setting ties to the more urban local, withthe possible exception that for districts in which at least three-fourths of the schools have localesspread among values of 1, 2, 3, or 4 (i.e., in metropolitan areas) but the most frequent single schoollocale is 5, 6, or 7 (i.e., large or small town or rural), the district locale would be set to the mostfrequent of the values 1, 2, 3, or 4. (That exception did not occur in these data.)
For districts with no locale code in any year, the most frequent locale code for districts in thesame county was used. If no data were available for the county, (a) the value 2 was imputed if themetro status code was 1; otherwise, if the number of schools was less than 5, the value 7 wasimputed. If the metro status code was 2 and there were 5 or more schools, the value 3 was imputed;and if the metro status code was 3 and there were 5 or more schools, the value 6 was imputed. Theserules are based on minimizing the percent errors based on relations observed for districts with data.Although the locale code was imputed separately by year, imputed values for a district were forcedto be constant across years, equal either to the latest unimputed value or, if there were no unimputedvalues, to the modal value.
Step 11. Percent of school-aged children in poverty. (This variable was taken from theSDDB. It was therefore missing for all CCD districts not present in the SDDB.) The averagepercent poverty for districts in the same county was used to impute percent poverty. If there wereno districts in a county with data, the average value 17 percent was used.
133
Step 12. Counts of special education students. First, counts in all districts in states whichreported uniform zeroes in a year were set to missing, to be imputed. Second, if the number in adistrict exceeds the total number of students for a district, it was imputed to be equal to the totalnumber of students.
Counts were then translated to fractions of total enrollment, and two variables werecreated—the average fractions for 1987-88 and 1988-89, and the average fractions for later years.Two averages were used because the values in the earlier years were not highly correlated with thevalues in later years. PROC IMPUTE was run, with five special education percentages (one for eachyear from 1987-88 through 1991-92), the two overall averages, and the percent of enrollment thatwas black non-Hispanic, plus Native American, minus Asian. It was run with separate hot deckdistributions depending on whether there was a determined gradespan. These variables were selectedon the basis of regression model results. Imputed percentages were translated back into counts.
Step 13. Four types of high school completers. Data were only available for the years after1986-87, and the high school equivalence results were not available for 1991-92. First, values for12th grade enrollment were imputed (and later dropped), in order to impute graduates as a ratio tothe preceding year’s 12th graders. Imputation of 12th grade enrollment occurred if the number of12th graders was either missing, larger than the total enrollment, or less than half of the totalcompleters (the sum of four fields: regular diplomas, plus other diplomas, plus other high schoolcompleters, plus high school equivalencies).
If the grade span was reasonable, the value of the total enrollment divided by the number ofgrades was used for 12th grade enrollment. Otherwise, if there was a 12th grade and the number ofcompleters was greater than zero, the grade 12 enrollment was set equal to the completers. If 12thgrade was not offered or the number of completers was zero, count of 12th graders was imputed tobe zero.
A small number of erroneous values for high grade in 1986-87 were set to 12. These werecases in which there were 12th graders enrolled and completers the next year but for which highgrade was less than 12. Counts of completers were transformed to ratios to preceding years’ 12thgraders.
PROC IMPUTE was run after the file was prepared. Variables included were average ethnicpercentages and percent in poverty, as well as the average over years of each of the four categoriesof completers. The latter averages, which normally would be no greater than 1, unless there wassubstantial in-migration, were not allowed to exceed 2. Values of percentage of 12th graders whoearned regular diplomas that differed from the average (across years) by more than 50 percentagepoints and values of other completion types that differed by more than 20 percentage points from theaverage were set to missing. Hot deck distributions were selected separately for three sizes of 12thgrade cohorts: <20, 20 to 99, and 100 or more. The results were transformed back to counts, andthree districts new in 1991-92 were separately imputed to have no completers.
Step 14. All imputed counts on the file were rounded to integers.
134
Step 15. Impute Per-Pupil Revenues and Expenditures. In addition to variables on theCCD nonfiscal survey file, two variables on the F-33 Census of Governments survey, total revenuesand expenditures per pupil, were imputed for the four school years from 1989-90 through 1992-3.For nearly every regular school district, data were present for at least one of the four years. Districtswith data in none of these years (n = 90) were imputed as the average value of per-pupil revenuesand expenditures for districts reporting data in the specified year, by category. The categories forwhich separate mean values were computed in each of the four years were large and small districtsin rural and nonrural settings in each of the four standard geographic regions. (The division of thesouth into two subregions used elsewhere in this report was not applied to this imputation.)
For all imputations, the first step was to compute mean values of per-pupil revenues andexpenditures for the 11,729 regular districts with F-33 data in all four of the school years (1989-90through 1992-93). The mean values for per-pupil revenues and expenditures were obtained for eachof four regions, separately for small and large rural and nonrural districts in each year (a total of 128numbers). Means were weighted by the F-33 estimate of enrollment in the year.
Next, for each pair of adjacent years, a linear regression function was estimated, using asingle predictor (the same measure in the adjacent year), to predict the deviation of a district’s per-pupil revenues or expenditures from the mean for that district’s region and size and locale category.A total of 12 regressions were estimated (3 pairs of adjacent years, in each order, for revenues andexpenditures). The regressions were weighted by the F-33 estimate of enrollment in the year beingpredicted. Then, for cases missing in a year, the value was imputed as the sum of (a) the mean valuefor the region by size by locale category for that year and (b) the estimated deviation from the meanbased on the regression.
The percentages of data that were imputed for this report range from 0.0 percent to 47.7percent, as shown in table B2. Except for race and special education counts in the earlier years, noneof these percentages were as great as 20 percent. Although these percentages primarily representmissing data, some imputed values are the result of setting unreasonable reported values to missing.As a general rule, most imputed values were based on reported values for the same district indifferent years, using the rules summarized above. It should be noted that these percentages pertainonly to regular school districts, as used in this report. Between 1,000 and 2,000 other entities areincluded in the Common Core of Data public school district release file.

135
Table B2. Percentages of values imputed on the district files used in the small rural districts report
Year
Variable 1986-87 1987-88 1988-89 1989-90 1990-91 1991-92 1992-93 1993-94
Small rural districtsGradespan 0.3 0.6 0.4 0.2 0.3 0.9 0.6 0.5No. of Schools 0.0 0.3 0.2 0.1 0.0 0.0 0.0 0.0
No. of Teachers 3.1 2.8 11.8 0.6 2.6 3.2 8.0 3.9
No. of Students 21.7 0.5 0.3 0.2 0.5 0.4 0.3 0.2
Race (Low/High) -- 25.-40. 22.-34. 20.-28. 14.3 8.8 4.0 1.8
Special Ed Count -- 40.7 29.7 26.0 31.3 13.3 1.8 2.6
Locale 4.3 4.0 3.1 1.8 0.9 0.2 0.0 0.0
Per-Pupil Revenue -- -- -- 3.9 26.1 1.6 15.7 --
Per-Pupil Expenditure -- -- -- 3.9 26.2 1.5 15.8 --
All districtsGradespan 0.6 0.4 0.3 0.2 0.3 0.6 0.4 0.3
No. of Schools 0.1 0.2 0.1 0.1 0.0 0.0 0.0 0.0
No. of Teachers 6.4 7.7 13.9 2.6 5.8 6.6 5.7 2.1
No. of Students 19.4 0.5 0.2 0.1 0.3 0.2 0.2 0.1
Race (Low/High) -- 26.-36. 16.-25. 12.-18. 10.9 7.6 5.1 2.4Special Ed Count -- 47.7 35.0 23.1 30.4 15.7 10.2 6.4
Locale 3.5 3.4 2.8 1.7 1.1 0.1 0.0 0.0
Per-Pupil Revenue -- -- -- 2.9 15.7 1.3 12.6 --
Per-Pupil Expenditure -- -- -- 2.9 15.7 1.3 12.6 --
Notes: -- Indicates that the measure was not included in this report for the particular year. Percentages of race/ethnicity imputation, unlike other measures, are for schools.
Three of the entries for race/ethnicity in table B2 represent a range. Before 1990-91, therewere different percentages of missing data for different race/ethnicities, ranging from a low for whitenon-Hispanics to a high for Native Americans. District level race/ethnicity percentages wereobtained by summing the percentages for schools in the district, with appropriate weights. However,there were a few districts with no school data. Therefore, in addition to the values imputed at theschool level shown in table B2, small percentages of race/ethnicity distributions were imputed at thedistrict level. These percentages were for 0.9, 1.0, 0.4, 0.5, 0.1, 0.2, and 0.3 percent of the districtsin the years from 1987-88 through 1993-94, respectively.

136