Embed Size (px)
Citation preview

This article was downloaded by: [The University Of Melbourne Libraries]On: 16 September 2013, At: 23:49Publisher: Taylor & FrancisInforma Ltd Registered in England and Wales Registered Number: 1072954 Registeredoffice: Mortimer House, 37-41 Mortimer Street, London W1T 3JH, UK
Polycyclic Aromatic CompoundsPublication details, including instructions for authors andsubscription information:http://www.tandfonline.com/loi/gpol20
Characteristics of PAHs, PCDD/Fs, PCBsand PBDEs in the Sediment of LakeBaikal, RussiaGon Ok a , Galina Shirapova b , Galina Matafonova b , Valeriy Batoevb & Seok hyung Lee aa Department of Environment Atmospheric Science, Graduate Schoolof Earth Environmental Engineering, and Dioxin Research Center,Pukyong National University, Busan, Koreab Baikal Institute of Nature Management SB RAS, Ulan-Ude, RussiaPublished online: 27 Mar 2013.
To cite this article: Gon Ok , Galina Shirapova , Galina Matafonova , Valeriy Batoev & Seok hyungLee (2013) Characteristics of PAHs, PCDD/Fs, PCBs and PBDEs in the Sediment of Lake Baikal, Russia,Polycyclic Aromatic Compounds, 33:2, 173-192, DOI: 10.1080/10406638.2013.764540
To link to this article: http://dx.doi.org/10.1080/10406638.2013.764540
PLEASE SCROLL DOWN FOR ARTICLE
Taylor & Francis makes every effort to ensure the accuracy of all the information (the“Content”) contained in the publications on our platform. However, Taylor & Francis,our agents, and our licensors make no representations or warranties whatsoever as tothe accuracy, completeness, or suitability for any purpose of the Content. Any opinionsand views expressed in this publication are the opinions and views of the authors,and are not the views of or endorsed by Taylor & Francis. The accuracy of the Contentshould not be relied upon and should be independently verified with primary sourcesof information. Taylor and Francis shall not be liable for any losses, actions, claims,proceedings, demands, costs, expenses, damages, and other liabilities whatsoever orhowsoever caused arising directly or indirectly in connection with, in relation to or arisingout of the use of the Content.
This article may be used for research, teaching, and private study purposes. Anysubstantial or systematic reproduction, redistribution, reselling, loan, sub-licensing,systematic supply, or distribution in any form to anyone is expressly forbidden. Terms &Conditions of access and use can be found at http://www.tandfonline.com/page/terms-and-conditions
Polycyclic Aromatic Compounds, 33:173–192, 2013Copyright C© Taylor & Francis Group, LLCISSN: 1040-6638 print / 1563-5333 onlineDOI: 10.1080/10406638.2013.764540
Characteristics of PAHs,PCDD/Fs, PCBs and PBDEs in theSediment of Lake Baikal, Russia
Gon Ok,1 Galina Shirapova,2 Galina Matafonova,2
Valeriy Batoev,2 and Seok hyung Lee1
1Department of Environment Atmospheric Science, Graduate School of EarthEnvironmental Engineering, and Dioxin Research Center, Pukyong NationalUniversity, Busan, Korea2Baikal Institute of Nature Management SB RAS, Ulan-Ude, Russia
The levels of PAHs, PCDD/Fs, PCBs, and PBDEs in Lake Baikal were monitored forthe first time using deep water sediment. The sediment samples were collected from 15stations in four regions of Lake Baikal: Ol’khon Island (n = 8), the Angara River estuary(n = 2), the Selenga River delta (n = 2), and the Baikal pulp and paper mill (BPPM)(n = 3). The highest average concentrations of PCDD/Fs (20.24 pg/g d.w.) and PCBs(68.72 ng/g d.w.) were found at Ol’khon Island. The highest total PBDE concentrationswere found at BPPM, with a mean concentration of 575.76 pg/g d.w. For PCBs, PCB-52,and PCB-69 were dominant, making up 11% of the total 209 PCB congeners. BDE-209 contributed 60% of PBDEs in Lake Baikal. According to the TPEQ concentrationof PAHs, PAHs contributed the most to Lake Baikal contamination. The sources ofcontamination of PAHs, PCDDs, and PCBs in Lake Baikal are identified as combustion,runoff from the use of the pesticides (PCP) and insulating oil, specifically for PCBs. Thesource of PBDEs is assumed to be production, use and disposal of products containingPBDEs, in addition to atmospheric long-range transport and deposition.
Key Words: Dioxins, Lake Baikal, lake sediment, PAHs, PBDEs
INTRODUCTION
Lake Baikal is the deepest lake in the world and contains 20% of the unfrozenfresh water available on Earth. Designated as a UNESCO World Heritage Site,Lake Baikal is recognized for its unique ecosystem (1).
Recently, changes in ecology and abiotic variables raised awareness aboutglobal warming. Moore et al. proposed that, because of anthropogenic stresses,
Received 11 August 2012; accepted 6 January 2013.Address correspondence to Gon Ok, Department of Environment Atmospheric Science,Graduate School of Earth Environmental Engineering, and Dioxin Research Center,Pukyong National University, Nam-gu Daeyeon 3-dong 599-1, Busan 608-737, Korea.E-mail: [email protected]
173
Dow
nloa
ded
by [
The
Uni
vers
ity O
f M
elbo
urne
Lib
rari
es]
at 2
3:49
16
Sept
embe
r 20
13
174 G. Ok et al.
the function of Lake Baikal’s ecosystem would worsen along with melting per-mafrost (2). Lake Baikal has over 300 inflow tributaries, and the only outflowtributary is the Angara River. The Selenga River, the main inflow tributary,provides 57% of water to Lake Baikal, and is known as one of the significantsources of lake pollution (3, 4). Ol’khon island is the only inhabited island inlake Baikal that is also a main tourist destination for Lake Baikal tourism. Thetourism activities in the island have shown to result in environmental impact(5).
Since then, organic pollutants were found in air, water, soil, and the Baikalseal (6–12). The Baikal pulp and paper mill (BPPM) was built directly on thesouthern shore in 1966 and is considered to be a major source of polychlo-rinated dibenzo-p-dioxin and dibenzo furan (PCDD/Fs) and polychlorinatedbiphenyl (PCB) contamination in Lake Baikal (1, 11).
In Russia, the levels of PCBs and DDT started to decrease with the re-striction of their production and use (13). However, in the past 20 years, thelevels of brominated flame retardants (BFRs) in the environment have beenincreasing in Russia, with their increasing use (14, 15).
Of particular note is a study that used the Baikal seal as an indicator ofthe significance of polybrominated diphenyl ether (PBDE) contamination inLake Baikal (16, 17). PBDEs are an emerging POP that is commonly used inpaint, textiles, and electronic devices. Recent studies suggest the severe tox-icity of PBDEs. Studies with mice exposed to PBDEs indicated that PBDEscause learning and motor disabilities, and that such deficits become more seri-ous as the animals grow older (18, 19).
Polycyclic aromatic hydrocarbons (PAHs) are unintentionally producedPOPs that can be released into the environment during human activities suchas during industrial combustion (20). Like dioxins and PCBs, PAHs are car-cinogenic and cause development of benign and malignant tumors in experi-mental animals (20). In order to protect the habitats of Lake Baikal and resi-dents of the area who are using lake water as their water source, this study ofPOPs in Lake Baikal is significant. So far, there are a limited number of studieson POPs in Lake Baikal and its basin using sediments as an analytical matrix,and there is no study as of yet on POPs in the deep-water sediments of LakeBaikal (1, 7). In the present work, the contamination levels and the sources ofPCDD/Fs, PCBs, and PAHs in the Lake Baikal ecosystem were monitored, forthe first time, using deep-water sediments. These newly obtained data couldserve as a basis for assessment of sources of Lake Baikal pollution and providea record of pollution.
MATERIALS AND METHODS
Sample CollectionThe sediment samples were collected from 15 stations in four regions of
Lake Baikal: Ol’khon Island (n = 8), the Angara River estuary (n = 2), the
Dow
nloa
ded
by [
The
Uni
vers
ity O
f M
elbo
urne
Lib
rari
es]
at 2
3:49
16
Sept
embe
r 20
13

PAHs, PCDD/Fs, PCBs and PBDEs Contamination in Lake Baikal 175
Figure 1: Sampling station at Lake Baikal.
Selenga River delta (n = 2), and near the Baikal pulp and paper mill (BPPM)(n = 3). The samplings stations, diving depths, and their specific locations areshown in Figure 1. All the samples were collected by two manned submersibles,“Mir” (the P.P. Shirshov Institute of Oceanology of the Russian Academy ofSciences) during the first international expedition in 2008.
Sample Extraction and PretreatmentSediment samples were freeze dried and organic compounds were ex-
tracted for 16 h with toluene using the Soxhlet extraction method.For the analysis of PCDD/Fs, a labeled and internal standard (EPA-1613,
LCS, and EPA-1613 ISS, Wellington Laboratories Inc., Canada) was used. Theextracts were cleaned using a multilayered silica gel column consisting of 2 gof anhydrous sodium sulfate, 0.6 g of silica gel, 3 g of 2% KOH, 0.6 g of silicagel, 4 g of 44% H2SO4, 4 g of 22% H2SO4, 0.6 g of silica gel, 2 g of 10% AgNO3,and 2 g of anhydrous sodium sulfate. The eluate used was 160 mL of n-hexane.The eluent was then cleaned again using an activated alumina column chro-matograph loaded with 10 g of alumina activated at 600◦C for 24 hours. Theelution was held with 70 mL of 3% dichloromethane in n-hexane for the firstfraction, and in 80 mL of 50% dichloromethane in n-hexane, for the secondfraction.
Dow
nloa
ded
by [
The
Uni
vers
ity O
f M
elbo
urne
Lib
rari
es]
at 2
3:49
16
Sept
embe
r 20
13

176 G. Ok et al.
For the dioxin like-PCBs (DL-PCBs) analysis, the samples were spikedwith a labeled standard (68A-LCS, Wellington Laboratories Inc.) and an inter-nal standard (68A-IS, Wellington Laboratories Inc.). The samples were thencleaned with a multilayered silica gel column layered the same way as thatused for cleaning for the analysis of dioxins. For the analysis of the 209 PCBcongeners, a standard solution M-1668A-1-5-0.01X (Accu Standard, USA) wasused (21–25).
The samples used for PAH analyses were spiked with the labeled stan-dard solutions (ES-2528, CIL, Inc., USA). For cleaning, an activated silica gelcolumn chromatograph (70–230 mesh, neutral, Merck) filled with silica gel ac-tivated at 600◦C for 2 h was used. For the first and second fractions, 10 mLof n-hexane and 100 mL of 10% dichloromethane in n-hexane were used aseluents, respectively (25, 26). The elution from the second fraction was con-centrated for the instrumental analysis. For the analyses of PBDEs, the la-beled and internal standard solutions (BFR-LCS, Wellington, and BFR-ISS,Wellington Laboratories Inc.) were spiked, and cleaned with a multilayeredsilica gel column in common with the pretreatment of PCDD/Fs. The eluateused for cleaning PBDEs was a 120 mL solution of 10% dichloromethane inn-hexane (24).
Instrumental AnalysisThe instrumental analyses of PCDD/Fs and PCBs were conducted using
high-resolution gas chromatography (6890N GC, Agilent, USA) and mass spec-trometry (JMS-700D, JEOL, Japan). The instrumental conditions for the anal-yses of PCDD/Fs and PCBs were as detailed in Ok et al. (24). In the caseof PAHs, high-resolution gas chromatography and mass spectrometry (6890NHRGC/MSD, Agilent, USA) were used (25, 26). The instrumental conditionsfor PAH analysis were set as suggested by Kim et al. (26).
RESULTS AND DISCUSSION
Persistent Organic Pollutants—PCDD/Fs, PCBs, DL-PCBs, PBDEsAmong the four sampling regions, Ol’khon Island had the highest total
PCDD/DF homolog concentrations, with a mean concentration of 20.3 pg/g d.w.,a minimum concentration of 9.6 pg/g d.w., and a maximum concentration of50.2 pg/g d.w (Table 1). The highest total toxicity equivalent (TEQ) concen-tration was also found at Ol’khon Island with a mean concentration of 0.35pg–WHO98TEQ/g d.w, and a range of 0.10–0.90 pg–WHO98TEQ/g d.w. Com-pared with sediments from Saginaw Bay (86.2 pg/g d.w.) and Spanish River
Dow
nloa
ded
by [
The
Uni
vers
ity O
f M
elbo
urne
Lib
rari
es]
at 2
3:49
16
Sept
embe
r 20
13

Tab
le1:
Co
nc
en
tra
tion
(pg
WH
O98
-TEQ
/g.d
.w)
of
PC
DD
/DFs
an
dP
CBs
inLa
keBa
ika
lse
dim
en
ts
Isla
nd
Olk
ho
n(n
=8)
Sele
ng
ariv
erd
elta
(n=
2)A
ng
ara
rive
rest
ua
ry(n
=2)
BPP
M(n
=3)
Me
an±S
DR
an
ge
Me
an±S
DR
an
ge
Me
an±S
DR
an
ge
Me
an±S
DR
an
ge
PCD
Ds
2,3,
7,8,
-T4C
DD
<0.
0001
<0.
0001
<0.
0001
<0.
0001
<0.
0001
<0.
0001
0.01
0±
0.01
80.
0001
–0.0
311,
2,3,
7,8-
P5C
DD
<0.
0001
<0.
0001
<0.
0001
<0.
0001
<0.
0001
<0.
0001
<0.
0001
<0.
0001
1,2,
3,4,
7,8-
H6C
DD
0.00
4±
0.01
10.
0001
–0.0
31<
0.00
01<
0.00
01<
0.00
01<
0.00
010.
001
±0.
003
0.00
01–0
.004
1,2,
3,6,
7,8-
H6C
DD
0.00
6±
0.01
80.
0001
–0.0
51<
0.00
01<
0.00
01<
0.00
01<
0.00
010.
003±
0.00
50.
0001
–0.0
091,
2,3,
7,8,
9-H
6CD
D0.
008
±0.
017
0.00
01–0
.050
<0.
0001
<0.
0001
<0.
0001
<0.
0001
<0.
0001
<0.
0001
1,2,
3,4,
6,7,
8-H
7CD
D0.
025
±0.
011
0.01
1–0.
045
0.01
8±
0.01
20.
009–
0.02
60.
013
±0.
005
0.01
0–0.
017
0.03
0±
0.01
60.
017–
0.04
8O
CD
D0.
002
±0.
002
0.00
1–0.
008
<0.
0001
0.00
02–0
.000
70.
0004
±0.
000
0.00
04–0
.000
40.
0007
±0.
0002
0.00
05–0
.001
PCD
Fs2,
3,7,
8-T4
DF
0.00
4±
0.00
90.
0001
–0.0
260.
003
±0.
004
0.00
01–0
.006
0.01
1±
0.00
10.
010–
0.01
20.
042
±0.
034
0.00
4–0.
071
1,2,
3,7,
8-P
5CD
F0.
004
±0.
005
0.00
01–0
.015
0.00
01±
0.00
10.
0001
–0.0
010.
003
±0.
001
0.00
3–0.
004
0.00
1±
0.00
10.
0001
–0.0
022,
3,4,
7,8-
P5C
DF
0.05
7±
0.07
10.
0001
–0.2
010.
005
±0.
007
0.00
01–0
.010
0.01
3±
0.01
80.
0001
–0.0
25<
0.00
01<
0.00
011,
2,3,
4,7,
8-H
6CD
F0.
004
±0.
009
0.00
01–0
.025
<0.
0001
<0.
0001
0.00
7±
0.00
40.
004–
0.01
1<
0.00
01<
0.00
011,
2,3,
6,7,
8-H
6CD
F0.
005
±0.
009
0.00
01–0
.027
<0.
0001
<0.
0001
0.00
8±
0.00
50.
005–
0.01
1<
0.00
01<
0.00
011,
2,3,
7,8,
9-H
6CD
F<
0.00
01<
0.00
01<
0.00
01<
0.00
010.
001
±0.
002
0.00
01–0
.003
<0.
0001
<0.
0001
2,3,
4,6,
7,8-
H6C
DF
0.00
01±
0.00
10.
0001
–0.0
02<
0.00
01<
0.00
01<
0.00
01<
0.00
01<
0.00
01<
0.00
011,
2,3,
4,6,
7,8-
H7C
DF
0.00
4±
0.00
70.
0001
–0.0
190.
001
±0.
001
0.00
0–0.
002
0.00
2±0.
001
0.00
1–0.
003
0.00
1±
0.00
10.
001–
0.00
21,
2,3,
4,7,
8,9-
H7C
DF
0.00
1±
0.00
20.
0001
–0.0
05<
0.00
01<
0.00
010.
0003
±0.
0001
0.00
03–0
.000
4<
0.00
01<
0.00
01O
CD
F0.
0001
±0.
0001
0.00
01–0
.000
2<
0.00
01<
0.00
01<
0.00
01<
0.00
01<
0.00
01<
0.00
01N
on-
ort
hoPC
Bs3,
3’,4
,4’-
T4C
B(#
77)
0.00
2±
0.00
10.
001–
0.00
40.
001
±0.
0001
0.00
1–0.
001
0.00
1±
0.00
010.
001–
0.00
10.
003
±0.
001
0.00
2–0.
004
3,4,
4’.5
-T4C
B(#
81)
0.00
3±
0.00
10.
001–
0.00
40.
001
±0.
0001
0.00
1–0.
001
0.00
1±
0.00
010.
001–
0.00
10.
003
±0.
001
0.00
2–0.
004
3,3’
,4,4
’,5-
P5C
B(#
126)
0.09
1±
0.08
90.
0001
–0.2
690.
038
±0.
021
0.02
3–0.
053
0.06
4±
0.01
40.
054–
0.07
4<
0.00
01<
0.00
01
3,3’
,4,4
’,5,
5’-H
6CB
(#16
9)0.
019
±0.
019
0.00
01–0
.058
0.00
5±
0.00
50.
002–
0.00
80.
010
±0.
005
0.00
6–0.
014
0.00
5±
0.00
50.
0001
–0.0
10
Mo
no-o
rtho
PCBs
2,3,
3’,4
,4’-
P5C
B(#
105)
0.01
9±
0.00
90.
011–
0.03
50.
010
±0.
001
0.01
0–0.
011
0.01
0±
0.00
10.
009–
0.01
00.
022
±0.
011
0.01
3–0.
033
2,3,
4,4’
,5-P
5CB
(#11
4)0.
011
±0.
006
0.00
4–0.
019
0.00
6±
0.00
10.
005–
0.00
70.
006
±0.
003
0.00
4–0.
009
0.01
2±
0.00
70.
006–
0.02
0
2,3’
,4,4
’,5-
P5C
B(#
118)
0.08
7±
0.07
60.
036–
0.26
20.
035
±0.
001
0.03
4–0.
036
0.03
0±
0.00
50.
026–
0.03
30.
069
±0.
033
0.04
1–0.
105
2’,3
,4,4
’,5-
P5C
B(#
123)
0.00
1±
0.00
10.
0001
–0.0
020.
0001
±0.
0001
0.00
01–0
.000
10.
0001
±0 .
0001
0.00
01–0
.000
10.
001
±0.
001
0.00
1–0.
002
2,3,
3’,4
,4’,
5-H
6CB
(#15
6)0.
006
±0.
004
0.00
3–0.
013
0.00
3±
0.00
010.
003–
0.00
30.
003
±0.
001
0.00
2–0.
003
0.00
7±
0.00
50.
003–
0.01
3
2,3,
3’,4
,4’,
5’-H
6CB
(#15
7)0.
001
±0.
001
0.00
1–0.
003
0.00
01±
0.00
010.
0001
–0.0
001
0.00
1±
0.00
010.
0001
–0.0
010.
001
±0.
001
0.00
01–0
.003
(Co
ntin
ue
do
nn
ext
pa
ge
)
177
Dow
nloa
ded
by [
The
Uni
vers
ity O
f M
elbo
urne
Lib
rari
es]
at 2
3:49
16
Sept
embe
r 20
13

Tab
le1:
Co
nc
en
tra
tion
(pg
WH
O98
-TEQ
/g.d
.w)
of
PC
DD
/DFs
an
dP
CBs
inLa
keBa
ika
lse
dim
en
ts(C
on
tinu
ed
)
Isla
nd
Olk
ho
n(n
=8)
Sele
ng
ariv
erd
elta
(n=
2)A
ng
ara
rive
rest
ua
ry(n
=2)
BPP
M(n
=3)
Me
an±S
DR
an
ge
Me
an±S
DR
an
ge
Me
an±S
DR
an
ge
Me
an±S
DR
an
ge
2,3′ ,4
,4′ ,5
,5′ -H
6CB
(#16
7)0.
003
±0.
008
0.00
01–0
.022
0.00
01±
0.00
010.
0001
–0.0
001
0.00
01±
0.00
010.
0001
–0.0
001
0.00
01±
0.00
010.
0001
–0.0
001
2,3,
3’,4
,4’,
5,5’
-H7C
B(#
189)
0.00
01±
0.00
010.
0001
–0.0
001
<0.
0001
<0.
0001
<0.
0001
<0.
0001
<0.
0001
<0.
0001
Ho
mo
log
T4C
DD
0.39
7±
0.63
90.
0001
–1.9
550.
411
±0.
298
0.20
0–0.
621
0.44
6±
0.01
60.
435–
0.45
80.
231
±0.
147
0.10
9–0.
394
P5C
DD
<0.
0001
<0.
0001
0.06
4±
0.09
00.
0001
–0.1
270.
249
±0.
076
0.19
6–0.
303
<0.
0001
<0.
0001
H6C
DD
0.61
3±
1.20
40.
0001
–3.5
540.
506
±0.
715
0.00
01–1
.011
0.93
7±
0.68
10.
455–
1.41
80.
450
±0.
398
0.00
01–0
.755
H7C
DD
4.21
8±
2.13
81.
921–
8.24
32.
990
±1.
914
1.63
7–4.
344
2.54
4±
1.07
81.
782–
3.30
64.
515
±2.
310
2.73
4–7.
126
OC
DD
11.4
13±
8.97
95.
192–
29.7
484.
598
±2.
996
2.47
9–6.
716
4.05
6±
0.30
83.
838–
4.27
46.
513
±2.
096
4.58
3–8.
743
Tota
lPC
DD
s16
.641
±12
.565
7.79
4–43
.499
8.56
8±
5.41
84.
737–
12.3
998.
232
±2.
159
6.70
6–9.
759
11.7
09±
4.66
77.
507–
16.7
31T4
CD
F1.
596
±1.
738
0.00
01–5
.133
0.54
9±
0.77
60.
0001
–1.0
971.
711
±0.
699
1.21
7–2.
205
2.01
0±
1.21
90.
688–
3.09
1P
5CD
F0.
605
±0.
723
0.00
01–2
.194
0.07
5±
0.10
60.
0001
–0.1
500.
621
±0.
387
0.34
8–0.
895
0.24
1±
0.28
60.
000–
0.55
7H
6CD
F0.
199
±0 .
390
0.00
01–1
.128
<0.
0001
<0.
0001
0.36
8±
0.33
40.
132–
0.60
4<
0.00
01<
0.00
01H
7CD
F0.
632
±1.
023
0.00
01–3
.061
0.10
7±
0.15
10.
0001
–0.2
130.
291
±0.
160
0.17
7–0.
404
0.14
5±
0.07
20.
063–
0.19
7O
CD
F0.
575
±0.
626
0.00
01–1
.666
0.25
7±
0.20
90.
109–
0.40
50.
103
±0.
146
0.00
01–0
.206
0.10
2±
0.08
90.
0001
–0.1
63To
talP
CD
Fs3.
607
±4.
250
0.42
6–12
.922
0.98
8±
0.82
40.
405–
1.57
03.
094
±1.
726
1.87
4–4.
314
2.49
8±
1.63
30.
752–
3.98
7To
tal
PC
DD
/DFs
(pg
/g.d
.w)20.2
48±
15.8
689.
259–
50.1
959.
556
±6.
241
5.14
3–13
.969
11.3
27±
0.43
411
.020
–11.
633
14.2
07±
3.65
610
.263
–17.
483
Mo
no
-CBs
0.00
2±
0.01
0.00
01–0
.02
0.00
3±
0.00
40.
0001
–0.0
1<
0.00
01<
0.00
010.
005
±0.
008
0.00
01–0
.01
Di-C
Bs5.
09±
3.46
1.56
–12.
975.
34±
1.25
4.46
–6.2
33.
11±
2.52
1.33
–4.8
94.
97±
1.88
3.74
–7.1
3Tr
i-CBs
17.6
5±
6.81
12.1
2–29
.84
12.4
1±
1.92
11.0
6–13
.77
6.16
±3.
613.
61–8
.71
15.4
0±
5.43
12.1
4–21
.66
Tetr
a-C
Bs27
.59
±12
.01
16.8
3–49
.72
19.0
0±
4 .53
15.7
9–22
.20
11.9
7±
5.55
8.05
–15.
8925
.99
±8.
6519
.82–
35.8
9Pe
nta
-CBs
14.7
9±
6.86
9.66
–28.
319.
32±
2.68
7.43
–11.
214.
94±
1.98
3.54
–6.3
410
.93
±4.
985.
77–1
5.71
He
xa-C
Bs3.
27±
1.83
1.44
–6.7
42.
33±
0.91
1.69
–2.9
71.
08±
0.01
1.07
–1.0
92.
40±
1.39
1.15
–3.9
0H
ep
ta-C
Bs0.
32±
0.19
0.17
–0.6
40.
18±
0.06
0.14
–0.2
20.
13±
0.00
10.
13–0
.13
0.29
±0.
170.
16-0
.48
Oc
ta-C
Bs<
0.00
01<
0.00
01<
0.00
01<
0.00
01<
0.00
01<
0.00
01<
0.00
01<
0.00
01N
on
a-C
Bs<
0.00
01<
0.00
01<
0.00
01<
0.00
01<
0.00
01<
0.00
01<
0.00
01<
0.00
01D
ec
a-C
Bs0.
01±
0.01
0.00
01–0
.02
<0.
0001
<0.
0001
0.00
3±
0.00
50.
0001
–0.0
1<
0.00
01<
0.00
01To
tal
PC
Bs(n
g/g
.d.w
)68
.72
±28
.66
43.3
5–11
6.83
48.5
8±
11.3
440
.56–
56.6
027
.38
±13
.63
17.7
5–37
.02
59.9
9±
21.9
543
.04–
84.7
8
WH
O98
TEQ
PC
DD
s0.
045
±0.
056
0.01
4–0.
180
0.01
8±
0.01
20.
010–
0.02
60.
014
±0.
005
0.01
0–0.
017
0.04
6±
0.02
60.
018–
0.07
0P
CD
Fs0.
080
±0.
087
0.00
01–0
.224
0.00
9±
0.01
30.
0001
–0.0
190.
046
±0.
003
0.04
4–0.
049
0.04
4±
0.03
50.
005–
0.07
3N
on
-ort
ho
PC
Bs0.
115
±0.
096
0.00
3–0.
312
0.04
5±
0.02
60.
027–
0.06
40.
077
±0.
019
0.06
3–0.
090
0.01
0±
0.00
70.
005–
0.01
8M
on
o-o
rth
oP
CBs
0.12
9±
0.09
10.
059–
0.32
30.
055
±0.
003
0.05
3–0.
058
0.04
9±
0.00
70.
044–
0.05
40.
112
±0.
057
0.06
3–0.
175
Tota
lTEQ
(pg
-WH
O98
TEQ
/g.d
.w)
0.34
90±
0.26
420.
1019
–0.8
976
0.15
72±
0.04
370.
1263
–0.1
297
0.18
56±
0.00
350.
1831
–0.1
881
0.23
75±
0.19
450.
0813
–0.4
554
178
Dow
nloa
ded
by [
The
Uni
vers
ity O
f M
elbo
urne
Lib
rari
es]
at 2
3:49
16
Sept
embe
r 20
13

PAHs, PCDD/Fs, PCBs and PBDEs Contamination in Lake Baikal 179
Figure 2: Homolog concentration of PCDD/Fs in Lake Baikal sediment.
(79.6 pg/g d.w.) in Lake Huron, and Na-PCP-contaminated Dongting Lake sed-iment, where I-TEQ concentration was 11 pg I–TEQ/g d.w., dioxin levels inLake Baikal sediments were considerably lower (27, 28).
The PCDD/DF levels in Lake Baikal are similar to levels found in sedi-ments of a rural lake in Finland (35 pg/g d.w.) (29). In this study, the sum ofPCDD concentrations was higher than those of PCDFs, and highly chlorinatedcompounds such as OCDD were dominant. OCDD contributed 52% of the to-tal concentration (Figure 2). The dominance of OCDD have been reported invarious lake sediments such as Lake Huron and Lake Superior (27). The highcontribution (56–91%) of OCDD was observed in sediments of Nanpaiwu Riverand Bohai Bay in China, the areas with serious PCP contamination (30). Basedon various studies conducted present study and the others, the dominance ofOCDDs in Lake Baikal sediment is assumed to be caused by the use of pesti-cides, such as PCP (27, 30).
Overall, the profile of 2,3,7,8-substances showed the dominance of1,2,3,4,6,7,8-HpCDDs among the PCDDs, and 2,3,4,7,8-PeCDFs among PCDFs(Figure 3). The highest PCDF contribution was found at the Angara Riverhead (sites K and L). Such a pattern is similar to the pattern of dioxins ob-served in the soils of the cities of Irkutsk, Angarsk, and Usol’ye, areas in whichthe Angara River flows through. Generally, the dominance of 2,3,4,7,8-PeCDFis observed during combustion processes. The fly ash from the combustion ofbagasse have shown the dominance of 2,3,4,7,8-PeCDF (31). Based on theseresults, the main sources of dioxins at Ol’khon Island, the Angara River head,and the Selenga River delta are assumed to be runoff from soil contaminatedby PCP and the air deposition from combustion and open burning of wasteresidues.
As shown in Table 1, the total concentration of the 209 PCB congenersranged from 17.8–116.8 ng/g d.w. The regional trend in the 209 PCB congeners
Dow
nloa
ded
by [
The
Uni
vers
ity O
f M
elbo
urne
Lib
rari
es]
at 2
3:49
16
Sept
embe
r 20
13

180 G. Ok et al.
Figure 3: Profile pattern of 2,3,7,8- substances in Lake Baikal sediment.
was as follows: Ol’khon Island (68.7 ng/g d.w.) > BPPM (60.0 ng/g d.w.) > Se-lenga River delta (48.6 ng/g d.w.) > Angara River head (27.4 ng/g d.w.).
The total PCB levels at Ol’khon Island were around twice higher thanthose in eastern Lake Erie (36 ng/g). The levels at Lake Baikal were con-siderably lower than those at central Lake Erie (100 ng/g) and Lake Ontario(100 ng/g) (31). Compared with Lake Michigan where the total PCBs levelswere 7400 ng/g d.w., Lake Baikal sediments were significantly lower and didnot exceed Canadian sediment quality guidelines (34, 35).
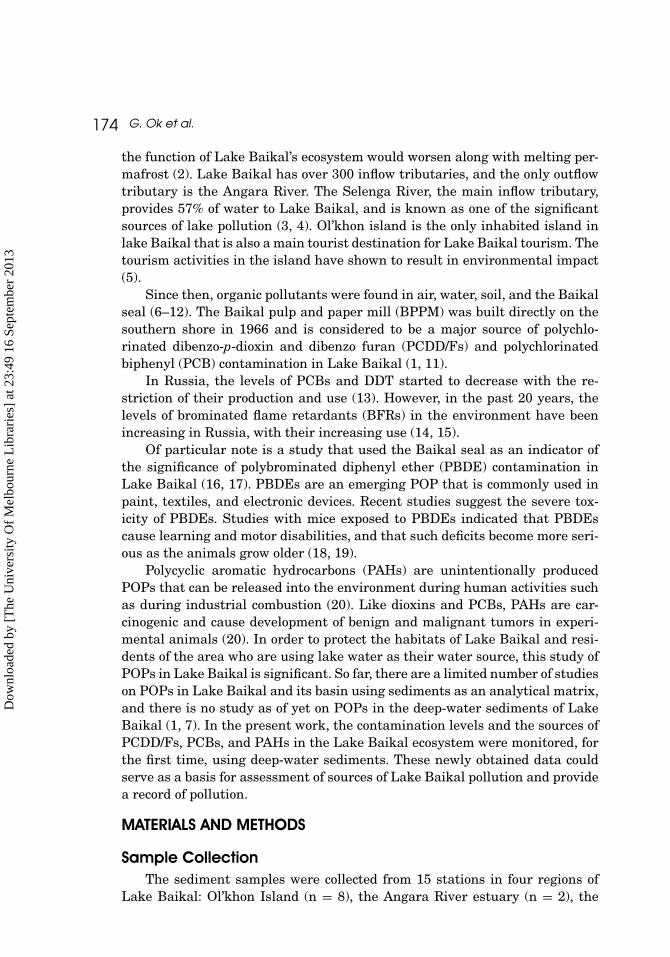
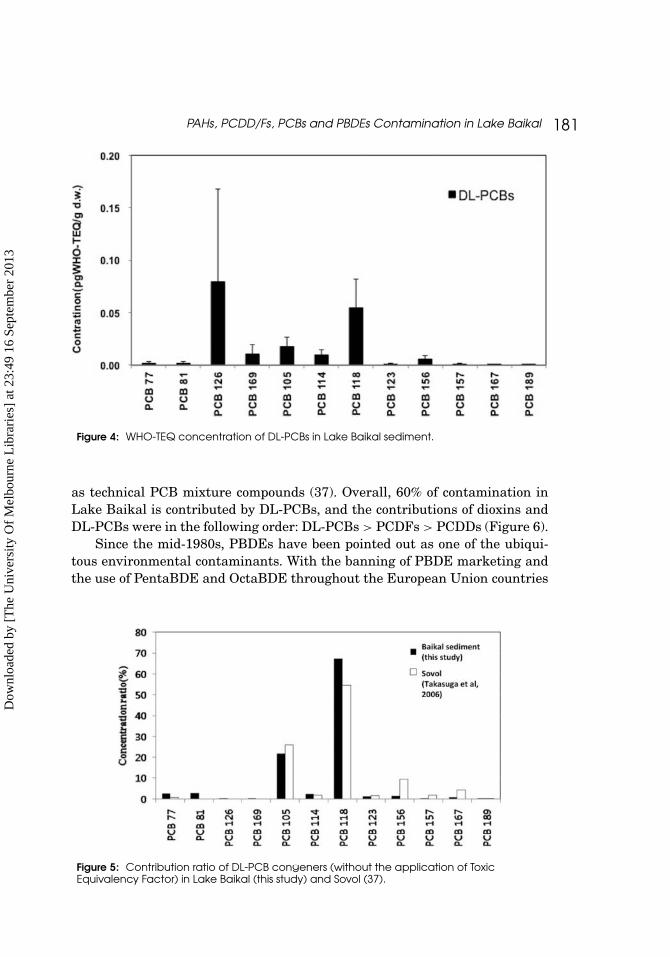
Among the 209 PCB congeners, PCB-52 and PCB-69 were dominant, com-prising 11% of the total 209 PCB congeners. Furthermore, PCB-5, PCB-8, PCB-28, PCB-32, and PCB-70 comprised a further 5–6% of the total concentration.The TEQ concentrations of PCB-126 among the non-ortho-PCBs, and PCB-118among the mono-ortho-PCBs prevailed (Figure 4). Such a pattern is similarto those observed in the Baikal seal and in Sovol, the commercial mixture ofPCBs (36, 37). In Sovol, the predominant PCB congeners are PCB-77 (non-ortho-PCBs); PCB-105, PCB-118, PCB-156 (mono-ortho-PCBs), and PCB-95,PCB-101, PCB-110, PCB-138, and PCB-153 (non-DL PCBs). The contributionfrom Sovol to DL-PCB contamination of Lake Baikal was assumed based onthe 0.0038% DL-PCBs content present in Sovol (37). The profile pattern ofPCBs without the application of TEF in both Lake Baikal sediments and Sovolshowed the dominance of PCB-118 and PCB-105. In Lake Baikal sediments,tetra-PCBs made the highest contribution. Among di-PCBs, PCB-5 and PCB-8made up 6% of the total PCBs. When observing the overall contribution of thePCB congeners in this study, the trends were similar to the patterns observedfor Aroclor 1221 and 1248 and Clophen A-30 and A-40 (Figure 5) (37). Based onthe results of this study and the previous study completed by Takasuga et al.,it is possible to suggest that Sovol plays a major role as one of the sources ofPCB contaminations in Lake Baikal in addition to other sources of PCBs, such
Dow
nloa
ded
by [
The
Uni
vers
ity O
f M
elbo
urne
Lib
rari
es]
at 2
3:49
16
Sept
embe
r 20
13
PAHs, PCDD/Fs, PCBs and PBDEs Contamination in Lake Baikal 181
Figure 4: WHO-TEQ concentration of DL-PCBs in Lake Baikal sediment.
as technical PCB mixture compounds (37). Overall, 60% of contamination inLake Baikal is contributed by DL-PCBs, and the contributions of dioxins andDL-PCBs were in the following order: DL-PCBs > PCDFs > PCDDs (Figure 6).
Since the mid-1980s, PBDEs have been pointed out as one of the ubiqui-tous environmental contaminants. With the banning of PBDE marketing andthe use of PentaBDE and OctaBDE throughout the European Union countries
Figure 5: Contribution ratio of DL-PCB congeners (without the application of ToxicEquivalency Factor) in Lake Baikal (this study) and Sovol (37).
Dow
nloa
ded
by [
The
Uni
vers
ity O
f M
elbo
urne
Lib
rari
es]
at 2
3:49
16
Sept
embe
r 20
13

182 G. Ok et al.
Figure 6: Contribution ratio of PCDD/Fs and DL-PCBs.
in 2004, PBDE levels in Europe are expected to decrease (38). Even so, theconcentration of PBDEs is rapidly increasing in Arctic biota, and this patternis expected to continue in the near future. The production of the commercialformulation PentaBDE mix, which is continuously being produced in over 95%of North America is known to have a great impact on long-range atmospherictransportation (14).
The results of the PBDE analyses on sediment from four regions in LakeBaikal are shown in Table 2. The average concentration of the sum of 40 PB-DEs was highest at BPPM (575.8 pg/g d.w.), around 2.5-fold lower than for thesediments of Lake Superior (1.4 ng/g d.w.), and significantly higher than forthe sediments of Verbania R. Toce, Italy (0.060 ng/g d.w.) (39, 40).
In Lake Baikal, 60% of the PBDEs are contributed by BDE-209 with amean concentration of 0.22 pg/g d.w. PBDE-47 and BDE-99 contributed 11%and 10%, respectively. The dominance of DecaBDE was also observed in otherstudies; in the Lake Maggiore basin of Italy and Switzerland, DecaBDE com-prised 97% of the sum PBDEs because of the use of the DecaBDE formulation,and it comprised 80% of the sum of BDEs in the Elbe River (41–43). Based onthis result, it is possible to assume that the PBDE chemical that contaminatesLake Baikal is brominated Deca-BDE. 90% of Deca-brominated chemicals areknown to comprise BDE-209 (44).
Generally, the sources of PBDEs are production and use of residential elec-tronic devices in big cities and industrial areas. Therefore, the concentrationof PBDEs was expected to be higher in the areas of Lake Baikal that are closeto the big cities. Other than some contribution of industrial use of electronicsand machine at the Paper Mill, the exact source of PBDE in Lake Baikal couldnot be explained in present study.
Dow
nloa
ded
by [
The
Uni
vers
ity O
f M
elbo
urne
Lib
rari
es]
at 2
3:49
16
Sept
embe
r 20
13

Tab
le2:
Co
nc
en
tra
tion
(pg
/g.d
.w.)
of
PBD
Esin
Lake
Baik
als
ed
ime
nts
Isla
nd
Olk
ho
n(n
=8)
BPP
M(n
=3)
Sele
ng
ariv
er
An
ga
raR
ive
rM
ea
n±S
DR
an
ge
de
lta(n
=1)
est
ua
ry(n
=1)
Me
an±S
DR
an
ge
PBD
EsBD
E-1
2.54
±6.
730.
0001
–7.8
1<
0.00
01<
0.00
01<
0.00
01<
0.00
01BD
E-2
5.30
±5.
830.
0001
–14.
34<
0.00
01<
0.00
014.
92±
8.52
0.00
01–1
4.76
BDE-
36.
82±
6.18
0.00
01–1
5.96
<0.
0001
<0.
0001
4.05
±7.
010.
0001
–12.
14BD
E-7
3.39
±1.
641.
68–5
.78
1.17
2.16
2.90
±1.
411.
85–4
.50
BDE-
10<
0.00
01<
0.00
01<
0.00
01<
0.00
01<
0.00
01<
0.00
01BD
E-15
7.25
±3.
264.
46–1
2.27
3.94
3.34
5.37
±2.
084.
02–7
.77
BDE-
171.
51±
1.02
0.00
01–3
.08
0.37
1.42
1.07
±1.
120.
0001
–2.2
3BD
E-28
4.14
±2.
900.
0001
–8.9
22.
583.
633.
19±
1.12
2.34
–4.4
6BD
E-30
<0.
0001
<0.
0001
<0.
0001
<0.
0001
<0.
0001
<0.
0001
BDE-
4739
. 53
±14
.88
23.4
1–66
.54
50.3
167
.28
31.9
3±
13.1
917
.00–
42.0
2BD
E-49
3.63
±2.
731.
75–9
.66
2.72
2.63
2.11
±0.
601.
64–2
.79
BDE-
663.
23±
2.24
0.00
01–6
.24
1.60
<0.
0001
1.39
±1.
200.
0001
–2.1
6BD
E-71
0.44
±0.
630.
0001
–1.4
9<
0.00
01<
0.00
01<
0.00
01<
0.00
01BD
E-77
1.63
±2.
540.
0001
–7.2
1<
0 .00
01<
0.00
01<
0.00
01<
0.00
01BD
E-85
0.83
±2.
200.
0001
–5.8
1<
0.00
01<
0.00
01<
0.00
01<
0.00
01BD
E-99
36.7
5±
15.4
120
.47–
56.7
330
.20
91.6
622
.71
±8.
8612
.74–
29.6
9BD
E-10
08.
05±
3.38
3.74
–12.
705.
9217
.82
3.87
±3.
410.
0001
–6.4
2BD
E-11
90.
33±
0.88
0.00
01–2
.32
<0.
0001
<0.
0001
<0.
0001
<0.
0001
BDE-
126
1.10
±2.
910.
0001
–7.7
1<
0.00
01<
0.00
01<
0.00
01<
0.00
01BD
E-13
8<
0.00
01<
0.00
01<
0.00
01<
0.00
01<
0.00
01<
0.00
01BD
E-13
9<
0.00
01<
0.00
01<
0.00
01<
0.00
01<
0.00
01<
0.00
01BD
E-14
0<
0.00
01<
0.00
01<
0.00
01<
0.00
01<
0.00
01<
0.00
01BD
E-15
31.
54±
2.43
0.00
01–6
. 49
1.12
9.96
1.78
±1.
540.
0001
–2.6
7BD
E-15
42.
14±
2.78
0.00
01–6
.55
4.24
8.83
3.49
±1.
142.
26–4
.51
BDE-
169
0.08
±0.
200.
0001
–0.5
3<
0.00
01<
0.00
01<
0.00
01<
0.00
01BD
E-17
10.
04±
0.09
0.00
01–0
.25
<0.
0001
<0.
0001
<0.
0001
<0.
0001
BDE-
180
0.11
±0.
280.
0001
–0.7
5<
0.00
01<
0.00
01<
0.00
01<
0.00
01BD
E-18
30.
33±
0.60
0.00
01–1
.55
<0.
0001
<0.
0001
0.70
±1.
210.
0001
–2.1
0BD
E-18
40.
06±
0.17
0.00
01–0
.44
<0.
0001
<0.
0001
<0.
0001
<0.
0001
(Co
ntin
ue
do
nn
ext
pa
ge
)
183
Dow
nloa
ded
by [
The
Uni
vers
ity O
f M
elbo
urne
Lib
rari
es]
at 2
3:49
16
Sept
embe
r 20
13

Tab
le2:
Co
nc
en
tra
tion
(pg
/g.d
.w.)
of
PBD
Esin
Lake
Baik
als
ed
ime
nts
(Co
ntin
ue
d)
Isla
nd
Olk
ho
n(n
=8)
BPP
M(n
=3)
Sele
ng
ariv
er
An
ga
raR
ive
rM
ea
n±S
DR
an
ge
de
lta(n
=1)
est
ua
ry(n
=1)
Me
an±S
DR
an
ge
BDE-
191
0.10
±0.
260.
0001
–0.6
8<
0.00
01<
0.00
01<
0.00
01<
0.00
01BD
E-19
60.
34±
0.66
0.00
01–1
.75
1.36
<0.
0001
1.65
±2.
850.
0001
–4.9
4BD
E-19
70.
17±
0.29
0.00
01–0
.62
<0.
0001
<0.
0001
0.54
±0.
940.
0001
–1.6
3BD
E-20
10.
17±
0.44
0.00
01–1
.17
<0.
0001
<0.
0001
1.46
±2.
530.
0001
–4.3
8BD
E-20
30.
29±
0.59
0.00
01–1
.56
1.34
<0.
0001
1.22
±2.
110.
0001
–3.6
6BD
E-20
40.
17±
0.44
0.00
01–1
.17
<0.
0001
<0.
0001
1.46
±2.
530.
0001
–4.3
8BD
E-20
50.
17±
0.46
0.00
01–1
.21
<0.
0001
<0.
0001
<0.
0001
<0.
0001
BDE-
206
4.38
±10
.32
0.00
01–2
7.63
<0.
0001
18.9
325
.89
±44
.85
0.00
01–7
7.68
BDE-
207
2.87
±6.
710.
0001
–17.
98<
0.00
0115
.64
22.3
0±
38.6
20.
0001
–66.
89BD
E-20
82.
31±
6.11
0.00
01–1
6.15
<0.
0001
0.00
13.4
6±
23.3
20.
0001
–40.
38BD
E-20
916
0.88
±13
1.84
49.9
0–43
8.28
125.
1218
8.32
418.
30±
399.
9711
3.84
–871
.28
Tota
lPBD
Es30
2.59
±18
2.77
163.
88–6
95.7
423
2.01
431.
6457
5.76
±51
2.93
181.
16–1
155.
58
184
Dow
nloa
ded
by [
The
Uni
vers
ity O
f M
elbo
urne
Lib
rari
es]
at 2
3:49
16
Sept
embe
r 20
13

PAHs, PCDD/Fs, PCBs and PBDEs Contamination in Lake Baikal 185
Table 3: Concentration of PAHs in sediments from various lakes worldwide
Lake PAHs (ng/g.d.w) Reference
Baikal Lake 219.81∼1255.56 This studyLaja Lake (Chile) 226 (45)Galletue Lake (Chile) 279 (45)Icalma Lake (Chile) 3182 (45)Larto Lake (rural LA, USA) 100 (46)Lake in Adirondack region (USA) 2500–4000 (47)Lake located at northern Great Lakes (USA) 300–1800 (47)Lake in northern Florida (USA) 750–1450 (47)Lake in northern New England (USA) 2000–2800 (47)
PAHsThe concentration of total PAHs (16 compounds) in Lake Baikal deep-water
sediments ranged from 219.8–1255.6 ng/g, with a mean of 452.2 ng/g. The aver-age concentration of total PAHs was highest at site G. The average concentra-tion of total PAHs at site H and site O were 876.7 and 501.8 ng/g, respectively.
Compared with other studies on PAHs in major lakes worldwide, PAH con-centrations in Lake Baikal sediments were about twice that in Laja Lake andGalletue Lake in Chile, and within a similar range with a lake located inthe northern Great Lakes in USA (Table 3) (45, 47). When the contributionof PAH compounds were compared by the number of rings, the dominanceof the two-ringed compound (naphthalene) and the three-ringed compound(phenanthrene) were 35% and 34.7%, respectively. The high contribution ofnaphthalene and phenanthrene is assumed to be caused by agricultural andindustrial activities from nearby areas, since dominance of naphthalene andphenanthrene is often observed after open backyard burning (48). Further-more, PAHs in sediments often consist of higher molecular weight compoundsrather than lower molecular weight compounds (48). However, in Lake Baikalsediments, the contribution of low molecular weight compounds was higherthan that of the high weight molecular compounds (Figure 7a). Such a patternin Lake Baikal sediments is similar to the trend commonly observed duringlow-temperature combustions, such as in open-burning incinerators (45).
Figure 7: Concentration and profile pattern of total PAHs in (a) PAHs-TPEQ, (b) PAHs-dioxinTEQ, and (c) Lake Baikal sediment.
Dow
nloa
ded
by [
The
Uni
vers
ity O
f M
elbo
urne
Lib
rari
es]
at 2
3:49
16
Sept
embe
r 20
13

186 G. Ok et al.
In the present study, the relative carcinogenicity of PAHs has also beenevaluated based on the toxic potency equivalency factor (TPEF) (49–52). Fur-thermore, the relative toxic equivalency factor (TEF) of PAHs was also sug-gested based on 2,3,7,8-Tetrachlorodibenzo-p-dioxin(TCDD) (52).
The toxicity of PAHs, toxic potency equivalent quantity (TPEQ) in LakeBaikal sediment was assessed using the TPEF suggested by Malcom andDobson (51). PAHs-TPEQ in Lake Baikal sediment ranged from 0.4–7.9 ngPAHs-TPEQ/g, with an average of 2.3 ng PAHs-TPEQ/g.
Overall, PAHs-TPEQ concentrations were high at sites G, H, andO, and the dominant compounds with the application of TPEQ weredibenz(a,h)anthracene and benzo(a)pyrene (Figure 7b). With the application ofthe relative toxic equivalency factors suggested by Klimm et al., PAHs-dioxinTEQ ranged from 2.0–56.0 pg PAHs-dioxin TEQ/g, with a mean of 16.0 pg PAHs-dioxin TEQ/g (53). Furthermore, the concentration of PAHs-dioxin TEQ showeda similar pattern to the total PAHs and PAHs-TPEQ (Figure 7c). The concen-tration of PAHs-dioxin TEQ was also highest at sites G and O, similar to thePAHs-TPEQ value.
With the application of toxic potency, PAHs contribute the most to LakeBaikal contamination compared to PCDD/Fs and DL-PCBs (Figure 8). Thus,the importance of assessing total toxicity and the risk of compound mixturesin the lake sediment is suggested (54).
For additional source identification, diagnostic analyses that use the ratioof certain PAH compounds were conducted. The ratios of AnT to PhA and FluA
Figure 8: Toxic Potency of PCDD/Fs, DL-PCBs and PAHs-dioxin TEQ in Lake Baikal sediment.
Dow
nloa
ded
by [
The
Uni
vers
ity O
f M
elbo
urne
Lib
rari
es]
at 2
3:49
16
Sept
embe
r 20
13

PAHs, PCDD/Fs, PCBs and PBDEs Contamination in Lake Baikal 187
Figure 9: Diagnostic analysis of PAHs source identification.
to FluA+Pyr in all areas were over 0.1 and below 0.4, respectively. Since theratio of InP/(InP+BghiP) was over 0.5, it is reasonable to assume that thesources of PAH contamination in Lake Baikal are the combustion of fossil fuels,lumber and grassland (Figure 9).
Principal Components Analysis (PCA)For clear source identification, principal components analysis was used.
As seen in Figure 10a, DL-PCBs, PCBs, dioxins, and PAHs share the samesource of pollution, such as industrial combustion and runoff of PCP from in-dustrial areas. However, pollution from PBDEs has its own origin. As a sourceof PBDE contamination in Lake Baikal sediment, the uses and production ofPBDE-containing products are suggested. Generally, certain PBDE congeners
Figure 10: Principal Component Analysis (PCA) plot of (a) PCDD/Fs, PCBs, DL-PCBs, PBDEs.and dioxins and (b) 40 PBDE congeners.
Dow
nloa
ded
by [
The
Uni
vers
ity O
f M
elbo
urne
Lib
rari
es]
at 2
3:49
16
Sept
embe
r 20
13

188 G. Ok et al.
are added to certain products. For example, PentaBDE is often used in mat-tresses and carpets, OctaBDE is often used in radio and ABS plastics, whileDecaBDE is contained in microelectronic trays. However, the exact type ofproduct that may cause the contamination is uncertain. As shown in Figure10b, PC1 and PC2 have an accounting ratio of 25.7%, and there is no specificgroup of PBDE congeners.
CONCLUSION
From the results, it is concluded that the source of dioxin contamination inLake Baikal is runoff from PCP-contaminated soil, air deposition, and com-bustion of waste residues, and contamination caused by pulp bleaching at thepaper mill. The concentration of PCDD/Fs is considerably lower than that inthe Great Lakes and PCP-contaminated lakes in China (30).
As for PCDD/Fs, the highest concentration of PCBs was found at Ol’khonIsland. PCB concentrations from Lake Baikal sediment are quite low. Basedon the similarities in the profile pattern of PCBs in Lake Baikal sedimentand that at Sovol, it has been suggested that Lake Baikal contamination ofPCBs is due to the use of technical PCB mixtures such as Aroclor. With theapplication of toxic potency, PAHs-TPEQ contributed the most to Lake Baikalcontamination compared to other compounds examined in this study. From theresults, the source of PAH contamination in Lake Baikal is suggested as agri-cultural and industrial activities. PBDE levels in Lake Baikal sediment werelower than those of the Great Lakes. Like many other major lakes worldwide,DecaBDE was dominant. The dominance of DecaBDE seems to be caused bythe use and production of electronic devices in big cities near the lake. How-ever, the exact source of general PBDE contamination in Lake Baikal is un-known, since the significant and direct influence of specific industries was un-noticeable in profile pattern or from PCA plots. Generally, the concentrationsof persistent organic pollutants were lower than from other major contami-nated lakes around the world. However, considering the fact that Lake Baikalsediment shows signs of dioxin, PCB, PBDE, and PAH contamination causedby the pulp industry and the use of pesticides and other agricultural activities,there are potential risks of contamination to Lake Baikal in the future. Thus,further monitoring of POPs in biota and the environment of Lake Baikal willbe necessary.
REFERENCES1. Mamontov, A. A., E. A. Mamontova, E. N. Tarasova, and M. S. Mclachlan. “Tracing
the sources of PCDD/Fs and PCBs to Lake Baikal.” Environ. Sci. Technol. 34 (2000):741–747.
2. Moore, M. V., S. E. Hampton, L. R. Izmest’eva, E. A. Silow, E. V. Peshcova, and B.K. Pavlov. “Climate change and the world’s “Sacred Sea.”- Lake Baikal.” Siberia. Bio.Sci. 59 (2009): 405–417.
Dow
nloa
ded
by [
The
Uni
vers
ity O
f M
elbo
urne
Lib
rari
es]
at 2
3:49
16
Sept
embe
r 20
13

PAHs, PCDD/Fs, PCBs and PBDEs Contamination in Lake Baikal 189
3. Flower, R. J., A. W. Mackay, N. Rose, J. L. Boyle, P. G. Dearing, A. E. Appleby, A.E. Kuzmina, and L. Z. Granina. “Sedimentary records of recent environmental changein Lake Baikal, Siberia.” Holocene 5 (1995): 323–327.
4. Kozhova, O. M. and E. A. Silow. “The current problems of Lake Baikal ecosystemconservation.” Lake Reserv. Res. Manage. 3 (1998): 19–33.
5. Opp, C. and C. Blid. Tourism in protected areas: potential or risk? A case studyfrom the world heritage area Lake Baikal. Proceedings of 4th symposium of the HoheTauern National Park for research in protected area. Castle of Kaprun, September17–19 (2009), 234–244.
6. Kucklick, J.R., T. F. Bidleman, L. L. McConnell, M. D. Walla, and G. P. Ivanov.“Organochlorines in the water and biota of Lake Baikal, Siberia.” Environ. Sci. Technol.28 (1994): 31–37.
7. Iwata, H., S. Tanabe, K. Ueda, and R. Tatsukawa. “Persistent organochlorineresidues8in air, water, sediments, and soils from the Lake Baikal region, Russia.” Env-iron. Sci. Technol. 29 (1995): 792–801.
8. Nakata, H., S. Tanabe, R. Tatsukawa, M. Amano, N. Miyazaki, and E. A. Petrov.“Persistent organochlorine residues and their accumulation kinetics in Baikal Seal(Phoca sibirica) from Lake Baikal, Russia.” Environ. Sci. Technol. 29 (1995): 2877–2885.
9. Nakata, H., S. Tanabe, R. Tatsukawa, M. Amano, N. Miyazaki, and E. A. Petrov.“Bioaccumulation profiles of polychlorinatedbiphenyls including coplanar congenersand possible toxicological implications in Baikal seal (Phoca sibirica).” Environ. Pollut.95 (1997): 57–65.
10. Mcconnell, L. L., J. R. Kucklick, T. F. Bidleman, G. P. Ivanov, and S. M. Chernyak.“Air–water gas exchange of organochlorine compounds in Lake Baikal, Russia.” Envi-ron. Sci. Technol. 30 (1996): 2975–2983.
11. Tarasova, E. N., A. A. Mamontov, and E. A. Mamontova. “Polychlorinated dibenzo-p-dioxins (PCDDs) and dibenzofurans (PCDFs) in Baikal Seal.” Chemosphere 34 (1997):2419–2427.
12. Tsydenova, O., T. B. Minh, N. Kajiwara, V. Batoev, and S. Tanabe. “Recent contam-ination by persistent organochlorines in Baikal seal (Phoca sibirica) from Lake Baikal,Russia.” Mar. Pollut. Bull. 48 (2004): 749–758.
13. Tanabe, S., S. Niimi, T. B. Minh, N. Miyazaki, and E. A. Petrov. “Temporal trends ofpersistent organochlorine contamination in Russia: a case study of Baikal and Caspianseal.” Arch. Environ. Contam. Toxicol. 44 (2003): 533–545.
14. Law, R. J., M. Alaee, C. R. Allchin, J. P. Boo, M. Lebeuf, P. Lepom, and G. A. Stern.“Levels and trends of polybrominated diphenyl ethers and other brominated flame re-tardants in wildlife.” Environ. Sci. Technol. 39 (2003): 281A–287A.
15. Covaci, A., A. C. Gerecke, R. J. Law, S. Voorspoels, M. Kohler, N. V. Heeb, H. Leslie,C. R. Allchin, and J. de Boer. “Hexabromocyclododecanes (HBCDs) in the environmentand humans: a review.” Environ. Sci. Technol. 40 (2006): 3679–3688.
16. Isobe, T., Y. Ochi, D. Imaeda, H. Sakai, S. Hirakawa, O. Tydenova, M. Amano, E.Petrov, V. Batoev, H. Iwata, S. Takahashi, and S. Tanabe. “Contamination status ofbrominated flame retardants (BFRs) in Baikal Seals (Pusa sibirica).” InterdisciplinaryStudies on Environmental Chemistry-Environmental Research in Asia, THERAPUB,Tokyo (2009) pp. 119–124.
17. Sakai, S., K. Hayakawa, H. Takatsuki, and I. Kawakami. “Dioxin-like PCBs re-leased from waste incineration and their deposition flux.” Environ. Sci. Technol. 35(2001): 3601–3607.
Dow
nloa
ded
by [
The
Uni
vers
ity O
f M
elbo
urne
Lib
rari
es]
at 2
3:49
16
Sept
embe
r 20
13

190 G. Ok et al.
18. Errikson, P.. “Developmental neurotoxicity of environmental agents in theneonate. Neurotoxicity of environmental agents in the neonate.” Neurotoxicology 18(1997): 719–726.
19. Errikson, P., H. Viberg, E. Jakobsson, U. Orn, and A. Fredrikson. “PBDE, 2,2,4,4,5-pentabromodiphenyl ether causes permanent neurotoxic effects during a defined periodof neonatal brain development.” Organohal. Comp. 40 (1999): 33–335.
20. WHO Regional Office for Europe. In WHO Regional Office for Europe. Air Qual-ity Guidelines, 2nd ed., Ch. 5.9 PAHs. (Denmark: WHO Regional Office for Europe,2000).
21. Miyata, H., O. Aozasa, Y. Mase, S. Ohta, S. Khono, and S. Asada. “Estimated an-nual emission of PCDDs, PCDFs and non-ortho chlorine substituted coplanar PCBsfrom flue gas from urban waste incinerators in Japan.” Chemosphere 29 (1994):2097–2105.
22. Ok, G., H. B. Moon, S. H. Ji, and Y. H. Han. “Concentration levels and be-havior characteristics of PCDDs/DFs in atmosphere.” Organohal. Comp. 43 (1999):209–212.
23. Ok, G., S. H. Ji, S. J. Kim, Y. K. Kim, J. H. Park, Y. S. Kim, and Y. H. Han. “Moni-toring of air pollution by polychlorinated dibenzo-p-dioxins and polychlorinated diben-zofurans of pine needles in Korea.” Chenmosphere 46 (2002): 1351–1357.
24. Ok, G., S. H. Lee, S. M. Hwang, and N. J. Park. Historical trends and analysis ofPCDD/DFs, PCBs and Emerging POPs in sediment core in Yeong-il bay, Korea. Pro-ceedings of Japan Society of Analytical Chemistry and Japan Analytical InstrumentsManufactures Association Conference, Tokyo, June 9–11, 2009, 371.
25. Kim, J. S., Y. H. Chung, and G. Ok. “Concentration levels and distribution charac-teristics of polycyclic aromatic hydrocarbons (PAHs) at soil in Changwon City.” J. Kor.Soc. Environ. Anal. 3 (2000): 171–175 (in Korea).
26. Kim, D. H. and G. Ok. “Survey on concentration characteristics of polycyclic aro-matic hydrocarbons in soil in Seoul.” J. Environ. Sci. 14 (2005): 71–80.
27. Shen, L., S. G. Gewurtz, E. J. Reiner, K. A. MacPherson, T. M. Kolic, P. A. Helm,I. D. Brindle, and C. H. Marvin. “Patterns and sources of polychlorinated dibenzo-p-dioxins and polychlorinated dibenzofurans in surficial sediments of Lakes Erie and On-tario.” Environ. Pollut. 156 (2008): 515–525.
28. Gao, L. R., M. H. Zeng, B. Zhang, W. B. Liu, X. R. Zhao, and Q. H. Zhang. “De-clining polychlorinated dibenzo-p-dioxins and benzofurans levels in the sediments fromDongting Lake in China.” Chemosphere 73 (2008): S176–179.
29. Isosaari, P., H. Pajunen, and T. Varitianen, T.. “PCDD/DF and PCB history in datedsediments of a rural lake.” Chemosphere 47 (2002): 575–593.
30. Hu, J., Y. Wan, B. Shao, X. Jin, W. An, F. Fin, M. Yang, X. Wang, and M. Sugisaki.“Occurrence of trace organic contaminants in Bohai Bay and its adjacent NanpaiwuRiver, North China.” Marine Chem. 95 (2005): 1–13.
31. Yieve, N. S. C. K. and M. Tiroumalechetty. “Dioxin levels in fly ahs coming fromthe combustion of bagasse.” J. Hazard. Mater. 155 (2008): 179–182.
32. Rappe, C., S. E. Swanson, and B. Glas. “Formation of PCDDs and PCDFs by thechlorination of water.” Chemosphere 19 (1989): 1875–1880.
33. Marvin, C., S. Painter, D. Williams, V. Richardson, R. Rossmann, and P. Van Hoof.“Spatial and temporal trends in surface water and sediment contamination in the Lau-rentian Great Lakes.” Environ. Pollut. 129 (2004): 131–144.
Dow
nloa
ded
by [
The
Uni
vers
ity O
f M
elbo
urne
Lib
rari
es]
at 2
3:49
16
Sept
embe
r 20
13
PAHs, PCDD/Fs, PCBs and PBDEs Contamination in Lake Baikal 191
34. Martinez, A., K. Norstrom, K. Wang, and K. C. Hornbuckle. “Polychlorinatedbiphenyl in the surficial sediment of Indiana Harbor and Ship Canal.” Lake Michigan.Environ. Int. 36 (2010): 849–854.
35. Canadian Council of Ministers of the Environment. Canadian sediment qualityguidelines for protection of aquatic life: Summary tables. In Canadian EnvironmentalQuality Guidelines. (Winnipeg, Manitoba, 1999).
36. Imaeda, D., T. Kunisue, Y. Ochi, H. Iwata, O. Tsydenova, S. Takahashi, M. Amano,A. Petrov, V. B. Batoev, and S. Tanabe. “Accumulation features and temporal trends ofPCDDs, PCDFs and PCBs in Baikal seals (Pusa sibirica).” Environ. Pollut. 157 (2009):737–747.
37. Takasuga, T., K. Senthilkumar, T. Matsumura, K. Shiozaki, and S. I. Sakai. “Iso-tope dilution analysis of polychlorinated biphenyls (PCBs) in transformer oil and globalcommercial PCB formulations by high resolution gas chromatography–high resolutionmass spectrometry.” Chemosphere 62 (2006): 469–484.
38. U.S. EPA. 2006. “Polybrominated diphenyl ethers (PBDEs) project plan. Available:http://www.epa.gov/oppt/pbde/pubs/proj-lan32906a.pdf (accessed March 20, 2011).
39. Song, W., J. C. Ford, A. Li, W. J. Mills, D. R. Buckley, and K. J. Rockne. Environ.Sci. Technol. 38 (2004): 3286–3293.
40. Mariani, G., E. Canuti, J. Catro-Jimenez, E. H. Christoph, S. J. Eisenreich, and G.Hanke. “Atmospheric input of POPs into Lake Maggiore (Northern Italy): PBDE con-centrations and profile in air, precipitation, settling material and sediments.” Chemo-sphere 73 (2008): S114–S121.
41. Guzzella, L., C. Roscioli, and A. Binelli. “Contamination by polybrominateddiphenyl ethers of sediments from the Lake Maggiore basin (Italy and Switzerland).”Chemosphere 73 (2008): 1684–1691.
42. Boon, J. P., W. E. Lewis, M. R. Tjoen-a-Choy, C. R. Allchin, R. J. Law, J. Boer,C. C. Ten Hallers-Tjabbes, and B. N. Zegers. “Levels of polybrominated diphenylether(PBDE) flame retardants in animals representing different trophic levels of theNorth Sea food web.” Environ. Sci. Technol. 36 (2002): 4025–4032.
43. Sawal, G., B. Stachel, and P. Lepom. Polybrominated diphenyl ethers in sedimentsfrom the river Elbe, Germany. Proceedings of the Third International Workshop onBrominated Flame Retardants BFR 2004. Toronto, June 6–9, 2004, 2004, 151–154.
44. La Guardia, M. J., R. C. Hale, and E. Harvey, E.. “Detailed polybrominateddiphenyl ether (PBDE) congener composition of the widely used penta-, octa-, and deca-PBDE technical flame retardant mixtures.” Environ. Sci. Technol. 40(20) (2006): 6247–6254.
45. Barra, R., P. Popp, R. Quiroz, H. C. Treutler, A. Araneda, C. Bauer, and R. Urruti.“Polycyclic aromatic hydrocarbons fluxes during the past 50 years observed in datedsediment cores from Andean mountain lakes in central south Chile.” Ecotoxicol. Envi-ron. Safety 63 (2006): 52–60.
46. Catallo, W. J., R. P. Gambrell, and B. S. Shane. “Toxic chemicals and metals insediments from rural and industrialized Louisiana lakes: Recent historical profiles andtoxicological significance.” Environ. Sci. Technol. 29 (1995): 1436–1445.
47. Furlong, E., E. T. Cessar, and R. Hites. “Accumulation of polycyclic aromatic hy-drocarbons in acid sensitive lakes.” Geochim. Cosmochim. Acta. 51 (1987): 2965–2975.
48. Moon, D. H.. “A study for estimation of emissions and profile chracteristics of diox-ins, dioxin-like PCBs and PAHs by open burning, Ph.D. Thesis, Pukyong National Uni-versity, Busan 2007.
Dow
nloa
ded
by [
The
Uni
vers
ity O
f M
elbo
urne
Lib
rari
es]
at 2
3:49
16
Sept
embe
r 20
13

192 G. Ok et al.
49. Nisbet, C. and P. LaGoy. “Toxic equivalency factors (TEFs) for polycyclic aromatichydrocarbons (PAHs).” Reg. Toxicol. Pharmacol. 16 (1992): 290–300.
50. LaGoy, P. K. and T. C. Quirk. “Establishing generic remediation goals for thepolycyclic aromatic hydrocarbons: critical issues.” Environ. Health Perspect. 102 (1994):348–352.
51. Malcolm, H. M. and S. Dobson. “The calculation of an Environmental AssessmentLevel (EAL) for atmospheric PHAs based on relative potencies. (1994), 34. Contractreport to Her Majesty’s Inspectorate of Pollution.
52. Ok, G., D. H. Kim, J. S. Im, S. H. Lee, and H. K. Kim. “Release of PAHs throughrunoff from the Gwangan Bridge to the coast in Busan, Korea.” J. Polycycl. Arom. Comp.31(2) (2011): 110–122
53. Klimm, C., A. M. Hofmaier, K. W. Schramm, and A. Kettrup. “Using TEF conceptfor assessing toxic potency oh polycyclic aromatic hydrocarbons in industrial samples.”Organohal. Comp. 40 (1999): 39–42.
54. Eljarrat, E., J. Caixach, J. Rivera, M. D. Torres, and N. Ginebreda. “Toxic po-tency assessment of non- and mono-orth PCBs, PCDDs, PCDFs, and PAHs in North-west Mediterranean sediments (Catalonia, Spain).” Environ. Sci. Technol. 35 (2001):3589–3594.
Dow
nloa
ded
by [
The
Uni
vers
ity O
f M
elbo
urne
Lib
rari
es]
at 2
3:49
16
Sept
embe
r 20
13