Embed Size (px)
Citation preview

Characteristics of International Trade Intermediaries and Their
Location in the Supply Chain
Hale Utar∗†
Abstract
Wholesale trade firms and their role in international trade are examined using transaction and
firm level data sets from Denmark for the period 1998-2006. Compared to internationally trading
manufacturing firms, wholesale firms trading internationally are found to focus on fewer countries
with more products and lower unit values, and their involvement in international trade trans-
actions differ significantly across industries. Manufacturing industries with more competitive
structure, lower firm size, lower capital intensity, higher production fragmentation and lower ex-
port/import intensities are found to have higher wholesale share of export. The analysis shows
that export and import premia also exist among wholesale trade firms, which is in line with
the idea that these premia result from fixed costs of exporting/importing. Systematic differ-
ences between wholesale trade firms in intermediate goods markets versus in consumption goods
markets are also documented and found critical in understanding the role of intermediaries in
international trade. While in intermediate goods export wholesale trade firms’ unit prices are
found to be significantly higher than manufacturers unit prices of the same good, the opposite
holds true for consumption goods export. Wholesale trade firms that specialize in export of
intermediate goods are found to be more skill intensive and pay more in comparison to other
exporting wholesale trade firms. The wage premium for exporters of intermediate goods for pro-
fessional level occupations is robust to controlling for detailed firm and worker characteristics.
The results suggest that theories highlighting the potential roles of intermediaries should take
the intermediaries’ location in the supply chain into account.
∗Department of Economics, Bielefeld University. Email: [email protected], Phone: +49 521 106 4842 .†The analysis is conducted while the author visited the Labor Market Dynamics and Growth Center at Aarhus University. The
author is grateful to Henning Bunzel and the late Dale Mortensen for facilitating the access to the confidential data bases of the Statistics
Denmark and for their support. Support of The Cycles, Adjustment, and Policy research unit, CAP, and the School of Economics and
Business, Aarhus University are acknowledged with appreciation.
1 Introduction
Studies show that the export and import behavior of manufacturing firms are important
factors in improving industrial productivity as well as in technology and knowledge transfer
between firms and countries (Bernard et al., 2007). In this light, the significant presence
of intermediaries in manufacturing trade revealed by recently available customs data has
received well deserved academic attention. While previous economics and management liter-
ature on intermediaries emphasizes the potential roles of intermediaries in facilitating trade
between manufacturers and final consumers, recent literature that makes use of transaction-
level international trade data focus on the fixed costs saving nature of trade intermediaries
in export.
So far this literature treats the intermediation between two suppliers within the supply chain
and intermediation between producer and final consumer uniformly. This paper documents
empirical regularities in the role and significance of intermediaries in international trade
from a small, open, and advanced country and provides insight into the determinants of
intermediation in relation to product and industry characteristics in international trade. It is
also shown that characteristics of trade firms differ systematically depending on the location of
intermediation in the supply chain. To do that, transaction-level data from Danish customs,
which include detailed information on all export and import transactions, are matched with
firm-level accounting data that includes detailed business activity, sales, employment, capital,
investment and other firm-level expenditures for the years 1998-2006.
Wholesale trade firms sell any type of goods. They simplify flow of goods, payments and
information by acting as intermediaries between the manufacturer and the customer. The
share of trade transacted via the manufacturer or a wholesale trade company varies sub-
stantially between different product groups or industries. Between 1993 and 2006, wholesale
trade firms’ and manufacturers’ average share of imports are 57 % and 31 % respectively,
while their respective shares of export are 32 % and 54 % in Denmark.1 Intermediaries are
1These numbers are higher in comparison to the similar numbers from the US as reported by Bernard et
al. (2010) and China as reported by Ahn et al. (2011). For the year 2002, Bernard et al. (2010) reports the
value share of intermediaries in export as 10 % and in import as 42 %. The value share of intermediaries in
1

found to be more active in import than in export, but in both export and import there is
substantial heterogeneity in their involvement across industries. While the wholesale trade
share is found to be on average 90 % in leather export, its share is 20 % in plastics export
in Denmark.2 Crude analysis of the data shows that the room for intermediaries is big-
ger in non-manufactured products, such as farm products, as would be expected. But even
in the manufacturing sector intermediaries, and wholesale trade firms in particular, play a
significant role in export and import.3
To understand the relative concentration of wholesalers across manufacturing sectors in in-
ternational trade, manufacturing sector characteristics are linked with the wholesale trade
shares in those industries. Manufacturing industries with higher median firm size and capital
intensity exhibit higher export share of wholesale trade firms. The results are in line with
theories that relate fixed costs of exporting to the presence of wholesale trade firms.
As a measure of comparative advantage at the industry level, the number of manufacturing
firms is also found to be negatively associated with the presence of wholesale trade firms in
export and import. Manufacturing industries with more competitive structure are found to
have higher wholesale share of export. More specifically, controlling for firm and industry
size, the wholesale trade share in export is negatively associated with firms’ age and indus-
try concentrations indices, as measured by the Herfindahl-Hirschman index and the 4-firm
concentration index, and it is positively associated with entry and exit rates. The wholesale
trade share in export is also found to be higher in manufacturing industries where the degree
of production fragmentation is higher. In general the wholesale trade shares in export and
import at the industry level are found to be negatively correlated with the export and import
intensities of manufacturing firms. This finding points to the role of intermediaries as trade
facilitators.
Wholesale trade firms trading internationally are found to focus on fewer countries with more
export for the year 2002 for China is reported as 29 % in Ahn et al. (2011).2These statistics are average of data between 1993 and 2006.3The analysis focuses on wholesale trade firms, including export and import agents but excluding the retail
sector. Because of this focus, the terms ”intermediary” and ”wholesale” trade firms are used interchangeably
throughout the paper.
2

products and lower unit values, confirming that the Danish data exhibit stylized facts similar
to what has recently been highlighted on the role of wholesale trade firms in export and
import.
But this paper also highlights a number of new and interesting features about the wholesale
trade firms. First it shows that similar to manufacturing firms, wholesale trade firms that
export are bigger, more productive and more capital-intensive; they pay more and employ
more educated employees in comparison to non-exporters. Importing wholesale trade firms
also share most of these features, showing that both export and import premia exist also
among wholesale trade firms. These findings are in line with the idea that these premia
result from fixed costs associated with exporting/importing (Bernard et al., 2007).
Second, there are important differences among wholesale trade firms in their involvement in
international trade depending on the distance in the supply chain to the final consumers. In
consumption goods markets, wholesale trade firms are found to focus on fewer countries with
relatively more products in comparison to manufacturing firms. In intermediate goods mar-
kets, on the other hand, they are found to focus on products as well as countries. Comparing
unit prices after controlling for detailed products and countries reveal that while in consump-
tion goods export wholesale trade firms’ unit prices are significantly lower in comparison
to manufacturers’, their prices are significantly higher than manufacturers’ in intermediate
goods export. Similarly, in consumption goods import wholesale trade firms’ unit prices
found to be significantly lower but this is not the case in intermediate goods import.
Firm-level data also show that wholesale trade firms specializing in export of intermediate
goods are bigger than other exporting wholesale trade firms. Controlling for size, whole-
sale trade firms that specialize in export of intermediate goods are found to be more skill
intensive and pay more in comparison to other exporting wholesale trade firms. They are
not found to be significantly different in terms of capital-labor ratio, investment and labor
productivity. The wage premium for exporters of intermediate goods for professional level
occupations is robust to controlling for detailed firm and worker-level characteristics as well
as intensity of high-tech goods sales. Wholesale trade firms in intermediate goods markets
may be developing product specific knowledge. More demanding firm to firm communication
3
required in global production chains may be one reason behind this wage premium. These
results indicate that in order to understand the role of wholesale trade firms in international
trade it is important to consider their distance in the supply chain to the final consumers.
The presence of middlemen or intermediaries in markets, in general, is motivated by several
possible factors including adverse selection and moral hazard (Biglaiser (1993) and Biglaiser
and Friedman (1994)), and the existence of search and information frictions (Rubinstein and
Wolinsky (1987)). Biglaiser (1993) and Biglaiser and Friedman (1994) predict that inter-
mediaries sell higher quality products by acting as quality guarantor. The results presented
here suggest that such quality sorting may be more relevant considerations in explaining
intermediaries role in intermediate goods market compared to consumption goods markets.
Among the recent studies that use transaction level trade data, Bernard et al. (2010) highlight
a number of stylized facts about intermediaries engaging in international trade in the US
using data from 2002. This paper complements theirs by providing additional detail to the
understanding of the nature of intermediaries in international trade.
Ahn et al. (2011) and Akerman (2010) extend the heterogeneous trade model with intermedia-
tion technology. Their models predict that the share of trade handled through intermediaries
increases with fixed costs of exporting. Similarly Bernard et al. (2011) provide empirical
regularities on the relationship between intermediaries’ involvement in export and country
specific fixed and variable costs using Italian data. Using Colombian and Chilean matched
transaction data Blum et al. (2009) document that in a majority of exporter and importer
matches at least one of the parties is a large international trader and that more than half of
the Chilean exporters sell to a single Colombian importer. The authors then develop a model
with matching frictions that replicate these findings. Felbermayr and Jung (2011) and Tang
and Zhang (2012) on the other hand focus on hold-up problems to relate the country and
product characteristics to the presence of export intermediaries. Except for Felbermayr and
Jung (2011) and Tang and Zhang (2012), these papers do not look at the extent of interme-
diaries’ involvement across industries and products, which is the focus of this paper.4 But all
4Felbermayr and Jung (2011) approaches the presence of trade intermediaries in export as a firm boundary
problem. As in the spirit of Helpman et al. (2004) manufacturing firms face a trade off in their decision
to choose an export mode due to the lack of enforceable cross-country contracts. They can use their own
4

of these papers, including Felbermayr and Jung (2011) and Tang and Zhang (2012) uniquely
treat intermediation between two suppliers and intermediation between producer and final
consumer/retailers. The results presented in this paper show that empirical regularities may
show contrast depending on the location of intermediation in the supply chain. The theories
that highlight one or the other potential role of intermediaries should take these differences
into account.
The paper is organized as follows. Data sets used in this study are described in the next
section. Empirical analyses are presented in sections 3 to 5 followed by concluding remarks.
2 Data
The main data sets used in this study are transaction-level custom records and firm-level
accounting data sets from Denmark, but other supplemental micro and macro data sets are
also used, such as labor market surveys. This section summarizes the main data sets while
details e.g. variable constructions, information on the additional data sets, are presented in
the appendix.
The firm-level data set (business statistics data) is compiled from survey results of firms that
take part in an annual financial survey as well as from the annual tax reports, vat reports,
and annual reports from incorporated companies. Wholesale trade firms are included in
this data set starting from 1998. So the sample period used in this study is 1998-2006.
The general business statistics include only firms that employ at least 0.5 FTE (full-time
wholesale affiliate in the foreign country to avoid distortion due to hold up problem and incur fixed costs of
distribution or that they use a trade intermediary but then face lower export revenues. Their model predicts
productivity/quality sorting within industries similar to Ahn et al. (2011) and Akerman (2010). While their
focus is still on the country specific costs, their model predicts firms producing high quality products with
strong brand reputation are more likely to invest in distribution channels in foreign markets. Similarly Tang
and Zhang (2012) consider a hold up problem in a heterogenous firm framework where intermediaries provide
fixed cost saving technology. Due to distortions caused by hold up problem in quality verification efforts
necessary for foreign buyers leads relationship between quality differentiation and propensity to use export
intermediary. Their model predicts that the propensity to export via an intermediary decreases with vertical
differentiation while it increases with horizontal differentiation of the products.
5
equivalent employment) and/or have had an estimated earnings of a certain size. Earning
sizes are estimated differently for different industries. In the wholesale trade sectors, the lower
limit of earnings is typically 500,000 Danish Kroner, while in the manufacturing industry, it
ranges between 150,000 and 200,000 Danish Kroner. Table A-1 in the appendix provide
summary statistics for the wholesale trade firms.
International trade data are available at the transaction-level starting from 1993. They con-
tain firm id, the type of transaction (whether it is export or import), the value of transaction
in Danish Kroner, the name and the code of the partner country, the amount of the trans-
acted good, the unit of the amount, the name and the 8-digit combined nomenclature (CN)
code of the good as well as the year of the transaction. The details of this data set is given in
Pedersen (2009). For the years 1993-2006, firm id’s in the transactions data sets are matched
with the main industry affiliation of firms using supplemental data sets within Statistics Den-
mark. As a result of this match 89 % of the firm ids’ in the export data and 94 % of the firm
ids’ in the import data are matched with industry affiliations.
As wholesale firms specialize in logistics, marketing and distribution, they can be expected to
employ fewer employees than manufacturing firms. Fig. 1 shows the distribution of size (the
logarithm of employment and the logarithm of capital assets) among manufacturing firms
and among wholesale firms for the year 2000. From the figure it is apparent that wholesale
firms employ fewer employees in general and have lower level of capital assets.
Fig. 2 shows that wholesale trade firms on average sell more in comparison to the manu-
facturing firms, but, as one expects, their rate of value-added over sales is on average much
lower compared to manufacturing firms.
While wholesale trade firms employ less people, they pay more on average than manufacturing
firms as indicated by Table 1 and they also employ more educated employees.
6

0.1
.2.3
Den
sity
−5 0 5 10lnFTE
All MAN FirmsAll WHS Firms
Year=2000
Kernel Density Estimates: The Logarithm of Employment
0.0
5.1
.15
.2D
ensi
ty
0 5 10 15the logarithm of capital
All MAN FirmsAll WHS Firms
Year=2000
Kernel Density Estimates: The Logarithm of Capital
Fig. 1 Distribution of Employment and Capital among Manufacturing and Wholesale Firms (Values
are expressed in constant 2000 prices in thousand Danish Kroner. Source: Statistics Denmark)
WHS Firms MAN FirmsMean # of Obs Mean # of Obs
Value Added 8190.492 133527 14669.377 151770FTE 10.980 133527 22.623 151770Average Hourly Wage 0.182 106462 0.160 108185Professional Occupation Rate 0.184 128862 0.094 145879College Rate 0.171 106462 0.125 108185
Table 1 Wholesale and manufacturing firms’ characteristics. The sample period is 1998-2006. Values
are expressed in thousand 2000 Danish Kroner. FTE is the full-time equivalent number of
employees. Professional Occupation Rate is the ratio of employees with at least mid-level
occupations over the total number of employees. College Rate is the ratio of employees with
at least some college education over the total number of employees
3 Understanding Across Industry Distribution of Wholesale
Share
The share of trade transacted via manufacturers or wholesale trade companies varies sub-
stantially between different product groups or industries. Fig. 3 presents the average shares
of export/import transacted directly by manufacturers across broad product categories (CN
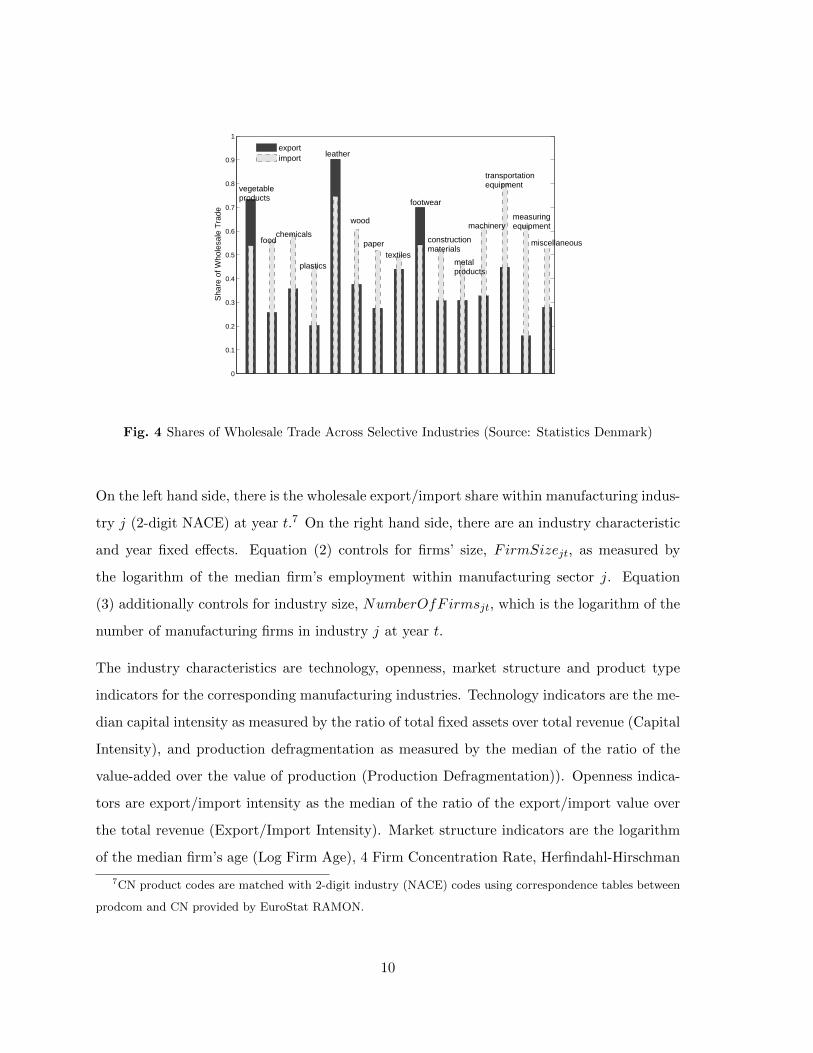
chapters) between 1993 and 2006. Fig. 4 presents the average shares of trade transacted via
7

0.0
5.1
.15
.2.2
5D
ensi
ty
0 5 10 15 20the logarithm of sales
All MAN FirmsAll WHS Firms
Year=2000
Kernel Density Estimates: The Logarithm of Sales
0.0
5.1
.15
.2.2
5D
ensi
ty
0 5 10 15 20the logarithm of value added
All MAN FirmsAll WHS Firms
Year=2000
Kernel Density Estimates: The Logarithm of Value Added
Fig. 2 Distribution of Sales and Value Added among Manufacturing and Wholesale Firms (Values are
expressed in constant 2000 prices in thousand Danish Kroner. Source: Statistics Denmark)
wholesale trade firms.5 In the appendix, Table A-2 presents the respective shares across all
broad product categories. Intermediaries are found to be more active in import than in export
(except vegetable products, fats and oils, leather, footwear, and arms and arts) but on both
sides there is also substantial heterogeneity across broad product categories. A higher share
of wholesale trade in import compared to export is expected as wholesaler involvement at
the later stages of the value chain is more likely due to the distribution and logistics services
they provide.
Very low shares of direct manufacturing export are observed in vegetable products and leather
coupled with proportionately high shares of wholesale trade in those product categories.
This is most probably because these categories contain non-manufactured products mostly
produced by farmers. What is most interesting is intermediaries’ significant involvement in
export of manufactured products (as also documented in Ahn et al. (2011) for China or
Bernard et al. (2010) for the US). Part of their involvement in export could be due to the
firm boundary issue that manufacturers of final products may prefer to outsource distribution
services and hence intermediaries export as part of their service in the distribution of the
products domestically and internationally. In Fig. 5, the wholesale shares in export are
shown separately for intermediate and consumption or final goods across broad product
5Most of the trade is conducted via manufacturer and wholesale trade firms, but retail firms as well as
other service firms are also present in international trade.
8

categories. The figure shows that intermediaries are more involved in final goods’ export
except in vegetable products, food, leather and construction materials all of which share the
property that they contain non-manufactured goods (farming and mining).
0
0.1
0.2
0.3
0.4
0.5
0.6
0.7
0.8S
hare
of D
irect
Tra
de
exportimport
vegetableproducts
food
chemicals
plastics
leather
wood
paper
textiles
footwear
constructionmaterials
metalproducts
machinery
transportationequipment
miscellaneous
measuringequipment
Fig. 3 Shares of Manufacturing Trade Across Selective Industries (Source: Statistics Denmark)
In order to relate (manufacturing) industry characteristics to the wholesale export and import
shares in that industry, the following industry-level equations are estimated:6
WHSjt = β0 + βa1IndustryCharacteristicjt +∑t
δYt Y eart + εjt (1)
WHSjt = β0 + βb1IndustryCharacteristicjt + β2FirmSizejt +∑t
δYt Y eart + εjt (2)
WHSjt = β0 + βc1IndustryCharacteristicjt + β2FirmSizejt + β3NumberOfFirmsjt
+∑t
δYt Y eart + εjt(3)
6Since the dependent variable is a share, the results are obtained using fractional logit model with robust
standard errors as suggested by Papke and Wooldridge (1996). The results are robust to transforming the
share variable as a logg-odds ratio and are available upon request.
9
0
0.1
0.2
0.3
0.4
0.5
0.6
0.7
0.8
0.9
1
Sha
re o
f Who
lesa
le T
rade
exportimport
vegetableproducts
wood
paper miscellaneous
textiles
chemicalsfood
plastics
leather
constructionmaterials
metalproducts
machinery
transportationequipment
measuringequipment
footwear
Fig. 4 Shares of Wholesale Trade Across Selective Industries (Source: Statistics Denmark)
On the left hand side, there is the wholesale export/import share within manufacturing indus-
try j (2-digit NACE) at year t.7 On the right hand side, there are an industry characteristic
and year fixed effects. Equation (2) controls for firms’ size, FirmSizejt, as measured by
the logarithm of the median firm’s employment within manufacturing sector j. Equation
(3) additionally controls for industry size, NumberOfFirmsjt, which is the logarithm of the
number of manufacturing firms in industry j at year t.
The industry characteristics are technology, openness, market structure and product type
indicators for the corresponding manufacturing industries. Technology indicators are the me-
dian capital intensity as measured by the ratio of total fixed assets over total revenue (Capital
Intensity), and production defragmentation as measured by the median of the ratio of the
value-added over the value of production (Production Defragmentation)). Openness indica-
tors are export/import intensity as the median of the ratio of the export/import value over
the total revenue (Export/Import Intensity). Market structure indicators are the logarithm
of the median firm’s age (Log Firm Age), 4 Firm Concentration Rate, Herfindahl-Hirschman
7CN product codes are matched with 2-digit industry (NACE) codes using correspondence tables between
prodcom and CN provided by EuroStat RAMON.
10

0
0.1
0.2
0.3
0.4
0.5
0.6
0.7
0.8
0.9
1
Sha
re o
f Who
lesa
le E
xpor
t
intermediateconsumption
vegetableproducts footwear
plastics
chemicals
food
leather
wood
paper
textiles
constructionmaterials
metalproducts
machinerytransportationequipment
miscellaneous
measuringequipment
Fig. 5 Shares of Export By Wholesale Traders Across Intermediate and Consumption Goods Within
Industries (Source: Statistics Denmark)
Index (HHI), and finally Entry and Exit Rates.8
Table 2 reports estimates of βa1 , βb1, and βc1 in equations (1) to (3) for export and Table 3
reports the same estimates for import.
The results on export as reported in Table 2 show that the wholesale share in export is
negatively correlated with the number of manufacturing firms and the median firm-level
employment in that industry. These findings are intuitive: Bigger firms or firms in industries
with higher comparative advantage (as indicated by the number of producing firms) are more
likely to pay the sunk entry costs of exporting a la Melitz (2003) and export directly rather
than through wholesale trade firms.9 In relatively big industries manufacturing firms may
also have more opportunity to learn from each other about potential export opportunities.
Capital intensity, and production (de)fragmentation are found to be negatively associated
with the wholesale share in export. This holds true even after controlling for the median
8The median industry characteristics are calculated using firm-level data on the manufacturing industry
between 1998 and 2006. Herfindahl-Hirschman Indices and 4-firm concentration indices are calculated by
taking both domestic and foreign sales into account.9Recent studies emphasize a role of intermediaries as reducing fixed costs of exporting, e.g. Akerman
(2010), Ahn et al. (2011), and Tang and Zhang (2012).
11

β̂a1 β̂b
1 β̂c1
NumberOfFirms −0.108* −0.319***FirmSize −0.239*** −0.471***Capital Intensity −3.611*** −3.656*** −1.765**Production Defragmentation −6.223*** −5.549*** −3.705***Export Intensity −3.881*** −1.309 −4.837***Import Intensity −3.830*** −0.696 −7.668***
Market StructureLog Firm Age −0.871** −0.652* −1.013***4 Firm Concentration Rate 0.007* 0.012*** −0.011**Herfindahl-Hirschman Index −0.000 0.000 −0.000***Entry Rate 8.260*** 6.655*** 5.478***Exit Rate 7.768*** 6.774*** 4.035*
Table 2 Wholesale share in export and industry characteristics. The results are obtained using the
generalized linear model with binomial family, logit link and robust standard errors. The
number of observations in all regressions is 195. The sample period is 1998-2006. ∗, ∗∗ and
∗∗∗ indicate significance at the 10 %, 5% and 1% levels respectively
(manufacturing) firm size and the number of (manufacturing) firms as well. Manufacturers
may prefer to control distributional channels as a part of brand and product differentiation
(Dent (2008)) especially for industries that exhibit increasing returns to scale or industries
with lower degree of production fragmentation.10 Negative relationships between export and
import intensities and wholesale trade share in export are in line with the trade facilitator
role of traders where export and import are relatively rare activities.
The wholesale trade share in export is also found to be higher in more competitive industries
as indicated by negative and significant coefficient estimates of the concentration indices
(HHI and 4-firm) and firms’ age and positive and significant coefficients of entry and exit
rates of manufacturing firms. Lower entry barriers in more competitive industries must allow
small and young firms to operate easily and these firms are more likely to export through
intermediaries. Concentration of industries may also be driven by increasing returns at the
firm level so firms may be less likely to outsource distribution services in less competitive
10A company with a high level of brand recognition may be hurt by using the same distribution channels as
used for cheaper generic products. Consider a product with a highly advertised specific function sold together
with a cheaper alternative. The distributors may extract higher profit margin from the cheaper alternative
by selling it together with the expensive one so that they can get a price which is close to the price of the
expensive one.
12

industries.
Table 3 presents the results for import. As in export, the wholesale import share is negatively
related with the number of manufacturing firms operating in the industry and the median
firm size, although the size effect is not found to be as important as in export. While all
other characteristics have the same signs as in export, some such as median capital intensity,
median firm’s age, entry and exit rates are not found to be significantly correlated with the
wholesale import share. A weaker relationship between the share of wholesale import and
manufacturing characteristics is expected since the manufacturing industry constitutes only
part of the customers of the import traders as the import traders also import for retail and
service sectors.
β̂a1 β̂b
1 β̂c1
NumberOfFirms −0.089* −0.139***FirmSize −0.005 −0.114*Capital Intensity −1.409* −1.408* −0.663Production Defragmentation −2.998*** −3.237*** −2.598**Export Intensity −2.086*** −3.165*** −4.762***Import Intensity −1.078 −1.875 −5.264**
Market StructureLog Firm Age 0.126 0.144 −0.0174 Firm Concentration Rate 0.002 0.003 −0.012**Herfindahl-Hirschman Index 0.000 0.000 −0.000*Entry Rate 1.511 1.829 1.603Exit Rate 2.051 2.637* 1.532
Table 3 Wholesale share in import and industry characteristics. The results are obtained using the
generalized linear model with binomial family, logit link and robust standard errors. The
number of observations in all regressions is 195. The sample period is 1998-2006. ∗, ∗∗ and
∗∗∗ indicate significance at the 10 %, 5% and 1% levels respectively
13

4 Comparing Manufacturing and Wholesale Trade Firms in
International Trade
4.1 Firm-level Differences
Table 4 reports that on average wholesale trade firms export ten 8-digit products, while man-
ufacturing firms export eight products during the 1998-2006 period. Wholesale trade firms
export to on average 4.5 countries while manufacturing firms export to 7.4 countries. That is,
wholesale exporters export more products to less countries in comparison to manufacturing
firms. This also holds true for imports, but to a lesser extent.
WHS Firms MAN Firms
Mean # of Obs Mean # of Obs
Number of Exported Products 10.005 63794 8.013 45147
Number of Export Countries 4.547 63794 7.413 45147
Number of Imported Products 18.130 83783 15.032 44596
Number of Import Countries 5.013 83783 6.113 44596
Table 4 Manufacturing and wholesale trade firms in international trade. International trade data
set that is matched with industry classifications is used. The sample period is 1998-2006.
Products are defined at the 8-digit CN level
To examine differences between wholesale intermediaries and manufacturing firms engaging
in international trade within broad product categories, equation (4) is estimated separately
with export and import transaction data aggregated at the firm-level.
xit = βWH0 + βWH
1 I(WHit) +∑t
δtY eart +∑it
γitIndustryit + εit (4)
where I(WHit) is an indicator whether firm i is an wholesale trade firm, and xit denotes
characteristics (in logarithm) of firm i at period t: value of export/import, average price of
exports/imports, the number of products exported/imported, the number of countries, the
number of export/import transactions, and the number of years in the export/import market.
The sample only includes firms that are identified by manufacturer or wholesale trade firms
so the estimates of βWH1 indicate the percentage difference in the characteristics for wholesale
14
trade firms in comparison to manufacturing firms after controlling for industry and year fixed
effects.11
The results for export and import are presented in column (a) and in column (b) of Table
5 respectively. Starting from export, the results show that wholesale trade firms’ export is
about 80 % less in comparison to manufacturing firms’ exports, they sell to a smaller number
of countries (relative country focus); on the other hand they sell about 6.3 % more products
and they are shorter lived in the export market. Wholesale trade firms do not seem to have
significant price differences at the firm level in comparison to manufacturing firms. In column
(b) the results show that the value of import is about 28 % more than the manufacturers’
imports, they import more products (about 9 %), their prices are lower, and they buy from
a smaller number of countries (13.8 %). Finally wholesale importers are also found to be 8.3
% less tenured in the import market in comparison to manufacturer importers. The results
indicate focus on country more than product as well as shorter tenure in the international
markets are common properties of both export and import traders.
In order to gain insights into potentially distinct roles of intermediaries in consumption and
intermediate goods markets, equation (4) is also estimated separately among intermediate
and consumption goods.12 To do that, before aggregating the transaction data at the firm-
level, only transactions with either intermediate or consumption goods are kept in the sample.
The results are presented at the lower panels of Table 5.
The result show that relative country focus among wholesale traders holds true whether we
look at intermediate goods or consumption goods trade. But the number of exported/imported
intermediate products is found to be smaller among traders in both export and import com-
pared to manufacturers, indicating that intermediate goods traders may be building product
specific knowledge. This seems not to be the case for consumption goods traders. The av-
erage price of intermediate goods exporters is found to be higher (9.2 %) in comparison to
manufacturer exporters’ prices. There is no statistically significant difference found between
11Industry dummy controls for broad product category of a firm as defined by CN Chapters. It does not
indicate whether a firm is a manufacturer or trader of these products. CN Chapters are listed in Table A-2 in
the appendix.12Intermediate and consumption goods classification is based on BEC Rev. 3. See the appendix for details.
15

wholesalers and manufacturers’ prices in consumption goods export. Only broad product cat-
egories are controlled for in these regressions so the price differences are expected to contain
differences in the type and quality of the products as well. This will be taken into account
in the next analysis below.
4.2 Unit Price Differences
This section presents an analysis to understand if there is any systematic differences in the
unit prices of goods transacted by intermediaries versus manufacturers. On the one hand,
manufacturing firms may be able to extract more surplus and so charge a higher price by
controlling distributional channels.13 Models with productivity sorting with fixed costs of
exporting on the other hand, predict higher unit prices for wholesale trade exporters. Inter-
mediation, in general, may result in double marginalization if the markets are not competitive
or intermediaries may have a value creating role by providing additional services.14
ln(pifc) = γ0 + γ1I(W ) + γ2I(R) +∑ic
λic(Producti × Countryc) + εifc (5)
Here pifc is the unit price of the good i (at CN-8 digit) imported/exported from/to country
c by firm f . I(W ) and I(R) are wholesaler and retailer dummies respectively.
To see if there is any systematic difference for unit price differential between wholesaler and
manufacturer depending on the type of goods they transact, the wholesaler dummy is also
interacted with an intermediate good indicator, I(IG), as below.
ln(pifc) = γ0 + γ1I(W ) + γ2I(R) + γ3 ∗ I(W ) ∗ I(IG)+∑ic
λic(Producti × Countryc) + εifc(6)
13Dent (2008) emphasizes that routes to market may involve product/brand differentiation. Models of hold-
up predict that manufacturing firms producing higher quality choose to export directly. See for example, Tang
and Zhang (2012).14The models with adverse selection (e.g. Biglaiser (1993)) predict that intermediaries on average sell higher
quality products, and their average prices are higher.
16

Tables 6 and 7 show unit price differentials between intermediaries and manufacturers for
the period 1998 through 2006 for export and import respectively. In these regressions the
sample only includes transactions that are conducted via either manufacturing, wholesale
or retailer companies excluding other types of firms such as business service firms. So the
estimate of γ1 in equation (5) indicates a unit price differential for wholesalers in comparison
to manufacturing companies after controlling for 8-digit product by country fixed effects in
a given year.
The results show that wholesalers’ price is on average lower compared to manufacturers, both
in export and in import after controlling for detailed product (CN-8 digit) by country fixed
effects. In export, the difference is not always significant and the F statistics are low before
2002. However, when the intermediate good dummy is interacted with the wholesale dummy,
F statistics grow sizably and estimates of γ1 become significant at the 1 % level. Estimates of
γ3, on the other hand are always positive and significant at the 1 % level. In 1998 wholesale
prices are found to be on average about 2.9 % lower than manufacturers’ prices regardless of
the type of goods. But when one controls for intermediate goods, wholesalers’ prices are found
to be 9.3 % lower, while prices of intermediate goods of wholesalers are found to be about
7 % higher than manufacturers’ intermediate goods’ prices.15 The findings are very similar
across all the years, suggesting that wholesalers’ involvement in export in intermediate and
consumption goods markets respectively have important distinctions. These results are quite
different from Ahn et al. (2011) where intermediaries’ unit prices are shown to be higher than
manufacturers’ in China.16 Bernard et al. (2009), on the other hand, show wholesale traders’
unit prices on average lower than manufacturers. The results presented here for Denmark
are in line with Bernard et al. (2010). But none of these studies look at the intermediate
and consumption goods markets separately. Doing that, results show that the unit price
15Separate estimation of equation (5) among intermediate and consumption goods also confirm these find-
ings. They are available upon request.16Ahn et al. (2011) control for the size as measured by employment when analyzing unit price differences
between manufacturers and intermediaries. Since wholesale trade firms are significantly smaller in terms of
employment than manufacturers, one expects upward bias on the coefficients for unit prices of intermediaries
they find. The different results obtained with Denmark as opposed to China may also be due to (potentially)
higher share of intermediate goods in Chinese export data.
17

differential between wholesalers and manufacturers in general depend on type of the goods,
intermediate versus consumption. While unit prices of exporting wholesale companies are
found to be lower in general compared to manufacturers’ prices, their prices are found to be
significantly higher for intermediate goods.
The results for import presented in Table 7 show that retailers’ unit prices are significantly
higher in comparison to manufacturers, probably indicating their closer distance to the final
customers. The prices of wholesalers are also found to be lower in general. Wholesalers that
import intermediate goods on the other hand are not found to have significantly lower prices
in comparison to manufacturers’ unit prices.
The models with adverse selection (Biglaiser (1993)) predict that intermediaries on average
sell higher quality products, and their average prices are higher. The results here suggest a
possibility of adverse selection problems in the intermediate goods markets. The differences
in market structure of intermediaries in intermediate and consumption goods markets may
also result in differences in prices as the possibility of double marginalization depends on
competitiveness of the markets. Tables A-4 to A-5 show that concentration patterns are also
different for wholesalers and manufacturers across these two different types of products. While
concentration patterns of wholesale trade firms and manufacturers are similar in general (A-
3); wholesale trade firms’ concentration is higher in intermediate goods while manufacturers
concentration is especially higher in consumption goods.
These results suggest hold-up problems that give rise to quality sorting of goods traded
between manufacturers and wholesale traders may be more relevant in the consumption goods
markets, while information frictions that give rise to adverse selection may be more important
in the intermediate goods markets. These results overall suggest that in understanding the
role of intermediaries in international trade it is critical to take explicit consideration of their
location in the supply chain into account.
18
5 Export and Import Premia Among Wholesale Traders
International trade literature emphasizes the importance of export and import behavior in
manufacturing firms’ performances (Bernard et al. (2007)). There is a large literature on
the sources of export premia among manufacturing firms. The two competing hypotheses
are whether export premia are due to self-selection of more productive firms into export
markets or whether they are due to learning by exporting, which is often thought to happen
via the buyer supplier link that foreign buyers actively or passively channel knowledge to the
local suppliers. One implicit assumption mostly made to motivate the learning by exporting
hypothesis is that knowledge is channeled into manufacturing processes. To further this
understanding it is important to see whether similar export and import premia also exist
among wholesale trade firms as these firms do not manufacture, so no such learning can drive
possible premia.
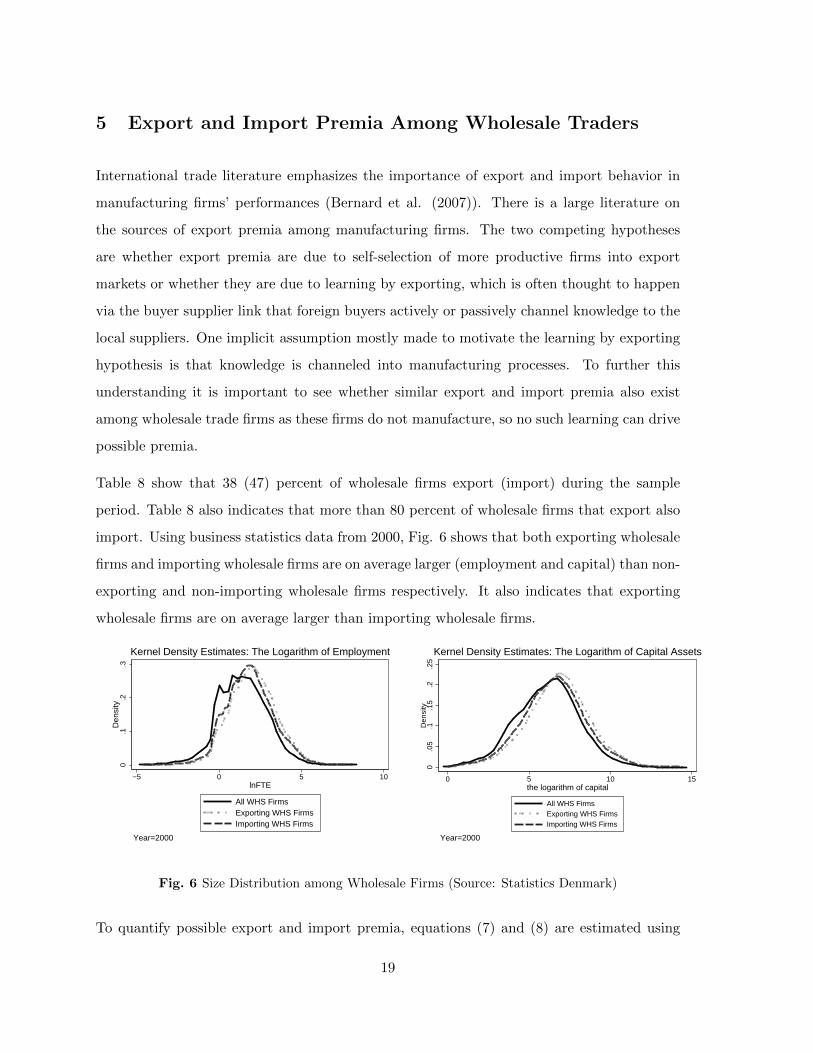
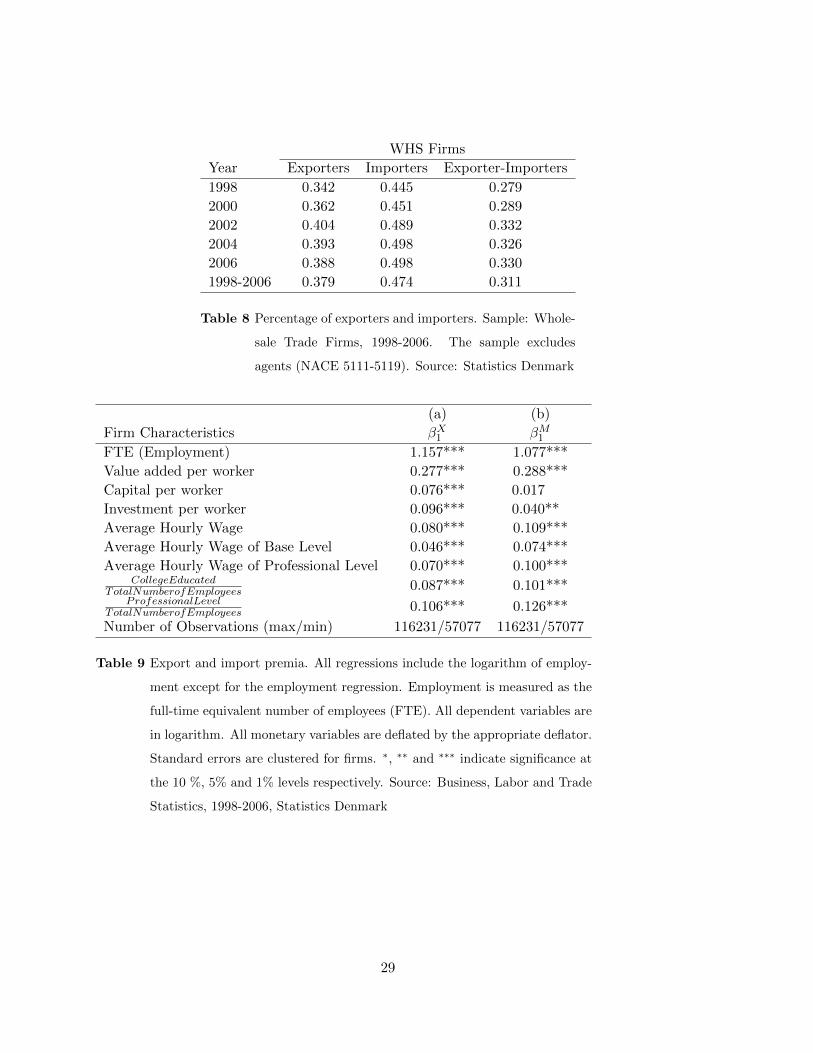
Table 8 show that 38 (47) percent of wholesale firms export (import) during the sample
period. Table 8 also indicates that more than 80 percent of wholesale firms that export also
import. Using business statistics data from 2000, Fig. 6 shows that both exporting wholesale
firms and importing wholesale firms are on average larger (employment and capital) than non-
exporting and non-importing wholesale firms respectively. It also indicates that exporting
wholesale firms are on average larger than importing wholesale firms.
0.1
.2.3
Den
sity
−5 0 5 10lnFTE
All WHS FirmsExporting WHS FirmsImporting WHS Firms
Year=2000
Kernel Density Estimates: The Logarithm of Employment
0.0
5.1
.15
.2.2
5D
ensi
ty
0 5 10 15the logarithm of capital
All WHS FirmsExporting WHS FirmsImporting WHS Firms
Year=2000
Kernel Density Estimates: The Logarithm of Capital Assets
Fig. 6 Size Distribution among Wholesale Firms (Source: Statistics Denmark)
To quantify possible export and import premia, equations (7) and (8) are estimated using
19
business statistics data for the wholesale trade firms for 1998-2006.
xijt = βX0 + βX1 I(XPijt) + βX2 lnFTEijt +∑j
ηjIndustryj +∑t
δtY eart + εijt (7)
xijt = βM0 + βM1 I(MPijt) + βM2 lnFTEijt +∑j
ηjIndustryj +∑t
δtY eart + εijt (8)
In these equations xijt denotes characteristics of wholesale trade firm i at period t in indus-
try j in logarithm, lnFTE is the logarithm of the full-time equivalent number of employees,
I(XPijt) is an export dummy and I(MPijt) is an import dummy. 4-digit industry and year
dummies are also included. The coefficient β1 indicates the percentage differences in the rele-
vant firm characteristics controlling for size (measured by the number of employees), industry
and time effects. The first column of Table 9 reports the differences between exporters and
non-exporters among wholesale trade firms and the second column reports the differences
between importers and non-importers among wholesale trade firms.
The results show that both export and import premia exist among wholesale trade firms.
More specifically exporting wholesale trade firms are larger, they pay higher wages (8 %),
and invest more (9.6 %). Their technology is relatively more capital intensive (7.6 %) and they
have higher labor productivity (27.7 %) and employ more skill intensive employees. Similar
differences also hold between importers and non-importers except for the capital intensity.
These results are in line with the sunk costs driven self-selection hypothesis.
The previous analysis revealed that export intermediaries that focus on intermediate goods
charge higher prices on average in comparison to manufacturers. To see if export premia also
change depending on the location of the intermediaries in the supply chain, equations (9) and
(10) are estimated among wholesale trade exporters.
xijt = βI0 + βI1IGIntensityijt + βI2 lnFTEijt +∑j
ηjIndustryj +∑t
δtY eart + εijt (9)
20
xijt = βC0 + βC1 CGIntensityijt + βC2 lnFTEijt +∑j
ηjIndustryj +∑t
δtY eart + εijt (10)
IGIntensityijt is the ratio of exported intermediate goods over the total number of exported
goods by wholesale trade firm i in industry j at year t. Similarly, CGIntensityijt is the ratio
of exported consumption goods over the total number of exported goods by wholesale trade
firm i in industry j at year t.17
The results in Table 10 show that wholesale trade exporters that specialize in exporting
intermediate goods instead of consumption goods are larger on average. But after controlling
for size, there are no significant differences found between wholesale exporters in intermediate
goods versus in consumption goods in terms of labor productivity, capital labor ratios and
investment intensity.
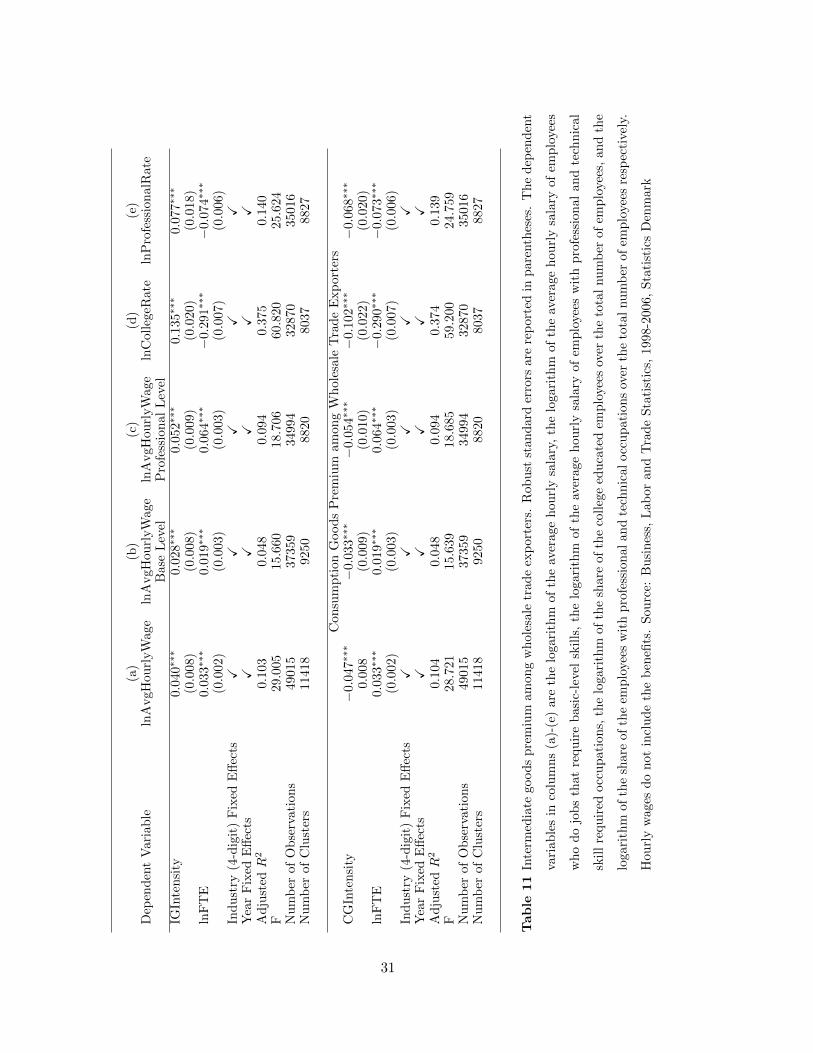
Table 11 reports intermediate goods premia in employee wages and characteristics. After
controlling for firm employment, there are significant differences in employee characteristics
and wages between wholesale trade exporters depending on their location in the supply chain.
Wholesale firms that export intermediate goods employ significantly more skill-intensive em-
ployees. This is manifested in a significantly higher ratio of employees with college education
as well as a higher ratio of employees with professional level of occupations. They also pay
higher wages. The coefficients in columns 2 and 3 in Table 11 indicate that one standard
deviation increase in the intermediate goods intensity is associated with 0.030 and 0.053 stan-
dard deviation increases in average hourly wages of basic level employees and of professional
level employees respectively.
To see if the wage premium can be explained by firm and labor characteristics, firm controls
and worker characteristics at the firm level are added. The firm controls are whether a firm
is single-plant, whether it is a proprietorship and firm’s age. The worker characteristics are
female employee ratio, college rate, average tenure of employees and a quadratic term of
17The sets of intermediate and consumption goods are not exhaustive. First, the definition of intermediate
goods do not include fuels and lubricants, second there are also capital and non-classified goods. Hence two
equations, one with intermediate goods intensity and the other with consumption goods intensity are estimated
instead of one.
21
average tenure of employees.18 The results in Table 12 show that the premium of the overall
average hourly wage and the average hourly wage of basic level employees can be explained
by firm and worker characteristics. The average hourly wage of professional employees is still
found to be significantly higher with the intensity of intermediate goods. High-tech good
intensity is added as an additional control in Table 13 but the results are not affected. The
coefficients of high-tech good intensity are found to be positive and significant indicating an
additional wage premium associated with high tech goods.
So wholesale trade firms that export intermediate goods employ more educated employees
and pay them proportionately more. The higher average hourly wages of basic level employees
can be explained by firm and employee characteristics. But even after controlling for these
factors as well as intensity of high-tech goods sales, average hourly wages of professional level
employees are still found to be positively associated with the intermediate goods intensity.
This could be due to communication requirements for intermediate goods which increases the
need for professional level functions.
6 Concluding Remarks
I examine the presence of intermediaries in international trade using data from a small, open
and advanced country, Denmark. A number of stylized facts about the wholesale trade firms
are highlighted to understand the role of these firms and distribution channels in international
trade in general.
Wholesale trade firms are found to employ fewer but more educated employees than manufac-
turing firms. They sell more but generate lower value-added. They are more likely to engage
in import than in export but those wholesale trade firms that import are more likely to export
as well. In general, they are found to focus on fewer countries with more products in com-
parison to manufacturing firms. Their share of export and import are found to be higher in
manufacturing industries with lower export and import intensities and with higher degree of
18Empirical studies analyzing the impact of tenure on earnings usually find positive effect at a diminishing
rate.
22

production fragmentation. Manufacturing industries with less market concentration, higher
entry and exit rates and lower median firm age are found to exhibit higher export share of
wholesale trade firms. Manufacturing industries with lower firm size and capital intensity
are also found to have higher export share of wholesale trade firms, confirming theories that
relate fixed costs of exporting to the presence of export intermediaries.
Characteristics of wholesale trade firms in international trade are shown to differ depending
on whether they trade consumption goods or intermediate goods, trade in the latter of which
has been growing steadily over the last decades due to internationalization of production and
increasing outsourcing. Particularly, while wholesale traders in general command lower unit
prices in international trade than manufacturers, exporting wholesale traders of intermediate
goods command higher unit prices.
Both export and import premia exist also among wholesale trade firms. The results show
that exporting wholesale firms are significantly larger, more capital and skill intensive in
comparison to non-exporting wholesale trade firms, they pay higher wages and they are more
productive. Similar differences also exist between importers and non-importers. Among
trade exporters, firms that specialize in intermediate goods are found to have additional pre-
mia. They are found to be bigger, more skill-intensive both in terms of employees’ education
levels and in occupation characteristics and pay higher wages in comparison to other export-
ing wholesale traders. The wage premium for professional occupations remains even after
controlling for detailed firm and worker level characteristics.
In existing literature intermediaries are treated uniformly regardless of their location in the
supply chain. In this paper I show that wholesale trade exporters differ systematically de-
pending on whether they function in intermediate or consumption goods markets. The results
suggest that when analyzing the role of intermediaries, attention should be given to whether
the goods in question are consumption goods or intermediate goods.
23

References
[1] Ahn, JaeBin, Amit K. Khandelwal, and Shang-Jin Wei (2011), “The Role of Intermedi-
aries in Facilitating Trade”, Journal of International Economics, 84(1), p. 73-85
[2] Akerman, Anders (2010), “A Theory on the Role of Wholesalers in International Trade
based on Economies of Scope”, Research Papers in Economics 2010:1, Stockholm Uni-
versity, Department of Economics.
[3] Bernard, Andrew B., Bradford Jensen, Stephen J. Redding, and Peter K. Schott (2010),
“Wholesalers and Retailers in U.S. Trade”, American Economic Review Papers and
Procveedings, 100, p. 408-413
[4] Bernard, Andrew B., Bradford Jensen, Stephen J. Redding, and Peter K. Schott (2007),
“Firms in International Trade”, Journal of Economic Perspectives, 21(3), p. 105-130.
[5] Bernard, Andrew B., Marco Grazzi, and Chiara Tomasi (2011), “Intermediaries in In-
ternational Trade: Direct versus Indirect Modes of Export”, NBER Working Paper No.
17711
[6] Biglaiser, Gary (1993), “Middlemen as Experts”, Rand Journal of Economics, Vol. 24,
No. 2, Summer 1993, p. 212-223.
[7] Biglaiser, Gary and James Friedman (1994), “Middlemen as Guarantors of Quality”,
International Journal of Industrial Organization, Vol. 12, p. 509-531.
[8] Blum, Bernardo, Sebastian Claro and Ignatius Horstmann (2009), “Intermediation and
the Nature of Trade Costs: Theory and Evidence”, working paper, University of Toronto.
[9] Dent, Julien, (2008), Distribution Channels: Understanding and Managing the Channels
to Market, Kogan Page Limimited.
[10] Felbermayr, Gabriel and Benjamin Jung (2011), “Trade Intermediation and the Orga-
nization of Exporters”, Review of International Economics 19(4), p. 634-648
[11] Helpman, Elhanan, Marc Melitz, and Stephen Yeaple (2014), “Export versus FDI with
heterogeneous firms”, American Economic Review, 94(1), p. 300-316.
24
[12] Loschky, Alexander (2008), “Reviewing the Nomenclature for High-Technology Trade
– The Sectoral Approach”, Paper presented at the 1st Meeting of the OECD Working
Party on International Trade in Goods and Trade in Services Statistics (WPTGS), 22-24
September 2008 in Paris.
[13] Melitz, M. (2003), “The Impact of Trade on Intra-Industry Reallocations and Aggregate
Industry Productivity,” Econometrica 71, p. 1695-1725.
[14] Papke, Leslie E. and Jeffrey M. Wooldridge (1996), “Econometric Methods For Fractional
Response Variables With An Application To 401(K) Plan Participation Rates”, Journal
of Applied Econometrics, Vol. 11, p. 619-632.
[15] Pedersen, Niels (2009), Essays in International Trade. Ph.D. dissertation, Northwestern
University, Evanston, Illinois.
[16] Rubinstein, Ariel and Asher Wolinsky (1987), “Middlemen”, The Quarterly Journal of
Economics, 102(3), p. 581-593.
[17] Rauch, James E. (1999), “Network versus Markets in International Trade”, Journal of
International Economics, Vol.48, pp.7-35.
[18] Tang, Heiwai and Yifan Zhang (2012), “Quality Differentiation and Trade Intermedia-
tion”, working paper, Tufts University.
[19] Utar, Hale (2014), “When the Floodgates Open : Northern Firms’ Response to Removal
of Trade Quotas on Chinese Goods”, American Economic Journal: Applied Economics,
6(4): 226-250.
25

7 Tables and Figures
7.1 Tables
(a) (b)Firm Characteristics Export Import
βWH1 βWH
1
Log Export-Import Value −0.806*** 0.281***Log Weighted Average Price 0.010 −0.101***Log Number of Products 0.063*** 0.091***Log Number of Countries −0.304*** −0.138***Log Number of Transactions −0.158*** 0.083***Log Number of Years Export/Import −0.104*** −0.083***
Number of Observations (min/max) 108272/108855 127541/128375Intermediate Goods TradeLog Export-Import Value −0.961*** −0.224***Log Weighted Average Price 0.076** 0.005Log Number of Products −0.037* −0.046*Log Number of Countries −0.330*** −0.152***Log Number of Transactions −0.252*** −0.043*Log Number of Years Export/Import −0.112*** −0.077***
Number of Observations (min/max) 76030/76040 97933/97939Consumption Goods TradeLog Export-Import Value −0.504*** −0.044Log Weighted Average Price −0.014 −0.021Log Number of Products 0.150*** 0.101***Log Number of Countries −0.208*** −0.151***Log Number of Transactions −0.039 0.011Log Number of Years Export/Import −0.084*** −0.102***
Number of Observations (min/max) 61810/63513 90030/93003
Table 5 Firm characteristics in international trade. Robust standard errors,
that are clustered for firms, are reported in parentheses. A constant
term is included but not reported. All regressions include industry
and year fixed effects. Industry is defined as a broad product cat-
egory (CN Chapter) of a firm’s activity. The sample only includes
wholesale trade firms and manufacturers between 1998 and 2006.
Value shares are used as weights in calculating firm-level average
price
26

YE
AR
1998
1998
1999
1999
2000
2000
2001
2001
2002
Var
iab
les
Log
Pri
ceL
og
Pri
ceL
og
Pri
ceL
og
Pri
ceL
og
Pri
ceL
og
Pri
ceL
og
Pri
ceL
og
Pri
ceL
og
Pri
ce
Wh
oles
aler
Du
mm
y(I
(W))
-0.0
29**
-0.0
93***
-0.0
12
-0.0
74***
-0.0
13
-0.0
77***
0.0
07
-0.0
65***
-0.0
15
(0.0
11)
(0.0
16)
(0.0
11)
(0.0
16)
(0.0
10)
(0.0
14)
(0.0
09)
(0.0
12)
(0.0
08)
Ret
aile
rD
um
my
(I(R
))-0
.036
-0.0
65
-0.0
54
-0.0
83*
-0.0
32
-0.0
62
0.0
46
0.0
14
-0.1
28***
(0.0
33)
(0.0
35)
(0.0
39)
(0.0
41)
(0.0
33)
(0.0
34)
(0.0
30)
(0.0
31)
(0.0
23)
Wh
oles
aler
*Inte
rmed
iate
Good
0.161***
0.1
58***
0.1
69***
0.1
86***
(0.0
21)
(0.0
20)
(0.0
19)
(0.0
18)
Pro
du
ctB
yM
arke
tF
ixed
Eff
ect
yes
yes
yes
yes
yes
yes
yes
yes
yes
Nu
mb
erof
obse
rvat
ion
1886
18188618
199497
199497
214210
214210
240978
240978
311288
Nu
mb
erof
clu
ster
s77
636
77636
80017
80017
82738
82738
88459
88459
105627
F3.
823.6
1.0
21.7
0.9
28.4
1.2
44.4
17.6
YE
AR
2002
2003
2003
2004
2004
2005
2005
2006
2006
Var
iab
les
Log
Pri
ceL
og
Pri
ceL
og
Pri
ceL
og
Pri
ceL
og
Pri
ceL
og
Pri
ceL
og
Pri
ceL
og
Pri
ceL
og
Pri
ce
Wh
oles
aler
Du
mm
y(I
(W))
-0.0
62**
*-0
.069***
-0.1
42***
-0.0
81***
-0.1
53***
-0.1
32***
-0.2
14***
-0.0
92***
-0.2
01***
(0.0
11)
(0.0
08)
(0.0
10)
(0.0
06)
(0.0
07)
(0.0
06)
(0.0
07)
(0.0
07)
(0.0
09)
Ret
aile
rD
um
my
(I(R
))-0
.145
***
-0.1
29***
-0.1
53***
-0.0
48**
-0.0
75***
-0.4
17***
-0.4
51***
-0.2
20***
-0.2
73***
(0.0
24)
(0.0
18)
(0.0
19)
(0.0
16)
(0.0
16)
(0.0
13)
(0.0
13)
(0.0
16)
(0.0
16)
Wh
oles
aler
*Inte
rmed
iate
Good
0.11
1***
0.1
74***
0.1
73***
0.1
96***
0.2
36***
(0.0
14)
(0.0
14)
(0.0
13)
(0.0
12)
(0.0
14)
Pro
du
ctB
yM
arke
tF
ixed
Eff
ect
yes
yes
yes
yes
yes
yes
yes
yes
yes
Nu
mb
erof
obse
rvat
ion
3112
88337461
337461
339485
339485
452254
452254
355370
355370
Nu
mb
erof
clu
ster
s10
5627
109908
109908
110801
110801
138614
138614
111285
111285
F23
.240.6
70.7
70.6
118.9
532.1
466.3
120.6
198.6
Tab
le6
Un
itp
rice
diff
eren
ces-
exp
ort.
Rob
ust
stan
dard
erro
rsare
rep
ort
edin
pare
nth
eses
.T
hey
are
clu
ster
edfo
rea
chC
N-8
dig
itp
rod
uct
and
cou
ntr
yp
air.
Aco
nst
ant
term
isin
clu
ded
bu
tn
ot
rep
ort
ed
27

YE
AR
1998
1998
1999
1999
2000
2000
2001
2001
2002
Var
iab
les
Log
Pri
ceL
og
Pri
ceL
og
Pri
ceL
og
Pri
ceL
og
Pri
ceL
og
Pri
ceL
og
Pri
ceL
og
Pri
ceL
og
Pri
ce
Wh
oles
aler
Du
mm
y(I
(W))
-0.0
29**
*-0
.056***
-0.0
53***
-0.0
68***
-0.0
38***
-0.0
59***
-0.0
25**
-0.0
55***
-0.0
39***
(0.0
09)
(0.0
15)
(0.0
09)
(0.0
17)
(0.0
09)
(0.0
16)
(0.0
09)
(0.0
15)
(0.0
08)
Ret
aile
rD
um
my
(I(R
))0.
061*
**0.
046**
0.0
75***
0.0
67***
0.0
49***
0.0
36*
0.0
44**
0.0
27
0.0
03
(0.0
13)
(0.0
15)
(0.0
14)
(0.0
18)
(0.0
13)
(0.0
17)
(0.0
13)
(0.0
16)
(0.0
11)
Wh
oles
aler
*Inte
rmed
iate
Good
0.0
46**
0.0
25
0.0
37*
0.0
52**
(0.0
17)
(0.0
18)
(0.0
17)
(0.0
17)
Pro
du
ctB
yM
arke
tF
ixed
Eff
ect
yes
yes
yes
yes
yes
yes
yes
yes
yes
Nu
mb
erof
obse
rvat
ion
3290
85329085
336968
336968
353146
353146
374009
374009
461178
Nu
mb
erof
clu
ster
s76
640
76640
78425
78425
80313
80313
84352
84352
97949
F47
.033.1
109.5
72.9
53.3
36.8
32.3
25.8
19.1
YE
AR
2002
2003
2003
2004
2004
2005
2005
2006
2006
Var
iab
les
Log
Pri
ceL
og
Pri
ceL
og
Pri
ceL
og
Pri
ceL
og
Pri
ceL
og
Pri
ceL
og
Pri
ceL
og
Pri
ceL
og
Pri
ce
Wh
oles
aler
Du
mm
y(I
(W))
-0.0
75**
*-0
.055***
-0.0
88***
-0.0
76***
-0.1
55***
-0.0
90***
-0.1
78***
-0.1
04***
-0.1
84***
(0.0
14)
(0.0
08)
(0.0
13)
(0.0
09)
(0.0
14)
(0.0
09)
(0.0
14)
(0.0
10)
(0.0
16)
Ret
aile
rD
um
my
(I(R
))-0
.017
-0.0
16
-0.0
33**
-0.0
51***
-0.0
92***
-0.0
67***
-0.1
15***
-0.0
70***
-0.1
15***
(0.0
13)
(0.0
11)
(0.0
12)
(0.0
12)
(0.0
14)
(0.0
12)
(0.0
14)
(0.0
13)
(0.0
16)
Wh
oles
aler
*Inte
rmed
iate
Good
0.06
7***
0.0
63***
0.1
42***
0.1
53***
0.1
39***
(0.0
16)
(0.0
15)
(0.0
15)
(0.0
15)
(0.0
16)
Pro
du
ctB
yM
arke
tF
ixed
Eff
ect
yes
yes
yes
yes
yes
yes
yes
yes
yes
Nu
mb
erof
obse
rvat
ion
4611
78473536
473536
483382
483382
457186
457186
526599
526599
Nu
mb
erof
clu
ster
s97
949
98941
98941
99433
99433
94218
94218
101158
101158
F14
.528.7
19.1
42.4
45.0
58.2
59.5
70.6
57.6
Tab
le7
Un
itp
rice
diff
eren
ces-
imp
ort.
Rob
ust
stan
dard
erro
rsare
rep
ort
edin
pare
nth
eses
.T
hey
are
clu
ster
edfo
rea
chC
N-8
dig
itp
rod
uct
and
cou
ntr
yp
air.
Aco
nst
ant
term
isin
clu
ded
bu
tn
ot
rep
ort
ed
28
WHS Firms
Year Exporters Importers Exporter-Importers
1998 0.342 0.445 0.279
2000 0.362 0.451 0.289
2002 0.404 0.489 0.332
2004 0.393 0.498 0.326
2006 0.388 0.498 0.330
1998-2006 0.379 0.474 0.311
Table 8 Percentage of exporters and importers. Sample: Whole-
sale Trade Firms, 1998-2006. The sample excludes
agents (NACE 5111-5119). Source: Statistics Denmark
(a) (b)
Firm Characteristics βX1 βM1FTE (Employment) 1.157*** 1.077***
Value added per worker 0.277*** 0.288***
Capital per worker 0.076*** 0.017
Investment per worker 0.096*** 0.040**
Average Hourly Wage 0.080*** 0.109***
Average Hourly Wage of Base Level 0.046*** 0.074***
Average Hourly Wage of Professional Level 0.070*** 0.100***CollegeEducated
TotalNumberofEmployees 0.087*** 0.101***ProfessionalLevel
TotalNumberofEmployees 0.106*** 0.126***
Number of Observations (max/min) 116231/57077 116231/57077
Table 9 Export and import premia. All regressions include the logarithm of employ-
ment except for the employment regression. Employment is measured as the
full-time equivalent number of employees (FTE). All dependent variables are
in logarithm. All monetary variables are deflated by the appropriate deflator.
Standard errors are clustered for firms. ∗, ∗∗ and ∗∗∗ indicate significance at
the 10 %, 5% and 1% levels respectively. Source: Business, Labor and Trade
Statistics, 1998-2006, Statistics Denmark
29

(a)
(b)
(c)
(d)
Dep
end
ent
Var
iab
leln
FT
Eln
Lab
orP
rod
uct
ivit
yln
Cap
italP
erW
ork
erln
Inve
stm
entP
erW
ork
erIG
Inte
nsi
ty0.
167∗∗
∗0.
014
−0.
020
−0.0
34
(0.0
34)
(0.0
13)
(0.0
30)
(0.0
28)
lnF
TE
−0.
105∗∗
∗−
0.1
33∗∗
∗−
0.1
63∗∗
∗
(0.0
05)
(0.0
09)
(0.0
08)
Ind
ust
ry(4
-dig
it)
Fix
edE
ffec
tsX
XX
XY
ear
Fix
edE
ffec
tsX
XX
XA
dju
sted
R2
0.06
50.0
87
0.0
64
0.0
43
F11
.843
21.7
58
18.2
16
15.1
66
Nu
mb
erof
Ob
serv
atio
ns
4995
049656
48934
46174
Nu
mb
erof
Clu
ster
s11
684
11659
11518
11310
Con
sum
pti
on
Good
sP
rem
ium
am
on
gW
hole
sale
Tra
de
Exp
ort
ers
CG
Inte
nsi
ty−
0.11
6∗∗
∗0.0
02
-0.0
52
-0.0
56
(0.0
37)
(0.0
14)
(0.0
33)
(0.0
30)
lnF
TE
−0.
105∗∗
∗−
0.1
34∗∗
∗−
0.1
64∗∗
∗
(0.0
05)
(0.0
09)
(0.0
08)
Ind
ust
ry(4
-dig
it)
Fix
edE
ffec
tsX
XX
XY
ear
Fix
edE
ffec
tsX
XX
XA
dju
sted
R2
0.06
40.0
87
0.0
64
0.0
44
F11
.592
21.6
45
18.2
18
15.2
04
Nu
mb
erof
Ob
serv
atio
ns
4995
049656
48934
46174
Nu
mb
erof
Clu
ster
s11
684
11659
11518
11310
Tab
le10
Inte
rmed
iate
good
sp
rem
ium
amon
gw
hol
esale
trad
eex
port
ers.
Rob
ust
stan
dard
erro
rsare
rep
ort
edin
pare
nth
eses
.T
he
dep
end
ent
vari
able
sin
colu
mn
sa-
dar
eth
elo
gari
thm
of
FT
E,
the
logari
thm
of
the
valu
ead
ded
over
FT
E,
the
logari
thm
of
the
valu
eof
cap
ital
asse
tsov
erF
TE
and
the
loga
rith
mof
the
valu
eof
tota
lin
vest
men
tov
erF
TE
resp
ecti
vely
.S
ou
rce:
Busi
nes
s,L
ab
or
an
dT
rade
Sta
tist
ics,
1998
-200
6,S
tati
stic
sD
enm
ark
30
(a)
(b)
(c)
(d)
(e)
Dep
end
ent
Var
iab
leln
AvgH
ourl
yW
age
lnA
vgH
ou
rlyW
age
lnA
vgH
ou
rlyW
age
lnC
oll
egeR
ate
lnP
rofe
ssio
nalR
ate
Base
Lev
elP
rofe
ssio
nal
Lev
elIG
Inte
nsi
ty0.
040∗∗
∗0.0
28∗∗
∗0.
052∗∗
∗0.
135∗∗
∗0.0
77∗∗
∗
(0.0
08)
(0.0
08)
(0.0
09)
(0.0
20)
(0.0
18)
lnF
TE
0.0
33∗∗
∗0.0
19∗∗
∗0.
064∗∗
∗−
0.2
91∗∗
∗−
0.074∗∗
∗
(0.0
02)
(0.0
03)
(0.0
03)
(0.0
07)
(0.0
06)
Ind
ust
ry(4
-dig
it)
Fix
edE
ffec
tsX
XX
XX
Yea
rF
ixed
Eff
ects
XX
XX
XA
dju
sted
R2
0.10
30.0
48
0.0
94
0.3
75
0.1
40
F29
.005
15.6
60
18.7
06
60.8
20
25.6
24
Nu
mb
erof
Ob
serv
atio
ns
4901
537359
34994
32870
35016
Nu
mb
erof
Clu
ster
s11
418
9250
8820
8037
8827
Con
sum
pti
on
Good
sP
rem
ium
am
on
gW
hole
sale
Tra
de
Exp
ort
ers
CG
Inte
nsi
ty−
0.04
7∗∗
∗−
0.033∗∗
∗−
0.054∗∗
∗−
0.102∗∗
∗−
0.068∗∗
∗
0.00
8(0
.009)
(0.0
10)
(0.0
22)
(0.0
20)
lnF
TE
0.0
33∗∗
∗0.0
19∗∗
∗0.
064∗∗
∗−
0.290∗∗
∗−
0.073∗∗
∗
(0.0
02)
(0.0
03)
(0.0
03)
(0.0
07)
(0.0
06)
Ind
ust
ry(4
-dig
it)
Fix
edE
ffec
tsX
XX
XX
Yea
rF
ixed
Eff
ects
XX
XX
XA
dju
sted
R2
0.10
40.0
48
0.0
94
0.3
74
0.1
39
F28
.721
15.6
39
18.6
85
59.2
00
24.7
59
Nu
mb
erof
Ob
serv
atio
ns
4901
537359
34994
32870
35016
Nu
mb
erof
Clu
ster
s11
418
9250
8820
8037
8827
Tab
le11
Inte
rmed
iate
good
sp
rem
ium
amon
gw
hol
esale
trad
eex
port
ers.
Rob
ust
stan
dard
erro
rsare
rep
ort
edin
pare
nth
eses
.T
he
dep
end
ent
vari
able
sin
colu
mn
s(a
)-(e
)ar
eth
elo
gari
thm
of
the
aver
age
hou
rly
sala
ry,
the
logari
thm
of
the
aver
age
hou
rly
sala
ryof
emp
loye
es
wh
od
ojo
bs
that
requ
ire
bas
ic-l
evel
skil
ls,
the
logari
thm
of
the
aver
age
hou
rly
sala
ryof
emp
loye
esw
ith
pro
fess
ion
al
an
dte
chn
ical
skil
lre
qu
ired
occ
up
atio
ns,
the
loga
rith
mof
the
share
of
the
coll
ege
edu
cate
dem
plo
yees
over
the
tota
lnu
mb
erof
emp
loye
es,
an
dth
e
loga
rith
mof
the
shar
eof
the
emp
loye
esw
ith
pro
fess
ion
al
an
dte
chn
ical
occ
up
ati
on
sov
erth
eto
tal
nu
mb
erof
emp
loyee
sre
spec
tive
ly.
Hou
rly
wag
esd
on
otin
clu
de
the
ben
efits
.S
ou
rce:
Bu
sin
ess,
Lab
or
an
dT
rad
eS
tati
stic
s,1998-2
006,
Sta
tist
ics
Den
mark
31

Dependent Variable lnAvgHourlyWage lnAvgHourlyWage lnAvgHourlyWageamong Base among Professional
Level Occupations Level OccupationsIGIntensity 0.009 -0.001 0.032∗∗∗
(0.007) (0.008) (0.009)lnFTE 0.022∗∗∗ 0.008∗ 0.065∗∗∗
(0.003) (0.003) (0.004)Singleplant -0.006 -0.011 0.009
(0.006) (0.006) (0.007)lnFirmAge −0.010∗∗∗ −0.007∗ 0.002
(0.003) (0.003) (0.003)Proprietorship −0.127∗∗∗ −0.035∗∗ −0.150∗∗∗
(0.011) (0.013) (0.019)FemaleRatio −0.091∗∗∗ −0.143∗∗∗ −0.039∗
(0.013) (0.015) (0.017)AvgTenure 0.048∗∗∗ 0.034∗∗∗ 0.030∗∗∗
(0.004) (0.005) (0.005)AvgTenure2 −0.001∗∗∗ −0.000∗∗ −0.000∗∗
(0.000) (0.000) (0.000)CollegeRate 0.255∗∗∗ 0.211∗∗∗ 0.169∗∗∗
(0.015) (0.016) (0.017)Industry (4-digit) Fixed Effects X X XYear Fixed Effects X X XAdjusted R2 0.227 0.117 0.139F 114.518 69.247 68.716Number of Observations 47548 36338 33964Number of Clusters 10925 8892 8437
Table 12 Intermediate goods premium, controlling for firm and worker characteristics. Robust stan-
dard errors are reported in parentheses. IGIntensity is the number of intermediate goods
that are exported over the total number of exported goods. Singleplant is a dummy variable
indicating single plant firms. logFirmAge is the logarithm of a firm’s age. Proprietorship
is a dummy variable indicating the ownership type. FemaleRatio is the number of female
employees over the total number of employees. AvgTenure is the average tenure of em-
ployees in a firm. AvgTenure2 is the square of the average tenure of employees in a firm.
CollegeRate is the number of employees with at least some college education over the total
number. Source: Business, Labor and Trade Statistics, 1998-2006, Statistics Denmark
32

Dependent Variable lnAvgHourlyWage lnAvgHourlyWage lnAvgHourlyWageamong Base among Professional
Level Occupations Level OccupationsIGIntensity 0.009 -0.001 0.032∗∗∗
(0.007) (0.008) (0.009)HTechIntensity 0.037∗∗∗ 0.042∗∗∗ 0.032∗∗∗
(0.008) (0.008) (0.010)lnFTE 0.022∗∗∗ 0.008∗ 0.065∗∗∗
(0.003) (0.003) (0.004)Singleplant -0.006 -0.011 0.009
(0.006) (0.006) (0.007)lnFirmAge −0.010∗∗∗ −0.007∗ 0.002
(0.003) (0.003) (0.003)Proprietorship −0.126∗∗∗ −0.034∗∗ −0.150∗∗∗
(0.011) (0.013) (0.019)FemaleRatio −0.088∗∗∗ −0.139∗∗∗ −0.036∗
(0.013) (0.015) (0.017)AvgTenure 0.048∗∗∗ 0.034∗∗∗ 0.030∗∗∗
(0.004) (0.005) (0.005)AvgTenure2 −0.001∗∗∗ −0.000∗∗ −0.000∗∗
(0.000) (0.000) (0.000)CollegeRate 0.252∗∗∗ 0.206∗∗∗ 0.165∗∗∗
(0.015) (0.016) (0.017)Industry (4-digit) Fixed Effects X X XYear Fixed Effects X X XAdjusted R2 0.228 0.118 0.139F 109.889 68.732 66.815Number of Observations 47548 36338 33964Number of Clusters 10925 8892 8437
Table 13 Intermediate goods premium, controlling for firm and worker characteristics and high-
tech intensity. Robust standard errors are reported in parentheses. HTechIntensity is the
number of high tech goods that are exported over the total number of exported goods. For
definitions of other variables see Table 12. Source: Business, Labor and Trade Statistics,
1998-2006, Statistics Denmark
33
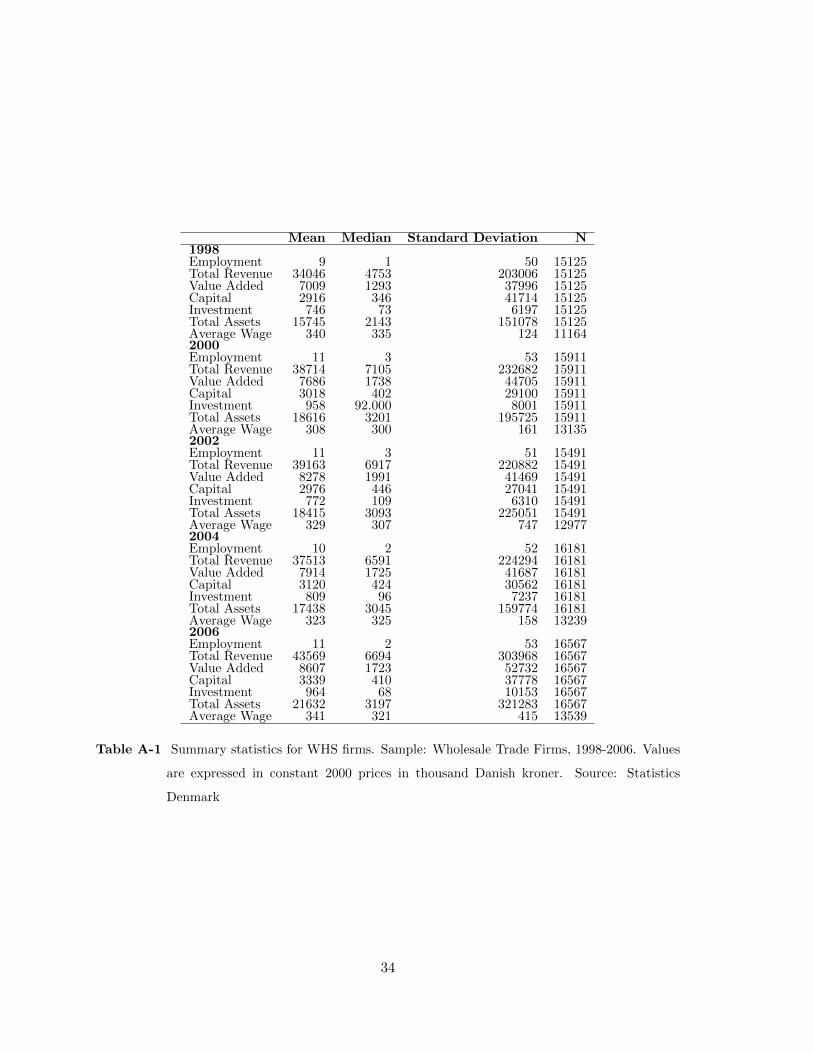
Mean Median Standard Deviation N1998Employment 9 1 50 15125Total Revenue 34046 4753 203006 15125Value Added 7009 1293 37996 15125Capital 2916 346 41714 15125Investment 746 73 6197 15125Total Assets 15745 2143 151078 15125Average Wage 340 335 124 111642000Employment 11 3 53 15911Total Revenue 38714 7105 232682 15911Value Added 7686 1738 44705 15911Capital 3018 402 29100 15911Investment 958 92.000 8001 15911Total Assets 18616 3201 195725 15911Average Wage 308 300 161 131352002Employment 11 3 51 15491Total Revenue 39163 6917 220882 15491Value Added 8278 1991 41469 15491Capital 2976 446 27041 15491Investment 772 109 6310 15491Total Assets 18415 3093 225051 15491Average Wage 329 307 747 129772004Employment 10 2 52 16181Total Revenue 37513 6591 224294 16181Value Added 7914 1725 41687 16181Capital 3120 424 30562 16181Investment 809 96 7237 16181Total Assets 17438 3045 159774 16181Average Wage 323 325 158 132392006Employment 11 2 53 16567Total Revenue 43569 6694 303968 16567Value Added 8607 1723 52732 16567Capital 3339 410 37778 16567Investment 964 68 10153 16567Total Assets 21632 3197 321283 16567Average Wage 341 321 415 13539
Table A-1 Summary statistics for WHS firms. Sample: Wholesale Trade Firms, 1998-2006. Values
are expressed in constant 2000 prices in thousand Danish kroner. Source: Statistics
Denmark
34

Imp
ort
Exp
ort
CN
Pro
du
ctC
ateg
orie
sW
hole
sale
Manu
fact
ure
Wh
ole
sale
Manu
fact
ure
CN
1:L
ive
anim
als;
anim
alp
rod
uct
s0.6
12
0.3
02
0.4
23
0.5
53
CN
2:V
eget
able
pro
du
cts
0.5
39
0.3
46
0.7
34
0.1
69
CN
3:A
nim
alan
dveg
etab
lefa
tsan
doi
ls0.2
66
0.6
88
0.5
05
0.4
83
CN
4:P
rep
ared
foodst
uff
s;b
ever
ages
,..
0.5
59
0.3
22
0.2
59
0.6
27
CN
5:M
iner
alp
rod
uct
s0.4
87
0.3
09
0.0
87
0.1
40
CN
6:P
rod
uct
sof
the
chem
ical
oral
lied
ind
ust
ries
0.5
86
0.3
63
0.3
57
0.5
78
CN
7:P
last
ics,
rub
ber
and
arti
cles
ther
eof
0.4
54
0.4
64
0.2
03
0.7
42
CN
8:R
awh
ides
and
skin
s,le
ath
er,
furs
kin
san
dart
icle
sth
ereo
f0.7
46
0.1
29
0.9
03
0.0
64
CN
9:W
ood
and
arti
cles
ofw
ood
0.6
05
0.3
39
0.3
76
0.5
79
CN
10:
Pu
lpof
wood
orof
oth
erfi
bro
us
cell
ulo
sic
mate
rial
0.5
20
0.3
92
0.2
76
0.6
69
CN
11:
Tex
tile
san
dte
xti
lear
ticl
es0.4
96
0.3
04
0.4
41
0.4
52
CN
12:
Foot
wea
r,h
ead
gear
,u
mb
rell
as,
sun
um
bre
llas,
walk
ing
stic
ks,
seat-
stic
ks,
...
0.5
42
0.2
75
0.7
01
0.2
51
CN
13:
Art
icle
sof
ston
e,p
last
er,
cem
ent,
asb
esto
s,m
ica
an
dsi
mil
ar
mate
rials
;..
.0.5
25
0.3
91
0.3
08
0.6
09
CN
14:
Nat
ura
lor
cult
ure
dp
earl
s,p
reci
ous
orse
mi-
pre
ciou
sst
on
es,
pre
ciou
sm
etals
,..
.0.6
73
0.2
06
0.4
13
0.5
03
CN
15:
Bas
em
etal
san
dar
ticl
esof
bas
em
etal
0.4
69
0.4
76
0.3
09
0.6
44
CN
16:
Mac
hin
ery
and
mec
han
ical
app
lian
ces;
elec
tric
al
equ
ipm
ent;
part
sth
ereo
f;..
.0.6
14
0.2
73
0.3
27
0.5
89
CN
17:
Veh
icle
s,ai
rcra
ft,
vess
els
and
asso
ciat
edtr
an
sport
equ
ipm
ent
0.8
02
0.0
57
0.4
49
0.3
77
CN
18:
Op
tica
l,p
hot
ogra
ph
ic,
mea
suri
ng,
chec
kin
g,
pre
cisi
on
,m
edic
al
inst
rum
ents
0.6
25
0.2
68
0.1
60
0.7
61
CN
19:
Arm
san
dam
mu
nit
ion
;p
arts
and
acce
ssori
esth
ereo
f0.6
19
0.0
38
0.6
98
0.2
49
CN
20:
Mis
cell
aneo
us
man
ufa
ctu
red
arti
cles
0.5
27
0.2
30
0.2
80
0.6
55
CN
21:
Wor
ks
ofar
t,co
llec
tors
’p
iece
s,an
dan
tiqu
es0.2
98
0.0
31
0.5
98
0.0
25
CN
22:
Oth
erp
rod
uct
s0.0
00
0.0
55
0.4
81
0.1
90
Tab
leA
-2S
har
eof
wh
oles
ale
rsacr
oss
CN
pro
du
ctca
tegori
es(a
ver
age
bet
wee
n1993-2
006)
35
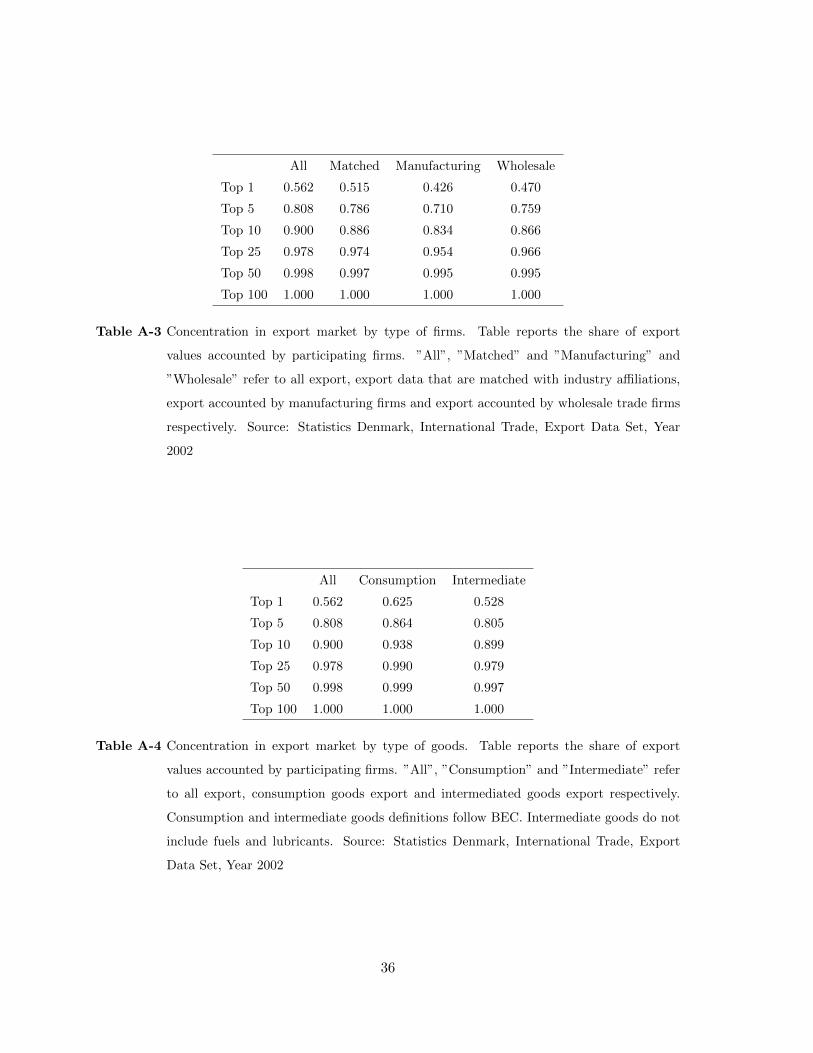
All Matched Manufacturing Wholesale
Top 1 0.562 0.515 0.426 0.470
Top 5 0.808 0.786 0.710 0.759
Top 10 0.900 0.886 0.834 0.866
Top 25 0.978 0.974 0.954 0.966
Top 50 0.998 0.997 0.995 0.995
Top 100 1.000 1.000 1.000 1.000
Table A-3 Concentration in export market by type of firms. Table reports the share of export
values accounted by participating firms. ”All”, ”Matched” and ”Manufacturing” and
”Wholesale” refer to all export, export data that are matched with industry affiliations,
export accounted by manufacturing firms and export accounted by wholesale trade firms
respectively. Source: Statistics Denmark, International Trade, Export Data Set, Year
2002
All Consumption Intermediate
Top 1 0.562 0.625 0.528
Top 5 0.808 0.864 0.805
Top 10 0.900 0.938 0.899
Top 25 0.978 0.990 0.979
Top 50 0.998 0.999 0.997
Top 100 1.000 1.000 1.000
Table A-4 Concentration in export market by type of goods. Table reports the share of export
values accounted by participating firms. ”All”, ”Consumption” and ”Intermediate” refer
to all export, consumption goods export and intermediated goods export respectively.
Consumption and intermediate goods definitions follow BEC. Intermediate goods do not
include fuels and lubricants. Source: Statistics Denmark, International Trade, Export
Data Set, Year 2002
36

APPENDIX
A Additional Tables
WHS MAN
Consumption Intermediate Consumption Intermediate
Top 1 0.453 0.556 0.456 0.352
Top 5 0.779 0.805 0.781 0.700
Top 10 0.889 0.894 0.894 0.826
Top 25 0.979 0.975 0.982 0.954
Top 50 0.997 0.996 0.998 0.995
Top 100 1.000 1.000 1.000 1.000
Table A-5 Concentration in export market by type of firms and type of goods. Table reports the
share of export values accounted by participating firms by type of goods and type of firms.
Source: Denmark Statistics, International Trade, Export Data Set, Year 2002
B Data
B.1 Foreign Trade Data
The foreign trade data sets are compiled from the Danish Customs records. Each shipment
record includes the date of the shipment, the value of shipment, the product code (CN-8 digit),
and the name of the product, weight of the shipment, type of the weight and sometimes
quantity information as well as the unique firm identifier. Statistics Denmark aggregated
this data into annual shipments for each product (CN-8 digit), country and firm triplet. As
provided by Statistics Denmark, the international transaction data set covers the universe
of Danish firms’ transactions for the period 1993-2007. However, only product shipments of
10000 kr (approx.1800 us $) or above are included in the data set for the transactions with
the EU countries.
37

B.2 Business Statistics Data
Business statistics data are compiled from survey results of firms that take part in a yearly
financial survey as well as from tax reports, vat reports, and annual reports from incorporated
companies. The general business statistics include only firms that employ at least a 0.5 FTE
(full-time equivalent employment) employment and/or have had an estimated earnings of a
certain size. Earning sizes are estimated differently for different industries. In the wholesale
trade sectors, the limit of earnings is typically over 500,000 Danish Kroner, while in the
manufacturing industry, it ranges between 150,000 and 200,000 Danish Kroner. Some of the
data for very small firms may be subject to imputation. This data set is available starting
from 1995, but only manufacturing, construction and retail sectors are included until 1998.
In 1998, the wholesale trade sector is included and starting from 1999 it covers almost all
sectors including mining, and all business service sectors.19 This data set is supplemented
with the labor surveys (IDA) that provide information on wages, education and occupation
characteristics for each individual in the labor force. In the labor (IDA) data set, for each
employed person there is a unique firm identifier provided for the employer. Using this firm
identifier, extracted information from IDA is merged with the Firm Accounting Data Set for
each year. Only a couple of observations in firm accounting data were left unmatched from
this matching.20
Intermediaries are defined as firms with their main economic activity in 2-digit Danish In-
dustrial Classification 51 (wholesale except of motor vehicles) as well as 6-digit industry
classifications equal to 501010, 501020, 501030, 503010, 503020, and 504000 which are sale
of motor vehicles, parts and accessories.
19Starting from 1999, the data set includes hospitality, transportation, telecommunication, real estate,
rental services, information technology services, research and development services, and other consultancy
and business services. It does not include agriculture, financial sector, public, education and medical service
sectors.20For the details of labor data set as well as other data sets used in this study see Utar (2014).
38

B.3 Matching Foreign Trade Data with Firm-level Data Sets
Foreign trade as compiled from the custom records contain firm id’s but not a main busi-
ness/industry affiliation, so it is not possible to identify the type of firms whether wholesale
trade, retailer, manufacturer or service etc from the foreign trade data alone. The analysis
in this paper is carried out by matching the foreign trade data with the business statistics as
well as other available data sets from Statistics Denmark such as tax data, and industry sales
data. Between 1993 and 2007, most of the foreign data in the import side (94 % of firms) can
be matched, less so in export (89 % of firms). A significant part of the transactions cannot
be matched in the export side, probably due to reporting errors. Nevertheless during 1998
and 2006 which is the sample period used in the empirical analysis, 91 % of the exporting
firms in custom data were matched with their corresponding industry affiliations.
B.4 Product Detail
Products description is based on the Combined Nomenclature (CN) 8 digit categories. The
first 6 digits of the CN corresponds to the HS-6 digit classification. For example, 852812
product code refers to color television receivers with built-in picture tubes. In the CN-8
classification there are 19 different kinds of color television receivers depending on different
characteristics such as display width, diagonal screen size, and lines of resolution.
B.4.1 Broad Product Classification
Product classification of the products as consumption, intermediate, or industrial good is
based on BEC Rev. 3. Consumption goods are defined as (BEC=112, 122, 522, >=600).
The rest are defined as industrial goods. Intermediate goods definition does not include fuels
and lubricants and is defined as (BEC=111, 121, 210, 220, 420, 530).
CN Chapters are used as broad product classifications and they are listed in Table A-2.
CN codes are matched with the corresponding manufacturing industries using PRODCOM.
Prodcom provides statistics on the production of manufactured goods. Prodcom uses the
product codes specified on the Prodcom List, which contains about 4500 different types of
39

manufactured products. Products are identified by an 8-digit code: the first four digits are the
classification of the producing enterprise given by the Statistical Classification of Economic
Activities in the European Community (NACE). Most product codes correspond to one or
more Combined Nomenclature (CN) codes, but some (mostly industrial services) do not. The
matching between CN and PRODCOM are provided by EUROSTAT RAMON. The matches
are executed for every year separately.
Rauch (1999) classification is used to classify products as homogenous, reference and differ-
entiated goods. Classifications in Rauch (1999) are based on SITC codes. Correspondence
tables between CN 8-digit and SITC 4-digit (provided by EUROSTAT RAMON) are used to
link the classification with the Danish data.
High tech goods definitions follow OECD nomenclature (Loschky (2008)). High-technology
classification is based on both direct and indirect R&D intensities in relation to the production
output or to the valued added. The indirect R&D intensity is defined as the R&D expen-
ditures embodied in the intermediate products used in the production in another economic
sector. See Loschky (2008) for more details.
40