Embed Size (px)
Citation preview

Title 1
2
3
4
5
6
7
8
9
10
11
12
13
14
15
16
17
18
Comparison of Klinkenberg-corrected gas permeability and water permeability in
sedimentary rocks
Authors
Wataru Tanikawa1*
Toshihiko Shimamoto2
Addresses
1. Kochi Institute for Core Sample Research, Japan Agency for Marine-Earth Science
and Technology (JAMSTEC), 200 Monobe-otsu, Kochi, Japan.
2. Department of Earth and Planetary Systems Science, Graduate School of Science,
Hiroshima University, Higashi-Hiroshima, Japan
*Corresponding author
Address: Kochi Institute for Core Sample Research, Japan Agency for Marine-Earth
Science and Technology, Nankoku 783-8502, Japan
Tel: +81-88-878-2203; fax: +81-88-878-2192
E-mail: [email protected]

Abstract 19
20
21
22
23
24
25
26
27
28
29
30
31
32
33
34
35
36
37
Quick measurements of permeability can be made by using gas as the pore fluid. To
apply gas permeability data to the evaluation of water permeability, the difference
between gas and water permeabilities needs to be assessed. We measured intrinsic
permeability of sedimentary rocks from the western foothills of Taiwan by using
nitrogen gas and distilled water as pore fluids in effective-pressure cycling tests at room
temperature. The observed difference in gas and water permeabilities was analyzed in
view of the Klinkenberg effect. This effect is due to the slip flow of gases at pore walls,
which enhances gas flow when pore sizes are very small. Our experimental results
showed that (1) gas permeability was larger than water permeability by several times to
one order of magnitude, (2) gas permeability increased with increasing pore pressure,
and (3) water permeability increased slightly as the pore-pressure gradient across the
specimen increased. Results (1) and (2) can be explained quantitatively by an empirical
power law in relation to the Klinkenberg constant b that is applicable in low permeable
range. This correlation enables us to estimate water permeability from gas permeability.
The Klinkenberg effect is important when permeability is lower than 10-18 m2 and at low
pore-pressure differentials, and correction for the effect is essential to estimate water
permeability from gas permeability measurement data. A simplified Bingham flow

model for water can partially explain the trend of result (3), though non-Darcy flow
behavior or inertial forces of water-rock interaction are needed to account for the
observed deviation from Darcy’s law.
38
39
40
41
42
43
Keyward
Gas permeability; Water permeability; Klinkenberg effect; Sedimentary rock
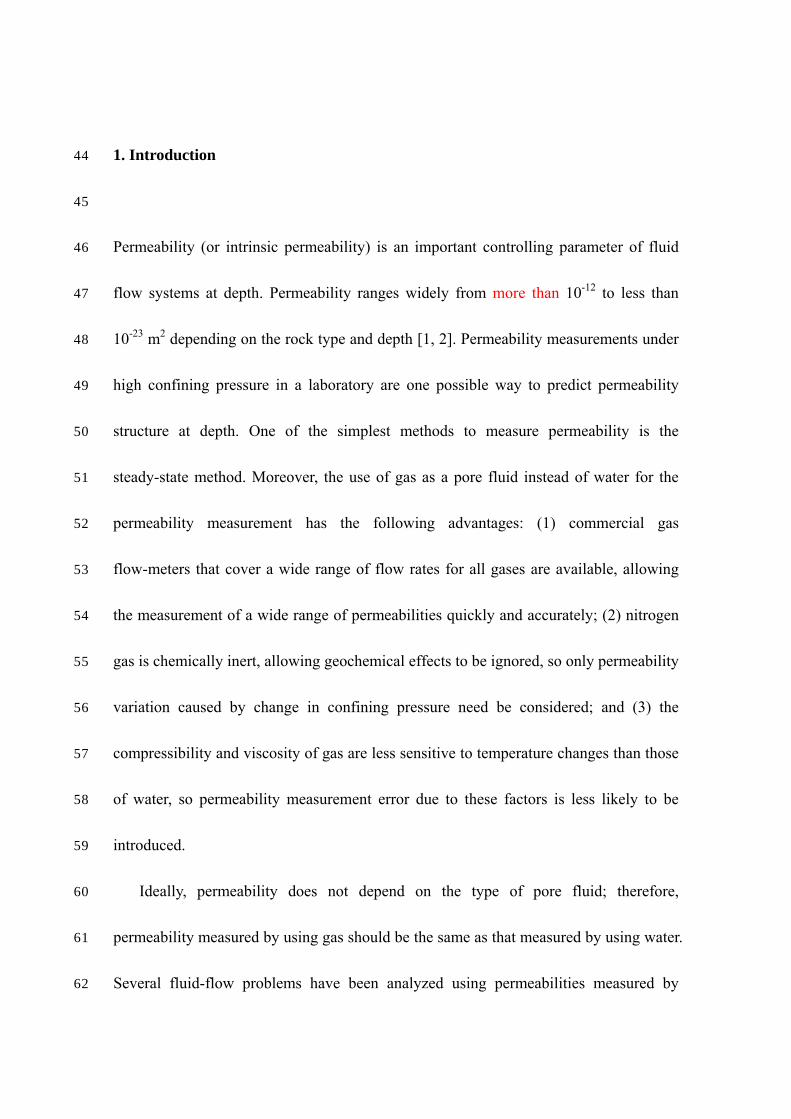
1. Introduction 44
45
46
47
48
49
50
51
52
53
54
55
56
57
58
59
60
61
62
Permeability (or intrinsic permeability) is an important controlling parameter of fluid
flow systems at depth. Permeability ranges widely from more than 10-12 to less than
10-23 m2 depending on the rock type and depth [1, 2]. Permeability measurements under
high confining pressure in a laboratory are one possible way to predict permeability
structure at depth. One of the simplest methods to measure permeability is the
steady-state method. Moreover, the use of gas as a pore fluid instead of water for the
permeability measurement has the following advantages: (1) commercial gas
flow-meters that cover a wide range of flow rates for all gases are available, allowing
the measurement of a wide range of permeabilities quickly and accurately; (2) nitrogen
gas is chemically inert, allowing geochemical effects to be ignored, so only permeability
variation caused by change in confining pressure need be considered; and (3) the
compressibility and viscosity of gas are less sensitive to temperature changes than those
of water, so permeability measurement error due to these factors is less likely to be
introduced.
Ideally, permeability does not depend on the type of pore fluid; therefore,
permeability measured by using gas should be the same as that measured by using water.
Several fluid-flow problems have been analyzed using permeabilities measured by

using gas instead of water [3-5]. However, it has been found that (1) permeability of a
medium to gas changes in relation to pore-pressure changes at the same effective
pressure [6], and (2) permeability of a medium to gas is higher than the permeability of
the same medium to water [7]. These problems might be related to the pore-pressure
dependence of gas permeability known as the Klinkenberg effect [8], which we define
and discuss in detail in Section 2. There are few examples, however, in which
permeabilities to different pore fluids are compared in the same samples [7,9-10] under
high confining pressure. Therefore, in this study, permeability of the same specimens
measured by using nitrogen gas as the pore fluid was compared with that measured by
using water as the fluid in effective-pressure cycling tests. Then, the Klinkenberg effect
on gas permeability and the pore-pressure dependence of permeability are discussed in
relation to the experimental data. Furthermore, the relationship between the Klinkenberg
slip factor and water permeability in low permeability range is discussed as the
relationship in low permeable rocks is not well studied. Sedimentary rocks from the
western foothills of Taiwan that have permeability variations were used for the
permeability measurements.
63
64
65
66
67
68
69
70
71
72
73
74
75
76
77
78
79
80
81
2. Intrinsic permeability and the Klinkenberg effect
82
83
84
85
86
87
88
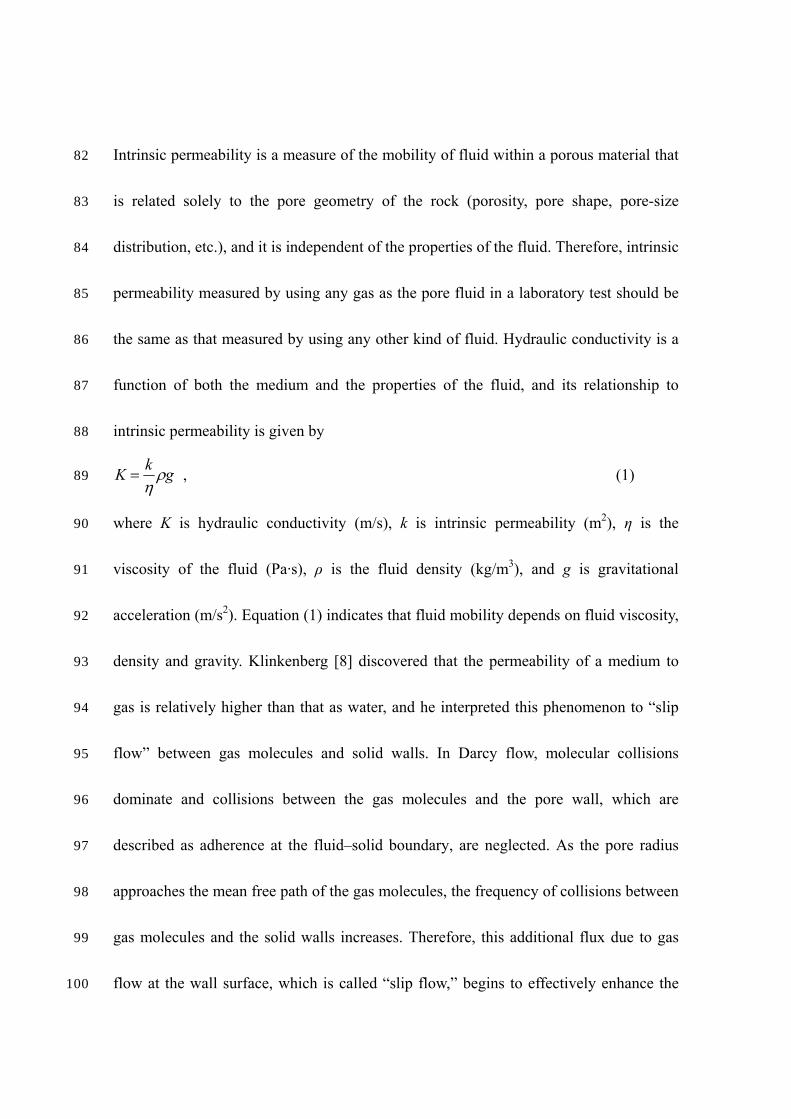
Intrinsic permeability is a measure of the mobility of fluid within a porous material that
is related solely to the pore geometry of the rock (porosity, pore shape, pore-size
distribution, etc.), and it is independent of the properties of the fluid. Therefore, intrinsic
permeability measured by using any gas as the pore fluid in a laboratory test should be
the same as that measured by using any other kind of fluid. Hydraulic conductivity is a
function of both the medium and the properties of the fluid, and its relationship to
intrinsic permeability is given by
K =kηρg , (1) 89
90
91
92
93
94
95
96
97
98
99
100
where K is hydraulic conductivity (m/s), k is intrinsic permeability (m2), η is the
viscosity of the fluid (Pa·s), ρ is the fluid density (kg/m3), and g is gravitational
acceleration (m/s2). Equation (1) indicates that fluid mobility depends on fluid viscosity,
density and gravity. Klinkenberg [8] discovered that the permeability of a medium to
gas is relatively higher than that as water, and he interpreted this phenomenon to “slip
flow” between gas molecules and solid walls. In Darcy flow, molecular collisions
dominate and collisions between the gas molecules and the pore wall, which are
described as adherence at the fluid–solid boundary, are neglected. As the pore radius
approaches the mean free path of the gas molecules, the frequency of collisions between
gas molecules and the solid walls increases. Therefore, this additional flux due to gas
flow at the wall surface, which is called “slip flow,” begins to effectively enhance the

101 flow rate. This phenomenon is called the Klinkenberg effect and is expressed as follows:
3
3
2
12
141
rTcb
Pbk
PT
rck
rclkk lllg
πκ
πκ
=
⎟⎠⎞
⎜⎝⎛ +=⎟
⎠⎞
⎜⎝⎛ +=⎟
⎠⎞
⎜⎝⎛ +=
, (2) 102
103
104
105
106
107
where kg is the permeability of a medium to gas (m2), kl is the permeability of a medium
to liquid (m2), l is the mean free path of the gas molecules (m), r is the pore radius (m),
κ is Boltzmann’s constant (JK-1), T is temperature (K), c is a constant, P is pore pressure
(Pa), and b is the Klinkenberg slip factor (Pa). The value of the parameter l in equation
(2) is given by the following relationship [11]:
PT
rl
224πκ
=
(3)
108
109
110
111
112
113
114
115
116
117
Equation (2) indicates that if the pore radius and the gas pore pressure are small and
the temperature of the gas is high, then kg becomes much larger than kl; in contrast, kg
approaches kl as pore pressure approaches infinity. For this reason, Brace et al. [9] and
Zoback and Byerlee [12] performed gas permeability tests under high pore pressure
conditions (P = 5 to 15 MPa) by the transient flow method to avoid the Klinkenberg
effect. Brace et al. (1968) showed that the permeability of Westerly granite to water,
ranging from 10-16 to 10-18, was similar to that as argon gas; however, it was not
mentioned that how high a pore pressure was required to avoid the Klinkenberg effect

in gas permeability tests. 118
119
120
121
122
123
124
125
126
127
128
129
130
131
132
133
134
135
136
The Klinkenberg factor b depends on the rock properties, and to a lesser degree on
the physical properties of the gas. Previous researches showed that b took a wide range
of values from 10−2 [8] to 18 [6]. Jones [13] investigated the relationship between the
Klinkenberg slip factor b and estimated water permeability kl in about 100 core
samples, and found that log b increased linearly with log kl within a permeability range
from 10-12 to 10-17 m2. Persoff and Hulen [14] estimated the relationship between b and
kl in less permeable (10-18 to 10-22 m2) metagraywacke samples; their results were
generally consistent with those of Jones, except that the slope of the regression line
was apparently steeper than that obtained by Jones [13], although they used too few
data points (8 points) to be sure.
3. Sample information and method
Outcropping sandstones from the west-central part of the western foothills of Taiwan
(Pleistocene to Miocene rocks) were used for our permeability tests. The western
foothills are known to be in a fold and thrust belt that developed during the Miocene as
a result of the collision of the Luzon arc with the Asian continent [15]. The western
foothills are well known for oil and natural gas fields [16], and permeability at depth in

137
138
139
140
141
142
143
144
145
146
147
148
149
150
151
152
the western foothills is a key parameter for understanding oil and natural gas storage
and migration mechanisms.
All samples were cored to a cylindrical shape. All specimens were 5 to 40 mm long and
approximately 20 mm in diameter. 4 samples were used for the comparison between gas
and water permeabilites, and gas permeability were measured in 30 samples to show the
relationship between b and permeability. Specimens were dried at 80 °C in an oven to
eliminate pore water before the gas permeability measurement. All experiments were
performed at room temperature using the intravessel oil pressure apparatus at Kyoto
University. In this experimental system, the oil apparatus can attain a confining pressure
of up to 400 MPa in conjunction with a mini-pressure generator system. To confine the
pressure, avoid leakage, and eliminate bypass flow between the side of the sample and
the jacket during permeability tests, samples were jacketed in three to four layers of
polyolefin, which contracts during heating. Fluid flows from the bottom to the top of a
specimen in this apparatus.
When an incompressible fluid (liquid) is used for permeability tests, intrinsic
permeability k is determined from the linear form of Darcy’s law:
dxdPkAQ
η−= ,
(4)
153
154
155 where Q is the volume of fluid measured per unit time, A is the cross-sectional area of

156
157
158
159
160
the sample, η is viscosity of the pore fluid, and dP/dx is the pressure gradient.
One-dimensional gas flow is assumed in equation (4) as the enforced pressure gradient
during permeability tests is very large. If a constant pressure gradient through the
sample is assumed, then equation (4) can be expressed as
( downup PPL
kAQ −=η
)161
162
163
164
165
166
(5)
L is sample length and Pup and Pdown are pore pressure at the upstream end (x = 0) and
downstream end (x = L) of the specimen, respectively. However, when a compressible
gas (PV = constant) is used as the pore fluid, the density of the pore fluid differs within
the specimen. In this case, the average gas permeability kgas is expressed as [6]
xLPP
P
LPP
AkxQ
downupup
downup
gas
222
22
)(21
)(−
−
−
=η
(6)
167
168
169 . When x = L, equation (6) becomes
)(2
)(22
down
downupgas
PPP
LAk
LxQ−
==η
(7) [17].
170
171
172 In our apparatus, Pup was kept constant at a value between 0.2 and 2 MPa using the

gas regulator, and the gas flow rate was monitored at the downstream of the samples
(Figure 1). Fluid flowing out of the specimen at the downstream end was released to
atmospheric pressure, and P
173
174
175
176
177
178
179
180
181
182
183
184
185
186
187
188
189
190
191
down was assumed to have a constant value of 0.1 MPa. Thus,
the pore-pressure differential, Pup – Pdown, can be assumed to be constant, and equation
(7) can be applied to evaluate gas permeability. The volumetric gas flow rate at the
downstream end of the samples was measured with a digital gas flow-meter
(ADM2000; Agilent Technologies, USA) and a high-precision bubble gas flow meter
(VP-1U; HoribaSTEC Ltd, JAPAN). Continuous, real-time digital measurements are
made by the ADM2000, enabling fast measurement of the gas permeability. Several
seconds to more than 10 minutes can be required to measure a volumetric flow rate with
the VP-1U, though a very low flow rate can be achieved. The ADM2000 can measure a
volumetric flow rate within the range 0.0005 –1.0 L/min (accuracy, ±3% of reading, or
±0.2 mL/min, whichever is greater), and the VP-1U can measure a flow rate within the
range 0.024–10 mL/min (accuracy, ±0.5% for 0.2–2 mL/min; ±1% for 2–10 mL/min).
Therefore, a wide range of gas flow rates from 1 L/min to 0.024 mL/min, corresponding
to gas permeabilities from 10-13 m2 down to 10-19 m2 in our experiments, was easily
measured by using these gas flow-meters.
Water permeability was evaluated by the steady-state flow method, by using
equation (5). Upstream pore pressure was controlled in the same way as before.

Distilled water was stored in the water tank and directly pressurized by nitrogen gas
from the gas bottle. Pore water at the downstream end was released to atmospheric
pressure. The water flow rate at the downstream end was determined by using a digital
balance (GF400; A&D Company, Ltd., JAPAN) to continuously monitor the real-time
weight increment of water flowing out from the specimen. Therefore, there was no
lower limit for the water permeability measurement if time permitted. We observed no
gas bubbles in the water flowing out from the downstream line during the water
permeability measurements, indicating that two-phase (water and nitrogen gas) flow did
not occur, even though we forced the water from the water tank with nitrogen gas under
high pressure. The viscosities of the nitrogen gas and distilled water at room
temperature of 17.4 × 10
192
193
194
195
196
197
198
199
200
201
202
203
204
205
206
207
208
209
210
-6 Pa・s and 1.0 × 10⁻³ Pa・s were used for the permeability
evaluation.
Permeability was measured at confining pressures that stepped up from 5 MPa to
the maximum of 160 MPa. To compare permeability of a medium to nitrogen gas with
that of same medium to water, nitrogen gas was used as the pore fluid for the first and
second, or first, second, and third, pressure cycles, and then distilled water was used as
the pore fluid for the last two pressure cycles. Before the pore fluid was switched from
nitrogen gas to water, the pore flow line was vacuumed once for an hour, and then filled
with CO2. After we vacuumed for an hour again, distilled water was poured into the

specimens. By filling the pore flow lines once with CO2, we could minimize the
influence of gas remaining within the pores during the water permeability measurement,
because the solubility of CO
211
212
213
214
215
216
217
218
219
220
221
222
223
224
225
226
227
228
229
2 in water is quite large under high pressure so that any CO2
gas would dissolve in the water during tests. The pore-pressure dependence of
permeability was investigated by changing Pup while keeping the confining pressure
constant.
4. Experimental result
General information on the test samples used to compare the difference between water
and gas permeability is given in Table 1. Porosity was measured by the standard method,
where porosity is calculated from the weight difference between the water-saturated
sample and the dry sample, and by the mercury intrusion porosimetry technique (MIPT)
with a commercial porosimeter (Porosimeter 2000, Carlo Erba Ltd.). The MIPT yielded
lower porosity than that determined by the standard method. Pore-size distributions
were also measured by MIPT (Figure 1). The radius of most micropores was in the
range from 0.01 to 10 μm. The peak volumetric ratio was near the maximum end of the
pore-size range in each case. Sample IVA407 (Tungkeng Fm), which had the highest
porosity among the specimens, also had the largest average and modal pore radii.

The results of the pressure cycling tests on the sandstone specimens are shown in
Figure 2. Permeability was plotted against the effective pressure, defined as the
difference between the confining pressure and the pore pressure. In our tests, however,
the effective pressure was assumed to be equivalent to the confining pressure because
the pore pressure was extremely small compared with the confining pressure. The error
bars in the figure mainly reflect differences caused by pore-pressure variation, because
permeability varies significantly with changes in pore pressure (this pore-pressure
dependence of permeability is described in the following section). The accuracy of the
flow rate was less than 1%, and the error of each data point is within the symbol.
230
231
232
233
234
235
236
237
238
239
240
241
242
243
244
245
246
247
248
In sample IVA407, five effective-pressure cycles were conducted. During the first
three pressure cycles, nitrogen gas was used as the pore fluid, and distilled water was
used during the other two pressure cycles. The initial permeability at the lowest
effective pressure was around 10-13 m2, and permeability decreased as the effective
pressure increased, although permeability was reduced by less than one order of
magnitude from the initial value even at 100 MPa of effective pressure. The
permeability during the first cycle was relatively larger than that during the second or
third pressure cycles, and a similar cyclic path was described during the second and
third cycles. Soon after the pore fluid was changed from nitrogen gas to water, the
permeability decreased sharply; the permeability of the medium to nitrogen gas was 2 to
4 times that of the same medium to water at the same effective and differential pressures.
Permeability during the fifth cycle was relatively smaller than that during the fourth
cycle. The influence of the pore fluid on the permeability change was larger than that
caused by the change in effective pressure or the increase in the pressure cycle number
(shown by error bars) for the same fluid. The other specimens (IVA418, IVA419, and
IVA478) showed similar permeability behavior as the pressure cycle tests with IVA407,
although the difference between the gas and water permeability differed among
specimens. In the case of IVA419, with smaller permeability than IVA407, permeability
to gas was 5 to 7 times that to water. In IVA418 and IVA478, which had the lowest
permeabilities, permeability of a medium to gas was more than 10 times that of the
same medium to water. These results imply that the permeability difference between
nitrogen gas and water is larger in specimens with low intrinsic permeability. The
permeability was also correlated with porosity and pore-size distribution; in our test
samples, permeability of porous sandstones with larger pore size (IVA407, IVA419) was
higher than that of the less porous sandstones (IVA418, IVA478). In IVA418, a sudden
irregular drop of permeability was recognized at 40 MPa during the third cycle, but this
drop was not observed during the other cycles or in other specimens. Wetting may
enhance deformation by mechanical collapse, because it is generally true that rocks are
weaker when wet than when dry. Therefore, an unexpected mechanical collapse might
249
250
251
252
253
254
255
256
257
258
259
260
261
262
263
264
265
266
267

have occurred at the time of wetting, but we do not have direct evidence of this from
microstructural observations.
268
269
270
271
272
273
274
275
276
277
278
279
280
281
282
283
284
285
286
Figure 3 illustrates examples of the relationship between the permeability to
nitrogen gas and the pore-pressure differential. Generally, permeability decreases as the
pore-pressure differential increases at all effective pressures. In IVA419, the maximum
permeability differed by a factor of 1.6 for pore-pressure differentials between 0.2 and
0.8 MPa.
The relationship between the permeability to water and the pore-pressure
differential is shown in Figure 4. In IVA419, permeability increased as the pore-pressure
differential increased, a trend opposite to that for permeability to gas. The maximum
permeability differed by a factor of 1.5 in relation to pore-pressure differential changes.
In IVA478, however, a dependence of permeability on the pore-pressure differential was
not clear.
5. Discussion
5-1. Klinkenberg effect
We plotted the permeability to nitrogen gas against the inverse of the average pore

pressure, 1/Pav, (Pav = (Pup+Pdown)/2) to verify the Klinkenberg effect (Figure 5). In most
cases, the permeability to gas increased linearly as 1/P
287
288
289
290
291
292
293
294
295
296
297
298
299
300
301
302
303
304
305
av increased, a result that is
consistent with the Klinkenberg equation, if it is assumed that average pore pressure is
equivalent to the pore pressure P in equation (2). Therefore, the permeability to water kl
can be estimated from the slopes of the lines in Figure 6. Water permeability estimated
by using the Klinkenberg equation, equation (2), showed almost the same value as the
observed permeability to water in IVA478, but in IVA407, IVA418, and IVA419, the
estimated water permeability was smaller than the observed permeability, though except
in IVA407 the difference was much smaller than the difference between water and gas
permeabilities (Figure 6). These results suggest that the difference between gas and
water permeabilities is strongly affected by the Klinkenberg effect. In IVA407, the
estimated water permeability did not show a linear relationship with average pore
pressure.
The pressure dependence of nitrogen gas viscosity can also cause a pore-pressure
dependence of permeability to gas. Nitrogen gas viscosity exhibits a positive
dependence on pressure, which can increase the permeability to gas, though this
sensitivity is much smaller than the temperature dependence. However, in our
experiment, the permeability change due to differences in pore pressure is so large that
the small pressure dependence of nitrogen gas viscosity (17.87 μPa·s for 0.1 MPa and
306
307
308
309
310
311
312
313
314
315
316
317
318
319
320
321
322
323
324
17.94 for 2 MPa at 300 K; [18]) cannot explain the observed pore pressure dependence
of permeability to gas.
5-2. Klinkenberg slip factor
Not only the water permeability but also the Klinkenberg slip factor b can be
approximated from the fitted slopes (Figure 5). When parameter b was plotted against
water permeability, both estimated from equation (2), for 30 sedimentary rocks from the
western foothills (330 points) (Figure 7), we found that b decreased with increasing
permeability to water, although the data show considerable scatter. The relationship
between water permeability and parameter b is described by the formula
)038.037.0()06.015.0( ±−×±= lkb , (8)
when the units of kl and b are selected as m2 and Pa, respectively. This correlation was
previously studied by Heid et al. [19], Jones [13], and Jones and Owens [20] for
different permeability ranges. Heid et al. [19] showed the correlation in air at 25 °C as
b = 0.11kl−0.39
(9)
for oil-field cores with permeability values of about 10-12 and 10-17 m2. Jones and
Owens [20] measured permeabilities of between 10-14 and 10-19 m2 for low-permeable

325
326
327
328
329
330
331
332
333
334
sands, and the correlation with b was expressed as
b = kl−0.33.
(10)
Both correlations are quite similar to our results, though in our tests the b values were
slightly smaller for all permeability ranges. Moreover, for permeabilities less than 10-19
m2, the slope of the relationship seems to become steeper, a trend also shown by Persoff
and Hulen [14].
When the correlation described by equation (8) is assumed to be applicable to any
rocks, and when equation (8) substitutes into equation (2), the relationship between
permeability to gas and that to water is
⎟⎟⎠
⎞⎜⎜⎝
⎛+=
−
av
llg P
kkk37.015.01 .
(11)
335
336
337
338
339
340
341
342
Therefore, the relationship between the ratio of permeability to gas and permeability to
water, kg/kl, and the pore-pressure differential, Pup – Pdown, in our experimental settings
that Pdown = 0.1 MPa (Figure 8) is such that when permeability of a medium to water is
higher than 10-16 m2, kg/kl is less than 2 for all values of the pore-pressure differential.
However, when permeability of a medium to water is less than 10-17 m2, the discrepancy
between kg/kl values for different values of the pore-pressure differential becomes

larger: in the extreme case, kg/kl is 30 when kl is 10-20 m2 and the pore-pressure
differential is 0.05 MPa. Therefore, we cannot neglect the difference between gas and
water permeability when both permeability and the pore-pressure differential applied for
the permeability measurements are smaller than 10
343
344
345
346
347
348
349
350
351
352
353
354
355
356
357
358
359
-17 m2 and 0.2 MPa respectively.
5-3. Pore-pressure dependence of water permeability
Several specimens showed a dependence of permeability of a medium to water on the
pore-pressure differential (Figure 4). Sasaki et al. [21] suggested that this positive
dependence is caused by Bingham plastic flow within small pores. Byerlee [22] also
asserted that fluid that flows within a relatively impermeable fault zone may exhibit
Bingham flow, which may increase the fluid pressure in the fault zone, thus reducing
fault strength. Generally, water exhibits Newtonian flow, in which the permeability does
not depend on the pore-pressure differential. However, when pore spaces are small,
adhesion to pore walls causes resistance to water flow, leading to a smaller flow rate and
smaller permeability. The Buckingham-Reiner equation describing Bingham flow in a
one-capillary-tube model is [23]
⎥⎥⎦
⎤
⎢⎢⎣
⎡⎟⎠⎞
⎜⎝⎛
Δ+⎟
⎠⎞
⎜⎝⎛
Δ−
Δ=
44 2312
341
8 PRL
PRL
LPRQ oo
p
ττη
π, 360

361
362
363
364
365
366
(12)
where Q is the volumetric flow discharge, ΔP is the pressure difference, R is the radius
of the capillary tube, ηp is the slope of the relationship between shear stress and the rate
of shear or dynamic viscosity when the shear stress τ > τ0, L is the length of the tube,
and τ0 is the critical yield strength. Under Newtonian flow, τ0 becomes 0 and equation
(12) becomes the Hagen-Poiseuille law:
pLPRQη
π8
4Δ= . (13) 367
368
369
370
371
372
If we apply the Buckingham-Reiner equation to porous media, assuming that a
capillary tube is analogous to a pore with radius r = R, permeability to a Bingham
plastic fluid can be expressed by combining Darcy’s law (equation 4) with equation
(12):
⎥⎥⎦
⎤
⎢⎢⎣
⎡⎟⎠⎞
⎜⎝⎛
Δ+⎟
⎠⎞
⎜⎝⎛
Δ−=
Δ=
42 2312
341
8 PrL
PrLnr
PALQk oow
lττη , (14) 373
374
375
376
377
378
where n is porosity , ηw is the viscosity of water, and ηp = ηw is assumed, and the
relationship between porosity of the medium, n, and pore radius (πr2 = nA) that
contains, on average, one capillary for a cross-sectional area A is applied. This
correlation can be employed if it is assumed that pore size can be represented by a
single pore size, implying that water permeability reaches the stable value nR2/8 at

larger pressure differentials. Two examples of the dependence of permeability on the
pore-pressure differential are shown in Figure 10. The experimental result for IVA389
(the same specimen as IVA418 but a different experimental run) of 30 MPa of effective
pressure was compared to the result calculated using equation (14), which assumes that
all pores are the same size. Parameters τ
379
380
381
382
383
384
385
386
387
388
389
390
391
392
393
394
395
396
0 and R were evaluated by the least-squares
method as 0.25 MPa and 0.13 μm, respectively. The prediction curve reaches a
permeability of 2.9·× 10-16 m2 at a higher pressure differential. This curve is partly
consistent with our experimental data, showing that permeability increases as the
pore-pressure differential increases and that the pressure sensitivity decreases gradually
as the pressure differential increases, but it does not reproduce them perfectly. The result
for IVA478 shows similar behavior.
As shown by the pore-size distribution of IVA418 (Figure 1), the pore radius of the
test specimens ranged widely from 0.01 to 10 μm, and the modal pore size was several
times larger than the pore size approximated by using equation (14). The discrepancy
between the two might be caused by the application of a simplified equation that
assumes that the pore size of a sample can be characterized by a single representative
pore size. When the pore-size distribution is taken into account, which is the more
realistic case, equation (14) is rewritten as
( ) ∑∑⎥⎥⎦
⎤
⎢⎢⎣
⎡⎟⎟⎠
⎞⎜⎜⎝
⎛Δ
+⎟⎟⎠
⎞⎜⎜⎝
⎛Δ
−==42 2
312
341
8)(
PrL
PrLrrfnrfkk
i
oi
i
oiiiiil
ττ , (15)
397
398
399
400
401
402
403
where f(ri) is the volumetric ratio of a pore of radius ri. It is also realistic that τi0 is
related to pore geometry and can change with pore radius. Equation (15) assumes that
the radius of each pore does not change in the flow direction through the specimen. The
other simplification is that the pore structure is partitioned into several parts
perpendicular to the flow direction. In this case, the equivalent permeability is given by
the harmonic mean of the individual permeabilities,
∑=
i
il
krfk )(
1
.
(16)
404
405
406
407
408
409
410
411
412
413
414
Using the pore-size distribution measured by the MIPT, permeability can be evaluated
by these capillary tube models. The gas and water permeabilities determined by
laboratory experiment were compared to the results of the three capillary models
described by equations (14), (15), and (16) (Figure 10). Permeabilities calculated
assuming an effective pressure of 10 MPa were plotted against the experimental values.
The average pore radius (Table 1) was used in equation (14), and the pore-size
distributions shown in Figure 2 were used in equations (15) and (16). To avoid the
unknown parameters, τ0 = 0 was selected. The data suggest that permeability is
influenced by the average pore radius, though the estimated values are large for all

specimens. The experimental values are between the harmonic and arithmetic means of
the capillary model. The simplest model, equation (14), is the most suitable for
estimating gas permeability, and the harmonic mean model yields more reasonable
results in low permeability specimens. Therefore, it can be said that permeability of
relatively porous rocks is controlled by the larger pore sizes (arithmetic mean model
domination), whereas the permeability of impermeable samples is more influenced by
the smaller pores (harmonic mean model domination).
415
416
417
418
419
420
421
422
423
424
425
426
427
428
429
430
431
432
433
It is not clear whether the chosen value of τ0 is realistic in nature. Furthermore,
several data points do not show clearly the dependence of the water permeability on the
pore-pressure differential. Even though the positive pore-pressure dependence in our
water permeability test can be partially explained by the Buckingham-Reiner equation,
water interactions with clays or inertial effects [24, 25] and the non-Darcy flow that is
described as the Forchheimer equation [26] must have considered explaining our data
thoroughly.
Our laboratory experiments were focused on porous sedimentary rocks, though it is
unknown whether other rocks (incohesive rocks, granite, fractured rocks, etc.) would
exhibit the same permeability characteristics. Faulkner and Rutter [7] compared the
permeability of clay-rich fault rocks to argon and water. Their data suggest that
permeability of a medium to argon gas was 10 times that of the same medium to water,

which in general is consistent with our results. However, they concluded that the
difference was caused by a reduction of the effective pore diameter due to the adhesion
of water molecules to crystal surfaces rather than to the Klinkenberg effect or Bingham
plastic flow behavior. It is possible that several mechanisms might concurrently affect
water and gas flow and permeability to each in a specimen. Therefore, understanding
the dominant mechanism accounting for permeability differences under various
conditions in relation to specimen characteristics such as pore shape and mineral
composition is important for our future study.
434
435
436
437
438
439
440
441
442
443
444
445
446
447
448
449
450
451
452
6. Conclusions
The permeability of sandstone specimens from the Taiwan western foothills to nitrogen
gas and water was measured on the same specimens in effective pressure cycling tests,
yielding the following significant results. (1) The permeability of a given specimen to
nitrogen gas was 2 to 10 times that to water. (2) The permeability to nitrogen gas
decreased as pore pressure increased, and this pore-pressure dependence on the
permeability of a medium to gas could be explained by the Klinkenberg equation for
most experimental data. The water permeability estimated by using the Klinkenberg
equation was consistent with the observed water permeability. (3) The relationship

between the Klinkenberg slip factor b and water permeability was consistent with that
determined empirically by a previous study, namely, that log b decreases linearly as log
water permeability increases over a wide range from 10
453
454
455
456
457
458
459
460
461
462
463
464
465
466
467
468
469
470
471
-14 to 10-20 m2. (4) The
permeability to water was positively related to the pore-pressure differential and
pore-size distribution, which can be partially explained by the Buckingham-Reiner
equation, though the calculated curve does not fully reproduce the experimental data
because of the complex pore geometry of the specimens, inertial effects nor non-Darcy
flow behavior that are .
Our experimental results suggest that the difference between the permeability of a
medium to gas and that of the same medium to water can be partly explained by the
Klinkenberg effect. Therefore, gas permeability values should not be corrected by using
the Klinkenberg equation when the Klinkenberg effect is not relevant. This phenomena
is only significant for low permeability media. The pore-pressure dependence of both
water and gas permeabilities should also be taken into account in fluid flow problems.
Acknowledgements
We express special appreciation to Dr. Weiren Lin of the Japan Agency for

Marine-Earth Science and Technology (JAMSTEC), and Mr. Daisaku Satou and Dr.
Manabu Takahashi of the National Institute of Advanced Industrial Science and
Technology (AIST) of Japan for the data on pore-size distributions obtained by mercury
injection tests.
472
473
474
475
476
477
478
479
480
481
482
483
484
485
486
487
488
489
490

References 491
492
493
494
495
496
497
498
499
500
501
502
503
504
505
506
507
508
509
[1] Neuzil CE. How permeable are clays and shales? Water Resources Res 1994;30:
2:145-150.
[2] Wang HF. Theory of linear poroelasticity: with applications to geomechanics and
hydrogeology. Princeton: Princeton University Press, 2000.
[3] Wibberley C. Hydraulic diffusivity of fault gouge zones and implications for thermal
pressurization during seismic slip. Earth Planets and Space 2002;54: 1153-1171.
[4] Noda H, Shimamoto T. Thermal pressurization and slip-weakening distance of a
fault; an example of the Hanaore Fault, southwest Japan. Bull Seismo Soc America
2005;95:1224-1233.
[5] Wibberley C, Shimamoto T. Earthquake slip weakening and asperities explained by
thermal pressurization. Nature 2005;436:7051:689-692.
[6] Wu YS, Pruess K, Persoff P. Gas flow in porous media with Klinkenberg’s effect.
Transport in Porous Media 1998;32:117-137.
[7] Faulkner DR, Rutter EH. Comparisons of water and argon permeability in natural
clay-bearing fault gouge under high pressure at 20 degrees C. J. Geophysical
Research 2000;105:16415-16426.
[8] Klinkenberg LJ. The permeability of porous media to liquids and gases. American
Petroleum Institute, Drilling and Productions Practices 1941;200-213.

[9] Brace WF, Walsh JB, Frangos WT. Permeability of granite under high pressure.
Journal of Geophysical Research 1968;73:2225-2236.
510
511
512
513
514
515
516
517
518
519
520
521
522
523
524
525
526
527
528
[10] Zhang M, Takeda M, Esaki T, Takahashi M, Endo H. Effects of confining pressure
on gas and water permeabilities of rocks. Mat Res Soc Symp Proc 2001; 663.
[11] Furbish DJ. Fluid physics in geology; an introduction to fluid motions on earth’s
surface and within its crust. New York: Oxford University Press, 1997.
[12] Zoback DM, Byerlee DJ. The effect of microcrack dilatancy on the permeability of
westerly granite. Journal of Geophysical Research 1975;80:752-755.
[13] Jones SC. A rapid accurate unsteady-state Klinkenberg permeameter. SPE Journal
1972;383-397.
[14] Persoff P, Hulen JB. Hydrologic characterization of reservoir metagraywacke from
shallow and deep levels of the geysers vapor-dominated geothermal system.
California, USA. Geothermics 2001;30:169-192.
[15] Teng LS. Geotectonic evolution of late Cenozoic arc-continent collision in Taiwan.
Tectonophysics 1990;183:57-76.
[16] Suppe J, Wittke JH. Abnormal pore-fluid pressures in relation to stratigraphy and
structure in the active fold-and-thrust belt of northwestern Taiwan. Petroleum
Geology of Taiwan 1977;14:11-24.
[17] Scheidegger AE. The physics of flow through porous media, 3rd Edition. Toronto:

University of Toronto Press, 1974. 529
530
531
532
533
534
535
536
537
538
539
540
541
542
543
544
545
546
547
[18] Chemical Society of Japan, Kagaku-Binran Kiso-Hen, 5th edition. Tokyo: Maruzen,
2004.
[19] Heid JG, McMahon JJ, Nielson RF, Yuster ST. Study of the permeability of rocks
to homogeneous fluids. API Drilling Prod Pract 1950;230-244.
[20] Jones FO, Owens WW. A laboratory study of low-permeability gas sands. J Petrol
Technol 1980;1631-1640.
[21] Sasaki T, Watanabe K, Lin W, Hosoya S. A study on hydraulic conductivity for
Neogene sedimentary rocks under low hydraulic gradient condition.
Shigen-to-Sozai 2003;119:587-592.
[22] Byerlee J. Friction, overpressure and fault normal compression. Geophys Res Lett
1990;17:2109-2112.
[23] Massey B, Smith JW. Mechanics of fluid, 8th edition. London and New York: Spon
press, 2005.
[24] Lever A, Dawe RA. Clay migration and entrapment in synthetic porous media.
Marine and Petroleum Geology 1987;4:112-118.
[25] Lever A, Dawe RA. Water sensitivity and migration of fines in the Hopeman
Sandstone. J Petroleum Geology 1984;7:1:97-108.
[26] Wu YS. Numerical simulation of single-phase and multiphase non-Darcy flow in

porous and fractured reservoirs. Transport in Porous Media. 2002;49:209-240.548

Specimensymbol Formation
Maximumburial
depth (m)Age (Ma)
Samplelength(mm)
Samplediameter
(mm)
Porosity (%)Average poreradius (μm)Standard
methodMercuryinjection
IVA407 Tungkeng Fm 3900-4500 11.6-14.5 20.8 20.6 22.7 18.8 4.75
IVA418 Shihmentsum Fm 4500-4800 17.8-19 12.4 20.7 13.6 11.9 0.76
IVA419 Kuanyinshan Ss 4500-4800 14-15 23.4 20.3 20.6 16.1 1.48
IVA478 Hourdonqkeng Fm 3900-4500 13.9-18 18.4 20.7 8.5 8.4 0.24

Modal poreradius (μm)
12.59
2.51
7.94
0.50

549
550
551
552
553
554
555
Table caption
Table. 1 Information on specimens
Figure captions
556
557
558
Figure 1. Pore-size distributions of the test samples.

559
560
561
562
563
564
Figure 2. Relationship between permeability and effective pressure from the pressure
cycling tests. Nitrogen gas was used as the pore fluid in the first two or three pressure
cycles, and then distilled water was used in the last two pressure cycles. Error bars
mainly reflect the pore-pressure dependence of permeability.

565
566
567
568
Figure 3. The dependence of permeability of a medium to nitrogen gas on the
pore-pressure differential.
569
570
571
572
Figure 4. The dependence of permeability of a medium to water on the pore-pressure
differential.
573

574
575
576
577
Figure 5. Relationship between permeability of a medium to gas and the inverse of the
average pore pressure, verifying the existence of the Klinkenberg effect described by
equation (2).
578
579
580
Figure 6. Comparison of water permeability estimated by using the Klinkenberg
equation and experimental data.
581
582
583
584
585
586
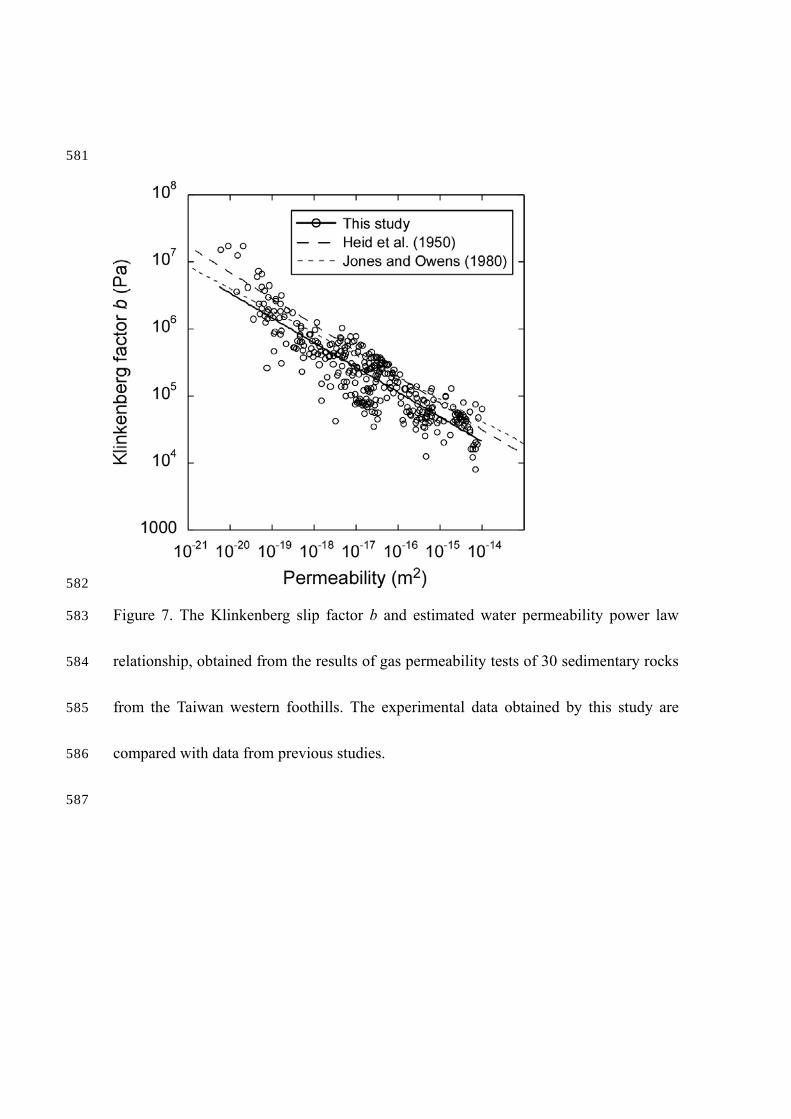
587
Figure 7. The Klinkenberg slip factor b and estimated water permeability power law
relationship, obtained from the results of gas permeability tests of 30 sedimentary rocks
from the Taiwan western foothills. The experimental data obtained by this study are
compared with data from previous studies.

588
589
590
591
592
Figure 8. The relationship between the ratio of permeability of a medium to gas to that
to water and the pore-pressure differential, evaluated by using the empirical relationship
described by equation (8).
593
594 Figure 9. Dependence of water permeability on the pore-pressure differential. The

595
596
597
598
trends obtained in two specimens are compared to those predicted by the
Buckingham-Reiner model (equation 14), which is based on Bingham plastic flow into
an assembly of capillary tubes of the same pore radius.
599
600
601
Figure 10. Comparison of observed permeabilities and the theoretical models of
equations (14), (15), and (16).